Risk Assessment of Mildly Flammable Refrigerants
262
Risk Assessment of Mildly Flammable Refrigerants Final Report 2016 March 2017 The Japan Society of Refrigerating and Air Conditioning Engineers
-
Upload
khangminh22 -
Category
Documents
-
view
3 -
download
0
Transcript of Risk Assessment of Mildly Flammable Refrigerants
Risk Assessment of Mildly Flammable
Refrigerants
Final Report 2016
March 2017
The Japan Society of Refrigerating and
Air Conditioning Engineers
Copyright © 2017 by the authors and JSRAE
All rights reserved. This report or any portion thereof may not be reproduced or used in any
manner whatsoever without the express written permission of JSRAE except for the use of brief
quotations in a book review.
Although the authors and JSRAE have made every effort to ensure that the information in this
report was correct at press time, the authors and JSRAE do not assume and hereby disclaim any
liability to any party for any loss, damage, or disruption caused by errors or omissions, whether
such errors or omissions result from negligence, accident, or any other cause.
The Japan Society of Refrigerating and Air Conditioning Engineers, JSRAE
Nihonbashi-Otomi Bldg. 5F
13-7 Nihon-bashi Odenma-cho
Chuo-ku, Tokyo, 103-0011 Japan
TEL +81-3-5623-3223, FAX +81-3-5623-3229
Foreword
While great successes have been achieved in climate change mitigation, global emissions of
greenhouse gases continue to rise. Greenhouse gas emissions from fossil fuels are the main issue, but
emissions of fluorocarbon refrigerants from refrigeration and air conditioning appliances should not
be ignored because of the large global warming potential (GWP) of fluorocarbons.
The progressively more severe impact of fluorocarbon refrigerants makes the need for urgent action
abundantly clear. The basic measure to reduce the impact of refrigerants is the replacement of
conventional hydrofluorocarbons (HFCs) with low-GWP refrigerants. Low-GWP refrigerants are not
very stable in atmosphere and thus are sometimes flammable. According to Japan’s High Pressure Gas
Safety Act, the use of flammable refrigerants in refrigeration and air conditioning equipment is
restricted in practice. For the safe use of flammable refrigerants and relaxation of the regulation, a risk
assessment needs to be performed; only a scientific risk assessment can provide a sound basis for
judgment and change in regulation.
The Ministry of Economy, Trade and Industry (METI) and the New Energy and Industrial Technology
Development Organization (NEDO) have been subsidizing research to obtain basic information on
mildly flammable refrigerants since 2011. In addition, a research committee was set up by the Japan
Society of Refrigerating and Air Conditioning Engineers to assess the risks associated with mildly
flammable refrigerants. The Japan Refrigerating and Air Conditioning Industry Association and the
Japan Automobile Manufacturers Association are presently conducting very definitive risk
assessments, and the results are being discussed by the research committee.
The final report provides state-of-the-art information concerning the risk of mildly flammable
refrigerants. We are sure that its information will be of much interest for the risk assessment. We thank
all the members and observers of the committee who helped produce this report. We hope that many
people will find it a useful and stimulating summary of the ever-sustainable story at the heart of human
progress.
Finally, we would like to express our deepest gratitude to NEDO for financial support.
Chairperson of the Committee
The University of Tokyo, Professor
Eiji HIHARA

Table of Contents
ABSTRACT 1
1. Introduction 8
1.1 Research Committee on Risk Assessment of Mildly Flammable Refrigerants 8
1.1.1 Background
1.1.2 Activities of the committee for the risk assessment of mildly flammable refrigerants
1.2 Regulatory Trends for Refrigerants in Japan and Overseas 10
1.2.1 International debate
1.2.2 Refrigerant regulations for Japan
1.2.3 Refrigerant regulations for Europe and the United States
1.2.4 Trends in developing countries
1.3 Trends in Safety Standards for Refrigerants in Japan and Overseas 15
1.3.1 Global comparison of safety regulations and standards
1.3.2 Differences between flammable and mildly flammable
1.3.3 Japanese High Pressure Gas Safety Act and international standards
1.3.4 Trends towards easing of regulations
2. Fundamental Flammability 22
2.1 Introduction 22
2.2 Effects of Temperature and Humidity on Flammability Limits of Refrigerants 26
2.2.1 Effect of laboratory level temperature and humidity on flammability limits of some
flammable refrigerants
2.2.2 Effect of high humidity on flammability limits
2.2.3 Comparison between ASHRAE and HPGSA-A methods in cases of FIP measurements for
nitrogen and carbon dioxide dilution
2.2.4 Comparison between ASHRAE and HPGSA-A methods using various metal wires
2.3 Burning Velocity 34
2.3.1 Influence of temperature, pressure, and concentration on burning velocity
2.3.2 Effect of humidity on burning velocity
2.4 Minimum ignition energy and quenching distance 38
2.4.1 Introduction: Ignition, extinction, and growth of flame
2.4.2 Quenching distance measurement
2.4.3 Estimation of minimum ignition energy
2.4.4 Comparison with ignition energy under practical conditions
2.5 Extinction Diameter 47
2.5.1 Extinction diameter in the standard condition
2.5.2 Effect of temperature and humidity on extinction diameter
2.6 Thermal decomposition of refrigerant 50
2.6.1 Thermal decomposition of R1234yf
2.6.2 Thermal decomposition of R1234ze (E)
2.6.3 Thermal decomposition of R22
2.6.4 Thermal decomposition of R32
2.6.5 Thermal decomposition of R134a
2.6.6 Initiation temperature for decomposition of refrigerants
2.6.7 Thermal decomposition of HFO1123
2.6.8 Thermal decomposition of HFO1123/R32 mixture
2.7 Analysis of thermal decomposition products for lower-GWP refrigerants 57
2.7.1 Introduction
2.7.2 Experimental methods and results
2.7.3 Summary
2.8 Evaluation of flammability characteristics in the practical environment 62
2.8.1 Flammability of refrigerants in Tokyo
2.8.2 Flammability of refrigerants in Jakarta
2.8.3 Flammability of refrigerants in Riyadh
3. Physical Hazard Evaluation of A2L Refrigerants Based on Several Conceivable Handling
Situations 68
3.1 Introduction 68
3.2 Hazard Evaluation of Handling Situation #1: Use with Fossil-fuel Heating System 69
3.2.1 Outline
3.2.2 Experiment
3.2.3 Results and discussions
3.3 Hazard Evaluation of Handling Situation #2-(a): Ignition and Flame Propagation Possibility by
a Lighter 71
3.3.1 Outline
3.3.2 Details of experimental evaluation of the possibility of ignition and flame propagation using
piezo-type gas lighter
3.3.3 Details of experimental evaluation of the possibility of ignition and flame propagation using
kerosene cigarette lighter
3.4 Hazard Evaluation of Handling Situation #2-(b): Physical Hazard of Rapid Leakage from a

pinhole 76
3.4.1 Outline
3.4.2 Experiment
3.4.3 Results and discussions
3.5 Hazard Evaluation of Situation #2-(c): - Physical Hazard of Leakage into the Collection Device
81
3.5.1 Outline
3.5.2 Experiment
3.5.3 Results and discussions
3.6 Hazard Evaluation of Situation #2-(d) - Diesel Combustion of Oil and Refrigerant Mixture
during Pump-Down of Air Conditioners 84
3.6.1 Background
3.6.2 Materials and methods
3.6.3 Results
3.7 Hazard Evaluation of Situation #3: Rapid Leakage from VRF System 94
3.7.1 Outline
3.7.2 Experiment
3.7.3 Results and discussions
3.8 Full-scale Experiment Assuming Conceivable Accident Scenario 99
3.8.1 Outline
3.8.2 Assumed accident scenario
3.9 Conclusions 110
4. Physical Hazard Assessment 115
4.1 Introduction 115
4.2 Combustion Test 115
4.2.1 Introduction
4.2.2 Experiment
4.2.3 Flame velocity and burning velocity
4.3 Hazard Evaluation According to Deflagration Index 122
4.3.1 KG value
4.3.2 Potential risk of combustion of A2L refrigerants compared to other flammable gases
4.3.3 Evaluation of reduced pressure based on KG
4.4 Combustion model to simulate experimental results 133
4.5 Conclusion 135

5. Procedure for the Risk Assessment of Mildly Flammable Refrigerants 138
5.1 Introduction 138
5.2 Risk Assessment Procedure 139
5.3 Air Conditioner Equipment and Risk Assessment Conditions 141
5.4 Risk Assessment Procedure for Household Air Conditioners 143
5.4.1 Tolerance level of risk assessment
5.4.2 Setting of leakage
5.4.3 Setting flammable spaces
5.4.4 Simulation of flammable time volume
5.4.5 Setting of ignition sources
5.4.6 Human error probability
5.4.7 Consistency with tolerance value
5.4.8 Summary for household air conditioners
5.5 Differences in the Case of Building Multi-Air Conditioners and Commercial Air Conditioners
151
5.6 Difference in the case of Chillers 153
5.7 FMEA and Other Hazards 153
5.8 Summary of Risk Assessment 154
6. Risk Assessment of Mini-Split Air Conditioners 156
6.1 Introduction 156
6.2 Refrigerant Leak Simulation 156
6.3 Ignition Source Evaluation 157
6.3.1 Electronic parts as a source of ignition
6.3.2 Source of ignition around indoor and outdoor units (mainly for residences)
6.3.3 Framework of ignition sources
6.4 Accidental probability of risk assessment (allowance level) 159
6.5 Leakage conditions 159
6.6 Summary of FTA 159
6.7 Risk Assessment and Results for Wall-Mounted Single Air Conditioners 160
6.7.1 Risk assessment of indoor units
6.8 Risk Assessment and Results for Housing Air Conditioners 161
6.8.1 Installation modes and problems
6.8.2 One-to-one connection floor-standing housing air conditioners (single floor-standing air
conditioners): Ignition sources and installation conditions
6.8.3 Probability of accident and aims of single floor-standing air conditioner risk assessment
6.8.4 Countermeasures for restricted settling area for single floor-standing air conditioners
6.8.5 Risk assessment analysis for single floor-standing air conditioner
6.8.6 Risk assessment analysis for single floor-standing air conditioners considering installation
in a space equivalent to the area of 4.5 tatami mats [Measure S2]
6.9 Risk Assessment and Results for Multi-Connection Housing Air Conditioner 164
6.9.1 Analysis conditions based on realistic housing environment
6.9.2 Effect of door clearances of the housing environment: hinged doors and sliding doors
6.9.3 Initial refrigerant concentration in indoor leakage from multi-connection floor-standing
air conditioners
6.9.4 Combustible space-time product
6.9.5 Risk assessment analysis for multi-connection floor-standing housing air conditioners
6.9.6 Results of diffusion by the indoor unit fans
6.9.7 Risk assessment results for multi-connection floor-standing housing air conditioners
(multi floor-standing air conditioners)
6.10 Risk Assessment for Multi-connection Wall-Mounted Air Conditioners (Multi-Wall Mounted
Air Conditioners) 170
6.11 Summary of Risk Assessment of Housing Air Conditioners 170
6.12 Diesel Explosion and Combustion Products 171
6.13 Consideration for the Actual Large Ignition Experiment Results 172
6.14 Summary 173
7. Risk Assessment for Split Air Conditioners (Commercial Package Air Conditioners) 175
7.1 Introduction 175
7.1.1 Overview of risk assessment for split air conditioners
7.1.2 Features of C-PAC
7.1.3 Risk assessment methodology
7.1.4 Setting of the allowable risk level
7.1.5 Factors of ignition accidents for C-PAC with A2L refrigerants
7.2 Refrigerant Leakage Simulation 178
7.2.1 Simulation cases for indoor installation models
7.2.2 Simulation cases for outdoor installation models
7.3 Ignition Source Assessment 183
7.3.1 Setting of the ignition source
7.3.2 Probability of the presence of ignition sources
7.4 FTA 185
7.4.1 FTA of service life stage for outdoor installation
7.4.2 FTA of service life stage for indoor installation
7.5 Result of Risk Assessment for Each Model 186
7.5.1 First stage models (typical normal C-PAC models)
7.5.2 Second stage models (high-risk C-PACs)
7.5.3 Third stage models (high-risk C-PAC systems 30 kW or less, including floor-standing
indoor units)
7.6 The Risk Assessment Considering Improper Refrigerant Charge 194
7.7 Summary 195
8. Risk Assessment of VRF Systems 196
8.1 Introduction 196
8.2 Characteristics of VRF Systems Using Mildly flammable Refrigerants 197
8.3 Preparations for Risk Assessment 197
8.3.1 Setting Allowable Levels
8.3.2 Probability of Number of Leaks for Different Refrigerant Leakage rates
8.3.3 Probability of Human Error
8.3.4 Ignition Source Assessment
8.3.5 Calculation Method for Ignition Probability
8.3.6 Calculation Method for Ignition Probability by Erroneous Refrigerant Charging
8.3.7 Installing an Indoor Model
8.3.8 Installing Outdoor Model
8.3.9 Risk assessment when using R1234yf
8.4 Results of Risk Assessment and Safety Measures 206
8.4.1Transportation stage
8.4.2 During Installation
8.4.3 During System Operation (Indoors)
8.4.4 Investigation of Floor-standing Safety Measures
8.4.5 During System Operation (Outdoors)
8.4.6 During Repair
8.4.7 During Disposal
8.4.8 Operation Summary (during storage, installation, repair, and disposal)
8.4.9 Investigation of erroneous refrigerant charge
8.4.10 Risk assessment for R1234yf
8.5 Investigation of the Safety Factor and the Rate of Refrigerant Charge 217
8.5.1 Sampling of Each Influential Factor

8.5.2 Effect of Each Influential Factor
8.5.3 Summary for the Safety Factor in Worst-Case Scenarios
8.6 Overall Summary and Future Issues Summary of Risk Assessment 221
9. Risk Assessment for Chiller Units 227
9.1 Introduction 227
9.2 Prerequisites for Risk Assessments 227
9.2.1 Features and tasks for the chiller
9.2.2 Risk assessment procedure
9.2.3 Risk assessment list and risk assessment map
9.3 Probable Existence of Flammable Space for Refrigerant Leak 228
9.3.1 Analysis model
9.3.2 Definition of flammable region and amount of leaked refrigerantt
9.3.3 Calculation method and conditions
9.3.4 Calculation results
9.3.5 Probability of existence of flammable space
9.4 Ignition Source 237
9.4.1 Machine rooms
9.4.2 Ignition sources
9.4.3 Ignition by smoking
9.4.4 Ignition by electrical components
9.4.5 Probability of ignition sources
9.5 Probability of Occurrence of Refrigerant Leakage 242
9.6 Calculation of Probability of Accidental Fires and Burns 242
9.6.1 Calculation conditions
9.6.2 Probability of accidental fire
9.7 Technical Requirements for Safety 243
9.7.1 Ventilation
9.7.2 Explosion proof
9.7.3 Refrigerant gas leak detection alarm equipment
9.8 Conclusions 246
Appendix 1: List of Committee Members 249
Appendix 2: List of Authors 251

ABSTRACT
1. Introduction
Research Committee on Risk Assessment of Mildly Flammable Refrigerants
It is estimated that the emissions of greenhouse gases excluding carbon dioxide in 2020 will be double as much as the
current ones, and the emission from the refrigerating and air-conditioning equipment will account for approximately
80 % of them in Japan. 60 % of emitted hydrofluorocarbon leaks from active equipment, and the rest leaks from end-of-
life equipment. In order to reduce both leakage, the Fluorocarbons Recovery and Destruction Law of Japan was revised
and the name was changed to the Act for Rationalized Use and Proper Management of Fluorocarbons in June 2013. The
details of the operating policy was issued by governmental and ministerial ordinances. The law was enforced in April
2015. Promising new refrigerants such as R32, R1234yf and R1234ze(E) have flammability. In ASHRAE Standard 34,
rank 2L was established for mildly flammable refrigerants with burning heats lower than 19 MJ/kg and burning
velocities lower than 10 cm/s. Together with ammonia, R1234yf, R1234ze(E) and R32 are classified as 2L. Although a
typical natural refrigerant R290 (propane) has a small GWP value, its strong flammability causes little usage in practical
applications.
A research committee was organized by the Japan Society of Refrigerating and Air Conditioning Engineers (JSRAE)
to assess the risks associated with mildly flammable refrigerants. The Japan Refrigerating and Air Conditioning
Industry Association (JRAIA) and the Japan Automobile Manufacturers Association undertook risk assessments and the
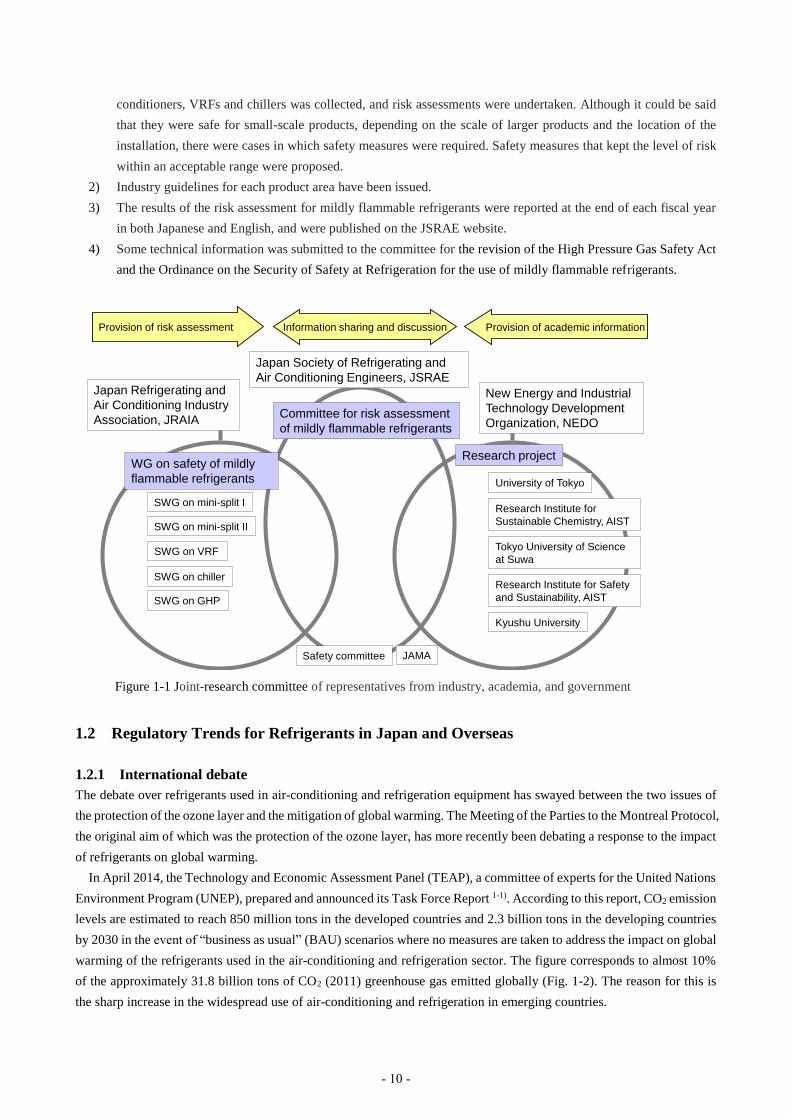
results were discussed by the research committee. Figure 1 shows a joint- research committee of representatives from
industry, academia, and government.
Regulatory Trends for Refrigerants in Japan and Overseas
The debate over refrigerants used in air conditioning and refrigeration equipment has swayed between the two issues
of protection of the ozone layer and the mitigation of global warming. The Meeting of the Parties to the Montreal
Protocol, which originally aimed for the protection of the ozone layer, has in recent years been debating a response to
the impact of refrigerant on global warming.
The Act for Rationalized Use and Proper Management of Fluorocarbons came into force in Japan in April 2015 as a
countermeasure for CO2 emissions. The fundamental direction of the Act was to clarify the four countermeasures in
each step of the life cycle from production to disposal and the main working bodies through the two large pillars: the
“rationalization of use” of fluorocarbons as well as the “optimization of control” of fluorocarbons that are used in
commercial-use products to curtail fluorocarbon emission to the atmosphere.
Europe performed a revision in January 2015 for the EU F-gas Regulation (EC Regulation No. 842). This revision
sets the target to reduce CO2 emissions in 2030 by 79% compared with the average for CO2 emissions from 2009 to
2012 through countermeasures including total amount management for refrigerant such as GWP regulations for each
application and pre-charge.
One of the major trends involves North America. The Obama administration strengthened the Climate Action Plan as
government policy and has proceeded with refrigerant countermeasures that prohibit high-GWP refrigerants and
approve low-GWP refrigerants by having the Environmental Protection Agency (EPA) use a refrigerant certification
system called the Significant New Alternatives Policy (SNAP).
Trends in Safety Standards for Refrigerants in Japan and Overseas
Currently, concerns for mild flammability pose the greatest challenge to converting to refrigerants with low global
warming potential (GWP). As previously mentioned, the non-flammable (A1) refrigerants display little promise as
alternative refrigerant candidates for R410A, whereas the lower flammable (A2L) have appropriate GWP.
- 1 -

Consequently, the questions become can the safety of these lower flammable refrigerants be guaranteed and can the
safety standards for each country and each international standards organization be met. In this way, tradeoffs occur in
alleviating concerns for both global warming and flammability. ISO and IEC are international standards held in high
esteem. Similarly, the European Standard (EN), American Society of Heating, Refrigerating, and Air-Conditioning
Engineer (ASHRAE), Globally Harmonized System of Classification and Labelling of Chemicals (GHS) are also
extremely important.
2. Fundamental Flammability
In this chapter we reported on fundamental flammability properties for 2L refrigerants and some other refrigerants.
Considering the worst conditions of environment where the refrigerants are used, the temperature and humidity effects
on these flammability properties were also reported.
The flammability limits are generally known to be linear to temperature (White’s rule). It has been shown that R717,
R32, and R143a follow this rule. However, it has been found that the temperature dependences of the flammability
limits of R1234yf and R1234ze(E) are much larger than the prediction by White’s rule.
As for the humidity dependence, the flammability limits of R717, R32, and R143a are not much dependent on humidity.
On the other hand, the flammability property of R1234yf and R1234ze(E) are markedly enhanced by the presence of
water vapor. In this connection it is remarkable that non-flammable gases of R410A, R410B, and R134a become
flammable under relative humidity of 50% at 60°C.
In Japan, HPGSA (High pressure gas safety act)-A method and ASHRAE method are used to measure the
flammability limits of refrigerants. We have found that the flammability measured with the former method is larger than
that by the latter method. In addition, we have also found that if 0.2mm Mo wire is used instead of 0.3mm Pt wire,
which is required in HPGSA-A method, the results obtained by both methods become almost coincident to each other.
Burning velocity (Su) for flammable refrigerants have been studied comprehensively. As for temperature dependence,
the Su of typical refrigerants increased about quadratically with absolute temperature. As for humidity dependence, the
Su of R32 decreased gradually with increasing the absolute humidity. On the other hand, the Su of R1234yf and
R1234ze(E) increased rather steeply with increasing the absolute humidity.
Quenching distance (dq) and its temperature, pressure, and humidity dependence have been studied. We evaluated the
temperature and pressure dependence on dq for R32 and R717. It was found that dq is essentially related to (uSu)-1,
where u is the unburned gas density, and a single relationship was obtained between the dq and Su at various
temperatures and pressures. As for humidity dependence on dq, we measured dq at various humidity. The dq of R1234yf
rapidly decreased with increasing the humidity and became one-fifth of dq at 25°C0%RH when the humidity attained
60°C50%RH.
Minimum ignition energy (Emin) has been estimated by using the dq and Su measured by the unified test method and
considering the heat loss theory of the minimum flame. The calculated Emin for 2L refrigerants were greater than the
spark discharge energy by the static electricity from the human body. Furthermore, the dq for 2L refrigerants were larger
than the possible distance of breakdown by the static electricity from the human body. Consequently, it is impossible to
ignite the 2L refrigerants by the spark discharge by static electricity from the human body. Practical ignition test for
several refrigerants was also carried out using the spark due to the hair dryer whose plug was connected with the socket
was switched on and then its plug was pulled from the socket. Despite that the discharge energy by the hairdryer was
greater than Emin of most 2L refrigerants, the spark could not ignite the 2L refrigerants.
The spark discharge generated between the electrodes of the magnetic contactors may ignite 2L refrigerants. However,
it was impossible for the flames of R32 and R1234yf to propagate out of the enclosure of the magnetic contactor. To
understand the reason for this results, we introduced "extinction diameter" as a new index. It was found that the
extinction diameters of R32 and R1234yf are larger than the size of the opening of the enclosure of magnetic contactors
- 2 -
in general use. Therefore, even though ignition of R32 and R1234yf occurs inside the magnetic contactors, the flame
cannot go through the opening to penetrate out of the enclosure of the magnetic contactors. The effect of humidity on
the extinction diameter was found to be almost comparable to that on the quenching distance.
Based on the above-mentioned findings, we estimated the flammabilities in Tokyo, Jakarta, and Riyadh for R290,
R32, and R1234yf as an example of practical flammability evaluation. As for R290 and R32, the regional flammabilities
were not much different from the standard (25°C0%RH) flammabilities in these three areas. On the other hand, those
for R1234yf were always higher than the standard ones in these areas. It was found that even in Riyadh, which is known
as a dry and high temperature area, the humidity effect is more significant than the temperature effect on the
flammabilities of R1234yf.
3. Physical Hazard Evaluation of A2L Refrigerants Based on Several
Conceivable Handling Situations
We conducted a series of experimental evaluations of the physical hazards associated with A2L refrigerant, assuming occasional
accident scenarios in situations in which A2L refrigerants are likely to be handled, based on discussions with developers and
associations dealing with air conditioning systems in Japan (JRAIA).
Situation #1: Simultaneous use with a fossil-fuel heating system
Even when all the refrigerant contained inside a commercial room air conditioning system leaked into the general living space
where the heating system was in operation, ignition and flame propagation did not occur. The amount of HF generated as a result of
the thermal decomposition of A2L refrigerant was equivalent to the amount of R410A.
Situation #2: Service and maintenance situation
(1) Accident scenario (a): We evaluated the physical hazard for a commercial portable gas lighter used in a space
where the A2L refrigerant leaked and accumulated. When a piezo gas lighter was used, no flame propagation was
observed. However, ignition and flame propagation to accumulated R32 was confirmed for a kerosene cigarette
lighter with a surrogate source of ignition instead of the usual generation by rubbing the flint wheel.
(2) Accident scenario (b): We assumed that the A2L refrigerant leaked from a fracture or pinhole formed in the pipes or
hoses from the factory for service and maintenance. Even when excess energy than the conceivable ignition source
in the actual situation was given to the refrigerant jet, ignition and flame propagation to the entire refrigerant jet
was not confirmed.
(3) Accident scenario (c): We assumed that the A2L refrigerant leaked inside a device used for service and maintenance,
such as a collection device. If there is a slit of suitable width in the model collection device, accumulation of
refrigerant can be controlled in a very short period of time and ignition averted.
(4) Accident scenario (d): During pump-down operation (refrigerant collection), self-ignition accidents caused by air leaking into
the refrigerant and lubricating oil mixture and a temperature rise by adiabatic compression may happen. Several incidents of
outdoor air conditioning units exploding during pump-down have been reported. R1234yf and R32 are drawing attention as low-
GWP refrigerants; however, because of their mild flammability, a safety estimation comparison to R410A (conventional non-
flammable refrigerant) is necessary. In this research, we investigated the conditions of combustion depending on refrigerants
with apparatus designed to simulate accidents that occur during pump-down.
Situation #3: Rapid leak from VRF system
A series of ignition experiment were carried out assuming the accident case that low-GWP refrigerant (R32) installed
to the VRF system leaked to the rectangle-shape general working space. There are possibilities that the flame
propagation rate could be predicted by the vertical distribution of concentration, ignition height, LFL and UFL which
were able to assume or to know before conducting experiment regardless of the leak height and ignition height.
Full-scale experiment assuming conceivable accident scenario
- 3 -
A full-scale experiment to examine the possibility of fire occurrence and physical hazard assuming the conceivable
accident scenario was carried out. As the results, if all amounts of refrigerant which amount corresponds to UFL leaked
into the focusing space, occurrences of ignition and flame propagation can be prevented by maintaining suitable
ventilation systems.
4. Physical Hazard Assessment
Refrigerants such as difluoromethane (R32, CH2F2), 2,3,3,3-tetrafluoropropene (R1234yf, CH2=CFCF3) and trans-
1,3,3,3-tetrafluolopropylene (R1234ze(E), CHF=CHCF3) are expected to show great potential as next-generation
refrigerants. Although these refrigerants perform better than existing refrigerants in terms of lower ODP and GWP, they
are mildly flammable. It is important to evaluate the combustion safety of A2L refrigerants in the event of leakage into
the atmosphere owing to installing and operating accidents. To address the issue of global warming due to conventional
refrigerants, ASHRAE (2010) defined the optional Class 2L to classify refrigerants with lower flammability, and it is
preparing to promote the conversion of air-conditioning equipment from conventional refrigerants to next-generation
refrigerants. To assess the physical hazard from the combustion and explosion of A2L refrigerants for ensuring safety,
the fundamental flammability characteristics of A2L refrigerants were evaluated.
In this study, a series of studies was conducted.The fundamental flammability characteristics of A2L refrigerants were
experimentally evaluated using a 524L large closed spherical combustion vessel in terms of parameters such as the
flame speed, burning velocity, and KG under the uplift behavior due to buoyancy arising from slow burning velocity.
The scale effect of KG was examined from the results of the flammable tests using 15L and 524L spherical vessels.
While it affects remarkable effect on that of hydrogen and propane, it was found that the volume show little effect on
KG values of A2L refrigerants as well as ammonia, Further, there is no indication of the expression of wrinkled flame
front and the laminar to turbulent flow from the results of high-speed video observation.
An influence of elevated temperature and moisture on the flammability is already known especially for R1234ze(E).
The flammability under dry and wet (above 50% RH) conditions at an elevated temperature of 35C tests were
conducted. With the addition of the moisture and elevated temperature, R32 exhibited flammability with almost the
same flame front shape as under the dry condition, and R1234yf showed a relatively clear flame front shape compared
with the dry condition. A blue flame was observed for R1234yf under the dry condition; however, a luminous flame was
observed under the wet and elevated temperature conditions. R1234ze was not flammable under the dry condition even
at elevated temperate; however, it become flammable under the wet condition. Maximum Pmax and KG obtained under a
series of experimental conditions including elevated and humid condition were evaluated.
A high-temperature surface has the potential to become ignition source of contacting flammable gases as well as a flame
and an electric spark. Auto-ignition temperature (AIT) is the lowest temperature at which the substance will produce
hot-flame ignition spontaneously in air at atmospheric pressure without other ignition sources, but it depends on testing
apparatus and conditions. In this part, AITs of A2L refrigerants and ammonia were experimental evaluated using a
ASTM E-659 test apparatus. The lowest temperatures at which ignition is recognized by visual judgement are 357 C
for R1234yf , 356C for R1234ze(E) and 478 C for R32, respectively. On the other hand, it was difficult to determine
AIT of ammonia with the test equipment.
It is difficult full-scale experimental evaluation for actual cases. The application of numerical simulation is
straightforward and expected procedure in the future. The numerical simulation with a combustion model was
considered to reproduce the combustion experiment.
To evaluate the explosion severity, the reduced pressure effect due to the presence of an opening in the room was
studied, and the effective area of venting was experimentally evaluated according to the venting design for explosion
protection.
- 4 -
5. Procedure for the Risk Assessment of Mildly Flammable Refrigerants
This chapter presented the risk assessment procedure adopted by the mini-split risk assessment SWG (I) based on the
risk assessment advancements at the JRAIA through collaboration between the University of Tokyo, Tokyo University
of Science, Suwa and AIST Chemical Division. The differences between a building multi-air conditioner, commercial
air conditioner, and chiller were also described.
A risk assessment is a preliminary evaluation of a product for future commercialization. It is just a tool to determine
the hazards that are present in the product. The hazard must be addressed if it is harmful. Product engineers must master
this tool well to provide safe equipment with reasonable price for the society. They also need to disclose the residual
and unexpected risks actively.
Concluding generally is not the aim of this report, however, because the risk of an air conditioner increases with the
refrigerant amount, and because the equipment size increases with the voltage source capacity, the risk for a bigger air
conditioner tends to become high in FTA analysis because the corresponding amount of refrigerant and electric power
capacity become larger. There are many choices to avoid the risks as countermeasures; these include reducing the
refrigerant leakage amount by providing a shutoff valve, diluting the refrigerant by rotating a fan fast, lowering the
refrigerant concentration by using dispersal fans and exhausts, eliminating the ignition source by means of a power
supply interrupting device located outside the installation compartment, and an alarm device by human correspondence.
Risk can also be avoided by enforcing regulations and standards such as confirming a seal during installation and
reporting safety checks. The characteristics, installation conditions, usage condition, convenience, and cost of each
device should be considered to determine the best approach.
In addition, the risk assessments for building multi-air conditioners, commercial air conditioners, and chillers are
described simply by using excerpts from previous progress reports. The previous reports can be referred for detailed
information about the conditions, evaluation methods, and results for the risk assessments, and this report 2015 provides
the latest published information.
6 Risk Assessment of Mini-Split Air Conditioners
The mini-split risk assessment SWG conducted risk assessment for R32 and R1234yf in wall-mounted residential air
conditioners, and confirmed that there are no safety problems. We also analyzed the risk assessment for housing air
conditioners using R32 and confirmed that they can be used without problems if certain measures are adhered. In order
to reduce the risks, we revised the manuals used during installation or servicing. More precisely, in the “Piping
construction manual for residential air conditioners using R32 refrigerant” (industrial society internal material) issued
by the JRAIA, we added cautionary reminders to service manuals and installation manuals, etc., and made suggestions
and manuals about the measures that can be adopted for R32.
Finally, we would like to express gratitude for the study conducted by the University of Tokyo and Suwa Tigers
University, which improved the accuracy of the risk assessment. In the future, we expect that once the damage level is
clarified, we will be able to use R32 and R1234yf air conditioners with more safely, thus contributing to prevent global
warming. The risk evaluation of mini-split air conditioners is concluded here.
7. Risk Assessment for Split Air Conditioners (Commercial Package Air
Conditioners)
By comparing split air conditioners (commercial package air conditioners (C-PAC)) with mini-split air conditioners
(Residential AC) and VRF air conditioners for buildings, from the perspective of a risk assessment with A2L, we
carried out a risk assessment for C-PAC using the same methodology. First, we set the allowable risk level of a C-PAC
as the target of the risk assessment. The allowable level was set as the probability of a serious accident occurring in the
- 5 -

market once every 100 years. The probability of an ignition accident was multiplied by the leakage probability, the
probability of generating a flammable region, and the probability of the presence of ignition sources. For each life-
cycle stage (Logistics, Installation, Usage, Service, and Disposal), the ignition probability was calculated with the FTA
based on the assumed risk scenario. We assessed C-PAC systems in three stages.
First stage: Typical normal C-PAC models: ceiling-cassette indoor unit in an office, 14 kW or less outdoor unit
installed at ground level without additional charge, and bulk storage at a warehouse.
Second stage: Severe case models for 14 kW or less systems, excluding floor-standing indoor units: maximum
piping length (charge amount) of a 14 kW system; Indoors: kitchen with many ignition sources, karaoke-room
(tightness); Outdoors: each floor, semi-underground, narrow space installations; and Logistics: small warehouse
storage, minivan delivery.
Third stage: Severe case models for all C-PACs 30 kW or less, including floor-standing indoor units: maximum
piping length (charge amount) of a 30 kW system; Indoors: floor-standing where the leakage gas remains at a high
concentration, and ice thermal storage indoor unit (ceiling type); Outdoors: the outdoor models are the same as those in
the second stage.
For the typical normal models of a C-PAC system, the ignition probability using R32 satisfied the allowable risk
without additional safety measures. However, safety measures were needed to satisfy the allowable level for some
severe cases of the second and third stage models.
In some stages of outdoor semi-underground and narrow space installations, the ignition probability did not satisfy
the allowable level. The dominant risk factors during the work stages were human errors such as improper refrigerant
recovery that generates a flammable region, improper power supply wiring that cause a spark, and brazing when there
is the probability that the open flame of a gas burner is present.. Thus, we proposed educating workers and requiring
that they carry a leak detector, as necessary safety measures.
For the Usage stage, we proposed a reduction in the generation of a flammable region as follows—semi-underground
condition: mechanical ventilation or unit’s fan operating with a leak detector and narrow space: an opening of 0.6 m or
more for one side.
In the case of “a floor-standing indoor unit,” the probability of generating a flammable region was too high because
the leakage gas tended to remain near the floor at a high concentration. The safety measure during the usage stage was
“force the unit’s fan to be ON with a leak detector near the floor.” For the work stages, professional training for
workers and carrying a leak detector were effective.
We plan to introduce the necessary safety measures to reduce the risk of ignition, such as the requirement of
ensuring safety when the refrigerant leaks in the commercial air conditioners (JRA4070), the guideline of design
construction for ensuring safety when the refrigerant leaks in the commercial air conditioners (JRA GL-16), and so on.
8. Risk Assessment for VRF Systems
We performed a risk assessment for VRF systems using lower flammable R32 and R1234yf that have low impact on
global warming, and sought the ignition probability in each of the most severe installation cases at the time of indoor
and outdoor use, installation, repair, and disposal. We determined refrigerant leak velocity and probability of generating
a rapid leak from the comments of customers and service personnel accompanying the bore-diameter investigation for
leak product samples and rapid leaks. In the case that allowance exceeds ignition probability for without measures, we
proposed safety measures to make the generation of an accident once in 100 years. By these safety measures we
clarified what we can do to reduce risk below allowance level and ensure that the occurrence of fire accidents is lower
than once in 100 years. In the future we will attempt to organize these safety measures as JRAIA safety standards.
Furthermore, we performed a detailed investigation concerning the safety factor in the case that decide an
unnecessary amount for allowable refrigerant charge that does not need safety measures. We removed the indoor unit
- 6 -

for built-in compressor indoor units that have a possibility of piping bursting with a leak and having a rapid refrigerant
leak by floor-standing models that are prone to accumulate refrigerant and vibration and determined that sufficient
safety was 1/2 of the safety factor. Within the movement for regulatory reform that our country is currently making
progress, we have been making progress in revision of refrigeration safety regulations that should facilitate actual use
even for flammable refrigerants but it is expected that a discussion be carefully conducted in regards to the easing of
regulations. For the future, we wish to proceed with activities to recognize relating to the safety factor from a mid-term
perspective.
9. Risk Assessment for Chiller Units
Central air-conditioning systems using hot or cold water use hydrofluorocarbon refrigerants such as R134a or R410A. Both
refrigerants have a global warming potential (GWP) exceeding 1,000 and thus, have a high global warming impact. Therefore, low-
GWP alternatives have been evaluated: R1234ze(E), R1234yf, and R32. These low-GWP refrigerants are mildly flammable,
however. Therefore, risk assessments (RAs) should be performed to eliminate this risk.
RA for fires and burns in chiller systems has been undertaken by the Japan Society of Refrigerating and Air Conditioning
Engineers. The scope of this study is to perform RAs for water-cooled chillers installed in machine rooms and air-cooled heat
pumps installed outdoors with a cooling capacity ranging from more than or equal 7.5 kW. Mobile chilling equipment, which cannot
be permanently installed, is excluded from this investigation.
If the mildly flammable refrigerants, R1234ze(E), R1234yf, and R32 leak at the velocity calculated based on leakage accidents
data, a small flammable space is formed for a short duration of time. In addition, assuming that the ignition sources are limited,
based on the burning characteristics of these refrigerants, the probability of accidental fires is low. However, the risk of refrigerant
leakage accidents is still significant, and the ventilation conditions are uncertain. Therefore, as a safety measure, two ventilation
lines, such as mechanical ventilation, should be installed and functioning at all times. The present results indicate that the
probability of an accidental fire in water-cooled heat pumps in machine rooms and air-cooled heat pumps installed outdoors,
assuming the existence of adequate countermeasures, is 3.89 × 10⁻¹² accident/(unit year), i.e., less than once every ten years.
Additionally, there are no risks of being allowable. Therefore, the mildly flammable refrigerants can be safely used for water-cooled
chillers and air-cooled heat pumps.
- 7 -

1. Introduction
1.1 Research Committee on Risk Assessment of Mildly Flammable Refrigerants
1.1.1 Background
The use of chlorofluorocarbons (CFCs) and hydrochlorofluorocarbons (HCFCs) has been severely restricted and, in an
effort to protect the ozone layer, they are being replaced with hydrofluorocarbons (HFCs). However, leakage of this
refrigerant into the air from active or end-of-life air conditioners is a serious environmental issue owing to its high global-
warming potential (GWP). Thus, it is now universally acknowledged that HFCs must be replaced with lower-GWP
refrigerants to rectify this problem. The main types of air-conditioning equipment produced in Japan are room, package,
and mobile air conditioners, with respective totals of 8.1 million, 0.8 million, and 5 million units being exported in 2015.
As a replacement of the conventional refrigerant used in mobile air conditioners, low-GWP refrigerant R1234yf has great
potential. Further, studies have been conducted over the past several years on the application of lower-GWP refrigerants
to stationary air conditioners. Additionally, in recognition of the urgent need to reduce global warming, regulations have
been imposed in Japan and overseas regarding the use of high-GWP refrigerants such as HFCs.
It is estimated that, in 2020, emissions of greenhouse gases other than carbon dioxide will be double current levels,
with emissions from the refrigerating and air-conditioning equipment accounting for approximately 80% in Japan. Of this,
60% of hydrofluorocarbon leaks emanate from active equipment, while the remainder originates from end-of-life
equipment. To reduce both types of leakage, the Fluorocarbons Recovery and Destruction Law of Japan was revised and,
in June 2013, the name was changed to the Act for Rationalized Use and Proper Management of Fluorocarbons. The
details of the operating policy were issued by governmental and ministerial ordinances. The law was enforced in April
2015. Table 1-1 lists the currently used refrigerants, new lower-GWP refrigerants, and the GWP cap imposed on main
products offered on the Japanese market. Promising new refrigerants such as R32, R1234yf and R1234ze(E) exhibit a
degree of flammability, as shown in Table 1-2. The lower and upper flammability limits listed in Table 1-2 were obtained
by the A method of the High Pressure Gas Safety Act. The burning velocity and the minimum ignition energy were
measured at 25°C and 0%RH, with R1234ze(E) being found to be nonflammable at this temperature. However, it was
found to be flammable at high temperatures and under humid conditions, such as 60°C and 50%RH. In ASHRAE Standard
34, rank 2L was established for mildly flammable refrigerants with burning heats lower than 19 MJ/kg and burning
velocities lower than 10 cm/s. Together with ammonia, R1234yf, R1234ze(E), and R32 are classified as 2L. Although a
typical natural refrigerant R290 (propane) has a small GWP value, its high flammability means it is seldom used in
practical applications.
The development of environmentally friendly refrigerants for room and package air conditioners is imperative for the
growth of air-conditioning technology. The low-GWP refrigerants R1234yf and R32 are promising candidate
replacements for conventional HFC refrigerants. However, these refrigerants are not very stable in air and are flammable.
Table 1-1 Currently used and new refrigerants in main products
Designated products and equipment Currently used
refrigerants (GWP)
Lower-GWP
refrigerants (GWP) GWP cap
Room air conditioner R410A (2090) R32 (675) 750
Commercial air conditioner R410A (2090) R32 (675) 750
Automobile air conditioner R134a (1430) R1234yf (4) 150
Turbo refrigerator and chillers R134a (1430) R1234ze (6) -
- 8 -

Therefore, it is essential to collect basic data about the flammability of these low-GWP refrigerants and research their
safety in practical applications. The integration of basic information about refrigerant physical properties, cycle
performance, life cycle climate performance (LCCP), flammability, and risk assessment will simplify their selection for
practical use. These efforts are expected to contribute to the advancement of the global air-conditioning industry.
Table 1-2 Flammability properties (extracted from Table 2-2)
Refrigerant number R410A R32 R1234yf R1234ze(E) R290
GWP 2090 675 4 6 < 3
Burning velocity (cm/s) n.f. 6.7 1.5 n.f. 38.7
Lower flammability limit [vol %] n.f. 13.3 6.21 6.39 1.92
Upper flammability limit [vol %] n.f. 29.3 14.0 13.3 10.46
Minimum ignition energy (mJ) n.f. 29 780 n.f. 0.35
Flammability category*) 1 2L 2L 2L 3
*) 1: non-flammable, 2L: mildly flammable, 3: highly flammable n.f.: non-flammable
1.1.2 Activities of the committee for the risk assessment of mildly flammable refrigerants
Rank 2L of ASHRAE Standard 34 changed the restriction on refrigerants regarding their flammability and allows for the
practical use of low-flammability refrigerants. However, in Japan, only the classifications “non-flammable” and
“flammable” are recognized in the High Pressure Gas Safety Act and the Ordinance on the Security of Safety at
Refrigeration. With the objective of gathering essential data to enable a risk assessment of mildly flammable refrigerants,
safety studies are being conducted by project teams from the Tokyo University of Science at Suwa, Kyushu University,
the University of Tokyo, and the National Institute of Advanced Industrial Science and Technology. Since 2011, they
have been sponsored by the project entitled “Development of Highly Efficient and Non-Freon Air-conditioning Systems”
of the New Energy and Industrial Technology Development Organization (NEDO).
In addition, a research committee was organized by the Japan Society of Refrigerating and Air-conditioning Engineers
(JSRAE) to assess the risks associated with mildly flammable refrigerants. The Japan Refrigerating and Air-conditioning
Industry Association (JRAIA) and the Japan Automobile Manufacturers Association undertook risk assessments and the
results were discussed by the research committee. Figure 1-1 illustrates a joint-research committee of representatives from
industry, academia, and government.
The committee for the risk assessment of mildly flammable refrigerants in the JSRAE and the working group on the
safety of mildly flammable refrigerants in the JRAIA have the following aims.
1) Establishment of measuring methods for combustion characteristics of refrigerants and their collection.
2) Estimation of volume of flammable space when refrigerant leaks from indoor or outdoor unit.
3) Existence probability of ignition source.
4) Estimation of severity of fire accident.
5) Evaluation of probability of fire accidents in each product type.
6) Safety measure for reducing probability of fire accidents below an acceptable level.
7) Issue of guidelines for safe use of mildly flammable refrigerants.
8) Contribution to revisions of the High Pressure Gas Safety Act and the Ordinance on the Security of Safety at
Refrigeration for the use of mildly flammable refrigerants.
9) Publication of results of activities, enlightenment, and contribution to the amendment of international standards
(ISO, IEC, etc.).
Consequently, the following results were obtained.
1) Information related to risk assessment of mildly flammable refrigerants for room air conditioners, package air
- 9 -
conditioners, VRFs and chillers was collected, and risk assessments were undertaken. Although it could be said
that they were safe for small-scale products, depending on the scale of larger products and the location of the
installation, there were cases in which safety measures were required. Safety measures that kept the level of risk
within an acceptable range were proposed.
2) Industry guidelines for each product area have been issued.
3) The results of the risk assessment for mildly flammable refrigerants were reported at the end of each fiscal year
in both Japanese and English, and were published on the JSRAE website.
4) Some technical information was submitted to the committee for the revision of the High Pressure Gas Safety Act
and the Ordinance on the Security of Safety at Refrigeration for the use of mildly flammable refrigerants.
1.2 Regulatory Trends for Refrigerants in Japan and Overseas
1.2.1 International debate
The debate over refrigerants used in air-conditioning and refrigeration equipment has swayed between the two issues of
the protection of the ozone layer and the mitigation of global warming. The Meeting of the Parties to the Montreal Protocol,
the original aim of which was the protection of the ozone layer, has more recently been debating a response to the impact
of refrigerants on global warming.
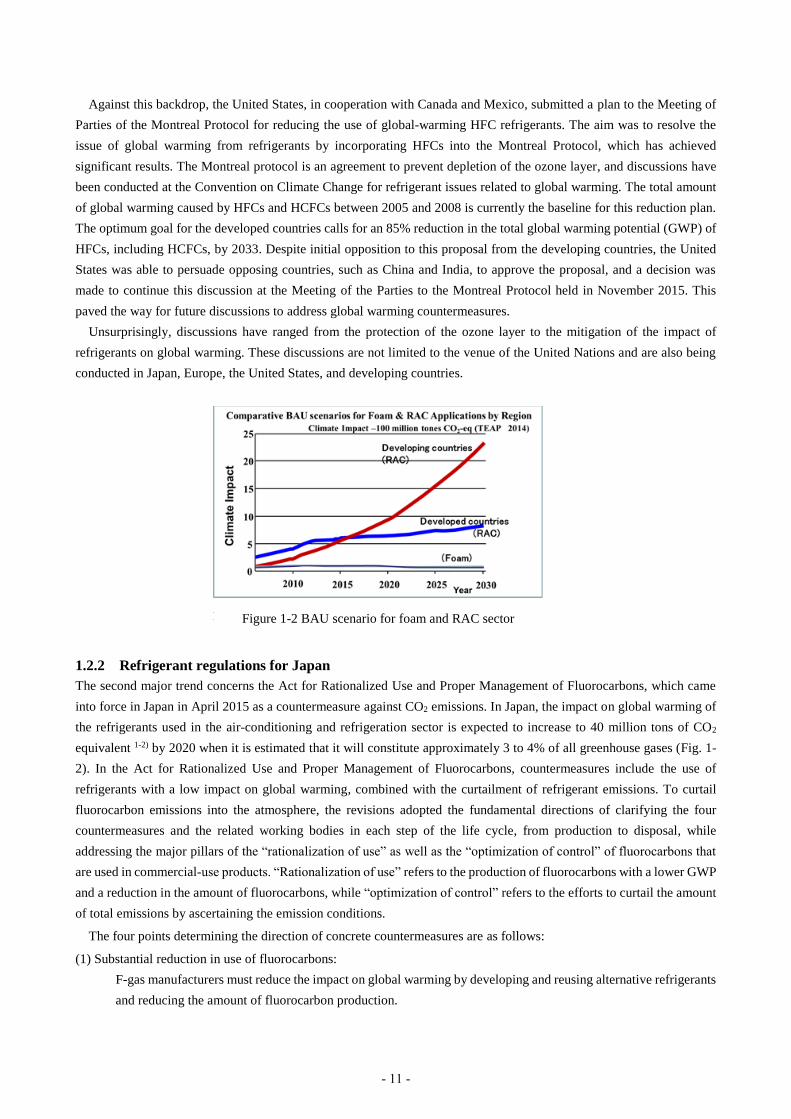
In April 2014, the Technology and Economic Assessment Panel (TEAP), a committee of experts for the United Nations
Environment Program (UNEP), prepared and announced its Task Force Report 1-1). According to this report, CO2 emission
levels are estimated to reach 850 million tons in the developed countries and 2.3 billion tons in the developing countries
by 2030 in the event of “business as usual” (BAU) scenarios where no measures are taken to address the impact on global
warming of the refrigerants used in the air-conditioning and refrigeration sector. The figure corresponds to almost 10%
of the approximately 31.8 billion tons of CO2 (2011) greenhouse gas emitted globally (Fig. 1-2). The reason for this is
the sharp increase in the widespread use of air-conditioning and refrigeration in emerging countries.
Figure 1-1 Joint-research committee of representatives from industry, academia, and government
Japan Refrigerating and
Air Conditioning Industry
Association, JRAIA
WG on safety of mildly
flammable refrigerants
SWG on mini-split I
SWG on mini-split II
SWG on chiller
SWG on VRF
SWG on GHP
Japan Society of Refrigerating and
Air Conditioning Engineers, JSRAE
New Energy and Industrial
Technology Development
Organization, NEDO
Research project
University of Tokyo
Research Institute for
Sustainable Chemistry, AIST
Research Institute for Safety
and Sustainability, AIST
Tokyo University of Science
at Suwa
Kyushu University
Committee for risk assessment
of mildly flammable refrigerants
JAMASafety committee
Provision of risk assessment Provision of academic informationInformation sharing and discussion
- 10 -
Against this backdrop, the United States, in cooperation with Canada and Mexico, submitted a plan to the Meeting of
Parties of the Montreal Protocol for reducing the use of global-warming HFC refrigerants. The aim was to resolve the
issue of global warming from refrigerants by incorporating HFCs into the Montreal Protocol, which has achieved
significant results. The Montreal protocol is an agreement to prevent depletion of the ozone layer, and discussions have
been conducted at the Convention on Climate Change for refrigerant issues related to global warming. The total amount
of global warming caused by HFCs and HCFCs between 2005 and 2008 is currently the baseline for this reduction plan.
The optimum goal for the developed countries calls for an 85% reduction in the total global warming potential (GWP) of
HFCs, including HCFCs, by 2033. Despite initial opposition to this proposal from the developing countries, the United
States was able to persuade opposing countries, such as China and India, to approve the proposal, and a decision was
made to continue this discussion at the Meeting of the Parties to the Montreal Protocol held in November 2015. This
paved the way for future discussions to address global warming countermeasures.
Unsurprisingly, discussions have ranged from the protection of the ozone layer to the mitigation of the impact of
refrigerants on global warming. These discussions are not limited to the venue of the United Nations and are also being
conducted in Japan, Europe, the United States, and developing countries.
1.2.2 Refrigerant regulations for Japan
The second major trend concerns the Act for Rationalized Use and Proper Management of Fluorocarbons, which came
into force in Japan in April 2015 as a countermeasure against CO2 emissions. In Japan, the impact on global warming of
the refrigerants used in the air-conditioning and refrigeration sector is expected to increase to 40 million tons of CO2
equivalent 1-2) by 2020 when it is estimated that it will constitute approximately 3 to 4% of all greenhouse gases (Fig. 1-
2). In the Act for Rationalized Use and Proper Management of Fluorocarbons, countermeasures include the use of
refrigerants with a low impact on global warming, combined with the curtailment of refrigerant emissions. To curtail
fluorocarbon emissions into the atmosphere, the revisions adopted the fundamental directions of clarifying the four
countermeasures and the related working bodies in each step of the life cycle, from production to disposal, while
addressing the major pillars of the “rationalization of use” as well as the “optimization of control” of fluorocarbons that
are used in commercial-use products. “Rationalization of use” refers to the production of fluorocarbons with a lower GWP
and a reduction in the amount of fluorocarbons, while “optimization of control” refers to the efforts to curtail the amount
of total emissions by ascertaining the emission conditions.
The four points determining the direction of concrete countermeasures are as follows:
(1) Substantial reduction in use of fluorocarbons:
F-gas manufacturers must reduce the impact on global warming by developing and reusing alternative refrigerants
and reducing the amount of fluorocarbon production.
Figure 1-2 BAU scenario for foam and RAC sector
- 11 -

(2) Promotion of products using non-fluorocarbons and low-GWP fluorocarbons:
Product manufacturers must work towards the widespread use of products that incorporate the latest technology
and market trends and which have the lowest environmental impact. The GWP target and period are specified in
Table 1-3.
Table 1-3 GWP target and period for each specified product in Japan
Specified Product GWP target Period
Residential A/C 750 2018
Commercial A/C < 3Rt 750 2020
Condensing Unit/Stationary Refrigeration 1500 2025
Central type Refrigeration 100 2019
MAC 150 2023
(3) Prevention of fluorocarbon leakage during equipment use:
The emission amounts must be reduced for equipment users by the promotion of appropriate control at the time of
equipment use.
(4) Improvement in F-gas charging and recovery:
Charging and collection contractors must promote the proper charging and collection of F-gas and speed their
efforts for the destruction and recycling of fluorocarbons. According to the direction stated above, those points
that must become the standard for that determination have been established and made public for “manufacturers
of fluorocarbons,” “manufacturers and importers of products that use fluorocarbons,” and “managers of
commercial-use air-conditioning and refrigeration equipment.” The total target amount has been set at a 32%
reduction in 2030 compared with 2013 levels 1-3) as stated in Japan’s Intended Nationally Determined Contributions
(INDC) to the Convention on Climate Change.
1.2.3 Refrigerant regulations for Europe and the United States
Even in Europe, a revision 1-4) to the EU F-gas Regulation (EC Regulation No. 842) was enacted in January 2015. The
EU F-gas Regulations for 2006 started with the incorporation of a refrigerant containment system, a training certification
system for installers, and a reporting system for the area of stationary air-conditioning and refrigeration. It had been
decided, in 2011, to prohibit the use of refrigerant HFC-134a for motor-vehicle air conditioners. This revised F-gas
regulation required that provision and enforcement begin from January 1, 2015. In addition to the existing regulations,
this revision set a target to reduce CO2 emissions in 2030 by 79% compared to the average CO2 emission levels for 2009
Figure 1-3 HFC emissions in Japan
- 12 -

to 2012, through the application of countermeasures including the total amount management for refrigerant such as GWP
regulations for each application and precharge. There are three points covered by the F-gas regulations.
(1) Regulations for the sales of HFC (control by imposing a quota on HFC sellers). This means imposing a sales quota
whereby existing sellers have the right to 89% of the total sales while the remaining 11% is allotted to new sellers.
(2) From 2017, the quota will be imposed even on the refrigerant used in imported air conditioners.
(3) GWP regulations for refrigerant used in equipment. It is said that this will be implemented in stages. Regulations
governing stationary freezers and refrigerators were given priority, with regulations planned for introduction from
2018, followed by multi-type central refrigeration systems in 2021, and then single split-type air conditioners in
2024. The GWP target and period are specified in Table 1-4.
Table 1-4. Target GWP and period for each product in EU
The third major trend involves North America. The Obama administration strengthened the Climate Action Plan as
government policy and has proceeded with refrigerant countermeasures that prohibit high-GWP refrigerants and approve
low-GWP refrigerants by having the Environmental Protection Agency (EPA) implement a refrigerant certification
system called the Significant New Alternatives Policy (SNAP). Soon, some refrigerants will essentially be prohibited by
being excluded from SNAP registration. These include the likes of HFC-404A and HFC-507A as well as HFC-134a and
specified HFC mixed refrigerants for standalone freezers and vending machines. The trend in Canada is similar to that in
Japan and Europe, while the GWP regulatory values and start year for the regulations corresponding to specific equipment
have been announced.
These GWP regulations in Japan, Europe, and Canada and compared in Table 1-5. The table shows that the targets are
mostly the same. It is believed that this is because only a limited number of refrigerants are available. As the comparison
Specified product GWP target Period
Residential refrigerator 150 2015/1/1
Hermetic industrial refrigeration 2500 2020/1/1
150 2022/1/1
Stationary refrigeration (> -50°C) 2500 2020/1/1
Multi-type refrigeration (> 40 kW) 150 2022/1/1
Split A/C (charge < 3 kg) 750 2025/1/1
MAC (MAC directive) 150 2013/1/1
MAC (all types) 150 2017/1/1
Table 1-5 Comparison of target
- 13 -

table makes clear, the numerical values assume HFC-32 for residential and commercial-use air conditioners smaller than
a certain capacity, and the weighted averages for HFC-410A and CO2 in Japan is assumed for freezer and refrigerator
showcases. The same assumption is made for HFC-410A in Europe. Motor-vehicle air conditioners are primarily assumed
to use HFO-1234yf, with the values being similar for Japan, Europe, and Canada. Alternative candidate refrigerants are
limited, which is why the use of essentially the same refrigerants is assumed.
In this way, efforts for reducing the impact of refrigerant on global warming are advancing globally. Figure 1-4
compares the reduction targets of the phasedown plan proposed to the Meeting of the Parties to the Montreal Protocol by
the previously mentioned three countries of North America (the United States, Canada, and Mexico) and the EU’s
reduction targets. The long-term target in both cases is an ultimate reduction of 80%.
1.2.4 Trends in developing countries
The fourth major trend involves the HCFC phaseout plan of the Montreal Protocol in developing countries. In 2008, the
Montreal Protocol was revised, and the period for the abolition of HCFCs in developing countries (Article 5 countries)
was also brought forward. The HCFC phaseout plan was concluded as shown in Figure 1-5, calling for the total amount
of ozone depleting HCFCs to be frozen, in 2013, at a level equal to the average for 2009-2010. The values must be further
reduced by 10% in 2015 and by 35% in 2020. Currently, a plan is being investigated for moving the developing countries
toward the second step (Phase 2) beginning from 2015. In the developing countries, air-conditioning and refrigeration are
steadily becoming more commonplace and refrigerant consumption is increasing. For this reason, it is extremely important
for there to be either a reduction in refrigerant production or a switch to new refrigerants. Refrigerant depletes the ozone
layer because of the action of the chlorine ion in HCFC.
Developed countries are already using HFCs, which do
not contain any chlorine, as an alternative to CFCs and
HCFCs. For example, HCFC-22 has shifted mainly to
HFC-410A (R410A). However, HCFCs, including
HCFC-22, are still widely used in developing countries.
There is concern, however, about the burden imposed,
prior to the phase-out deadline, by the two-fold
conversion to a refrigerant that does not deplete the
ozone layer and then to a refrigerant that has an even
lower impact on global warming. The UNEP would also
like to avoid any shift to HFCs with a high GWP, while Figure 1-5 HCFC phaseout plan (Article 5 countries)
Figure 1-4 Reduction Target for HFC/HCFC Consumption
- 14 -

United Nations officials are opposed to providing financial assistance from the Montreal Protocol Multilateral Fund for a
shift to HFC-410A.
Applications have been made to the United Nations to
utilize the Multilateral Fund to help finance these
refrigerant conversions in developing countries. These
applications are evaluated 1-5) by the Executive
Committee (ExCom) that is held several times every year
with the evaluation results being announced on the
website. The author presents a simple summary in Table
1-6. Further progress was made concerning Phase 2 that
began from 2015 at the Meeting of Parties of the
Montreal Protocol, held in Dubai in November 2015.
1.3 Trends in Safety Standards for Refrigerants in Japan and Overseas
1.3.1 Global comparison of safety regulations and standards
Currently, concerns over mild flammability pose the greatest challenge to the conversion to refrigerants with a low global
warming potential (GWP). As previously mentioned, the non-flammable (A1) refrigerants exhibit little promise as
alternatives to R410A, whereas the lower flammable (A2L) have an appropriate GWP. Consequently, the question
becomes one of whether the safety of these less flammable refrigerants can be guaranteed and can satisfy the safety
standards for each country and each international standards organization. Thus, tradeoffs arise in alleviating concerns
related to both global warming and flammability. ISO and IEC are both highly respected international standards. Similarly,
the European Standard (EN), the American Society of Heating, Refrigerating, and Air-Conditioning Engineers
(ASHRAE), and the Globally Harmonized System of Classification and Labelling of Chemicals (GHS) are also very
influential. Table 1-7 shows the international, European, and U.S. standards that relate to the definition and classification
of refrigerants.
Table 1-7 Safety standards related to refrigerants in each region
Refrigeration and Air-Conditioning General Gases
(transportation) Refrigerant RAC total Equipment
International ISO817 ISO5149 IEC60335-2-40,24,89,34 GHS
United States ASHRAE34 ASHRAE15
UL1995,484
UL984
UL60335-2-40 DOT
Europe EN378 EN378 EN60335-2-40
China GB/T 7778-2008
GB 9237-2001
SB/T 10345.1~4-2012
(EN378:2008)
GB 4706.32-2012
(IEC 60335-2-40:2005)
Japan High Pressure Gas Safety Act (KHK) Japan Electrical Safety
Standards
General High
Pressure Gas Safety
Ordinance
At present, revisions of these national and international standards are being made to address the handling of less-
flammable refrigerants. Revisions to ASHRAE 34, ISO 817, and ISO 5149 have already been completed and issued.
Revisions to for IEC 60335-2-40 and GHS are underway. Here I would like to briefly address the contents of these
standards.
(1) ISO 817 (Designation and safety classification): This standard expresses the rules for the nomenclature used to
describe refrigerants. Revised in 2014, the criteria for the safety classes of refrigerants have been incorporated,
including a classification for lower flammability (2L). Class 2L, which covers lower flammability and relates to the
Table 1-6 Measures imposed by each country
- 15 -
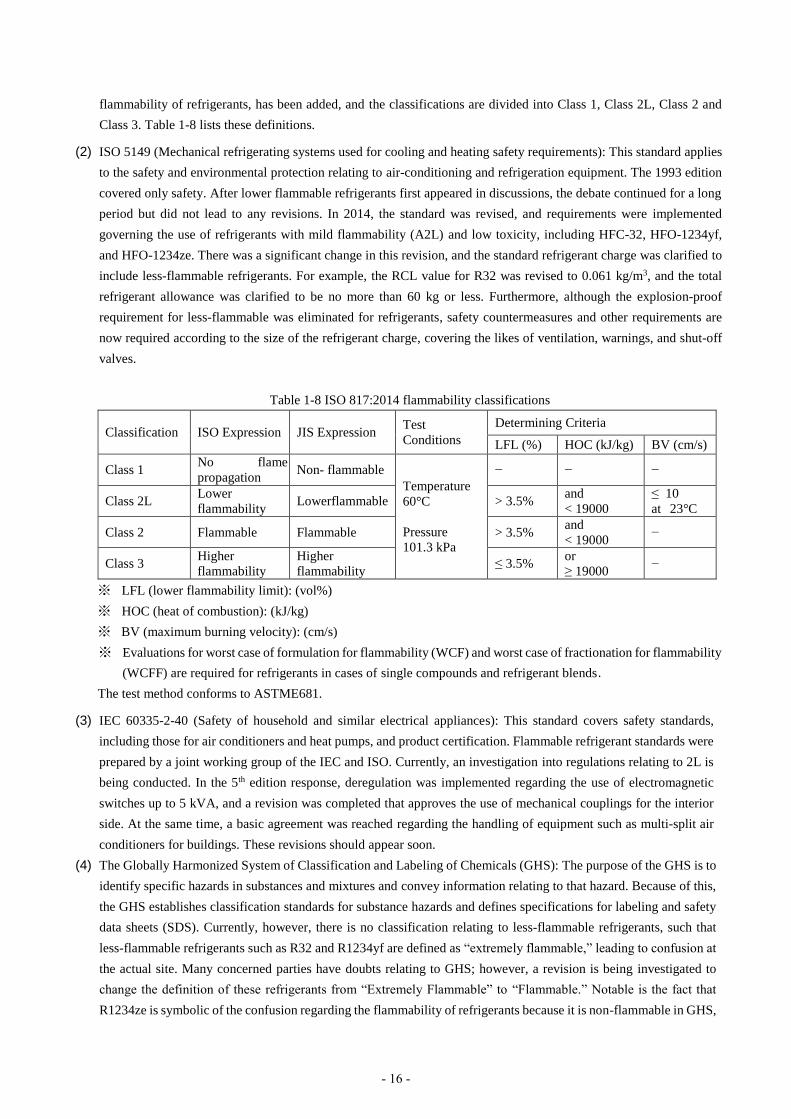
flammability of refrigerants, has been added, and the classifications are divided into Class 1, Class 2L, Class 2 and
Class 3. Table 1-8 lists these definitions.
(2) ISO 5149 (Mechanical refrigerating systems used for cooling and heating safety requirements): This standard applies
to the safety and environmental protection relating to air-conditioning and refrigeration equipment. The 1993 edition
covered only safety. After lower flammable refrigerants first appeared in discussions, the debate continued for a long
period but did not lead to any revisions. In 2014, the standard was revised, and requirements were implemented
governing the use of refrigerants with mild flammability (A2L) and low toxicity, including HFC-32, HFO-1234yf,
and HFO-1234ze. There was a significant change in this revision, and the standard refrigerant charge was clarified to
include less-flammable refrigerants. For example, the RCL value for R32 was revised to 0.061 kg/m3, and the total
refrigerant allowance was clarified to be no more than 60 kg or less. Furthermore, although the explosion-proof
requirement for less-flammable was eliminated for refrigerants, safety countermeasures and other requirements are
now required according to the size of the refrigerant charge, covering the likes of ventilation, warnings, and shut-off
valves.
Table 1-8 ISO 817:2014 flammability classifications
Classification ISO Expression JIS Expression Test
Conditions
Determining Criteria
LFL (%) HOC (kJ/kg) BV (cm/s)
Class 1 No flame
propagation Non- flammable
Temperature
60°C
Pressure
101.3 kPa
− − −
Class 2L Lower
flammability Lowerflammable > 3.5%
and
< 19000
≤ 10
at 23°C
Class 2 Flammable Flammable > 3.5% and
< 19000 −
Class 3 Higher
flammability
Higher
flammability ≤ 3.5%
or
≥ 19000 −
※ LFL (lower flammability limit): (vol%)
※ HOC (heat of combustion): (kJ/kg)
※ BV (maximum burning velocity): (cm/s)
※ Evaluations for worst case of formulation for flammability (WCF) and worst case of fractionation for flammability
(WCFF) are required for refrigerants in cases of single compounds and refrigerant blends.
The test method conforms to ASTME681.
(3) IEC 60335-2-40 (Safety of household and similar electrical appliances): This standard covers safety standards,
including those for air conditioners and heat pumps, and product certification. Flammable refrigerant standards were
prepared by a joint working group of the IEC and ISO. Currently, an investigation into regulations relating to 2L is
being conducted. In the 5th edition response, deregulation was implemented regarding the use of electromagnetic
switches up to 5 kVA, and a revision was completed that approves the use of mechanical couplings for the interior
side. At the same time, a basic agreement was reached regarding the handling of equipment such as multi-split air
conditioners for buildings. These revisions should appear soon.
(4) The Globally Harmonized System of Classification and Labeling of Chemicals (GHS): The purpose of the GHS is to
identify specific hazards in substances and mixtures and convey information relating to that hazard. Because of this,
the GHS establishes classification standards for substance hazards and defines specifications for labeling and safety
data sheets (SDS). Currently, however, there is no classification relating to less-flammable refrigerants, such that
less-flammable refrigerants such as R32 and R1234yf are defined as “extremely flammable,” leading to confusion at
the actual site. Many concerned parties have doubts relating to GHS; however, a revision is being investigated to
change the definition of these refrigerants from “Extremely Flammable” to “Flammable.” Notable is the fact that
R1234ze is symbolic of the confusion regarding the flammability of refrigerants because it is non-flammable in GHS,
- 16 -
less flammable in ISO817, and flammable in the general gases of Japan. Table 1-9 lists the flammable classifications
used in GHS.
Table 1-9 Flammable Classifications in GHS
Class 1
Extremely Flammable
Class 2
Flammable
Other
Not flammable
Test Conditions Temperature 20°C, Pressure 101.3 kPa
Determining
Criteria LFL < 13%, or
UFL-LFL > 12%
Flammable range exists but
is not Class 1
Flammable range does not exist
Expression Extremely Flammable Flammable -
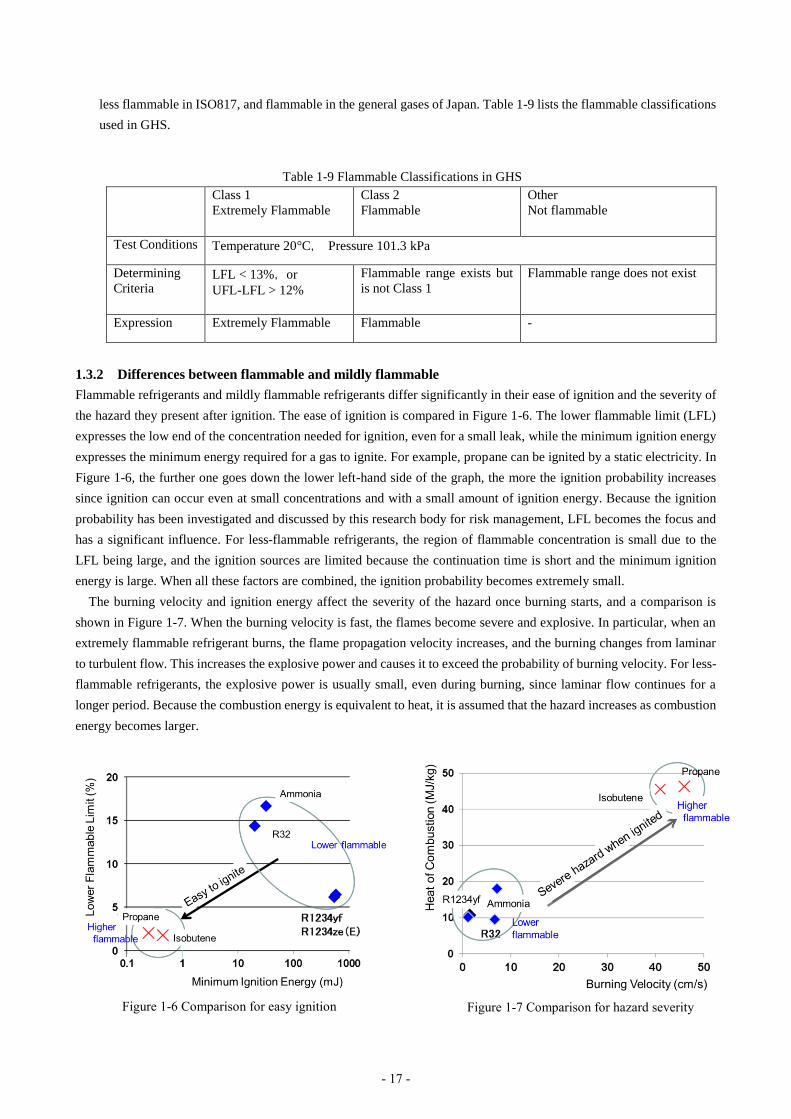
1.3.2 Differences between flammable and mildly flammable
Flammable refrigerants and mildly flammable refrigerants differ significantly in their ease of ignition and the severity of
the hazard they present after ignition. The ease of ignition is compared in Figure 1-6. The lower flammable limit (LFL)
expresses the low end of the concentration needed for ignition, even for a small leak, while the minimum ignition energy
expresses the minimum energy required for a gas to ignite. For example, propane can be ignited by a static electricity. In
Figure 1-6, the further one goes down the lower left-hand side of the graph, the more the ignition probability increases
since ignition can occur even at small concentrations and with a small amount of ignition energy. Because the ignition
probability has been investigated and discussed by this research body for risk management, LFL becomes the focus and
has a significant influence. For less-flammable refrigerants, the region of flammable concentration is small due to the
LFL being large, and the ignition sources are limited because the continuation time is short and the minimum ignition
energy is large. When all these factors are combined, the ignition probability becomes extremely small.
The burning velocity and ignition energy affect the severity of the hazard once burning starts, and a comparison is
shown in Figure 1-7. When the burning velocity is fast, the flames become severe and explosive. In particular, when an
extremely flammable refrigerant burns, the flame propagation velocity increases, and the burning changes from laminar
to turbulent flow. This increases the explosive power and causes it to exceed the probability of burning velocity. For less-
flammable refrigerants, the explosive power is usually small, even during burning, since laminar flow continues for a
longer period. Because the combustion energy is equivalent to heat, it is assumed that the hazard increases as combustion
energy becomes larger.
Figure 1-7 Comparison for hazard severity Figure 1-6 Comparison for easy ignition
- 17 -

1.3.3 Japanese High Pressure Gas Safety Act and international standards
Table 1-10 shows a comparison of the relationship between the international standards and the Japanese High Pressure
Gas Safety Act (KHK). From this table, we can see how the flammability differs according to the standard, as well as the
difference between Japan and overseas. There are three main reasons for this difference. One is that the testing method is
different. Takisawa mentioned this in the previous chapter. Because the ignition energy is large in the testing method used
in Japan, the value is more demanding than that used overseas. Next, the combustible range that determines the
flammability differs according to the standard. For example, in ISO817, the flammability is less than LFL 3.5% but in
GHS there is flame propagation, while in the KHK it is 10% or less. However, the biggest difference is how the definition
differs in terms of whether the gas is used in air-conditioning and refrigeration equipment or used as a general gas. When
used in air-conditioning and refrigeration, the concept of lower flammability has been debated, but there are still no
standards governing the handling of lower flammable gases in the standards governing the handling of general gases.
Originally, there was no concept of a “lower flammable” gas in the KHK; however, this has been requested by industry
associations, and there is a plan to clarify the handling of lower-flammable refrigerants and define “inert” to be equivalent
to non-flammable. Some have expressed their surprise that only Japan has made lower-flammable refrigerants equivalent
to non-flammable refrigerants, but the term “inert,” as used in Japan in the KHK, expresses a “remarkably low level of
danger” (a term in the KHK legal glossary), although this is not a term that expresses the physical properties of the
Table 1-10 Classifications of flammability in Japan and overseas
-
Lower
flammable
A2L
R1234yf
R1234ze
are A2L
A2
expected
to be A2L
Inert
Extremely
flammable
R1234yf
extremely
flammable
Flammable
R1234yf:
flammable
R1234ze:
non-
flammable
- 18 -
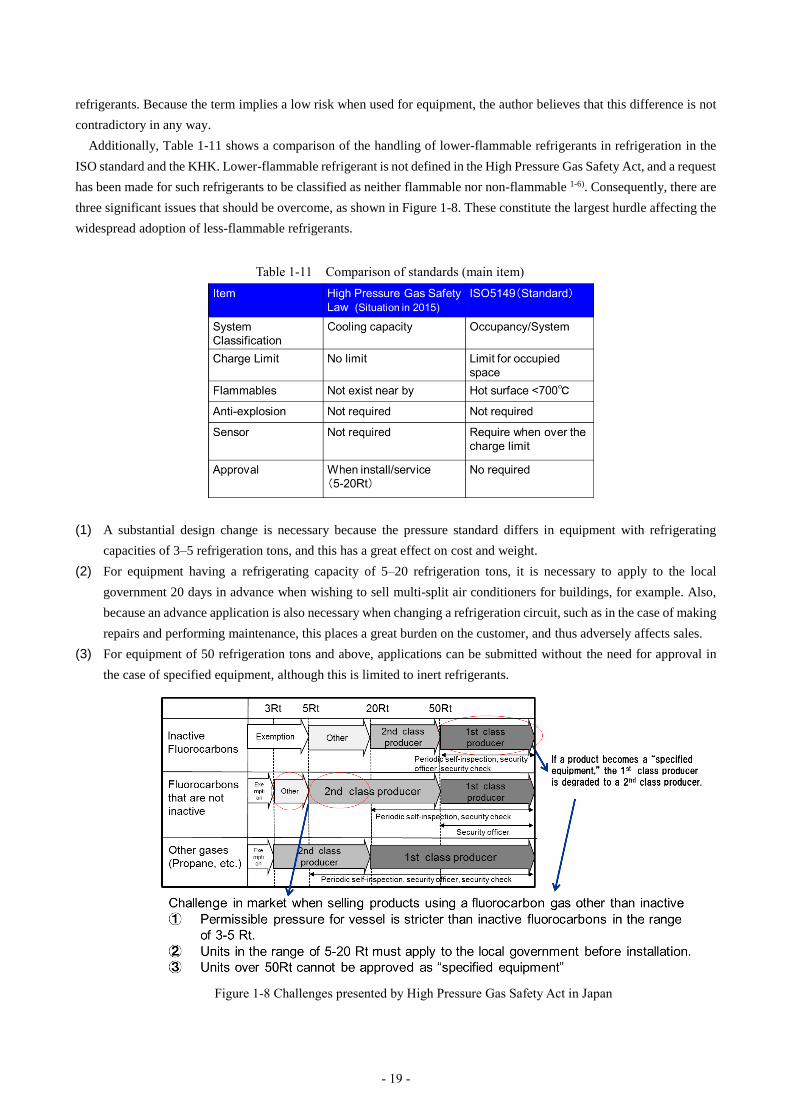
refrigerants. Because the term implies a low risk when used for equipment, the author believes that this difference is not
contradictory in any way.
Additionally, Table 1-11 shows a comparison of the handling of lower-flammable refrigerants in refrigeration in the
ISO standard and the KHK. Lower-flammable refrigerant is not defined in the High Pressure Gas Safety Act, and a request
has been made for such refrigerants to be classified as neither flammable nor non-flammable 1-6). Consequently, there are
three significant issues that should be overcome, as shown in Figure 1-8. These constitute the largest hurdle affecting the
widespread adoption of less-flammable refrigerants.
(1) A substantial design change is necessary because the pressure standard differs in equipment with refrigerating
capacities of 3–5 refrigeration tons, and this has a great effect on cost and weight.
(2) For equipment having a refrigerating capacity of 5–20 refrigeration tons, it is necessary to apply to the local
government 20 days in advance when wishing to sell multi-split air conditioners for buildings, for example. Also,
because an advance application is also necessary when changing a refrigeration circuit, such as in the case of making
repairs and performing maintenance, this places a great burden on the customer, and thus adversely affects sales.
(3) For equipment of 50 refrigeration tons and above, applications can be submitted without the need for approval in
the case of specified equipment, although this is limited to inert refrigerants.
Figure 1-8 Challenges presented by High Pressure Gas Safety Act in Japan
Table 1-11 Comparison of standards (main item)
- 19 -

1-3-4 Trends towards easing of regulations
A direction 1-7) was set forth in Japan on March 12, 2015, and March 9, 2016 at the High Pressure Gas Subcommittee of
the Industrial Safety Committee for the Industrial Structure Council to ease the regulations governing refrigeration in the
KHK. The direction adopted to ease the regulations involves classifying three refrigerants (R32, R123yf, and R1234ze)
as being “inert” in the refrigeration regulations. However, there are conditions related to the determination of the necessary
steps in the technical standards. The necessary steps are as follows:
・A structure shall be provided to prevent any accumulation of these less-flammable refrigerants in the event of a leak
・Warning equipment shall be installed in any location where it is feared that gas may accumulate.
Furthermore, there is a direction whereby three less-flammable refrigerants are classified as being “inert” even in the
general gas regulations that are applied broadly to general gases and the complex building regulations that are mainly
applied to factories. However, as in the case of the refrigeration regulations, some conditions must be worked out
regarding the necessary steps in the technical standards.
The easing of regulations has also been advancing internationally. In 2010, ASHRAE34 was revised with the
classification of the less-flammable (2L) class. In 2013, IEC60335-2-40Ed.5 was revised, allowing the use of flared joints,
for example, for less-flammable refrigerants. Following this, in 2014, ISO817 and then ISO5149 were revised, such that
the standards governing the use of less-flammable refrigerants were largely established. Currently, discussions regarding
the revision of IEC60335-2-40 are ongoing, with the outlook leaning towards an easing of the regulations in 2017. In this
easing of the regulations, a maximum leak amount of 10 kg/h for multi-split air conditioners for buildings, which are
mostly used in Japan, has been met with opposition in the United States and has become a point of contention, but a
decisions will be made on the various issues such as the effect of natural ventilation to ultimately reach an agreement. In
the United States, the Obama administration has conducted policy-linking countermeasures aimed at addressing global
warming as part of the Significant New Alternatives Policy (SNAP), a refrigerant-use certification system chiefly
administered by the EPA. SNAP has been revised, with the use of less-flammable refrigerants and flammable refrigerants
for which the charge is small have been approved for integrated equipment. However, there is a plan to remove refrigerants
with high GWP such as R404A and partly for R134a from the list of alternative refrigerant candidates and eventually
abolish them. The debate as to whether to ease the regulations governing large equipment is progressing in ASHRAE15,
which has formed a committee study group, with the goal of ultimately reflecting the outcome in the likes of building
standards based on the revision of the international mechanical code that forms the basis of these results. Likewise, the
trend towards an easing of the regulations is also progressing for GHS and is being reflected in the likes of SDS.
References
1-1) UNEP Ozone Secretariat website: ozone.unep.org/new_site/en/assessment_panels_bodies.php?committee_id=6
1-2) Direction for Future Measures of Fluorocarbons: Central Environment Council/Industrial Structure Council of METI
(December 2014)
www.env.go.jp/council/06earth/y0612-07/mat01.pdf
1-3) Japan’s INDC “Greenhouse Gas Reduction Plan”: The Prime Minister’s Office (July 17, 2015)
www.kantei.go.jp/jp/singi/ondanka/.../siryou1-2.pdf
1-4) Guidance Document for F-gas Regulation (April 2015)
ec.europa.eu/clima/policies/f-gas/docs/f-gas_equipment_operators_en.pdf
1-5) e.g. UNEP Ozone Unit ExCom
www.multilateralfund.org/.../64/English/1/6452.pdf
1-6) High Pressure Gas Safety Act Refrigeration Safety Regulations
www.meti.go.jp/policy/safety_security/industrial_safety/law/law8.html8)
1-7) High Pressure Gas Subcommittee of the Industrial Safety Committee for the Industrial Structure Council
- 20 -

www.meti.go.jp/committee/sankoushin/hoan/koatsu_gas/pdf/007_05_03.pdf
www.meti.go.jp/committee/sankoushin/hoan/koatsu_gas/010_haifu.html
- 21 -
2. Fundamental Flammability
2.1 Introduction
High-global warming potential (GWP) compounds are stable in the atmosphere, and therefore lower-GWP alternatives
are less stable. The properties that make these new compounds more reactive in the atmosphere also makes them more
flammable. Low-GWP compounds with mild flammability appear to provide the optimum balance of acceptable safety
properties and environmental performance, when considering the risk tradeoff with high-GWP compounds. Thus, risk
assessments need to be performed on mildly flammable compounds before they are used in practical applications.
(Hereafter, a compound with a maximum burning velocity of Su, max ≤ 10 cms-1 is called “mildly flammable” or a “2L”
compound).
According to the International Organization for Standardization/International Electrotechnical Commission (ISO/IEC)
Guide 51 (1999)2-1), risk is defined as the “combination of the probability of occurrence of harm and the severity of that
harm.” When assessing the risk of flammable refrigerants, we should consider the combination of the probability of fire
occurring because of leakage of the refrigerant, and the severity of that fire hazard. Accordingly, it is important to collect
a set of indices that appropriately express this risk.
In order to consider the probability of potential fire incidents and the severity of fire hazards, ISO 817 (2014) 2-2) uses
the lower flammability limit (LFL), heat of combustion (Hc), and burning velocity (Su,max) to categorize refrigerants into
four flammability classes, which are summarized in Table 2-1. These properties must be evaluated in order to realize the
use of new refrigerants in practical applications. The American National Standards Institute/American Society of Heating,
Refrigerating and Air-Conditioning Engineers (ANSI/ASHRAE) Standard 34 (2013) 2-3) and ISO 817 recently introduced
the new 2L flammability class to distinguish the lowest flammability class from the other flammability classes. ISO 5149
(2014) 2-4) and IEC 60335-2-40 2-5) are considering relaxing restrictions on the use of the 2L refrigerants under the premise
that the fire hazards caused by 2L refrigerants should be very low, in probability and severity.
According to ANSI/ASHRAE Standard 15 (2013) 2-6), there shall be no hot surface over 427 °C permanently installed
in a refrigerating machinery room. Thus, it is also important to understand the thermal decomposition of the refrigerant
and its thermal ignition on a hot surface.
Based on the above observations, if we are to export and import refrigerating systems using 2L refrigerants, correct
evaluation of the fundamental flammability properties given above is a basic requirement.
In addition, in order to establish reliable risk assessments under practical conditions, performing risk assessments based
on the flammability properties under realistic conditions is important. We should carry out risk assessments by considering
the parameters that cover the worst-case scenarios under practical conditions. From this viewpoint, the effect of humidity
on flammability and thermal decomposition was within the scope of this research project.
Table 2-1 Refrigerant flammability classification in ISO 817 (2014) and representative refrigerants
Flammability class Definition Representative refrigerant
Class 3 (Higher flammability) LFL 3.5 vol% or Hc 19 MJkg−1 R290, R600a
Class 2 (Flammable) LFL 3.5 vol% and Hc 19 MJkg−1 R152a
Class 2L (Lower flammability) In class 2, Su, max 10 cms−1 R717, R32, R143a
R1234yf, R1234ze (E)
Class 1 (No flame propagation) No flame propagation R134a, R410A, R22
In this study, we first present a report on the fundamental flammability properties of 2L refrigerants. A detailed practical
risk assessment is presented in the following chapters.
- 22 -

As described previously, refrigerants are classified based on the LFL, Hc, and Su,max. In Section 2.2, we report on the
measured flammability limits for Class 2L and Class 1 refrigerants, including the effects that temperature and humidity
may have on those limits. In Section 2.3, the burning velocity for Class 2L and Class 1 refrigerants are reported, including
the temperature and humidity issues.
To determine whether a refrigerant is flammable or not in practice, information is needed on the ignition energy of the
refrigerant and the ignition source in the surrounding environment. Section 2.4 presents an evaluation of ignition energy
and quenching distance, including the influence of temperature, humidity, and refrigerant concentration on them.
In this research project, a new index called the extinction diameter was introduced to evaluate the flammability
characteristics of 2L refrigerants. This index is expected to be used for judging whether an enclosure of electrical parts
with openings, such as a magnetic contactor and socket, can become an ignition source for refrigerants. In Section 2.5,
we report the experimental results for the extinction diameter for typical refrigerants, including the effect that high
humidity has on the parameter.
Sections 2.6 and 2.7 discuss the thermal decomposition of refrigerants, and 2L refrigerants and typical Class 1
refrigerants are compared. As described earlier, the use of flammable refrigerants near a hot surface with a temperature
of over 427 °C is forbidden in some applications. Thus, information on the onset of thermal decomposition is important.
In addition, from the viewpoint of toxicity, it is very important to know the toxicity level and the concentration of thermal
decomposition products. It is also important to know whether there is a significant difference between 2L and existing
non-flammable refrigerants.
In Section 2.8, we evaluate fundamental flammability in three different areas as an example. In this example, the
weather conditions, i.e. temperature and humidity, are considered. The evaluation is based on the temperature and
humidity effects on the fundamental flammability, which are reported in this chapter. Therefore, it is possible to estimate
the fundamental flammability of various areas in the real world in the same manner.
Table 2-2 lists the flammability characteristics obtained in this study. The fundamental flammability data used in this
report are quoted from this table.
- 23 -

Table 2-2 Flammability characteristics of typical refrigerants
R290 R600a R152a R717 R143a R32 R1234yf R1234ze(E) R413A R410A R134a R22
ISO817 safety class A3 A3 A2 B2L A2L A2L A2L A2L A1/A2 A1 A1 A1
GWP100yr 3 3 124 <1 4470 675 4 6 2050 2090 1430 1810
Flammability limit (LFL/UFL), vol% (upper pair) and kgm−3 (lower pair)
HPGSAa-A method,
25 °C, 0 %RH
1.92/10.46
0.035/0.189
1.57/8.6
0.037/0.204
4.25/18.3
0.115/0.494
10.5/50.0
0.073/0.348
7.15/18.8
0.246/0.646
13.3/29.3
0.283/0.623
6.21/14.0
0.290/0.653
6.39/13.3
0.298/0.620
ASHRAE method b,
30 °C, 0 %RH
2.02/ 9.81
0.0358/0.174
1.67/7.66
0.039/0.179
4.3/17.3
0.114/0.460
15.3 / 30.4
0.105/0.208
7.3/17.9
0.247/0.605
13.5 / 28
0.282/0.586
6.7 / 12
0.307/0.550
n.f / n.f n.f./n.f.c n.f / n.f d n.f / n.f n.f / n.f
ASHRAE method b,
60 °C, 50 %RH
4.36 / 14.8
0.105/0.358
18 / 24.5
0.112/0.153
13.5 / 23.6
0.257/0.449
4.8 / 15
0.200/0.626
5.05 / 15.5
0.211/0.647
7.16/14.3 c
0.291/0.581
15.6/ 21.8 d
0.414/0.579
11.5/ 15.9
0.429/0.594
n.f / n.f
Heat of combustion (Hc), MJkg−1
25 °C, 0 %RH 46.3 45.6 16.3 18.6 10.2 9.5 10.7 10.1 7.6 d 6.5 d 6.7 3.5
Maximum burning velocity (Su,max), cms−1
25 °C, 0 %RH 38.7 34.2 23.6 7.2 7.1 6.7 1.5 n.f. n.f. n.f. n.f. n.f.
60 °C, 0 %RH 47.4 41.3 29.0 8.8 9.1 7.8 1.9 n.f. n.f. n.f. n.f. n.f.
60 °C, 50 %RH 6.9 10.3 10.3 5.9 c 3 d, e 2 e n.f.
Minimum ignition energy (Emin), mJ, estimated f
25 °C, 0 %RH 0.35 0.62 0.9 45 27 29 780 n.f. n.f. n.f. n.f. n.f.
60 °C, 50 %RH 40 9 9 30 c 130 d, e 130 e n.f.
Quenching distance (dq), mm g
25 °C, 0 %RH 1.75 2.0 2.33 8.95 7.0 7.55 24.8 e n.f. n.f. n.f. n.f. n.f.
60 °C, 0 %RH 1.58 1.7 h 2.2 h 8.05 5.8 h 6.95 20.5 e n.f. n.f. n.f. n.f. n.f.
60 °C, 50 %RH 8.25 5.0 5.15 7.55 c 13.25d
12.5 d, e
12.5 e n.f.
Flame extinction diameter (d*), mm, for the distance between ignition point and opening (h) of 9 mm
25 °C, 0 %RH 1.23 6.9 5.6 14.0 i
10.0 e,i
n.f. n.f. n.f. n.f. n.f.
60 °C, 0 %RH 5.25 n.f. n.f. n.f. n.f. n.f.
60 °C, 50 %RH 6.35 3.9 3.9 n.f.
- 24 -

Thermal decomposition temperature j, °C, at the stoichiometric concentration (Cst) with gas flow rate of 100 cm3min−1
0 %RH 570 ± 10 610 ± 10 580 ± 20 710 ± 20 500 ± 10
n.f. = nonflammable. a) High Pressure Gas Safety Act. b) ASTM E681 (2004) method 2-7) using a 12-l glass flask. c) Values obtained for WCFF composition of R413A, i.e.
R218/134a/600a = 28.85/64.49/6.67 wt%, instead of the nominal composition, 9.0/88.0/3.0 wt%. The WCFF of R413A was calculated by Professor Ryo Akasaka, Kyushu
Sangyo University. d) Values obtained for the nominal composition of R410A and R413A. e) Values obtained in the microgravity environment where the buoyant flow is
eliminated from the very slow flame propagation and ideal flame propagation is realized. f) Estimated value from ref. 2-8). g) Values measured by modified ASTM E582-07
method2-8). h) Estimated value from ref. 2-8). i) d* for h = 58 mm, instead of 9 mm. j) Thermal decomposition temperature here is the temperature at which decomposition rate
of the refrigerant attains 10 %.
- 25 -

2.2 Effects of Temperature and Humidity on Flammability Limits of Refrigerants
Many of the alternative refrigerants are multi-fluorinated compounds. In addition, some of them contain more fluorine
atoms than hydrogen atoms. Such compounds may have wider flammable ranges in moist air than in dry air, therefore it
is important to know how the humidity affects the flammability of such compounds. In this context, a question arises as
to what happens when a non-flammable compound containing more fluorine atoms than hydrogen atoms is subjected to
high humidity conditions.
In this study, the flammability limits were measured with the ASHRAE method2-3) (ASTM E681 method2-7)). The
explosion vessel was a 12-l spherical glass flask, and the vessel flange was held on top by spring-loaded clamps. The
flask was placed in a temperature-controlled air bath. In order to adjust the humidity condition of the air, pure water was
injected into the vessel with a syringe. Two kinds of syringes were used2-9). One was a 0.2 ml full scale, and the relationship
between the injected water, q mL, and resulting water vapor pressure, p mmHg (1 mmHg = 133.32 Pa), corrected for
23 °C, is given by
p = 80.06q – 0.078. (2-1)
The other was a 1.0 ml full scale, and the relationship between the injected water and water vapor pressure is given by
p = 90.895q. (2-2)
2.2.1 Effect of laboratory level temperature and humidity on flammability limits of some flammable
refrigerants
(a) Temperature influence on flammability limits: In general, the flammable range becomes wide when the temperature
is raised; the lower limit becomes lower and the upper limit becomes higher. This tendency is quantitatively predicted
using White’s rule2-10). Here, the question arises as to whether this rule is also applicable to weakly flammable gases, such
as 2L refrigerants. In this study, we measured flammability limits for five 2L refrigerants: R717, R32, R143a, R1234yf,
and R1234ze (E). The measurements of R717, R32, and R143a were taken in dry air, and the measurements of R1234yf
and R1234ze (E) were taken in dry air and in moist air, where the humidity of the moist air was 50 % corrected for 23 °C.
The measurements in dry air were taken for a temperature range of 5–100 °C. However, because the saturated vapor
pressure of water at 5 °C does not reach 50 % corrected for 23 °C, the measurements in the moist air were taken only for
a temperature range of 20–100 °C. The results of the measurements are summarized in Table 2-3.
Table 2-3 Temperature influence on the flammability limits of several 2L refrigerants.
Refrigerant Temperature
range,
°C
Intercept at 0 °C,
vol%
Temperature coefficient
for LFL,
vol%K−1
Temperature coefficient
for UFL,
vol%K−1
LFL UFL Observed Predicted Observed Predicted
R717 5100 15.63 29.50 −0.0086 −0.0095 0.0208 0.0189
R32 5100 13.68 27.40 −0.0070 −0.0064 0.0091 0.0133
R143a 5100 7.51 17.60 −0.0051 −0.0038 0.0080 0.0093
R1234yf, dry 5100 7.13 11.70 −0.0133 −0.0029 0.0102 0.0052
R1234yf, moist 20100 5.55 13.15 −0.0045 −0.0028 0.0098 0.0071
R1234ze (E), moist 20100 6.39 12.17 −0.0104 −0.0029 0.0174 0.0061
Considering White's rule, the lower flammability limit, L(t), and the upper flammability limit, U(t), at temperature t °C
are expressed by the following equations:
𝐿(𝑡) = 𝐿25 {1 −100𝐶𝑝,𝐿
𝐿25𝑄(𝑡 − 25)} (2-3)
- 26 -
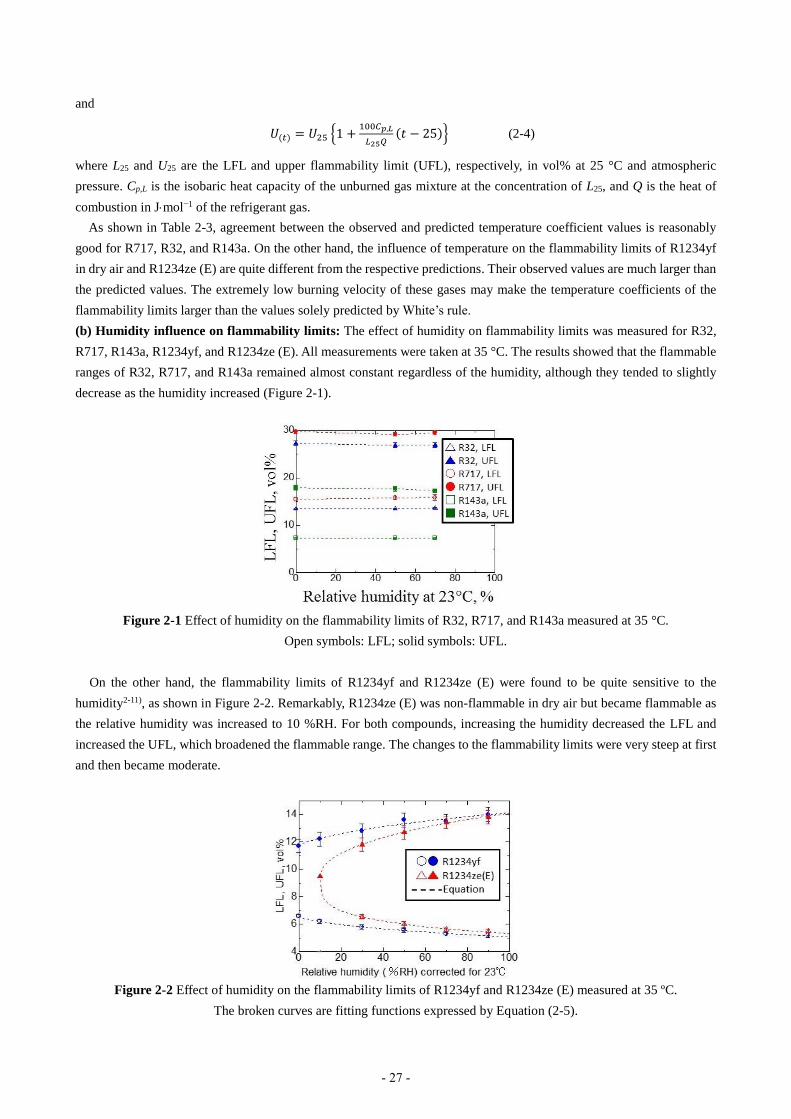
and
𝑈(𝑡) = 𝑈25 {1 +100𝐶𝑝,𝐿
𝐿25𝑄(𝑡 − 25)} (2-4)
where L25 and U25 are the LFL and upper flammability limit (UFL), respectively, in vol% at 25 °C and atmospheric
pressure. Cp,L is the isobaric heat capacity of the unburned gas mixture at the concentration of L25, and Q is the heat of
combustion in Jmol−1 of the refrigerant gas.
As shown in Table 2-3, agreement between the observed and predicted temperature coefficient values is reasonably
good for R717, R32, and R143a. On the other hand, the influence of temperature on the flammability limits of R1234yf
in dry air and R1234ze (E) are quite different from the respective predictions. Their observed values are much larger than
the predicted values. The extremely low burning velocity of these gases may make the temperature coefficients of the
flammability limits larger than the values solely predicted by White’s rule.
(b) Humidity influence on flammability limits: The effect of humidity on flammability limits was measured for R32,
R717, R143a, R1234yf, and R1234ze (E). All measurements were taken at 35 °C. The results showed that the flammable
ranges of R32, R717, and R143a remained almost constant regardless of the humidity, although they tended to slightly
decrease as the humidity increased (Figure 2-1).
Figure 2-1 Effect of humidity on the flammability limits of R32, R717, and R143a measured at 35 °C.
Open symbols: LFL; solid symbols: UFL.
On the other hand, the flammability limits of R1234yf and R1234ze (E) were found to be quite sensitive to the
humidity2-11), as shown in Figure 2-2. Remarkably, R1234ze (E) was non-flammable in dry air but became flammable as
the relative humidity was increased to 10 %RH. For both compounds, increasing the humidity decreased the LFL and
increased the UFL, which broadened the flammable range. The changes to the flammability limits were very steep at first
and then became moderate.
Figure 2-2 Effect of humidity on the flammability limits of R1234yf and R1234ze (E) measured at 35 ºC.
The broken curves are fitting functions expressed by Equation (2-5).
- 27 -
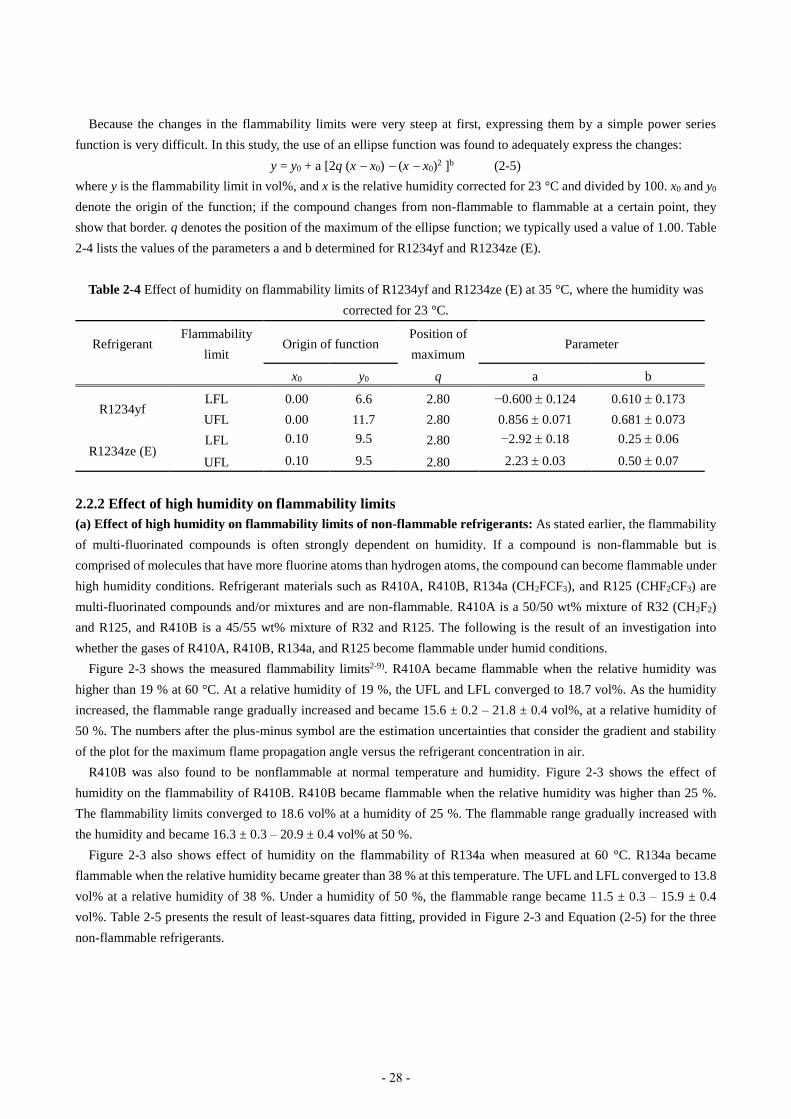
Because the changes in the flammability limits were very steep at first, expressing them by a simple power series
function is very difficult. In this study, the use of an ellipse function was found to adequately express the changes:
y = y0 + a [2q (x x0) (x x0)2 ]b (2-5)
where y is the flammability limit in vol%, and x is the relative humidity corrected for 23 °C and divided by 100. x0 and y0
denote the origin of the function; if the compound changes from non-flammable to flammable at a certain point, they
show that border. q denotes the position of the maximum of the ellipse function; we typically used a value of 1.00. Table
2-4 lists the values of the parameters a and b determined for R1234yf and R1234ze (E).
Table 2-4 Effect of humidity on flammability limits of R1234yf and R1234ze (E) at 35 °C, where the humidity was
corrected for 23 °C.
Refrigerant Flammability
limit Origin of function
Position of
maximum Parameter
x0 y0 q a b
R1234yf LFL 0.00 6.6 2.80 −0.600 0.124 0.610 0.173
UFL 0.00 11.7 2.80 0.856 0.071 0.681 0.073
R1234ze (E) LFL 0.10 9.5 2.80 −2.92 0.18 0.25 0.06
UFL 0.10 9.5 2.80 2.23 0.03 0.50 0.07
2.2.2 Effect of high humidity on flammability limits
(a) Effect of high humidity on flammability limits of non-flammable refrigerants: As stated earlier, the flammability
of multi-fluorinated compounds is often strongly dependent on humidity. If a compound is non-flammable but is
comprised of molecules that have more fluorine atoms than hydrogen atoms, the compound can become flammable under
high humidity conditions. Refrigerant materials such as R410A, R410B, R134a (CH2FCF3), and R125 (CHF2CF3) are
multi-fluorinated compounds and/or mixtures and are non-flammable. R410A is a 50/50 wt% mixture of R32 (CH2F2)
and R125, and R410B is a 45/55 wt% mixture of R32 and R125. The following is the result of an investigation into
whether the gases of R410A, R410B, R134a, and R125 become flammable under humid conditions.
Figure 2-3 shows the measured flammability limits2-9). R410A became flammable when the relative humidity was
higher than 19 % at 60 °C. At a relative humidity of 19 %, the UFL and LFL converged to 18.7 vol%. As the humidity
increased, the flammable range gradually increased and became 15.6 ± 0.2 – 21.8 ± 0.4 vol%, at a relative humidity of
50 %. The numbers after the plus-minus symbol are the estimation uncertainties that consider the gradient and stability
of the plot for the maximum flame propagation angle versus the refrigerant concentration in air.
R410B was also found to be nonflammable at normal temperature and humidity. Figure 2-3 shows the effect of
humidity on the flammability of R410B. R410B became flammable when the relative humidity was higher than 25 %.
The flammability limits converged to 18.6 vol% at a humidity of 25 %. The flammable range gradually increased with
the humidity and became 16.3 ± 0.3 – 20.9 ± 0.4 vol% at 50 %.
Figure 2-3 also shows effect of humidity on the flammability of R134a when measured at 60 °C. R134a became
flammable when the relative humidity became greater than 38 % at this temperature. The UFL and LFL converged to 13.8
vol% at a relative humidity of 38 %. Under a humidity of 50 %, the flammable range became 11.5 ± 0.3 – 15.9 ± 0.4
vol%. Table 2-5 presents the result of least-squares data fitting, provided in Figure 2-3 and Equation (2-5) for the three
non-flammable refrigerants.
- 28 -
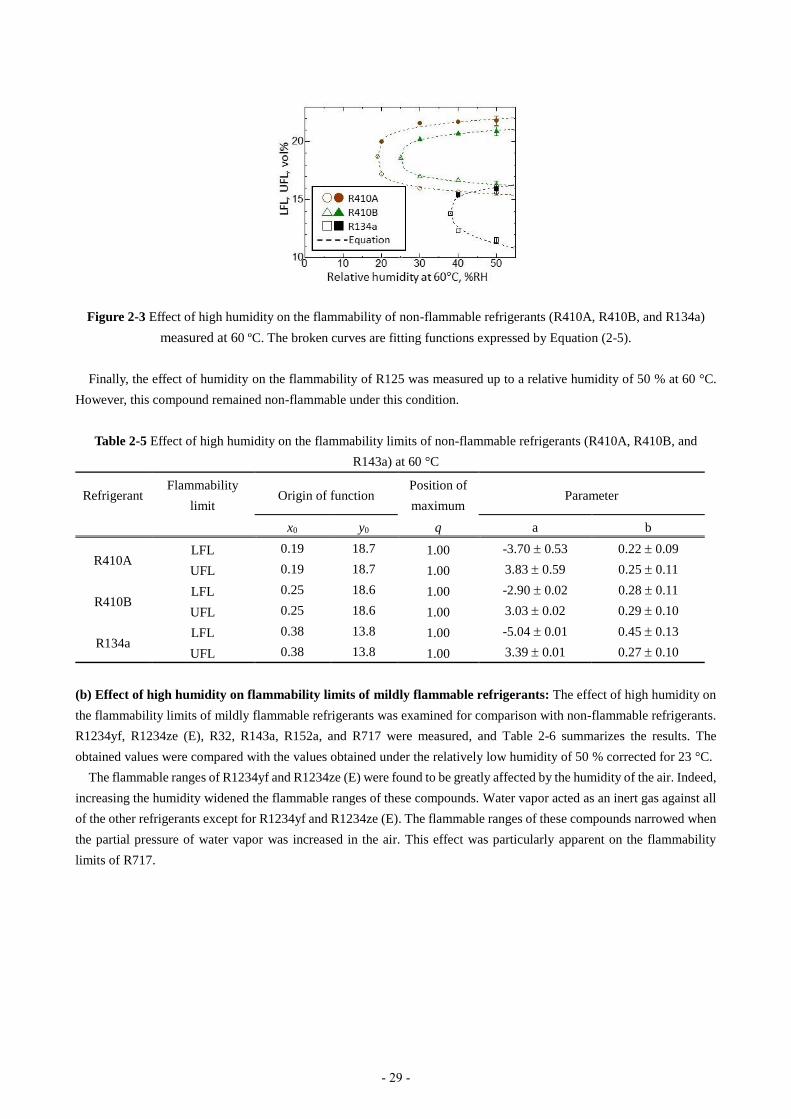
Figure 2-3 Effect of high humidity on the flammability of non-flammable refrigerants (R410A, R410B, and R134a)
measured at 60 ºC. The broken curves are fitting functions expressed by Equation (2-5).
Finally, the effect of humidity on the flammability of R125 was measured up to a relative humidity of 50 % at 60 °C.
However, this compound remained non-flammable under this condition.
Table 2-5 Effect of high humidity on the flammability limits of non-flammable refrigerants (R410A, R410B, and
R143a) at 60 °C
Refrigerant Flammability
limit Origin of function
Position of
maximum Parameter
x0 y0 q a b
R410A LFL 0.19 18.7 1.00 -3.70 0.53 0.22 0.09
UFL 0.19 18.7 1.00 3.83 0.59 0.25 0.11
R410B LFL 0.25 18.6 1.00 -2.90 0.02 0.28 0.11
UFL 0.25 18.6 1.00 3.03 0.02 0.29 0.10
R134a LFL 0.38 13.8 1.00 -5.04 0.01 0.45 0.13
UFL 0.38 13.8 1.00 3.39 0.01 0.27 0.10
(b) Effect of high humidity on flammability limits of mildly flammable refrigerants: The effect of high humidity on
the flammability limits of mildly flammable refrigerants was examined for comparison with non-flammable refrigerants.
R1234yf, R1234ze (E), R32, R143a, R152a, and R717 were measured, and Table 2-6 summarizes the results. The
obtained values were compared with the values obtained under the relatively low humidity of 50 % corrected for 23 °C.
The flammable ranges of R1234yf and R1234ze (E) were found to be greatly affected by the humidity of the air. Indeed,
increasing the humidity widened the flammable ranges of these compounds. Water vapor acted as an inert gas against all
of the other refrigerants except for R1234yf and R1234ze (E). The flammable ranges of these compounds narrowed when
the partial pressure of water vapor was increased in the air. This effect was particularly apparent on the flammability
limits of R717.
- 29 -

Table 2-6 Effect of high humidity on flammability limits of some flammable compounds.
Refrigerant 35 ºC/50 %RH for 23 ºC 60 ºC/50 %RH
LFL, vol% UFL, vol% LFL, vol% UFL, vol%
R1234ze (E) 5.95 0.15 12.7 0.4 5.05 0.1 15.5 0.7
R1234yf 5.4 0.15 13.5 0.5 4.8 0.1 15.0 0.6
R32 13.5 0.2 26.9 0.5 13.5 0.2 23.6 0.6
R717 15.8 0.4 29.2 0.4 18.0 0.7 24.5 0.5
R143a 7.3 0.15 17.7 0.5 7.4 0.1 15.0 1.0
R152a (4.3 0.1)a (17.3 0.5)a 4.36 0.05 14.8 0.5
a) Values in the parentheses were obtained under the dry condition.
2.2.3 Comparison between ASHRAE and HPGSA-A methods in cases of FIP measurements for nitrogen
and carbon dioxide dilution
One of the fundamental indices used to access the flammability of compounds is the flammability limit, and there are
various methods available to measure it. The US has established its own method, called the ASHRAE method 2-3). It is
also employed by the American Society for Testing and Materials (ASTM) as E-6812-7). Japan has its own method for the
measurement (HPGSA-A method), which is a part of the High Pressure Gas Safety Act. The problem with these methods
is that there are large differences between them.
The ASHRAE method employs a 12-liter spherical glass vessel, which is settled inside a temperature controlled air
bath. The flange of the vessel is held by loose springs. Ignition of the gas sample is made by a spark between the electrodes,
which is initiated by a 15 kV, 30 mA neon transformer. The inner pressure is relieved by an upward shift of the flange.
Before ignition, the sample gas and air is introduced into the vessel in this order by the partial pressure method. The
mixture is determined to be flammable if the flame moves upward and outward from the point of ignition to reach an arc
of the vessel wall subtending an angle of 90°, as measured from the point of ignition.
The HPGSA-A method uses a 2-liter pressure-tight spherical metal vessel. The sample gases are introduced into the
vessel by the partial pressure method, which is the same as ASHRAE method. Ignition is made by fusing a 0.3 mm thick,
20 mm long platinum wire. Go/no-go is determined whether the temperature is raised or not, though the method does not
specify the actual temperature rise necessary to determine the limit.
Thus, the two methods are different in many respects: the type of vessel, the ignition method, the determination method,
and so forth. Indeed, there is no guarantee that the results obtained by both the methods will be the same. Then, we have
tried to make clear the differences and tried to make consistent the results obtained by the two methods.
We have made a comparison between the two methods by measuring the flammability of R32, R143a, and R152a,
which are well known in the field of refrigerants. All measurements were taken in dry air.
Among the refrigerant compounds, many weakly flammable gases are involved. If the flammability test of the weakly
flammable gases is conducted by using the ASHRAE method, it is quite normal for the extent of the flame propagation
to create a plateau around 90°, as measured from the point of ignition. In those cases, the determination of the flammability
limits suffers from a large uncertainty. This is the reason why the experiments were performed to determine Fuel
Inertization Point (FIP) rather than to determine the flammability limits. As regards the triangular diagram for the inert
gas dilution of a fuel gas, if the strength of flame propagation is taken as the third axis to make the diagram three
dimensional (3D), the FIP is located along the ridge toward the 100 % inert gas point of the diagram. In this study, the
binary systems of R32-N2, R32-CO2, R143a-N2, and R152a-CO2 were examined.
Initially, ASHRAE measurements were taken for the inert dilution systems of R32-N2, R32-CO2, R143a-N2, and
R152a-CO2 to draw their triangular diagrams, and to determine the respective FIPs. The ratios of the inert components
- 30 -
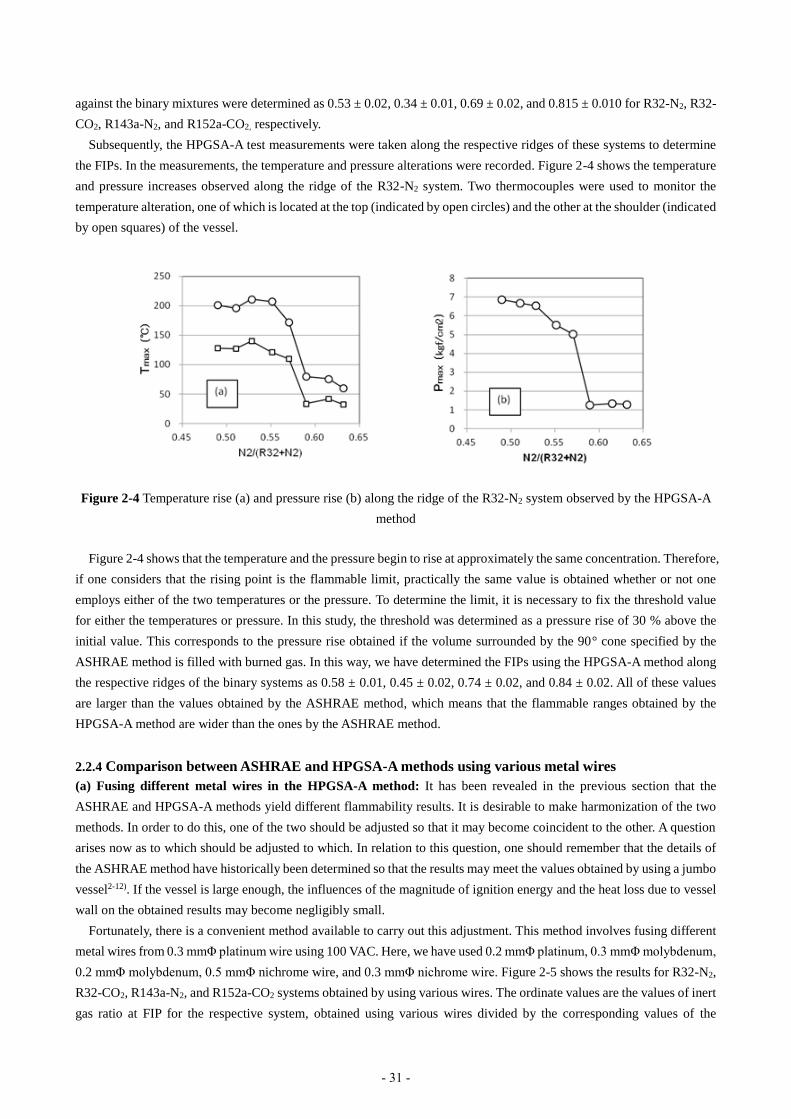
against the binary mixtures were determined as 0.53 ± 0.02, 0.34 ± 0.01, 0.69 ± 0.02, and 0.815 ± 0.010 for R32-N2, R32-
CO2, R143a-N2, and R152a-CO2, respectively.
Subsequently, the HPGSA-A test measurements were taken along the respective ridges of these systems to determine
the FIPs. In the measurements, the temperature and pressure alterations were recorded. Figure 2-4 shows the temperature
and pressure increases observed along the ridge of the R32-N2 system. Two thermocouples were used to monitor the
temperature alteration, one of which is located at the top (indicated by open circles) and the other at the shoulder (indicated
by open squares) of the vessel.
Figure 2-4 Temperature rise (a) and pressure rise (b) along the ridge of the R32-N2 system observed by the HPGSA-A
method
Figure 2-4 shows that the temperature and the pressure begin to rise at approximately the same concentration. Therefore,
if one considers that the rising point is the flammable limit, practically the same value is obtained whether or not one
employs either of the two temperatures or the pressure. To determine the limit, it is necessary to fix the threshold value
for either the temperatures or pressure. In this study, the threshold was determined as a pressure rise of 30 % above the
initial value. This corresponds to the pressure rise obtained if the volume surrounded by the 90° cone specified by the
ASHRAE method is filled with burned gas. In this way, we have determined the FIPs using the HPGSA-A method along
the respective ridges of the binary systems as 0.58 ± 0.01, 0.45 ± 0.02, 0.74 ± 0.02, and 0.84 ± 0.02. All of these values
are larger than the values obtained by the ASHRAE method, which means that the flammable ranges obtained by the
HPGSA-A method are wider than the ones by the ASHRAE method.
2.2.4 Comparison between ASHRAE and HPGSA-A methods using various metal wires
(a) Fusing different metal wires in the HPGSA-A method: It has been revealed in the previous section that the
ASHRAE and HPGSA-A methods yield different flammability results. It is desirable to make harmonization of the two
methods. In order to do this, one of the two should be adjusted so that it may become coincident to the other. A question
arises now as to which should be adjusted to which. In relation to this question, one should remember that the details of
the ASHRAE method have historically been determined so that the results may meet the values obtained by using a jumbo
vessel2-12). If the vessel is large enough, the influences of the magnitude of ignition energy and the heat loss due to vessel
wall on the obtained results may become negligibly small.
Fortunately, there is a convenient method available to carry out this adjustment. This method involves fusing different
metal wires from 0.3 mmΦ platinum wire using 100 VAC. Here, we have used 0.2 mmΦ platinum, 0.3 mmΦ molybdenum,
0.2 mmΦ molybdenum, 0.5 mmΦ nichrome wire, and 0.3 mmΦ nichrome wire. Figure 2-5 shows the results for R32-N2,
R32-CO2, R143a-N2, and R152a-CO2 systems obtained by using various wires. The ordinate values are the values of inert
gas ratio at FIP for the respective system, obtained using various wires divided by the corresponding values of the
- 31 -

ASHRAE method. Among the results, those of the 0.3 mmΦ platinum and 0.3 mmΦ molybdenum wires gave the widest
flammable range, and that of the 0.3 mmΦ nichrome was the narrowest. Comparison of the averages of the four binary
systems presents that the one closest to 1.0 is due to 0.2 mmΦ molybdenum. Similarly, the deviation from the average is
also the smallest for this case.
Figure 2-5 Comparison of the values obtained by using various wires in the HPGSA-A method with those of ASHRAE
method (1) FIPs for the flammable gas-inert gas systems of R32-N2, R32-CO2, R143a-N2, and R152a-CO2 from left to
right.
Similar experiments have also been carried out for the individual compounds themselves (R32, R143a, and R152a).
Figure 2-6 shows the results. The left side shows the lower flammability limits, and the right side shows the upper
flammability limits. The lower limit results show that the 0.3 mmΦ molybdenum wire yields the lowest LFL values, and
the 0.2 mmΦ molybdenum wire yields the LFL values closest to the ASHRAE values. Almost all cases give higher values
of UFL than the ASHRAE method. Among them, the 0.2 mmΦ molybdenum appears to yield the values closest to the
ASHRAE values.
Figure 2-6 Comparison of the flammability limit values obtained by the ASHRAE method with those obtained by
using various wires in HPGSA-A method. (2) Flammability limits for R32, R143a, and R152a from left to right.
Numbers for various metal wires are the same as in Figure 2-5.
Conclusively,
(1) The setting position of the thermocouple does not affect the results.
(2) The rising up concentrations are almost the same for the temperature and pressure. We have adopted a 30 %
pressure rise above the initial value as the threshold to determine the flammability limits.
- 32 -

(3) The HPGSA-A method provide a wider flammable range than the ASHRAE method.
(4) Adoption of different kinds of metal wire can adjust the resulting values of flammability limits so that they
may coincide to the ASHRAE values. For that purpose, 0.2 mmΦ molybdenum can be employed.
(b) Flammability limits of other compounds measured by ASHRAE, HPGSA-A, and Mo methods: As shown above,
it has been revealed that the HPGSA-A method gives wider flammable ranges than the ASHRAE method. On the other
hand, it has been found that the HPGSA method using 0.2 mmΦ molybdenum wire (Mo method) gives values close to
the values obtained by the ASHRAE method at least for R32, R143a, and R152a. Then, we need to clarify the effect of
using the Mo method for other flammable compounds than R32, R143a, and R152a.
Table 2-7 shows the flammability limits as measured by the ASHRAE method, HPGSA-A method, and Mo method,
for R717, R1234yf, R1234ze (E), R290, and R600a, in addition to R32, R143a, and R152a. All were measured at 25 ºC
and 0 %RH. As for R1234yf, the maximum flame propagation angle stays at approximately 90° for quite a wide
concentration range (7–10 vol%) and we could not accurately define the flammable range. On the other hand, the
flammable range of this compound as measured by using the Mo method was too narrow to determine the uncertainty
limit.
In the preceding section, we have stated that the flammable ranges of R32, R143a, and R152a measured by the
ASHRAE method are all narrower than those measured by the HPGSA-A method. Table 2-7 shows that this is also true
for R717, R1234yf, R1234ze (E), R290, and R600a. As also stated, the LFL and UFL as measured by the Mo method are
close to the values obtained by the ASHRAE method. However, the flammable ranges are consistently wider than those
by the ASHRAE method. The flammable ranges measured by a particular method seem to be consistently wider or
narrower than the ones measured by another method. This fact suggests that if in anywhere in the world we have an ideal
method for measuring the flammability limits, we could find a good substitute method for that in some way.
One important point to note is that the flammable range of R717 as measured with the HPGSA-A method is abnormally
wide. The lower limit is 10.5 % and the upper limit is as high as 50 %. This fact cannot be explained in terms of the
energy issue. This is mostly likely due to some particular effect, such as the catalytic effect of platinum on the combustion
reaction of R717.
Table 2-7 Flammability limits of various refrigerant-related compounds measured by the ASHRAE method, HPGSA-A
method, and Mo method at 25 ºC (vol%)
Refrigerant ASHRAE method HPGSA-A method Mo method
R32 14.15 ± 0.20 – 26.7 ± 0.5 13.3 ± 0.2 – 29.3 ± 0.5 13.75 ± 0.15 – 29.4 ± 0.5
R143a 7.7 ± 0.1 – 16.7 ± 0.8 7.15 ± 0.15 – 18.8 ± 0.5 7.68 ± 0.10 – 16.8 ± 0.4
R152a 4.5 ± 0.1 – 16.5 ± 0.7 4.25 ± 0.20 – 18.3 ± 0.3 4.42 ± 0.10 – 18.05 ± 0.40
R717 16.1 ± 0.3 – 29.0 ± 0.3 10.5 ± 1.5 – 50 ± 5 14.9 ± 0.7 – 30.8 ± 0.3
R1234yf 7 – 10 a 6.21 ± 0.15 – 14.0 ± 0.5 7.82 – 8.04 b
R1234ze (E) n.f. 6.39 ± 0.20 – 13.3 ± 0.5 8.3 ± 0.7 – 11.2 ± 0.8
R600a 1.725 ± 0.02 – 6.9 ± 0.3 1.57 ± 0.03 – 8.6 ± 0.2 1.64 ± 0.07 – 8.25 ± 0.3
R290 2.08 ± 0.04 – 9.5 ± 0.5 1.92 ± 0.04 – 10.46 ± 0.2 1.91 ± 0.04 – 10.41 ± 0.10
a) Flame propagation angle sticks to 90° line for the concentration range of 7–10 vol%, and it is not possible to
identify the flammable range exactly. b) The uncertainty cannot be assigned because the flammable range is very
narrow.
(c) The lower flammability limit of R32 as measured by using a jumbo spherical vessel: The results obtained in the
study thus far have indicated a need for an ideal method to measure the flammability limit. This ideal method is
needed in order to assess the reliability of the ASHRAE, HPGSA-A, and Mo methods. In short, the ideal method
- 33 -

should be capapable of taking a measurement that is not influenced by factors such as the ignition method and
the vessel wall. If we have a large enough vessel, it is possible to satisfy this condition. We do not know exactly
how large the vessel needs to be for this purpose, but we had a chance to conduct an experiment using a large
vessel (100 cm in diameter and 520 liter in volume) to measure the lower flammability limit of R32. Ignition is
made by an AC discharge using a 15 kV, 30 mA neon transformer. The spark duration was 0.4 s. The spark
electrode is located 10 cm beneath the vessel center. Flame propagation was observed by a very sensitive video
camera. Temperature and pressure rises were monitored by a thermocouple and a strain gauge. The lower
flammability limit of R32 was tentatively obtained as 13.7 vol%. This value falls between the value obtained by
the HPGSA-A method and the Mo method. The observed LFL value of R32 obtained by various methods located
from largest to smallest is as follows: ASHRAE >Mo >the jumbo vessel >HPGSA-A. Though the measurement
by this large vessel has not been taken for the other refrigerants (R143a, R152a, R717, R1234yf, R1234ze (E),
R290, and R600a), the values obtained by the other three methods falls in the order of ASHRAE >Mo >HPGSA-
A. If these results are taken into consideration, it may well be possible that we can find a good alternative method
of measuring the flammability limits, which can be used as a standard.
2.3 Burning Velocity
2.3.1 Influence of temperature, pressure, and concentration on burning velocity
The burning velocities of typical refrigerants have been reported in previous studies2-13,2-14,2-8). With the exception of
R1234yf, we used the spherical-vessel (SV) method to measure the pressure–time development and obtained the burning
velocity by utilizing a spherical flame propagation model. The model was originally established for small hydrocarbons;
we applied the model to hydrofluorocarbons2-13).
In the SV method, burning velocity (Su) is presented as a function of temperature (T) in K and pressure (P) in atm in
the following empirical equation,
𝑆𝑢 = 𝑆𝑢0(𝑇 𝑇𝑆⁄ )𝛼(𝑃 𝑃𝑆⁄ )𝛽 (2-6)
where Ts = 298 K, Ps = 101.3 kPa, Su0 is the Su at Ts and Ps in cms−1, and and indicate the coefficients of temperature
and pressure influence on Su, respectively.
Because Su0, , and in Equation (2-6) depend on the refrigerant/air equivalence ratio, , we performed a nonlinear
least-squares fitting of all of the data measured at various concentrations and initial pressures using the following
equations:
𝑆𝑢0 = 𝑆𝑢0,𝑚𝑎𝑥 + 𝑠1(𝜑 − 𝜑𝑚𝑎𝑥)2 + 𝑠2(𝜑 − 𝜑𝑚𝑎𝑥)
3 (2-7)
𝛼 = 𝑎1 + 𝑎2(𝜑 − 1) (2-8)
𝛽 = 𝑏1 + 𝑏2(𝜑 − 1) (2-9)
where Su0,max, s1, s2, max, a1, a2, b1, and b2 are the fitting parameters. Su0,max is the maximum Su at the standard condition
of Ts and Ps, and max; a1 and b1 are the values of and , respectively, at the stoichiometric concentration ( = 1). The
cubic form of Equation (2-7) represents the asymmetric nature of the influence on the burning velocity. The relationship
between (-) and concentration C (vol%) is, by definition, written by
φ =𝐶 (100−𝐶)⁄
𝐶𝑠𝑡 (100−𝐶𝑠𝑡)⁄ (2-10)
where Cst is the stoichiometric concentration in vol%.
The Cst of a fluorine-containing compound and its blend is determined by considering the following overall combustion
reactions2-15). The combustion reaction of the refrigerant given by a function of the chemical formula, CqHrFs, is classified
into the following two cases, dependent on the number of H atoms and F atoms present in CqHrFs.
1) If the number of H atoms, r, is larger than or equal to the number of F atoms, s, the reaction proceeds as
- 34 -

CqHrFs + (q +r−s
4) O2 = sHF + qCO2 +
r−s
2H2O (r s) (2-11)
In this case, the combustion products are HF, CO2, and H2O, and Cst is given by the following equation:
𝐶𝑠𝑡 =100
1+100
21(𝑞+
𝑟−𝑠
4) (2-12)
2) In case r is smaller than s in the refrigerant CqHrFs, H atoms first react with F atoms to produce HF, then remaining F
atoms react with C atoms to produce COF2, and then the remaining C atoms produce CO2. In this case, the combustion
products are HF, COF2, and CO2, and the reaction formula is expressed by the following equation:
CqHrFs + (q −s−r
4)O2 = rHF +
s−r
2COF2 + (q −
s−r
2) CO2 (r < s) (2-13)
The value of Cst of this case is also given by Equation (2-12). Table 2-8 lists these parameters and Table 2-2 lists the
Su0,max at 60 °C, 0 %RH for typical refrigerants.
We used the SV method to obtain the T and P influence on Su by measuring pressure–time data and employing a
spherical flame propagation model 2-13). To obtain the pressure–time data applicable to the SV method, it is essential to
obtain an isotropically (spherically) propagating flame in the closed vessel, which is free from distortion of the flame
surface by the buoyancy force or cooling effect to the vessel wall. However, for R1234yf, the flame was significantly
distorted by the buoyancy, which made application of the SV method impossible.
Therefore, we have performed experiments in a microgravity environment using a 10-m drop tower at the National
Institute of Advanced Industrial Science and Technology (AIST) Hokkaido Center. In this environment, buoyancy does
not work and Su can be obtained from the spherically propagating flame without conductive heat loss to the wall. However,
the experimental data in microgravity have not been fully accumulated to establish the T and P influence on Su for R1234yf.
Instead, we obtained the T influence on Su by measuring the Su at various initial temperatures by employng the schlieren
photography method, as shown in Figure 2-7. We assumed that the pressure influnce on Su is negligible, i.e. β = 0, in
Equation (2-6). As for R1234ze (E), self-sustained flame propagation was not observed at 80 °C or lower and 0 %RH.
As summarized in Table 2-8, the burning velocities of these refrigerants increase approximately quadratically with
increasing T and decrease with increasing P, but very slightly. As for the influence of concentration, Su becomes maximum
at a slightly richer-than-the stoichiomertric concentration for all the refrigerants except R1234yf. For R1234yf, the Su
reaches its maximum at a fairly rich concentration, although its change is faint.
Table 2-8 Parameters of temperature, pressure, and concentration influence on burning velocity for typical
refrigerants
Refrigerant Temperature range,
°C
Su0,max,
cms−1
s1 s2 max a1 a2 b1 b2
R1234yf 2580 1.5 1.33 1.864 (0) (0) (0)
R32 a 25100 6.7 −22.33 6.99 1.079 1.972 0.470 −0.055 −0.291
R717 b 25100 7.2 −74.33 −105.7 1.098 1.505 3.824 −0.095 −0.910
R143a a 25100 7.1 −39.49 52.53 1.018 2.319 −2.000 −0.177 −0.074
R254fb c 25100 9.5 −44.40 50.91 1.033 1.627 2.955 −0.116 −0.669
R152a a 25100 23.5 −92.86 −48.43 1.086 1.917 −0.450 −0.229 0.049
R600a c 25100 34.2 −148.6 −94.94 1.079 1.810 −1.248 −0.272 0.254
R290 a 25100 38.7 −138.4 5.82 1.056 1.892 −1.458 −0.274 0.544
a) Data from ref. 2-13). b) Data from ref. 2-14). c) Data from ref. 2-8).
- 35 -

Figure 2-7 Temperature influence on burning velocity for R1234yf (concentration, 10 vol%; humidity, 0 %RH)
2.3.2 Effect of humidity on burning velocity
As mentioned in the previous section, the overall combustion reaction of fluorinated compounds and their mixtures are
divided by the relationship between the number of H atoms and F atoms in the refrigerants. In the combustion reaction
expressed by Equation (2-13) (for example, the combustion of R1234yf and R1234ze (E) in dry air), where there is not
enough H atoms to react with all the F atoms to produce HF, the remaining F atom produces COF2 and the overall
combustion reaction is terminated. By adding the H-atom supplying compound (for example, hydrocarbons, R152a, R717,
and water vapor (H2O)), the reaction involved in COF2 proceeds in the following exothermic reaction (this is an example
of H2O addition):
COF2 + H2O = 2HF + CO2 + 59.4 kJmol−1 (2-14)
Consequently, the heat of combution in the reaction system increases by 59.4 kJmol−1.
In the reaction that is expressed by Equation (2-11) (for example, the combustion of R32, R143a, and R152a), where
all the F atoms in the reaction system react with H atoms to produce HF, although the water vapor is added, it doesn't
contribute to the chemical reaction and decreases the flame temperature slightly as the inert gas. Thus, the flammability
of the system for some compounds will change much with the addition of water vapor, so we investigated the effect of
humidity.
(a) Effect of humidity on the burning velocity for R32: Figure 2-8 shows the effect of humidity on the burning velocity
of R32. The absolute humidity, AH, is defined as gram-H2O per gram-dry air. All the data in this figure were measured at
60 °C and at the stoichiometric concentration. As the AH increased, the stoichiometric burning velocity (Su,st) of R32
decreased gradually, and when the AH became as high as 0.068 (equivalent to 60 °C, 50 %RH), the Su,st decreased by
25 % that in the dry condition. This effect is probably due to the inert effect by water vapor. When we consider the
relationship between Su and AH, because the data available is quite limited, we assumed a linear relationship and obtained
the following equation:
Su, st,60°C,AH = Su, st,60°C,0 32.86AH (2-15)
where AH is the absolute humidity (g-water/g-dry air) and Su, st,60°C,AH and Su, st,60°C,0 are the stoichiometric burning
velocities at 60 °C at AH and in the dry condition, respectively. As shown in Figure 2-8, the difference between the linear
approximation by Equation (2-15) and the experimental data is very small, and therefore it is acceptable to apply the
linear function to express the burning velocity in moist air on a practical level.
- 36 -

Figure 2-8 Humidity influence on the burning velocity of R32.
All the data was collected at stoichiometric concentration and 60 °C. The broken line represents Equation (2-15).
(b) Effect of humidity on burning velocity for R1234yf and R1234ze (E): Figure 2-9 shows the effect of humidity on
the maximum burning velocity (Su,max) for R1234yf and R1234ze (E). All of the data were measured at 60 °C. As shown
in Figure 2-9(a), the Su,max of R1234yf increased significantly with increasing AH. When the AH became as high as 0.068,
which is equivalent to 60 °C, 50 %RH, the Su,max reached five times that in the dry condition, although the increment in
Su,max became gradual at around this humidity level. Figure 2-9(b) shows the Su,max plotted by the total F-atom/H-atom
ratio. In the condition where F atoms > H atoms, the Su,max increased with increasing F/H ratio until it reached
approximately 1.0. Beyond that, the change in Su,max became small. These tendencies correspond well to Equations (2-
11), (2-14), and (2-13). When we consider the relationship between Su and AH, because the data available is quite limited,
we assumed a linear relationship if the H/F ratio 1.0, and obtained the following equation:
Su, max,60°C,AH = Su, max,60°C,0 +165.5AH (H/F ratio 1.0) (2-16)
where Su, max,60°C,AH and Su, max,60°C,0 are the maximum burning velocity at 60 °C at AH and in the dry condition, respectively.
As shown in Figure 2-9(a), the difference between the linear approximation by Equation (2-16) and the experimental data
is small, and therefore it is acceptable to apply the linear function to express the burning velocity in moist air on a practical
level.
Figure 2-9 Humidity influence on the maximum bunring velocity for R1234yf and R1234ze (E).
(a) Su,max vs Absolute humidity; (b) Su,max vs H/F ratio of the refrigerant/moist air mixture. The blue broken line
represents Equation (2-16). All the data are measured at 60 °C.
- 37 -

2.4 Minimum ignition energy and quenching distance
2.4.1 Introduction: Ignition, extinction, and growth of flame
Before reporting parameters on ignition and extinction of refrigerant flames, it is necessary to explain the growth process
of the incipient flame. When an electric spark is provided to a fuel/air gas mixture whose concentration is within the
flammable range, the flame kernel is generated by the spark and grows as illustrated in Figure 2-102-8). Figure 2-10 shows
the histories of incipient flames with different spark energies. The sample gas is 21 vol% of R32/air mixture. The radius
of flame sphere, rf, was obtained by measuring the horizontal diameter of the schlieren flame image. The numbers in the
figure indicate the order of the spark energy (1 is the lowest and 6 is the highest).
Figure 2-10(a) shows the measured flame radius vs. time. Just after the spark discharge, the rf of the incipient flame
changed in a rather complex manner, depending on the discharge energy. As for test 1 and 2 (low discharge energies), the
flame extinguished within 0.01 s after the spark discharge. For tests 3–6, the rf initially showed different changes with
time, but eventually show almost the same increment with time. By obtaining the derivatives of these graphs with respect
to time, we obtained the relationship between the instantaneous flame propagation rate, Sb (= drf /dt), vs. rf, as shown in
Figure 2-10(b). The Sb of the incipient flame sphere decreased rapidly with increasing rf. This is due to heat loss to the
surrounding (cold) unburned gas from the small flame sphere that is heated by the spark discharge and forced to expand
spatially. As the flame sphere grows and the flame surface area increases, the heat generation of the flame by the
combustion increases. When the heat generation by the combustion is balanced with heat loss to the surrounding, the Sb
becomes minimum. When the flame sphere grows further, the heat generation exceeds the heat loss and the flame sphere
keeps growing with an increasing Sb. This flame at the minimum Sb is the minimum flame, and the larger flame is a self-
sustained propagating flame. The boundary condition of the transition from spark-supported propagation to self-sustained
propagation is that the heat generation rate exceeds the heat loss rate. When the rf exceeds 10 mm, the Sb converges at the
constant value, independent of the magnitude of discharge energy. This means that the relationship between heat
generation and heat loss becomes independent of the flame size. In other words, the curved flame of the flame sphere
becomes a planar flame.
It is important to note that in the case of R32, for example, a "long" period of being a weak flame exists until the flame
diameter exceeds 20 mm. During this “long” period, if the flame experiences cooling, the flame will extinguish more
readily than the laminar flame. Such of large size of the weak flame state (to be compared with the gap of practical spark
electrodes, e.g. holes of AC power supply socket and gap of electrodes in magnetic contactors) is practically important
and this is specific characteristic to the 2L refrigerants. For highly flammable refrigerants such as R290, the size of the
weak flame state is one order of magnitude smaller than that of R32. Therefore, it is practically less meaningful to consider
sizes during the weak flame state.
Figure 2-10 Growth of the flame sphere of R32/air with various discharge energy. At 25 °C, 0 %RH, and 21 vol%.
(a) time evolution of the flame radius; (b) instantaneous flame propagation rate during flame growth.
- 38 -

When considering the probability of the occurrence of a fire hazard due to flammable gases, the flammability limits,
minimum ignition energy (MIE), and quenching distance are some of the most important indices. Experimentally, the
minimum ignition energy (Emin) is the lowest spark discharge energy that can ignite a flammable gas mixture at the most
ignitable concentration. The parallel plate quenching distance (dq) is the minimum distance between two surfaces above
which flame propagation becomes self-sustaining. A standard test method for determining Emin and dq is specified in
ASTM E582-07 (2007) 2-16). These parameters, if obtained appropriately, are useful for designing the electrical equipment
that may be deployed in areas with a potentially flammable gas atmosphere. However, no appropriate test method that is
suitable for evaluating the MIE of 2L compounds currently exists.
Figure 2-11 summarizes the published Emin data of compounds relevant to this study. For R290, Emin has been reported
to be 0.247–0.48 mJ. For mildly flammable compounds, the reported Emin values vary widely from < 10 mJ to > 10 J.
Even for R717, which has been studied extensively, NFPA 77 (2000) 2-17) uses an Emin value of 680 mJ, while the High
Pressure Gas Safety Institute of Japan (KHK) 2-18) uses 14 mJ. Such a wide variation makes assessing the fire risk based
on Emin very difficult. The difficulty with determining Emin reliably is that it is very dependent on the electrode size, gap
between electrodes, and ignition spark density and duration.
To improve the current situation, an ignition energy evaluation method is being developed to provide a reliable index
for the fire risk.
Compared to Emin, dq seems to be much easier to measure and provides reliable data on mildly flammable compounds.
In addition, Emin is related to dq and Su through an equation of heat loss theory. Therefore, we first measured dq and then
estimated Emin by using the measured dq and Su 2-8). Table 2-8 lists Su and relevant parameters, and Table 2-9 lists dq and
relevant parameters.
Figure 2-11 Wide variation in published experimental Emin values (○) for typical refrigerants2-8)
2.4.2 Quenching distance measurement
(a) Quenching distance in the standard condition: Quenching distance measurements were carried out at 1 atm, 25 °C,
and 0 %RH by using an apparatus that is similar to but deliberately modified from ASTM E582 (2007) 2-16). We reported
the dq for eleven highly to only mildly flammable gases (which include alkanes, fluorinated alkanes and alkenes, and
ammonia). Figure 2-12 shows the apparatus for the parallel plate quenching distance measurement. The apparatus was
turned at an angle of 90° to the position of the ASTM E582 test apparatus. We tested both this geometry and the geometry
of ASTM E582. Because a slowly propagating flame is significantly affected by the buoyancy, we measured dq in both
the vertical position, dq,v (i.e., same position as the ASTM E582 apparatus), and horizontal position, dq,h, of the parallel
plates. The cathode electrode was fixed, while the anode electrode could be moved with a micrometer to provide an
adjustable gap width of less than 0.001 mm. The plane plate was made of machineable glass ceramic (Macor). The plates
could be removed from the electrodes; we tested plates with diameters (D) of 5, 25, 50, 75, and 100 mm to examine the
- 39 -
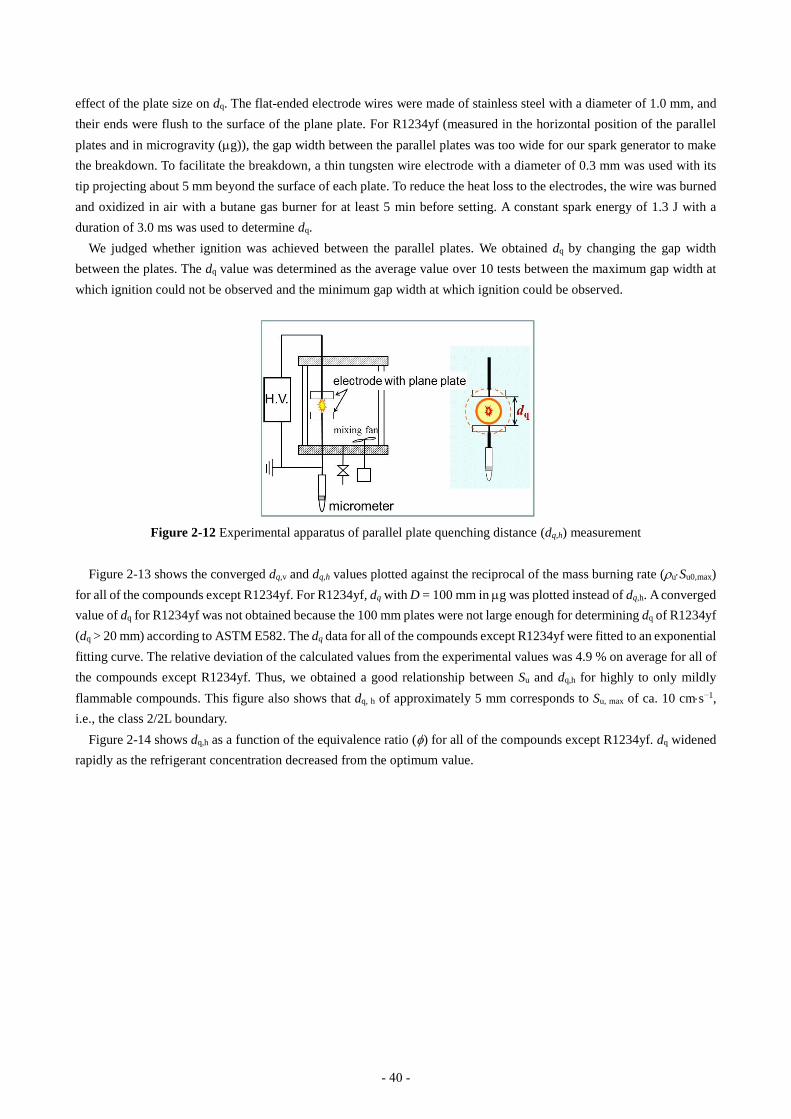
effect of the plate size on dq. The flat-ended electrode wires were made of stainless steel with a diameter of 1.0 mm, and
their ends were flush to the surface of the plane plate. For R1234yf (measured in the horizontal position of the parallel
plates and in microgravity (g)), the gap width between the parallel plates was too wide for our spark generator to make
the breakdown. To facilitate the breakdown, a thin tungsten wire electrode with a diameter of 0.3 mm was used with its
tip projecting about 5 mm beyond the surface of each plate. To reduce the heat loss to the electrodes, the wire was burned
and oxidized in air with a butane gas burner for at least 5 min before setting. A constant spark energy of 1.3 J with a
duration of 3.0 ms was used to determine dq.
We judged whether ignition was achieved between the parallel plates. We obtained dq by changing the gap width
between the plates. The dq value was determined as the average value over 10 tests between the maximum gap width at
which ignition could not be observed and the minimum gap width at which ignition could be observed.
Figure 2-12 Experimental apparatus of parallel plate quenching distance (dq,h) measurement
Figure 2-13 shows the converged dq,v and dq,h values plotted against the reciprocal of the mass burning rate (uSu0,max)
for all of the compounds except R1234yf. For R1234yf, dq with D = 100 mm in g was plotted instead of dq,h. A converged
value of dq for R1234yf was not obtained because the 100 mm plates were not large enough for determining dq of R1234yf
(dq > 20 mm) according to ASTM E582. The dq data for all of the compounds except R1234yf were fitted to an exponential
fitting curve. The relative deviation of the calculated values from the experimental values was 4.9 % on average for all of
the compounds except R1234yf. Thus, we obtained a good relationship between Su and dq,h for highly to only mildly
flammable compounds. This figure also shows that dq, h of approximately 5 mm corresponds to Su, max of ca. 10 cms−1,
i.e., the class 2/2L boundary.
Figure 2-14 shows dq,h as a function of the equivalence ratio () for all of the compounds except R1234yf. dq widened
rapidly as the refrigerant concentration decreased from the optimum value.
- 40 -

Figure 2-13 Quenching distance for eleven compounds as function of mass burning rate (uSu) (25 °C, 0 %RH)
Figure 2-14 Concentration (equivalence ratio) influence on quenching distances for ten compounds (25 °C, 0 %RH)
Table 2-9 Experimental quenching distances and estimated Emin for eleven compounds (25 °C, 0 %RH)
Compound Exp. dq Calc. Emin Calc. Emin
dq,h,
mm
dq,v,
mm
Conc.
vol%
by Eq. (2-19) and dq,h
mJ
by Eq. (2-19) and dq,v
mJ
R290 1.70 1.70 4.5 1.13 0.35 0.35
R600a 2.00 - 3.6 1.16 0.62 0.62
R152a 2.33 - 9.0 1.18 0.90 0.90
HFO1243zf 3.33 - 8.5 1.33 2.2 2.2
HFC143 3.58 3.48 11.5 1.24 2.9 2.6
R152a/134a (50/50 vol%) 4.08 3.88 11.5 1.24 3.8 3.0
HFC254fb 5.23 4.35 8.5 1.33 12 5.3
R143a 7.03 6.00 12.5 1.36 27 13
R32 7.55 6.45 21.0 1.27 29 14
R717 8.95 7.45 21.9 1.00 45 19
R1234yf 24.8a 16.6 10.0 1.33 780 76
a) Measured in microgravity.
- 41 -
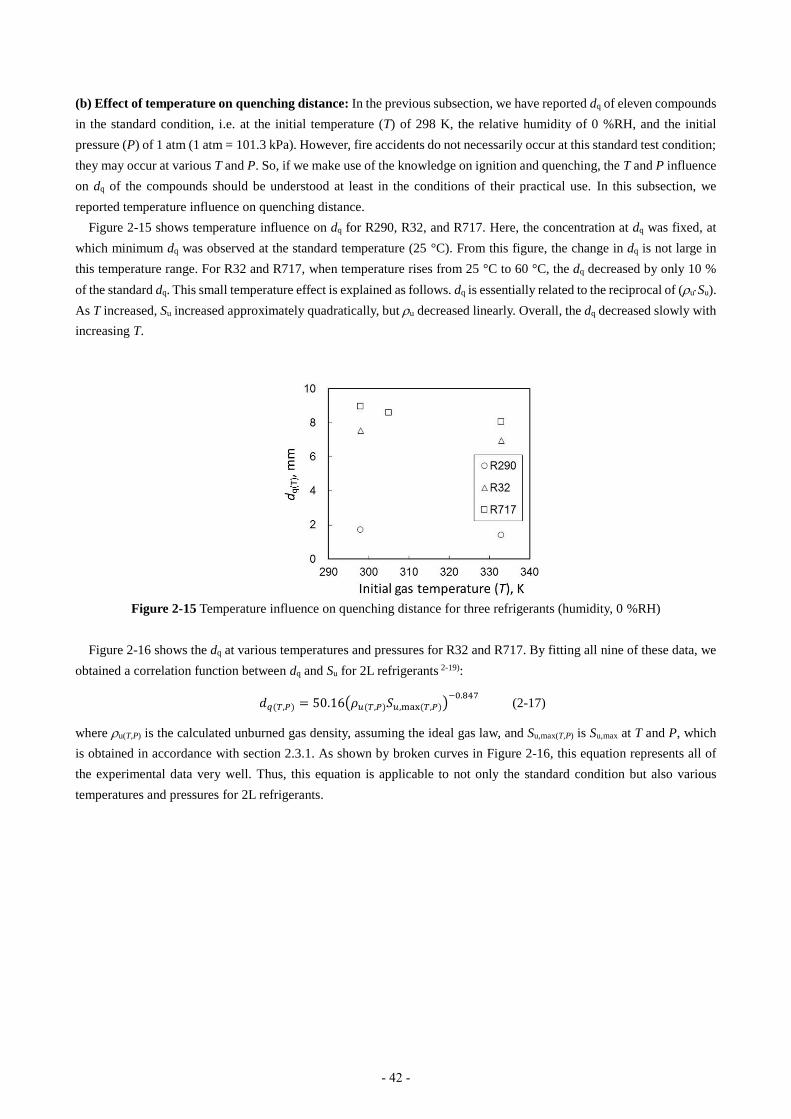
(b) Effect of temperature on quenching distance: In the previous subsection, we have reported dq of eleven compounds
in the standard condition, i.e. at the initial temperature (T) of 298 K, the relative humidity of 0 %RH, and the initial
pressure (P) of 1 atm (1 atm = 101.3 kPa). However, fire accidents do not necessarily occur at this standard test condition;
they may occur at various T and P. So, if we make use of the knowledge on ignition and quenching, the T and P influence
on dq of the compounds should be understood at least in the conditions of their practical use. In this subsection, we
reported temperature influence on quenching distance.
Figure 2-15 shows temperature influence on dq for R290, R32, and R717. Here, the concentration at dq was fixed, at
which minimum dq was observed at the standard temperature (25 °C). From this figure, the change in dq is not large in
this temperature range. For R32 and R717, when temperature rises from 25 °C to 60 °C, the dq decreased by only 10 %
of the standard dq. This small temperature effect is explained as follows. dq is essentially related to the reciprocal of (uSu).
As T increased, Su increased approximately quadratically, but u decreased linearly. Overall, the dq decreased slowly with
increasing T.
Figure 2-15 Temperature influence on quenching distance for three refrigerants (humidity, 0 %RH)
Figure 2-16 shows the dq at various temperatures and pressures for R32 and R717. By fitting all nine of these data, we
obtained a correlation function between dq and Su for 2L refrigerants 2-19):
𝑑𝑞(𝑇,𝑃) = 50.16(𝜌𝑢(𝑇,𝑃)𝑆𝑢,max(𝑇,𝑃))−0.847
(2-17)
where u(T,P) is the calculated unburned gas density, assuming the ideal gas law, and Su,max(T,P) is Su,max at T and P, which
is obtained in accordance with section 2.3.1. As shown by broken curves in Figure 2-16, this equation represents all of
the experimental data very well. Thus, this equation is applicable to not only the standard condition but also various
temperatures and pressures for 2L refrigerants.
- 42 -
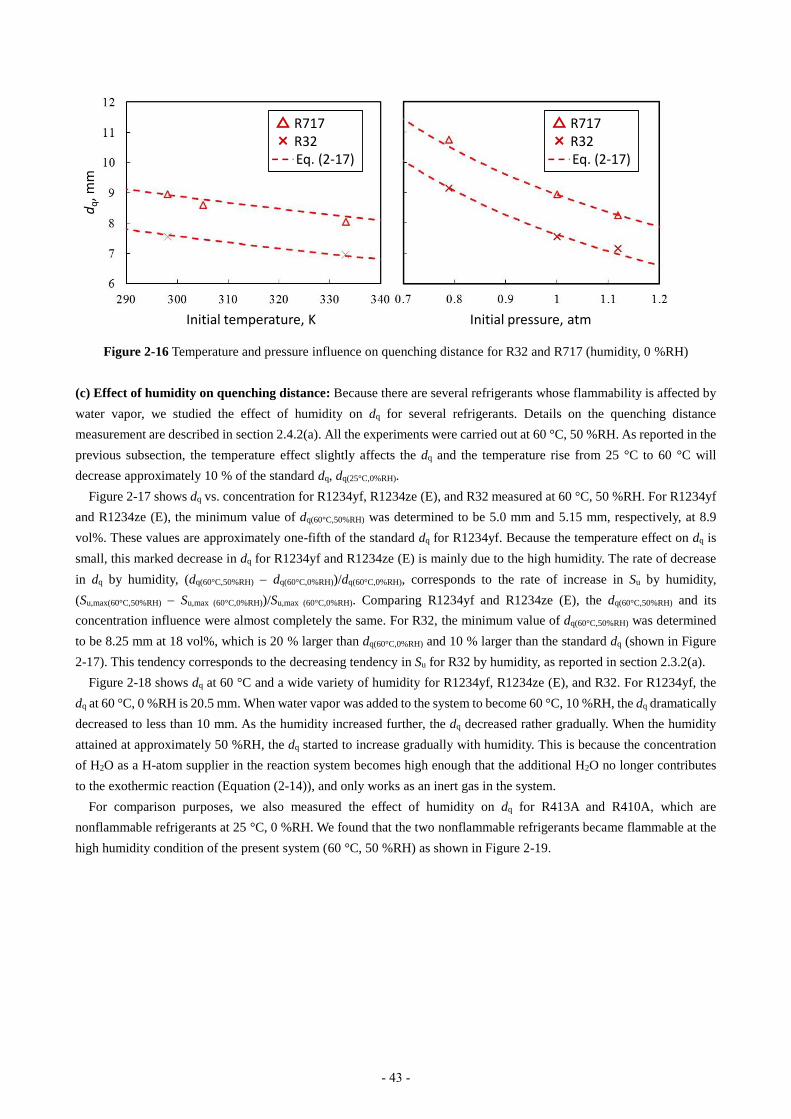
Figure 2-16 Temperature and pressure influence on quenching distance for R32 and R717 (humidity, 0 %RH)
(c) Effect of humidity on quenching distance: Because there are several refrigerants whose flammability is affected by
water vapor, we studied the effect of humidity on dq for several refrigerants. Details on the quenching distance
measurement are described in section 2.4.2(a). All the experiments were carried out at 60 °C, 50 %RH. As reported in the
previous subsection, the temperature effect slightly affects the dq and the temperature rise from 25 °C to 60 °C will
decrease approximately 10 % of the standard dq, dq(25°C,0%RH).
Figure 2-17 shows dq vs. concentration for R1234yf, R1234ze (E), and R32 measured at 60 °C, 50 %RH. For R1234yf
and R1234ze (E), the minimum value of dq(60°C,50%RH) was determined to be 5.0 mm and 5.15 mm, respectively, at 8.9
vol%. These values are approximately one-fifth of the standard dq for R1234yf. Because the temperature effect on dq is
small, this marked decrease in dq for R1234yf and R1234ze (E) is mainly due to the high humidity. The rate of decrease
in dq by humidity, (dq(60°C,50%RH) dq(60°C,0%RH))/dq(60°C,0%RH), corresponds to the rate of increase in Su by humidity,
(Su,max(60°C,50%RH) Su,max (60°C,0%RH))/Su,max (60°C,0%RH). Comparing R1234yf and R1234ze (E), the dq(60°C,50%RH) and its
concentration influence were almost completely the same. For R32, the minimum value of dq(60°C,50%RH) was determined
to be 8.25 mm at 18 vol%, which is 20 % larger than dq(60°C,0%RH) and 10 % larger than the standard dq (shown in Figure
2-17). This tendency corresponds to the decreasing tendency in Su for R32 by humidity, as reported in section 2.3.2(a).
Figure 2-18 shows dq at 60 °C and a wide variety of humidity for R1234yf, R1234ze (E), and R32. For R1234yf, the
dq at 60 °C, 0 %RH is 20.5 mm. When water vapor was added to the system to become 60 °C, 10 %RH, the dq dramatically
decreased to less than 10 mm. As the humidity increased further, the dq decreased rather gradually. When the humidity
attained at approximately 50 %RH, the dq started to increase gradually with humidity. This is because the concentration
of H2O as a H-atom supplier in the reaction system becomes high enough that the additional H2O no longer contributes
to the exothermic reaction (Equation (2-14)), and only works as an inert gas in the system.
For comparison purposes, we also measured the effect of humidity on dq for R413A and R410A, which are
nonflammable refrigerants at 25 °C, 0 %RH. We found that the two nonflammable refrigerants became flammable at the
high humidity condition of the present system (60 °C, 50 %RH) as shown in Figure 2-19.
△ R717× R32
Eq. (2-17)
△ R717× R32
Eq. (2-17)
dq,m
m
Initial pressure, atmInitial temperature, K
- 43 -

Figure 2-17 Quenching distance vs. refrigerant concentration for R1234yf, R1234ze (E), and R32 at high humidity
(60 °C, 50 %RH).
Figure 2-18 Quenching distance vs. humidity for R1234yf, R1234ze (E), and R32 at 60 °C
Left: dq vs. relative humidity at 60 °C; right: dq vs. absolute humidity.
Figure 2-19 Quenching distance vs. refrigerant concentration for R413A and R410A at high humidity (60 °C,
50 %RH).
2.4.3 Estimation of minimum ignition energy
The minimum ignition energy is defined as the energy that is sufficient to establish a flame sphere with the minimum
radius necessary for self-sustained propagation. According to the simple heat loss theory, Emin is given by
Emin = (1/6)dmin3bcp(Tb − Tu) (2-18)
where dmin is the diameter of the minimum flame sphere in a free space, and Tb and Tu are the burned and unburned gas
temperatures.
- 44 -
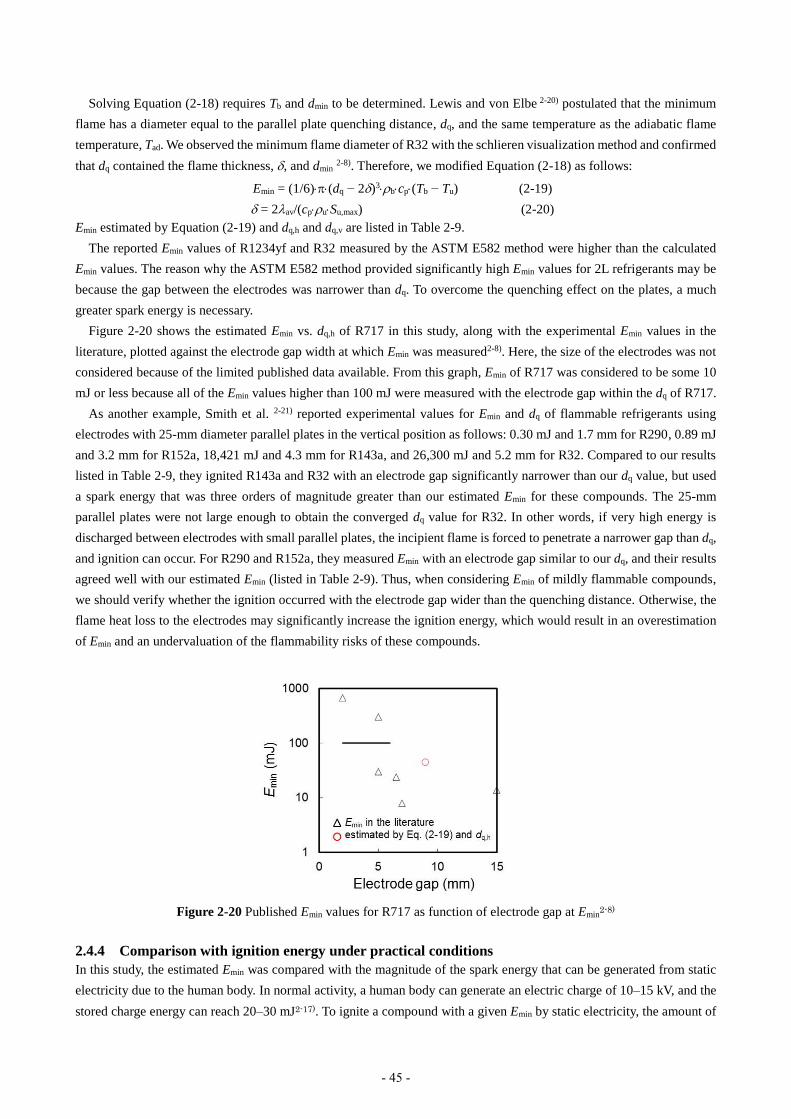
Solving Equation (2-18) requires Tb and dmin to be determined. Lewis and von Elbe 2-20) postulated that the minimum
flame has a diameter equal to the parallel plate quenching distance, dq, and the same temperature as the adiabatic flame
temperature, Tad. We observed the minimum flame diameter of R32 with the schlieren visualization method and confirmed
that dq contained the flame thickness, , and dmin 2-8). Therefore, we modified Equation (2-18) as follows:
Emin = (1/6)(dq − 2)3bcp(Tb − Tu) (2-19)
= 2av/(cpuSu,max) (2-20)
Emin estimated by Equation (2-19) and dq,h and dq,v are listed in Table 2-9.
The reported Emin values of R1234yf and R32 measured by the ASTM E582 method were higher than the calculated
Emin values. The reason why the ASTM E582 method provided significantly high Emin values for 2L refrigerants may be
because the gap between the electrodes was narrower than dq. To overcome the quenching effect on the plates, a much
greater spark energy is necessary.
Figure 2-20 shows the estimated Emin vs. dq,h of R717 in this study, along with the experimental Emin values in the
literature, plotted against the electrode gap width at which Emin was measured2-8). Here, the size of the electrodes was not
considered because of the limited published data available. From this graph, Emin of R717 was considered to be some 10
mJ or less because all of the Emin values higher than 100 mJ were measured with the electrode gap within the dq of R717.
As another example, Smith et al. 2-21) reported experimental values for Emin and dq of flammable refrigerants using
electrodes with 25-mm diameter parallel plates in the vertical position as follows: 0.30 mJ and 1.7 mm for R290, 0.89 mJ
and 3.2 mm for R152a, 18,421 mJ and 4.3 mm for R143a, and 26,300 mJ and 5.2 mm for R32. Compared to our results
listed in Table 2-9, they ignited R143a and R32 with an electrode gap significantly narrower than our dq value, but used
a spark energy that was three orders of magnitude greater than our estimated Emin for these compounds. The 25-mm
parallel plates were not large enough to obtain the converged dq value for R32. In other words, if very high energy is
discharged between electrodes with small parallel plates, the incipient flame is forced to penetrate a narrower gap than dq,
and ignition can occur. For R290 and R152a, they measured Emin with an electrode gap similar to our dq, and their results
agreed well with our estimated Emin (listed in Table 2-9). Thus, when considering Emin of mildly flammable compounds,
we should verify whether the ignition occurred with the electrode gap wider than the quenching distance. Otherwise, the
flame heat loss to the electrodes may significantly increase the ignition energy, which would result in an overestimation
of Emin and an undervaluation of the flammability risks of these compounds.
Figure 2-20 Published Emin values for R717 as function of electrode gap at Emin2-8)
2.4.4 Comparison with ignition energy under practical conditions
In this study, the estimated Emin was compared with the magnitude of the spark energy that can be generated from static
electricity due to the human body. In normal activity, a human body can generate an electric charge of 10–15 kV, and the
stored charge energy can reach 20–30 mJ2-17). To ignite a compound with a given Emin by static electricity, the amount of
- 45 -

energy needs to be three times Emin via a metallic material, and 60 times Emin via human skin2-22)-2-24). If this factor is
applied to flammable refrigerants, R290 can be ignited by a spark from static electricity due to the human body. However,
2L refrigerants are very difficult to ignite via a spark between human skin and metallic materials.
In addition, dq was compared with the possible spark distance generated from static electricity. The possibility of
generating spark discharge in the gas phase can be explained by Paschen's law. The law states that the voltage, Vp (kV),
necessary for breakdown of a gas at p (Torr) is determined by
𝑉𝑝 = 23.85 ∙ 𝛼 ∙ 𝑑 ∙ (1 +0.329
√𝛼∙𝑑) (2-21)
where d is the distance between electrodes and α is the relative air density2-25):
α = 0.386𝑝 (273 + 𝑇)⁄ (2-22)
Equation (2-21) suggests that even though breakdown occurs in the refrigerant/air cloud with Vp = 15 kV (upper limit
of human body), its possible distance is 4.3 mm or shorter, which is shorter than the dq of the 2L compounds. Thus, a
spark generated by the static electricity from the human body always occurs with the distance shorter than dq of the 2L
compounds, and the generated flame kernel is inevitably affected by the heat loss to the electrodes. To overcome the heat
loss and ignite the gas mixture, a much greater spark energy than its Emin is required, as illustrated in Figure 2-20.
Consequently, it is unrealistic to ignite 2L refrigerants using the spark from the static electricity of the human body.
Considering the other practical conditions, the spark energy necessary to ignite a compound is usually far greater than
its Emin. The practical conditions are very different from those in the laboratory, where researchers carefully prepare the
optimum concentration (see for reference Figures 2-14, 2-17, and 2-19), spark conditions, optimum gap between
electrodes, etc. Emin is obtained only in the immediate vicinity of such conditions, and even a slight change may
dramatically increase the measured Emin, as shown in Figure 2-11.
For 2L refrigerants, which have a quenching distance of larger than 5 mm, Emin can be obtained with a spark that is
isolated from any objects within their quenching distances. Therefore, to ignite 2L refrigerants with practical electrical
parts, the spark energy must be much greater than Emin.
We examined whether ignition takes place for various refrigerants using the spark discharge from a practical electrical
part. Table 2-10 summarizes the results of our practical ignition test. Consider the case where an electrical household
appliance is in continuing operation, and its plug is physically pulled from the AC power supply socket. An electric spark
is generated in the hole of the socket by this disconnection, which is a situation commonly seen in daily life. If a cloud of
flammable refrigerant/air mixture is present near the socket, the spark in the socket may become an ignition source for
the gas mixture. In the present test, a hair dryer (voltage of 100 VAC and power consumption of 1200 W) was chosen as
the electrical appliance because of its relatively high electrical power within the category of portable appliances, and its
easy handling. Either of four types of refrigerants (R290, R152a, HFC254fb, or R32) mixed with dry air at the most
ignitable concentration for each respective gas was filled in a closed vessel, at the center of which the socket was placed.
The hair dryer whose plug was connected with the socket was switched on and then its plug was pulled from the socket.
The generated spark has energy of several hundred mJ, which was greater than Emin of these compounds. With this spark,
R290 and R152a were ignited by a single trial. However, HFC254fb and R32 were not ignited in over 100 trials, and only
the electric spark itself was observed in the vessel. This is because the width of the hole of the socket was 2.3 mm and
the initial flames of R290 and R152a could develop into a self-sustained flame in the hole. HFC254fb and R32 could not
because the dimension of the hole effectively limits the possible diameter of the flame. Thus, R290 and R152a were
ignited but HFC254fb and R32 were not ignited by the spark in the electrical socket, despite the fact that the spark energy
was greater than their minimum ignition energy.
- 46 -
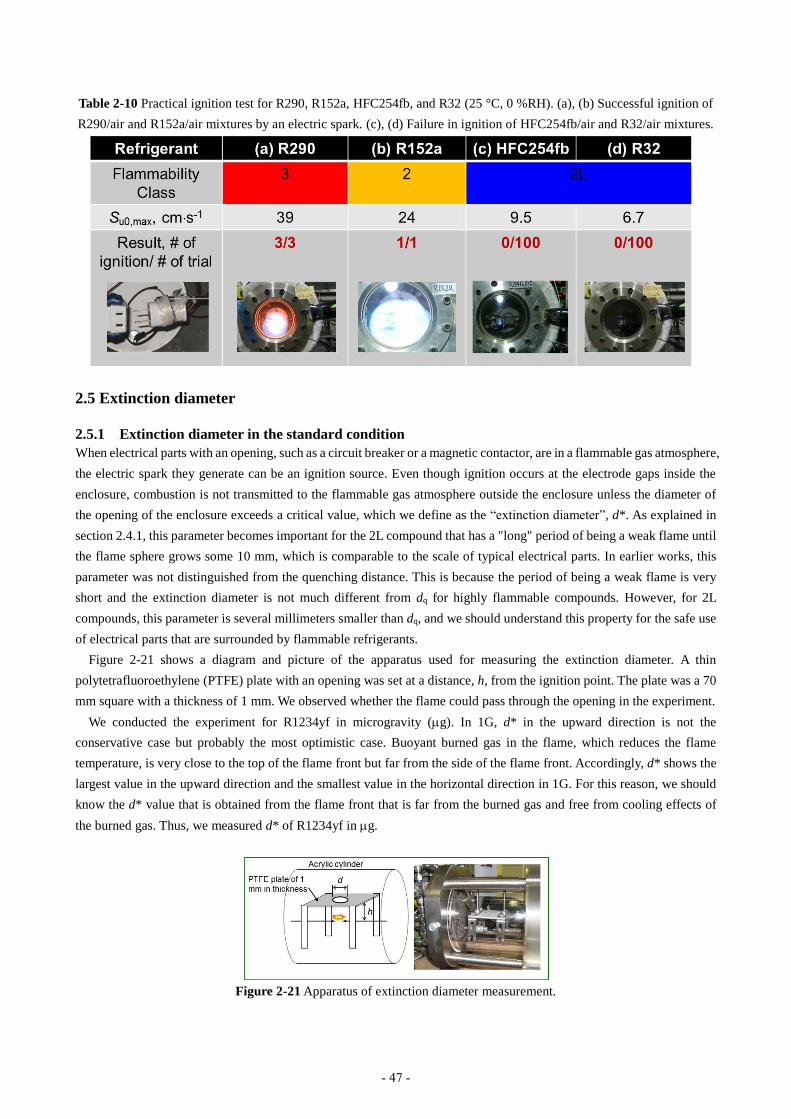
Table 2-10 Practical ignition test for R290, R152a, HFC254fb, and R32 (25 °C, 0 %RH). (a), (b) Successful ignition of
R290/air and R152a/air mixtures by an electric spark. (c), (d) Failure in ignition of HFC254fb/air and R32/air mixtures.
2.5 Extinction diameter
2.5.1 Extinction diameter in the standard condition
When electrical parts with an opening, such as a circuit breaker or a magnetic contactor, are in a flammable gas atmosphere,
the electric spark they generate can be an ignition source. Even though ignition occurs at the electrode gaps inside the
enclosure, combustion is not transmitted to the flammable gas atmosphere outside the enclosure unless the diameter of
the opening of the enclosure exceeds a critical value, which we define as the “extinction diameter”, d*. As explained in
section 2.4.1, this parameter becomes important for the 2L compound that has a "long" period of being a weak flame until
the flame sphere grows some 10 mm, which is comparable to the scale of typical electrical parts. In earlier works, this
parameter was not distinguished from the quenching distance. This is because the period of being a weak flame is very
short and the extinction diameter is not much different from dq for highly flammable compounds. However, for 2L
compounds, this parameter is several millimeters smaller than dq, and we should understand this property for the safe use
of electrical parts that are surrounded by flammable refrigerants.
Figure 2-21 shows a diagram and picture of the apparatus used for measuring the extinction diameter. A thin
polytetrafluoroethylene (PTFE) plate with an opening was set at a distance, h, from the ignition point. The plate was a 70
mm square with a thickness of 1 mm. We observed whether the flame could pass through the opening in the experiment.
We conducted the experiment for R1234yf in microgravity (g). In 1G, d* in the upward direction is not the
conservative case but probably the most optimistic case. Buoyant burned gas in the flame, which reduces the flame
temperature, is very close to the top of the flame front but far from the side of the flame front. Accordingly, d* shows the
largest value in the upward direction and the smallest value in the horizontal direction in 1G. For this reason, we should
know the d* value that is obtained from the flame front that is far from the burned gas and free from cooling effects of
the burned gas. Thus, we measured d* of R1234yf in g.
Figure 2-21 Apparatus of extinction diameter measurement.
- 47 -
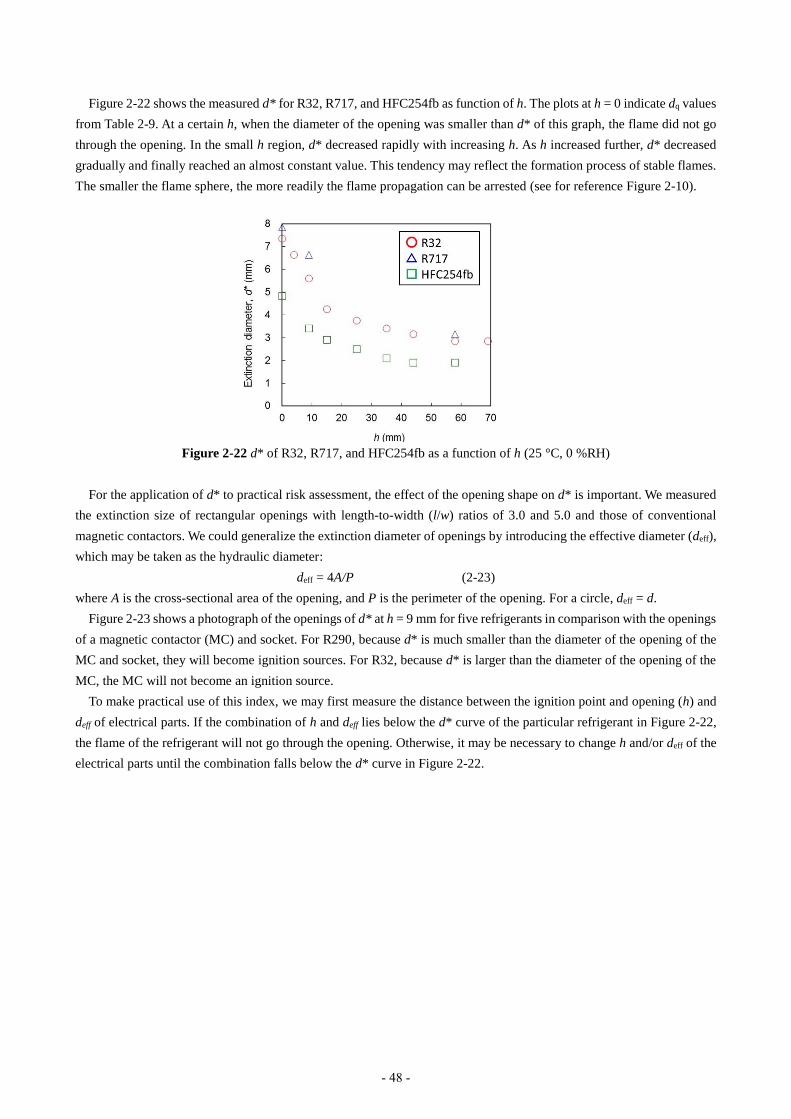
Figure 2-22 shows the measured d* for R32, R717, and HFC254fb as function of h. The plots at h = 0 indicate dq values
from Table 2-9. At a certain h, when the diameter of the opening was smaller than d* of this graph, the flame did not go
through the opening. In the small h region, d* decreased rapidly with increasing h. As h increased further, d* decreased
gradually and finally reached an almost constant value. This tendency may reflect the formation process of stable flames.
The smaller the flame sphere, the more readily the flame propagation can be arrested (see for reference Figure 2-10).
Figure 2-22 d* of R32, R717, and HFC254fb as a function of h (25 °C, 0 %RH)
For the application of d* to practical risk assessment, the effect of the opening shape on d* is important. We measured
the extinction size of rectangular openings with length-to-width (l/w) ratios of 3.0 and 5.0 and those of conventional
magnetic contactors. We could generalize the extinction diameter of openings by introducing the effective diameter (deff),
which may be taken as the hydraulic diameter:
deff = 4A/P (2-23)
where A is the cross-sectional area of the opening, and P is the perimeter of the opening. For a circle, deff = d.
Figure 2-23 shows a photograph of the openings of d* at h = 9 mm for five refrigerants in comparison with the openings
of a magnetic contactor (MC) and socket. For R290, because d* is much smaller than the diameter of the opening of the
MC and socket, they will become ignition sources. For R32, because d* is larger than the diameter of the opening of the
MC, the MC will not become an ignition source.
To make practical use of this index, we may first measure the distance between the ignition point and opening (h) and
deff of electrical parts. If the combination of h and deff lies below the d* curve of the particular refrigerant in Figure 2-22,
the flame of the refrigerant will not go through the opening. Otherwise, it may be necessary to change h and/or deff of the
electrical parts until the combination falls below the d* curve in Figure 2-22.
- 48 -
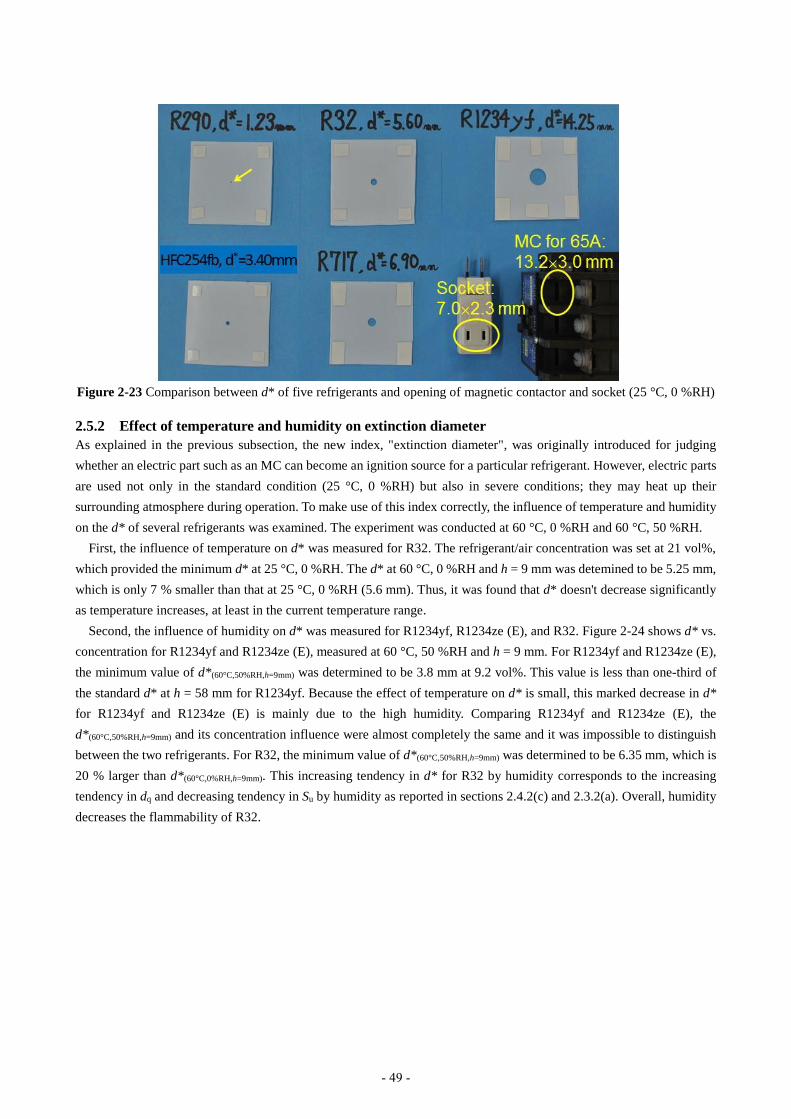
Figure 2-23 Comparison between d* of five refrigerants and opening of magnetic contactor and socket (25 °C, 0 %RH)
2.5.2 Effect of temperature and humidity on extinction diameter
As explained in the previous subsection, the new index, "extinction diameter", was originally introduced for judging
whether an electric part such as an MC can become an ignition source for a particular refrigerant. However, electric parts
are used not only in the standard condition (25 °C, 0 %RH) but also in severe conditions; they may heat up their
surrounding atmosphere during operation. To make use of this index correctly, the influence of temperature and humidity
on the d* of several refrigerants was examined. The experiment was conducted at 60 °C, 0 %RH and 60 °C, 50 %RH.
First, the influence of temperature on d* was measured for R32. The refrigerant/air concentration was set at 21 vol%,
which provided the minimum d* at 25 °C, 0 %RH. The d* at 60 °C, 0 %RH and h = 9 mm was detemined to be 5.25 mm,
which is only 7 % smaller than that at 25 °C, 0 %RH (5.6 mm). Thus, it was found that d* doesn't decrease significantly
as temperature increases, at least in the current temperature range.
Second, the influence of humidity on d* was measured for R1234yf, R1234ze (E), and R32. Figure 2-24 shows d* vs.
concentration for R1234yf and R1234ze (E), measured at 60 °C, 50 %RH and h = 9 mm. For R1234yf and R1234ze (E),
the minimum value of d*(60°C,50%RH,h=9mm) was determined to be 3.8 mm at 9.2 vol%. This value is less than one-third of
the standard d* at h = 58 mm for R1234yf. Because the effect of temperature on d* is small, this marked decrease in d*
for R1234yf and R1234ze (E) is mainly due to the high humidity. Comparing R1234yf and R1234ze (E), the
d*(60°C,50%RH,h=9mm) and its concentration influence were almost completely the same and it was impossible to distinguish
between the two refrigerants. For R32, the minimum value of d*(60°C,50%RH,h=9mm) was determined to be 6.35 mm, which is
20 % larger than d*(60°C,0%RH,h=9mm). This increasing tendency in d* for R32 by humidity corresponds to the increasing
tendency in dq and decreasing tendency in Su by humidity as reported in sections 2.4.2(c) and 2.3.2(a). Overall, humidity
decreases the flammability of R32.
- 49 -
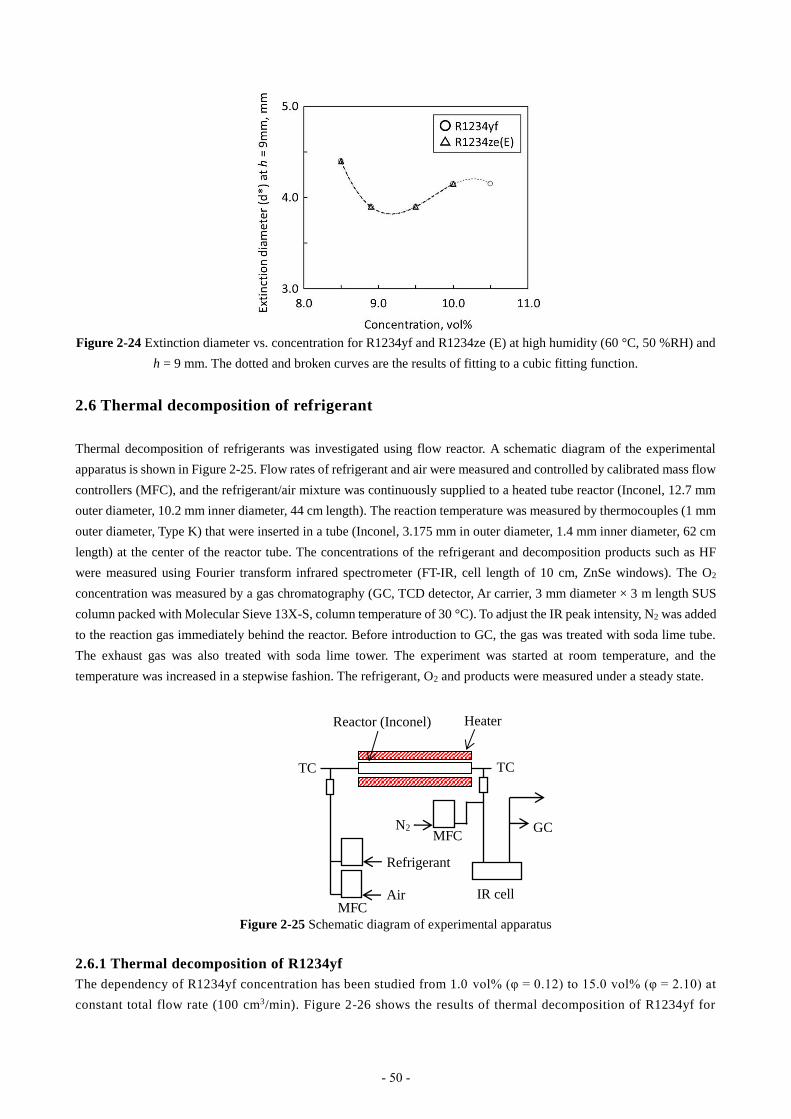
Figure 2-24 Extinction diameter vs. concentration for R1234yf and R1234ze (E) at high humidity (60 °C, 50 %RH) and
h = 9 mm. The dotted and broken curves are the results of fitting to a cubic fitting function.
2.6 Thermal decomposition of refrigerant
Thermal decomposition of refrigerants was investigated using flow reactor. A schematic diagram of the experimental
apparatus is shown in Figure 2-25. Flow rates of refrigerant and air were measured and controlled by calibrated mass flow
controllers (MFC), and the refrigerant/air mixture was continuously supplied to a heated tube reactor (Inconel, 12.7 mm
outer diameter, 10.2 mm inner diameter, 44 cm length). The reaction temperature was measured by thermocouples (1 mm
outer diameter, Type K) that were inserted in a tube (Inconel, 3.175 mm in outer diameter, 1.4 mm inner diameter, 62 cm
length) at the center of the reactor tube. The concentrations of the refrigerant and decomposition products such as HF
were measured using Fourier transform infrared spectrometer (FT-IR, cell length of 10 cm, ZnSe windows). The O2
concentration was measured by a gas chromatography (GC, TCD detector, Ar carrier, 3 mm diameter × 3 m length SUS
column packed with Molecular Sieve 13X-S, column temperature of 30 °C). To adjust the IR peak intensity, N2 was added
to the reaction gas immediately behind the reactor. Before introduction to GC, the gas was treated with soda lime tube.
The exhaust gas was also treated with soda lime tower. The experiment was started at room temperature, and the
temperature was increased in a stepwise fashion. The refrigerant, O2 and products were measured under a steady state.
Figure 2-25 Schematic diagram of experimental apparatus
2.6.1 Thermal decomposition of R1234yf
The dependency of R1234yf concentration has been studied from 1.0 vol% (φ = 0.12) to 15.0 vol% (φ = 2.10) at
constant total flow rate (100 cm3/min). Figure 2-26 shows the results of thermal decomposition of R1234yf for
MFC
Refrigerant
TC
Heater Reactor (Inconel)
GC
TC
Air IR cell
N2 MFC
- 50 -
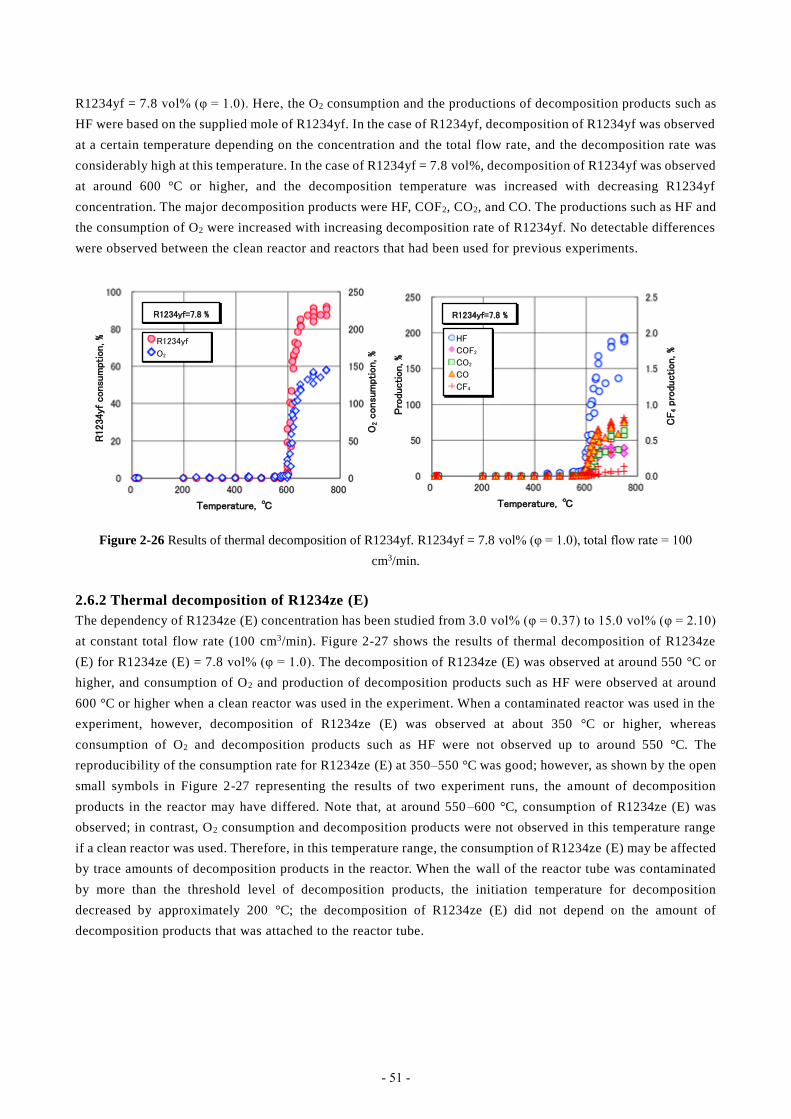
R1234yf = 7.8 vol% (φ = 1.0). Here, the O2 consumption and the productions of decomposition products such as
HF were based on the supplied mole of R1234yf. In the case of R1234yf, decomposition of R1234yf was observed
at a certain temperature depending on the concentration and the total flow rate, and the decomposition rate was
considerably high at this temperature. In the case of R1234yf = 7.8 vol%, decomposition of R1234yf was observed
at around 600 °C or higher, and the decomposition temperature was increased with decreasing R1234yf
concentration. The major decomposition products were HF, COF2, CO2, and CO. The productions such as HF and
the consumption of O2 were increased with increasing decomposition rate of R1234yf. No detectable differences
were observed between the clean reactor and reactors that had been used for previous experiments.
Figure 2-26 Results of thermal decomposition of R1234yf. R1234yf = 7.8 vol% (φ = 1.0), total flow rate = 100
cm3/min.
2.6.2 Thermal decomposition of R1234ze (E)
The dependency of R1234ze (E) concentration has been studied from 3.0 vol% (φ = 0.37) to 15.0 vol% (φ = 2.10)
at constant total flow rate (100 cm3/min). Figure 2-27 shows the results of thermal decomposition of R1234ze
(E) for R1234ze (E) = 7.8 vol% (φ = 1.0). The decomposition of R1234ze (E) was observed at around 550 °C or
higher, and consumption of O2 and production of decomposition products such as HF were observed at around
600 °C or higher when a clean reactor was used in the experiment. When a contaminated reactor was used in the
experiment, however, decomposition of R1234ze (E) was observed at about 350 °C or higher, whereas
consumption of O2 and decomposition products such as HF were not observed up to around 550 °C. The
reproducibility of the consumption rate for R1234ze (E) at 350–550 °C was good; however, as shown by the open
small symbols in Figure 2-27 representing the results of two experiment runs, the amount of decomposition
products in the reactor may have differed. Note that, at around 550 –600 °C, consumption of R1234ze (E) was
observed; in contrast, O2 consumption and decomposition products were not observed in this temperature range
if a clean reactor was used. Therefore, in this temperature range, the consumption of R1234ze (E) may be affected
by trace amounts of decomposition products in the reactor. When the wall of the reactor tube was contaminated
by more than the threshold level of decomposition products, the initiation temperature for decomposition
decreased by approximately 200 °C; the decomposition of R1234ze (E) did not depend on the amount of
decomposition products that was attached to the reactor tube.
R1234yf=7.8 %
R1234yf
O2
Temperature, ℃
R1234
yf c
onsu
mpt
ion, %
O2 c
onsu
mpt
ion, %
Temperature, ℃
HF
COF2
CO2
CO
CF4
R1234yf=7.8 %
Pro
duction, %
CF
4 pro
duction, %
- 51 -

Figure 2-27 Results of thermal decomposition of R1234ze (E). R1234ze (E) = 7.8 vol% (φ = 1.0), total flow rate = 100
cm3/min. Open symbols represent the experimental results using the reactor to which thermal decomposition products
were adhered.
2.6.3 Thermal decomposition of R22
The dependency of R22 concentration has been studied from 10.0 vol% (φ = 0.40) to 21.9 vol% (φ = 1.0) at
constant total flow rate (100 cm3/min). Figure 2-28 shows the results of thermal decomposition of R22 for R22
= 21.9 vol% (φ = 1.0). The consumption of R22 and O2 and decomposition products such as HF were observed
at around 450 °C or higher when a clean reactor was used for the experiment. At around 450–650 °C, the
consumption and production gradually increased with increasing temperature. When a contaminated reactor was
used for the experiments, R22 consumption was observed at about 300 °C or higher, whereas O2 consumption
and decomposition products such as HF were not observed up to around 450 °C. At around 450 °C or higher, no
differences between clean and contaminated reactors were observed for O 2 consumption and production of
decomposition products such as HF. When a contaminated reactor was used, a large scatter was observed for R22
consumption at around 300–600 °C. Thus, R22 consumption may depend on the amount of decomposition
products.
Figure 2-28 Results of thermal decomposition of R22. R22 = 21.9 vol% (φ = 1.0), total flow rate = 100 cm3/min. Open
symbols represent the experimental results using the reactor to which thermal decomposition products were adhered.
2.6.4 Thermal decomposition of R32
The dependency of R32 concentration has been studied from 2.0 vol% (φ = 0.10) to 24.0 vol% (φ = 1.50) at
constant total flow rate (100 cm3/min). Figure 2-29 shows the results of thermal decomposition of R32 for R32
R1234ze (E)=7.8 %
R1234ze (E)
O2
Temperature, ℃
O2 c
onsu
mpt
ion, %
R1234
ze (E)
consu
mpt
ion, %
Temperature, ℃
HF
COF2
CO2
CO
CF4
R1234ze (E)=7.8 %
CF
4 p
rodu
ction, %
Pro
duction, %
R22=21.9 % R22=21.9 %
R22
O2
HF
COF2
CO2
CO
HCl
CF4
R22, O
2 consu
mpt
ion, %
Temperature, ℃
CF
4 pro
duction, %
Pro
duction, %
Temperature, ℃
- 52 -

= 17.3 vol% (φ = 1.0). The decomposition of R32 was observed at around 550 °C or higher, and the decomposition
temperature was gradually increased with decreasing R32 concentration. The productions of decomposition
products such as HF were increased with increasing decomposition rate of R32. As well as the case of R1234yf,
no detectable differences were observed between the clean reactor and reactors that had been used for previous
experiments.
Figure 2-29 Results of thermal decomposition of R32. R32 = 17.3 vol% (φ = 1.0), total flow rate = 100 cm3/min.
2.6.5 Thermal decomposition of R134a
The dependency of R134a concentration has been studied from 1.5 vol% (φ = 0.11) to 14.5 vol% (φ = 1.21) at
constant total flow rate (100 cm3/min). Figure 2-30 shows the results of thermal decomposition of R134a for
R134a = 12.3 vol% (φ = 1.0). The decomposition of R134a was observed at around 600 °C or higher, and
consumption of O2 and production of decomposition products such as HF were observed at around 600 °C or
higher when a clean reactor was used in the experiment. When a contaminated reactor was used in the experiment,
however, decomposition of R134a was observed at about 400 °C or higher, and consumption of O2 and the
decomposition products such as HF were observed at same temperature. As well as the case of R1234ze (E),
when the reactor tube was contaminated by more than the threshold level of decomposition products, the initiation
temperature for decomposition of R134a decreased by approximately 200 °C.
Figure 2-30 Results of thermal decomposition of R134a. R134a = 12.3 vol% (φ = 1.0), total flow rate = 100 cm3/min.
Open symbols represent the experimental results using the reactor to which thermal decomposition products were
adhered.
R32=17.3 %
R32
O2
Temperature, ℃
R32, O
2 c
onsu
mpt
ion, %
R32=17.3 %
HF, C
O2 p
rodu
ction, %
Temperature, ℃
HF
COF2
CO2
CO
CF4
CO
F2, C
O, C
F4 p
rodu
ction, %
R134a=12.3 %
R134a
O2
R134a
consu
mpt
ion, %
O2 c
onsu
mpt
ion, %
Temperature, ℃
R134a=12.3 %
HF, C
O2, C
O, C
OF
2 pr
odu
ction,
%
Temperature, ℃
HF
COF2
CO2
CO
CF4
CF
4 pro
duction, %
- 53 -

2.6.6 Initiation temperature for decomposition of refrigerants
Figure 2-31 shows the initiation temperature for decomposition of five refrigerants studied here. Here, the
initiation temperature for thermal decomposition means the temperature at which the decomposition rate o f the
refrigerant reaches 10 %. In the case of R1234yf and R1234ze (E), as shown in Figs. 2-26 and 2-27, the
decomposition of refrigerant and productions of decomposition products such as HF were observed at a certain
temperature depending on the concentration and total flow rate, and the decomposition and production rates were
considerably high at this temperature. On the other hand, for R22, R32, and R134a, the rate of increase of
decomposition of refrigerant was lower than the case of R1234yf and R1234ze (E), whereas consumption of O2
and decomposition products such as HF was observed above initiation temperature for decomposition of
refrigerants. In all cases, the initiation temperature decreased with increasing refrigerant concentration.
Figure 2-31 Initiation temperature for decomposition of five refrigerants, total flow rate = 100 cm3/min. Thermal
decomposition temperature is the temperature at which the decomposition rate of the refrigerant reaches 10 %.
2.6.7 Thermal decomposition of HFO1123
The dependency of HFO1123 concentration has been studied from 1.5 vol% (φ = 0.11) to 22.0 vol% (φ = 2.02)
at constant total flow rate (100 cm3/min). Also, the dependency of total flow rate has been studied at φ = 1.0 (see
Figure 2-36). Figure 2-32 shows the results of thermal decomposition of HFO1123 for HFO1123 = 12.3 vol% (φ
= 1.0). The decomposition of HFO1123 was observed at around 390 °C or higher, and consumption of O2 and the
decomposition products such as HF were observed at the same temperature. As seen in Figure 2-32, when the
temperature exceeded 390 °C, the decomposition rate of HFO1123 rapidly increased to almost 100 %. Also, O2
consumption and the products such as HF were rapidly increased, when the temperature exceeded 390 °C. The
major products were HF, COF2, CO2, and CO, and production of small amount of CF4 was observed when φ was
large. No detectable differences were observed between the clean reactor and reactors that had been used for
previous experiments.
R1234yf
R1234ze (E)
Initia
tion t
em
pera
ture
, ℃
Concentration of refrigerant, %
Total flow rate=100 cm3/min
R134a
R32
R22 In
itia
tion t
em
pera
ture
, ℃
Concentration of refrigerant, %
Total flow rate=100 cm3/min
- 54 -
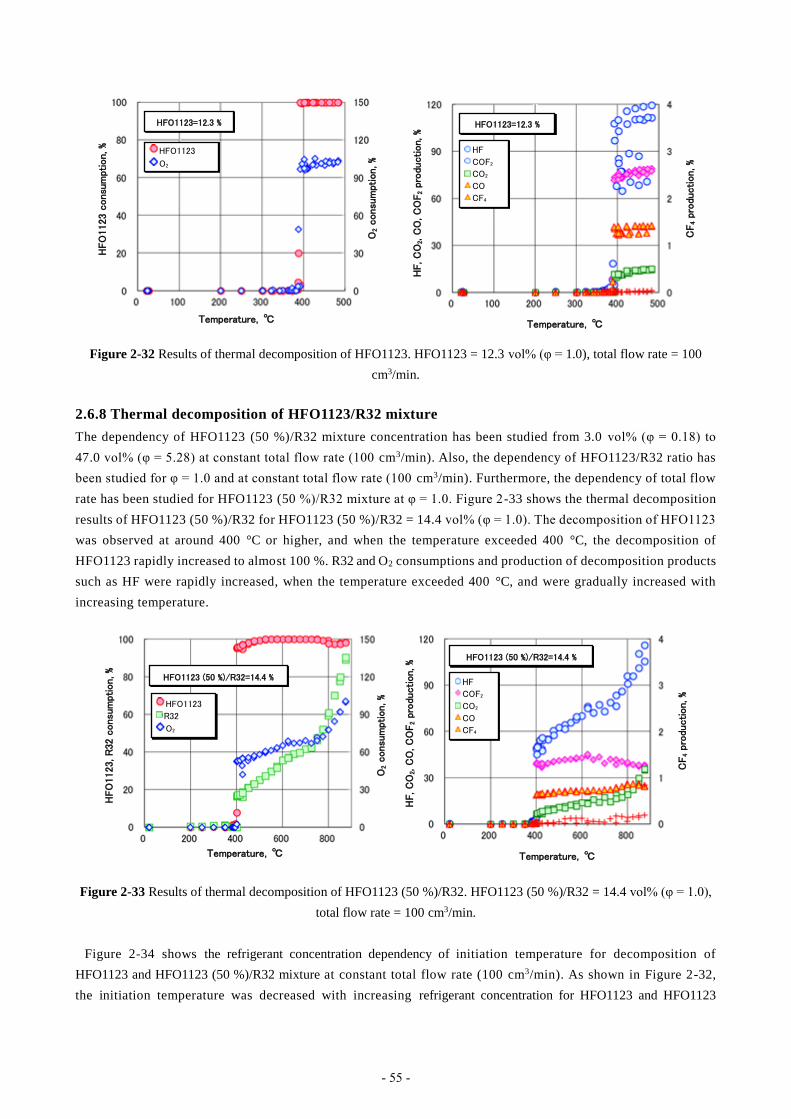
Figure 2-32 Results of thermal decomposition of HFO1123. HFO1123 = 12.3 vol% (φ = 1.0), total flow rate = 100
cm3/min.
2.6.8 Thermal decomposition of HFO1123/R32 mixture
The dependency of HFO1123 (50 %)/R32 mixture concentration has been studied from 3.0 vol% (φ = 0.18) to
47.0 vol% (φ = 5.28) at constant total flow rate (100 cm3/min). Also, the dependency of HFO1123/R32 ratio has
been studied for φ = 1.0 and at constant total flow rate (100 cm3/min). Furthermore, the dependency of total flow
rate has been studied for HFO1123 (50 %)/R32 mixture at φ = 1.0. Figure 2-33 shows the thermal decomposition
results of HFO1123 (50 %)/R32 for HFO1123 (50 %)/R32 = 14.4 vol% (φ = 1.0). The decomposition of HFO1123
was observed at around 400 °C or higher, and when the temperature exceeded 400 °C, the decomposition of
HFO1123 rapidly increased to almost 100 %. R32 and O2 consumptions and production of decomposition products
such as HF were rapidly increased, when the temperature exceeded 400 °C, and were gradually increased with
increasing temperature.
Figure 2-33 Results of thermal decomposition of HFO1123 (50 %)/R32. HFO1123 (50 %)/R32 = 14.4 vol% (φ = 1.0),
total flow rate = 100 cm3/min.
Figure 2-34 shows the refrigerant concentration dependency of initiation temperature for decomposition of
HFO1123 and HFO1123 (50 %)/R32 mixture at constant total flow rate (100 cm3/min). As shown in Figure 2-32,
the initiation temperature was decreased with increasing refrigerant concentration for HFO1123 and HFO1123
HFO1123=12.3 %
HF, C
O2, C
O, C
OF
2 p
rodu
ction,
%
Temperature, ℃
HF
COF2
CO2
CO
CF4
CF
4 p
rodu
ction, %
HFO1123=12.3 %
HFO1123
O2
HFO
1123 c
onsu
mpt
ion, %
Temperature, ℃
O2 c
onsu
mpt
ion, %
HFO1123 (50 %)/R32=14.4 %
HFO1123
R32
O2
HFO
1123, R
32 c
onsu
mpt
ion, %
O2 c
onsu
mpt
ion, %
Temperature, ℃
HF, C
O2, C
O, C
OF
2 pr
odu
ction,
%
Temperature, ℃
HF
COF2
CO2
CO
CF4
HFO1123 (50 %)/R32=14.4 %
CF
4 pro
duction, %
- 55 -
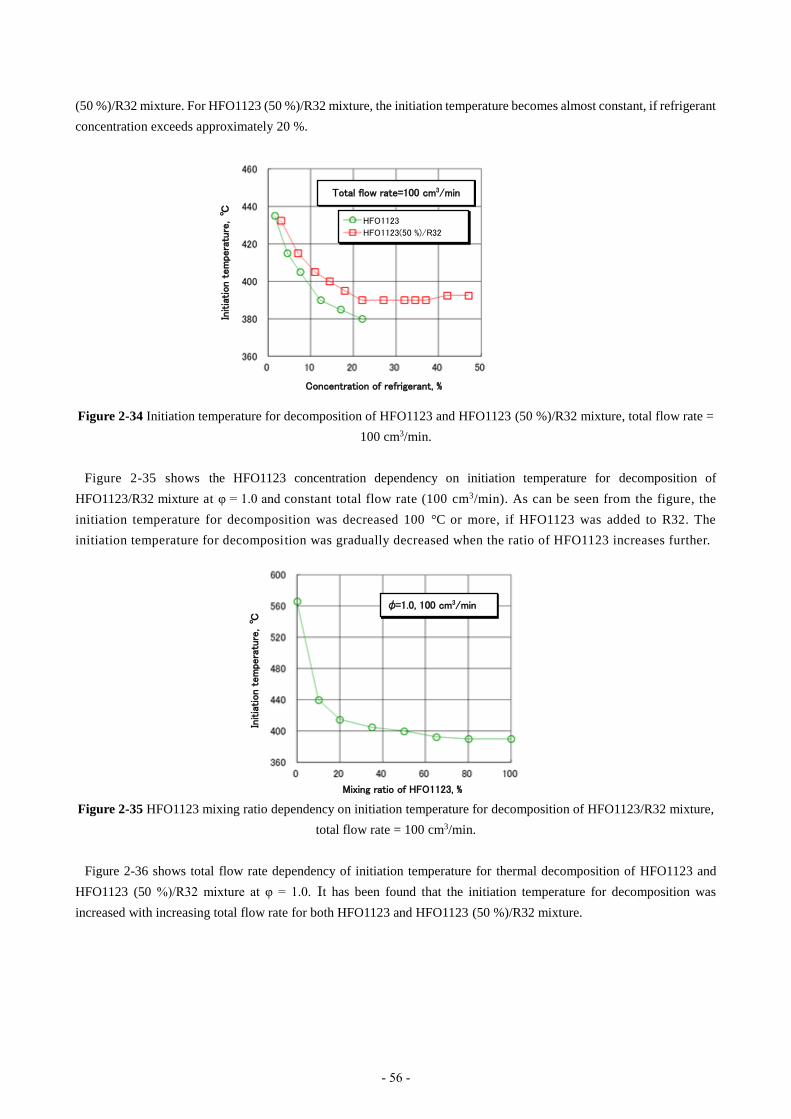
(50 %)/R32 mixture. For HFO1123 (50 %)/R32 mixture, the initiation temperature becomes almost constant, if refrigerant
concentration exceeds approximately 20 %.
Figure 2-34 Initiation temperature for decomposition of HFO1123 and HFO1123 (50 %)/R32 mixture, total flow rate =
100 cm3/min.
Figure 2-35 shows the HFO1123 concentration dependency on initiation temperature for decomposition of
HFO1123/R32 mixture at φ = 1.0 and constant total flow rate (100 cm3/min). As can be seen from the figure, the
initiation temperature for decomposition was decreased 100 °C or more, if HFO1123 was added to R32. The
initiation temperature for decomposition was gradually decreased when the ratio of HFO1123 increases further.
Figure 2-35 HFO1123 mixing ratio dependency on initiation temperature for decomposition of HFO1123/R32 mixture,
total flow rate = 100 cm3/min.
Figure 2-36 shows total flow rate dependency of initiation temperature for thermal decomposition of HFO1123 and
HFO1123 (50 %)/R32 mixture at φ = 1.0. It has been found that the initiation temperature for decomposition was
increased with increasing total flow rate for both HFO1123 and HFO1123 (50 %)/R32 mixture.
Total flow rate=100 cm3/min
Concentration of refrigerant, %
HFO1123
HFO1123(50 %)/R32 In
itia
tion t
em
pera
ture
, ℃
φ=1.0, 100 cm3/min
Mixing ratio of HFO1123, %
Initia
tion t
em
pera
ture
, ℃
- 56 -

Figure 2-36 Total flow rate dependency of initiation temperature for HFO1123 and HFO1123 (50 %)/R32 mixture, φ =
1.0.
2.7 Analysis of thermal decomposition products for lower-GWP refrigerants
2.7.1 Introduction
To analyze the risks of using lower-GWP refrigerants, it is necessary to clarify their decomposability and
products of thermal decomposition. However, the high reactivity of products such as hydrogen fluoride (HF) make this
quantification difficult. Moreover, the reactivity of a molecule with more fluorine atoms than hydrogen atoms, such as
R1234yf, is affected by humidity. Thus, the flammability limits and product composition of lower-GWP refrigerants
depends on the relative humidity of the surrounding air.
The experiment described in this section was carried out to quantify the amount of HF, the main toxic product, and to
analyze the effects of different wall materials.
2.7.2 Experimental methods and results
(a) Experimental apparatus: There are two causes of HF generation from refrigerants: thermal decomposition by
heating and combustion. In this research, only thermal decomposition was studied. A diagram of the experimental
apparatus fabricated to study thermal decomposition by heating is shown in Fig. 2-37. This experimental apparatus
consisted of four parts: gas-mixing, heating, measuring, and detoxification parts.
The gas-mixing part was used to mix refrigerant and air at a specified concentration and humidity. The concentration
was controlled by mass flow controllers, and the humidity was controlled by a dehumidifier and humidifier. The heating
part was used to heat a gas sample and caused it to react in a straight pipe (inner diameter: 10.7 mm); a 550-mm-long
electric furnace was included around the pipe. The measuring part consisted of gas cells for Fourier transform infrared
spectroscopy (FT-IR). Two cells with different path lengths were used to broaden the concentration measurement range.
The detoxification part consisted of an absorbance tube that exhausted into a fume hood.
φ=1.0
Total flow rate, cm3/min
Initia
tion t
em
pera
ture
, ℃
HFO1123
HFO1123 (50 %)/R32
- 57 -

Fig. 2-37 Diagram of the experimental apparatus
Table 2-11 Experimental parameters
Refrigerants tested Lower-GWP refrigerants: R32, R1234yf, HFO1123
Conventional refrigerants: R134a, R22
Heating tube material Inconel 600,
Stainless steel (SUS304 and SUS316)
Refrigerant concentration [vol%] 2.5–10
Temperature of the heater [°C] 310–710
Humidity [g-water / kg-dry air] 0–16
Total flow rate [ml/min] 100–200
Inner diameter of heating tube [mm] 10.7
Cross-sectional area of heating tube [cm2] 0.90
Length of heating tube [mm] 550
Heating time [s]
(in case of 200 ml/min)
5–15
(depends on factors such as heating temperature)
(b) Materials tested and parameters: The experimental parameters are shown in Table 2-11. The tested refrigerants
were mixtures of refrigerants (R32, R1234yf, HFO1123, R134a, and R22) and air. Inconel 600 and stainless steel (SUS304
and SUS316) were used as heating tube materials to compare the effect of corrosion between commonly used metals like
stainless steel and corrosion-resistant Inconel.
(c) Effects of temperature and humidity on thermal decomposition: The effects of temperature and humidity on
decomposition temperature were tested with Inconel tubes. The concentrations of the refrigerant and HF after heating
versus the heater temperature are shown in Figs. 2-38 to 2-47 for each refrigerant. A summary is shown in Table 2-12.
The variable parameter is absolute humidity [g-water / kg-dry air], and the fixed parameters are the refrigerant
concentration (2.5 vol%) and the total flow rate (200 ml/min).
In Figs. 2-38 and 2-39, the AH labeled “2” refers to values such that 0 ≤ AH [g/kg] < 2, and a label of “4” means that
2 ≤ AH [g/kg] < 4. Other figures are also labeled similarly. In these tests, the temperature at which the refrigerant
concentration starts to decrease was not affected by the humidity. However, only in the case of R1234yf, the thermal
decomposition is affected by humidity when the heater temperature is around 600 °C, as shown in Fig. 2-40. It is inferred
the reaction rate decreased as humidity increased.
air
MFC
gascylinder
compressor
MFC
humidifier
dehumidifier
refrigerants
exhaust
FT-IRgas cell
Electric heater(reactor tube)
- 58 -
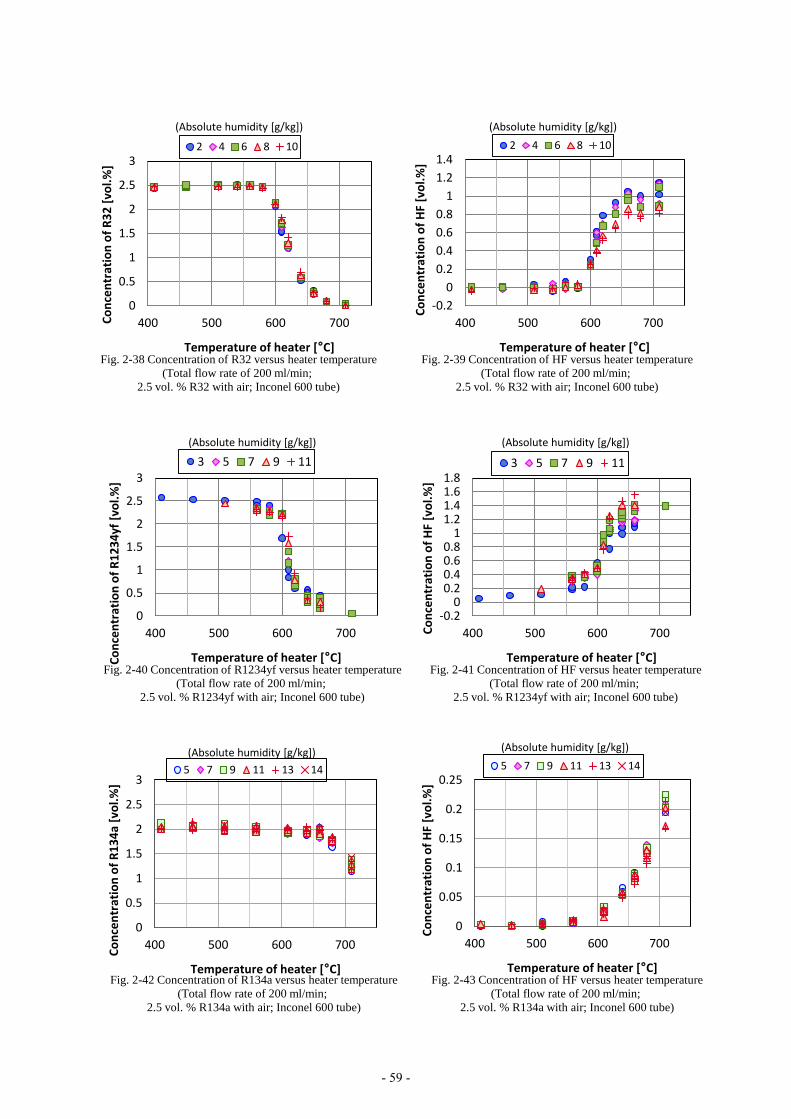
0
0.5
1
1.5
2
2.5
3
400 500 600 700Co
nce
ntr
atio
n o
f R
32
[vo
l.%
]
Temperature of heater [°C]
2 4 6 8 10
Fig. 2-38 Concentration of R32 versus heater temperature
(Total flow rate of 200 ml/min;
2.5 vol. % R32 with air; Inconel 600 tube)
(Absolute humidity [g/kg])
-0.2
0
0.2
0.4
0.6
0.8
1
1.2
1.4
400 500 600 700
Co
nce
ntr
atio
n o
f H
F [v
ol.
%]
Temperature of heater [°C]
2 4 6 8 10
Fig. 2-39 Concentration of HF versus heater temperature
(Total flow rate of 200 ml/min;
2.5 vol. % R32 with air; Inconel 600 tube)
(Absolute humidity [g/kg])
0
0.5
1
1.5
2
2.5
3
400 500 600 700
Co
nce
ntr
atio
n o
f R
12
34
yf [
vol.
%]
Temperature of heater [°C]
3 5 7 9 11
Fig. 2-40 Concentration of R1234yf versus heater temperature
(Total flow rate of 200 ml/min;
2.5 vol. % R1234yf with air; Inconel 600 tube)
(Absolute humidity [g/kg])
-0.20
0.20.40.60.8
11.21.41.61.8
400 500 600 700Co
nce
ntr
atio
n o
f H
F [v
ol.
%]
Temperature of heater [°C]
3 5 7 9 11
Fig. 2-41 Concentration of HF versus heater temperature
(Total flow rate of 200 ml/min;
2.5 vol. % R1234yf with air; Inconel 600 tube)
(Absolute humidity [g/kg])
0
0.5
1
1.5
2
2.5
3
400 500 600 700
Co
nce
ntr
atio
no
f R
13
4a
[vo
l.%
]
Temperature of heater [°C]
5 7 9 11 13 14
(Absolute humidity [g/kg])
Fig. 2-42 Concentration of R134a versus heater temperature
(Total flow rate of 200 ml/min;
2.5 vol. % R134a with air; Inconel 600 tube)
0
0.05
0.1
0.15
0.2
0.25
400 500 600 700
Co
nce
ntr
atio
n o
f H
F [v
ol.
%]
Temperature of heater [°C]
5 7 9 11 13 14
(Absolute humidity [g/kg])
Fig. 2-43 Concentration of HF versus heater temperature
(Total flow rate of 200 ml/min;
2.5 vol. % R134a with air; Inconel 600 tube)
- 59 -
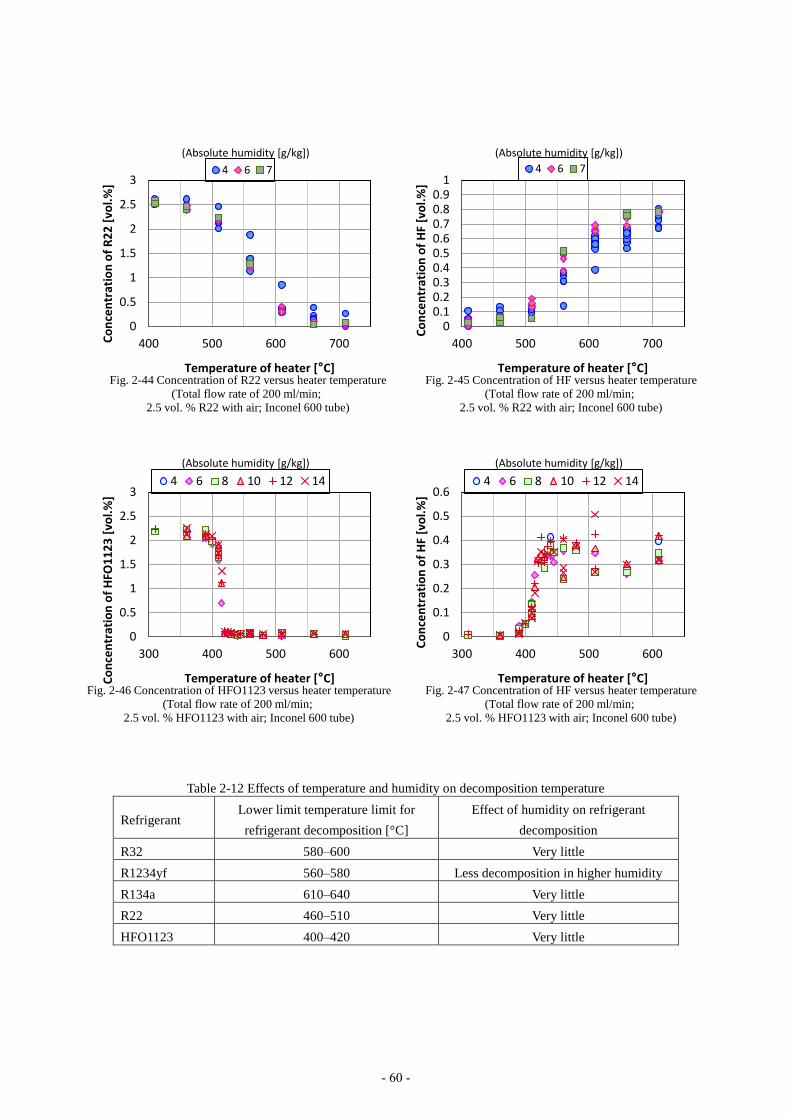
Table 2-12 Effects of temperature and humidity on decomposition temperature
Refrigerant Lower limit temperature limit for
refrigerant decomposition [°C]
Effect of humidity on refrigerant
decomposition
R32 580–600 Very little
R1234yf 560–580 Less decomposition in higher humidity
R134a 610–640 Very little
R22 460–510 Very little
HFO1123 400–420 Very little
0
0.5
1
1.5
2
2.5
3
400 500 600 700Co
nce
ntr
atio
n o
f R
22
[vo
l.%
]
Temperature of heater [°C]
4 6 7
(Absolute humidity [g/kg])
Fig. 2-44 Concentration of R22 versus heater temperature
(Total flow rate of 200 ml/min;
2.5 vol. % R22 with air; Inconel 600 tube)
00.10.20.30.40.50.60.70.80.9
1
400 500 600 700
Co
nce
ntr
atio
n o
f H
F [v
ol.
%]
Temperature of heater [°C]
4 6 7
(Absolute humidity [g/kg])
Fig. 2-45 Concentration of HF versus heater temperature
(Total flow rate of 200 ml/min;
2.5 vol. % R22 with air; Inconel 600 tube)
0
0.5
1
1.5
2
2.5
3
300 400 500 600
Co
nce
ntr
atio
n o
f H
FO1
12
3 [
vol.
%]
Temperature of heater [°C]
4 6 8 10 12 14
(Absolute humidity [g/kg])
Fig. 2-46 Concentration of HFO1123 versus heater temperature
(Total flow rate of 200 ml/min;
2.5 vol. % HFO1123 with air; Inconel 600 tube)
0
0.1
0.2
0.3
0.4
0.5
0.6
300 400 500 600
Co
nce
ntr
atio
n o
f H
F [v
ol.
%]
Temperature of heater [°C]
4 6 8 10 12 14
(Absolute humidity [g/kg])
Fig. 2-47 Concentration of HF versus heater temperature
(Total flow rate of 200 ml/min;
2.5 vol. % HFO1123 with air; Inconel 600 tube)
- 60 -

(d) Effects of tube material on thermal decomposition: The effects of corrosion were tested using stainless steel
tubes (SUS304 and SUS316). In this test, the temperature was increased in steps of 50 °C up to 710 °C, and this process
was repeated after the tube had time to naturally cool.
Some of the results are shown in Figs. 2-48 and 2-49, and a summary of these results, including experiments with
Inconel tubes, is given in Table 2-13. The labels (e.g., “1st,” “2nd,” etc.) in the figures indicate the number of cycles of
the temperature increase. Nearly similar results were obtained with Inconel tubes in the 1st test. However, as the tubes
became corroded, the concentrations of the refrigerants started to decrease at lower temperatures.
Table 2-13 Difference in the lower temperature limit of decomposition between SUS and Inconel tubes [°C]
Tube material
Refrigerant
Inconel 600 SUS316 SUS304
Dry/wet Dry Wet (absolute humidity:
about 6[g/kg])
Dry
R32 580–600 560–610 460–510 410–460
R1234yf 550–580 410–460 410–460 410–460
R134a 610–640 610–660 610–660 460–510
R22 460–510 310–360 310–360 310–360
HFO1123 400–420 360–410 360–410 310–360
(d) Effect of soot on thermal decomposition: In the experiments with R1234yf, we found that the results gradually
changed when the experiment was repeated using the same tube. The concentration of R1234yf after heating is shown in
Fig. 2-50. In this case, soot was found in the tube, and the decrease in the R1234yf concentration started at a lower
temperature compared to the results in Fig. 2-40.
0
0.5
1
1.5
2
2.5
3
400 500 600 700
Co
nce
ntr
atio
n R
32
[vo
l.%
]
Temperature of heater [°C]
1st 2nd 3rd 4th 5th 6th
Fig. 2-48 Concentration of R32 versus heater temperature
(Total flow rate of 200ml/min, 2.5vol% R32
with humid air, SUS316 tube)
0
0.5
1
1.5
2
2.5
3
400 500 600 700Co
nce
ntr
atio
n o
f R
32
[vo
l.%
]
Temperature of heater [°C]
1st 2nd 3rd 4th
Fig. 2-49 Concentration of R32 versus heater temperature
(Total 200ml/min, 2.5vol% R32
with dry air, SUS304 tube)
- 61 -

2.7.3 Summary
In summary, the decomposition of refrigerants on a hot surface was tested to analyze the risks of using lower-
GWP refrigerants. We obtained the following results:
1) The temperatures at which the refrigerants began to decrease when heated for approximately 10 s were:
R32: 580–600 °C, R1234yf: 560–580 °C, HFO1123: 400–420 °C
R134a: 610–640 °C, R22: 480–510 °C
2) The temperature at which the refrigerant concentration started to decrease was not affected by the humidity for the
refrigerants tested in the Inconel tube. Only for R1234yf small effect of the humidity on the thermal decomposition
was obtained.
3) All refrigerants, which were tested in the stainless steel tubes, decomposed at lower temperatures, and the amounts
of the product and the decomposed refrigerant were increased.
4) The generation of soot contributed to the decomposition of R1234yf at lower temperatures and the amount of
product and decomposed refrigerant increased.
2.8 Evaluation of flammability characteristics in the practical environment
Figure 2.51 shows the monthly-averaged temperature and relative humidity data for Tokyo, Jakarta, and Riyadh.
According to ISO 817 (2014) 2-2), the flammability limit shall be measured using moist air of 23 °C, 50 %RH (absolute
humidity of 0.0082 g-water/g-dry air, indicated by a dotted-broken black curve in Figure 2-51). The burning velocity shall
be measured using the dry air. On the other hand, if one looks at the weather pattern in Tokyo, it has only one month
where relative humidity falls below 50 %RH. The flammability parameters evaluated in accordance with ISO 817 (2014)
may not correctly express the flammability under high humidity conditions in Tokyo. To perform a more reliable and
practical risk assessment on the flammability of refrigerants, it is desirable to apply flammability properties in practical
conditions such as a regional climate and a surrounding environment where the air conditioning equipment is used, instead
of the standard conditions.
0
0.5
1
1.5
2
2.5
3
400 500 600 700
Co
nce
ntr
atio
n o
f R
12
34
yf [
vol.
%]
Temperature of heater [°C]
2 4 6 9 10 12
(Absolute humidity [g/kg])
Fig. 2-50 Concentration of R1234yf versus heater temperature
(Total flow rate of 200 ml/min;
2.5 vol% R1234yf with dry air; Inconel 600 tube with soot)
- 62 -
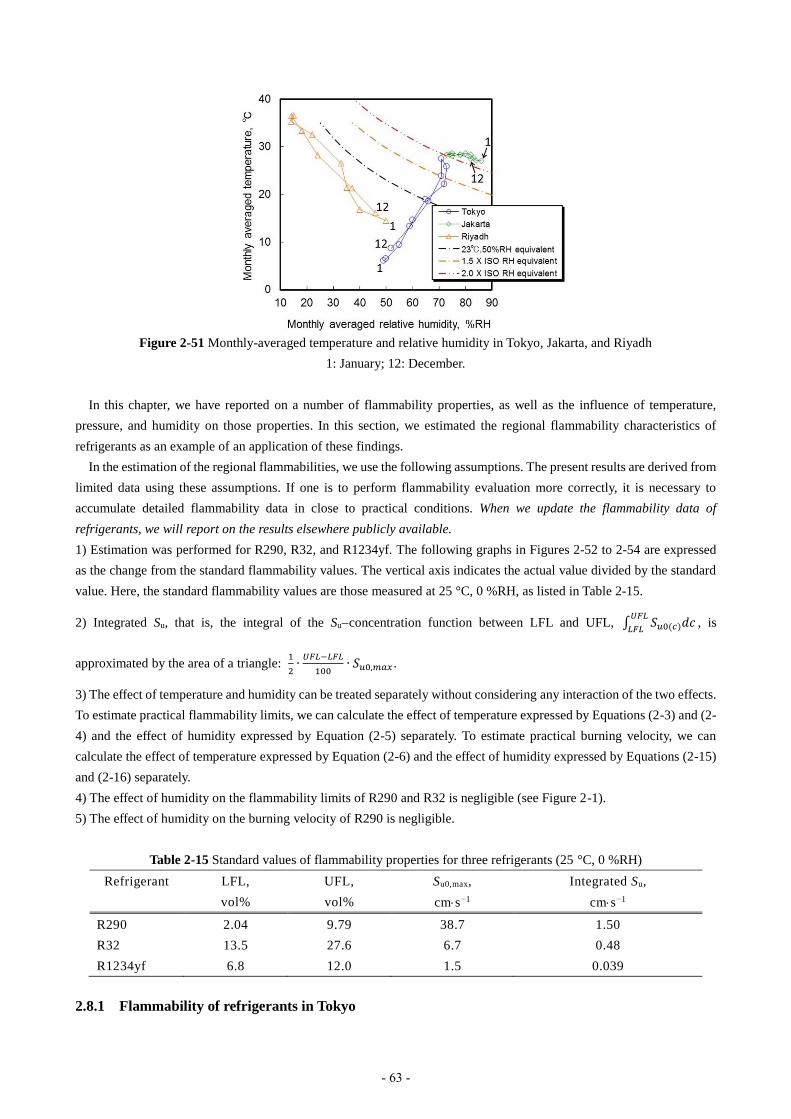
Figure 2-51 Monthly-averaged temperature and relative humidity in Tokyo, Jakarta, and Riyadh
1: January; 12: December.
In this chapter, we have reported on a number of flammability properties, as well as the influence of temperature,
pressure, and humidity on those properties. In this section, we estimated the regional flammability characteristics of
refrigerants as an example of an application of these findings.
In the estimation of the regional flammabilities, we use the following assumptions. The present results are derived from
limited data using these assumptions. If one is to perform flammability evaluation more correctly, it is necessary to
accumulate detailed flammability data in close to practical conditions. When we update the flammability data of
refrigerants, we will report on the results elsewhere publicly available.
1) Estimation was performed for R290, R32, and R1234yf. The following graphs in Figures 2-52 to 2-54 are expressed
as the change from the standard flammability values. The vertical axis indicates the actual value divided by the standard
value. Here, the standard flammability values are those measured at 25 °C, 0 %RH, as listed in Table 2-15.
2) Integrated Su, that is, the integral of the Suconcentration function between LFL and UFL, ∫ 𝑆𝑢0(𝑐)𝑑𝑐𝑈𝐹𝐿
𝐿𝐹𝐿, is
approximated by the area of a triangle: 1
2∙𝑈𝐹𝐿−𝐿𝐹𝐿
100∙ 𝑆𝑢0,𝑚𝑎𝑥 .
3) The effect of temperature and humidity can be treated separately without considering any interaction of the two effects.
To estimate practical flammability limits, we can calculate the effect of temperature expressed by Equations (2-3) and (2-
4) and the effect of humidity expressed by Equation (2-5) separately. To estimate practical burning velocity, we can
calculate the effect of temperature expressed by Equation (2-6) and the effect of humidity expressed by Equations (2-15)
and (2-16) separately.
4) The effect of humidity on the flammability limits of R290 and R32 is negligible (see Figure 2-1).
5) The effect of humidity on the burning velocity of R290 is negligible.
Table 2-15 Standard values of flammability properties for three refrigerants (25 °C, 0 %RH)
Refrigerant LFL,
vol%
UFL,
vol%
Su0,max,
cms−1
Integrated Su,
cms−1
R290 2.04 9.79 38.7 1.50
R32 13.5 27.6 6.7 0.48
R1234yf 6.8 12.0 1.5 0.039
2.8.1 Flammability of refrigerants in Tokyo
- 63 -
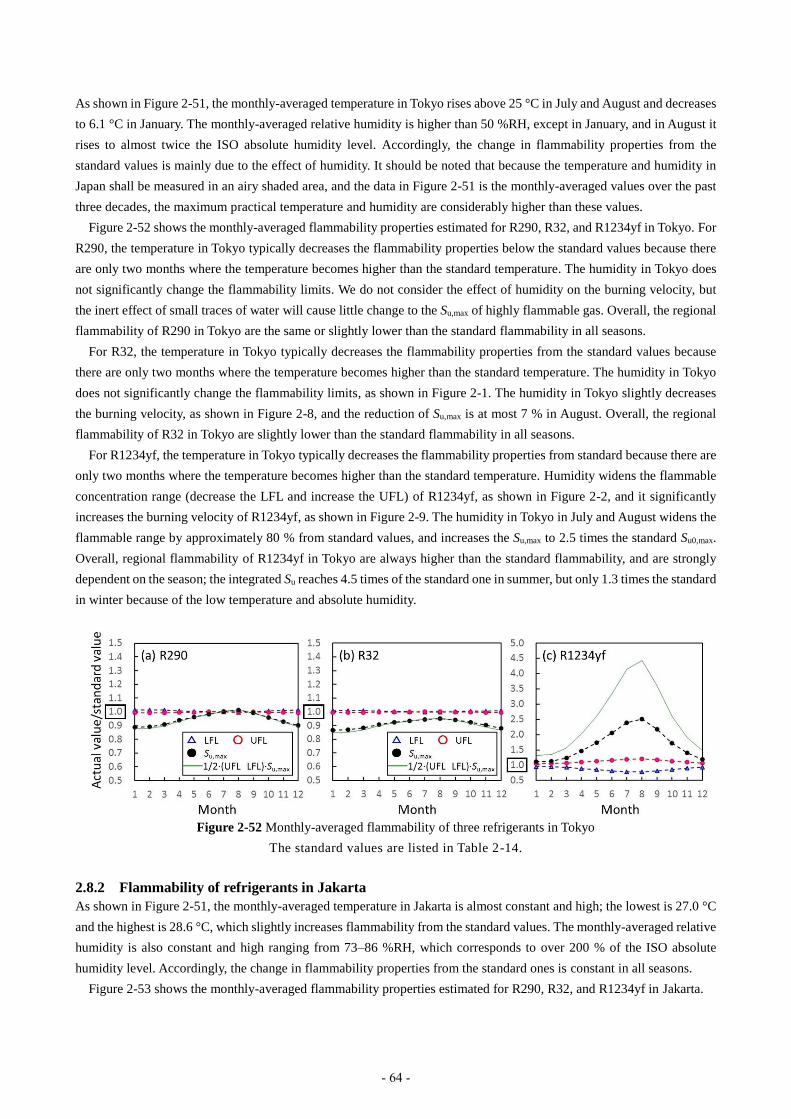
As shown in Figure 2-51, the monthly-averaged temperature in Tokyo rises above 25 °C in July and August and decreases
to 6.1 °C in January. The monthly-averaged relative humidity is higher than 50 %RH, except in January, and in August it
rises to almost twice the ISO absolute humidity level. Accordingly, the change in flammability properties from the
standard values is mainly due to the effect of humidity. It should be noted that because the temperature and humidity in
Japan shall be measured in an airy shaded area, and the data in Figure 2-51 is the monthly-averaged values over the past
three decades, the maximum practical temperature and humidity are considerably higher than these values.
Figure 2-52 shows the monthly-averaged flammability properties estimated for R290, R32, and R1234yf in Tokyo. For
R290, the temperature in Tokyo typically decreases the flammability properties below the standard values because there
are only two months where the temperature becomes higher than the standard temperature. The humidity in Tokyo does
not significantly change the flammability limits. We do not consider the effect of humidity on the burning velocity, but
the inert effect of small traces of water will cause little change to the Su,max of highly flammable gas. Overall, the regional
flammability of R290 in Tokyo are the same or slightly lower than the standard flammability in all seasons.
For R32, the temperature in Tokyo typically decreases the flammability properties from the standard values because
there are only two months where the temperature becomes higher than the standard temperature. The humidity in Tokyo
does not significantly change the flammability limits, as shown in Figure 2-1. The humidity in Tokyo slightly decreases
the burning velocity, as shown in Figure 2-8, and the reduction of Su,max is at most 7 % in August. Overall, the regional
flammability of R32 in Tokyo are slightly lower than the standard flammability in all seasons.
For R1234yf, the temperature in Tokyo typically decreases the flammability properties from standard because there are
only two months where the temperature becomes higher than the standard temperature. Humidity widens the flammable
concentration range (decrease the LFL and increase the UFL) of R1234yf, as shown in Figure 2-2, and it significantly
increases the burning velocity of R1234yf, as shown in Figure 2-9. The humidity in Tokyo in July and August widens the
flammable range by approximately 80 % from standard values, and increases the Su,max to 2.5 times the standard Su0,max.
Overall, regional flammability of R1234yf in Tokyo are always higher than the standard flammability, and are strongly
dependent on the season; the integrated Su reaches 4.5 times of the standard one in summer, but only 1.3 times the standard
in winter because of the low temperature and absolute humidity.
Figure 2-52 Monthly-averaged flammability of three refrigerants in Tokyo
The standard values are listed in Table 2-14.
2.8.2 Flammability of refrigerants in Jakarta
As shown in Figure 2-51, the monthly-averaged temperature in Jakarta is almost constant and high; the lowest is 27.0 °C
and the highest is 28.6 °C, which slightly increases flammability from the standard values. The monthly-averaged relative
humidity is also constant and high ranging from 73–86 %RH, which corresponds to over 200 % of the ISO absolute
humidity level. Accordingly, the change in flammability properties from the standard ones is constant in all seasons.
Figure 2-53 shows the monthly-averaged flammability properties estimated for R290, R32, and R1234yf in Jakarta.
- 64 -

For R290, the temperature in Jakarta slightly increases the flammability properties from the standard values because the
temperature in Jakarta is constantly slightly higher than the standard temperature. The humidity in Jakarta does not
significantly change the flammability limits. We don't consider the effect of humidity on the burning velocity, but the inert
effect by a trace of water will little change Su,max of highly flammable gas. Overall, the regional flammability of R290 in
Jakarta are constantly slightly higher than the standard values.
For R32, the temperature in Jakarta slightly increases the flammability properties above the standard values because
the temperature in Jakarta is constantly slightly higher than the standard temperature. The humidity in Jakarta does not
significantly change the flammability limits as shown in Figure 2-1. The humidity in Jakarta constantly slightly decreases
the burning velocity as shown in Figure 2-8 and the reduction of Su,max is at most 9 % in April. Overall, the regional
flammability of R32 in Jakarta is constant and slightly lower than the standard ones in all seasons.
For R1234yf, the temperature in Jakarta slightly increases the flammability properties from the standard values because
the temperature in Jakarta is almost constant and slightly higher than the standard temperature. Humidity widens the
flammable concentration range of R1234yf as shown in Figure 2-2. It significantly increases the burning velocity of
R1234yf as shown in Figure 2-9. The humidity in Jakarta is always beyond the humidity range of the measured
flammability limits in Figure 2-2. If the flammability limits at 23 °C, 100 %RH is applied, the humidity will widen the
flammable range by approximately 80 % from the standard one in all seasons. The humidity in Jakarta constantly increases
the Su,max to 2.8 times of the standard Su0,max in all seasons. Overall, regional flammability of R1234yf in Jakarta are
considerably higher than the standard ones and the integrated Su reaches 5 times the standard one. They are almost constant
in all seasons.
Figure 2-53 Monthly-averaged flammability of three refrigerants in Jakarta
The standard values are listed in Table 2-14.
2.8.3 Flammability of refrigerants in Riyadh
As shown in Figure 2-51, the monthly-averaged temperature in Riyadh rises to 36.6 °C in July, which makes the
flammability higher than the standard values. The monthly-averaged relative humidity is considerably low. The
corresponding absolute humidity is low and constant, which is lower than the ISO absolute humidity level. However, note
that the change in flammability limits of R1234yf by humidity is most pronounced in the low humidity level, as shown
in Figure 2-2. Accordingly, the change in flammability properties from the standard ones is due to both the effects of
temperature and humidity.
Figure 2-54 shows the monthly-averaged flammability properties estimated for R290, R32, and R1234yf in Riyadh.
For R290, the effect of temperature on flammability limits was obtained from Reference 2-26). Because the temperature
influence on flammability limits of R290 is not very strong, the temperature in Riyadh changes the flammability limits
by only less than 5 % of the standard values. The high temperature in Riyadh increases the Su of R290 and the increase
of Su,max is at most 7 % in July. The humidity in Riyadh does not significantly change the flammability limits of R290. We
do not consider the effect of humidity on the burning velocity but the inert effect by a trace of water will little change
- 65 -

Su,max of highly flammable gas. Overall, the regional flammability of R290 in Riyadh is 8 % higher in summer and 7 %
lower in winter than the standard ones.
For R32, the temperature influence on flammability limits is not very strong, as listed in Table 2-3. The high temperature
in Riyadh increases the Su of R32 and the increase of Su,max is at most 8 % of the standard one. The humidity in Riyadh
does not significantly change the flammability limits as shown in Figure 2-1. The humidity slightly decreases the burning
velocity as shown in Figure 2-8. However, because the absolute humidity in Riyadh is low, the reduction of Su,max is only
at most 3 %. Overall, the regional flammability of R32 in Riyadh are slightly higher in summer and slightly lower in
winter than the standard ones and the integrated Su ranges from only 0.9 to 1.1 of the standard one.
For R1234yf, the temperature influence on flammability limits is not very strong, as listed in Table 2-3 (in dry
condition). The temperature in Riyadh changes the flammability limits by only within 2 % of the standard values. The
high temperature in Riyadh increases the burning velocity (see Table 2-8). Although the increase of Su,max attains at most
7 % of the standard value, the increase of Su,max as the absolute value is negligibly small due to the very low Su0,max of
R1234yf. The relative humidity in Riyadh is low and it is equivalent to 23 °C, 30 %RH. As shown in Figure 2-2, the
flammability limits of R1234yf changes much at the humidity level below 23 °C, 30 %RH. Therefore, even the low
humidity of Riyadh widens the flammable concentration range by approximately 78 % from the standard value. The
humidity significantly increases the burning velocity of R1234yf as shown in Figure 2-9. However, because of the low
absolute humidity, the humidity in Riyadh increases the Su,max to at most 1.6 times of the standard Su0,max in April.
Overall, the regional flammability of R1234yf in Riyadh are always somewhat higher than the standard value and are
not very dependent on the season; the integrated Su ranges from 2.4 to 3.0 times of the standard one. It is found that even
in Riyadh, which is known as a dry and high temperature area, the humidity effect has a more significant on the
flammability of R1234yf than the temperature effect.
Figure 2-54 Monthly-averaged flammability of three refrigerants in Riyadh
The standard values are listed in Table 2-14.
References
2-1) ISO/IEC Guide 51, Safety aspects— Guidelines for their inclusion in standards, International Organization for
Standardization, 1999.
2-2) ISO 817, Refrigerants— Designation and safety classification, International Organization for Standardization, 2014.
2-3) ANSI/ASHRAE Standard 34-2013, Designation and safety classification of refrigerants, American Society of
Heating, Refrigerating and Air-conditioning Engineers, Inc, 2013.
2-4) ISO 5149, Refrigerating systems and heat pumps— Safety and environmental requirements, International
Organization for Standardization, 2014.
2-5) IEC 60335-2-40, Household and similar electrical appliances - Safety - Part 2-40: Particular requirements for
electrical heat pumps, air-conditioners and dehumidifiers, International Electrotechnical Commission.
- 66 -

2-6) ANSI/ASHRAE Standard 15-2013, Safety Standard for Refrigeration Systems, American Society of Heating,
Refrigerating and Air-conditioning Engineers, Inc., 2013.
2-7) ASTM E681-04, Standard test method for concentration limits of flammability of chemicals, ASTM International,
2004.
2-8) Takizawa, K., Igarashi, N., Takagi, S., Tokuhashi, K., Kondo, S., Quenching distance measurement of highly to
mildly flammable compounds, Fire Safety J., 71, pp. 58–68, 2015.
2-9) Kondo, S., Takizawa, K., Tokuhashi, K., Effect of high humidity on flammability property of a few non-flammable
refrigerants, J. Fluor. Chem., 161, pp. 29–33, 2014.
2-10) White, A. G., Limits for the propagation of flame in inflammable gas–air mixtures. Part III. The effects of
temperature on the limits, J. Chem. Soc., Trans., 127, pp. 672–684, 1925.
2-11) Kondo, S., Takizawa, K., Tokuhashi, K., Effects of temperature and humidity on the flammability limits of several
2L refrigerants, J. Fluor. Chem., 144, pp. 130–136, 2012.
2-12) Richard, R., Refrigerant flammability testing in large volume vessels, DOE/CE/23810-87, pp. 1–8, 1998.
2-13) Takizawa, K., Takahashi, A., Tokuhashi, K., Kondo, S., Sekiya, A., Burning velocity measurement of fluorinated
compounds by spherical-vessel method, Combust. Flame, 141, pp. 298–307, 2005.
2-14) Takizawa, K., Takahashi, A., Tokuhashi, K., Kondo, S., Sekiya, A., Burning velocity measurements of nitrogen-
containing compounds, J. Hazard. Mater., 155, pp. 144–152, 2008.
2-15) Takizawa, K., Takahashi, A., Tokuhashi, K., Kondo, S., Sekiya, A., Reaction stoichiometry for combustion of
fluoroethane blends, ASHRAE Trans., 112, pp. 459–468, 2006.
2-16) ASTM E582-07, Standard test method for minimum ignition energy and quenching distance in gaseous mixtures,
ASTM International, 2007.
2-17) NFPA 77, Recommended Practice on Static Electricity 2000 Edition, NFPA, 2000.
2-18) Technologies for high pressure gas safety, 12th ed., The High Pressure Gas Safety Institute of Japan (KHK), pp.
102–103, 2015.
2-19) Takizawa, K., Igarashi, N., Tokuhashi, K., Kondo, S., Effects of temperature and pressure on quenching distances
of difluoromethane (R32) and ammonia (R717), The 13th Asia Pacific Conference on the Built Environment, pp.143–155,
2015.
2-20) Lewis B., Von Elbe G., Combustion, Flames and Explosions of Gases, third ed., Academic Press, New York, pp.
333–361, 1987.
2-21) Smith, N. D., Mitchell, W. A., Tufts, M. W., Determining minimum ignition energies and quenching distances of
difficult-to-ignite compounds, J. Testing Eval. 31, pp. 178–182, 2003.
2-22) Tolson, P., The stored energy needed to ignite methane by discharges from a charged person, J. Electrostat., 8, pp.
289–293, 1980.
2-23) Wilson, N., The risk of fire or explosion due to static charges on textile clothing, J. Electrostat., 4, pp. 67–84, 1977.
2-24) Davies, D. K., The incendivity of sparks and brush discharges, J. Electrostat., 27, pp. 175–178, 1992.
2-25) The Institute of Electrostatics Japan, Handbook of Electrostatics, Ohmsha, Tokyo, pp. 220–21, 1981 (in Japanese)
2-26) Kondo, S., Takizawa, K., Takahashi, A., Tokuhashi, K., On the temperature dependence of flammability limits of
gases, J. Hazard. Mater. 187, pp. 585–590, 2011.
- 67 -
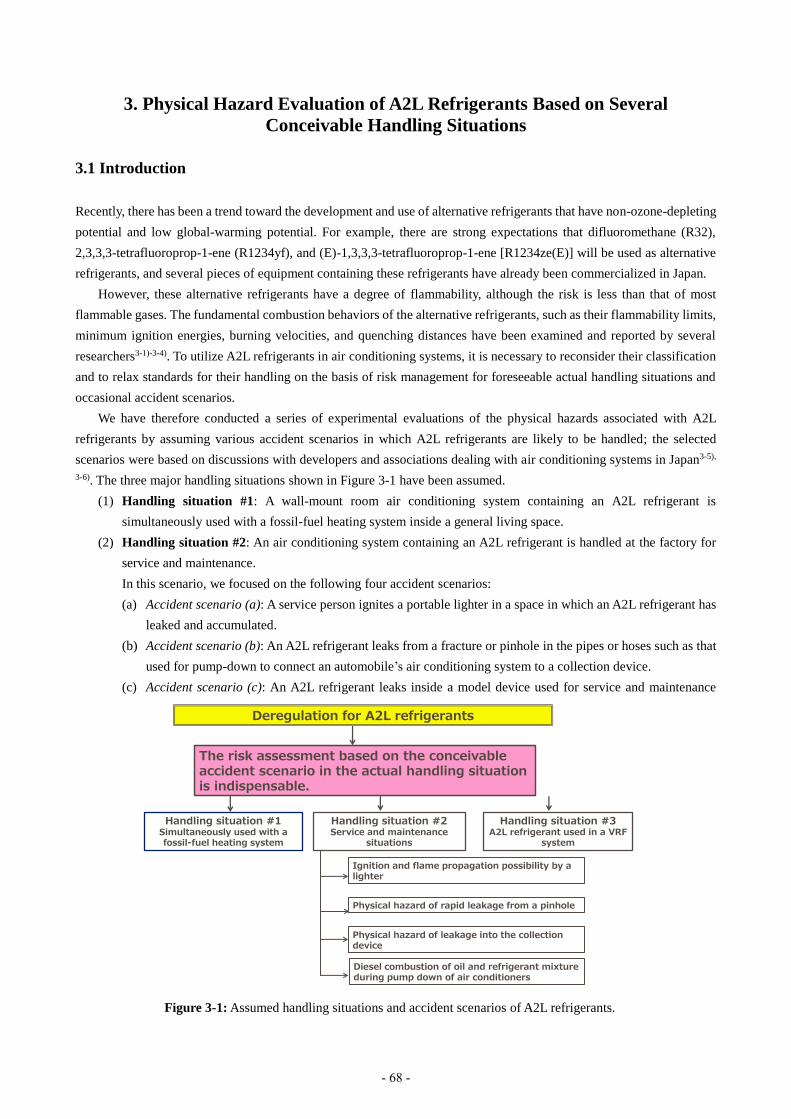
3. Physical Hazard Evaluation of A2L Refrigerants Based on Several
Conceivable Handling Situations
3.1 Introduction
Recently, there has been a trend toward the development and use of alternative refrigerants that have non-ozone-depleting
potential and low global-warming potential. For example, there are strong expectations that difluoromethane (R32),
2,3,3,3-tetrafluoroprop-1-ene (R1234yf), and (E)-1,3,3,3-tetrafluoroprop-1-ene [R1234ze(E)] will be used as alternative
refrigerants, and several pieces of equipment containing these refrigerants have already been commercialized in Japan.
However, these alternative refrigerants have a degree of flammability, although the risk is less than that of most
flammable gases. The fundamental combustion behaviors of the alternative refrigerants, such as their flammability limits,
minimum ignition energies, burning velocities, and quenching distances have been examined and reported by several
researchers3-1)-3-4). To utilize A2L refrigerants in air conditioning systems, it is necessary to reconsider their classification
and to relax standards for their handling on the basis of risk management for foreseeable actual handling situations and
occasional accident scenarios.
We have therefore conducted a series of experimental evaluations of the physical hazards associated with A2L
refrigerants by assuming various accident scenarios in which A2L refrigerants are likely to be handled; the selected
scenarios were based on discussions with developers and associations dealing with air conditioning systems in Japan3-5),
3-6). The three major handling situations shown in Figure 3-1 have been assumed.
(1) Handling situation #1: A wall-mount room air conditioning system containing an A2L refrigerant is
simultaneously used with a fossil-fuel heating system inside a general living space.
(2) Handling situation #2: An air conditioning system containing an A2L refrigerant is handled at the factory for
service and maintenance.
In this scenario, we focused on the following four accident scenarios:
(a) Accident scenario (a): A service person ignites a portable lighter in a space in which an A2L refrigerant has
leaked and accumulated.
(b) Accident scenario (b): An A2L refrigerant leaks from a fracture or pinhole in the pipes or hoses such as that
used for pump-down to connect an automobile’s air conditioning system to a collection device.
(c) Accident scenario (c): An A2L refrigerant leaks inside a model device used for service and maintenance
Deregulation for A2L refrigerants
The risk assessment based on the conceivable accident scenario in the actual handling situation is indispensable.
Handling situation #1Simultaneously used with a fossil-fuel heating system
Handling situation #2Service and maintenance
situations
Handling situation #3A2L refrigerant used in a VRF
system
Physical hazard of rapid leakage from a pinhole
Physical hazard of leakage into the collection device
Ignition and flame propagation possibility by a lighter
Diesel combustion of oil and refrigerant mixture during pump down of air conditioners
Figure 3-1: Assumed handling situations and accident scenarios of A2L refrigerants.
- 68 -

such as a collection device.
(d) Accident scenario (d): Diesel combustion of the compressor of an air conditioner containing an A2L
refrigerant during pump-down.
(3) Handling situation #3: An A2L refrigerant is used in the Variable Refrigerant Flow (VRF) system.
In this report, we present digests of the results of experimental evaluation of A2L refrigerants in above handling
situations. The details of the work presented in this report have been published as review papers3-7)-3-11).
3.2 Hazard Evaluation of Handling Situation #1: Use with Fossil-fuel Heating System
3.2.1 Outline
In this situation, scenarios involving ignition, flame propagation, and concentration of combustion product (hydrogen
fluoride (HF)) were intensively investigated. We focused on two different types of accident cases: an A2L refrigerant
leaking from an air conditioning system into a general living space in which a fossil-fuel heating system was already
operating (Case (i)), and a fossil-fuel heating system operating in a general living space in which the leaked A2L
refrigerant had already leaked and accumulated (Case (ii)).
An article describing the details of this topic was published in 2012 3-10).
3.2.2 Experiment
Figure 3-2 shows the schematic diagram of the experimental setup. A commercial room air conditioning system for an
area comprising six Tatami mats (about 11 m2) was installed on the wall of an experimental facility (2800-mm cube) in
which the center of the ventilation outlet was located 700 mm beneath the ceiling and at the center in the horizontal
direction. Refrigerant was leaked in the downward direction from the ventilation outlet. In Case (i), a radiative oil stove
(power: 2.4 kW, designed to heat 13 m2) and an oil fan heater (power: 3.2 kW, designed to heat 16 m2) were employed as
representative fossil-fuel heating systems already operating inside the general living space. In Case (ii), a ceramic heater
(FPS1, Yarkar Ceramic Co., Ltd., Osaka) was employed as the heating source instead of the fossil-fuel heating system
because the heating source had to be controlled remotely.
R1234yf, R32, and R410A were employed as the test refrigerants. The amount of leaked refrigerant was 800 g, which
was designed based on the amount of refrigerant contained in most commercial air conditioning systems3-12). In addition,
two leak rates were used: 10 g/min and 60 g/min.
In this experiment, concentrations of the refrigerant and the HF that were produced by combustion or thermal
decomposition were measured using Fourier transform infrared spectroscopy (FT-IR) ( JASCO, FT-IR4200, Tokyo).
- 69 -

3.2.3 Results and discussions
3.2.3.1 Case (i)
In all of the experimental cases, no flame propagation to the leaked and accumulated A2L refrigerants in the experimental
room was observed, and the situation in the experiment room was not changed before or after each experiment.
Figure 3-3 shows the time history of the leaked refrigerant and HF concentration at position 4 in Figure 3-2 for the
case in which the oil fan heater was the representative fossil-fuel heating system. The time history of the refrigerant
concentration was similar to that of the HF concentration regardless of the operation of the air conditioner. The maximum
refrigerant concentration was approximately 2 vol%, which is much less than the lower flammable limit (LFL) of R32.
More specifically, even when all of the R32 installed in the wall-mount room air conditioner was leaked to the general
living space (approximately 8 m2), the R32 concentration did not exceed the LFL; thus, flame propagation to the room
did not occur. These behaviors were also confirmed in the case of R1234yf.
Figure 3-4 shows the HF concentration of each refrigerant. Approximately 50–1500 ppm of HF was produced, which
is much greater than the permissible value designated by the Japan Society for Occupation and Health3-13). The amount
of HF produced in the oil fan heater case was much greater than that of the radiative stove. This was because the refrigerant
that was sucked into the oil fan heater was completely burned, whereas a portion of the refrigerants that made contact
with the heating body of the radiative oil stove may not have burned, but only decomposed.
In the case of the radiative oil stove (Figure 3-4(a)), the HF concentration when the air conditioner was in operation
was greater than the amount when the air conditioner was not in operation, regardless of the variety of refrigerant; however,
this trend was not observed in the case of the oil fan heater (Figure 3-4(b)). The reason for this may be that the flow in
the experimental room became complex as a result of the interaction of the circular flow of the fan heater and the air
conditioner. In addition, although the HF generated by R32 was slightly higher than that of R1234yf and R410A, the HF
generation ability of A2L refrigerants was similar to that of R410A.
3.2.3.2 Case (ii)
The concentration of refrigerant in the experimental room was at most 2 vol%, which is much lower than the LFL of R32.
Flame propagation to the unburned refrigerant did not occur and very little HF was produced (less than 50 ppm, which is
the guaranteed limit).
28
00
2800
Experiment room
21
00
X
1400
Air Conditioning System
FT-IR(Low conc.)
FT-IR(High conc.)
To vacuum pumpValve control box
Data Logger
Signal conditionerBalance
Cylinder
Needle valveBall valve
Observation room
BDR
Monitor
①
②
③
④
⑤ ⑥10
00 15
00
20
00
Heating System
CCD Camera
: concentration measuring positionUnit: mm
X: 400 mm with radiative oil stove, 300 mm with oil fan heater
Figure 3-2: Schematic diagram of experimental setup for evaluation of handling situation #1.
- 70 -

3.3 Hazard Evaluation of Handling Situation #2-(a): Ignition and Flame Propagation
Possibility by a Lighter
3.3.1 Outline
In this scenario, we evaluated the physical hazard for the case in which a commercial cigarette lighter was ignited inside
a space in which an A2L refrigerant had leaked and accumulated at the service and maintenance factory. A piezo-type gas
lighter and kerosene cigarette lighter were each used as the target gas lighter. The possibility of ignition and flame
propagation to the accumulated A2L refrigerants located around the portable lighter were examined. The possibility of
ignition from the heat of the cigarette tip was ignored because this type of ignition rarely occurs even for methane gas,
which is well-known as being a highly flammable gas3-14).
Articles describing some of the details of this topic were published3-8), 3-9).
3.3.2 Details of experimental evaluation of the possibility of ignition and flame propagation using piezo-
type gas lighter
Figure 3-3: Time history of the concentrations of refrigerant and HF at the front of the heating system. Heating system: Oil fan heater; Refrigerant: R32; Capacity of experiment room: 22 m3.
(a) Air conditioning system not in operation, (b) Air conditioning system in operation
0
200
400
600
800
1000
1200
1400
1600
1800
2000
0
0.2
0.4
0.6
0.8
1
1.2
1.4
1.6
1.8
2
0 20 40 60 80 100 120
HF
Co
nce
ntr
atio
n (
pp
m)
R3
2 C
on
cen
trat
ion
(vo
l%)
time (min)
AC-OFF, 10g/min, RefrigerantAC-OFF, 60g/min, RefrigerantAC-OFF, 10g/min, HFAC-OFF, 60g/min, HF
(a) AC-OFF
0
200
400
600
800
1000
1200
1400
1600
1800
2000
0
0.2
0.4
0.6
0.8
1
1.2
1.4
1.6
1.8
2
0 20 40 60 80 100 120
HF
Co
nce
ntr
atio
n (
pp
m)
R3
2 C
on
cen
trat
ion
(vo
l%)
time (min)
AC-ON, 10g/min, RefrigerantAC-ON, 60g/min, RefrigerantAC-ON, 10g/min, HFAC-ON, 60g/min, HF
(b) AC-ON
Figure 3-4: Comparison of HF concentration with the leak rate and operation of air conditioning system: (a) using a radiative oil stove, (b) using an oil fan heater.
0
200
400
600
800
1000
1200
1400
1600
1800
2000
R32 R1234yf R410A
HF
Co
nce
ntr
atio
n (
pp
m)
Varieties of Refrigerants
10g/min, AC-OFF
10g/min, AC-ON
60g/min, AC-OFF
60g/min, AC-ON
(a)
0
200
400
600
800
1000
1200
1400
1600
1800
2000
R32 R1234yf R410A
HF
Co
nce
ntr
atio
n (
pp
m)
Varieties of Refrigerants
10g/min, AC-OFF10g/min, AC-ON60g/min, AC-OFF60g/min, AC-ON
(b)
- 71 -

3.3.2.1 Determination of composition of test mixture
We assumed n-butane as the fuel in the gas lighter. We also assumed that the mixture comprising the fuel of the gas lighter,
air, and an A2L refrigerant was formed very close to the outlet of the gas lighter, and we regarded the mixtures of the fuel
gas and A2L refrigerant as a single component. In this report, we call the mixture of n-butane and A2L refrigerant “fuel
gas” and the mixture of this “fuel gas” and air as “fuel mixture.” The flammable zone of this “fuel mixture” in air was
estimated by simply using Le Chatelier’s principle (Eq. 3.1). This estimation is only approximate because Le Chatelier’s
principle is only approved for a mixture of saturated hydrocarbons that Burgess−Wheeler’s law which the multiple value
of LFL at 25 °C and combustion heat is constant is approved.
2
2
1
11
LFL
n
LFL
n
LFL ,
2
2
1
11
UFL
n
UFL
n
UFL (3-1)
where LFL is the lower flammable limit (vol%), UFL is the upper flammable limit (vol%), n is the volumetric fraction of
the component, subscript 1 is n-butane, and subscript 2 is the A2L refrigerant.
The concentration of n-butane very close to the outlet of the lighter ought to exceed the LFL. The examples in Figure
3-5 show the relation between the composition ratio of “fuel gas” in the “fuel mixture” and also that of n-butane against
the “fuel gas.” These composition ratios were estimated assuming that the concentration of n-butane was always greater
than that of the LFL. Thus, we considered the combinations of three concentrations of n-butane (LFL, Cst: stoichiometric
concentration, and UFL) and of A2L refrigerant (LFL/2, LFL, UFL). The solid curve indicates the variation of the LFL
estimated from Eq. (3-1) with various composition ratios of “fuel gas” in the “fuel mixture,” and the dotted curve indicates
the variation of the UFL. As a result, the concentration of the “fuel mixture” was within the estimated flammable zone
when the A2L refrigerant with a concentration less than the LFL was mixed with n-butane and air. We focused on the
mixture having this composition as shown in the closed circle of Figure 3-5.
The ignition energy of n-butane with the same equivalence ratio as the above composition mixture was within the range
0
0.05
0.1
0.15
0.2
0.25
0.3
0.35
0.4
0 0.2 0.4 0.6 0.8 1
(n-b
uta
ne
+ R
32
)/(n
-bu
tan
e +
R3
2 +
Air
) (-
)
n-butane/(n-butane + R32) (-)
0
0.05
0.1
0.15
0.2
0.25
0.3
0.35
0.4
0 0.2 0.4 0.6 0.8 1
(n-b
uta
ne
+ R
12
34
ze)/
(n-b
uta
ne
+ R
12
34
ze +
Air
) (-
)
n-butane/(n-butane+R1234ze) (-)
0
0.05
0.1
0.15
0.2
0.25
0.3
0.35
0.4
0 0.2 0.4 0.6 0.8 1
(n-b
uta
ne
+ R
12
34
yf)/
(n-b
uta
ne
+ R
12
34
yf +
Air
) (
-)
n-butane/(n-butane+R1234yf) (-)
(a) R1234yf (b) R1234ze(E)
(c) R32 Sym-bol
Composition
n-butane A2L
Sym-bol
Composition
n-butane A2L
LFL LFL/2
No. No.
①
②
③
④
⑤
⑥
⑦
⑧LFL LFLLFL UFLCst LFLCst UFL
UFL LFL/2UFL LFLUFL LFL
LFL of the mixture
UFL of the mixture
Figure 3-5: Estimation of flammable range and concentration of “fuel mixture” (n-butane + A2L refrigerants) in
the air with various compositions of “fuel gas” (n-butane/A2L refrigerant).
- 72 -

of 0.25 to 2.40 mJ, which is as great as or less than the energy from a piezoelectric spark of a few millijoules3-15). Therefore,
the “fuel gas” composition between the LFL and UFL curves has some ignition possibility. In addition, the ignition
energies of R1234yf and R32 were at least greater than a few dozen millijoules; that is, one figure larger than that of n-
butane, hence the ignition energy of “fuel gas” will be much greater than that of n-butane. Therefore, the possibility of
actual ignition was very small. The ignition possibility in the above composition is conceivably a very severe case.
3.3.2.2 Experiment
The operating device for a portable gas lighter comprising a pneumatic cylinder (SSD-X, CKD Corp.) and jig was located
300 mm above the bottom of an acrylic pool of volume 1 m3 at the center of the horizontal plane. Air to operate the device
was supplied remotely using a solenoid valve at a pressure of 0.15 MPa. A piezo gas lighter and a commercial turbo gas
lighter were employed as the ignition sources.
R1234yf, R1234ze(E), and R32 were employed in the evaluation. The A2L refrigerant was leaked in a downward
direction from a height of 750 mm above the bottom of the pool. The target leakage rate was 10 g/min for all refrigerants.
The refrigerant concentrations at six vertical positions (0, 100, 300, 500, 750, and 1000 mm in height from the bottom of
the acrylic pool) were measured using FT-IR before pushing the button of the piezo gas lighter. The vertical distribution
of the refrigerant concentration was constant for heights less than 500 mm.
The operation to push the button of the lighter was maintained for 2 or 10 s per cycle. This operation was repeated
for five or nine cycles at intervals of 5 s per cycle. The lighter outlet was observed using a digital video camera (Xacti,
30 fps, SANYO Electric Co., Ltd., Osaka).
3.3.2.3 Results and discussions
3.3.2.3.1 Piezo gas lighter
Figure 3-6 shows photographs of the piezo gas lighter and its surroundings. In the case of the accumulated A2L refrigerant
with the LFL concentration, a pale emission was observed near the outlet of the lighter for 1/30 s. Flame propagation to
the entire refrigerant in the surroundings did not occur. In the case of the accumulated A2L refrigerant with a concentration
of LFL/2, an open flame was generated at the gas lighter for several cases. However, this flame also failed to propagate
to the entire refrigerant. This trend was also confirmed for the other refrigerants.
flame
(a) R1234yf with LFL
flame
(b)R1234ze(E) with LFL
flame
(c)R32 with LFL
(d)R32 with LFL/2 (e)Air
Figure 3-6: Photos of the electronic piezo lighter and the surroundings near its outlet in the accumulated A2L
refrigerant.
- 73 -

3.3.3 Details of experimental evaluation of the possibility of ignition and flame propagation using
kerosene cigarette lighter
3.3.3.1 Outline
In the service and maintenance case of air conditioning systems containing A2L refrigerants, a kerosene cigarette lighter
was used as the ignition source. The fuel of the kerosene cigarette lighter always vaporized into the windbreak when the
cap was open. This point was the major difference compared to the piezo gas lighter. Further, the size of the open flame
was larger than that of the piezo gas lighter. We experimentally evaluated the possibility of ignition and flame propagation
to the accumulated A2L refrigerant using a commercial kerosene cigarette lighter. An article describing some of the details
of this topic was published in 20163-16).
3.3.3.2 Experiment
Figure 3-7 is a schematic diagram of the experimental setup. Difluoromethane (called “R32” in this report) was used as
the test A2L refrigerant. R32 was leaked downwards into an acrylic pool with dimensions of 1000 mm × 1000 mm × 1000
mm. A commercial kerosene cigarette lighter was located 300 mm above the center base of the pool. To ignite the kerosene
cigarette lighter remotely, an AC electric spark was generated at the gap of the electrodes (2-mm diameter stainless steel)
which was oriented near the wick in the windbreak by an inverter-type neon transformer (CR-N16, Kodera Electronics,
Co., Ltd., Gifu). A solid-state electrical relay (GSR-20L-D32Z, Misumi Group, Inc., Tokyo) was inserted into the power
supply circuit, and the electrical supply that activated the solid-state relay was controlled by means of a 5-Vp-p DC
rectangular wave generated by a function generator (33120A, Agilent Technologies, Santa Clara, CA). The electricity
was supplied to the solid-state electric relay for 50, 100, and 500 ms (referred to as the “energization time”). In each
ignition test, the switching action to energize the relay was repeated ten times at intervals of 5 s. The generated voltage
between the gap of the electrodes was measured by means of a high-voltage probe (P6015A, Tektronix Inc., Beaverton,
OR), and the generated current was measured by means of a current transformer (Model 2100, Pearson Electronics Inc.,
Palo Alto, CA).
Video recordings of the kerosene lighter and surroundings containing R32 were made using a high-speed camera
(FASTCAM SA-X; Photron Ltd., Tokyo), a digital video camera (HC-V520M, Panasonic Corporation, Osaka), and a
CCD camera (MTV-53KM21H, Mintron Enterprise, Co., Ltd., Taipei). The timing of the beginning of the solid-state relay
being energized and the commencement of the video recording by the high-speed camera was synchronized by means of
a trigger signal generated by the function generator.
A 220-g sample of R32 was leaked from a position 750 mm above the base of the pool at a leakage rate of 10 g/min.
Before the ignition test, the concentration of the accumulated R32 was measured by means of an FT/IR-4200 Fourier
Lighter 30
0
10
00
Solid state relay
AC100V
High-Speed camera
CCD camera
Digital video camera
Function generator
Neon transformer
Figure 3-7: Schematic diagram of the experimental setup for ignition test with a kerosene cigarette lighter. Unit:
mm.
- 74 -
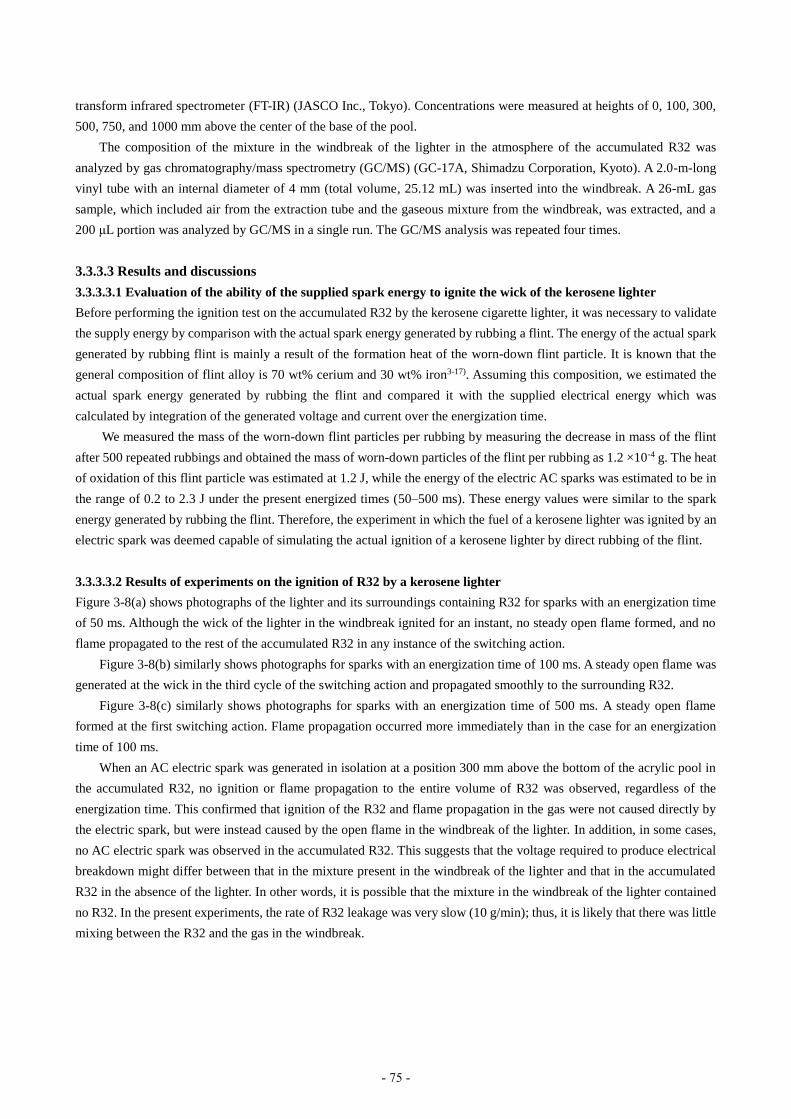
transform infrared spectrometer (FT-IR) (JASCO Inc., Tokyo). Concentrations were measured at heights of 0, 100, 300,
500, 750, and 1000 mm above the center of the base of the pool.
The composition of the mixture in the windbreak of the lighter in the atmosphere of the accumulated R32 was
analyzed by gas chromatography/mass spectrometry (GC/MS) (GC-17A, Shimadzu Corporation, Kyoto). A 2.0-m-long
vinyl tube with an internal diameter of 4 mm (total volume, 25.12 mL) was inserted into the windbreak. A 26-mL gas
sample, which included air from the extraction tube and the gaseous mixture from the windbreak, was extracted, and a
200 μL portion was analyzed by GC/MS in a single run. The GC/MS analysis was repeated four times.
3.3.3.3 Results and discussions
3.3.3.3.1 Evaluation of the ability of the supplied spark energy to ignite the wick of the kerosene lighter
Before performing the ignition test on the accumulated R32 by the kerosene cigarette lighter, it was necessary to validate
the supply energy by comparison with the actual spark energy generated by rubbing a flint. The energy of the actual spark
generated by rubbing flint is mainly a result of the formation heat of the worn-down flint particle. It is known that the
general composition of flint alloy is 70 wt% cerium and 30 wt% iron3-17). Assuming this composition, we estimated the
actual spark energy generated by rubbing the flint and compared it with the supplied electrical energy which was
calculated by integration of the generated voltage and current over the energization time.
We measured the mass of the worn-down flint particles per rubbing by measuring the decrease in mass of the flint
after 500 repeated rubbings and obtained the mass of worn-down particles of the flint per rubbing as 1.2 ×10⁻⁴ g. The heat
of oxidation of this flint particle was estimated at 1.2 J, while the energy of the electric AC sparks was estimated to be in
the range of 0.2 to 2.3 J under the present energized times (50–500 ms). These energy values were similar to the spark
energy generated by rubbing the flint. Therefore, the experiment in which the fuel of a kerosene lighter was ignited by an
electric spark was deemed capable of simulating the actual ignition of a kerosene lighter by direct rubbing of the flint.
3.3.3.3.2 Results of experiments on the ignition of R32 by a kerosene lighter
Figure 3-8(a) shows photographs of the lighter and its surroundings containing R32 for sparks with an energization time
of 50 ms. Although the wick of the lighter in the windbreak ignited for an instant, no steady open flame formed, and no
flame propagated to the rest of the accumulated R32 in any instance of the switching action.
Figure 3-8(b) similarly shows photographs for sparks with an energization time of 100 ms. A steady open flame was
generated at the wick in the third cycle of the switching action and propagated smoothly to the surrounding R32.
Figure 3-8(c) similarly shows photographs for sparks with an energization time of 500 ms. A steady open flame
formed at the first switching action. Flame propagation occurred more immediately than in the case for an energization
time of 100 ms.
When an AC electric spark was generated in isolation at a position 300 mm above the bottom of the acrylic pool in
the accumulated R32, no ignition or flame propagation to the entire volume of R32 was observed, regardless of the
energization time. This confirmed that ignition of the R32 and flame propagation in the gas were not caused directly by
the electric spark, but were instead caused by the open flame in the windbreak of the lighter. In addition, in some cases,
no AC electric spark was observed in the accumulated R32. This suggests that the voltage required to produce electrical
breakdown might differ between that in the mixture present in the windbreak of the lighter and that in the accumulated
R32 in the absence of the lighter. In other words, it is possible that the mixture in the windbreak of the lighter contained
no R32. In the present experiments, the rate of R32 leakage was very slow (10 g/min); thus, it is likely that there was little
mixing between the R32 and the gas in the windbreak.
- 75 -
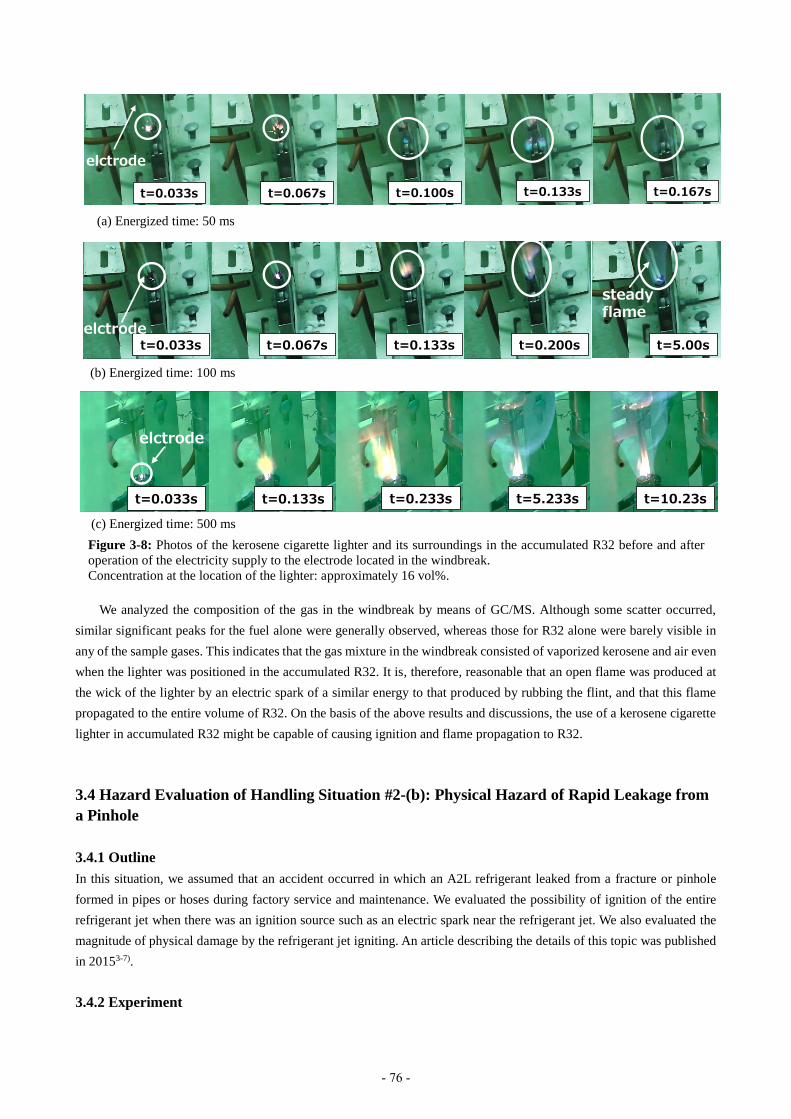
We analyzed the composition of the gas in the windbreak by means of GC/MS. Although some scatter occurred,
similar significant peaks for the fuel alone were generally observed, whereas those for R32 alone were barely visible in
any of the sample gases. This indicates that the gas mixture in the windbreak consisted of vaporized kerosene and air even
when the lighter was positioned in the accumulated R32. It is, therefore, reasonable that an open flame was produced at
the wick of the lighter by an electric spark of a similar energy to that produced by rubbing the flint, and that this flame
propagated to the entire volume of R32. On the basis of the above results and discussions, the use of a kerosene cigarette
lighter in accumulated R32 might be capable of causing ignition and flame propagation to R32.
3.4 Hazard Evaluation of Handling Situation #2-(b): Physical Hazard of Rapid Leakage from
a Pinhole
3.4.1 Outline
In this situation, we assumed that an accident occurred in which an A2L refrigerant leaked from a fracture or pinhole
formed in pipes or hoses during factory service and maintenance. We evaluated the possibility of ignition of the entire
refrigerant jet when there was an ignition source such as an electric spark near the refrigerant jet. We also evaluated the
magnitude of physical damage by the refrigerant jet igniting. An article describing the details of this topic was published
in 20153-7).
3.4.2 Experiment
t=0.067s t=0.100s t=0.133s t=0.167s
elctrode
t=0.033s
t=0.033s t=0.067s t=0.133s t=0.200s t=5.00s
elctrode
steady flame
(a) Energized time: 50 ms
(b) Energized time: 100 ms
t=0.133s t=0.233s t=5.233s t=10.23st=0.033s
elctrode
(c) Energized time: 500 ms
Figure 3-8: Photos of the kerosene cigarette lighter and its surroundings in the accumulated R32 before and after
operation of the electricity supply to the electrode located in the windbreak.
Concentration at the location of the lighter: approximately 16 vol%.
- 76 -

3.4.2.1 Refrigerant leakage system
The model leakage system consisted of a refrigerant cylinder, a balance, a regulator, a pressure gage, and a pinhole unit.
These components were connected by copper and stainless steel tubes. The outside diameter of the tubes was 6.35 mmϕ
(1/4”). Leak pressure was monitored by means of a pressure gage (PGI63B-MG2.5-LAQX, Swagelok Company, Solon,
OH) and a strain-gage type pressure transmitter (PGS-20KA, Kyowa Electric Instruments, Co., Ltd., Tokyo). The pinhole
was modeled using a cap-type coupling (1/4”, SS-400-C, Swagelok Company) with a hole in the center. Two patterns
were used for the shape of the hole: a circular pinhole and a rectangular slit. The diameter of the pinhole ranged over the
values 0.2, 1.0, 3.0, and 4.0 mm, and the size of the rectangular slit was 1.0 mm × 4.0 mm.
3.4.2.2 Concentration measuring system
Before conducting the ignition experiment, concentrations of the leaked refrigerant jet were measured using five
ultrasonic gas analyzers (US-II-T-S, Daiichi Nekken Co., Ltd., Hyogo). The concentration was estimated from the average
molecular weight, specific heat ratio, gas constant, and temperature. Concentrations were measured at 50, 100, 150, 250,
and 500 mm in the downstream direction and -50, 0, and 50 mm in the vertical direction from the center of the pinhole,
i.e., the concentrations of refrigerant were measured at 15 positions as shown in Figure 3-9(a). Because the refrigerant
concentrations could only be measured at five positions at any given time, the refrigerant concentrations at the 15 positions
were measured in groups of five by switching the valves. Positive height values indicate distances above the center of a
pinhole, whereas negative values indicate distances below the pinhole. Refrigerant concentrations were measured for 30
s at each position because the refrigerant concentrations attained an approximate uniform value within a period of less
than 30 s after the opening of the valve.
3.4.2.3 Ignition experiment
In the ignition experiment, a single spark, a repetitive spark, and an open flame were used as ignition sources. The single
spark was generated using a high-voltage system (MEL1140B, Genesis Co., Ltd., Ibaraki). The designed energy of the
spark was approximately 10 J. The continuous spark was generated using an inverter-type neon transformer (CR-N16,
Kodera Electronics, Co., Ltd., Gifu). In the repetitive spark case, the discharge time was varied over the range of 15 to 30
s, thus the total supply energy was more than the approximate order of 100 J. The length of the open flame was about 100
mm. These ignition sources were located 90 mm downstream from the center of the pinhole at the same height as the
center of the pinhole.
In the ignition experiments, temperatures were measured at 25 points by means of 0.32-mmϕ K-type thermocouples,
heat fluxes were measured using nine heat flux sensors (TG2000-2, Vatell Co., Ltd., Christiansburg, VA), and sound
pressures were measured using three microphones (378B02, PCB Piezotronics Inc., Depew, NY). The measured positions
of these parameters are shown in Figure 3-9(b). The response time of the thermocouple and heat flux sensor was
approximately 1–2 s and 1.5 ms, respectively.
3.4.2.4 Experimental conditions
The effects of various refrigerants, pinhole diameters, refrigerant mass flow rates, and varieties of ignition sources on the
formation of flame and damage by combustion were examined experimentally. R1234yf, R1234ze(E), and R32 were used
as test refrigerants. Refrigerant leakages were in the gas phase state. Lists of the experimental conditions for the
concentration measurements and the ignition experiment are given in Table 3-1 and Table 3-2, respectively. A 4-mm-
diameter pinhole was chosen to represent the case in which the pipe or hose had broken completely, and a 0.2-mm-
diameter pinhole was chosen to represent the case where a slight crack formed in a pipe or hose. In the cases shown by
shading in Table 3-1, the refrigerant was leaked directly from a cylinder without passing through a regulator. Although
the vapor pressure of the refrigerant is comparatively lower than the maximum operating pressure of a refrigerant in an
air conditioning system, the air conditioning system would not be operational during service and maintenance. In addition,
- 77 -

leakage from a 4-mm-diameter hole hardly ever occurs except when there is a complete fracture of a pipe or hose. On the
basis of these considerations, the case of a refrigerant leaking at its vapor pressure from a 4-mm-diameter pinhole was
Concentration meter
500
50
50
250
150100
50
Refrigerant
Regulator
Pressure gagePressure transducer
Nozzle 50
50
100
100100
50100
150250
500
50
50
50
K-type thermocouple(φ0.32 mm)
Heat flux gage(Vatell, TG2000-0-2)
Sound pressure sensor(PCB 378B02)
Ignition sourceNozzle
(a) Concentration measurement (b) Ignition experiment
Figure 3-9: Schematic diagram of the experimental setup and measurement positions of concentration, temperature,
heat flux, and sound pressure. Unit: mm
Experiment No. RefrigerantPinhole diameter
(mm)
Mass flow rate
(g/min)
J20-38 0.2 47.5
J20-08 82.5
J19-01 66.7
J20-03 116.7
J20-04 126.7
J20-09 297.5
J20-05 110.0
J20-10 195.0
J20-11 540.0
J20-07 82.5
J20-13 187.5
J20-06 97.5
J20-12 245.0
J20-24 5.0
J20-25 17.5
J20-14 107.5
J20-19 122.5
J20-15 140.0
J20-20 542.5
J20-16 115.0
J20-21 472.5
J20-18 130.0
J20-23 335.0
J20-17 137.5
J20-22 320.0
J20-31 5.0
J20-32 22.5
J20-26 82.5
J20-33 97.5
J20-27 97.5
J20-34 272.5
J20-28 87.5
J20-35 192.5
J20-30 85.0
J20-37 92.5
J20-29 85.0
J20-36 102.5
1
4
1x4hor
1x4ver
1
4
3
R32
R1234yf
R1234ze (E)
3
1x4hor
1x4ver
0.2
1
3
4
1x4hor
1x4ver
0.2
Table 3-1: List of experimental conditions for
concentration measurement for situation #2-(b).
Experiment
No.Refrigerant
Pinhole
diameter
(mm)
Ignition
Source
Mass flow
rate (g/min)
J22-21 Ne-TR 260.0
J22-27 Spark 172.5
J22-22 Ne-TR 726.7
J22-28 Spark 600.0
J21-01 285.0
J21-02 250.0
J21-03 N.D.
J21-04 Ne-TR 670.0
J21-05 Openflame N.D.(*)
J22-25 Ne-TR 413.3
J22-26 Spark 847.5
J22-24 1x4 hor Ne-TR 386.7
J22-23 Ne-TR 433.3
J22-29 Spark 367.5
J22-11 1 Ne-TR 106.7
J22-12 3 Ne-TR 400.0
J21-07 Spark 580.0
J21-08 500.0
J21-09 500.0
J21-10 650.0
J22-14 1x4 hor Ne-TR 346.7
J22-13 1x4 ver Ne-TR 353.3
J22-15 1 Ne-TR 120.0
J22-16 3 Ne-TR 260.0
J22-17 4 Ne-TR 220.0
J22-20 1x4 hor Ne-TR 260.0
J22-18 140.0
J22-19 213.3
R1234ze (E)
1x4 ver
Spark
Ne-TR
Ne-TR
R32
1
3
4
1x4 ver
4R1234yf
Table 3-2: List of experimental conditions for
ignition measurement for situation #2-(b).
- 78 -
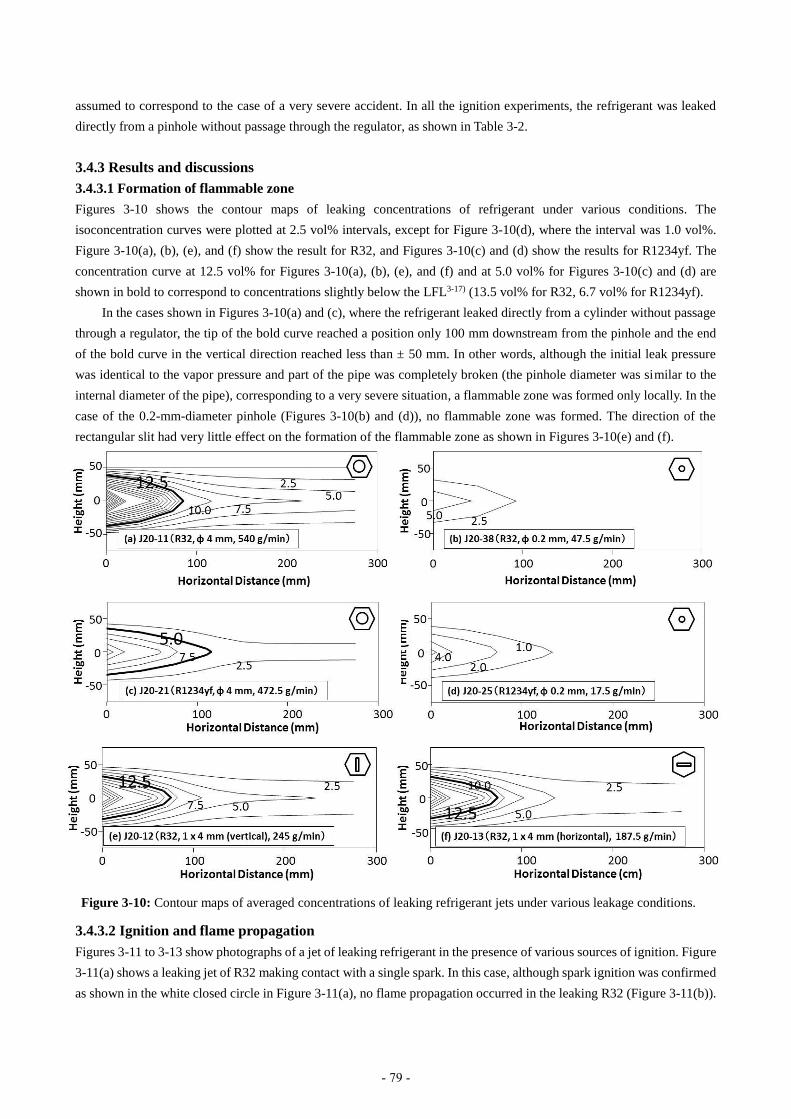
assumed to correspond to the case of a very severe accident. In all the ignition experiments, the refrigerant was leaked
directly from a pinhole without passage through the regulator, as shown in Table 3-2.
3.4.3 Results and discussions
3.4.3.1 Formation of flammable zone
Figures 3-10 shows the contour maps of leaking concentrations of refrigerant under various conditions. The
isoconcentration curves were plotted at 2.5 vol% intervals, except for Figure 3-10(d), where the interval was 1.0 vol%.
Figure 3-10(a), (b), (e), and (f) show the result for R32, and Figures 3-10(c) and (d) show the results for R1234yf. The
concentration curve at 12.5 vol% for Figures 3-10(a), (b), (e), and (f) and at 5.0 vol% for Figures 3-10(c) and (d) are
shown in bold to correspond to concentrations slightly below the LFL3-17) (13.5 vol% for R32, 6.7 vol% for R1234yf).
In the cases shown in Figures 3-10(a) and (c), where the refrigerant leaked directly from a cylinder without passage
through a regulator, the tip of the bold curve reached a position only 100 mm downstream from the pinhole and the end
of the bold curve in the vertical direction reached less than ± 50 mm. In other words, although the initial leak pressure
was identical to the vapor pressure and part of the pipe was completely broken (the pinhole diameter was similar to the
internal diameter of the pipe), corresponding to a very severe situation, a flammable zone was formed only locally. In the
case of the 0.2-mm-diameter pinhole (Figures 3-10(b) and (d)), no flammable zone was formed. The direction of the
rectangular slit had very little effect on the formation of the flammable zone as shown in Figures 3-10(e) and (f).
3.4.3.2 Ignition and flame propagation
Figures 3-11 to 3-13 show photographs of a jet of leaking refrigerant in the presence of various sources of ignition. Figure
3-11(a) shows a leaking jet of R32 making contact with a single spark. In this case, although spark ignition was confirmed
as shown in the white closed circle in Figure 3-11(a), no flame propagation occurred in the leaking R32 (Figure 3-11(b)).
Figure 3-10: Contour maps of averaged concentrations of leaking refrigerant jets under various leakage conditions.
- 79 -

Neither ignition nor flame propagation to the refrigerant was observed with R1234yf or R1234ze(E). In the case shown
in Figure 3-12, the jet of leaking R32 made contact with a continuous spark. At the start of the refrigerant leak, a pale-
violet emission was observed around the electrode (Figure 3-12(a)) which grew with time, although it was pushed away
in the downstream direction (Figures 3-12(b) and (c)). However, as the temperature of the leaking refrigerant decreased
Figure 3-12: Photographs of leaking refrigerant jet in contact with a continuous spark.
Refrigerant: R32; Pinhole: 4 mmϕ; Leak pressure: 0.66 MPa.
Figure 3-11: Photographs of leaking refrigerant jet in contact with a single spark.
Refrigerant: R32; Pinhole: 4 mmϕ; Leak pressure: 0.81 MPa.
Figure 3-13: Photographs of leaking refrigerant jet in contact with an open flame.
Refrigerant: R32; Pinhole: 4 mmϕ; Leak pressure: 1.16 MPa.
Pinhole Open flame
Leak direction
(a) Leak start(t = 0 s)
(b) t= 33 ms (c) t= 66 ms
- 80 -

with time, the leaking refrigerant produced a fog, and a pale-violet emission became barely visible (Figures 3-12(d) and
(e)). With the further passage of time and the formation of a steady jet of leaking refrigerant, the pale-violet emission was
again observed, but only locally around the electrode, but flame propagation to the entire refrigerant jet was not observed
(Figure 3-12(f)). In Figure 3-13, the jet of leaking R32 made contact with an open flame. When the leak started, although
an open flame was formed vertically at first (Figure 3-13(a)), it was gradually pushed away in the downstream direction,
and a pale-violet emission appeared at the bottom of the open flame (Figure 3-13(b)). The pale-violet emission, which is
characteristic of burning R32, then appeared, and the bright emission of the open flame disappeared (Figure 3-13(c)).
However, immediately afterwards, the pale-violet emission disappeared, and no flame propagation to the bulk of
refrigerant was observed. The open flame was therefore blown off.
3.4.3.3 Physical effects: temperature, heat flux, and combustion products
Figure 3-14(a) shows the temporal history of the temperature at the same height as the center of the pinhole when R32
was leaked at a pressure of 1.06 MPa from a 4-mm-diameter pinhole. The ignition source was a continuous spark. Because
the diameter of the thermocouple was 0.32 mmϕ, its response might not have been capable of following sudden
temperature variations. Therefore, temperature data immediately following the start of the leakage were not always
reliable. However, if the leaked refrigerant was ignited by the continuous spark and a flame propagated to the entire leaked
refrigerant jet, the temperature at the same height as the center of the pinhole should show a significant increase; but this
was not observed as can be seen in Figure 3-14(a).
Figure 3-14(b) shows the variation in the heat flux 100 mm from the central axis in the lateral direction. The
surroundings around the leaked refrigerant jet were cooled as a result of the temperature decrease of the leaked refrigerant
jet, resulting in the appearance of negative heat flux values. However, no significant increase in the heat flux was observed
at this or any other measurement position.
The concentration of the HF produced from combustion was monitored by means of a portable gas analyzer (SC-70,
Riken Keiki Co., Ltd., Tokyo). HF was generated at concentrations below the alarm concentration of 3 ppm. Similar
properties were observed under all the experimental conditions examined.
3.5 Hazard Evaluation of Handling Situation #2-(c): Physical Hazard of Leakage into the
Collection Device
3.5.1 Outline
0
2
4
6
8
10
12
14
16
-10 -5 0 5 10 15 20
tem
pe
ratu
re (℃
)
time since commencement of leakage (s)
(a)
-0.2
-0.15
-0.1
-0.05
0
0.05
-5 0 5 10 15 20
he
at f
lux
(W/c
m2)
time since commencement of leakage (s)
50 mmdownstream
100 mmdownstream
150 mmdownstream
(b)
Figure 3-14: Temporal histories of temperature and heat flux at the same height as the center of the pinhole.
Refrigerant: R32; pinhole: 4 mmϕ; leak pressure: 1.06 MPa; ignition source: continuous spark.
- 81 -
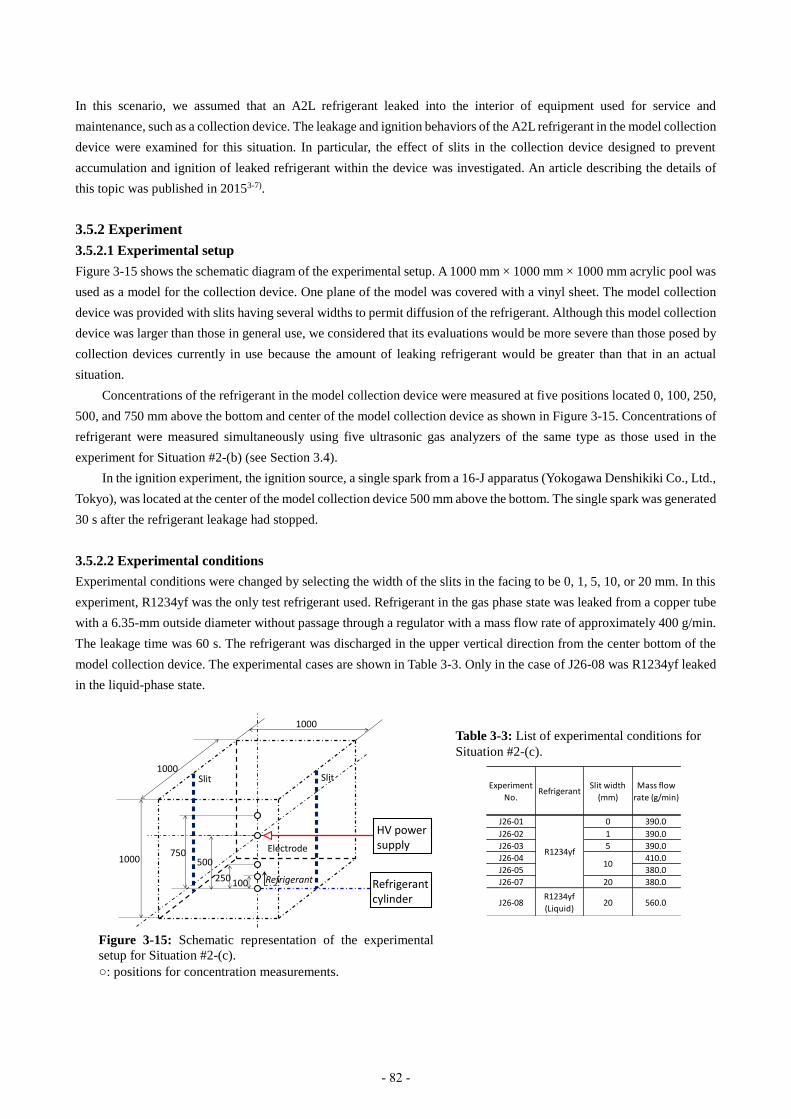
In this scenario, we assumed that an A2L refrigerant leaked into the interior of equipment used for service and
maintenance, such as a collection device. The leakage and ignition behaviors of the A2L refrigerant in the model collection
device were examined for this situation. In particular, the effect of slits in the collection device designed to prevent
accumulation and ignition of leaked refrigerant within the device was investigated. An article describing the details of
this topic was published in 20153-7).
3.5.2 Experiment
3.5.2.1 Experimental setup
Figure 3-15 shows the schematic diagram of the experimental setup. A 1000 mm × 1000 mm × 1000 mm acrylic pool was
used as a model for the collection device. One plane of the model was covered with a vinyl sheet. The model collection
device was provided with slits having several widths to permit diffusion of the refrigerant. Although this model collection
device was larger than those in general use, we considered that its evaluations would be more severe than those posed by
collection devices currently in use because the amount of leaking refrigerant would be greater than that in an actual
situation.
Concentrations of the refrigerant in the model collection device were measured at five positions located 0, 100, 250,
500, and 750 mm above the bottom and center of the model collection device as shown in Figure 3-15. Concentrations of
refrigerant were measured simultaneously using five ultrasonic gas analyzers of the same type as those used in the
experiment for Situation #2-(b) (see Section 3.4).
In the ignition experiment, the ignition source, a single spark from a 16-J apparatus (Yokogawa Denshikiki Co., Ltd.,
Tokyo), was located at the center of the model collection device 500 mm above the bottom. The single spark was generated
30 s after the refrigerant leakage had stopped.
3.5.2.2 Experimental conditions
Experimental conditions were changed by selecting the width of the slits in the facing to be 0, 1, 5, 10, or 20 mm. In this
experiment, R1234yf was the only test refrigerant used. Refrigerant in the gas phase state was leaked from a copper tube
with a 6.35-mm outside diameter without passage through a regulator with a mass flow rate of approximately 400 g/min.
The leakage time was 60 s. The refrigerant was discharged in the upper vertical direction from the center bottom of the
model collection device. The experimental cases are shown in Table 3-3. Only in the case of J26-08 was R1234yf leaked
in the liquid-phase state.
Refrigerant
HV power supply
Refrigerant cylinder
1000
1000
1000
SlitSlit
Electrode
100250
500750
Figure 3-15: Schematic representation of the experimental
setup for Situation #2-(c).
○: positions for concentration measurements.
Experiment
No.Refrigerant
Slit width
(mm)
Mass flow
rate (g/min)
J26-01 0 390.0
J26-02 1 390.0
J26-03 5 390.0
J26-04 410.0
J26-05 380.0
J26-07 20 380.0
J26-08R1234yf
(Liquid)20 560.0
R1234yf
10
Table 3-3: List of experimental conditions for
Situation #2-(c).
- 82 -
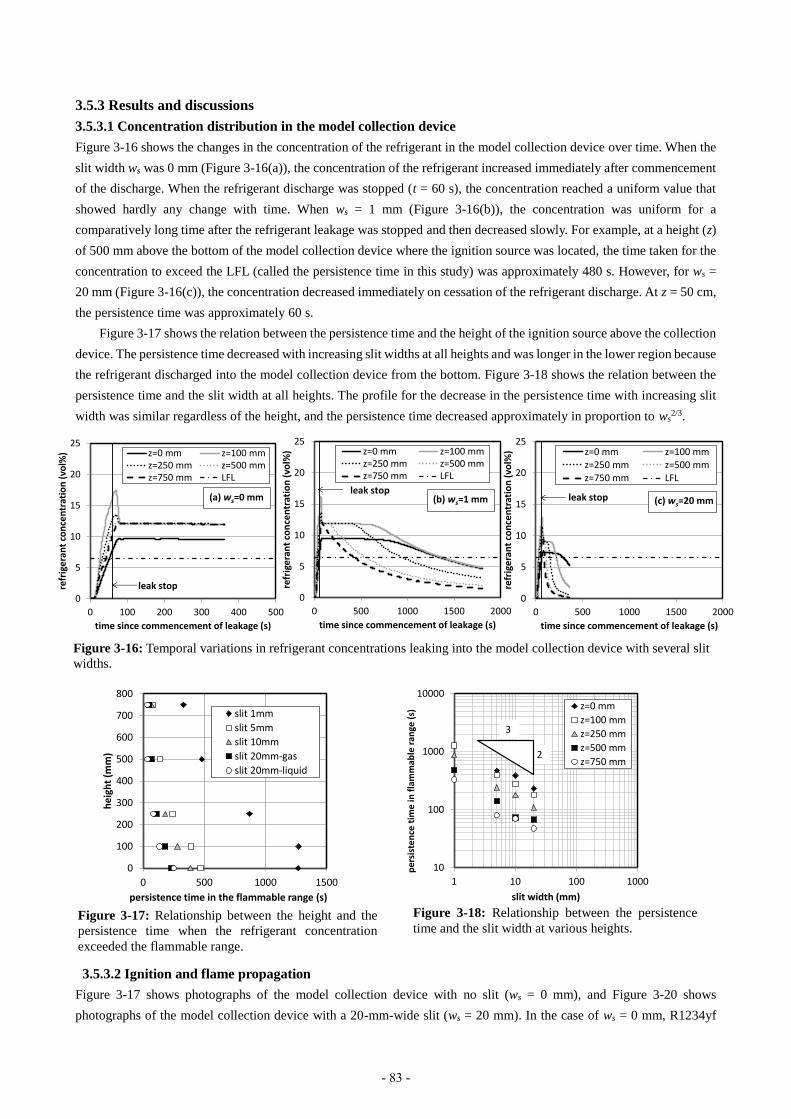
3.5.3 Results and discussions
3.5.3.1 Concentration distribution in the model collection device
Figure 3-16 shows the changes in the concentration of the refrigerant in the model collection device over time. When the
slit width ws was 0 mm (Figure 3-16(a)), the concentration of the refrigerant increased immediately after commencement
of the discharge. When the refrigerant discharge was stopped (t = 60 s), the concentration reached a uniform value that
showed hardly any change with time. When ws = 1 mm (Figure 3-16(b)), the concentration was uniform for a
comparatively long time after the refrigerant leakage was stopped and then decreased slowly. For example, at a height (z)
of 500 mm above the bottom of the model collection device where the ignition source was located, the time taken for the
concentration to exceed the LFL (called the persistence time in this study) was approximately 480 s. However, for ws =
20 mm (Figure 3-16(c)), the concentration decreased immediately on cessation of the refrigerant discharge. At z = 50 cm,
the persistence time was approximately 60 s.
Figure 3-17 shows the relation between the persistence time and the height of the ignition source above the collection
device. The persistence time decreased with increasing slit widths at all heights and was longer in the lower region because
the refrigerant discharged into the model collection device from the bottom. Figure 3-18 shows the relation between the
persistence time and the slit width at all heights. The profile for the decrease in the persistence time with increasing slit
width was similar regardless of the height, and the persistence time decreased approximately in proportion to ws2/3.
3.5.3.2 Ignition and flame propagation
Figure 3-17 shows photographs of the model collection device with no slit (ws = 0 mm), and Figure 3-20 shows
photographs of the model collection device with a 20-mm-wide slit (ws = 20 mm). In the case of ws = 0 mm, R1234yf
0
5
10
15
20
25
0 500 1000 1500 2000
refr
ige
ran
t co
nce
ntr
atio
n(v
ol%
)
time since commencement of leakage (s)
z=0 mm z=100 mmz=250 mm z=500 mmz=750 mm LFL
(c) ws=20 mmleak stop
0
5
10
15
20
25
0 500 1000 1500 2000
refr
ige
ran
t co
nce
ntr
atio
n(v
ol%
)
time since commencement of leakage (s)
z=0 mm z=100 mmz=250 mm z=500 mmz=750 mm LFL
(b) ws=1 mmleak stop
0
5
10
15
20
25
0 100 200 300 400 500
refr
ige
ran
t co
nce
ntr
atio
n(v
ol%
)
time since commencement of leakage (s)
z=0 mm z=100 mmz=250 mm z=500 mmz=750 mm LFL
(a) ws=0 mm
leak stop
Figure 3-16: Temporal variations in refrigerant concentrations leaking into the model collection device with several slit
widths.
0
100
200
300
400
500
600
700
800
0 500 1000 1500
he
igh
t (m
m)
persistence time in the flammable range (s)
slit 1mm
slit 5mm
slit 10mm
slit 20mm-gas
slit 20mm-liquid
Figure 3-17: Relationship between the height and the
persistence time when the refrigerant concentration
exceeded the flammable range.
10
100
1000
10000
1 10 100 1000
pe
rsis
ten
ce t
ime
in f
lam
mab
le r
ange
(s)
slit width (mm)
z=0 mm
z=100 mm
z=250 mm
z=500 mm
z=750 mm
3
2
Figure 3-18: Relationship between the persistence
time and the slit width at various heights.
- 83 -

near the ignition source ignited, and a pale-violet flame propagated in the upward vertical direction as a result of the
buoyancy generated by the R1234yf flame. When the R1234yf flame made contact with the roof of the model collection
device, the pale-violet flame propagated horizontally and downward, but the flame did not propagate immediately to the
unburned R1234yf because the burning velocity of R1234yf is very small and the supply of oxygen needed for combustion
was limited. As a result, the pale-violet flame and unburned R1234yf reached equilibrium at a certain height. Later, the
vinyl sheet covering the side plane burned, allowing fresh air to flow into the model collection device; at this stage, the
flame propagated throughout the model collection device.
In the case of ws = 20 mm, however, although an ignition spark was generated during the period when the refrigerant
concentration exceeded the LFL, ignition and flame propagation were not observed. The reason for this might be the flow
of R1234yf in the model collection device. The burning velocity of R1234yf is very low, so the flame cannot propagate
throughout the R1234yf present in the model collection device.
3.6 Hazard Evaluation of Handling Situation #2-(d): Diesel Combustion of Oil Refrigerant
Mixture during Pump-Down of Air Conditioner
3.6.1 Background
During pump-down operation (refrigerant collection), self-ignition accidents caused by air leaking into the refrigerant
and lubricating oil mixture and a temperature rise by adiabatic compression may happen. Several incidents of outdoor air
conditioning units exploding during pump-down have been reported3-19)3-20). R1234yf and R32 are drawing attention as
low-global warming potential (GWP) refrigerants; however, because of their mild flammability, a safety estimation
comparison to R410A (conventional non-flammable refrigerant) is necessary. In this research, we investigated the
Figure 3-19: Photographs of the model collection device with no slit after generation of a spark. Refrigerant: R1234yf;
Leak rate: 380 g/min; Energy of the ignition spark: ~16 J. Variable t is the time after generation of the ignition spark.
(a) t = 0s (b) t = 0.5s (c) t = 1.5s
(d) t = 2.5s (e) t = 4.5s (f) t = 5.5s
(a) t = 0s (b) t = 0.5s (c) t = 1.5s
Figure 3-20: Photographs of the model collection device with a 20-mm slit after generation of a spark. Refrigerant:
R1234yf; Leak rate: 380 g/min; Energy of ignition spark: ~16 J.
- 84 -
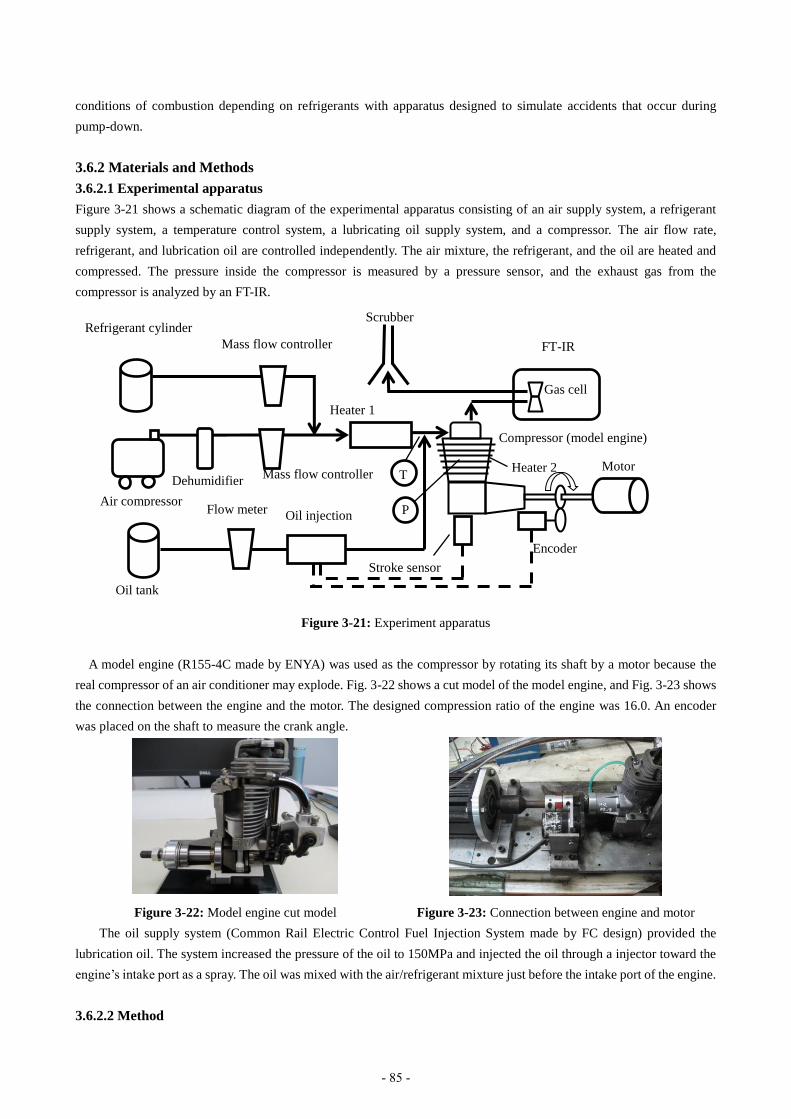
conditions of combustion depending on refrigerants with apparatus designed to simulate accidents that occur during
pump-down.
3.6.2 Materials and Methods
3.6.2.1 Experimental apparatus
Figure 3-21 shows a schematic diagram of the experimental apparatus consisting of an air supply system, a refrigerant
supply system, a temperature control system, a lubricating oil supply system, and a compressor. The air flow rate,
refrigerant, and lubrication oil are controlled independently. The air mixture, the refrigerant, and the oil are heated and
compressed. The pressure inside the compressor is measured by a pressure sensor, and the exhaust gas from the
compressor is analyzed by an FT-IR.
Figure 3-21: Experiment apparatus
A model engine (R155-4C made by ENYA) was used as the compressor by rotating its shaft by a motor because the
real compressor of an air conditioner may explode. Fig. 3-22 shows a cut model of the model engine, and Fig. 3-23 shows
the connection between the engine and the motor. The designed compression ratio of the engine was 16.0. An encoder
was placed on the shaft to measure the crank angle.
Figure 3-22: Model engine cut model
Figure 3-23: Connection between engine and motor
The oil supply system (Common Rail Electric Control Fuel Injection System made by FC design) provided the
lubrication oil. The system increased the pressure of the oil to 150MPa and injected the oil through a injector toward the
engine’s intake port as a spray. The oil was mixed with the air/refrigerant mixture just before the intake port of the engine.
3.6.2.2 Method
Stroke sensor
Encoder
Compressor (model engine)
Heater 2
Scrubber
FT-IR
Oil injection
Oil tank
Flow meter
Dehumidifier
Air compressor
Mass flow controller
Heater 1
Refrigerant cylinder
Mass flow controller
Motor
Gas cell
T
P
- 85 -
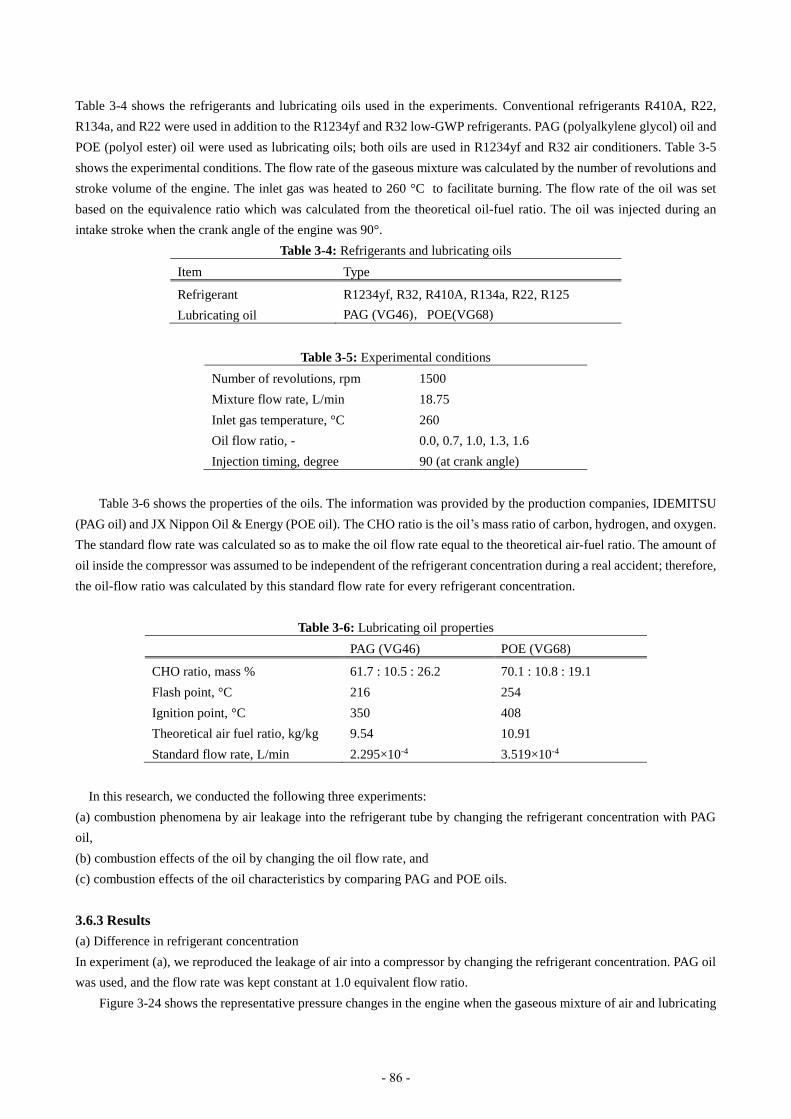
Table 3-4 shows the refrigerants and lubricating oils used in the experiments. Conventional refrigerants R410A, R22,
R134a, and R22 were used in addition to the R1234yf and R32 low-GWP refrigerants. PAG (polyalkylene glycol) oil and
POE (polyol ester) oil were used as lubricating oils; both oils are used in R1234yf and R32 air conditioners. Table 3-5
shows the experimental conditions. The flow rate of the gaseous mixture was calculated by the number of revolutions and
stroke volume of the engine. The inlet gas was heated to 260 °C to facilitate burning. The flow rate of the oil was set
based on the equivalence ratio which was calculated from the theoretical oil-fuel ratio. The oil was injected during an
intake stroke when the crank angle of the engine was 90°.
Table 3-4: Refrigerants and lubricating oils
Item Type
Refrigerant R1234yf, R32, R410A, R134a, R22, R125
Lubricating oil PAG (VG46),POE(VG68)
Table 3-5: Experimental conditions
Number of revolutions, rpm 1500
Mixture flow rate, L/min 18.75
Inlet gas temperature, °C 260
Oil flow ratio, - 0.0, 0.7, 1.0, 1.3, 1.6
Injection timing, degree 90 (at crank angle)
Table 3-6 shows the properties of the oils. The information was provided by the production companies, IDEMITSU
(PAG oil) and JX Nippon Oil & Energy (POE oil). The CHO ratio is the oil’s mass ratio of carbon, hydrogen, and oxygen.
The standard flow rate was calculated so as to make the oil flow rate equal to the theoretical air-fuel ratio. The amount of
oil inside the compressor was assumed to be independent of the refrigerant concentration during a real accident; therefore,
the oil-flow ratio was calculated by this standard flow rate for every refrigerant concentration.
Table 3-6: Lubricating oil properties
PAG (VG46) POE (VG68)
CHO ratio, mass % 61.7 : 10.5 : 26.2 70.1 : 10.8 : 19.1
Flash point, °C 216 254
Ignition point, °C 350 408
Theoretical air fuel ratio, kg/kg 9.54 10.91
Standard flow rate, L/min 2.295×10⁻⁴ 3.519×10⁻⁴
In this research, we conducted the following three experiments:
(a) combustion phenomena by air leakage into the refrigerant tube by changing the refrigerant concentration with PAG
oil,
(b) combustion effects of the oil by changing the oil flow rate, and
(c) combustion effects of the oil characteristics by comparing PAG and POE oils.
3.6.3 Results
(a) Difference in refrigerant concentration
In experiment (a), we reproduced the leakage of air into a compressor by changing the refrigerant concentration. PAG oil
was used, and the flow rate was kept constant at 1.0 equivalent flow ratio.
Figure 3-24 shows the representative pressure changes in the engine when the gaseous mixture of air and lubricating
- 86 -

oil was compressed. The horizontal axis shows the crank angle, which reached top dead center at 360°. The figure shows
a crank-angle range of 180° to 540° to focus on the compression and expansion stroke. The vertical axis shows the absolute
pressure. The pressure plots were placed every 0.5°. The blue dots represent the pressure when the air was compressed
without the oil. The pressure rose by adiabatic compression during the compression stroke when the crank angle was
between 180° and 360°, reached a maximum at the top dead center, and descended during the expansion stroke when the
crank angle was between 360° and 540°. The engine ran smoothly at this time. The red dots represent the pressure when
the air/oil mixture was compressed; the pressure rose higher than that of the air compressed without oil, and a loud noise
and strong vibration were observed. It was assumed that the lubricating oil self-ignited.
Figure 3-24: Change of pressure inside engine against crank angle with and without oil
Figure 3-25 shows the representative pressure changes in the engine when the gaseous mixture of the air and the
refrigerant was compressed. The refrigerant used was R1234yf. The blue, red, and green dots represent the pressure with
refrigerant concentrations of 0%, 20%, and 65%, respectively. The maximum pressure increased as the refrigerant
concentration decreased, presumably because of the difference between the specific heat ratio of the air and that of the
refrigerant. Combustion did not occur, and the rotation of the engine was smooth regardless of the refrigerant
concentration. No elements were produced by the refrigerant combustion. These tendencies were similar for all of the
refrigerants. These results show that refrigerants do not self-ignite without lubricating oil.
Figure 3-26 shows the representative pressure changes in the engine when the gaseous mixture of air, refrigerant
R1234yf, and lubricating oil was compressed; the blue, red, and green dots represent the pressure with refrigerant
concentrations of 0%, 20%, and 65%, respectively. When the refrigerant concentration was 65%, similar to the case of
compressed air with no oil, no combustion was observed. When the refrigerant concentration was 20%, the pressure in
the engine rose drastically, and both intense noise and vibration were observed; it is assumed that the refrigerant burned.
When the refrigerant concentration was 0%, the oil burned with a pattern similar to that shown in Fig. 3-24.
Combustion did not occur with high refrigerant concentration, and the maximum pressure increased as the refrigerant
concentration decreased. Combustion occurred when the refrigerant concentration was lower than a certain amount. The
maximum pressure decreased as the refrigerant concentration decreased further. These results were similar to the those of
R32, R410A, r134a, and R22; however, the refrigerant concentration where combustion occurred and the maximum
pressure differed depending on the refrigerant. However, in the case of the R125 refrigerant, despite its low concentration
and lower maximum pressure, no drastic combustion was observed.
2.5
2.0
1.5
1.0
0.5
0.0
Pre
ssu
re [
MP
a]
540480420360300240180
Angle [degree]
without oil
with oil
- 87 -
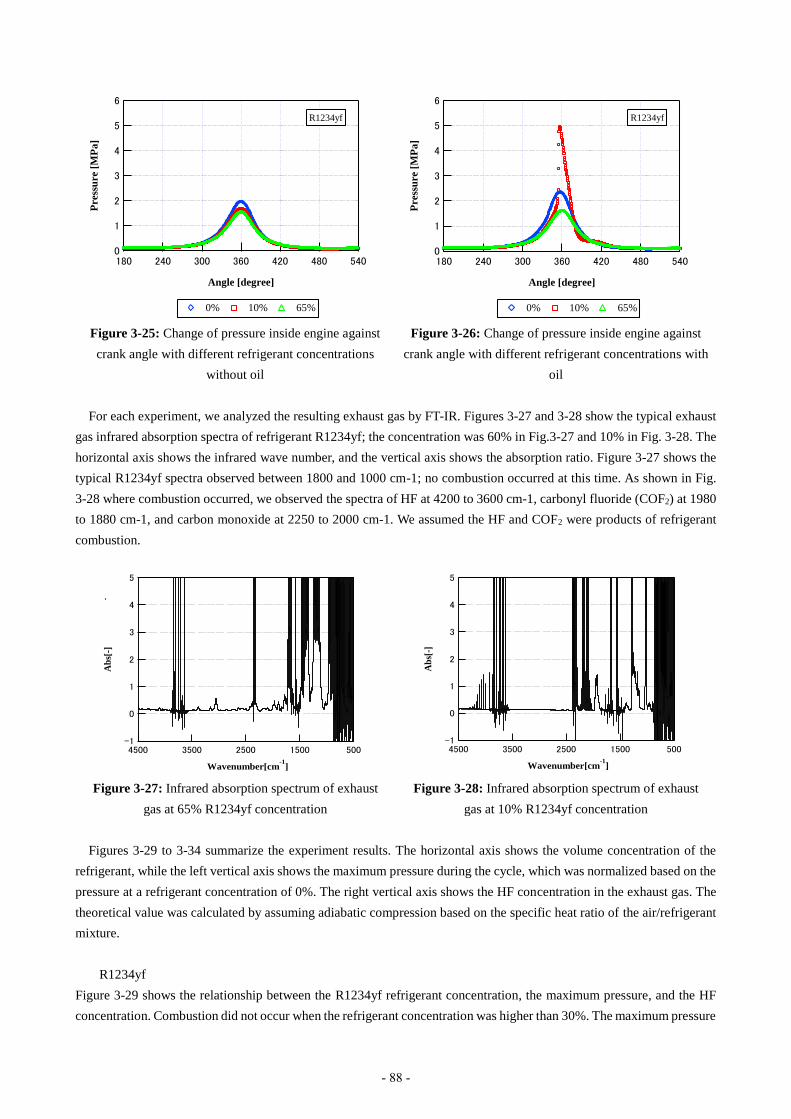
Figure 3-25: Change of pressure inside engine against
crank angle with different refrigerant concentrations
without oil
Figure 3-26: Change of pressure inside engine against
crank angle with different refrigerant concentrations with
oil
For each experiment, we analyzed the resulting exhaust gas by FT-IR. Figures 3-27 and 3-28 show the typical exhaust
gas infrared absorption spectra of refrigerant R1234yf; the concentration was 60% in Fig.3-27 and 10% in Fig. 3-28. The
horizontal axis shows the infrared wave number, and the vertical axis shows the absorption ratio. Figure 3-27 shows the
typical R1234yf spectra observed between 1800 and 1000 cm-1; no combustion occurred at this time. As shown in Fig.
3-28 where combustion occurred, we observed the spectra of HF at 4200 to 3600 cm-1, carbonyl fluoride (COF2) at 1980
to 1880 cm-1, and carbon monoxide at 2250 to 2000 cm-1. We assumed the HF and COF2 were products of refrigerant
combustion.
Figure 3-27: Infrared absorption spectrum of exhaust
gas at 65% R1234yf concentration
Figure 3-28: Infrared absorption spectrum of exhaust
gas at 10% R1234yf concentration
Figures 3-29 to 3-34 summarize the experiment results. The horizontal axis shows the volume concentration of the
refrigerant, while the left vertical axis shows the maximum pressure during the cycle, which was normalized based on the
pressure at a refrigerant concentration of 0%. The right vertical axis shows the HF concentration in the exhaust gas. The
theoretical value was calculated by assuming adiabatic compression based on the specific heat ratio of the air/refrigerant
mixture.
R1234yf
Figure 3-29 shows the relationship between the R1234yf refrigerant concentration, the maximum pressure, and the HF
concentration. Combustion did not occur when the refrigerant concentration was higher than 30%. The maximum pressure
6
5
4
3
2
1
0
Pre
ssu
re [
MP
a]
540480420360300240180
Angle [degree]
0% 10% 65%
R1234yf
6
5
4
3
2
1
0
Pre
ssu
re [
MP
a]
540480420360300240180
Angle [degree]
0% 10% 65%
R1234yf
5
4
3
2
1
0
-1
Ab
s[-]
4500 3500 2500 1500 500
Wavenumber[cm-1
]
5
4
3
2
1
0
-1
Ab
s[-]
4500 3500 2500 1500 500
Wavenumber[cm-1
]
- 88 -

with the lubricating oil was almost the same as that without the oil. Combustion was observed when the refrigerant
concentration was less than 20%. Within this range, the shape of the graph was convex and exhibited a maximum pressure
of approximately 5 MPa at a concentration of 10%. HF was produced when combustion occurred. The concentration of
the HF increased with the maximum pressure and reached a maximum of approximately 3.5 vol%.
R32
Figure 3-30 shows the relationship between the R32 refrigerant concentration, the maximum pressure, and the HF
concentration. Combustion occurred only when the refrigerant concentration was less than 30%, and the maximum
pressure increased with the concentration, which reached a maximum of approximately 5 MPa. The borderline between
the range of burning and non-burning was very clear. The concentration of HF increased as the maximum pressure
increased.
Figure 3-29: Maximum pressure and HF concentration
vs. different R1234yf concentrations
Figure 3-30: Maximum pressure and HF concentration
vs. different R32 concentrations
R410A
Figure 3-31 shows the relationship between the R410A refrigerant concentration, the maximum pressure, and the HF
concentration. Combustion occurred when the refrigerant concentration was less than 20%. In this range, the maximum
pressure increased with the concentration of the refrigerant. The borderline between the range of burning and non-burning
was fairly clear. The concentration of HF increased as the maximum pressure increased.
R134a
Figure 3-32 shows the relationship between the R134a refrigerant concentration, the maximum pressure, and the HF
concentration. Although combustion occurred only when the concentration was less than 30%, the maximum pressure
was lower than that obtained with the other refrigerants. The pressure was almost equal to the result obtained with 0%
refrigerant. Within the range less than 30%, it seems that the refrigerant did not burn, but the lubricating oil did. By further
decreasing the refrigerant concentration to less than 7.5%, the maximum pressure increased to approximately 4 MPa,
which suggests that the refrigerant was also burning. The HF concentration was high in this range.
3
2
1
0
P_
ma
x [
-]
100806040200
Con_ref [vol%]
0.6
0.5
0.4
0.3
0.2
0.1
0.0
HF
[v
ol%
]R1234yf
with oil without oil P_th HF
3
2
1
0
P_
ma
x [
-]
100806040200
Con_ref [vol%]
0.6
0.5
0.4
0.3
0.2
0.1
0.0
HF
[v
ol%
]
R32
with oil without oil P_th HF
- 89 -
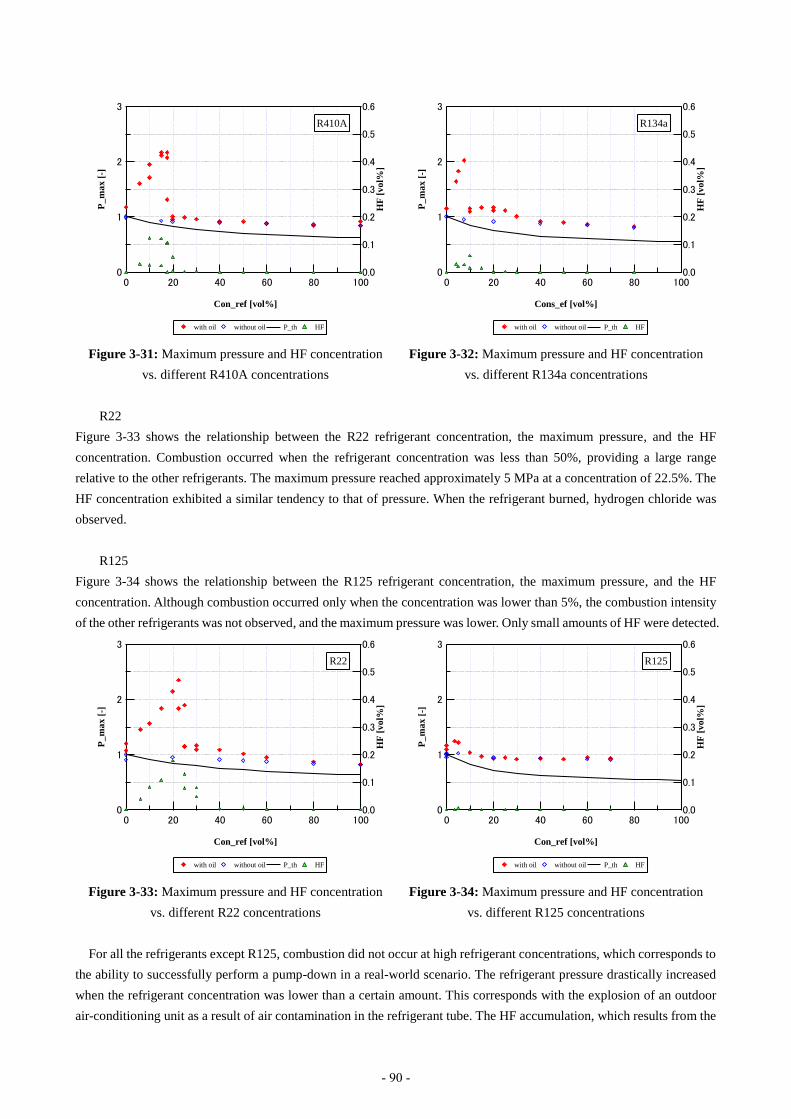
Figure 3-31: Maximum pressure and HF concentration
vs. different R410A concentrations
Figure 3-32: Maximum pressure and HF concentration
vs. different R134a concentrations
R22
Figure 3-33 shows the relationship between the R22 refrigerant concentration, the maximum pressure, and the HF
concentration. Combustion occurred when the refrigerant concentration was less than 50%, providing a large range
relative to the other refrigerants. The maximum pressure reached approximately 5 MPa at a concentration of 22.5%. The
HF concentration exhibited a similar tendency to that of pressure. When the refrigerant burned, hydrogen chloride was
observed.
R125
Figure 3-34 shows the relationship between the R125 refrigerant concentration, the maximum pressure, and the HF
concentration. Although combustion occurred only when the concentration was lower than 5%, the combustion intensity
of the other refrigerants was not observed, and the maximum pressure was lower. Only small amounts of HF were detected.
Figure 3-33: Maximum pressure and HF concentration
vs. different R22 concentrations
Figure 3-34: Maximum pressure and HF concentration
vs. different R125 concentrations
For all the refrigerants except R125, combustion did not occur at high refrigerant concentrations, which corresponds to
the ability to successfully perform a pump-down in a real-world scenario. The refrigerant pressure drastically increased
when the refrigerant concentration was lower than a certain amount. This corresponds with the explosion of an outdoor
air-conditioning unit as a result of air contamination in the refrigerant tube. The HF accumulation, which results from the
3
2
1
0
P_
ma
x [
-]
100806040200
Con_ref [vol%]
0.6
0.5
0.4
0.3
0.2
0.1
0.0
HF
[v
ol%
]
R410A
with oil without oil P_th HF
3
2
1
0
P_
ma
x [
-]
100806040200
Cons_ef [vol%]
0.6
0.5
0.4
0.3
0.2
0.1
0.0
HF
[v
ol%
]
R134a
with oil without oil P_th HF
3
2
1
0
P_
ma
x [
-]
100806040200
Con_ref [vol%]
0.6
0.5
0.4
0.3
0.2
0.1
0.0
HF
[v
ol%
]
R22
with oil without oil P_th HF
3
2
1
0
P_
ma
x [
-]
100806040200
Con_ref [vol%]
0.6
0.5
0.4
0.3
0.2
0.1
0.0
HF
[v
ol%
]
R125
with oil without oil P_th HF
- 90 -

burning of the refrigerant, occurs in the range of refrigerant concentrations where the pressure rises rapidly. This implies
that not only is the lubricating oil burning, but also the refrigerant itself. Although the range of flammability differs
slightly depending on the refrigerant, the flammable range is wider than that of pure refrigerant mentioned in chapter 2.
Furthermore, even those refrigerants categorized as non-flammable burned in our experiments. For R125, however, no
intense combustion occurred at any refrigerant concentration, and only very small amounts of HF were detected.
R1234yf and R32 exhibit different flammability ranges than those observed in other research, and other refrigerants
have no flammable range; however, some investigations suggest that the presence of high-humidity air will lead to a
widening of the flammability range to the point where even some refrigerants categorized as non-flammable will actually
burn, which was mentioned in other researches. This is caused by the water in the air reacting with the fluorine in the
refrigerant, thus causing the refrigerant to burn more easily.
(b) Difference in oil flow rate (c) Difference in oil property
In experiments (b) and (c), we investigated the effects on combustion of two different kinds of oil with different flow
rates. The oils used were PAG and POE oil. The refrigerants used were R1234yf, R32, R410A, and R22. The oil-flow
ratio was set to 0.0, 0.7, 1.0, 1.3, and 1.6 equivalent flow ratios. It should be noted that the oil-flow ratio was based on
standard flow rates calculated by the theoretical air-fuel ratio, thus the ratio may be different depending on the oil.
Figure 3-35 shows the representative pressure changes in an engine when a gaseous mixture of air and PAG lubricating
oil were compressed and the oil-flow ratio was changed. No combustion was observed when the oil-flow ratio was lower
than 0.7. Combustion occurred when the oil-flow ratio was larger than 1.0, and the maximum pressure increased as the
oil flow ratio increased.
Figure 3-36 shows the representative pressure changes in an engine when a gaseous mixture of air, 20% R1234yf
concentration refrigerant, and PAG lubricating oil were compressed and the oil-flow ratio was changed. Combustion did
not occur when the oil-flow ratio was lower than 1.0. Pressure was lower than that of the air/oil mixture presumably
because of the difference between the specific heat ratio of the air and that of the refrigerant, similar to the result of
experiment (a). Combustion occurred when the oil-flow ratio was larger than 1.3. The pressure rose drastically compared
with the case of the mixture without the refrigerant, and greater vibration and noise were observed. No combustion
occurred at any oil-flow ratio when the refrigerant flow rate was further increased. These tendencies were similar to the
results of refrigerants R32, R410a, and R22.
Figure 3-35: Change of pressure inside engine vs. crank
angle with different amounts of PAG oil
Figure 3-36: Change of pressure inside engine vs. crank
angle with different amounts of PAG oil and refrigerant
Table 3-7 shows the maximum pressure and refrigerant concentration at which the pressure was maximized of each
refrigerant and PAG oil-flow ratio. It is clear that the flammable range enlarged as the oil flow ratio increased; in addition,
7
6
5
4
3
2
1
0
Pre
ssu
re [
MP
a]
540480420360300240180
Angle [degree]
oil 0.0 oil 0.7 oil 1.0 oil 1.3 oil 1.6
7
6
5
4
3
2
1
0
Pre
ssu
re [
MP
a]
540480420360300240180
Angle [degree]
oil 0.0 oil 0.7 oil 1.0 oil 1.3 oil 1.6
R1234yf
- 91 -

the maximum pressure and the refrigerant concentration taking the maximum pressure also increase.
Table 3-7: Maximum pressure and concentration at maximum pressure
Refrigerant Maximum pressure
(normalized) [-]
Concentration of refrigerant
at maximum pressure [vol%]
Oil-flow ratio 0.7 1.0 1.3 1.6 0.7 1.0 1.3 1.6
R1234yf 1.98 2.54 2.59 2.74 5 15 15 20
R32 2.20 2.49 2.73 2.93 15 20 30 30
R410A 1.31 2.16 2.47 2.43 10 15 20 25
R22 1.08 1.67 2.04 1.99 0 10 30 30
Figures 3-37 to 3-40 show the combustion ranges for each refrigerant. The horizontal axis shows refrigerant
concentration, and the vertical axis shows the equivalent PAG oil-flow ratio. The red dots represent the condition where
combustion occurred, and the blue dots represent the condition where combustion did not occur. It is suggested that the
flammable range enlarged as the oil-flow ratio increased; however, combustion occurred at lower refrigerant
concentrations and larger oil-flow ratios.
Figure 3-37: Flammable range of R1234yf vs. different
amounts of PAG oil
Figure 3-38: Flammable range of R32 vs. different
amounts of PAG oil
Figure 3-39: Flammable range of R410A vs. different
amounts of PAG oil
Figure 3-40: Flammable range of R22 vs. different
amounts of PAG oil
Figures 3-41 to 3-48 summarize the results of each refrigerant and oil-flow ratio. The horizontal axis shows the
refrigerant concentration, and the vertical axis shows the maximum pressure which was normalized by the same means
1009080706050403020100
Con_ref [vol%]
1.6
1.4
1.2
1.0
0.8
0.6
0.4
0.2
0.0
Oil
ra
ito
[-]
non-flammable flammable
R1234yf / PAG
1009080706050403020100
Con_ref [vol%]
1.6
1.4
1.2
1.0
0.8
0.6
0.4
0.2
0.0
Oil
ra
ito
[-]
non-flammable flammable
R32 / PAG
1009080706050403020100
Con_ref [vol%]
1.6
1.4
1.2
1.0
0.8
0.6
0.4
0.2
0.0
Oil
ra
ito
[-]
non-flammable flammable
R410A / PAG
1009080706050403020100
Con_ref [vol%]
1.6
1.4
1.2
1.0
0.8
0.6
0.4
0.2
0.0
Oil
ra
ito
[-]
non-flammable flammable
R22 / PAG
- 92 -
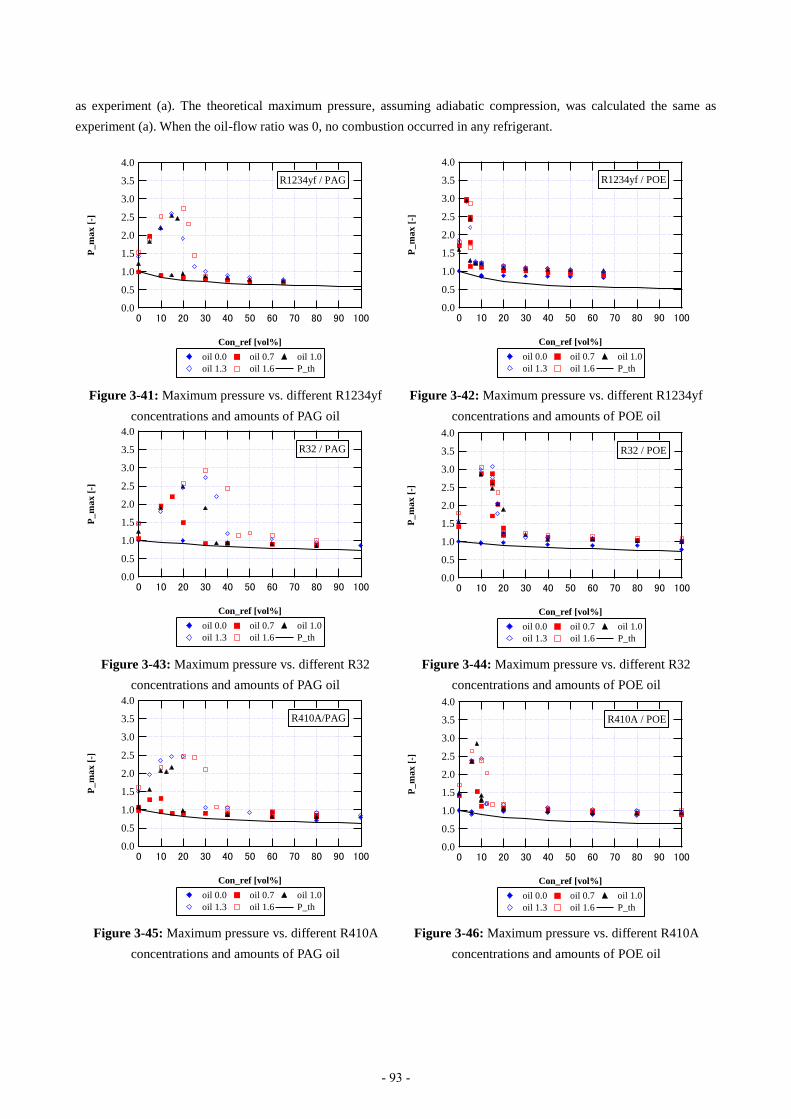
as experiment (a). The theoretical maximum pressure, assuming adiabatic compression, was calculated the same as
experiment (a). When the oil-flow ratio was 0, no combustion occurred in any refrigerant.
Figure 3-41: Maximum pressure vs. different R1234yf
concentrations and amounts of PAG oil
Figure 3-42: Maximum pressure vs. different R1234yf
concentrations and amounts of POE oil
Figure 3-43: Maximum pressure vs. different R32
concentrations and amounts of PAG oil
Figure 3-44: Maximum pressure vs. different R32
concentrations and amounts of POE oil
Figure 3-45: Maximum pressure vs. different R410A
concentrations and amounts of PAG oil
Figure 3-46: Maximum pressure vs. different R410A
concentrations and amounts of POE oil
4.0
3.5
3.0
2.5
2.0
1.5
1.0
0.5
0.0
P_
ma
x [
-]
1009080706050403020100
Con_ref [vol%]
R1234yf / PAG
oil 0.0 oil 0.7 oil 1.0
oil 1.3 oil 1.6 P_th
4.0
3.5
3.0
2.5
2.0
1.5
1.0
0.5
0.0
P_
ma
x [
-]
1009080706050403020100
Con_ref [vol%]
R1234yf / POE
oil 0.0 oil 0.7 oil 1.0
oil 1.3 oil 1.6 P_th
4.0
3.5
3.0
2.5
2.0
1.5
1.0
0.5
0.0
P_
ma
x [
-]
1009080706050403020100
Con_ref [vol%]
R32 / PAG
oil 0.0 oil 0.7 oil 1.0
oil 1.3 oil 1.6 P_th
4.0
3.5
3.0
2.5
2.0
1.5
1.0
0.5
0.0
P_
ma
x [
-]
1009080706050403020100
Con_ref [vol%]
R32 / POE
oil 0.0 oil 0.7 oil 1.0
oil 1.3 oil 1.6 P_th
4.0
3.5
3.0
2.5
2.0
1.5
1.0
0.5
0.0
P_
ma
x [
-]
1009080706050403020100
Con_ref [vol%]
R410A/PAG
oil 0.0 oil 0.7 oil 1.0
oil 1.3 oil 1.6 P_th
4.0
3.5
3.0
2.5
2.0
1.5
1.0
0.5
0.0
P_
ma
x [
-]
1009080706050403020100
Con_ref [vol%]
R410A / POE
oil 0.0 oil 0.7 oil 1.0
oil 1.3 oil 1.6 P_th
- 93 -
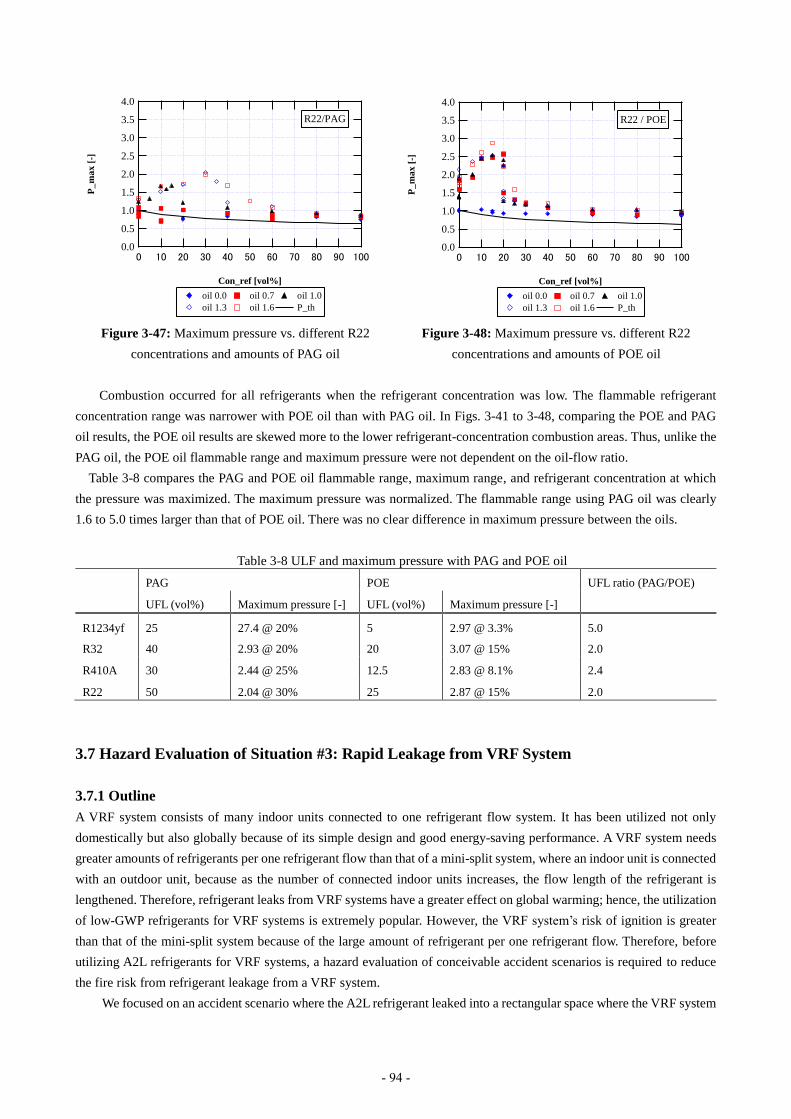
Figure 3-47: Maximum pressure vs. different R22
concentrations and amounts of PAG oil
Figure 3-48: Maximum pressure vs. different R22
concentrations and amounts of POE oil
Combustion occurred for all refrigerants when the refrigerant concentration was low. The flammable refrigerant
concentration range was narrower with POE oil than with PAG oil. In Figs. 3-41 to 3-48, comparing the POE and PAG
oil results, the POE oil results are skewed more to the lower refrigerant-concentration combustion areas. Thus, unlike the
PAG oil, the POE oil flammable range and maximum pressure were not dependent on the oil-flow ratio.
Table 3-8 compares the PAG and POE oil flammable range, maximum range, and refrigerant concentration at which
the pressure was maximized. The maximum pressure was normalized. The flammable range using PAG oil was clearly
1.6 to 5.0 times larger than that of POE oil. There was no clear difference in maximum pressure between the oils.
Table 3-8 ULF and maximum pressure with PAG and POE oil
PAG POE UFL ratio (PAG/POE)
UFL (vol%) Maximum pressure [-] UFL (vol%) Maximum pressure [-]
R1234yf 25 27.4 @ 20% 5 2.97 @ 3.3% 5.0
R32 40 2.93 @ 20% 20 3.07 @ 15% 2.0
R410A 30 2.44 @ 25% 12.5 2.83 @ 8.1% 2.4
R22 50 2.04 @ 30% 25 2.87 @ 15% 2.0
3.7 Hazard Evaluation of Situation #3: Rapid Leakage from VRF System
3.7.1 Outline
A VRF system consists of many indoor units connected to one refrigerant flow system. It has been utilized not only
domestically but also globally because of its simple design and good energy-saving performance. A VRF system needs
greater amounts of refrigerants per one refrigerant flow than that of a mini-split system, where an indoor unit is connected
with an outdoor unit, because as the number of connected indoor units increases, the flow length of the refrigerant is
lengthened. Therefore, refrigerant leaks from VRF systems have a greater effect on global warming; hence, the utilization
of low-GWP refrigerants for VRF systems is extremely popular. However, the VRF system’s risk of ignition is greater
than that of the mini-split system because of the large amount of refrigerant per one refrigerant flow. Therefore, before
utilizing A2L refrigerants for VRF systems, a hazard evaluation of conceivable accident scenarios is required to reduce
the fire risk from refrigerant leakage from a VRF system.
We focused on an accident scenario where the A2L refrigerant leaked into a rectangular space where the VRF system
4.0
3.5
3.0
2.5
2.0
1.5
1.0
0.5
0.0
P_
ma
x [
-]
1009080706050403020100
Con_ref [vol%]
R22/PAG
oil 0.0 oil 0.7 oil 1.0
oil 1.3 oil 1.6 P_th
4.0
3.5
3.0
2.5
2.0
1.5
1.0
0.5
0.0
P_
ma
x [
-]
1009080706050403020100
Con_ref [vol%]
R22 / POE
oil 0.0 oil 0.7 oil 1.0
oil 1.3 oil 1.6 P_th
- 94 -

was fixed and some ignition sources were located. We evaluated experimentally the possibility of ignition, flame
propagation behavior, and combustion strength. In particular, various concentration distributions and ignition heights
were used to examine the behaviors of flame propagation and pressure in the model rectangular space with dimensions
350 mm × 350 mm × 1000 mm (122.5 L).
3.7.2 Experiment
3.7.2.1 Materials and methods
The experimental apparatus consisted of a model rectangular vessel, an agitation system, a refrigerant leak system, a
concentration measuring system, a pressure measuring system, a temperature measuring system, camera systems, and an
extinguishing system. The schematic diagram of the outline of the experimental apparatus is shown in Figure 3-49.
(1) Model combustion chamber
Figure 3-50 shows the photo of the model rectangular combustion chamber made with SUS304 steel with
dimensions 350 mm x 350 mm x 1000 mm (volume 122.5 L). The designated resist pressure was 10 kPa. The
observation window of dimensions 150 mm x 600 mm was fixed in the side plane. Some inlet ports with
dimensions of Rc3/8” and Rc1/4” were fixed on the upper plane of the combustion chamber. A refrigerant leak
line, an extinction line, lines for concentration measurement, and a pressure transmitter were attachable through
these inlet ports. Two breather valves (100 mmϕ, activation pressure: 10 kPa) were fixed at the right side of
the upper plane to relieve the pressure in the chamber; therefore, we could measure up to 10 kPa of pressure.
Thermocouples were inserted through a 5-mm slit on the side plane of the chamber to measure temperature,
and then the slit was covered with a vinyl sheet; therefore, combustion pressure could be relieved via this slit
before reaching 10 kPa, at which pressure the covered slit would break or burn.
(2) Agitation system
The agitation system consisted of a propeller and a brushless DC motor. A propeller (90 mmϕ) was fixed in the
bottom of the chamber and operated by a brushless DC motor (BLFD60A2, Oriental Motor Co., Ltd.).
(3) Refrigerant leak system and concentration measurement system
2800
Refrigerant supply line
CCD camera
Monitor
Data Logger
FT-IR
To vacuum pump
Refrigerant
Balance
Amplifier
Unit:mm
28
00
Line for measuring refrigerant concentration
Electrode
362
36
2
High-speedPC
Amplifier Oscilloscope
Pressure transducer
Blu-ray
High-Voltage power source
Function G.
Wire net with thermocouple
Data Logger
PCExperiment room
Observation room
Normal-speed
Figure 3-49: Schematic diagram of experimental setup for ignition test of rapid-leaked A2L refrigerant in a
rectangular space simulating an actual office space.
- 95 -

Refrigerant was leaked through the leak line consisting of a ¼-
inch stainless tube and a 6-mmϕ vinyl tube. This leak line was
inserted through the chamber inlet port. The gas refrigerant
was leaked to the ambient air in a vertical downward direction.
The leak height was set at four stages of vessel height (H): 0
mm (0 H), 175 mm (½H), 263 mm (¾H), and 350 mm (H).
The concentration of refrigerant in the chamber was
measured at five vertical positions (15, 125, 195, 265, and 325
mm above the bottom of the vessel) and horizontally centered
by an FT-IR spectrometer (JASCO, FT/IR-4200).
(4) Ignition system
A DC spark was generated to initiate ignition of the accumulated refrigerant. A pair of 1-mmϕ-diameter
tungsten needle electrodes with a 3-mm gap were charged by the high-voltage DC power source (MEL1140B,
Genesis Co., Ltd.), and then discharge was initiated by a 5Vp-p rectangular wave signal generated by a function
generator (33120A, Agilent). The charge voltage was approximately 1.6 kV, and the capacitance including
electrodes and cables was approximately 10 μF, resulting in a spark discharge energy of approximately 12.8 J.
(5) Pressure measurement system
A pressure transmitter (PGM-02KG, Kyowa Electronic Instruments, Co., Ltd., Range: 20 kPa) was fixed at the
center of the upper plane of the chamber. The output of the pressure transmitter was amplified by a signal
conditioner (WGA-670B, Kyowa Electronic Instruments Co., Ltd.) and then recorded by a chart recorder
(8860-50, Hioki E.E.).
(6) Temperature measurement system
Twenty-seven points of 0.32-mmϕ K-type thermocouples were connected to a wire network fixed into the
combustion chamber. The thermocouple outputs were logged by a data logger (MX-100, Yokogawa Electric
Corp.) at a 500-ms logging interval. The thermocouple response time was approximately 1 s; therefore, the
measured temperatures are only for reference.
(7) Camera system
Flame behavior after ignition was captured by a high-speed camera (SA-X, Photron, 5000 fps), a normal-speed
digital camera (HC-V520M, Panasonic), and a mini-CCD camera (MTV-53KM21H, Mintron Enterprise). The
high-speed camera video recording was initiated by a 5Vp-p signal generated by the function generator that
synchronized the video recording with the timing of the spark discharge generation and the recording of the
signal by a pressure transmitter. The video taken by a mini CCD camera was recorded by a blu-ray recorder
(BRAVIA, SONY).
3.7.2.2 Experimental conditions
(1) Concentration measurements
R32 was used as the test refrigerant. The leak amount was set at 40 and 50 g and the leak rate at 10 g/min. The
leak height was varied as the aforementioned four stages of heights. The concentration measurement was
repeated three times for each combination of leak amount and leak height to examine the repeatability of the
measured concentration values.
(2) Ignition experiment
The varieties of refrigerant, leak amount, leak rate, and leak height were set the same as those for the
concentration measurements. The ignition-source height was varied between three stages of 75 mm, 125 mm,
and 175 mm above the bottom of the chamber. The ignition experiment was repeated three times for each
combination of leak amount, leak height, and ignition height to ensure repeatability.
1000
350
350
Pressure transducer
Refrigerant
Unit: mm
Breather valve
Figure 3-50: Photo of the rectangular
combustion chamber.
- 96 -
3.7.3 Results and discussions
3.7.3.1 Influence of leak height on concentration distribution
Figure 3-51 shows the vertical distribution of R32 concentration at every leak height with good repeatability. In the case
of leak height, H, the gradient of concentration in the vertical direction was comparatively small. However, the gradient
of concentration became apparent with a low leak height. For example, in the case of leak height 0 H (leakage at the
floor), the concentration at the 15 mm height exceeded the UFL. These trends were confirmed regardless of the leak
amount (40 g or 50 g).
3.7.3.2 Influence of leak height and ignition height on flame behavior
Figure 3-52(a) shows images of flame propagation behavior of R32 in the chamber taken by normal-speed camera under
the conditions of 50 g of leak amount, 75-mm ignition height, and leak height 0 H. Figure 3-52(b) shows the condition
with a leak height H, and Figure 3-52(c) shows the conditions with a leak height H and 125-mm ignition height.
Generally, the flame propagated in an upward direction from the ignition point and then propagated to the horizontal
direction. It was confirmed that the flame ran to the left side of the chamber because there was clearance to insert
thermocouples covered with the vinyl sheet at the left side of the chamber. The visible emission of the R32 flame in the
case of leak H seemed stronger than that of leak 0 H. The upward flame propagation rate was 2.03 m/s in the case of leak
height H and 1.27 m/s in the case of leak height 0 H. The combustion in the case of leak height H was stronger than the
case of leak height 0 H because of the difference in the amount of flammable R32.
In the case of leak height H, concentrations of R32 in all vertical directions were within the flammable range and the
concentration at the vicinity of the ceiling approximately coincided with the stoichiometric concentration. In the case of
leak height 0 H, the gradient of concentration was larger than that at leak height H; therefore, the concentration of R32 in
the vicinity of the floor exceeded the UFL, and in the vicinity of ceiling it was less than the LFL, thus the amount of
strong flammable mixture with concentration near the stoichiometric concentration was less than the case at leak height
H.
We also focused on the influence of ignition height on flame propagation behavior based on the comparison between
0
50
100
150
200
250
300
350
0 10 20 30
He
igh
t ab
ove
bas
e (
mm
)
R32 concentration (vol%)
1st
2nd
3rd
LFL
UFL
(a) Leak height H
0
50
100
150
200
250
300
350
0 10 20 30H
eigh
t ab
ove
bas
e (
mm
)R32 concentration (vol%)
1st2nd3rdLFLUFL
(b) Leak height
¾ H
0
50
100
150
200
250
300
350
0 10 20 30
Hei
ght
abo
ve b
ase
(m
m)
R32 concentration (vol%)
1st2nd3rdLFLUFL
(c) Leak height
½ H
0
50
100
150
200
250
300
350
0 10 20 30
Hei
ght
abo
ve b
ase
(m
m)
R32 concentration (vol%)
1st
2nd
3rd
LFL
UFL
(d) Leak height
0 H
Figure 3-51: Vertical distribution of R32 concentration in chamber at various leak heights. Leak amount: 50 g.
- 97 -
Figure 3-52(b) and (c). Although ignition and flame propagation to the entire chamber were observed in both cases, the
visible emission of R32 flame at the 75-mm ignition height seemed stronger than that at the 125-mm ignition height, and
the upward flame propagation rate was also larger.
3.7.3.3 Introduction of “index of available combustible refrigerant”
According to the experimental results and discussions described in the above section, it was clarified that the flame
propagation behavior of R32, which has a low burning velocity, was greatly influenced by its buoyancy; thus, the flame
propagation to the downward direction was blocked, and the flame mainly propagated in an upward direction. It was
considered that the flame propagation behavior of R32 mainly depended on the amount of R32 located above the ignition
source within a flammable range. Therefore, we focused on the
area produced by the lines of vertical distribution of concentration,
ignition height, LFL, and UFL, which are known or can be
assumed before conducting the experiment. This area corresponds
to the amount of R32 located above the ignition source. This area
was estimated by the summation of split rectangles divided by
every 0.1 vol%.
Of note, the burning velocity that majorly influences the flame
propagation behavior shows an upper convex curve vs. the
equivalence ratio, which shows the maximum value at the vicinity
of the stoichiometric concentration. Thus, the influence of the
equivalence ratio to the burning velocity is not considered in the
area estimated by the aforementioned method. Therefore, we
developed a weighted value that corresponds to the influence of the
equivalence ratio to the burning velocity, and we introduced this
weighted value to the aforementioned area.
First, the relation between the equivalence ratio and the burning velocity reported by literature3-20) was approximated
by a quadratic fit. The y-vertex of the quadratic function was determined as the maximum burning velocity “Sumax.”
Second, we estimated values of Su/Sumax. The value of Su implies the burning velocity at an arbitrary value of the
(a) (b)
(c)
Figure 3-52: Sequence photos of R32 flame propagation in the chamber. Leak amount: 50 g.
(a) Leak height: 0 H, ignition height: 75 mm, (b) Leak height: H, ignition height: 75 mm,
(c) Leak height: H, ignition height: 125 mm.
Variable t: time since spark discharge initiated.
y = -3.76 x2 + 8.25 x - 3.52
0.86
0.88
0.9
0.92
0.94
0.96
0.98
1
0.7 0.8 0.9 1 1.1 1.2 1.3 1.4
Su/S
um
ax (
-)
Equivalent ratio (-)
Figure 3-53: Relation between ratio of burning
velocity Su/Sumax and the equivalence ratio.
- 98 -

equivalence ratio, which can be read from literature3-20). We estimated the relation between Su/Sumax and the equivalence
ratio by the quadratic function shown in Eq. (3.2) and Figure 3-53.
52.325.876.3 2max SuSu (3-2)
Finally, the value of Su/Sumax in every equivalence ratio was multiplied by the aforementioned split rectangles which
were divided by every 0.1 vol% to weight the influence of the equivalence ratio to the burning velocity, and then the
summation of these multiplied areas of split rectangle was estimated. We defined these multiplied areas as “index of
available combustible refrigerant (IACR).”
3.7.3.4 Relation between flame propagation rate/peak overpressure and IACR
Figure 3-54(a) shows the relation between the flame propagation rate and the IACR and Figure 3-54(b) shows the relation
between peak overpressure and the IACR. The flame propagation rate increased with an increase in the IACR because
the flame was pulled to the vinyl-sheet-covered slit on the side plane because of the low resist pressure. Therefore, it is
possible to predict the flame propagation rate from the vertical distribution of concentration, ignition height, LFL, and
UFL data already known before conducting an experiment regardless of the leak height and ignition height.
Although the peak overpressure generally increased with an increase in the IACR, a significant relationship was not
confirmed.
3.8 Full-scale Experiment Assuming Conceivable Accident Scenario
3.8.1 Outline
We conducted detailed experimental evaluations for ignition possibility and physical hazards assuming conceivable
accident scenarios based on discussions of the risk assessments conducted by industrial associations such as the Japan
Refrigeration and Air Conditioning Industry Association (JRAIA). However, since many of the scenarios could only be
conducted on a laboratory scale, especially in the VRF scenario case, the scale effect on the experimental results could
not be clarified. Therefore, we conducted a full-scale experiment to evaluate the physical hazard and fire risk of a single
conceivable accident scenario.
3.8.2 Assumed accident scenario
We assumed a conceivable A2L refrigerant accident scenario of a refrigerant leak in a narrow karaoke space (floor area:
4 m3-21)). The scenario assumed that the refrigerant leaked rapidly (10 kg/h) from a ceiling-mounted cassette-type indoor
unit (four-direction type) and accumulated, and then an open candle flame was generated on a table located 50 cm above
the floor. When the refrigerant leaks from the unit, the leaked refrigerant engulfs the surrounding air and is agitated. To
0
0.2
0.4
0.6
0.8
1
1.2
0 20 40 60 80 100
Flam
e p
rop
agat
ion
rat
e (
m/s
)
Available index of combustible refrigerant
(mm・vol%)
Leak height=0 H (50g)
Leak Height=1/2H (50g)
Leak Height=3/4H (50g)
Leak Height=H (50g)
Leak Height=0 H (40g)
Leak Height=1/2H (40g)
Leak Height=3/4H (40g)
Leak Height=H (40g)0
0.5
1
1.5
2
2.5
3
3.5
0 20 40 60 80 100
Pe
ak o
verp
ress
ure
(kP
a)
Available index of combustible refrigerant
(mm・vol%)
(b) peak overpressure (a) flame propagation rate
Figure 3-54: Dependencies of flame propagation rate and peak overpressure on the IACR.
- 99 -
simulate the leak behavior, a commercial unit was installed on the ceiling of a model combustion chamber, and the leaked
refrigerant then collided with the metal plate of the unit, and the resulting liquefied refrigerant discharged to the
atmosphere.
In Japan, the mechanical ventilation system configuration of all karaoke spaces is regulated. For example, the
ventilation amount setting must be more than the available ventilation amount which is estimated by the following
equation.
NAV f20 (3.3)
where V is the available ventilation amount (m3/h), Af is the floor area (m2), and N is the space occupancy of one person
(about 2 m2).
The experimental combustion chamber was configured to meet the ventilation system requirements of a full-scale
karaoke space based on reports of the Japan Fire Alarms Manufacturer’s Association3-22): Af = 4 m2, N = 2 m2, and V = 40
m3/h.
3.8.3 Experiment
3.8.3.1 Materials and methods
(1) Location of the experimental facility
The full-scale experiment was conducted at the airtight experimental facility of Kayaku Japan Co., Ltd., Asa
Plant.
(2) Combustion chamber and mechanical ventilation system
Figure 3-55(a) shows the schematic diagram of the experimental setup, and Figure 3-55(b) shows a photo of the
combustion chamber. The combustion chamber was 2000 mm wide x 2000 mm long x 3000 mm high and made
of 10-mm-thick polycarbonate boards. Plywood boards 2000 mm wide x 2000 mm long were installed at a height
of 2400 mm as the designed ceiling and at the base of chamber as the designed floor. Therefore, the available
combustion space was 2000 mm x 2000 mm x 2400 mm. A ceiling-mounted cassette-type indoor unit (four-
direction type) was fixed to the ceiling. The outlet dimension of the unit was 495.6 mm x 56.0 mm. Two 80-
mmϕ openings for ventilation were made on the ceiling, and two pressure relief dampers were installed on the
upper side plane of the chamber.
2000
24
00
2000
Ceiling mounted cassette type indoor unit
Oil heater
Humidifier
Ignition point
(b) (a)
30
00
2000
2000
Indoor unit
24
00
Unit: mm100
40
07
50
75
0
Oscillo-scope
500500
TC* & Concentration
TC*Pressure transmitter
Temp. & Hum.
Ignition source
Gas analyzer(to measure concentration)
Data Logger
Transformer
Ventilation inlet
Ventilation outlet
*TC: Thermocouple (K-type, 0.32mmϕ)
Amplifier
Figure 3-55: Schematic diagram of experimental setup for the full-scale combustion experiment and photo of the
model combustion chamber.
- 100 -
Mechanical ventilation was simulated by using a
commercial hair dryer (Panasonic, EH5101P-A) which
was installed at the ceiling ventilation inlet. The 40-m3/h
available ventilation amount was maintained by
controlling the opening area of the dryer air inlet. In cases
without ventilation, both the ventilation outlet and inlet
were closed by covering with vinyl sheets.
Before conducting the ignition test, we examined the
natural ventilation performance of the combustion
chamber. A 5.5-kg unit of R32 corresponding to the UFL
was leaked to the combustion chamber, and then the
concentration of R32 was measured at four vertical
positions (100, 500, 1250, and 2000 mm). Figure 3-56
shows the time histories of the R32 concentrations obtained at the four heights. The horizontal axis implies time
since the leak start, and the leak stoppage occurred 33 minutes after the leak start. In the region below 1250 mm
in height, a decrease of concentration was hardly confirmed within the 60-min period after the leak stoppage. At
the 2000 mm height, although a significant decrease of concentration was confirmed compared to the other
heights, the rate of decrease in one hour was approximately 9%. In other words, the times of ventilation were
approximately 0.1 times/h. Therefore, the airtight performance of the combustion chamber was higher than that
regulated by the Building Standards Act in Japan3-23).
(3) Refrigerant leakage system and leak method
To simulate the actual leak situation from the ceiling-mounted cassette-type indoor unit, a side panel of the indoor
unit was pierced with a ¼-in copper tube to leak refrigerant hole. Once the refrigerant collided with the metal
panel of the unit, the refrigerant diffused by agitation and the entrainment of the surrounding air was leaked from
the ventilation outlet of the unit. Although the liquefied refrigerant discharged to the atmosphere, the leaked
refrigerant assumed a mist state when it collided with the metal panel of the unit, and a small amount of liquid
refrigerant accumulated on the drain pan of the unit. The leak rate was set at 10 kg/h.
(4) Ignition source
An open candle-like flame was employed as the ignition source. The tip of a commercial match was broken and
placed on a Ni-Cr wire coil, and ignition was initiated by charging the Ni-Cr wire coil with an AC transformer.
The ignition system was located 500 mm above the floor, the height of a typical karaoke table.
3.8.3.2 Measurement items and methods
(1) Vertical distribution of refrigerant
The refrigerant concentrations at 100, 500, 1250, and 2000 mm height in the center of the chamber were
measured by four ultrasonic gas analyzers (US-IIT-S, Daiichi Nekken Co., Ltd.).
(2) Flame propagation behavior
The flame propagation behavior near the ignition source was obtained by a normal-speed digital camera (GZ-
HM670, 30 fps, JVC KENWOOD Corp.), and photographs of the entire combustion chamber were also taken
with a high-speed digital camera (GZ-E355, 300 fps, JVC KENWOOD Corp.). The cameras were installed in
acrylic boxes to protect them from poisoning and corrosion by the HF generated during combustion.
(3) Combustion chamber temperature
K-type thermocouples (0.32 mmϕ) were fixed in the combustion chamber as shown in Figure 3-55(a) to measure
the temperature in the combustion chamber. The outputs of the thermocouples were logged by a data logger
(GL7000, Graphtec Corp.).
0
5
10
15
20
25
0 20 40 60 80 100 120
R3
2 C
on
cen
trat
ion
[vo
l%]
Time [min]
h=2000 mm (CH1)
h=1250 mm (Ch2)
h=500 mm (Ch3)
h=100 mm (Ch4)
Figure 3-56: Time history of the variation of
R32 concentration in the model combustion
chamber.
- 101 -
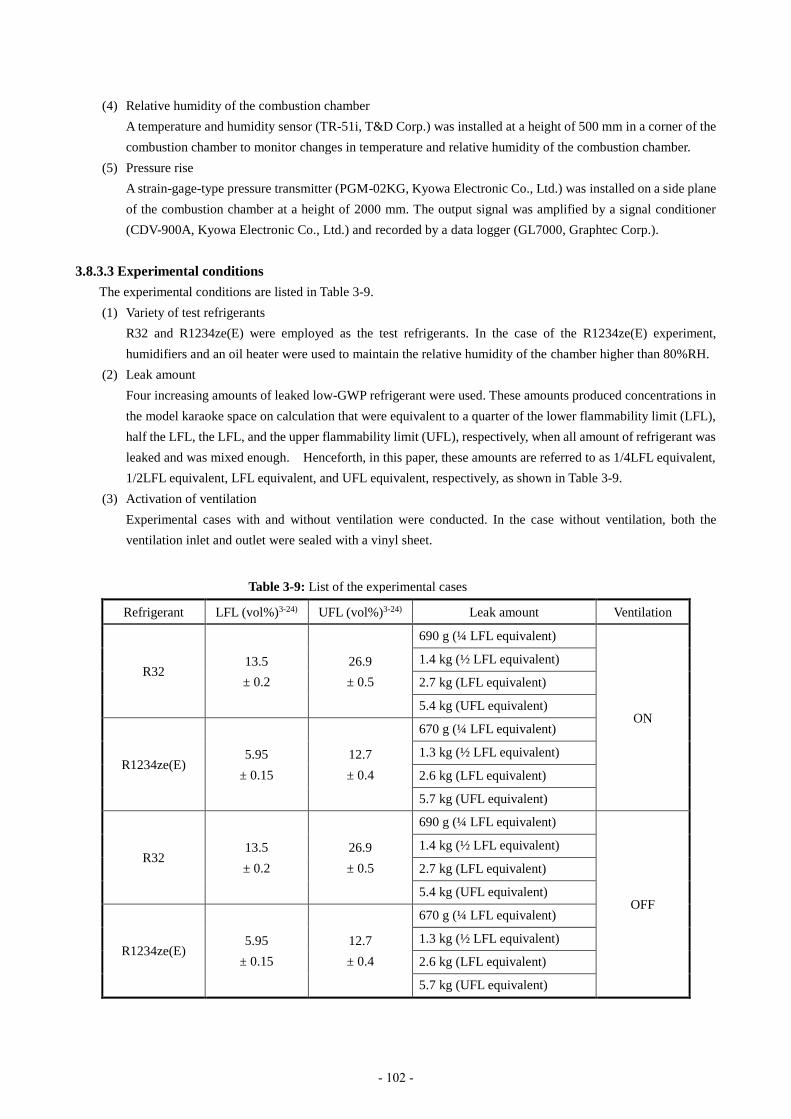
(4) Relative humidity of the combustion chamber
A temperature and humidity sensor (TR-51i, T&D Corp.) was installed at a height of 500 mm in a corner of the
combustion chamber to monitor changes in temperature and relative humidity of the combustion chamber.
(5) Pressure rise
A strain-gage-type pressure transmitter (PGM-02KG, Kyowa Electronic Co., Ltd.) was installed on a side plane
of the combustion chamber at a height of 2000 mm. The output signal was amplified by a signal conditioner
(CDV-900A, Kyowa Electronic Co., Ltd.) and recorded by a data logger (GL7000, Graphtec Corp.).
3.8.3.3 Experimental conditions
The experimental conditions are listed in Table 3-9.
(1) Variety of test refrigerants
R32 and R1234ze(E) were employed as the test refrigerants. In the case of the R1234ze(E) experiment,
humidifiers and an oil heater were used to maintain the relative humidity of the chamber higher than 80%RH.
(2) Leak amount
Four increasing amounts of leaked low-GWP refrigerant were used. These amounts produced concentrations in
the model karaoke space on calculation that were equivalent to a quarter of the lower flammability limit (LFL),
half the LFL, the LFL, and the upper flammability limit (UFL), respectively, when all amount of refrigerant was
leaked and was mixed enough. Henceforth, in this paper, these amounts are referred to as 1/4LFL equivalent,
1/2LFL equivalent, LFL equivalent, and UFL equivalent, respectively, as shown in Table 3-9.
(3) Activation of ventilation
Experimental cases with and without ventilation were conducted. In the case without ventilation, both the
ventilation inlet and outlet were sealed with a vinyl sheet.
Refrigerant LFL (vol%)3-24) UFL (vol%)3-24) Leak amount Ventilation
R32 13.5
± 0.2
26.9
± 0.5
690 g (¼ LFL equivalent)
ON
1.4 kg (½ LFL equivalent)
2.7 kg (LFL equivalent)
5.4 kg (UFL equivalent)
R1234ze(E) 5.95
± 0.15
12.7
± 0.4
670 g (¼ LFL equivalent)
1.3 kg (½ LFL equivalent)
2.6 kg (LFL equivalent)
5.7 kg (UFL equivalent)
R32 13.5
± 0.2
26.9
± 0.5
690 g (¼ LFL equivalent)
OFF
1.4 kg (½ LFL equivalent)
2.7 kg (LFL equivalent)
5.4 kg (UFL equivalent)
R1234ze(E) 5.95
± 0.15
12.7
± 0.4
670 g (¼ LFL equivalent)
1.3 kg (½ LFL equivalent)
2.6 kg (LFL equivalent)
5.7 kg (UFL equivalent)
Table 3-9: List of the experimental cases
- 102 -

3.8.4 Results and discussions
3.8.4.1 Vertical distribution of concentration
(1) Without ventilation
Figure 3-57 shows the vertical distributions of concentrations of R32 and R1234ze(E) for each leak amount.
The vertical gradient of concentration was hardly noticeable in all leak amounts. In all cases, concentrations
reached a quasi-steady state with concentration less than the target concentration, particularly in the case of
leakage of UFL equivalent condition, the concentration of R32 was approximately 8 vol% lower than the UFL
of R32; in the case of R1234ze(E), the concentration of R1234ze(E) was approximately 2 vol% lower than its
UFL. Although the liquefied refrigerant discharged to the atmosphere, it collided with the metal plate of the unit
in a mist state and leaked to the combustion chamber almost in a gas state. It was observed that some of leaked
refrigerant liquefied and accumulated in the drain pan of the unit and then slowly vaporized. Therefore, even if
the entire amount of refrigerant of the UFL equivalent had leaked into the combustion chamber, the
concentration in the combustion chamber was lower than that of the target concentration. Furthermore, although
the combustion chamber was airtight, the rise in pressure because of the rapid leak of refrigerant caused the wall
of the chamber to expand slightly and create small crevices, thereby allowing the mixture of refrigerant and air
to leak out of the chamber.
In particular, in the case of R32 with the UFL equivalent condition, the concentration of R32 was
approximately 19% and uniform. It was slightly higher than the stoichiometric concentration (17.3 vol%), so it
0
500
1000
1500
2000
0 10 20 30
He
igh
t (m
m)
Concentration (vol%)
690 g(1/4LFL) 1.4 kg(1/2LFL)2.8 kg(LFL) 5.5 kg(UFL)LFL UFL
(a) R32
0
500
1000
1500
2000
0 5 10 15
He
igh
t (m
m)
Concentration (vol%)670 g(1/4LFL) 1.3 kg(1/2LFL)
2.7 kg(LFL) 5.7 kg(UFL)
LFL UFL
(b) R1234ze(E)
Figure 3-57: Vertical distribution of A2L refrigerant concentration in model combustion chamber without
ventilation.
0
500
1000
1500
2000
0 5 10 15
He
igh
t (m
m)
Concentration (vol%)
after 20 secafter 80 secafter 320 secLFLUFL
(b) R1234ze(E)
0
500
1000
1500
2000
0 10 20 30
He
igh
t (m
m)
Concentration (vol%)
after 20 secafter 80 secafter 320 secLFLUFL
(a) R32
Figure 3-58: Vertical distribution of A2L refrigerant concentration in model combustion chamber with
ventilation. Leak amount: UFL equivalent
- 103 -

shows the strongest combustion strength.
(2) With ventilation
Figure 3-58 shows vertical distribution of concentration of R32 and R1234ze(E) when an amount of the UFL
equivalent was leaked. Even if the entire amount of refrigerant leaked into the combustion chamber, it was not
confirmed that the R32 and R1234ze(E) concentrations were within the flammable range, and the concentrations
decreased with time because of the ventilation activation.
3.8.4.2 Combustion behavior
Experimental results are listed in Table 3-10.
(1) R32/without ventilation
1) Leak amount: ¼ LFL equivalent
The concentration of R32 in the vicinity of the ignition source was approximately 2.9 vol%, which was
lower than the ¼ LFL (3.375 vol%). This was because some of leaked R32 accumulated in the liquid state
and vaporized on the drain pan.
An open flame was generated from the match, but no flame propagation to the surrounding R32 was
confirmed, and no significant increase in temperature or pressure was confirmed. No changes in the
appearance of the chamber were observed.
2) Leak amount: ½ LFL equivalent
The concentration of R32 in the vicinity of the ignition source was approximately 5.0 vol%, which was
lower than the ½ LFL (6.75 vol%).
An open flame was generated from the match, but no flame propagation to the surrounding R32 was
confirmed, and no significant increase in temperature or pressure was confirmed. No changes in the
appearance of the chamber were observed.
3) Leak amount: LFL equivalent
The concentration of R32 in the vicinity of the ignition source was approximately 10.8 vol%, which was
lower than the LFL (13.5 vol%).
An open flame was generated from the match, but no flame propagation to the surrounding R32 was
Table 3-10: Experimental results
Refrigerant
Equivalent
leak amount
(target value)
Before leak After leak
Vent. Ignition
Max. peak
overpress
ure [kPa]
Temp
[°C]
Humidity
[%RH]
Temp
[°C]
Humidity
[%R.H.]
R32
¼LFL 15.9 56 16.4 52
ON
× –a
½LFL 15.9 26 15.3 24 × –a
LFL 4.1 73 4.8 68 × –a
UFL 5.6 58 5.9 47 × –a
R1234ze(E)
¼LFL 22.7 53 21.8 51 × –a
½LFL – – 17.8 60 × –a
LFL 19.8 58 16.0 61 × –a
UFL 19.8 62 14.0 49 × –a
R32
¼LFL 4.9 53 4.9 52
OFF
× –a
½LFL 4.5 61 4.4 58 × –a
LFL 4.2 55 3.2 52 × –a
UFL 3.7 87 0.7 83 ○ 4.3
R1234ze(E)
¼LFL 19.3 85 18.6 89 × –a
½LFL 20.9 83 18.9 81 × –a
LFL 19.9 85 14.4 89 × –a
UFL 16.3 90 10.1 89 ○ 4.0
*a: not detected.
- 104 -

confirmed, and no significant increase in temperature or pressure was confirmed. No changes in the
appearance of the chamber were observed.
4) Leak amount: UFL equivalent
The concentration of R32 in the vicinity of the ignition source was approximately 19.2 vol%, which was
lower than the UFL (26.9 vol%), but within the flammable range. Figure 3-59 shows the sequence
photographs of the combustion chamber after the Ni-Cr wire coil was energized, and Figure 3-60 shows the
pressure-rise profile. The start time when the Ni–Cr wire coil was energized and that when recording of the
videogram and logging the pressure data began did not always exactly coincide. Consequently, the times
shown in Fig. 3-59 and Fig.3-60 are reference values.
The ignition from the match was observed at 2.4 s after the wire coil was energized, and 500 ms later the
flame propagated to the R32 in the vicinity of the ignition source and a significant blue flame formed. The
open flame generated by the match was enveloped by the R32 flame, and since oxygen to burn the R32
became insufficient, the R32 flame assumed a long narrow shape in an upward direction. After a further
passage of 500 ms, the R32 flame propagated from the open flame of the match to the unburnt R32 and rose
and formed a vortex. Approximately 3.9−4.4 s after the Ni-Cr wire coil was energized, the R32 flame
propagated to the entire combustion chamber, and a bright flame was observed at 5.4 s. It was considered
that some of the R32 in the chamber burned imperfectly because the equivalence ratio at almost all heights
exceeds 1 in this condition. At the 7.4-s mark, the R32 flame in the chamber was almost extinguished, and
white smog consisting of water and HF combustion products were observed. Furthermore, the combustion
chamber bounded slightly because of the pressure rise caused by the combustion. Therefore, if this
combustion chamber did not bound, the maximum value of pressure rise in the combustion chamber would
have been higher.
The rise of pressure started 4 s after ignition and reached its first peak value of approximately 2.3 kPa,
and then decreased with time. However, after the pressure increased again with time, it reached a second
peak value of 4.3 kPa.
t=0 s t=2.4 s t=2.9 s
t=3.4 s t=3.9 s t=4.4 s
t=5.4 s t=6.4 s t=7.4 s
Figure 3-59: Sequence photos of the flame propagation of A2L refrigerant without mechanical ventilation.
Variable t: time since Ni-Cr wire coil energized, Refrigerant: R32, Leak amount: corresponding UFL (5.4 kg)
- 105 -

Furthermore, the flame propagation rate was roughly estimated at approximately 1.0 m/s based on the
sequence images shown in Figure 3-59; therefore, the burning velocity was estimated at approximately 0.10
m/s. When the accumulated R32 was burned under the experimental conditions, the burning velocity was
as fast as the 0.1-m/s criterion of an A2L-class or A2-class refrigerant, but it was much smaller than the
burning velocity of a strongly flammable gas like hydrocarbon (0.4−0.5 m/s). Therefore, it was assumed
that the R32 flame in this experiment was not transited to the turbulent combustion.
(2) R32 with ventilation
Figure 3-61 shows the time histories of R32 concentrations for every leak amount.
1) Leak amount: ¼ LFL equivalent
The concentration of R32 in the vicinity of the ignition source was approximately 2.0 vol%, which was
-2
-1
0
1
2
3
4
5
0 2 4 6P
ress
ure
ris
e (
kPa)
Time since energizing Ni-Cr wire (s)
Pressure
Figure 3-60: Profile of pressure rise resulting from the combustion of R32 in chamber without ventilation.
Refrigerant: R32, Leak amount: UFL (5.4 kg).
0
5
10
15
20
25
30
0 5 10 15 20
Co
nce
ntr
atio
n (
vol%
)
Time (min)
h=2000 mm h=1250 mmh=500 mm h=100 mmIndoor unit LFL
Leak stop
(a) ¼ LFL equivalent
0
5
10
15
20
25
30
0 5 10 15 20
Co
nce
ntr
atio
n (
vol%
)
Time (min)
h=2000 mm h=1250 mmh=500 mm h=100 mmIndoor unit LFL
Leak stop
(b) ½ LFL equivalent
0
5
10
15
20
25
30
0 5 10 15 20
Co
nce
ntr
atio
n (
vol%
)
Time (min)
h=2000 mm h=1250 mmh=500 mm h=100 mmIndoor unit LFL
Leak stop
(c) LFL equivalent
0
5
10
15
20
25
30
0 20 40 60
Co
nce
ntr
atio
n (
vol%
)
Time (min)
h=2000 mm h=1250 mmh=500 mm h=100 mmIndoor unit LFL
Leak stop
(d) UFL equivalent
Figure 3-61: Time history of the concentration of A2L refrigerant with mechanical ventilation for various leak
amounts. Refrigerant: R32.
- 106 -
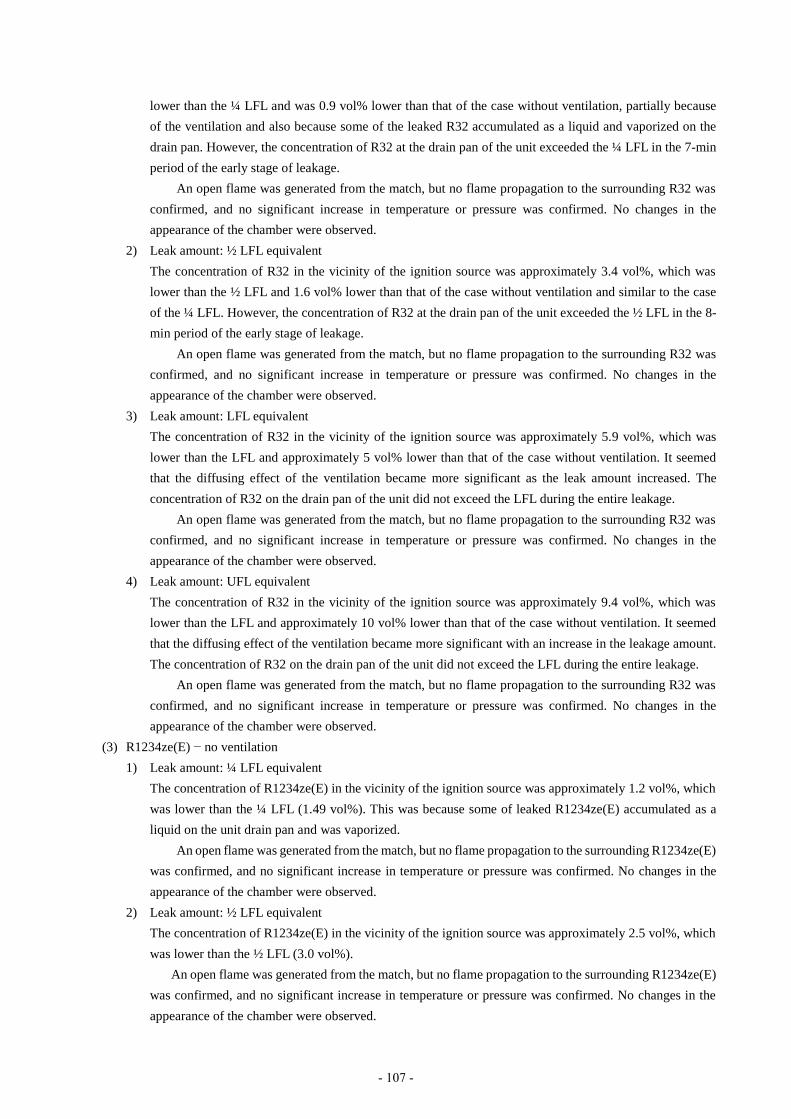
lower than the ¼ LFL and was 0.9 vol% lower than that of the case without ventilation, partially because
of the ventilation and also because some of the leaked R32 accumulated as a liquid and vaporized on the
drain pan. However, the concentration of R32 at the drain pan of the unit exceeded the ¼ LFL in the 7-min
period of the early stage of leakage.
An open flame was generated from the match, but no flame propagation to the surrounding R32 was
confirmed, and no significant increase in temperature or pressure was confirmed. No changes in the
appearance of the chamber were observed.
2) Leak amount: ½ LFL equivalent
The concentration of R32 in the vicinity of the ignition source was approximately 3.4 vol%, which was
lower than the ½ LFL and 1.6 vol% lower than that of the case without ventilation and similar to the case
of the ¼ LFL. However, the concentration of R32 at the drain pan of the unit exceeded the ½ LFL in the 8-
min period of the early stage of leakage.
An open flame was generated from the match, but no flame propagation to the surrounding R32 was
confirmed, and no significant increase in temperature or pressure was confirmed. No changes in the
appearance of the chamber were observed.
3) Leak amount: LFL equivalent
The concentration of R32 in the vicinity of the ignition source was approximately 5.9 vol%, which was
lower than the LFL and approximately 5 vol% lower than that of the case without ventilation. It seemed
that the diffusing effect of the ventilation became more significant as the leak amount increased. The
concentration of R32 on the drain pan of the unit did not exceed the LFL during the entire leakage.
An open flame was generated from the match, but no flame propagation to the surrounding R32 was
confirmed, and no significant increase in temperature or pressure was confirmed. No changes in the
appearance of the chamber were observed.
4) Leak amount: UFL equivalent
The concentration of R32 in the vicinity of the ignition source was approximately 9.4 vol%, which was
lower than the LFL and approximately 10 vol% lower than that of the case without ventilation. It seemed
that the diffusing effect of the ventilation became more significant with an increase in the leakage amount.
The concentration of R32 on the drain pan of the unit did not exceed the LFL during the entire leakage.
An open flame was generated from the match, but no flame propagation to the surrounding R32 was
confirmed, and no significant increase in temperature or pressure was confirmed. No changes in the
appearance of the chamber were observed.
(3) R1234ze(E) − no ventilation
1) Leak amount: ¼ LFL equivalent
The concentration of R1234ze(E) in the vicinity of the ignition source was approximately 1.2 vol%, which
was lower than the ¼ LFL (1.49 vol%). This was because some of leaked R1234ze(E) accumulated as a
liquid on the unit drain pan and was vaporized.
An open flame was generated from the match, but no flame propagation to the surrounding R1234ze(E)
was confirmed, and no significant increase in temperature or pressure was confirmed. No changes in the
appearance of the chamber were observed.
2) Leak amount: ½ LFL equivalent
The concentration of R1234ze(E) in the vicinity of the ignition source was approximately 2.5 vol%, which
was lower than the ½ LFL (3.0 vol%).
An open flame was generated from the match, but no flame propagation to the surrounding R1234ze(E)
was confirmed, and no significant increase in temperature or pressure was confirmed. No changes in the
appearance of the chamber were observed.
- 107 -
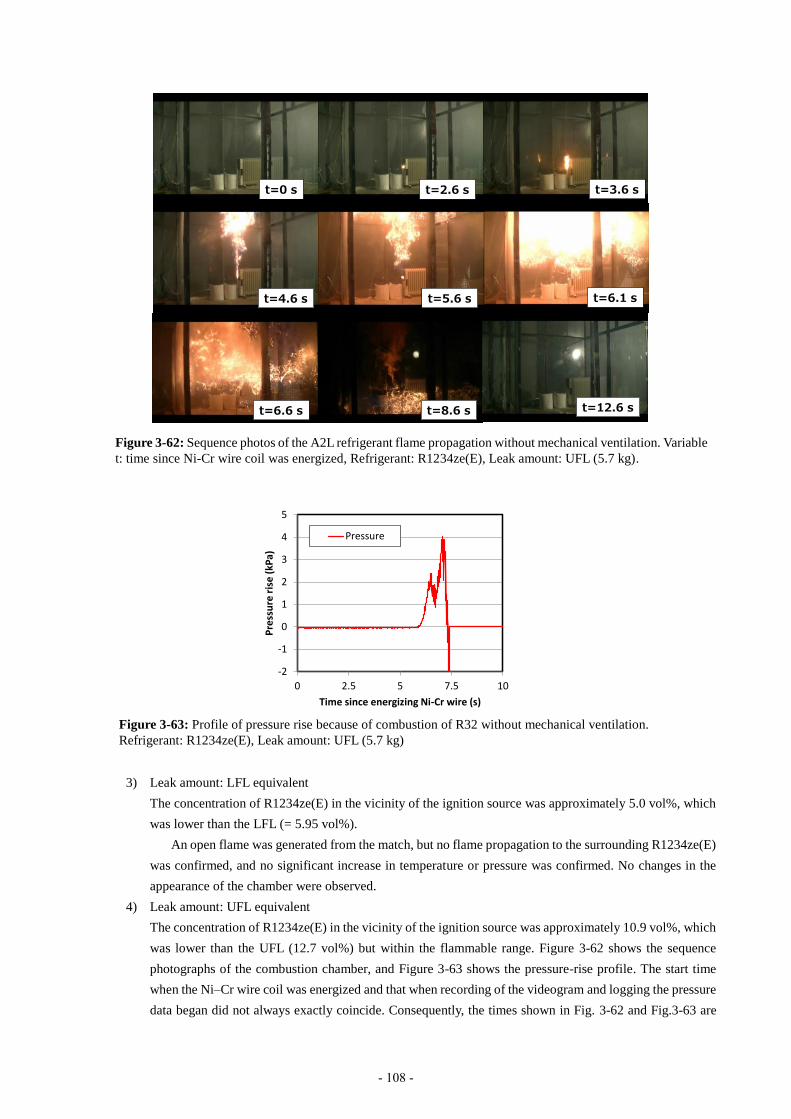
3) Leak amount: LFL equivalent
The concentration of R1234ze(E) in the vicinity of the ignition source was approximately 5.0 vol%, which
was lower than the LFL (= 5.95 vol%).
An open flame was generated from the match, but no flame propagation to the surrounding R1234ze(E)
was confirmed, and no significant increase in temperature or pressure was confirmed. No changes in the
appearance of the chamber were observed.
4) Leak amount: UFL equivalent
The concentration of R1234ze(E) in the vicinity of the ignition source was approximately 10.9 vol%, which
was lower than the UFL (12.7 vol%) but within the flammable range. Figure 3-62 shows the sequence
photographs of the combustion chamber, and Figure 3-63 shows the pressure-rise profile. The start time
when the Ni–Cr wire coil was energized and that when recording of the videogram and logging the pressure
data began did not always exactly coincide. Consequently, the times shown in Fig. 3-62 and Fig.3-63 are
t=2.6 st=0 s t=3.6 s
t=4.6 s t=5.6 s t=6.1 s
t=6.6 s t=8.6 s t=12.6 s
Figure 3-62: Sequence photos of the A2L refrigerant flame propagation without mechanical ventilation. Variable
t: time since Ni-Cr wire coil was energized, Refrigerant: R1234ze(E), Leak amount: UFL (5.7 kg).
-2
-1
0
1
2
3
4
5
0 2.5 5 7.5 10
Pre
ssu
re r
ise
(kP
a)
Time since energizing Ni-Cr wire (s)
Pressure
Figure 3-63: Profile of pressure rise because of combustion of R32 without mechanical ventilation.
Refrigerant: R1234ze(E), Leak amount: UFL (5.7 kg)
- 108 -
reference values.
Ignition from the match was observed at 2.6 s after the Ni-Cr wire coil was energized, and 500 ms later, the
open flame generated from the match became long and narrow in the upward direction. A blue flame, which
is indicative of R1234ze(E), was observed at the envelope of the open flame 4.6 s after ignition; however,
the blue flame was very small. A handstand cone-shaped flame similar to a bright flame formed at the
ignition source and hit the ceiling and then descended by gravity. It was assumed that a large amount of
unburnt R1234ze(E) had accumulated in the lower part of the combustion chamber because R1234ze(E) is
a comparatively heavy refrigerant. The flame descended from the ceiling and stopped at the equivalent
height with unburnt R1234ze(E), and then the flame propagated to the unburnt R1234ze(E) in the lower
chamber area; this entire process lasted approximately 10 to 12 s. The combustion time of R1234e(E) was
longer than that of R32. The white smog resulting from the generation of water and HF as combustion
products was again observed. Furthermore, no bounding of the combustion chamber was observed, but the
combustion chamber rotated approximately 5 degrees by the moment of force.
The rise of pressure started approximately 6 s after ignition, reached its first peak value of
approximately 2.4 kPa, and then decreased with time. However, the pressure increased again with time and
reached a second peak of 4.0 kPa. The flame propagation rate could not read from the sequence photos
shown in Figure 3-62 because the flame propagated to the handstand cone-shape.
(4) R1234ze(E) with ventilation
Figure 3-64 shows the time history of R1234ze(E) concentrations at every leak amount.
1) Leak amount: ¼ LFL equivalent
The concentration of R1234ze(E) in the vicinity of the ignition source was approximately 1.0 vol%, which
was lower than the ¼ LFL and 0.2 vol% lower than that of the case without ventilation. This result is
attributed to the effect of the ventilation and the fact that some of the leaked R1234ze(E) accumulated in
the liquid state on the unit drain pan and vaporized. However, the concentration of R1234ze(E) on the drain
pan of the unit exceeded the ¼ LFL for 6 min in the early stage of leakage.
An open flame was generated from the match, but no flame propagation to the surrounding R1234ze(E)
was confirmed, and no significant increase in temperature or pressure was confirmed. No changes in the
appearance of the chamber were observed.
2) Leak amount: ½ LFL equivalent
The concentration of R1234ze(E) in the vicinity of the ignition source was approximately 1.75 vol%, which
was lower than the ½ LFL and 0.75 vol% lower than that of the case without ventilation. However, the
concentration of R1234ze(E) on the unit drain pan exceeded the ½ LFL for 2 min in the early stage of
leakage.
An open flame was generated from the match, but no flame propagation to the surrounding R1234ze(E)
was confirmed, and no significant increase in temperature or pressure was confirmed. No changes in the
appearance of the chamber were observed.
3) Leak amount: LFL equivalent
The concentration of R1234ze(E) in the vicinity of the ignition source was approximately 3.0 vol%, which
was lower than the LFL and approximately 2.0 vol% lower than that of the case without ventilation. The
concentration of R1234ze(E) on the unit drain pan did not exceed the LFL for the entire leakage duration.
An open flame was generated from the match, but no flame propagation to the surrounding R1234ze(E)
was confirmed, and no significant increase in temperature or pressure was confirmed. No changes in the
appearance of the chamber were observed.
4) Leak amount: UFL equivalent
The concentration of R1234ze(E) in the vicinity of the ignition source was approximately 4.9 vol%, which
- 109 -
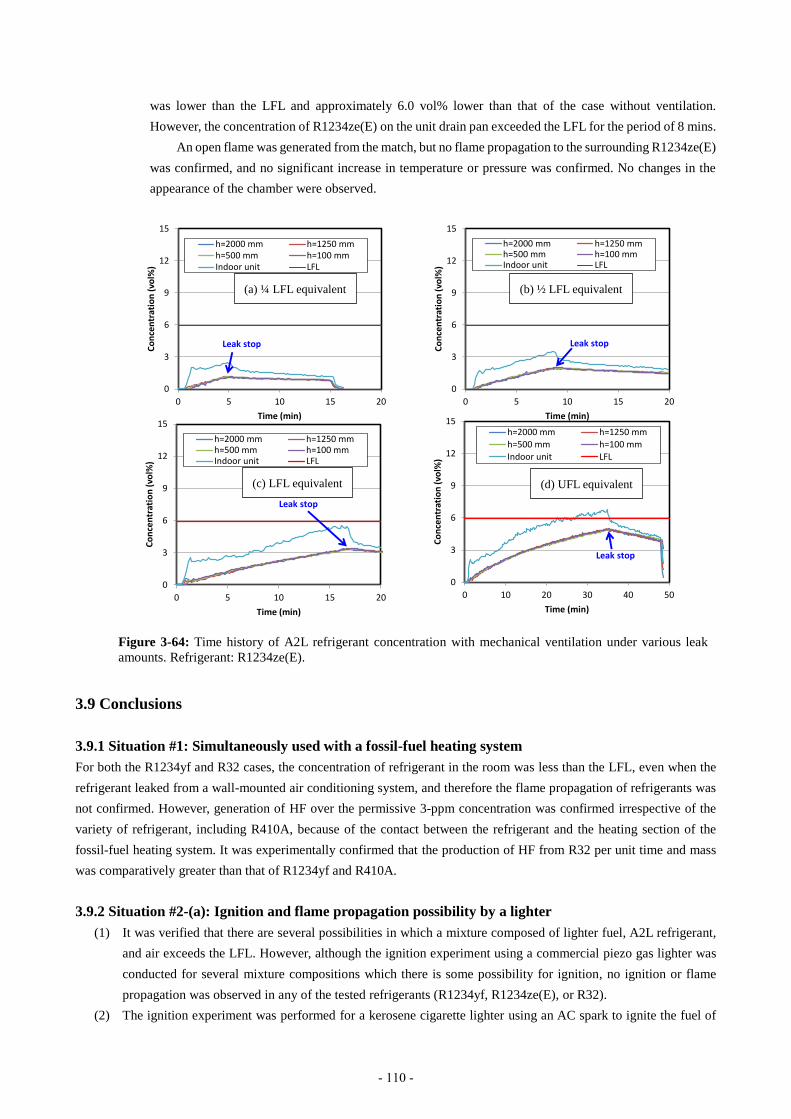
was lower than the LFL and approximately 6.0 vol% lower than that of the case without ventilation.
However, the concentration of R1234ze(E) on the unit drain pan exceeded the LFL for the period of 8 mins.
An open flame was generated from the match, but no flame propagation to the surrounding R1234ze(E)
was confirmed, and no significant increase in temperature or pressure was confirmed. No changes in the
appearance of the chamber were observed.
3.9 Conclusions
3.9.1 Situation #1: Simultaneously used with a fossil-fuel heating system
For both the R1234yf and R32 cases, the concentration of refrigerant in the room was less than the LFL, even when the
refrigerant leaked from a wall-mounted air conditioning system, and therefore the flame propagation of refrigerants was
not confirmed. However, generation of HF over the permissive 3-ppm concentration was confirmed irrespective of the
variety of refrigerant, including R410A, because of the contact between the refrigerant and the heating section of the
fossil-fuel heating system. It was experimentally confirmed that the production of HF from R32 per unit time and mass
was comparatively greater than that of R1234yf and R410A.
3.9.2 Situation #2-(a): Ignition and flame propagation possibility by a lighter
(1) It was verified that there are several possibilities in which a mixture composed of lighter fuel, A2L refrigerant,
and air exceeds the LFL. However, although the ignition experiment using a commercial piezo gas lighter was
conducted for several mixture compositions which there is some possibility for ignition, no ignition or flame
propagation was observed in any of the tested refrigerants (R1234yf, R1234ze(E), or R32).
(2) The ignition experiment was performed for a kerosene cigarette lighter using an AC spark to ignite the fuel of
0
3
6
9
12
15
0 5 10 15 20
Co
nce
ntr
atio
n (
vol%
)
Time (min)
h=2000 mm h=1250 mmh=500 mm h=100 mmIndoor unit LFL
Leak stop
(a) ¼ LFL equivalent
0
3
6
9
12
15
0 5 10 15 20
Co
nce
ntr
atio
n (
vol%
)
Time (min)
h=2000 mm h=1250 mmh=500 mm h=100 mmIndoor unit LFL
Leak stop
(b) ½ LFL equivalent
0
3
6
9
12
15
0 5 10 15 20
Co
nce
ntr
atio
n (
vol%
)
Time (min)
h=2000 mm h=1250 mmh=500 mm h=100 mmIndoor unit LFL
Leak stop
(c) LFL equivalent
0
3
6
9
12
15
0 10 20 30 40 50
Co
nce
ntr
atio
n (
vol%
)
Time (min)
h=2000 mm h=1250 mm
h=500 mm h=100 mm
Indoor unit LFL
Leak stop
(d) UFL equivalent
Figure 3-64: Time history of A2L refrigerant concentration with mechanical ventilation under various leak
amounts. Refrigerant: R1234ze(E).
- 110 -
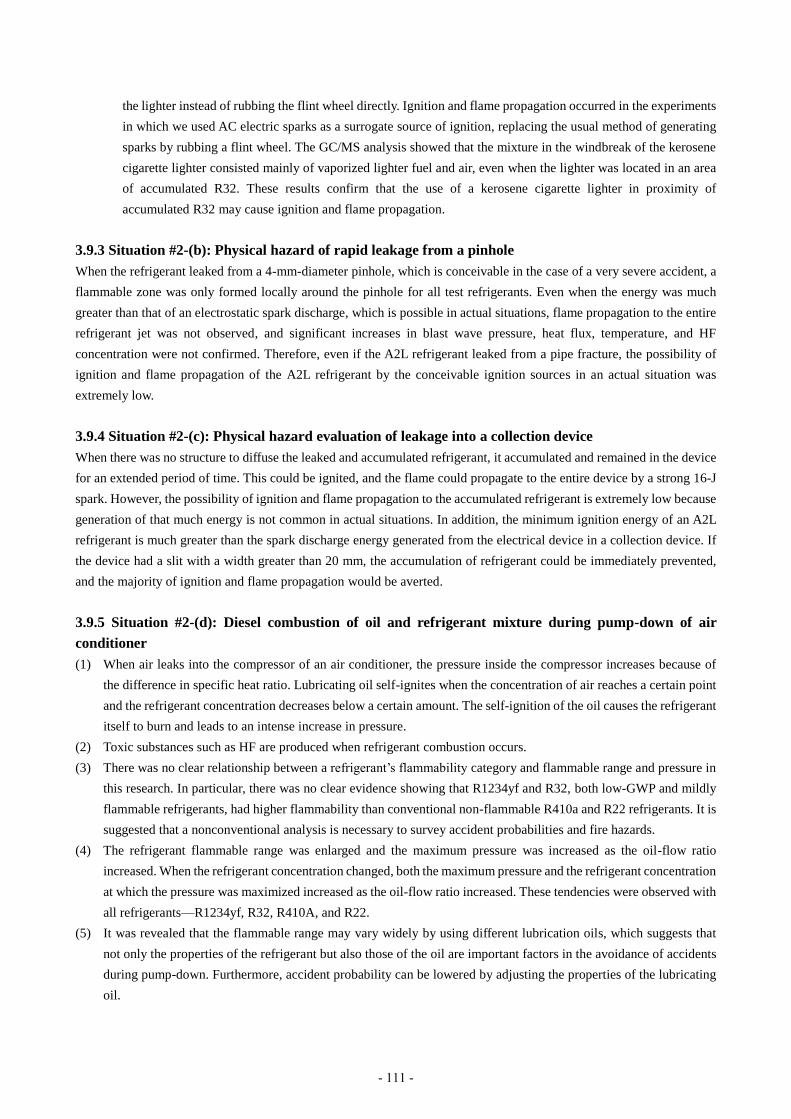
the lighter instead of rubbing the flint wheel directly. Ignition and flame propagation occurred in the experiments
in which we used AC electric sparks as a surrogate source of ignition, replacing the usual method of generating
sparks by rubbing a flint wheel. The GC/MS analysis showed that the mixture in the windbreak of the kerosene
cigarette lighter consisted mainly of vaporized lighter fuel and air, even when the lighter was located in an area
of accumulated R32. These results confirm that the use of a kerosene cigarette lighter in proximity of
accumulated R32 may cause ignition and flame propagation.
3.9.3 Situation #2-(b): Physical hazard of rapid leakage from a pinhole
When the refrigerant leaked from a 4-mm-diameter pinhole, which is conceivable in the case of a very severe accident, a
flammable zone was only formed locally around the pinhole for all test refrigerants. Even when the energy was much
greater than that of an electrostatic spark discharge, which is possible in actual situations, flame propagation to the entire
refrigerant jet was not observed, and significant increases in blast wave pressure, heat flux, temperature, and HF
concentration were not confirmed. Therefore, even if the A2L refrigerant leaked from a pipe fracture, the possibility of
ignition and flame propagation of the A2L refrigerant by the conceivable ignition sources in an actual situation was
extremely low.
3.9.4 Situation #2-(c): Physical hazard evaluation of leakage into a collection device
When there was no structure to diffuse the leaked and accumulated refrigerant, it accumulated and remained in the device
for an extended period of time. This could be ignited, and the flame could propagate to the entire device by a strong 16-J
spark. However, the possibility of ignition and flame propagation to the accumulated refrigerant is extremely low because
generation of that much energy is not common in actual situations. In addition, the minimum ignition energy of an A2L
refrigerant is much greater than the spark discharge energy generated from the electrical device in a collection device. If
the device had a slit with a width greater than 20 mm, the accumulation of refrigerant could be immediately prevented,
and the majority of ignition and flame propagation would be averted.
3.9.5 Situation #2-(d): Diesel combustion of oil and refrigerant mixture during pump-down of air
conditioner
(1) When air leaks into the compressor of an air conditioner, the pressure inside the compressor increases because of
the difference in specific heat ratio. Lubricating oil self-ignites when the concentration of air reaches a certain point
and the refrigerant concentration decreases below a certain amount. The self-ignition of the oil causes the refrigerant
itself to burn and leads to an intense increase in pressure.
(2) Toxic substances such as HF are produced when refrigerant combustion occurs.
(3) There was no clear relationship between a refrigerant’s flammability category and flammable range and pressure in
this research. In particular, there was no clear evidence showing that R1234yf and R32, both low-GWP and mildly
flammable refrigerants, had higher flammability than conventional non-flammable R410a and R22 refrigerants. It is
suggested that a nonconventional analysis is necessary to survey accident probabilities and fire hazards.
(4) The refrigerant flammable range was enlarged and the maximum pressure was increased as the oil-flow ratio
increased. When the refrigerant concentration changed, both the maximum pressure and the refrigerant concentration
at which the pressure was maximized increased as the oil-flow ratio increased. These tendencies were observed with
all refrigerants—R1234yf, R32, R410A, and R22.
(5) It was revealed that the flammable range may vary widely by using different lubrication oils, which suggests that
not only the properties of the refrigerant but also those of the oil are important factors in the avoidance of accidents
during pump-down. Furthermore, accident probability can be lowered by adjusting the properties of the lubricating
oil.
- 111 -
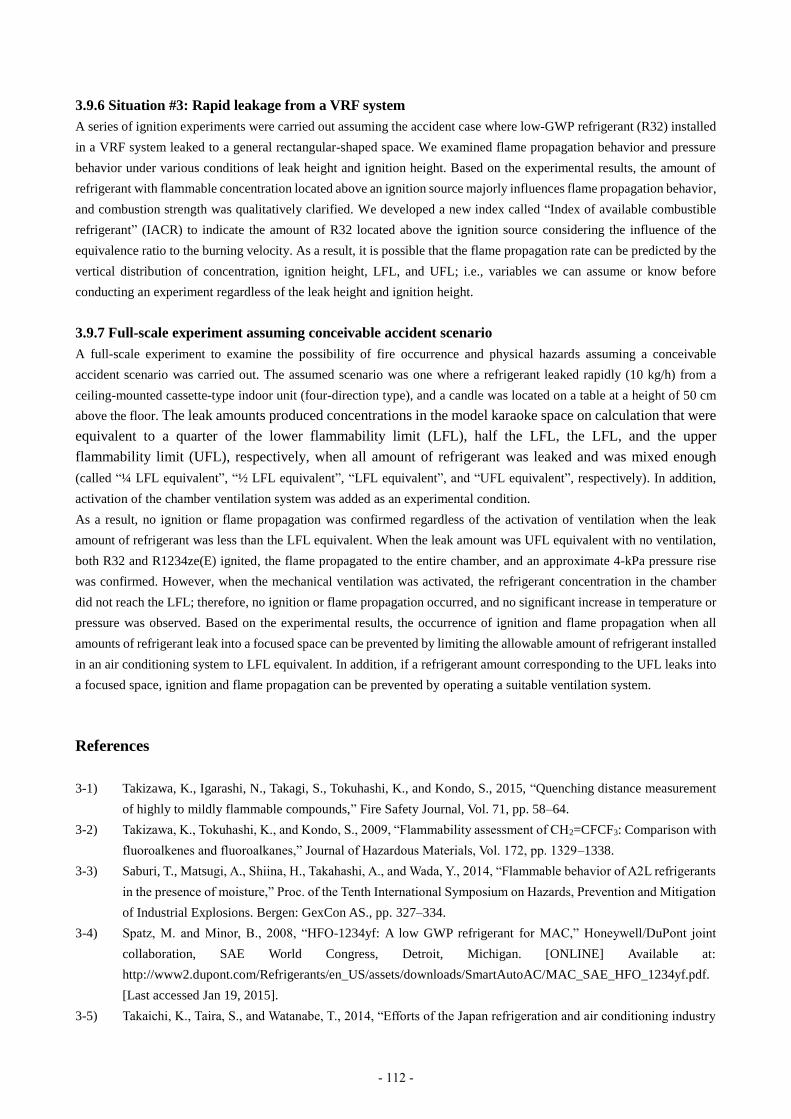
3.9.6 Situation #3: Rapid leakage from a VRF system
A series of ignition experiments were carried out assuming the accident case where low-GWP refrigerant (R32) installed
in a VRF system leaked to a general rectangular-shaped space. We examined flame propagation behavior and pressure
behavior under various conditions of leak height and ignition height. Based on the experimental results, the amount of
refrigerant with flammable concentration located above an ignition source majorly influences flame propagation behavior,
and combustion strength was qualitatively clarified. We developed a new index called “Index of available combustible
refrigerant” (IACR) to indicate the amount of R32 located above the ignition source considering the influence of the
equivalence ratio to the burning velocity. As a result, it is possible that the flame propagation rate can be predicted by the
vertical distribution of concentration, ignition height, LFL, and UFL; i.e., variables we can assume or know before
conducting an experiment regardless of the leak height and ignition height.
3.9.7 Full-scale experiment assuming conceivable accident scenario
A full-scale experiment to examine the possibility of fire occurrence and physical hazards assuming a conceivable
accident scenario was carried out. The assumed scenario was one where a refrigerant leaked rapidly (10 kg/h) from a
ceiling-mounted cassette-type indoor unit (four-direction type), and a candle was located on a table at a height of 50 cm
above the floor. The leak amounts produced concentrations in the model karaoke space on calculation that were
equivalent to a quarter of the lower flammability limit (LFL), half the LFL, the LFL, and the upper
flammability limit (UFL), respectively, when all amount of refrigerant was leaked and was mixed enough
(called “¼ LFL equivalent”, “½ LFL equivalent”, “LFL equivalent”, and “UFL equivalent”, respectively). In addition,
activation of the chamber ventilation system was added as an experimental condition.
As a result, no ignition or flame propagation was confirmed regardless of the activation of ventilation when the leak
amount of refrigerant was less than the LFL equivalent. When the leak amount was UFL equivalent with no ventilation,
both R32 and R1234ze(E) ignited, the flame propagated to the entire chamber, and an approximate 4-kPa pressure rise
was confirmed. However, when the mechanical ventilation was activated, the refrigerant concentration in the chamber
did not reach the LFL; therefore, no ignition or flame propagation occurred, and no significant increase in temperature or
pressure was observed. Based on the experimental results, the occurrence of ignition and flame propagation when all
amounts of refrigerant leak into a focused space can be prevented by limiting the allowable amount of refrigerant installed
in an air conditioning system to LFL equivalent. In addition, if a refrigerant amount corresponding to the UFL leaks into
a focused space, ignition and flame propagation can be prevented by operating a suitable ventilation system.
References
3-1) Takizawa, K., Igarashi, N., Takagi, S., Tokuhashi, K., and Kondo, S., 2015, “Quenching distance measurement
of highly to mildly flammable compounds,” Fire Safety Journal, Vol. 71, pp. 58–64.
3-2) Takizawa, K., Tokuhashi, K., and Kondo, S., 2009, “Flammability assessment of CH2=CFCF3: Comparison with
fluoroalkenes and fluoroalkanes,” Journal of Hazardous Materials, Vol. 172, pp. 1329–1338.
3-3) Saburi, T., Matsugi, A., Shiina, H., Takahashi, A., and Wada, Y., 2014, “Flammable behavior of A2L refrigerants
in the presence of moisture,” Proc. of the Tenth International Symposium on Hazards, Prevention and Mitigation
of Industrial Explosions. Bergen: GexCon AS., pp. 327–334.
3-4) Spatz, M. and Minor, B., 2008, “HFO-1234yf: A low GWP refrigerant for MAC,” Honeywell/DuPont joint
collaboration, SAE World Congress, Detroit, Michigan. [ONLINE] Available at:
http://www2.dupont.com/Refrigerants/en_US/assets/downloads/SmartAutoAC/MAC_SAE_HFO_1234yf.pdf.
[Last accessed Jan 19, 2015].
3-5) Takaichi, K., Taira, S., and Watanabe, T., 2014, “Efforts of the Japan refrigeration and air conditioning industry
- 112 -
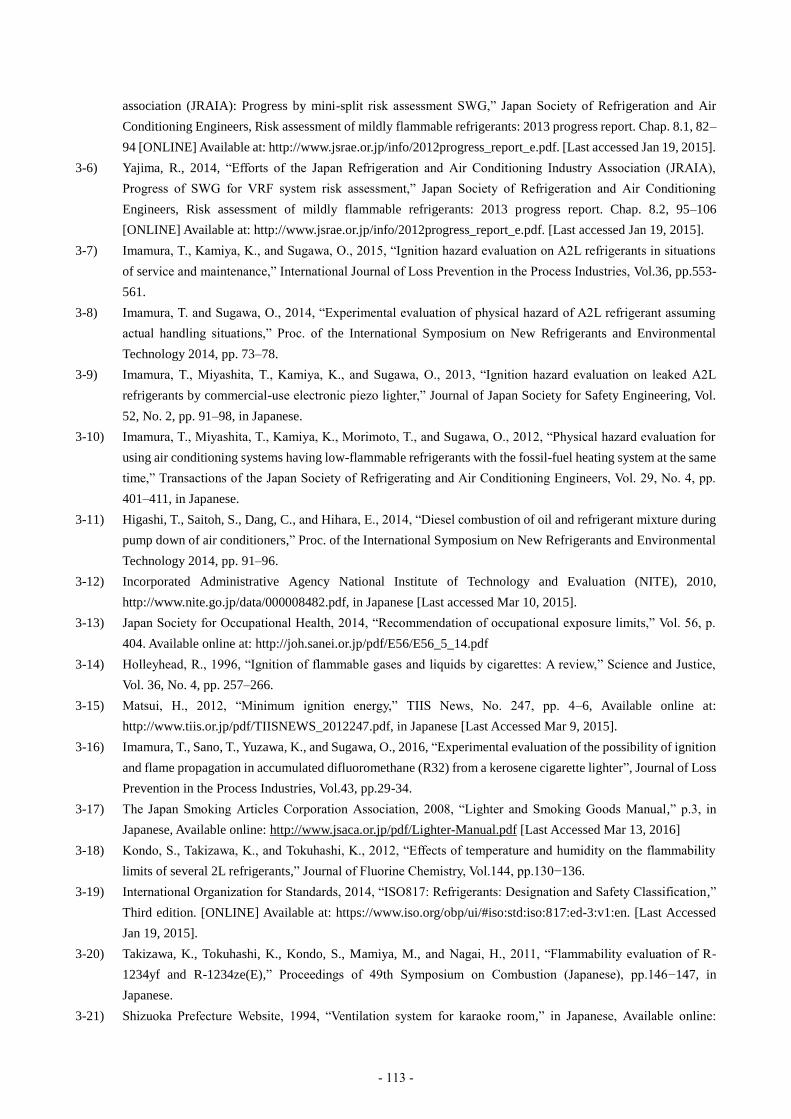
association (JRAIA): Progress by mini-split risk assessment SWG,” Japan Society of Refrigeration and Air
Conditioning Engineers, Risk assessment of mildly flammable refrigerants: 2013 progress report. Chap. 8.1, 82–
94 [ONLINE] Available at: http://www.jsrae.or.jp/info/2012progress_report_e.pdf. [Last accessed Jan 19, 2015].
3-6) Yajima, R., 2014, “Efforts of the Japan Refrigeration and Air Conditioning Industry Association (JRAIA),
Progress of SWG for VRF system risk assessment,” Japan Society of Refrigeration and Air Conditioning
Engineers, Risk assessment of mildly flammable refrigerants: 2013 progress report. Chap. 8.2, 95–106
[ONLINE] Available at: http://www.jsrae.or.jp/info/2012progress_report_e.pdf. [Last accessed Jan 19, 2015].
3-7) Imamura, T., Kamiya, K., and Sugawa, O., 2015, “Ignition hazard evaluation on A2L refrigerants in situations
of service and maintenance,” International Journal of Loss Prevention in the Process Industries, Vol.36, pp.553-
561.
3-8) Imamura, T. and Sugawa, O., 2014, “Experimental evaluation of physical hazard of A2L refrigerant assuming
actual handling situations,” Proc. of the International Symposium on New Refrigerants and Environmental
Technology 2014, pp. 73–78.
3-9) Imamura, T., Miyashita, T., Kamiya, K., and Sugawa, O., 2013, “Ignition hazard evaluation on leaked A2L
refrigerants by commercial-use electronic piezo lighter,” Journal of Japan Society for Safety Engineering, Vol.
52, No. 2, pp. 91–98, in Japanese.
3-10) Imamura, T., Miyashita, T., Kamiya, K., Morimoto, T., and Sugawa, O., 2012, “Physical hazard evaluation for
using air conditioning systems having low-flammable refrigerants with the fossil-fuel heating system at the same
time,” Transactions of the Japan Society of Refrigerating and Air Conditioning Engineers, Vol. 29, No. 4, pp.
401–411, in Japanese.
3-11) Higashi, T., Saitoh, S., Dang, C., and Hihara, E., 2014, “Diesel combustion of oil and refrigerant mixture during
pump down of air conditioners,” Proc. of the International Symposium on New Refrigerants and Environmental
Technology 2014, pp. 91–96.
3-12) Incorporated Administrative Agency National Institute of Technology and Evaluation (NITE), 2010,
http://www.nite.go.jp/data/000008482.pdf, in Japanese [Last accessed Mar 10, 2015].
3-13) Japan Society for Occupational Health, 2014, “Recommendation of occupational exposure limits,” Vol. 56, p.
404. Available online at: http://joh.sanei.or.jp/pdf/E56/E56_5_14.pdf
3-14) Holleyhead, R., 1996, “Ignition of flammable gases and liquids by cigarettes: A review,” Science and Justice,
Vol. 36, No. 4, pp. 257–266.
3-15) Matsui, H., 2012, “Minimum ignition energy,” TIIS News, No. 247, pp. 4–6, Available online at:
http://www.tiis.or.jp/pdf/TIISNEWS_2012247.pdf, in Japanese [Last Accessed Mar 9, 2015].
3-16) Imamura, T., Sano, T., Yuzawa, K., and Sugawa, O., 2016, “Experimental evaluation of the possibility of ignition
and flame propagation in accumulated difluoromethane (R32) from a kerosene cigarette lighter”, Journal of Loss
Prevention in the Process Industries, Vol.43, pp.29-34.
3-17) The Japan Smoking Articles Corporation Association, 2008, “Lighter and Smoking Goods Manual,” p.3, in
Japanese, Available online: http://www.jsaca.or.jp/pdf/Lighter-Manual.pdf [Last Accessed Mar 13, 2016]
3-18) Kondo, S., Takizawa, K., and Tokuhashi, K., 2012, “Effects of temperature and humidity on the flammability
limits of several 2L refrigerants,” Journal of Fluorine Chemistry, Vol.144, pp.130−136.
3-19) International Organization for Standards, 2014, “ISO817: Refrigerants: Designation and Safety Classification,”
Third edition. [ONLINE] Available at: https://www.iso.org/obp/ui/#iso:std:iso:817:ed-3:v1:en. [Last Accessed
Jan 19, 2015].
3-20) Takizawa, K., Tokuhashi, K., Kondo, S., Mamiya, M., and Nagai, H., 2011, “Flammability evaluation of R-
1234yf and R-1234ze(E),” Proceedings of 49th Symposium on Combustion (Japanese), pp.146−147, in
Japanese.
3-21) Shizuoka Prefecture Website, 1994, “Ventilation system for karaoke room,” in Japanese, Available online:
- 113 -
http://shizuoka-calc.jp/wp-content/uploads/2011/03/pdf31.pdf [Last Accessed Mar 13, 2016]
3-22) Japan Fire Alarms Manufacturer’s Association, 2012, “Report on the experiment for influence on the smoke
detector by smoking in the karaoke room,” in Japanese, Available online:
http://www.fdma.go.jp/html/data/tuchi2203/pdf/220331_ren2.pdf#search='%E3%82%AB%E3%83%A9%E3%82
%AA%E3%82%B1%E6%96%BD%E8%A8%AD%E3%81%AE%E5%80%8B%E5%AE%A4%E3%81
%AB%E3%81%8A%E3%81%91%E3%82%8B%E5%96%AB%E7%85%99%E3%81%AB%E3%82%8
8%E3%82%8B%E7%85%99%E6%84%9F%E7%9F%A5%E5%99%A8%E3%81%B8%E3%81%AE%E
5%BD%B1%E9%9F%BF%E5%AE%9F%E9%A8%93%E5%A0%B1%E5%91%8A%E6%9B%B8' [Last
Accessed Mar 13, 2016]
3-23) Website in Japanese: http://www.iny.jp/regulation/cnstreg5.html [Last Accessed Mar 13, 2016]
3-24) Takizawa, K., 2015, Risk Assessment of Mildly Flammable Refrigerants 2014 Progress Report, JSRAE, p.26.
- 114 -
4. Physical Hazard Assessment
4.1 Introduction
Refrigerants such as difluoromethane (R32, CH2F2), 2,3,3,3-tetrafluoropropene (R1234yf, CH2=CFCF3) and trans-
1,3,3,3-tetrafluolopropylene (R1234ze(E), CHF=CHCF3) have zero ozone depletion potential (ODP) and low global-
warming potential (GWP). In particular, R1234yf and R1234ze have GWP values lower than the required 150 for new
mobile air-conditioning units (Directive/2006/40/EC 4-1)). Thus, these compounds are regarded as having great potential
as next-generation refrigerants. Although these refrigerants perform better than existing refrigerants in terms of their
lower ODP and GWP, they are mildly flammable. It is important to evaluate the combustion safety of A2L refrigerants
in the event of their leakage into the atmosphere as could occur with installation and operating accidents. To address the
issue of global warming due to the use of conventional refrigerants, ASHRAE (2010) 4-2) has defined the optional Class
2L to classify refrigerants with a lower flammability, and it is preparing to promote the conversion of air-conditioning
equipment from conventional to next-generation refrigerants. To this end, a series of studies was conducted.
・ The fundamental flammability characteristics of A2L refrigerants were experimentally evaluated using a large
spherical combustion vessel, and their safety was assessed based on the results. Flammability was investigated in
terms of parameters such as the flame speed, burning velocity, and deflagration index KG under the influence of
caused by the buoyancy arising from the slow burning velocity.
・ The scale effect of KG was examined by comparing the results with those obtained from a test with a 15-L spherical
vessel.
・ An influence of elevated temperature and moisture was investigated, especially for R1234ze(E).
・ The flammability of ammonia was also investigated to enable a direct comparison with A2L refrigerants and
eliminate the instrumental and test conditional dependency on KG and the auto-ignition temperature AIT.
・ The reduction effect of the pressure due to the presence of an opening was investigated using an unclosed vessel.
・ A numerical combustion model to simulate the experimental results obtained with the vessel was examined.
4.2 Combustion Test
4.2.1 Introduction
To utilize these mildly flammable gases safely, ASHRAE (2010) 4-2) added the optional 2L subclass to the existing Class
2 (lower flammability) to classify the safety of refrigerants. R32, R1234yf, and R1234ze are classified as A2L refrigerants,
which are defined as having both low toxicity and low flammability with a maximum burning velocity of ≤ 10 cm/s. A2L
refrigerants have such a low burning velocity that any lifting of the flame front due to buoyancy significantly affects their
combustion behavior. In terms of safety, it is important to investigate the fundamental flammability properties of these
alternative refrigerants. In this study, a large-volume spherical vessel was prepared to observe and evaluate the effect of
buoyancy on the flammable properties of R32 and R1234yf; the flame propagation behaviors of these two refrigerants
were observed using a high-speed video camera, and the internal pressure in the vessel was measured using a pressure
sensor. The flame propagation velocity was estimated by image analysis of the high-speed video images. The burning
velocity was estimated from the flame speed and the pressure profile; the latter was measured using the spherical vessel
method under the assumption of spherical flame-front expansion (Takizawa et al. 4-3)). The maximum peak pressure (i.e.,
the maximum overpressure relative to the pressure in the vessel during combustion) and deflagration index (i.e., a constant
that defines the maximum rate of pressure increase with combustion time, as defined by ISO 6184-2 4-4) and NFPA68 4-
5)), were evaluated. Ignition tests using a mixture of gases with an electric discharge were conducted for a range of
- 115 -

equivalent ratios , which is the ratio of the fuel–oxygen ratio to the stoichiometric fuel–oxygen ratio: 0.8−1.2 for
R32 and 1.2−1.4 for R1234yf. In the current fiscal year, the flammability in the presence of an elevated temperature
and moisture level was experimentally investigated (thus mimicking the conditions experienced in summer), and the
burning behavior upon ignition was investigated. A scheme for evaluating the potential risk of combustion and explosion
in actual situations was developed based on the experimentally obtained KG values.
4.2.2 Experiment
Figure 4-1 shows the experimental apparatus with the spherical vessel. The spherical vessel had a diameter of 1 m and a
volume of 0.524 m3. A pressure transducer was placed at the top of the vessel and the pressure signal obtained during
combustion was recorded on a data logger. The burning behavior was observed using a high-speed video camera through
a PMMA viewing port. The R32 burning behavior was investigated at equivalent ratios of 0.8–1.2. The R1234yf
burning behavior was evaluated at equivalent ratios of 1.2–1.4against a reference ratio of 1.325 (mixing ratio of
10 vol%, which Takizawa et al. 4-3) reported as giving the maximum burning velocity for R1234yf when using the
spherical vessel method (Metghalchi and Kech 4-6) and Hill and Hung 4-7))). Pressure transducers were used to introduce
fuel gas into the vessel up to a certain partial pressure (BG in Figure 4-1). Air was then introduced into the vessel until
the total pressure in the vessel was 101,325 Pa. During the gas introduction and mixing procedure, gas circulation was
maintained using a diaphragm pump (DP in Figure 4-1). The electrode for providing the electric spark consisted of a set
of horizontally opposed tungsten wires with a 7-mm gap. The wires were 0.3 mm in diameter to avoid heat loss and
structural disturbance. The vessel was equipped with a jacketed mantle heater that covered the entire outside surface of
the vessel to maintain the initial temperature at a constant value (Figure 4-1, right picture). The electrode provided a spark
upon the application of a high-voltage power supply to ignite the mixture gas. The discharge voltage and current were
recorded on an oscilloscope, and the discharge energy was estimated. The expansion behavior of the flame front was
recorded using the high-speed camera, and the recorded video image sequences were analyzed; the flame velocities in the
side and upper directions were then evaluated.
Figure 4-1 Schematic (left) and photograph (right) of experimental apparatus.
4.2.3 Flame velocity and burning velocity
(a) Image observation
Figure 4-2 shows an example of the high-speed video images of the flame front propagation behaviors for R32 for
0.9 and 1.2. The flame expanded while slowly climbing upwards. The shape of the flame front, which is the
interface between the unburned and the burned gas, was distorted under the influence of buoyancy and viscosity. The
- 116 -

expansion behaviors between 0.9 and 1.2 were almost the same except for their temporal responses. The top
picture in Figure 4-3 shows the high-speed video images of the flame front propagation behavior of R1234yf for
1.35. No clear, smooth flame front was observed; the flame front was convoluted without symmetry and floated
upwards. Furthermore, the ignition characteristics of R1234yf were unstable and depended not only on its
flammability but also on the experimental conditions such as the discharge conditions, including the electrode
geometry and heat loss, as well as the vessel size and shape. Because it was difficult to examine the possibility of
these effects, alternatives such as a small spherical vessel (15 cm, 15 L) and a compact elongated cylindrical vessel
(inner diameter: 10 cm, and length: 20 cm) were prepared to investigate the flammable behavior upon ignition. The
bottom picture in Figure 4-3 shows the test results for the compact elongated vessel. A smooth and clear flame front
was observed that could not be seen in the large and small spherical vessels. The relationship between the fluid
dynamics at a high temperature, produced by the burned gas and buoyancy, and the slow burning velocity at the
bottom of the flame, resulted in the squeezed flame front shape. The flammability of the gas mixture in the closed
vessel was affected not only by the fuel/air mixture ratio, initial pressure, and initial temperature, but also by the vessel
size and shape, ignition source, and other factors. These results point to the influence of the small vessel volume and
shape; thus, the effect of the fluid dynamic behavior on the flammability must be considered in a full-scale situation.
R32 0.9
R32 1.2
100 ms 200 ms 300 ms 400 ms
Figure 4-2 Images of flame front propagation for R32 (top: = 0.9, bottom: = 1.2)
100 ms 200 ms 300 ms 400 ms
50 ms 100 ms 150 ms 200 ms
Figure 4-3 Images of flame propagation for R1234yf
( = 1.325, top: large spherical vessel, bottom: compact elongated vessel).
- 117 -
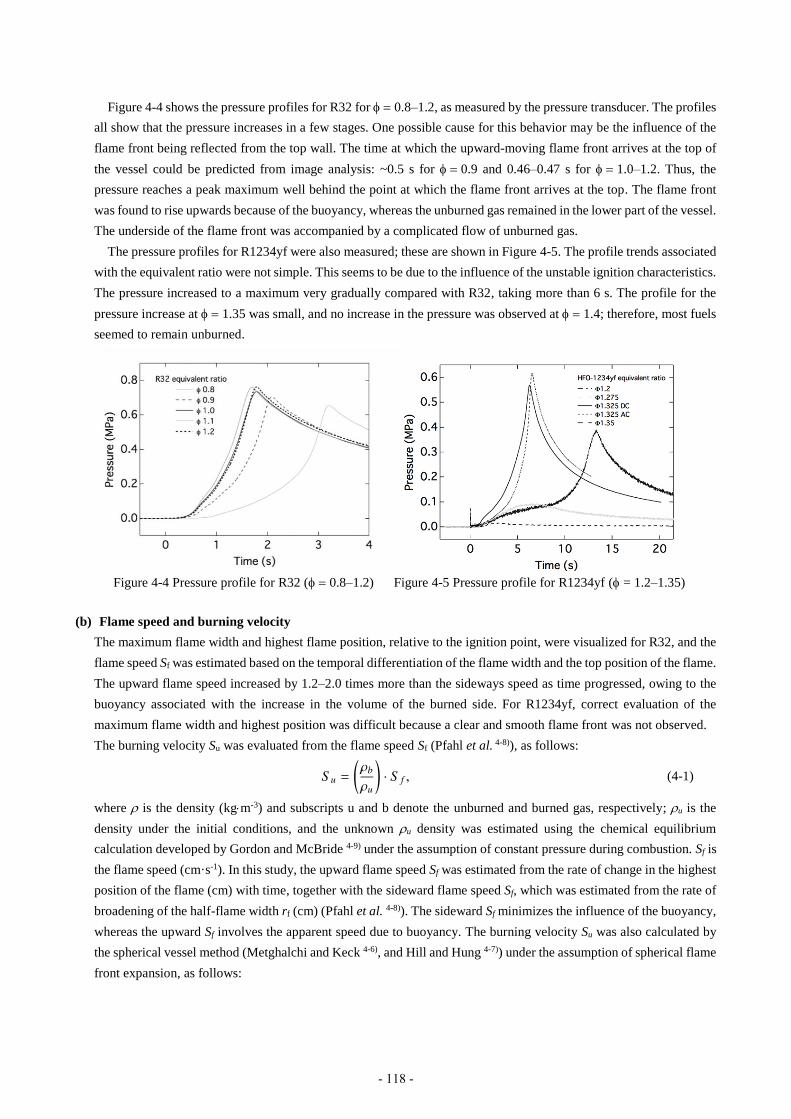
Figure 4-4 shows the pressure profiles for R32 for 0.8–1.2, as measured by the pressure transducer. The profiles
all show that the pressure increases in a few stages. One possible cause for this behavior may be the influence of the
flame front being reflected from the top wall. The time at which the upward-moving flame front arrives at the top of
the vessel could be predicted from image analysis: ~0.5 s for 0.9 and 0.46–0.47 s for 1.0–1.2. Thus, the
pressure reaches a peak maximum well behind the point at which the flame front arrives at the top. The flame front
was found to rise upwards because of the buoyancy, whereas the unburned gas remained in the lower part of the vessel.
The underside of the flame front was accompanied by a complicated flow of unburned gas.
The pressure profiles for R1234yf were also measured; these are shown in Figure 4-5. The profile trends associated
with the equivalent ratio were not simple. This seems to be due to the influence of the unstable ignition characteristics.
The pressure increased to a maximum very gradually compared with R32, taking more than 6 s. The profile for the
pressure increase at 1.35was small, and no increase in the pressure was observed at 1.4; therefore, most fuels
seemed to remain unburned.
Figure 4-4 Pressure profile for R32 (0.8–1.2) Figure 4-5 Pressure profile for R1234yf (= 1.2–1.35)
(b) Flame speed and burning velocity
The maximum flame width and highest flame position, relative to the ignition point, were visualized for R32, and the
flame speed Sf was estimated based on the temporal differentiation of the flame width and the top position of the flame.
The upward flame speed increased by 1.2–2.0 times more than the sideways speed as time progressed, owing to the
buoyancy associated with the increase in the volume of the burned side. For R1234yf, correct evaluation of the
maximum flame width and highest position was difficult because a clear and smooth flame front was not observed.
The burning velocity Su was evaluated from the flame speed Sf (Pfahl et al. 4-8)), as follows:
(4-1)
where is the density (kgm-3) and subscripts u and b denote the unburned and burned gas, respectively; u is the
density under the initial conditions, and the unknown u density was estimated using the chemical equilibrium
calculation developed by Gordon and McBride 4-9) under the assumption of constant pressure during combustion. Sf is
the flame speed (cm·s-1). In this study, the upward flame speed Sf was estimated from the rate of change in the highest
position of the flame (cm) with time, together with the sideward flame speed Sf, which was estimated from the rate of
broadening of the half-flame width rf (cm) (Pfahl et al. 4-8)). The sideward Sf minimizes the influence of the buoyancy,
whereas the upward Sf involves the apparent speed due to buoyancy. The burning velocity Su was also calculated by
the spherical vessel method (Metghalchi and Keck 4-6), and Hill and Hung 4-7)) under the assumption of spherical flame
front expansion, as follows:
- 118 -
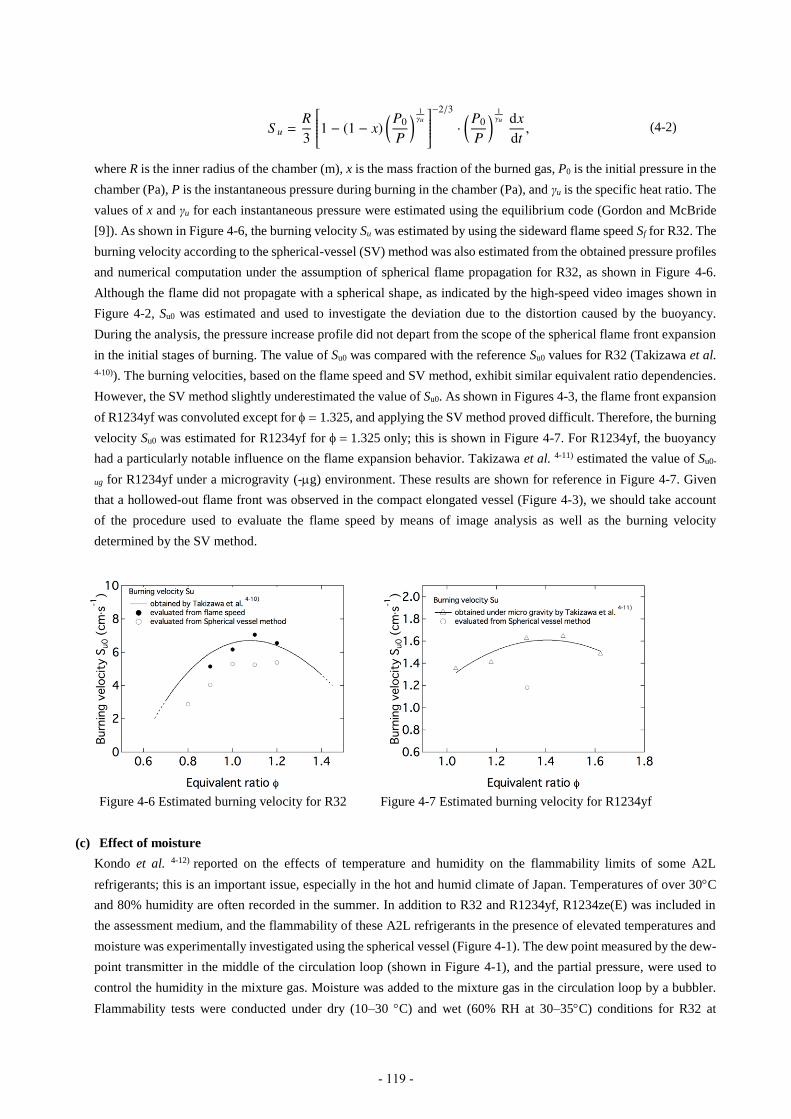
(4-2)
where R is the inner radius of the chamber (m), x is the mass fraction of the burned gas, P0 is the initial pressure in the
chamber (Pa), P is the instantaneous pressure during burning in the chamber (Pa), and γu is the specific heat ratio. The
values of x and γu for each instantaneous pressure were estimated using the equilibrium code (Gordon and McBride
[9]). As shown in Figure 4-6, the burning velocity Su was estimated by using the sideward flame speed Sf for R32. The
burning velocity according to the spherical-vessel (SV) method was also estimated from the obtained pressure profiles
and numerical computation under the assumption of spherical flame propagation for R32, as shown in Figure 4-6.
Although the flame did not propagate with a spherical shape, as indicated by the high-speed video images shown in
Figure 4-2, Su0 was estimated and used to investigate the deviation due to the distortion caused by the buoyancy.
During the analysis, the pressure increase profile did not depart from the scope of the spherical flame front expansion
in the initial stages of burning. The value of Su0 was compared with the reference Su0 values for R32 (Takizawa et al.
4-10)). The burning velocities, based on the flame speed and SV method, exhibit similar equivalent ratio dependencies.
However, the SV method slightly underestimated the value of Su0. As shown in Figures 4-3, the flame front expansion
of R1234yf was convoluted except for 1.325, and applying the SV method proved difficult. Therefore, the burning
velocity Su0 was estimated for R1234yf for 1.325only; this is shown in Figure 4-7. For R1234yf, the buoyancy
had a particularly notable influence on the flame expansion behavior. Takizawa et al. 4-11) estimated the value of Su0-
ug for R1234yf under a microgravity (-g) environment. These results are shown for reference in Figure 4-7. Given
that a hollowed-out flame front was observed in the compact elongated vessel (Figure 4-3), we should take account
of the procedure used to evaluate the flame speed by means of image analysis as well as the burning velocity
determined by the SV method.
Figure 4-6 Estimated burning velocity for R32 Figure 4-7 Estimated burning velocity for R1234yf
(c) Effect of moisture
Kondo et al. 4-12) reported on the effects of temperature and humidity on the flammability limits of some A2L
refrigerants; this is an important issue, especially in the hot and humid climate of Japan. Temperatures of over 30C
and 80% humidity are often recorded in the summer. In addition to R32 and R1234yf, R1234ze(E) was included in
the assessment medium, and the flammability of these A2L refrigerants in the presence of elevated temperatures and
moisture was experimentally investigated using the spherical vessel (Figure 4-1). The dew point measured by the dew-
point transmitter in the middle of the circulation loop (shown in Figure 4-1), and the partial pressure, were used to
control the humidity in the mixture gas. Moisture was added to the mixture gas in the circulation loop by a bubbler.
Flammability tests were conducted under dry (10–30 C) and wet (60% RH at 30–35C) conditions for R32 at
- 119 -
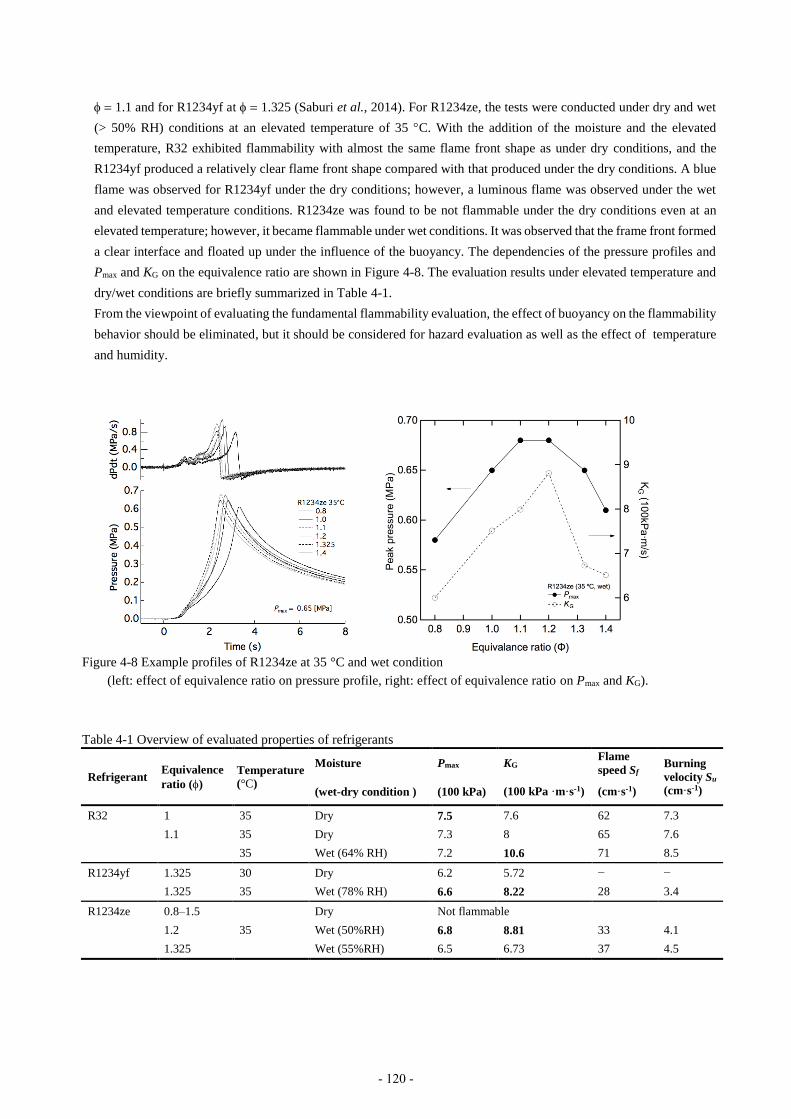
1.1and for R1234yf at 1.325 (Saburi et al., 2014). For R1234ze, the tests were conducted under dry and wet
(> 50% RH) conditions at an elevated temperature of 35 C. With the addition of the moisture and the elevated
temperature, R32 exhibited flammability with almost the same flame front shape as under dry conditions, and the
R1234yf produced a relatively clear flame front shape compared with that produced under the dry conditions. A blue
flame was observed for R1234yf under the dry conditions; however, a luminous flame was observed under the wet
and elevated temperature conditions. R1234ze was found to be not flammable under the dry conditions even at an
elevated temperature; however, it became flammable under wet conditions. It was observed that the frame front formed
a clear interface and floated up under the influence of the buoyancy. The dependencies of the pressure profiles and
Pmax and KG on the equivalence ratio are shown in Figure 4-8. The evaluation results under elevated temperature and
dry/wet conditions are briefly summarized in Table 4-1.
From the viewpoint of evaluating the fundamental flammability evaluation, the effect of buoyancy on the flammability
behavior should be eliminated, but it should be considered for hazard evaluation as well as the effect of temperature
and humidity.
Figure 4-8 Example profiles of R1234ze at 35 °C and wet condition
(left: effect of equivalence ratio on pressure profile, right: effect of equivalence ratio on Pmax and KG).
Table 4-1 Overview of evaluated properties of refrigerants
Refrigerant Equivalence
ratio ()
Temperature
(°C)
Moisture Pmax KG Flame
speed Sf Burning
velocity Su
(cm·s-1) (wet-dry condition ) (100 kPa) (100 kPa ·m·s-1) (cm·s-1)
R32 1 35 Dry 7.5 7.6 62 7.3
1.1 35 Dry 7.3 8 65 7.6
35 Wet (64% RH) 7.2 10.6 71 8.5
R1234yf 1.325 30 Dry 6.2 5.72 − −
1.325 35 Wet (78% RH) 6.6 8.22 28 3.4
R1234ze 0.8–1.5
35
Dry Not flammable
1.2 Wet (50%RH) 6.8 8.81 33 4.1
1.325 Wet (55%RH) 6.5 6.73 37 4.5
- 120 -
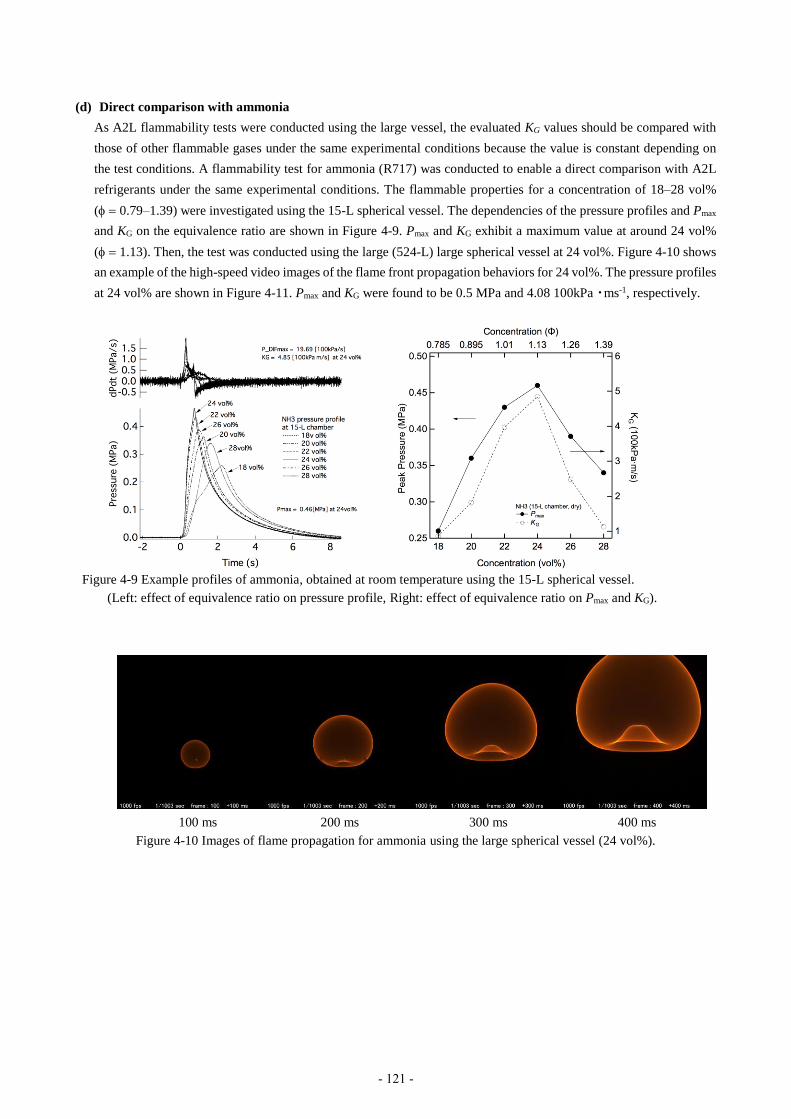
(d) Direct comparison with ammonia
As A2L flammability tests were conducted using the large vessel, the evaluated KG values should be compared with
those of other flammable gases under the same experimental conditions because the value is constant depending on
the test conditions. A flammability test for ammonia (R717) was conducted to enable a direct comparison with A2L
refrigerants under the same experimental conditions. The flammable properties for a concentration of 18–28 vol%
(0.79–1.39) were investigated using the 15-L spherical vessel. The dependencies of the pressure profiles and Pmax
and KG on the equivalence ratio are shown in Figure 4-9. Pmax and KG exhibit a maximum value at around 24 vol%
(1.13). Then, the test was conducted using the large (524-L) large spherical vessel at 24 vol%. Figure 4-10 shows
an example of the high-speed video images of the flame front propagation behaviors for 24 vol%. The pressure profiles
at 24 vol% are shown in Figure 4-11. Pmax and KG were found to be 0.5 MPa and 4.08 100kPa・ms-1, respectively.
Figure 4-9 Example profiles of ammonia, obtained at room temperature using the 15-L spherical vessel.
(Left: effect of equivalence ratio on pressure profile, Right: effect of equivalence ratio on Pmax and KG).
100 ms 200 ms 300 ms 400 ms
Figure 4-10 Images of flame propagation for ammonia using the large spherical vessel (24 vol%).
- 121 -
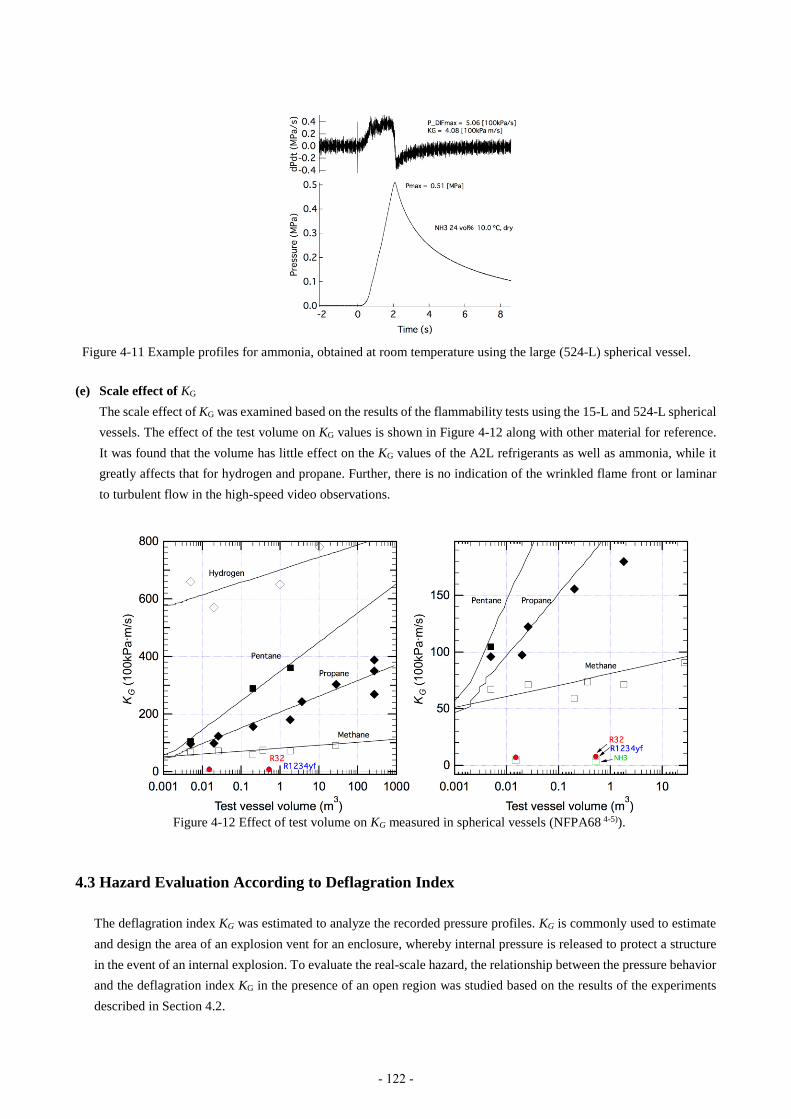
Figure 4-11 Example profiles for ammonia, obtained at room temperature using the large (524-L) spherical vessel.
(e) Scale effect of KG
The scale effect of KG was examined based on the results of the flammability tests using the 15-L and 524-L spherical
vessels. The effect of the test volume on KG values is shown in Figure 4-12 along with other material for reference.
It was found that the volume has little effect on the KG values of the A2L refrigerants as well as ammonia, while it
greatly affects that for hydrogen and propane. Further, there is no indication of the wrinkled flame front or laminar
to turbulent flow in the high-speed video observations.
Figure 4-12 Effect of test volume on KG measured in spherical vessels (NFPA68 4-5)).
4.3 Hazard Evaluation According to Deflagration Index
The deflagration index KG was estimated to analyze the recorded pressure profiles. KG is commonly used to estimate
and design the area of an explosion vent for an enclosure, whereby internal pressure is released to protect a structure
in the event of an internal explosion. To evaluate the real-scale hazard, the relationship between the pressure behavior
and the deflagration index KG in the presence of an open region was studied based on the results of the experiments
described in Section 4.2.
- 122 -
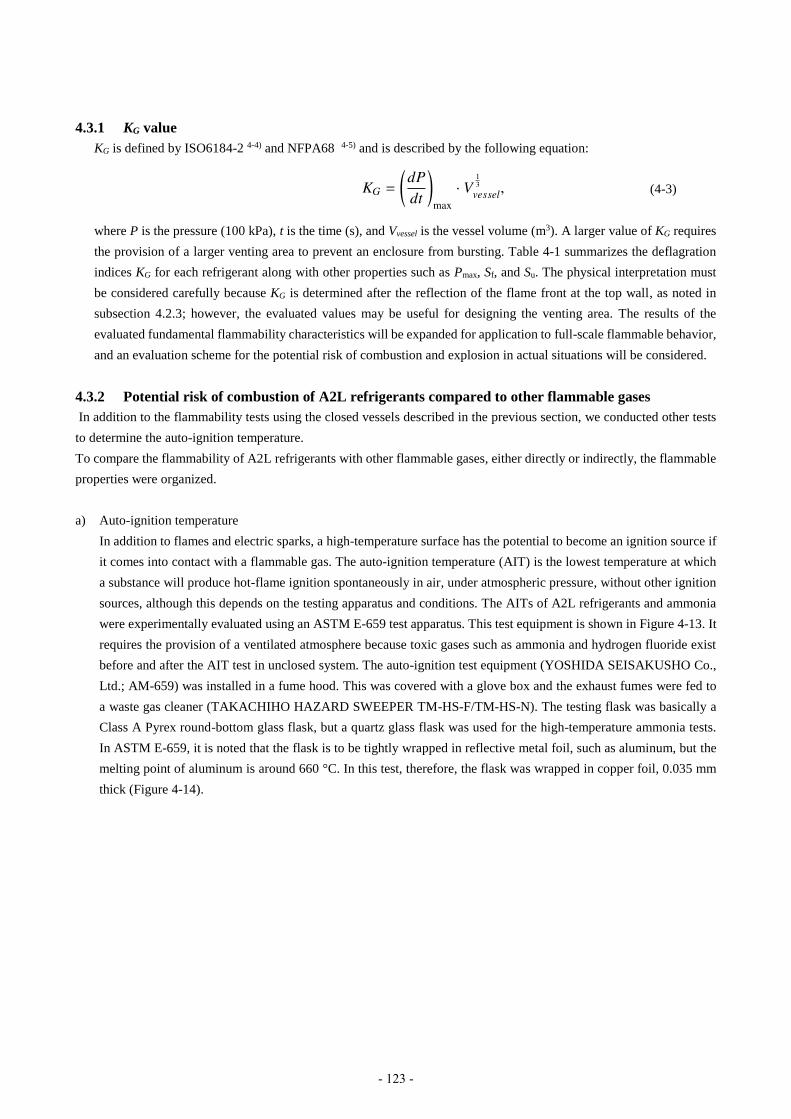
4.3.1 KG value
KG is defined by ISO6184-2 4-4) and NFPA68 4-5) and is described by the following equation:
(4-3)
where P is the pressure (100 kPa), t is the time (s), and Vvessel is the vessel volume (m3). A larger value of KG requires
the provision of a larger venting area to prevent an enclosure from bursting. Table 4-1 summarizes the deflagration
indices KG for each refrigerant along with other properties such as Pmax, Sf, and Su. The physical interpretation must
be considered carefully because KG is determined after the reflection of the flame front at the top wall, as noted in
subsection 4.2.3; however, the evaluated values may be useful for designing the venting area. The results of the
evaluated fundamental flammability characteristics will be expanded for application to full-scale flammable behavior,
and an evaluation scheme for the potential risk of combustion and explosion in actual situations will be considered.
4.3.2 Potential risk of combustion of A2L refrigerants compared to other flammable gases
In addition to the flammability tests using the closed vessels described in the previous section, we conducted other tests
to determine the auto-ignition temperature.
To compare the flammability of A2L refrigerants with other flammable gases, either directly or indirectly, the flammable
properties were organized.
a) Auto-ignition temperature
In addition to flames and electric sparks, a high-temperature surface has the potential to become an ignition source if
it comes into contact with a flammable gas. The auto-ignition temperature (AIT) is the lowest temperature at which
a substance will produce hot-flame ignition spontaneously in air, under atmospheric pressure, without other ignition
sources, although this depends on the testing apparatus and conditions. The AITs of A2L refrigerants and ammonia
were experimentally evaluated using an ASTM E-659 test apparatus. This test equipment is shown in Figure 4-13. It
requires the provision of a ventilated atmosphere because toxic gases such as ammonia and hydrogen fluoride exist
before and after the AIT test in unclosed system. The auto-ignition test equipment (YOSHIDA SEISAKUSHO Co.,
Ltd.; AM-659) was installed in a fume hood. This was covered with a glove box and the exhaust fumes were fed to
a waste gas cleaner (TAKACHIHO HAZARD SWEEPER TM-HS-F/TM-HS-N). The testing flask was basically a
Class A Pyrex round-bottom glass flask, but a quartz glass flask was used for the high-temperature ammonia tests.
In ASTM E-659, it is noted that the flask is to be tightly wrapped in reflective metal foil, such as aluminum, but the
melting point of aluminum is around 660 °C. In this test, therefore, the flask was wrapped in copper foil, 0.035 mm
thick (Figure 4-14).
- 123 -

Figure 4-13 ASTM E659 test equipment
Figure 4-14 ASTM E659 test equipment (left: plunger system, right: test flask with copper foil).
Photographs of the flask neck at auto-ignition for R1234yf, R1234ze (E), R32, and ammonia are shown in Figure 4-15.
The temperature profiles for these gases, as measured by a data logger, are shown in Figure 4-16. For R1234yf and
R1234ze(E), the ignition time, which is the time (s) between the insertion of the sample into the flask and ignition,
gradually increases with the approach of AIT. The lowest temperatures at which ignition can be visually recognized are
357C for R1234yf and 356C for R1234ze(E). Below these temperatures, that was no ignition or rapid rise in the
temperature. For R32, the ignition time is not as dependent on the operating temperature as R1234yf and R1234ze(E),
being around 10 s. The lowest temperature at which ignition was recognized by visual judgement was 478C for R32. On
the other hand, the AIT of ammonia is known to be 651C but it was difficult to judge ignition visually at these operating
temperatures because the furnace of the apparatus itself started to glow red. When the operating temperature approached
the decomposition temperature of ammonia, the glow was recognized at the injection needle as soon as the sample was
injected. The increase in the temperature was observed but it was in the order of 20–30 C. Visual judgement became
difficult and the temperature rise became smaller as the operating temperature decreased. Therefore, it proved difficult to
determine the AIT of the ammonia with the test equipment. The AIT test results are summarized in Table 4-2.
.
- 124 -

R1234yf R1234ze(E)
R32 NH3
Figure 4-15 Captured images of auto-ignition
(upper left: R1234yf, upper right: R1234ze(E), lower left: R32, lower right: NH3).
R1234yf R1234ze(E)
R32 NH3
Figure 4-16 ASTM E659 temperature profiles
(upper left: R1234yf, upper right: R1234ze(E), lower left: R32, lower right: NH3).
- 125 -
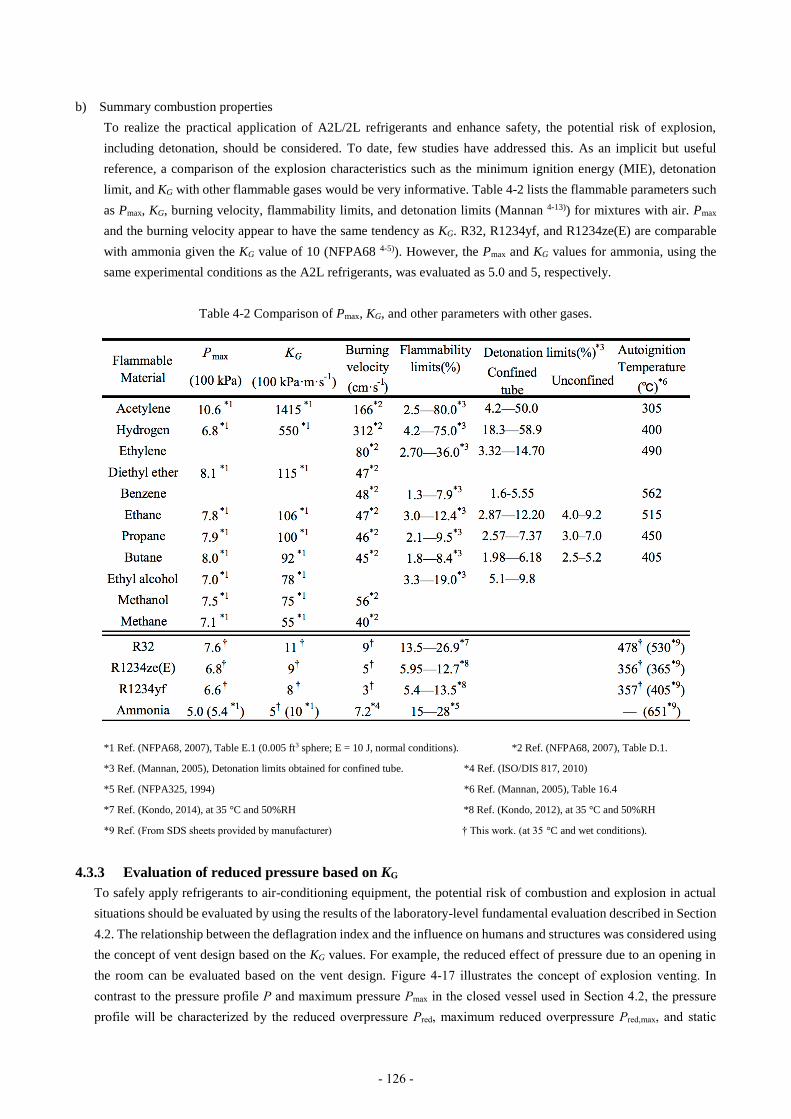
b) Summary combustion properties
To realize the practical application of A2L/2L refrigerants and enhance safety, the potential risk of explosion,
including detonation, should be considered. To date, few studies have addressed this. As an implicit but useful
reference, a comparison of the explosion characteristics such as the minimum ignition energy (MIE), detonation
limit, and KG with other flammable gases would be very informative. Table 4-2 lists the flammable parameters such
as Pmax, KG, burning velocity, flammability limits, and detonation limits (Mannan 4-13)) for mixtures with air. Pmax
and the burning velocity appear to have the same tendency as KG. R32, R1234yf, and R1234ze(E) are comparable
with ammonia given the KG value of 10 (NFPA68 4-5)). However, the Pmax and KG values for ammonia, using the
same experimental conditions as the A2L refrigerants, was evaluated as 5.0 and 5, respectively.
Table 4-2 Comparison of Pmax, KG, and other parameters with other gases.
*1 Ref. (NFPA68, 2007), Table E.1 (0.005 ft3 sphere; E = 10 J, normal conditions). *2 Ref. (NFPA68, 2007), Table D.1.
*3 Ref. (Mannan, 2005), Detonation limits obtained for confined tube. *4 Ref. (ISO/DIS 817, 2010)
*5 Ref. (NFPA325, 1994) *6 Ref. (Mannan, 2005), Table 16.4
*7 Ref. (Kondo, 2014), at 35 °C and 50%RH *8 Ref. (Kondo, 2012), at 35 °C and 50%RH
*9 Ref. (From SDS sheets provided by manufacturer) † This work. (at 35 °C and wet conditions).
4.3.3 Evaluation of reduced pressure based on KG
To safely apply refrigerants to air-conditioning equipment, the potential risk of combustion and explosion in actual
situations should be evaluated by using the results of the laboratory-level fundamental evaluation described in Section
4.2. The relationship between the deflagration index and the influence on humans and structures was considered using
the concept of vent design based on the KG values. For example, the reduced effect of pressure due to an opening in
the room can be evaluated based on the vent design. Figure 4-17 illustrates the concept of explosion venting. In
contrast to the pressure profile P and maximum pressure Pmax in the closed vessel used in Section 4.2, the pressure
profile will be characterized by the reduced overpressure Pred, maximum reduced overpressure Pred,max, and static
- 126 -

activation overpressure for the vent Pstat. The vent area A versus the designated reduced pressure Pred,max for KG can be
estimated from various models (VDI-3673 4-14); BS EN 144914-15); Siwek 4-16)). On the other hand, the vent area A is
usually assumed to be circular or square. If the vent is rectangular, the ratio of the long side (L) to the short side (D)
should not exceed 2 (NIIS-TR-No.38 4-17)). In an actual situation in a room, L/D will exceed 2, so the effective venting
area Av should be evaluated experimentally. A spherical closed vessel was used in Section 4.2, whereas a cubic vessel
with 50-cm sides was prepared to simulate a room. A schematic of the apparatus and a photograph of the cubic vessel
are shown in Figures 4-18 and 4-19. The vessel is made of 3-mm stainless steel and is equipped with a viewing window
made of 10-mm PMMA in the front side of the vessel. A vent hole which is changeable its shape, size and position is
fabricated on the side of the vessel to evaluate the fundamental pressure-reducing effect on the presence of the venting
space. The venting area was sealed with plastic wrap. Tubes acting as the fuel gas inlet, exhaust gas outlet, and fuel
concentration analysis point were arranged on the top of the vessel. The gas concentration can be adjusted and
determined by the partial pressure in a closed vessel; however, this evaluation was not possible in this vessel, so the
concentration was measured by FT-IR analysis. The fuel gas was leaked into the vessel through the gas inlet tube at a
rate of 10 g/min. A fan mixed the fuel and air in the vessel to attain the premix condition. The gas concentration was
measured at a point 15 cm from the bottom. A discharge electrode was positioned at a point 15 cm from the bottom.
Two breather valves were mounted on the top of the vessel to prevent the buildup of excess pressure and protect the
vessel structure. The measurements of the discharge voltage and current, pressure, and temperature in the vessel, as
well as the observation of the flammable behavior using the high-speed video camera, were conducted concurrently
with the ignition.
Figure 4-17 Reduced pressure behavior for venting.
- 127 -
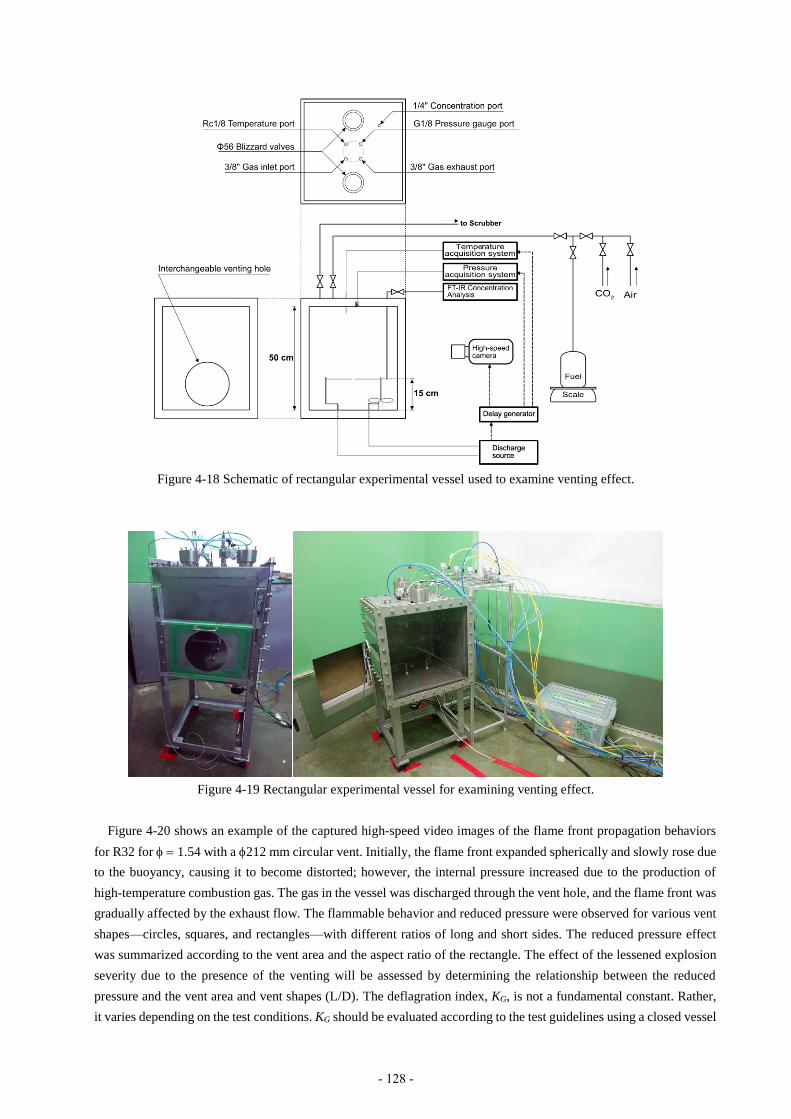
Figure 4-18 Schematic of rectangular experimental vessel used to examine venting effect.
Figure 4-19 Rectangular experimental vessel for examining venting effect.
Figure 4-20 shows an example of the captured high-speed video images of the flame front propagation behaviors
for R32 for 1.54 with a 212 mm circular vent. Initially, the flame front expanded spherically and slowly rose due
to the buoyancy, causing it to become distorted; however, the internal pressure increased due to the production of
high-temperature combustion gas. The gas in the vessel was discharged through the vent hole, and the flame front was
gradually affected by the exhaust flow. The flammable behavior and reduced pressure were observed for various vent
shapes—circles, squares, and rectangles—with different ratios of long and short sides. The reduced pressure effect
was summarized according to the vent area and the aspect ratio of the rectangle. The effect of the lessened explosion
severity due to the presence of the venting will be assessed by determining the relationship between the reduced
pressure and the vent area and vent shapes (L/D). The deflagration index, KG, is not a fundamental constant. Rather,
it varies depending on the test conditions. KG should be evaluated according to the test guidelines using a closed vessel
- 128 -

4-5), so KG
* was used in this part as the apparent deflagration index which is evaluated with an unclosed rectangular
vessel equipped with a vent hole. The reduction in the pressure, Pred, and KG* were evaluated by changing the area of
the circular vent, as shown in Figure 4-21. Both values increased as the vent area decreased. The value Pred saturated
at around 25 kPa due to the activation of breather valve for test vessel safety. KG* could be evaluated because the
temporal change in the reduction in the pressure dPred/dt, reached a maximum before the Pred reached its maximum.
The results of a series of experiments on the effects of vent shape and vent size under various concentrations were
combined. The dependencies of Pred and KG* on the concentration of R32 and the vent area are shown in Figures 4-22
and 4-23, respectively. Although there is no obvious effect of the different vent shapes (circular vs. rectangular) on
the reduction in pressure, the values of Pred do not vary substantially regardless of the shape of the vent hole, and the
values of KG* were found to be similar regardless of the vent shape under the experimental conditions. An example of
the effect of the vent shape on the pressure profile for a vent area of 25cm2 for R32 is shown in Figure 4-24. The
experiment was also conducted for R1234yf under a nearly fixed concentration. The results of this experiment are
shown in Figures 4-25 and 4-26.
The minimum required vent area for a low-strength enclosure is defined in NFPA68 4-5), as:
(4-4)
where Av is the vent area (m2), C is the venting parameter, and As is the internal surface area of the enclosure (m2).
The venting parameter C is defined by an equation or a table for the fundamental burning velocity. Figure 4-27 shows
the vent area for the vessel used for this experiment. The evaluated Av is fully satisfied by the results obtained in the
experiment.
The results obtained in this experiment were evaluated by assuming premixing, that is, the worst-case condition.
For the vent design for a dust explosion, the required venting area is expected to be smaller when the dust is localized
in the space. In this case, the vent area can be estimated from the occupancy of the combustible area in the space 4-17).
It is generally assumed that a partially combustible region will form near the floor in the case of a slow leakage of
refrigerant. To deal with this, a treatment similar to the design of the vent area for dust is expected to be applied.
50 ms 150 ms 250 ms 350 ms 450 ms
650 ms 850 ms 1050 ms 1250 ms 1450 ms
Figure 4-20 Images of flame propagation for R32 ( = 1.54) in rectangular vessel with 212 mm circular vent.
- 129 -
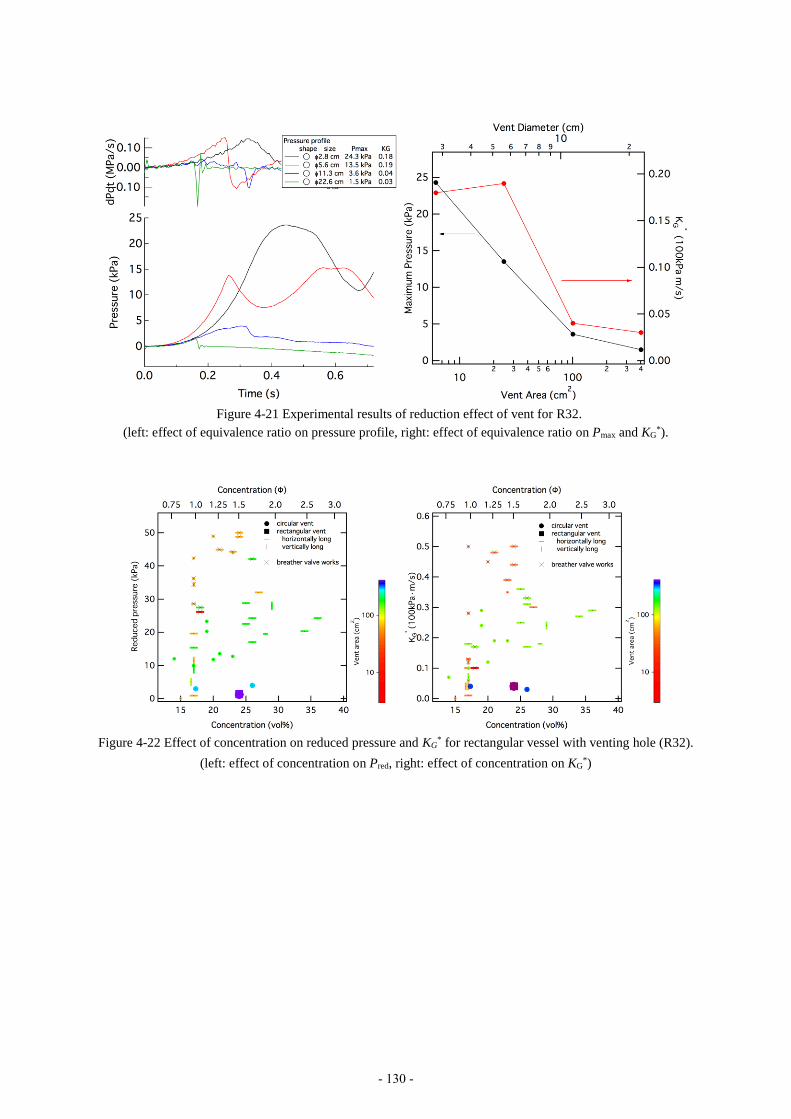
Figure 4-21 Experimental results of reduction effect of vent for R32.
(left: effect of equivalence ratio on pressure profile, right: effect of equivalence ratio on Pmax and KG*).
Figure 4-22 Effect of concentration on reduced pressure and KG* for rectangular vessel with venting hole (R32).
(left: effect of concentration on Pred, right: effect of concentration on KG*)
- 130 -
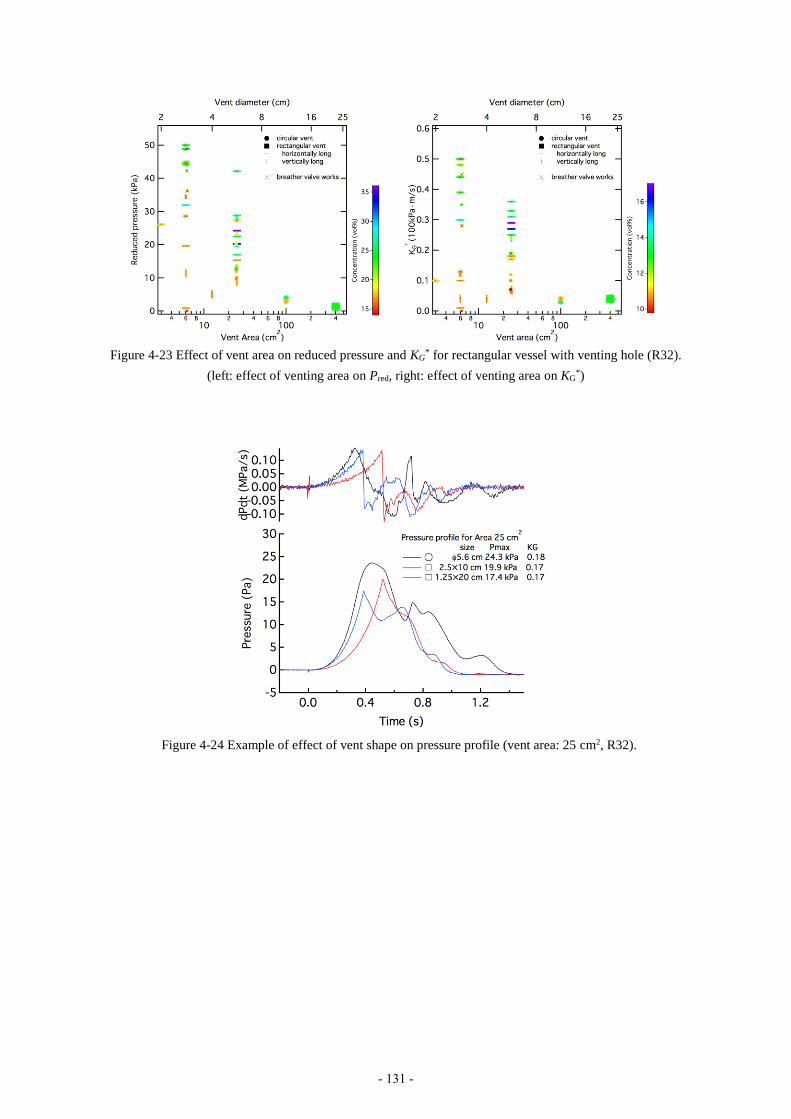
Figure 4-23 Effect of vent area on reduced pressure and KG* for rectangular vessel with venting hole (R32).
(left: effect of venting area on Pred, right: effect of venting area on KG*)
Figure 4-24 Example of effect of vent shape on pressure profile (vent area: 25 cm2, R32).
- 131 -
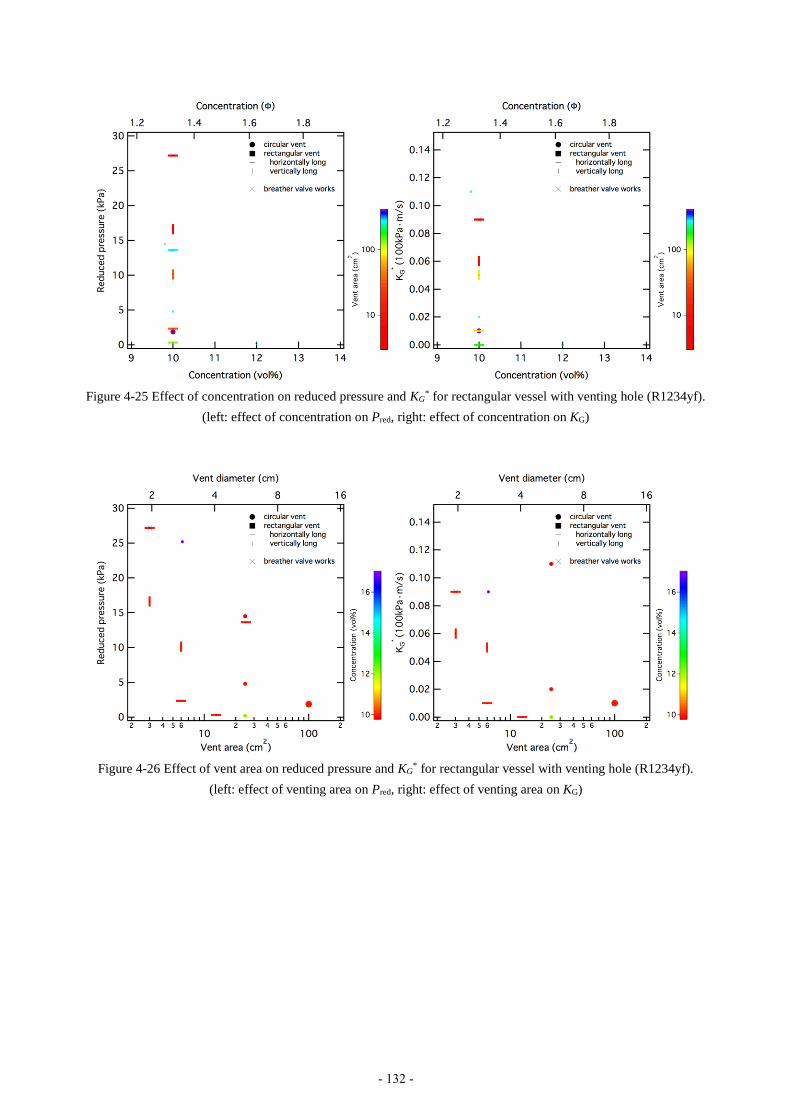
Figure 4-25 Effect of concentration on reduced pressure and KG* for rectangular vessel with venting hole (R1234yf).
(left: effect of concentration on Pred, right: effect of concentration on KG)
Figure 4-26 Effect of vent area on reduced pressure and KG* for rectangular vessel with venting hole (R1234yf).
(left: effect of venting area on Pred, right: effect of venting area on KG)
- 132 -

Figure 4-27 Designed vent size for low-strength enclosure according to NFPA68 [5] (L 50-cm rectangular vessel).
4.4 Combustion model to simulate experimental results
To perform a safety assessment of flammable refrigerants based on an accident scenario, it is necessary to assume many
situations such as the leak location (room), leak position, amount of leaked refrigerant, the distribution of the flammable
area, and so on. It is therefore difficult to undertake a full-scale experimental evaluation. The application of numerical
simulation is straightforward and is expected to become the accepted procedure in the future. In this section, a numerical
simulation for reproducing the combustion experiment described in Section 4.1 is considered in an effort to perform a
full-scale numerical evaluation. This requires a combustion model capable of reproducing the slow burning velocity of
A2L refrigerants.
There have been many studies of numerical simulation for combustion, but there have been very few reports addressing
the combustion reaction of A2L refrigerants. Therefore, there is a need to construct a numerical combustion model for
A2L/2L−air premixed gases, as well as the development of a computational fluid dynamics (CFD) code to be incorporated
into the combustion model to enable the simulation of the combustion behavior of refrigerants under various conditions
to be simulated and thus help to estimate the flame propagation distance and blast pressure. As an empirical approach, an
Arrhenius-type one-step global reaction model could be applied. However, to simulate the flammable behaviors and
estimate the explosion effect under actual situations, such as with different concentration gradients, a more reproducible
and explanatory model should be applied and examined. The construction of a detailed reaction model of A2L refrigerant
would be preferable, but the construction of such a model would not be easy. For example, given that it requires 20
reactions to describe hydrogen combustion, it would require an enormous number of species and reactions to describe the
A2L refrigerant reaction. Therefore, there is a need for a reduced model.
In this study, we considered a practical and capable model. Premixed combustion was assumed in this study. A
combustion model that considers a turbulent diffusion flame to be an ensemble of laminar diffusion flamelets was adopted,
as was a scalar variable, c, which describes the transport of the flame front, thus giving,
(4-5)
where ST is the turbulent burning velocity. This is related to the laminar burning velocity, SL, as follows:
(4-6)
- 133 -
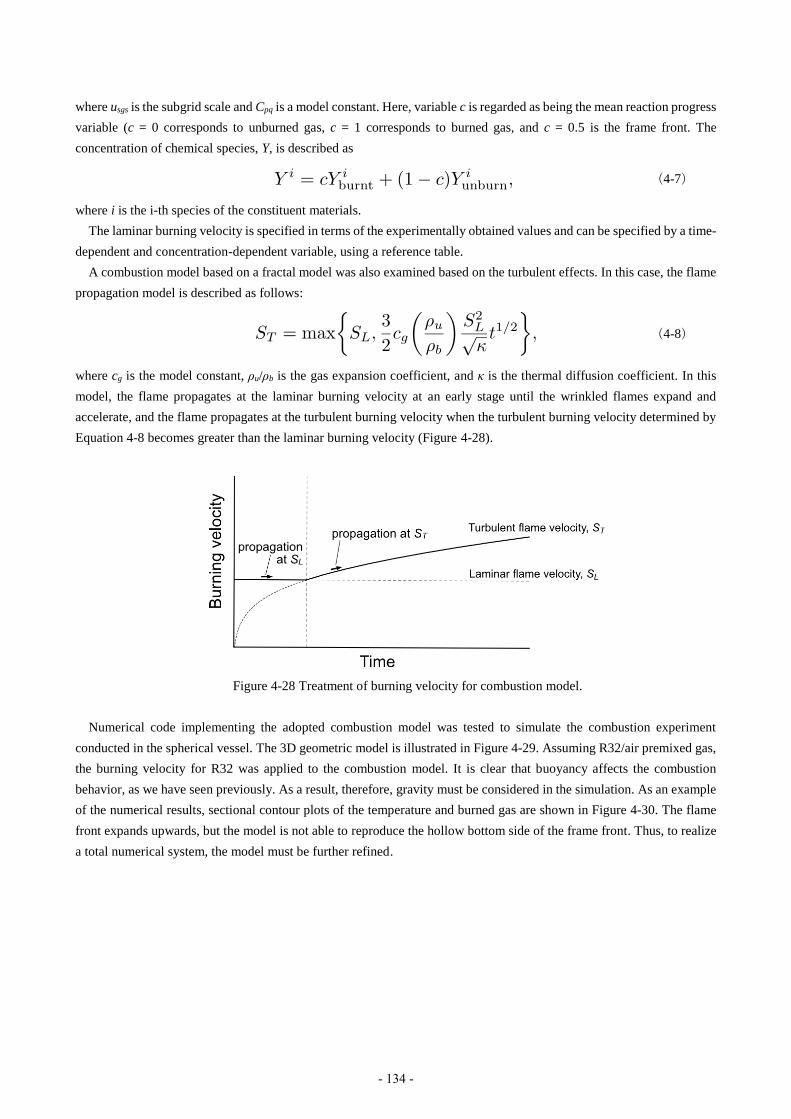
where usgs is the subgrid scale and Cpq is a model constant. Here, variable c is regarded as being the mean reaction progress
variable (c = 0 corresponds to unburned gas, c = 1 corresponds to burned gas, and c = 0.5 is the frame front. The
concentration of chemical species, Y, is described as
(4-7)
where i is the i-th species of the constituent materials.
The laminar burning velocity is specified in terms of the experimentally obtained values and can be specified by a time-
dependent and concentration-dependent variable, using a reference table.
A combustion model based on a fractal model was also examined based on the turbulent effects. In this case, the flame
propagation model is described as follows:
(4-8)
where cg is the model constant, ρu/ρb is the gas expansion coefficient, and κ is the thermal diffusion coefficient. In this
model, the flame propagates at the laminar burning velocity at an early stage until the wrinkled flames expand and
accelerate, and the flame propagates at the turbulent burning velocity when the turbulent burning velocity determined by
Equation 4-8 becomes greater than the laminar burning velocity (Figure 4-28).
Figure 4-28 Treatment of burning velocity for combustion model.
Numerical code implementing the adopted combustion model was tested to simulate the combustion experiment
conducted in the spherical vessel. The 3D geometric model is illustrated in Figure 4-29. Assuming R32/air premixed gas,
the burning velocity for R32 was applied to the combustion model. It is clear that buoyancy affects the combustion
behavior, as we have seen previously. As a result, therefore, gravity must be considered in the simulation. As an example
of the numerical results, sectional contour plots of the temperature and burned gas are shown in Figure 4-30. The flame
front expands upwards, but the model is not able to reproduce the hollow bottom side of the frame front. Thus, to realize
a total numerical system, the model must be further refined.
- 134 -
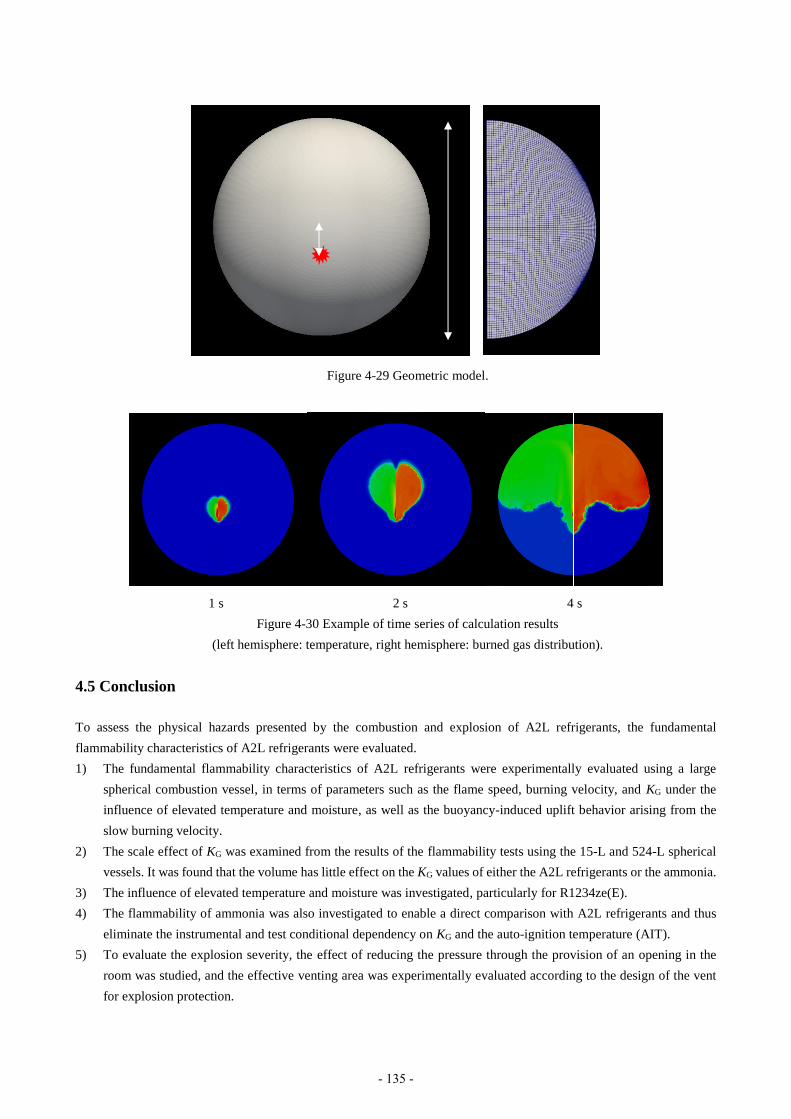
Figure 4-29 Geometric model.
1 s 2 s 4 s
Figure 4-30 Example of time series of calculation results
(left hemisphere: temperature, right hemisphere: burned gas distribution).
4.5 Conclusion
To assess the physical hazards presented by the combustion and explosion of A2L refrigerants, the fundamental
flammability characteristics of A2L refrigerants were evaluated.
1) The fundamental flammability characteristics of A2L refrigerants were experimentally evaluated using a large
spherical combustion vessel, in terms of parameters such as the flame speed, burning velocity, and KG under the
influence of elevated temperature and moisture, as well as the buoyancy-induced uplift behavior arising from the
slow burning velocity.
2) The scale effect of KG was examined from the results of the flammability tests using the 15-L and 524-L spherical
vessels. It was found that the volume has little effect on the KG values of either the A2L refrigerants or the ammonia.
3) The influence of elevated temperature and moisture was investigated, particularly for R1234ze(E).
4) The flammability of ammonia was also investigated to enable a direct comparison with A2L refrigerants and thus
eliminate the instrumental and test conditional dependency on KG and the auto-ignition temperature (AIT).
5) To evaluate the explosion severity, the effect of reducing the pressure through the provision of an opening in the
room was studied, and the effective venting area was experimentally evaluated according to the design of the vent
for explosion protection.
1着
0
- 135 -
6) To assess the explosion risk presented by A2L/2L refrigerants, the burning velocity and detonation limits were
compared with those of other flammable gases.
7) The reduction effect of the pressure due to the presence of an opening was investigated using an unclosed vessel.
8) A numerical combustion model for simulating the experimental results obtained with the vessel was examined.
Nomenclature
AV geometric vent area (m2)
Aeff effective vent area (m2)
Ef effective venting efficiency (%)
KG deflagration index for gases (100 kPam/s2)
P pressure (Pa)
Pmax maximum pressure (Pa)
Pred reduced pressure (Pa)
dP/dt rate of pressure rise (100 kPa/s)
Sf flame speed (cm/s)
Su fundamental burning velocity (cm/s)
Su0 fundamental burning velocity at ambient condition (cm/s)
t time (s)
T temperature (K)
Vvessel vessel volume (m3)
equivalence ratio
density (kg/m3)
References
4-1) Directive 2006/40/EC, Directive 2006/40/EC of the European Parliament and the Council of 17 May 2006 relating
to emissions from air-conditioning systems in motor vehicles and amending Council Directive 70/156/EEC, Official
Journal of the European Union, L 161:12-18..
4-2) ASHRAE, 2010, Designation and Safety Classification of Refrigerants, ANSI/ASHRAE Standard 34-2007
Addendum ak.
4-3) Takizawa, K., Tokuhashi, K., and Kondo, S., 2009, Flammability Assessment of CH2=CFCF3:
Comparison with Fluoroalkenes and Fluoroalkanes, Journal of Hazardous Materials, 172, pp. 1329–
1338.
4-4) ISO 6184-2, 1985, Explosion Protection Systems– Part 2: Determination of Explosion Indices of
Combustible Gases in Air.
4-5) NPFA, 2007, Guide for Venting of Deflagrations 2007 Edition, NPFA 68.
4-6) Metghalchi, M., and Keck, J. C., 1980, Combustion and Flame, 38, pp. 143–154.
4-7) Hill, P. G., and Hung, J., 1988, Laminar Burning Velocities of Stoichiometric Mixtures of Methane
with Propane and Ethane Additives, Combustion Science and Technology, 60, pp.7–30.
4-8) Pfahl, U. J., Ross, M. C., and Shepherd, J. E., 2000, Flammability Limits, Ignition Energy, and Flame
Speeds in H2−CH4−NH3−N2O−O2-N2 Mixtures, Combustion and Flame, 123, pp. 140–158.
4-9) Gordon, S., and McBride, B. J., 1994, Computer Program for Calculation of Complex Chemical
Equilibrium Compositions and Applications, I. Analysis, NASA RP-1311.
- 136 -
4-10) Takizawa, K., Takahashi, A., Tokuhashi, K. Kondo, S., and Sekiya, A., 2005, Burning Velocity
Measurement of Fluorinated Compounds by the Spherical-Vessel Method, Combustion and Flame,
141, pp. 298–307.
4-11) Takizawa, K., Tokuhashi, K., Kondo, S., Mamiya, M., and Nagai, H., 2010, Flammability Assessment
of CH2=CFCF3 (R-1234yf) and its Mixtures with CH2F2 (R-32), 2010 International Symposium on
Next-generation Air-conditioning and Refrigeration Technology, Tokyo, P 08.
4-12) Kondo, S., Takizawa, K., and Tokuhashi, K., 2012, Effects of Temperature and Humidity on the
Flammability Limits of Several 2L Refrigerants, Journal of Fluorine Chemistry, 144, pp. 130–136.
4-13) Mannan, S., 2005, Lee’s Loss Prevention in the Process Industries, 3rd ed., Elsevier, 2, p.1383.
4-14) VDI-3673, 2002, Pressure Venting of Dust Explosions, Verein Deutscher Ingenieure.
4-15) BS EN 14491, 2012, Dust Explosion Venting Protective Systems, British Standards Institution.
4-16) Siwek, R., 1996, Explosion Venting Technology, J. Loss Prev. Process Ind., 9, 81–90.
4-17) NIIS-TR-No.38, 2005, Technical Recommendations of the National Institute of Industrial Safety,
ISSN 0911-8063 (in Japanese).
4-18) Tomizuka, T. et al., 2013, “A study of numerical hazard prediction method of gas explosion”,
International Journal of Hydrogen Energy, 38, pp.5176–5180.
- 137 -

Risk assessment
5. Procedure for the Risk Assessment of Mildly Flammable Refrigerants
5.1 Introduction
The Japan Refrigeration and Air Conditioning Industry Association (hereinafter, JRAIA) has been promoting the risk
assessment of mildly flammable refrigerants, focusing on R32 and R1234yf, since 2011, as shown in Fig. 5-1. We
describe risk assessment methods in this section.
2011 2012 2013 2014 2015 2016
JSRAE
Committee for risk
assessment of
mildly flammable
refrigerants
J
R
A
I
A
Mini-split 1
(Residential
AC)
VRF
Chiller
Mini-split 2
(Commercial
AC)
Figure 5-1 Schedule of research committee (Including JRAIA)
As shown in Fig. 5-2, in the risk assessment for mini-split air conditioners, the sub-working group I (SWG (I)) first
the hazards of R32 were compared with those of conventional refrigerants. The risks related to its flammability and
ignitability were clearly different from those for conventional refrigerants. Thus, the NEDO project initiated by
universities and research institutes commenced risk assessment for flammability, and the SWGs of JRAIA joined it 5-1),
5-2). At the time of commencement of the project, two hazards, namely, the generation of harmful fluorine compounds by
flame contact and diesel explosion during service and disposal, had not been studied. Hence, we had little scientific
knowledge about these hazards. The University of Tokyo and National Institute of Advanced Industrial Science and
Technology (AIST) then assessed these hazards. According to existing research, mildly flammable refrigerants do not
differ from the conventional refrigerants in terms of these two hazards, and the hazard can be accepted socially despite
some remaining problems. We do not have any plans to start risk assessment for these hazards.
Figure 5-2 Hazard comparison of mildly flammable and conventional refrigerants
Progress report
Progress report
Progress report
Progress report
Final report
Start
Kobe Symp. Kobe Symp. Kobe Symp. ICR2015
Risk assessment of wall-mounted ACs
Risk assessment of floor-standing ACs
Subject extraction
Subject extraction
Subject extraction
Subject extraction
Risk assessment
Risk assessment
Safety measure Guideline development
Guideline development
Guideline development
Reexamination
- 138 -
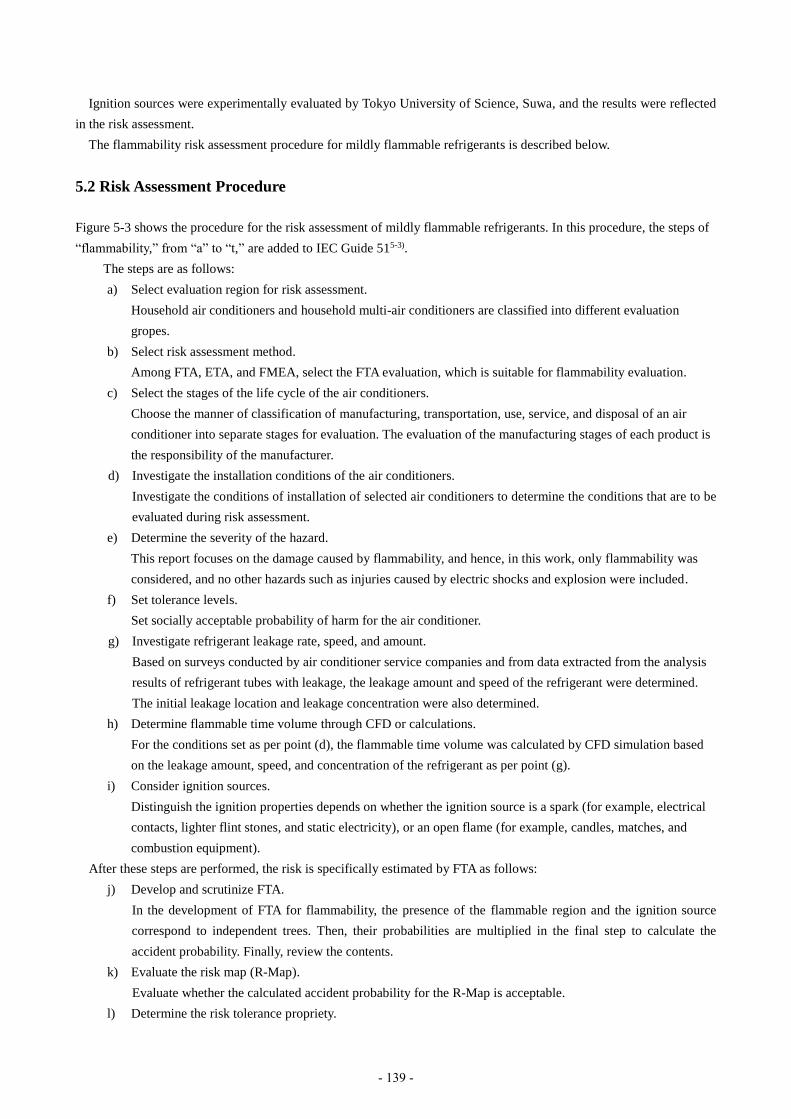
Ignition sources were experimentally evaluated by Tokyo University of Science, Suwa, and the results were reflected
in the risk assessment.
The flammability risk assessment procedure for mildly flammable refrigerants is described below.
5.2 Risk Assessment Procedure
Figure 5-3 shows the procedure for the risk assessment of mildly flammable refrigerants. In this procedure, the steps of
“flammability,” from “a” to “t,” are added to IEC Guide 515-3).
The steps are as follows:
a) Select evaluation region for risk assessment.
Household air conditioners and household multi-air conditioners are classified into different evaluation
gropes.
b) Select risk assessment method.
Among FTA, ETA, and FMEA, select the FTA evaluation, which is suitable for flammability evaluation.
c) Select the stages of the life cycle of the air conditioners.
Choose the manner of classification of manufacturing, transportation, use, service, and disposal of an air
conditioner into separate stages for evaluation. The evaluation of the manufacturing stages of each product is
the responsibility of the manufacturer.
d) Investigate the installation conditions of the air conditioners.
Investigate the conditions of installation of selected air conditioners to determine the conditions that are to be
evaluated during risk assessment.
e) Determine the severity of the hazard.
This report focuses on the damage caused by flammability, and hence, in this work, only flammability was
considered, and no other hazards such as injuries caused by electric shocks and explosion were included.
f) Set tolerance levels.
Set socially acceptable probability of harm for the air conditioner.
g) Investigate refrigerant leakage rate, speed, and amount.
Based on surveys conducted by air conditioner service companies and from data extracted from the analysis
results of refrigerant tubes with leakage, the leakage amount and speed of the refrigerant were determined.
The initial leakage location and leakage concentration were also determined.
h) Determine flammable time volume through CFD or calculations.
For the conditions set as per point (d), the flammable time volume was calculated by CFD simulation based
on the leakage amount, speed, and concentration of the refrigerant as per point (g).
i) Consider ignition sources.
Distinguish the ignition properties depends on whether the ignition source is a spark (for example, electrical
contacts, lighter flint stones, and static electricity), or an open flame (for example, candles, matches, and
combustion equipment).
After these steps are performed, the risk is specifically estimated by FTA as follows:
j) Develop and scrutinize FTA.
In the development of FTA for flammability, the presence of the flammable region and the ignition source
correspond to independent trees. Then, their probabilities are multiplied in the final step to calculate the
accident probability. Finally, review the contents.
k) Evaluate the risk map (R-Map).
Evaluate whether the calculated accident probability for the R-Map is acceptable.
l) Determine the risk tolerance propriety.
- 139 -
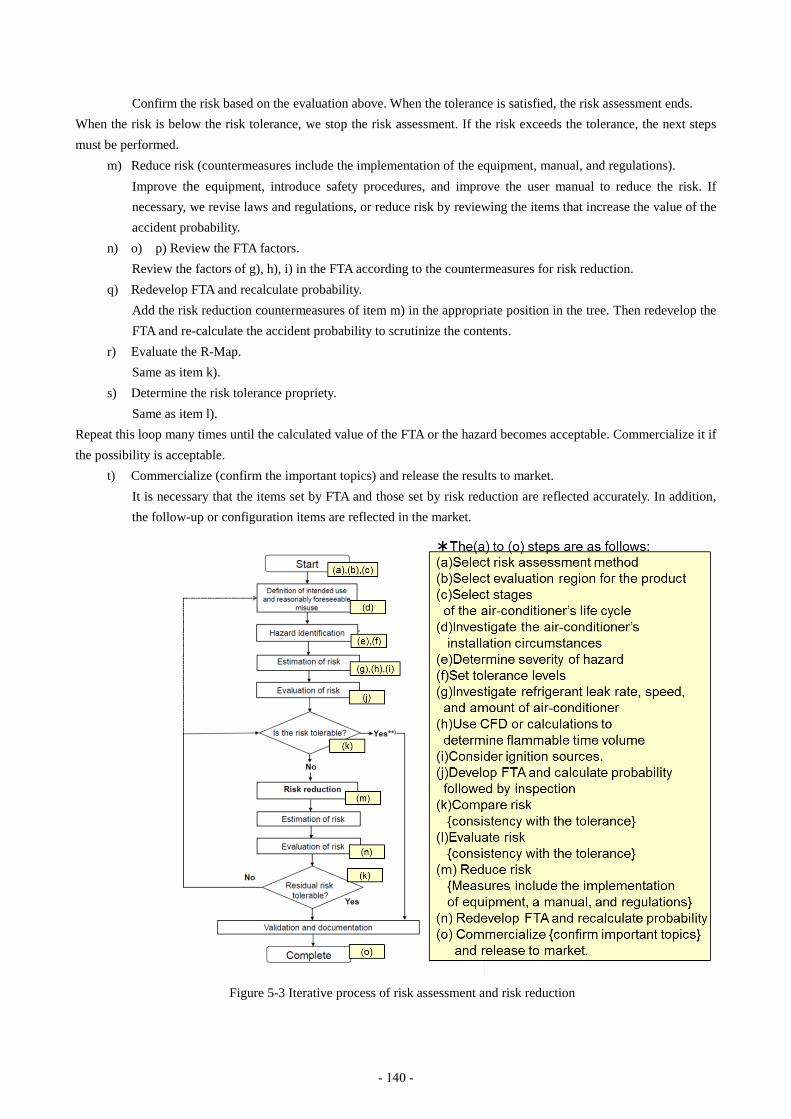
Confirm the risk based on the evaluation above. When the tolerance is satisfied, the risk assessment ends.
When the risk is below the risk tolerance, we stop the risk assessment. If the risk exceeds the tolerance, the next steps
must be performed.
m) Reduce risk (countermeasures include the implementation of the equipment, manual, and regulations).
Improve the equipment, introduce safety procedures, and improve the user manual to reduce the risk. If
necessary, we revise laws and regulations, or reduce risk by reviewing the items that increase the value of the
accident probability.
n) o) p) Review the FTA factors.
Review the factors of g), h), i) in the FTA according to the countermeasures for risk reduction.
q) Redevelop FTA and recalculate probability.
Add the risk reduction countermeasures of item m) in the appropriate position in the tree. Then redevelop the
FTA and re-calculate the accident probability to scrutinize the contents.
r) Evaluate the R-Map.
Same as item k).
s) Determine the risk tolerance propriety.
Same as item l).
Repeat this loop many times until the calculated value of the FTA or the hazard becomes acceptable. Commercialize it if
the possibility is acceptable.
t) Commercialize (confirm the important topics) and release the results to market.
It is necessary that the items set by FTA and those set by risk reduction are reflected accurately. In addition,
the follow-up or configuration items are reflected in the market.
Figure 5-3 Iterative process of risk assessment and risk reduction
- 140 -

In the NEDO project, two groups study the flammable properties test and those performing the risk assessment. Thus,
it may take time for the first groups to perform tests. The second groups of SWGs proceeded with the risk assessment
and improved the accuracy after obtaining experimental test results.
This procedure is described from the next section in detail.
In general, the risk assessment is performed using methods such as FTA, ETA, and FMEA. The risk assessment of
flammable refrigerants considers two individual phenomena: the presence of an ignition source and the generation of a
flammable volume. We choose the FTA to determine the individual phenomena because it allows easy calculations.
The risk assessment performed in 2011 at the JRAIA on the use of propane in air conditioners was also based on
FTA5-4), but the concept of R-maps had not been well established yet, and the accident-generation probability (i.e.,
tolerance) described below was not set. In particular, for safety evaluation, the concept of R-maps, as shown in Figure
5-4, is adopted.
In the risk assessment, the product committee in the JRAIA considered the following target equipment: a household
air conditioner, a building with multiple air conditioners, and a chiller. There are many variations in air-conditioning
equipment, and making clear divisions is difficult. However, although the products differ, the installation conditions,
usage state, installation persons, service persons, and disposal method (considering regulations) generally show distinct
features. It is necessary to classify
the air conditioners into groups and
assess the individual risk of each
group.
If the classification is very narrow,
the risk assessment becomes
complicated, and data common to
different groups cannot be collected
because the risk assessment needs to
be performed on an individual basis.
In addition, the number of target
products in circulation becomes less,
leading to a large tolerance value,
which is described later, and the
safety of the actual product may not
be sufficiently secured.
5.3 Air Conditioner Equipment and Risk Assessment Conditions
Figure 5-5 shows various types of air conditioners, and Table 5-1 compares the household air conditioners, commercial
air conditioners, building multi- air conditioners, and chillers.
Figure 5-5 Various types of air conditioners
Frequently 10-4
Some time 10-5
Rare 10-6
Usually not 10-7
Very difficult 10-8
Extremely difficult 10-9
Near zero 10-10
Possibility of an incident
0 Ⅰ Ⅱ Ⅲ Ⅳ
No
damage
Minor
damage(smoke
from
product)
Light
damage(fire from
product,
light injury)
Major
damage(fire,
human
injury)
Lethal
damage(permanent
injury, death,
burning
down of a
house)
Severity
Risk
Lik
elih
ood
Strategy of Risk Evaluation
Figure 5-4 Risk map
- 141 -
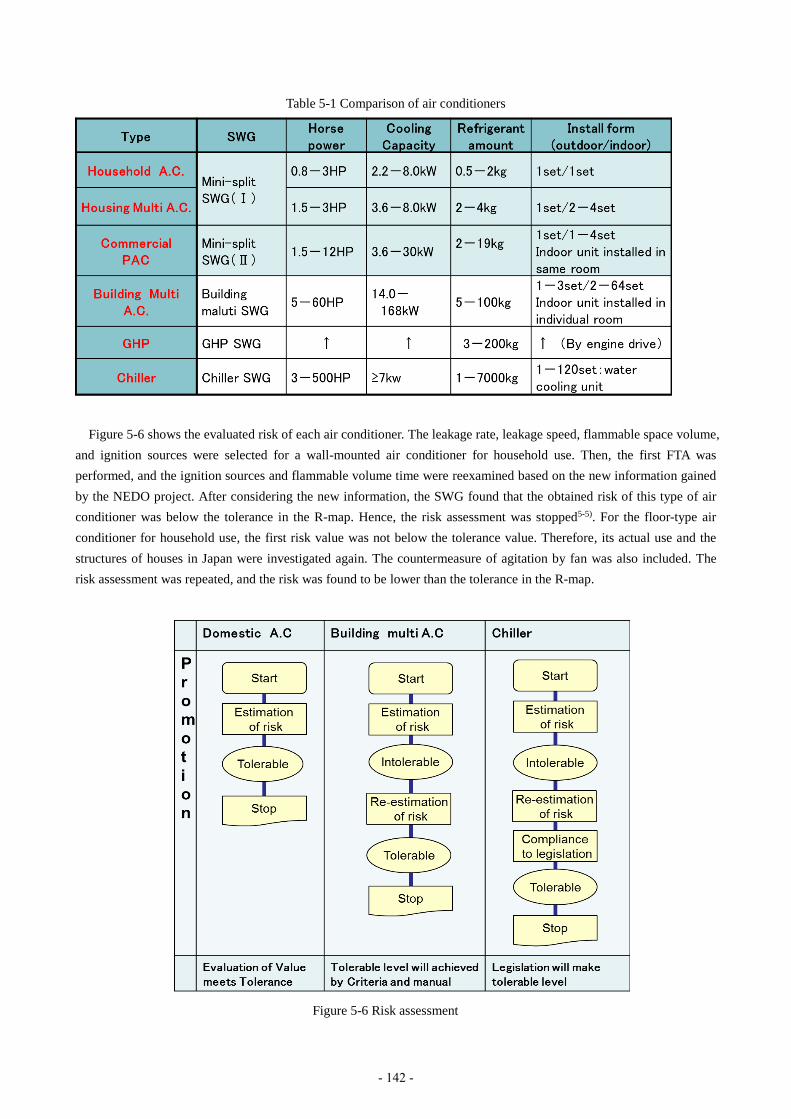
Table 5-1 Comparison of air conditioners
Figure 5-6 shows the evaluated risk of each air conditioner. The leakage rate, leakage speed, flammable space volume,
and ignition sources were selected for a wall-mounted air conditioner for household use. Then, the first FTA was
performed, and the ignition sources and flammable volume time were reexamined based on the new information gained
by the NEDO project. After considering the new information, the SWG found that the obtained risk of this type of air
conditioner was below the tolerance in the R-map. Hence, the risk assessment was stopped5-5). For the floor-type air
conditioner for household use, the first risk value was not below the tolerance value. Therefore, its actual use and the
structures of houses in Japan were investigated again. The countermeasure of agitation by fan was also included. The
risk assessment was repeated, and the risk was found to be lower than the tolerance in the R-map.
Figure 5-6 Risk assessment
- 142 -

Similarly, the values of the leakage rate, leakage speed, flammable time volume, and ignition sources were selected
for the commercial air conditioner and building multi-air conditioner, and they were evaluated in the first FTA.
However, the risks of semi-underground installations, installations in narrow places, and karaoke shops did not achieve
the tolerance values allowed in the R-map. Therefore, countermeasures were taken to develop a manual and standards to
ensure that the risk was below the tolerance.
As a chiller contains a large amount of refrigerant, the flammable time volume in the case of a leakage is large.
Because of the presence of numerous ignition sources, such as electromagnetic switches with large capacitance, near a
chiller, the risk exceeds the permitted tolerance according to the R-map. Therefore, an exhaust device needs to be
developed to ensure that a flammable volume is not formed. The SWG is considering regulations to enforce such a
countermeasure.
As the amount of the refrigerant charged in the equipment and the flammable time volume become larger, external
countermeasures such as gas alarms, spread fans, and exhaust fans gain importance as countermeasures in addition to
the countermeasures for the equipment itself. Manuals and industry association standards need to be incorporated to
enforce standards.
Hereinafter, the household air conditioners and chillers are distinguished in terms of the FTA depending on the
equipment and countermeasures. However, the basic risk assessment of the household air conditioners, commercial air
conditioners, building multi-air conditioners, and chillers does not greatly differ; hence, the steps for the risk assessment
of a household air conditioner are described below in detail. Content was extracted from the risk assessment method
described in the previous progress report, so there is some overlap. After the risk assessment procedure for a household
air conditioner is described, the differences between a building multi-air conditioner, commercial air conditioner, and
chiller are explained. The risk assessments for a building multi-air conditioner, commercial air conditioner, and chiller
are described later.
5.4 Risk Assessment Procedure for Household Air Conditioners
5.4.1 Tolerance level of risk assessment
Documents of the National Institute of Technology and Evaluation (NITE) are referred to describe the risk assessment
of accident probability. Figure 5-7 shows the outline of the risk levels5-6).
Figure 5-7 Risk levels
Large-scale facilities such as chemical plants are subject to various regulations and have a risk tolerance of
approximately 10-5. However, the tolerance for a home electronics unit owned by an ordinary consumer who does not
generally consider the maintenance is 10-8 accidents/year (based on a figure of 1 million sets sold). In other words, a
product is regarded as safe if a fatal accident occurs once in 100 years for 1 million sets in circulation. The total number
of household air conditioners in circulation is about 100 million, so the target probability for risk tolerance is 10-10
accidents/year.
An important fact with regard to the relation between the circulation number and accident probability is that there are
- 143 -
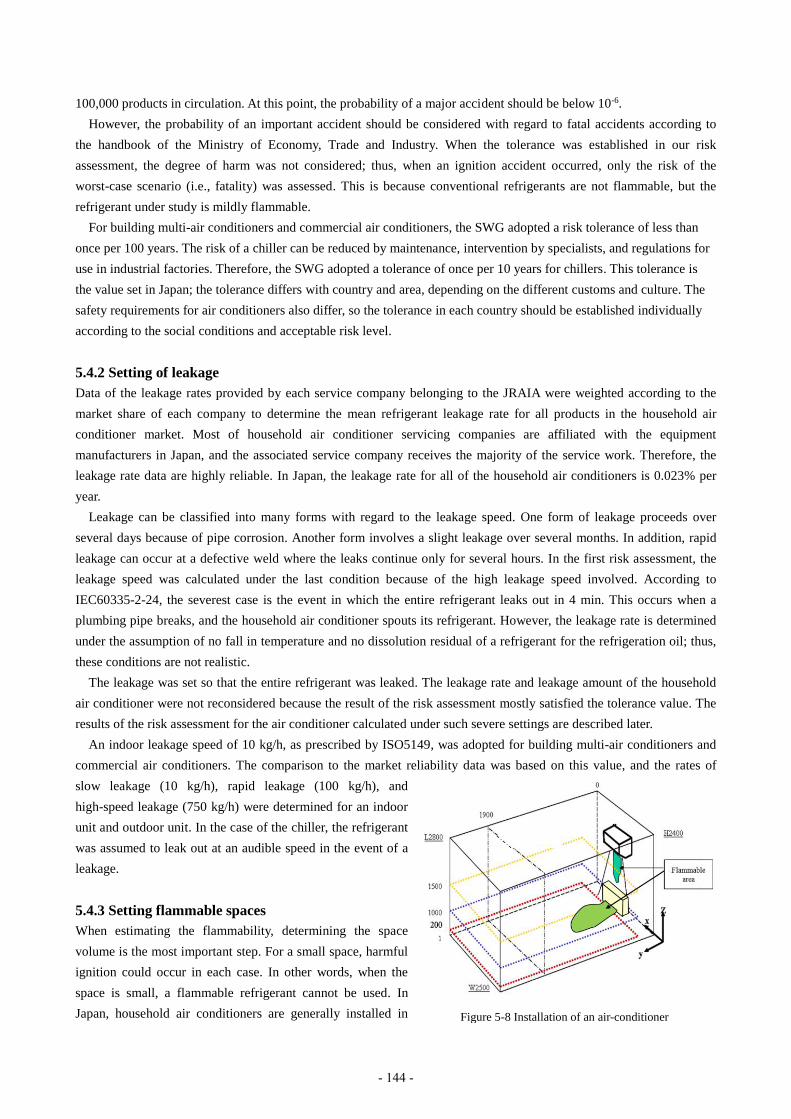
100,000 products in circulation. At this point, the probability of a major accident should be below 10-6.
However, the probability of an important accident should be considered with regard to fatal accidents according to
the handbook of the Ministry of Economy, Trade and Industry. When the tolerance was established in our risk
assessment, the degree of harm was not considered; thus, when an ignition accident occurred, only the risk of the
worst-case scenario (i.e., fatality) was assessed. This is because conventional refrigerants are not flammable, but the
refrigerant under study is mildly flammable.
For building multi-air conditioners and commercial air conditioners, the SWG adopted a risk tolerance of less than
once per 100 years. The risk of a chiller can be reduced by maintenance, intervention by specialists, and regulations for
use in industrial factories. Therefore, the SWG adopted a tolerance of once per 10 years for chillers. This tolerance is
the value set in Japan; the tolerance differs with country and area, depending on the different customs and culture. The
safety requirements for air conditioners also differ, so the tolerance in each country should be established individually
according to the social conditions and acceptable risk level.
5.4.2 Setting of leakage
Data of the leakage rates provided by each service company belonging to the JRAIA were weighted according to the
market share of each company to determine the mean refrigerant leakage rate for all products in the household air
conditioner market. Most of household air conditioner servicing companies are affiliated with the equipment
manufacturers in Japan, and the associated service company receives the majority of the service work. Therefore, the
leakage rate data are highly reliable. In Japan, the leakage rate for all of the household air conditioners is 0.023% per
year.
Leakage can be classified into many forms with regard to the leakage speed. One form of leakage proceeds over
several days because of pipe corrosion. Another form involves a slight leakage over several months. In addition, rapid
leakage can occur at a defective weld where the leaks continue only for several hours. In the first risk assessment, the
leakage speed was calculated under the last condition because of the high leakage speed involved. According to
IEC60335-2-24, the severest case is the event in which the entire refrigerant leaks out in 4 min. This occurs when a
plumbing pipe breaks, and the household air conditioner spouts its refrigerant. However, the leakage rate is determined
under the assumption of no fall in temperature and no dissolution residual of a refrigerant for the refrigeration oil; thus,
these conditions are not realistic.
The leakage was set so that the entire refrigerant was leaked. The leakage rate and leakage amount of the household
air conditioner were not reconsidered because the result of the risk assessment mostly satisfied the tolerance value. The
results of the risk assessment for the air conditioner calculated under such severe settings are described later.
An indoor leakage speed of 10 kg/h, as prescribed by ISO5149, was adopted for building multi-air conditioners and
commercial air conditioners. The comparison to the market reliability data was based on this value, and the rates of
slow leakage (10 kg/h), rapid leakage (100 kg/h), and
high-speed leakage (750 kg/h) were determined for an indoor
unit and outdoor unit. In the case of the chiller, the refrigerant
was assumed to leak out at an audible speed in the event of a
leakage.
5.4.3 Setting flammable spaces
When estimating the flammability, determining the space
volume is the most important step. For a small space, harmful
ignition could occur in each case. In other words, when the
space is small, a flammable refrigerant cannot be used. In
Japan, household air conditioners are generally installed in Figure 5-8 Installation of an air-conditioner
- 144 -

rooms with floor areas of approximately 9.9 m2. This can be considered a suitable value, but catalogs specify that the
units may be installed in rooms up to 7.43 m2 (i.e., 4.5 tatami mats) in size. Thus, the risk assessment performed in 2000
considered air conditioners using propane in 7 m2 (4 mats) spaces as the severe condition. Therefore, the leakage space
was set to a floor area of 7 m2 and a height of 2.4 m for the risk assessment of a household air conditioner installed at a
height of 1.8 m. Figure 5-8 outlines the interior space of the room and the installation condition. The outdoor unit was
assumed to be installed in the veranda of the apartment, where three sides were walls and the fourth a glass window.
For a building multi-air conditioner, the area of the office room was initially as 13 m2 area and the height as 2.7 m. In
the following risk assessment, it was assumed that a karaoke room and a restaurant have small enclosed spaces. The
outdoor unit was first set to have two surrounding walls; however, for the risk assessment of the interior, several severe
conditions, such as semi-underground installation and a machinery room for which establishing the diffusion effect of
wind was difficult, were assumed. For a specific chiller volume, the mean, minimum, and maximum values of the
machinery room area are summarized by using the data in the List of Completed Facility Research of the Journal of
Heating and Air-Conditioning Sanitary Engineering (2007–2010). In the analysis model, the area of the machinery room
was defined as the average value, and the height of the machinery room was defined as 5 m.
The next hazard considered was a refrigerant leakage during storage in a warehouse before physical distribution.
Household air conditioners are often kept in large-scale depots near the sales area, but a medium-scale depot with
semi-fireproof construction as determined by the Building Standards Law was considered in this risk assessment. This
room was assumed to have a floor area of 1000 m2 and was assumed to store 10,000 sets. Under these conditions, the
volume is small, and the risk is high.
Because the circulation process are same for transportation of building multi-air conditioners and commercial air air
conditioners, a medium-scale depot of semi-fireproof construction was assumed, and the depot was assumed to contain
2300 sets considering the different equipment sizes. With regard to chillers, refrigerant is filled in them when the
refrigerant tubes are laid in the building. Hence, there are no hazards from a mildly flammable refrigerant.
The conditions for the service and disposal steps were determined by the investigation conducted by each company
and by consultation with the SWG. Severe conditions were established for each step of the risk assessment.
5.4.4 Simulation of flammable time volume
The generated volume and duration of the flammable region were determined based on the leakage rate and space
volume described above. The integrated value is referred as the flammable time volume. In short, the flammable time
volume is the ratio of the flammable area generated in 1 year based on the assumed space. In the early stages of the risk
assessment on the use of a propane air conditioner, the flammable time volume was determined by converting the
calculated value into the equivalent for R32. The interface of separation and reformation was established in 2012 by the
University of Tokyo and calculated from simulation results to ensure that pressure does not eventually build up because
of a refrigerant leakage. Figure 5-9 shows the simulation conditions for each air conditioner as considered by the
University of Tokyo5-7).
Figure 5-9 Simulation conditions for each air-conditioner
- 145 -

The flammable time volume of each simulated air conditioner is provided in the figure obtained from the University
of Tokyo, and each SWG of the JRAIA calculated the ignition probability using these values. Table 5-2 lists the
flammable time volumes of R32 and R1234yf used in a mini-split air conditioner SWG(I). For R1234yf, each value was
calculated by converting it to the equivalent simulated value for R32 under identical conditions.
Table 5-2 Flammable time volumes in leakage situations
(m3·min)
R290 R32 R1234yf
1.1 Logistics 5.50 × 101 2.00 × 10⁻⁴ 2.20 × 10⁻⁴
2.2 Installation 7.16 × 10² 2.40 × 10⁻³ 2.50 × 10⁻⁴
2.5 Mistakes 7.75 × 10⁻² 9.00 × 10⁻³ 1.30 × 10⁻²
2.10 Refrigerant charge 8.51 × 10³ 9.97 × 101 3.70 × 10²
3.1 Indoor unit operation 1.41 × 101 5.00 × 10⁻⁴ 5.50 × 10⁻⁴
3.5 Indoor unit stop 7.16 × 10³ 2.40 × 10⁻² 2.50 × 10⁻²
4.1 Outdoor unit 7.76 × 10⁻¹ 9.00 × 10⁻² 1.30 × 10⁻¹
5.1 Connecting pipe 8.51 × 10³ 9.97 × 10² 3.70 × 10³
7.8 Service/relief 7.75 × 10⁻² 9.07 × 10⁻³ 1.30 × 10⁻²
8 Disposal Using similar situations and values
The flammable time volume for a household air conditioner excluding full refrigerant leakage was small at 10-4 to
10-2 m3·min. On the other hand, the value is large at 0.6–314 m3·min for a building multi-air conditioner and chiller.
Note that CFD is used to determine the flammable time volume; however, if the room geometry and leakage height
are almost similar to the condition of other CFD, the result can be obtained based on the CFD results by simplifying the
equation modified by the SWG according to Kataoka’s reports5-8). The flammable time volume can be obtained using
the following equation:
V1 = V0×((m1×h0×A01/2)/ (m0×h1×A1
1/2))3 (5-1)
where V1 is the converged flammable time volume; V0 is the original flammable time volume obtained by CFD
simulation; m0 is the original leakage refrigerant mass; h0 is the original leakage height; A0 is the original floor area; m1
is the setting leakage refrigerant mass;h1 is the setting leakage height; and A1 is the setting floor area.
If the interior and height of the space are considerably different, the converged values should be judged carefully.
5.4.5 Setting of ignition sources
In rare cases, a flammable space may be formed even if the R32 refrigerant used in a household air conditioners leaks
into the environment. In such a case, sparks generated from electrical equipment, metal collision, and static electricity
or the open flame of combustion equipment such as oil stoves act as ignition sources. In addition, smoking supplies can
ignite oil and gas through sparks to produce an open flame. These ignition sources were examined in detail in the 2011
and 2012 progress reports of the Japan Society of Refrigerating and Air Conditioning Engineers. The SWG referred to
the reports by Imamura et al. (2012)5-9), Takizawa (2011)5-10), and Goetzler et al. (1998)5-11) to describe the following
items that were assumed as ignition sources:
(1) An electromagnetic contactor with no cover ignites at 7.2 kVA or more. However, if a contact is covered with a
clearance of 3 mm or less, it does not ignite at 12 kVA or more. Low-voltage electrical equipment in Japanese
homes rarely ignites.
(2) Electronic lighter rarely ignites, and the flame does not propagate.
(3) Mildly flammable refrigerants are not ignited by burning tobacco that does not emit a flame.
(4) Kerosene fan heaters do not cause flame propagation under the influence of the flow.
- 146 -
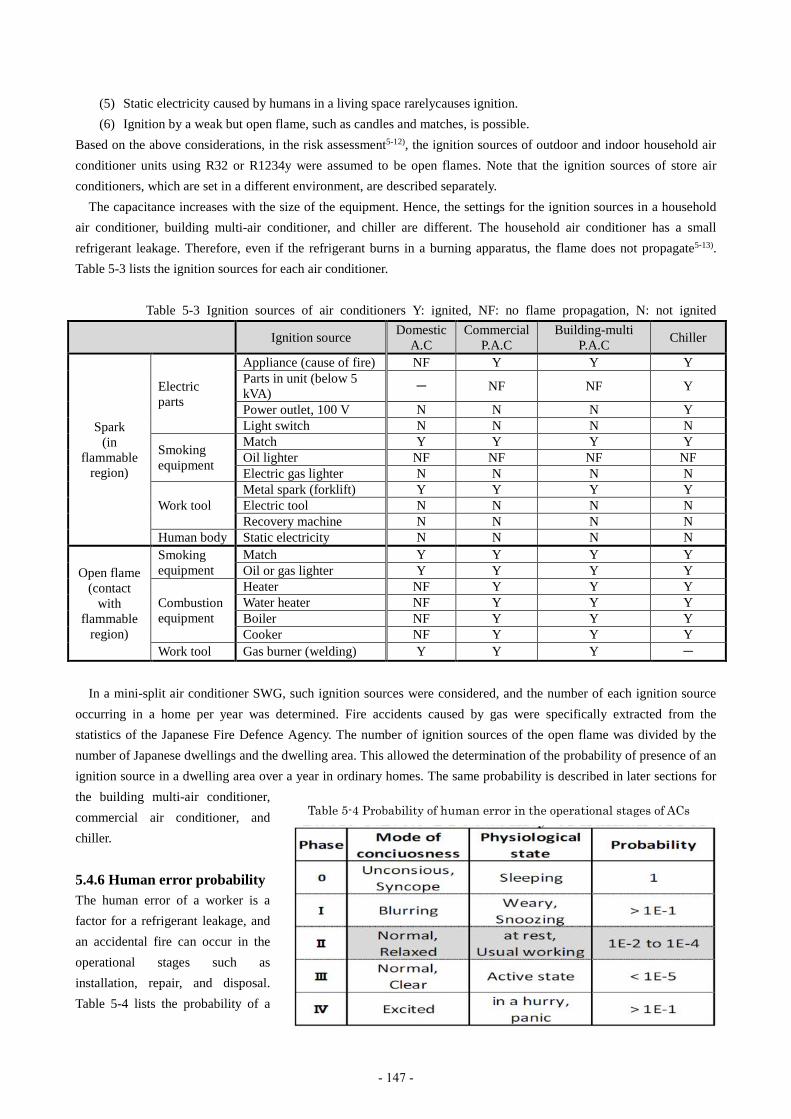
(5) Static electricity caused by humans in a living space rarelycauses ignition.
(6) Ignition by a weak but open flame, such as candles and matches, is possible.
Based on the above considerations, in the risk assessment5-12), the ignition sources of outdoor and indoor household air
conditioner units using R32 or R1234y were assumed to be open flames. Note that the ignition sources of store air
conditioners, which are set in a different environment, are described separately.
The capacitance increases with the size of the equipment. Hence, the settings for the ignition sources in a household
air conditioner, building multi-air conditioner, and chiller are different. The household air conditioner has a small
refrigerant leakage. Therefore, even if the refrigerant burns in a burning apparatus, the flame does not propagate5-13).
Table 5-3 lists the ignition sources for each air conditioner.
Table 5-3 Ignition sources of air conditioners Y: ignited, NF: no flame propagation, N: not ignited
Ignition source Domestic
A.C
Commercial
P.A.C
Building-multi
P.A.C Chiller
Spark
(in
flammable
region)
Electric
parts
Appliance (cause of fire) NF Y Y Y
Parts in unit (below 5
kVA) - NF NF Y
Power outlet, 100 V N N N Y
Light switch N N N N
Smoking
equipment
Match Y Y Y Y
Oil lighter NF NF NF NF
Electric gas lighter N N N N
Work tool
Metal spark (forklift) Y Y Y Y
Electric tool N N N N
Recovery machine N N N N
Human body Static electricity N N N N
Open flame
(contact
with
flammable
region)
Smoking
equipment
Match Y Y Y Y
Oil or gas lighter Y Y Y Y
Combustion
equipment
Heater NF Y Y Y
Water heater NF Y Y Y
Boiler NF Y Y Y
Cooker NF Y Y Y
Work tool Gas burner (welding) Y Y Y -
In a mini-split air conditioner SWG, such ignition sources were considered, and the number of each ignition source
occurring in a home per year was determined. Fire accidents caused by gas were specifically extracted from the
statistics of the Japanese Fire Defence Agency. The number of ignition sources of the open flame was divided by the
number of Japanese dwellings and the dwelling area. This allowed the determination of the probability of presence of an
ignition source in a dwelling area over a year in ordinary homes. The same probability is described in later sections for
the building multi-air conditioner,
commercial air conditioner, and
chiller.
5.4.6 Human error probability
The human error of a worker is a
factor for a refrigerant leakage, and
an accidental fire can occur in the
operational stages such as
installation, repair, and disposal.
Table 5-4 lists the probability of a
Table 5-4 Probability of human error in the operational stages of ACs
- 147 -
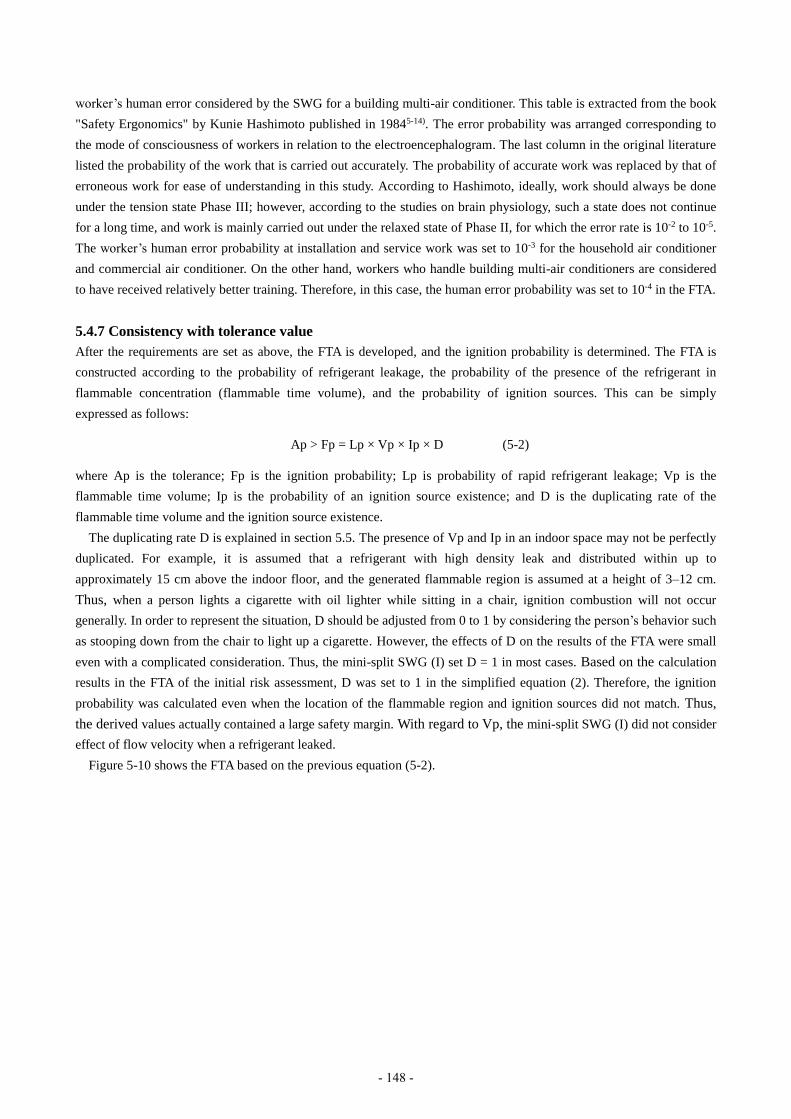
worker’s human error considered by the SWG for a building multi-air conditioner. This table is extracted from the book
"Safety Ergonomics" by Kunie Hashimoto published in 19845-14). The error probability was arranged corresponding to
the mode of consciousness of workers in relation to the electroencephalogram. The last column in the original literature
listed the probability of the work that is carried out accurately. The probability of accurate work was replaced by that of
erroneous work for ease of understanding in this study. According to Hashimoto, ideally, work should always be done
under the tension state Phase III; however, according to the studies on brain physiology, such a state does not continue
for a long time, and work is mainly carried out under the relaxed state of Phase II, for which the error rate is 10-2 to 10-5.
The worker’s human error probability at installation and service work was set to 10-3 for the household air conditioner
and commercial air conditioner. On the other hand, workers who handle building multi-air conditioners are considered
to have received relatively better training. Therefore, in this case, the human error probability was set to 10-4 in the FTA.
5.4.7 Consistency with tolerance value
After the requirements are set as above, the FTA is developed, and the ignition probability is determined. The FTA is
constructed according to the probability of refrigerant leakage, the probability of the presence of the refrigerant in
flammable concentration (flammable time volume), and the probability of ignition sources. This can be simply
expressed as follows:
Ap > Fp = Lp × Vp × Ip × D (5-2)
where Ap is the tolerance; Fp is the ignition probability; Lp is probability of rapid refrigerant leakage; Vp is the
flammable time volume; Ip is the probability of an ignition source existence; and D is the duplicating rate of the
flammable time volume and the ignition source existence.
The duplicating rate D is explained in section 5.5. The presence of Vp and Ip in an indoor space may not be perfectly
duplicated. For example, it is assumed that a refrigerant with high density leak and distributed within up to
approximately 15 cm above the indoor floor, and the generated flammable region is assumed at a height of 3–12 cm.
Thus, when a person lights a cigarette with oil lighter while sitting in a chair, ignition combustion will not occur
generally. In order to represent the situation, D should be adjusted from 0 to 1 by considering the person’s behavior such
as stooping down from the chair to light up a cigarette. However, the effects of D on the results of the FTA were small
even with a complicated consideration. Thus, the mini-split SWG (I) set D = 1 in most cases. Based on the calculation
results in the FTA of the initial risk assessment, D was set to 1 in the simplified equation (2). Therefore, the ignition
probability was calculated even when the location of the flammable region and ignition sources did not match. Thus,
the derived values actually contained a large safety margin. With regard to Vp, the mini-split SWG (I) did not consider
effect of flow velocity when a refrigerant leaked.
Figure 5-10 shows the FTA based on the previous equation (5-2).
- 148 -
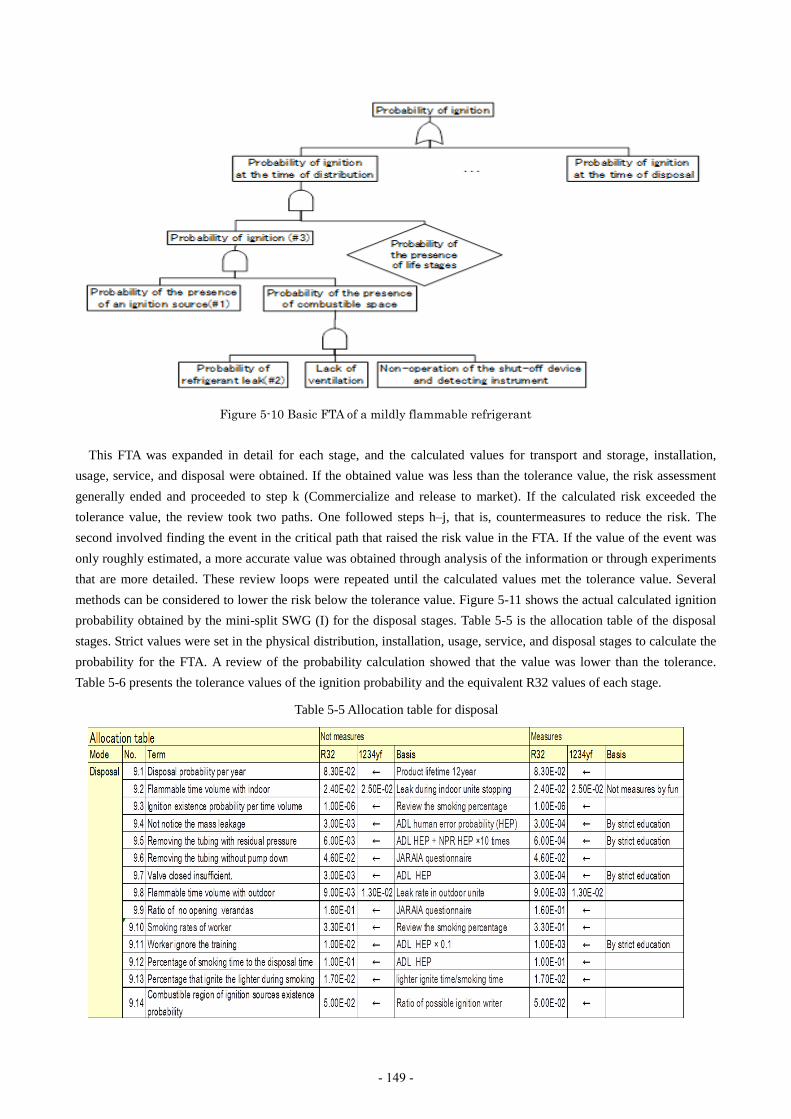
This FTA was expanded in detail for each stage, and the calculated values for transport and storage, installation,
usage, service, and disposal were obtained. If the obtained value was less than the tolerance value, the risk assessment
generally ended and proceeded to step k (Commercialize and release to market). If the calculated risk exceeded the
tolerance value, the review took two paths. One followed steps h–j, that is, countermeasures to reduce the risk. The
second involved finding the event in the critical path that raised the risk value in the FTA. If the value of the event was
only roughly estimated, a more accurate value was obtained through analysis of the information or through experiments
that are more detailed. These review loops were repeated until the calculated values met the tolerance value. Several
methods can be considered to lower the risk below the tolerance value. Figure 5-11 shows the actual calculated ignition
probability obtained by the mini-split SWG (I) for the disposal stages. Table 5-5 is the allocation table of the disposal
stages. Strict values were set in the physical distribution, installation, usage, service, and disposal stages to calculate the
probability for the FTA. A review of the probability calculation showed that the value was lower than the tolerance.
Table 5-6 presents the tolerance values of the ignition probability and the equivalent R32 values of each stage.
Figure 5-10 Basic FTA of a mildly flammable refrigerant
Table 5-5 Allocation table for disposal
- 149 -

The values were almost same as the tolerance, indicating that the safety will not change even if detailed analyses are
performed for household air-conditioning. The SWG judged that creating a safety manual was necessary, and
documentation was developed for safe work during installation and service.
Note that the one-to-one connection of floor-type housing air conditioners and multi-connection air conditioners
installed on floor did not meet the tolerance values in the primary evaluation according to the analysis by the SWG.
This is explained in detail in Chapter 6.
Table 5-6 Results of risk assessment review
Risk: Ignition Probability
R290 R32 R1234yf
Logistic 9.2 × 10⁻¹¹–1.4 × 10⁻⁷ 4.1 × 10⁻¹² 4.5 × 10⁻¹²
Installation 3.7 × 10⁻⁹–2.2 × 10⁻⁸ 2.7 × 10⁻¹⁰ 3.1 × 10⁻¹⁰
Use (Indoor) 5.0 × 10⁻¹³–9.5 × 10⁻⁹ 3.9 × 10⁻¹⁵ 4.3 × 10⁻¹⁵
(Outdoor) 4.9 × 10⁻¹³–9.3 × 10⁻⁹ 1.5 × 10⁻¹⁰ 2.1 × 10⁻¹⁰
Service 2.8 × 10⁻⁷–8.1 × 10⁻⁷ 3.2 × 10⁻¹⁰ 3.6 × 10⁻¹⁰
Disposal 4.1 × 10⁻⁷–5.1 × 10⁻⁷ 3.6 × 10⁻¹¹ 5.3 × 10⁻¹¹
With regard to commercial air conditioners and building multi-air conditioners, the leakage rate, leakage speed,
flammable time volume, and ignition sources were similarly determined, and the initial FTA was performed. The risk of
refrigerant leakage from the air conditioners set on the ceiling of an office was below the tolerance. However, in a
secondary evaluation where the air conditioners were set in a semi-underground location or in a narrow place (e.g., a
karaoke shop), the risk became higher. Hence, a manual was developed to lower the risk to values less than the
tolerance according to the R-map.
A chiller contains a large amount of refrigerant. Therefore, the flammable time volume is large in the event of leakage.
Because there are ignition sources inside the chiller, such as an electromagnetic switch with large capacitance, the risk
was not be below the tolerance according to the R-map in the first evaluation. Therefore, an exhaust device is necessary
to prevent the formation of a flammable region. Regulations are being considered to enforce such a countermeasure.
Figure 5-11 FTA for the disposal of an outdoor unit
- 150 -
5.4.8 Summary for household air conditioners
The flammable time volume did not become too large even though the SWG(I) set a small volume of space and high
leakage rate, as described above. The ignition probability was minimum at less than or equal to the tolerance value
because the probability of existence of ignition sources, except an oil lighter, was evaluated as minimum. Therefore, a
second risk assessment was not performed, and the risks associated with flammability during the life cycle were
evaluated again. The risk was reconsidered in sequence, and all of the members in the SWG(I) confirmed that there was
no problem. Note that installation work on household air conditioners in Japan is carried out mainly by local electrical
shop personnel or professionals. Therefore, a plumbing manual was developed to improve the accuracy of the
installation and service work. Contents of the manual were published and circulated among the companies and
organizations related to JRAIA. The manual is referred to as the work manual of the corresponding air conditioner
manufacturer and organization.
5.5 Differences in the Case of Building Multi-Air Conditioners and Commercial Air
Conditioners
Building multi-air conditioners and commercial air conditioners have greater amount of refrigerant and distinctly
different installation conditions and usage environment as compared to those for household air conditioners in the
aforementioned risk assessment procedure. The differences in the risk assessment procedure are listed below.
(1) Tolerance of risk assessment
Similar to the household air conditioner, the risk tolerances of a building multi-air conditioner and commercial air
conditioner were determined based on the number of units in circulation in the market with a target accident frequency
of once per 100 years.
Building multi-air conditioners and commercial air conditioners have the similar cooling capacities. However, while
an outdoor unit of a commercial air conditioner is attached to a single indoor unit, that of a building multi-air
conditioner can be attached to multiple indoor units. Thus, the amounts of refrigerant differ significantly. Because of
this difference, in addition to differences in the location, installation skill, and equipment, the tolerance values for each
type of air conditioner was provided separately in the risk assessment.
Building multi-air conditioners have a market distribution of 10 million units. Thus, the risk tolerance was set to 1 ×
10-9 usage stage, while that for other stages such as services and installation was set to 1 × 10⁻⁸. Commercial air
conditioners have a market distribution of 7.8 million units; thus, the risk tolerance was set to 1.3 × 10⁻⁹ in the usage
stage and 1.3 × 10⁻⁸ in other stages.
(2) Leakage
Building multi-air conditioners and commercial air conditioners were considered to have a standard leakage rate of 10
kg/h, as defined in ISO5149. This value was compared with the data of defects in the market as collected for the SWG.
The ratios of a slow leakage (10 kg/h), rapid leakage (1–10 kg/h), and high-speed leakage (10–75 kg/ h) from the
outdoor unit were then determined. For the indoor unit, the SWG considered that the risk of a high-speed leakage was 0
because it was not observed in a leakage experiment using nitrogen. On the other hand, the outdoor unit exhibited
leakage rates exceeding 10 kg/h; thus, the number of the high-speed leakage was assumed to be one-tenth of that of the
rapid leakage.
(3) Ignition source
Table 5-3 presents the ignition sources for a building multi air conditioner and commercial air conditioner. The NITE
statistics were used to determine the accident rate of fires with home electronics, and the probabilities of existence of
the ignition sources in the “office model” and “kitchen model” that are assumed to have relatively many ignition
sources were determined. Table 5-7 presents the ignition probabilities of equipments based on the fire information.
- 151 -

Table 5-7 Ignition sources from NITE statistics (part of whole)
(4) Life stage and installation case
air conditioner installation conditions were classified into different cases: those in an office, a restaurant, a karaoke
room, a semi-underground location, and a machinery room. Then, the risk assessment was performed for each stage of
the life cycle. Table 5-8 presents the results of the building multi SWG.
Table 5-8 Risk assessment of the life stages and installation cases (part of whole)
(5) Countermeasures
The means to lower the risk for building multi air conditioners and commercial air conditioners with high ignition
probability were comprehensively considered at life cycle stages and under installation conditions with high ignition
probability. The installation condition with a high ignition probability was a tightly sealed room, such as a karaoke room,
and the tolerance value was not met. Therefore, the SWG considered acceptable security countermeasures such as
connecting a ventilator with a refrigerant leakage detector. Another situation was the use of a burner as an ignition
source in the service stage. When a refrigerant leakage is noticed during burner work, the burner should be put out
- 152 -
immediately. To ensure that a leakage is certainly noticed, a refrigerant leakage detector should be installed to measure
the refrigerant concentration. This countermeasure requires a series of procedures developed through education, training,
and practice. The ignition probability can be then suppressed to below the tolerance value. The safety guideline GL-13
of the JRAIA should be revised based on the risk assessment results, and then distributed.
5.6 Difference in the case of Chillers
The differences in the risk assessment procedure for a building multi-air conditioner and commercial air conditioner
were described in the previous sections. This section describes the difference between chillers and the aforementioned
air conditioners. The chiller contains a large amount of refrigerant. It is installed in an underground machinery room,
which is tightly sealed. With regard the installation and use of a chiller in Japan, the most important and distinctive
point is that various regulations and manuals already exist to ensure safety. When a new refrigerant is applied, the risk
assessment assumes that all chillers follow the safety regulations and manuals.
(1) Risk level
The tolerance of the chiller is almost the same as that of the equipment in industrial use. The risk can be reduced by
maintenance, specialist intervention, and regulations. The chiller SWG set the risk tolerance as 1 × 10⁻⁸. The ignition
probability was set to “once per 10 years” according to estimate that that the number of the stock in the market in
over 6 years is 134,000 units.
(2) Setting of life stages
An overhaul was added to the chiller, and six life stages were assumed. The refrigerant is charged after a seal check is
performed during installation. Hence, the transportation stage was not evaluated for the risk assessment.
(3) Condition of the machinery room
There are several regulations on the ventilation and use of firearms in a machine room where a chiller is located. The
air is ventilated four or more times per hour through mechanical forced ventilation. The air supply and exhaust louver
area were determined by referring to the Kagoshima Prefecture Building Standards; an air-supply port was installed
above the equipment, and an exhaust port was located on the wall behind the equipment.
(4) Refrigerant leakage point
The refrigerant leakage point was assumed to be located 0.15 m from the floor and the center of the front face of the
equipment. The refrigerant leaks out at sonic speed through a cylindrical nozzle of length 0.1 m.
(5) Countermeasures and summary
A flammable area is not generated when the compulsory mechanical ventilation works. However, in the absence of
ventilation, a flammable area persisted for a long time. For a water-cooled chiller, the volume of the machine room is
very small based on the amount of the refrigerant. Thus, sufficient ventilation and sensor installation near the floor are
very important security measures. Ventilation is indispensable and the most effective countermeasure to reduce the
flammable space in the case of a rapid leakage from the chiller. Therefore, a manual and safety regulations should be
developed. If a mildly flammable refrigerant leaks under ventilation conditions, almost no flammable space is formed.
Because many manuals and regulations already exist for the chillers, as given above, ensuring safety may require
considering a way to make people obey regulations while they are working on the installation, use, and disposal.
5.7 FMEA and Other Hazards
With regard to productization at each company, it should be confirmed that no item with high risk probably exists. For
this purpose, FMEA with extracted hazards based on the conditions (quality information in the past) should be
conducted. The refrigerants clearly did not show great differences in the past. The differences between the mildly
flammable refrigerants and the conventional refrigerants in the hazards were judged to be socially acceptable for the
- 153 -
harmful fluorine compounds generated by burning of the refrigerants and diesel explosion according to basic
assessments done by the University of Tokyo and AIST. However, the specifications of the air conditioner and
compressor differ depending on the company, and their production defects in the past were also different. Thus, some
additional considerations may be necessary, especially for products with a large amount of refrigerant. Many pieces of
equipment need to be considered. The chiller SWG is performing an FMEA on items common to companies. Japanese
electric appliance manufacturers often require an FMEA to be conducted by them for air conditioner commercialization.
5.8 Summary of Risk Assessment
This chapter presented the risk assessment procedure adopted by the mini-split risk assessment SWG (I) based on the
risk assessment advancements at the JRAIA through collaboration between the University of Tokyo, Tokyo University
of Science, Suwa and AIST Chemical Division. The differences between a building multi-air conditioner, commercial
air conditioner, and chiller were also described.
A risk assessment is a preliminary evaluation of a product for future commercialization. It is just a tool to determine
the hazards that are present in the product. The hazard must be addressed if it is harmful. Product engineers must master
this tool well to provide safe equipment with reasonable price for the society. They also need to disclose the residual
and unexpected risks actively.
Concluding generally is not the aim of this report, however, because the risk of an air conditioner increases with the
refrigerant amount, and because the equipment size increases with the voltage source capacity, the risk for a bigger air
conditioner tends to become high in FTA analysis because the corresponding amount of refrigerant and electric power
capacity become larger. There are many choices to avoid the risks as countermeasures; these include reducing the
refrigerant leakage amount by providing a shutoff valve, diluting the refrigerant by rotating a fan fast, lowering the
refrigerant concentration by using dispersal fans and exhausts, eliminating the ignition source by means of a power
supply interrupting device located outside the installation compartment, and an alarm device by human correspondence.
Risk can also be avoided by enforcing regulations and standards such as confirming a seal during installation and
reporting safety checks. The characteristics, installation conditions, usage condition, convenience, and cost of each
device should be considered to determine the best approach.
In addition, the risk assessments for building multi-air conditioners, commercial air conditioners, and chillers are
described simply by using excerpts from previous progress reports. The previous reports can be referred for detailed
information about the conditions, evaluation methods, and results for the risk assessments, and this report 2015 provides
the latest published information.
Reference
5-1) Hihara, E., The International Symposium on New refrigerants and Environmental Technology
2014, Kobe (2012), pp59-60
5-2) Takizawa, K., The International Symposium on New refrigerants and Environmental
Technology 2014, Kobe (2014), pp79-84
5-3) ISO/IEC Guide 51 (2014)
5-4) Kenji, Y., The International Symposium on HCFC Alternative refrigerants and Environmental
Technology, (2000) , pp182-189 (in Japanese)
5-5) Kenji, T., The International Symposium on New refrigerants and Environmental Technology
2012, (2012) , pp90-94 (in Japanese)
5-6) http://www.cao.go.jp/consumer/history/01/kabusoshiki/anzen/doc/006_110201_shiryou2.pdf,
(2015) (in Japanese)
5-7) Hihara, E., The International Symposium on New refrigerants and Environmental Technology
- 154 -
2014, Kobe (2014), pp69-72
5-8) Kataoka, O., The International Symposium on HCFC Alternative refrigerants and
Environmental Technology 2000, (2000) ,pp218-223
5-9) Imamura, T., Sugawa, O., “Physical Hazard Evaluation for using Air Conditioning Systems having
Low-Flammable Refrigerants with the Fossil-fuel Heating System at the Same Time”, Transactions of
Japan Society of Refrigerating and Air Conditioning Engineers, (2012), Vol.29, No.4, pp.401-411
(in Japanese)
5-10) Takizawa, K., Study on Minimum Ignition Energy of Mildly Flammable Refrigerant, (2011)
5-11) Goetzler et al., Risk Assessment of HFC-32 and HFC-32/134a(30/7wt.%) in split system
residential heat pumps: DOE/CE/23810-92, ADL, (1998)
5-12) Dean Smith et al., “Determining Minimum Ignition Energies and Quenching Distances of
Difficult to ignite Components”, Journal of Testing and Evaluation, (2003), Vol.31, No.3
5-13) Imamura et al., Evaluation of Fire Hazards of A2L Class Refrigerant, The International
Symposium on New Refrigerants and Environmental Technology, (2012)
5-14) Hashimoto, K., “Human safety engineering,” Japan Industrial Safety & Health Association,
(1984), pp85-97 (in Japanese)
- 155 -
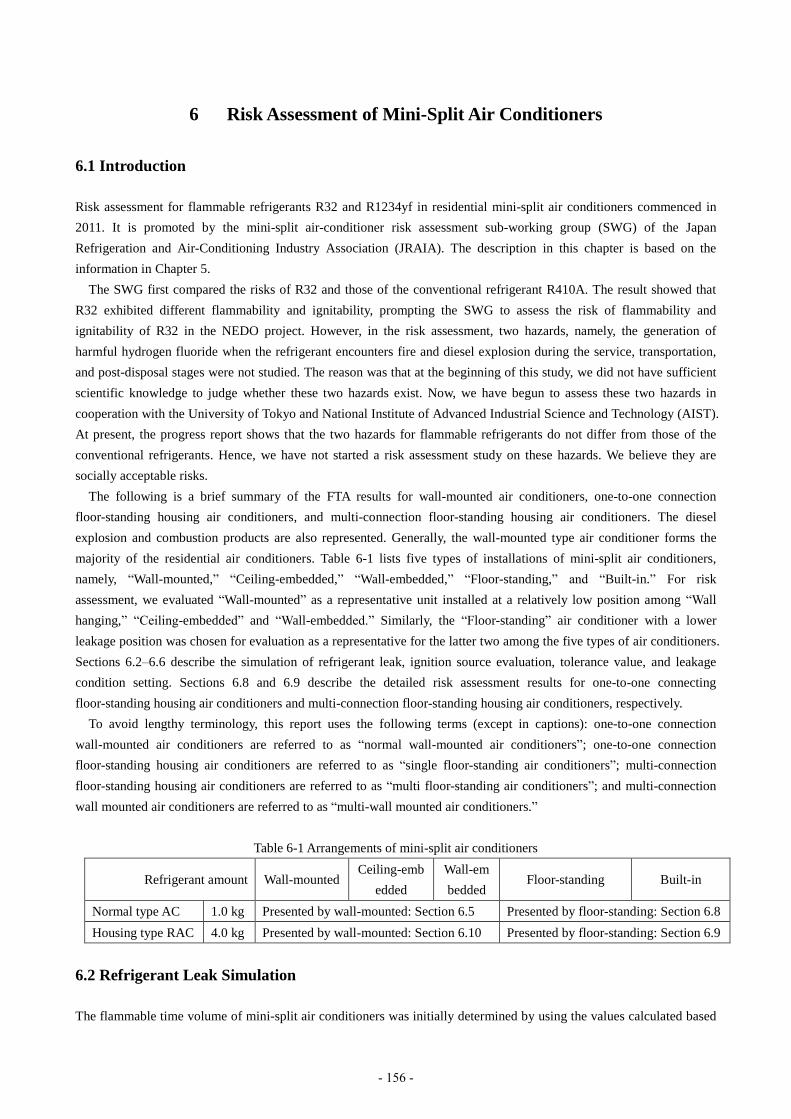
6 Risk Assessment of Mini-Split Air Conditioners
6.1 Introduction
Risk assessment for flammable refrigerants R32 and R1234yf in residential mini-split air conditioners commenced in
2011. It is promoted by the mini-split air-conditioner risk assessment sub-working group (SWG) of the Japan
Refrigeration and Air-Conditioning Industry Association (JRAIA). The description in this chapter is based on the
information in Chapter 5.
The SWG first compared the risks of R32 and those of the conventional refrigerant R410A. The result showed that
R32 exhibited different flammability and ignitability, prompting the SWG to assess the risk of flammability and
ignitability of R32 in the NEDO project. However, in the risk assessment, two hazards, namely, the generation of
harmful hydrogen fluoride when the refrigerant encounters fire and diesel explosion during the service, transportation,
and post-disposal stages were not studied. The reason was that at the beginning of this study, we did not have sufficient
scientific knowledge to judge whether these two hazards exist. Now, we have begun to assess these two hazards in
cooperation with the University of Tokyo and National Institute of Advanced Industrial Science and Technology (AIST).
At present, the progress report shows that the two hazards for flammable refrigerants do not differ from those of the
conventional refrigerants. Hence, we have not started a risk assessment study on these hazards. We believe they are
socially acceptable risks.
The following is a brief summary of the FTA results for wall-mounted air conditioners, one-to-one connection
floor-standing housing air conditioners, and multi-connection floor-standing housing air conditioners. The diesel
explosion and combustion products are also represented. Generally, the wall-mounted type air conditioner forms the
majority of the residential air conditioners. Table 6-1 lists five types of installations of mini-split air conditioners,
namely, “Wall-mounted,” “Ceiling-embedded,” “Wall-embedded,” “Floor-standing,” and “Built-in.” For risk
assessment, we evaluated “Wall-mounted” as a representative unit installed at a relatively low position among “Wall
hanging,” “Ceiling-embedded” and “Wall-embedded.” Similarly, the “Floor-standing” air conditioner with a lower
leakage position was chosen for evaluation as a representative for the latter two among the five types of air conditioners.
Sections 6.2–6.6 describe the simulation of refrigerant leak, ignition source evaluation, tolerance value, and leakage
condition setting. Sections 6.8 and 6.9 describe the detailed risk assessment results for one-to-one connecting
floor-standing housing air conditioners and multi-connection floor-standing housing air conditioners, respectively.
To avoid lengthy terminology, this report uses the following terms (except in captions): one-to-one connection
wall-mounted air conditioners are referred to as “normal wall-mounted air conditioners”; one-to-one connection
floor-standing housing air conditioners are referred to as “single floor-standing air conditioners”; multi-connection
floor-standing housing air conditioners are referred to as “multi floor-standing air conditioners”; and multi-connection
wall mounted air conditioners are referred to as “multi-wall mounted air conditioners.”
Table 6-1 Arrangements of mini-split air conditioners
Refrigerant amount Wall-mounted Ceiling-emb
edded
Wall-em
bedded Floor-standing Built-in
Normal type AC 1.0 kg Presented by wall-mounted: Section 6.5 Presented by floor-standing: Section 6.8
Housing type RAC 4.0 kg Presented by wall-mounted: Section 6.10 Presented by floor-standing: Section 6.9
6.2 Refrigerant Leak Simulation
The flammable time volume of mini-split air conditioners was initially determined by using the values calculated based
- 156 -
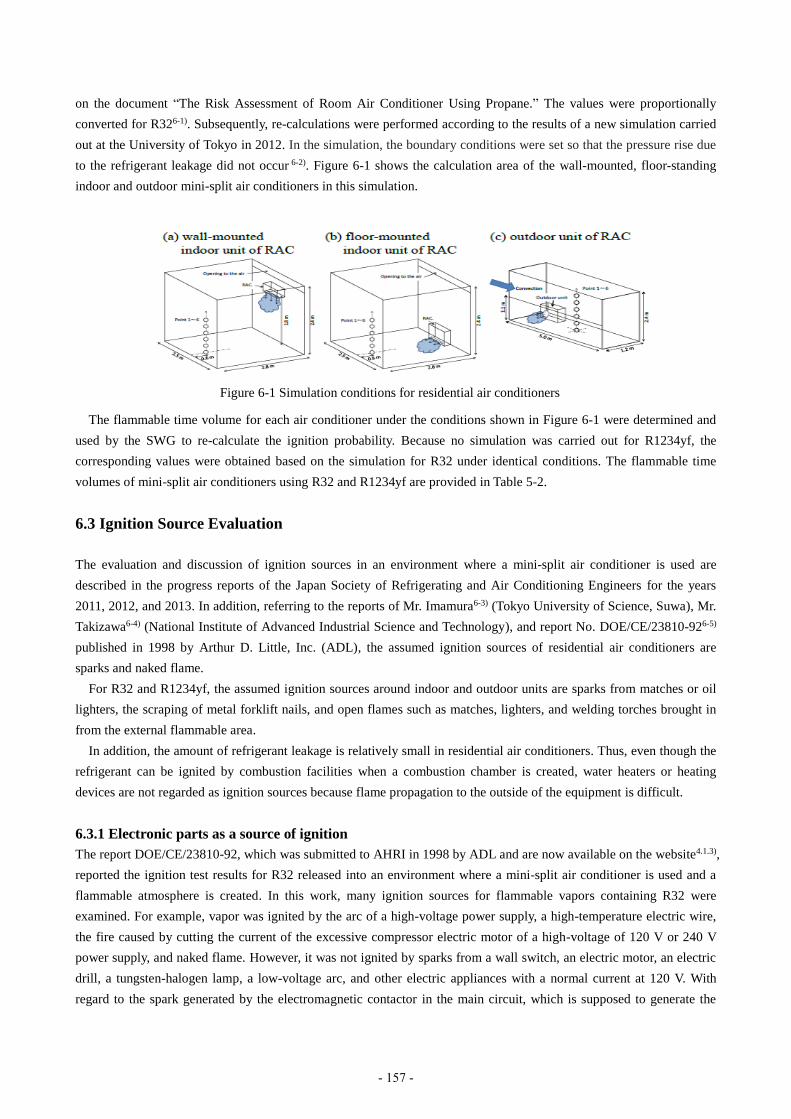
on the document “The Risk Assessment of Room Air Conditioner Using Propane.” The values were proportionally
converted for R326-1). Subsequently, re-calculations were performed according to the results of a new simulation carried
out at the University of Tokyo in 2012. In the simulation, the boundary conditions were set so that the pressure rise due
to the refrigerant leakage did not occur 6-2). Figure 6-1 shows the calculation area of the wall-mounted, floor-standing
indoor and outdoor mini-split air conditioners in this simulation.
The flammable time volume for each air conditioner under the conditions shown in Figure 6-1 were determined and
used by the SWG to re-calculate the ignition probability. Because no simulation was carried out for R1234yf, the
corresponding values were obtained based on the simulation for R32 under identical conditions. The flammable time
volumes of mini-split air conditioners using R32 and R1234yf are provided in Table 5-2.
6.3 Ignition Source Evaluation
The evaluation and discussion of ignition sources in an environment where a mini-split air conditioner is used are
described in the progress reports of the Japan Society of Refrigerating and Air Conditioning Engineers for the years
2011, 2012, and 2013. In addition, referring to the reports of Mr. Imamura6-3) (Tokyo University of Science, Suwa), Mr.
Takizawa6-4) (National Institute of Advanced Industrial Science and Technology), and report No. DOE/CE/23810-926-5)
published in 1998 by Arthur D. Little, Inc. (ADL), the assumed ignition sources of residential air conditioners are
sparks and naked flame.
For R32 and R1234yf, the assumed ignition sources around indoor and outdoor units are sparks from matches or oil
lighters, the scraping of metal forklift nails, and open flames such as matches, lighters, and welding torches brought in
from the external flammable area.
In addition, the amount of refrigerant leakage is relatively small in residential air conditioners. Thus, even though the
refrigerant can be ignited by combustion facilities when a combustion chamber is created, water heaters or heating
devices are not regarded as ignition sources because flame propagation to the outside of the equipment is difficult.
6.3.1 Electronic parts as a source of ignition
The report DOE/CE/23810-92, which was submitted to AHRI in 1998 by ADL and are now available on the website4.1.3),
reported the ignition test results for R32 released into an environment where a mini-split air conditioner is used and a
flammable atmosphere is created. In this work, many ignition sources for flammable vapors containing R32 were
examined. For example, vapor was ignited by the arc of a high-voltage power supply, a high-temperature electric wire,
the fire caused by cutting the current of the excessive compressor electric motor of a high-voltage of 120 V or 240 V
power supply, and naked flame. However, it was not ignited by sparks from a wall switch, an electric motor, an electric
drill, a tungsten-halogen lamp, a low-voltage arc, and other electric appliances with a normal current at 120 V. With
regard to the spark generated by the electromagnetic contactor in the main circuit, which is supposed to generate the
Figure 6-1 Simulation conditions for residential air conditioners
- 157 -

highest energy, the evaluation result of ADL is judged as non-ignition with 20 opening and closing tests, which is
different from the standard of the IEC. On the other hand, contacts of the electromagnetic contactor used in Japanese
products are surrounded by a cover that usually has only a small gap to the contacting point. Recent studies by AIST
confirmed that flame propagation does not occur in an electromagnetic contactor with a rated capacity of 12 kVA
covered with a cover having a gap of approximately 3 mm around the contact point 4.1.4). Although the evaluation of
ignition by these electric sparks is mainly observed in the case of R32, it is considered that R1234yf and R1234ze will
not ignite with even larger contact capacity because their minimum ignition energy is larger than that of R32 6-6), 6-7), 6-8).
6.3.2 Source of ignition around indoor and outdoor units (mainly for residences)
The presence of the ignition sources varies greatly depending on the usage of the room. The ignition sources in
small-scale businesses where residential applications and kitchen equipment are used are as follows:
(1) Naked flame
Solid fuels such as gas appliances and candles, firewood and charcoal, and tobacco and lighters serve as ignition
sources for flammable refrigerants. However, when an ascending airstream is generated by a flame such as that of a gas
stove, the concentration of the remained refrigerant decreases, and furthermore, when the rising air flow velocity
exceeds the burning rate of the refrigerant, flame ignition and flame propagation do not occur.
(2) Ignition device
A piezoelectric element, a magneto, the arc of a high-voltage transformer assembly, a flint system, and a nickel–chrome
alloy wire were used as the ignition equipment for kerosene and gas apparatus. These types of ignition equipment
cannot ignite R32.
(3) Electrical appliance
Electric appliances can act as ignition sources. Sparks generated between the contacts when turning on and shutting
down devices with large inductance need to be considered. Moreover, the generation of heat in the high-current region
of a circuit with a huge capacitor causes the melting of the contacts, which will discharge sparks that act as ignition
sources. Sparks are also generated from the worn brush when it makes contact with the brush motor, but ignition does
not occur when the clearance from the outside of the casing is smaller than the flame extinguishing distance or in the
case of a fully closed type of motor.
(4) Static electricity
Static electricity is generally created by friction with a synthetic material. The charge is correlated to the electric
capacity, the relative humidity (RH) of the material, and the dielectric breakdown voltage. When a material is charged to
about 12 kV at low RH and the electric capacity is set to 100 PF, the electric discharge energy is 7.2 mJ 4.1.9). Under dry
conditions such as for an RH of 7%, according to 4-2 of IEC61000-4-2, the voltage may be as high as approximately 15
kV. The electric discharge energy at this voltage reaches approximately 11.3 mJ. Usually, the electric discharge between
a doorknob and the human body is about 1 mJ in winter, and the same amount of electric discharge occurs when you
removing clothing. In general, the conditions lighting a flammable gas using the minimum ignition energy of an electric
discharge are as follows. Because the insulation performance of air is 3,000 V/mm, air will influence cooling, and a
flame will not spread if the distance between the electrodes is small; thus, the possibility that A2L refrigerants will
ignite because of static electricity is very small. Following the above considerations, in this risk assessment, a naked
flame was the main ignition source was considered.
6.3.3 Framework of ignition sources
If the R32 refrigerant used in a mini-split air conditioner leaks to the environment, a flammable atmosphere can form in
rare cases. In such a case, sparks from electrical equipment, metal collision, and static electricity or the open flame of
combustion equipment such as oil stoves are considered ignition sources. In addition, smoking objects can ignite oil and
gas by means of a spark to produce an open flame. These ignition sources were described in detail in the 2011 and 2012
- 158 -

progress reports of the Japan Society of Refrigerating and Air Conditioning Engineers. The SWG referenced the reports
by Imamura et al. (2012), Takizawa (2011), and Goetzler et al. (1998) to describe the following ignition sources:
(1) An electromagnetic contactor with no cover ignites at 7.2 kVA or more. However, if a contact is covered with a
clearance of 3 mm or less, it does not ignite until 12 kVA or more. Low-voltage electrical equipment in Japanese homes
rarely ignites6-9).
(2) R32 will not be ignited by a cigarette that does not have a flame.
(3) Static electricity caused by humans in daily life rarely causes ignition.
Based on the above considerations, only open flames were considered as the ignition sources for outdoor and indoor
mini-split air conditioner units using R32 or R1234yf in the risk assessment. Note that the ignition sources of store air
conditioners, which have a different environment, are described in a different section.
6.4 Accidental probability of risk assessment (allowance level)
According to NITE6-10), a home electric appliance has a major accident probability of 10-8 sets/year (for 1 million sets).
In other words, a product with one million units distributed a year is considered safe if a fatal accident occurs once in
100 years. The total number of mini-split air conditioners and residential air conditioners in Japan is approximately 100
million sets, so the target value in the FTA calculation was set to ≤10-10 sets/year.
6.5 Leakage conditions
A questionnaire on refrigerant leakage and the use of fire during installation and service was sent by the JRAIA to
construction vendors and service shops, and nearly 600 replies were received. The incidence of refrigerant leakage or
fire use is as follows: The incidence of refrigerant leakage at installations was 0.74%, which is comparable with the
incidence of 0.77% during service. However, refrigerant leakage during charging and recovery was considerable. The
amounts of leakage occurring when a worker detaches and attaches a charge hose and connection joint were actually
small. The reasonable refrigerant leakage may be 1/100. Considering the use of fire, the amount of smoking during
service was 1.3%, and other types of fire use were 4.2%. During service, pipes may sometimes need to be welded;
hence, if the use of fire sources such as burners or ignition lighters for a burner is assumed, the rate of fire usage should
increase. Smoking is discussed in a later section.
6.6 Summary of FTA
The results of the risk assessment for the aforementioned mini-split air conditioners are described in Table 6-2. For
normal wall-mounted air conditioners, the hazard occurrence probability (ignition rate) in the revised risk assessment
was almost 10-10 during use, and was less than 10-9 during transportation, installation, and operation. Because each
value was below the tolerance value, no further risk assessment tests were carried out6-11).
In order to achieve equivalent performance and efficiency while replacing the conventional refrigerant R410A with
the mildly flammable refrigerant R1234yf in mini-split air conditioners, the size of the heat exchanger has to be
increased to approximately 1.4 times it’s the original size, and a new large and reliable compressor has to be developed.
While considering the data in Table 6-2, it is necessary to keep in mind that the values have been slightly revised from
the 2013 progress report.
- 159 -

Table 6-2 Ignition probability of various refrigerants (normal wall mounted air conditioner)
Risk: Ignition probability
Life Stage R32 R1234yf R290
Logistic 4.1 × 10⁻¹⁷ 4.5 × 10⁻¹⁷ 9.7 × 10⁻¹⁶
Installation 2.7 × 10⁻¹⁰ 3.1 × 10⁻¹⁰ 3.7× 10⁻⁹
Use (Indoor) 3.9 × 10⁻¹⁵ 4.3 × 10⁻¹⁵ 5.0 × 10⁻¹³
Use (Outdoor) 1.5 × 10⁻¹⁰ 2.1 × 10⁻¹⁰ 4.9 × 10⁻¹³
Service 3.2 × 10⁻¹⁰ 3.6 × 10⁻¹⁰ 2.8 × 10⁻⁷
Disposal 3.6 × 10⁻¹¹ 5.3 × 10⁻¹¹ 4.1 × 10⁻⁷
However, the values for single floor-standing air conditioners and multi-floor-standing air conditioners in the reviewed
risk assessment are larger than the tolerance value. Therefore, door clearances, primarily in Japanese-style houses, were
investigated to achieve a risk assessment closer to the actual usage. We also reviewed whether the same tolerance values
could be applied for normal wall-mounted air conditioners.
The risk assessment is described in detail in Sections 6.4 and 6.5; however, the latest risk assessment results, which are
very important, are as presented in Table 6-3.
Table 6-3 Ignition probabilities of various mini-split air conditioners
Risk: Ignition probability
Life Stage Normal wall-mounted
R32
Single floor-standing
R32
Multi-floor-standing R32
Logistic 4.1 × 10⁻¹⁷ 3.6 × 10⁻¹¹ 1.1 × 10⁻⁹
Installation 2.7 × 10⁻¹⁰ 4.0 × 10⁻¹¹ 9.0 × 10⁻⁹
Use (Indoor) 3.9 × 10⁻¹⁵ 4.1 × 10⁻¹⁰ 4.7 × 10⁻¹⁰
Use (Outdoor) 1.5 × 10⁻¹⁰ 8.6 × 10⁻¹¹ 1.1 × 10⁻⁹
Service 3.2 × 10⁻¹⁰ 2.6 × 10⁻¹⁰ 4.3 × 10⁻⁹
Disposal 3.6 × 10⁻¹¹ 2.5 × 10⁻¹¹ 4.1 × 10⁻¹⁰
The tolerance value for single floor-standing air conditioners was 10-9 during use, and 10-8 during transportation and
installation, which almost meets the allowable values.
6.7 Risk Assessment and Results for Wall-Mounted Single Air Conditioners
The risk assessment for the wall-mounted indoor unit in the service step is described below.
6.7.1 Risk assessment of indoor units
Risk assessment for the combustion of indoor units using R32 was performed based on the FTA of R290. First, the FTA
of R290 was replaced by that for R32, and the ignition probability was examined. Because of the difference between the
properties of these two refrigerants, the numerical values had to be changed. The flammable time volume in Table 6-4
for R32 was calculated as 1/10 that of R290. The spreading probability for R32 was set as 1/1000 that of R290
according to the ADL report. Thus, the ignition probability was set to the range 1.8×10⁻⁶ to 9.0×10⁻⁶ and was equivalent
to that of R290 (1.7×10⁻⁶ to 9.3×10⁻⁶). This is because the ignition probability caused by smoking by a service person is
large, and it is the dominant factor in the risk assessment at servicing.
- 160 -

Table 6-4 Servicing ignition probability
R32 R290
Current Measure Current Measure
Servicing
Ignition
1.8 × 10⁻⁶
- 9.0 × 10⁻⁶
1.7 × 10⁻¹⁰
- 4.0 × 10⁻¹⁰
1.7 × 10⁻⁶
- 9.3 × 10⁻⁶
2.3 × 10⁻⁷
- 5.5 × 10⁻⁷
R290 rate 100/103 100/103 - -
The latest study at the Tokyo University of Science showed that A2L refrigerants such as R32 are not ignited by the fire
of a cigarette or the fire of a piezoelectric-type lighter. These examination results are reflected in the FTA, by the
addition of “the rate of smoking time to a service period,” “the rate of time which has stuck the lighter during smoking,”
and “the ignition source existence probability of the area within flammable” to the probability of ignition from smoking.
As a result, the ignition probability and the improved FTA are set as 1.7 × 10⁻¹⁰–4.0 × 10⁻¹⁰ and to 1 over 1400.
6.8 Risk Assessment and Results for Housing Air Conditioners
6.8.1 Installation modes and problems
In addition to the wall-mounted type, other types of indoor housing air conditioner units are available. Individual risk
assessment is required depending on the installation method and connection specifications. Figure 6-2 compares the
installation types and the conditions for risk assessment between multi-connection housing air conditioners and
one-to-one connection air conditioners. In addition to the wall-mounted type, the other types of indoor housing air
conditioner units include the floor-standing type, the ceiling-mounted cassette type, the wall-embedded type, and the
built-in type. The flammable refrigerant being evaluated currently has a tendency to accumulate near the floor because it
is a Freon-type refrigerant with density higher than that of air. The risk is highest in the case of refrigerant leakage from
floor-standing type units, and it is assumed that in the case of multi-connection floor-standing housing air conditioners,
which contain a large amount of refrigerant, the risk is greater. To avoid complications, we first discuss the evaluation
of the one-to-one connection floor-standing type housing air conditioners, and then consider the multi-connection
floor-standing housing air conditioners. Finally, we present the ignition risk probabilities of multi-connection
wall-mounted air conditioners as a reference.
6.8.2 One-to-one connection floor-standing housing air conditioners (single floor-standing air
conditioners): Ignition sources and installation conditions
The ignition sources for single floor-standing air conditioners were assumed as the same as those for conventional
wall-mounted air conditioners. The indoor space was a small room with a floor space of 7 m2 and room height of 2.4 m,
and the indoor unit was installed on the floor as shown in Fig. 6-2.
- 161 -

Conventional air conditioner RA multi-air conditioner
(1 outdoor unit, 1 indoor unit) (1 outdoor unit, multiple indoor units)
Figure 6-2 Housing air conditioners: installation types and analysis conditions
Table 6-5 Life stages and tolerance values of single floor-standing air conditioners (probability of accidents)
6.8.3 Probability of accident and aims of single floor-standing air conditioner risk assessment
The tolerance values for the probability of an accident for single floor-standing air conditioners are the same as those
for the wall-mounted type according to the National Institute of Technology and Evaluation (NITE). Housing air
conditioners such as the floor-standing type are sometimes installed by the installers for the room air conditioners, but
commonly the installation work is carried out by professionals who have received adequate training for this type of air
conditioners. In the risk assessment evaluation of floor-standing housing air conditioners, the tolerance value for the
probability of an accident during use was set less than 10-9 considering the small number of floor-standing air
conditioners in the market, which is less than 1% as compared to that of the wall-mounted type. Further, the
specifications and usage are similar to that of the package air conditioners or multi-air-conditioners for buildings.
In addition, assuming that service providers engage in self-prevention during servicing work, the hazard level was
- 162 -
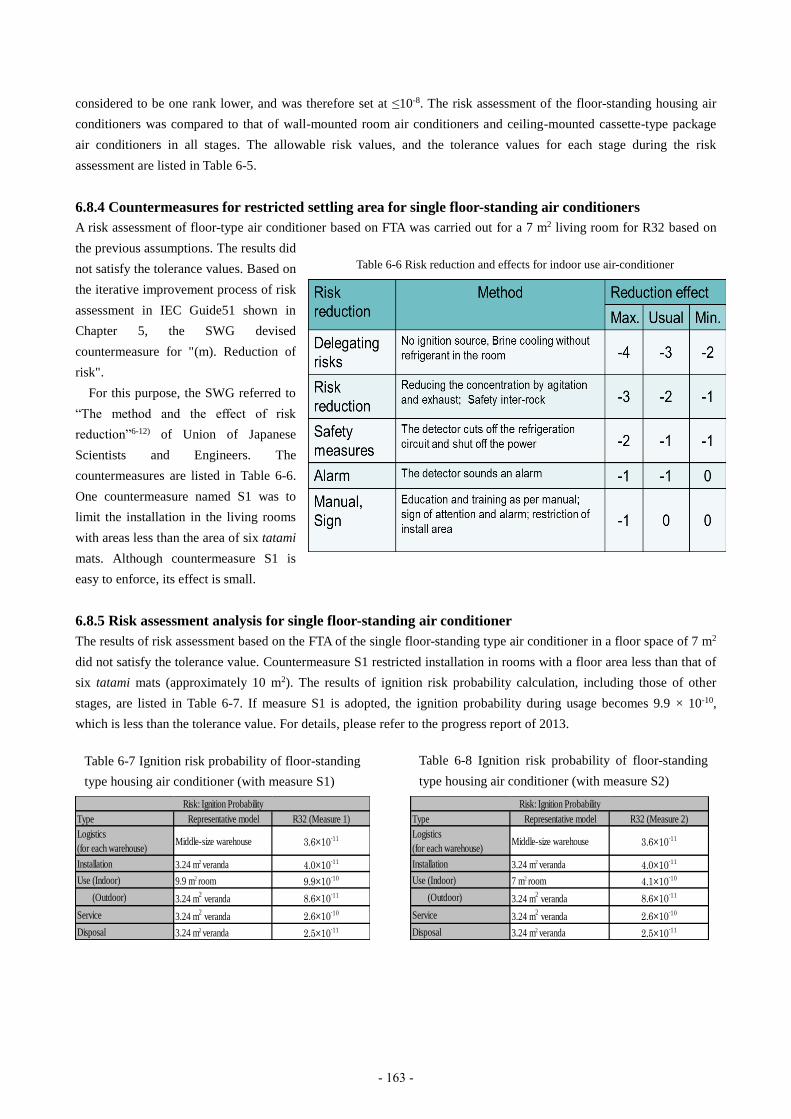
considered to be one rank lower, and was therefore set at ≤10-8. The risk assessment of the floor-standing housing air
conditioners was compared to that of wall-mounted room air conditioners and ceiling-mounted cassette-type package
air conditioners in all stages. The allowable risk values, and the tolerance values for each stage during the risk
assessment are listed in Table 6-5.
6.8.4 Countermeasures for restricted settling area for single floor-standing air conditioners
A risk assessment of floor-type air conditioner based on FTA was carried out for a 7 m2 living room for R32 based on
the previous assumptions. The results did
not satisfy the tolerance values. Based on
the iterative improvement process of risk
assessment in IEC Guide51 shown in
Chapter 5, the SWG devised
countermeasure for "(m). Reduction of
risk".
For this purpose, the SWG referred to
“The method and the effect of risk
reduction”6-12) of Union of Japanese
Scientists and Engineers. The
countermeasures are listed in Table 6-6.
One countermeasure named S1 was to
limit the installation in the living rooms
with areas less than the area of six tatami
mats. Although countermeasure S1 is
easy to enforce, its effect is small.
6.8.5 Risk assessment analysis for single floor-standing air conditioner
The results of risk assessment based on the FTA of the single floor-standing type air conditioner in a floor space of 7 m2
did not satisfy the tolerance value. Countermeasure S1 restricted installation in rooms with a floor area less than that of
six tatami mats (approximately 10 m2). The results of ignition risk probability calculation, including those of other
stages, are listed in Table 6-7. If measure S1 is adopted, the ignition probability during usage becomes 9.9 × 10⁻¹⁰,
which is less than the tolerance value. For details, please refer to the progress report of 2013.
Type Representative model R32 (Measure 1)
Logistics
(for each warehouse)Middle-size warehouse 3.6×10⁻¹¹
Installation 3.24 m2 veranda 4.0×10⁻¹¹
Use (Indoor) 9.9 m2 room 9.9×10⁻¹⁰
Use (Outdoor) 3.24 m2 veranda 8.6×10⁻¹¹
Service 3.24 m2 veranda 2.6×10⁻¹⁰
Disposal 3.24 m2 veranda 2.5×10⁻¹¹
Risk: Ignition Probability
Type Representative model R32 (Measure 2)
Logistics
(for each warehouse)Middle-size warehouse 3.6×10⁻¹¹
Installation 3.24 m2 veranda 4.0×10⁻¹¹
Use (Indoor) 7 m2 room 4.1×10⁻¹⁰
Use (Outdoor) 3.24 m2 veranda 8.6×10⁻¹¹
Service 3.24 m2 veranda 2.6×10⁻¹⁰
Disposal 3.24 m2 veranda 2.5×10⁻¹¹
Risk: Ignition Probability
Table 6-7 Ignition risk probability of floor-standing
type housing air conditioner (with measure S1)
Table 6-8 Ignition risk probability of floor-standing
type housing air conditioner (with measure S2)
Table 6-6 Risk reduction and effects for indoor use air-conditioner
- 163 -
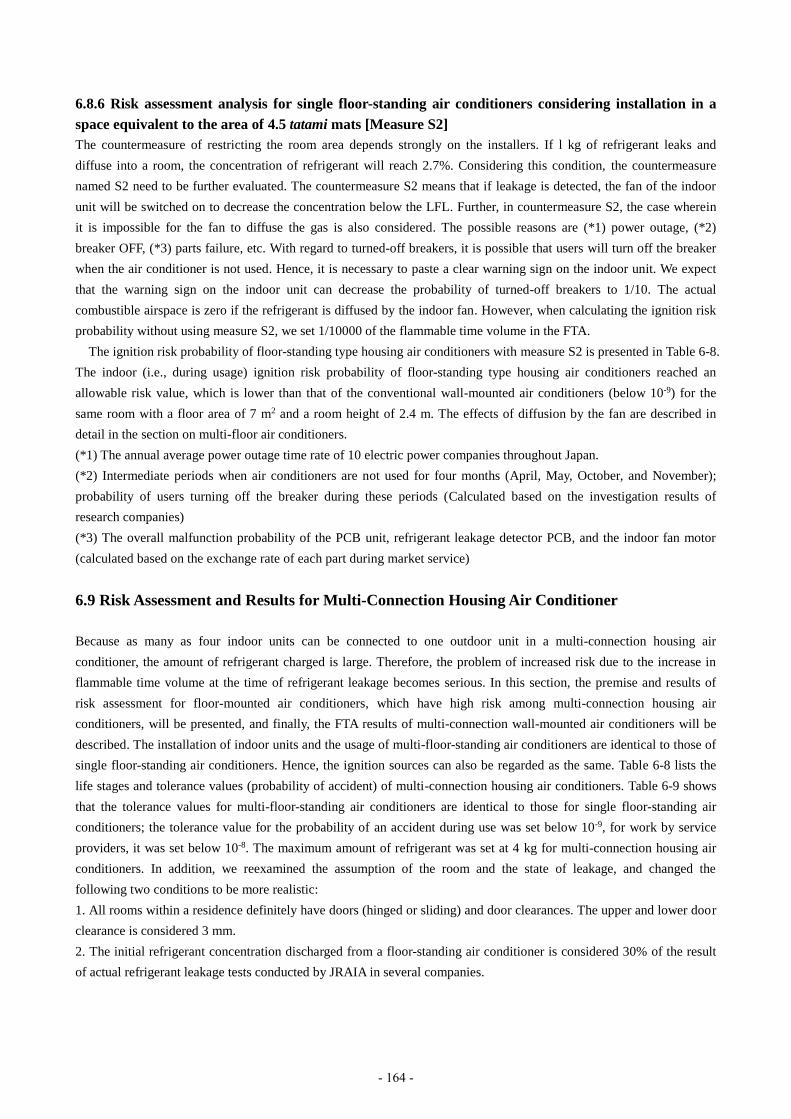
6.8.6 Risk assessment analysis for single floor-standing air conditioners considering installation in a
space equivalent to the area of 4.5 tatami mats [Measure S2]
The countermeasure of restricting the room area depends strongly on the installers. If l kg of refrigerant leaks and
diffuse into a room, the concentration of refrigerant will reach 2.7%. Considering this condition, the countermeasure
named S2 need to be further evaluated. The countermeasure S2 means that if leakage is detected, the fan of the indoor
unit will be switched on to decrease the concentration below the LFL. Further, in countermeasure S2, the case wherein
it is impossible for the fan to diffuse the gas is also considered. The possible reasons are (*1) power outage, (*2)
breaker OFF, (*3) parts failure, etc. With regard to turned-off breakers, it is possible that users will turn off the breaker
when the air conditioner is not used. Hence, it is necessary to paste a clear warning sign on the indoor unit. We expect
that the warning sign on the indoor unit can decrease the probability of turned-off breakers to 1/10. The actual
combustible airspace is zero if the refrigerant is diffused by the indoor fan. However, when calculating the ignition risk
probability without using measure S2, we set 1/10000 of the flammable time volume in the FTA.
The ignition risk probability of floor-standing type housing air conditioners with measure S2 is presented in Table 6-8.
The indoor (i.e., during usage) ignition risk probability of floor-standing type housing air conditioners reached an
allowable risk value, which is lower than that of the conventional wall-mounted air conditioners (below 10-9) for the
same room with a floor area of 7 m2 and a room height of 2.4 m. The effects of diffusion by the fan are described in
detail in the section on multi-floor air conditioners.
(*1) The annual average power outage time rate of 10 electric power companies throughout Japan.
(*2) Intermediate periods when air conditioners are not used for four months (April, May, October, and November);
probability of users turning off the breaker during these periods (Calculated based on the investigation results of
research companies)
(*3) The overall malfunction probability of the PCB unit, refrigerant leakage detector PCB, and the indoor fan motor
(calculated based on the exchange rate of each part during market service)
6.9 Risk Assessment and Results for Multi-Connection Housing Air Conditioner
Because as many as four indoor units can be connected to one outdoor unit in a multi-connection housing air
conditioner, the amount of refrigerant charged is large. Therefore, the problem of increased risk due to the increase in
flammable time volume at the time of refrigerant leakage becomes serious. In this section, the premise and results of
risk assessment for floor-mounted air conditioners, which have high risk among multi-connection housing air
conditioners, will be presented, and finally, the FTA results of multi-connection wall-mounted air conditioners will be
described. The installation of indoor units and the usage of multi-floor-standing air conditioners are identical to those of
single floor-standing air conditioners. Hence, the ignition sources can also be regarded as the same. Table 6-8 lists the
life stages and tolerance values (probability of accident) of multi-connection housing air conditioners. Table 6-9 shows
that the tolerance values for multi-floor-standing air conditioners are identical to those for single floor-standing air
conditioners; the tolerance value for the probability of an accident during use was set below 10-9, for work by service
providers, it was set below 10-8. The maximum amount of refrigerant was set at 4 kg for multi-connection housing air
conditioners. In addition, we reexamined the assumption of the room and the state of leakage, and changed the
following two conditions to be more realistic:
1. All rooms within a residence definitely have doors (hinged or sliding) and door clearances. The upper and lower door
clearance is considered 3 mm.
2. The initial refrigerant concentration discharged from a floor-standing air conditioner is considered 30% of the result
of actual refrigerant leakage tests conducted by JRAIA in several companies.
- 164 -
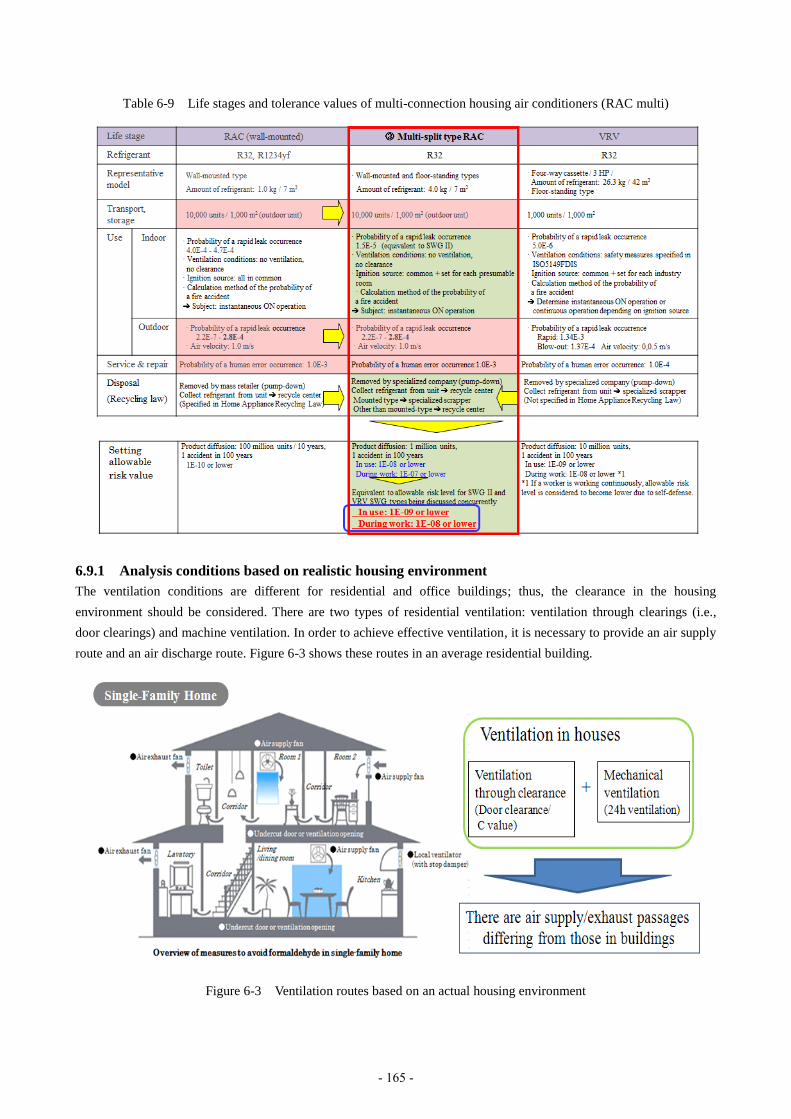
Table 6-9 Life stages and tolerance values of multi-connection housing air conditioners (RAC multi)
6.9.1 Analysis conditions based on realistic housing environment
The ventilation conditions are different for residential and office buildings; thus, the clearance in the housing
environment should be considered. There are two types of residential ventilation: ventilation through clearings (i.e.,
door clearings) and machine ventilation. In order to achieve effective ventilation, it is necessary to provide an air supply
route and an air discharge route. Figure 6-3 shows these routes in an average residential building.
Figure 6-3 Ventilation routes based on an actual housing environment
- 165 -

6.9.2 Effect of door clearances of the housing environment: hinged doors and sliding doors
Let us now consider door clearances in residential buildings. Two types of clearings can be considered for average
residences: cases wherein doors are used as actual ventilation routes, and cases wherein they are not. More precisely, if
doors are used as actual ventilation routes, the clearances are greater than 10 mm. However, even if they are not used as
ventilation routes, there are clearances above and below the doors. Figure 6-4 shows the clearance survey results for
hinged doors of various manufacturers. The results show that the minimum upper clearance is 3 mm, and the minimum
lower clearance is 4 mm. Similarly, the survey results of sliding doors are shown in Figure 6-5. The minimum upper and
lower clearances are both 3 mm, and the door slit is 6.5 mm.
Based on the above results, actual tests and FTA were conducted for a 3-mm clearance for both upper and lower sides
of a door (the door slit was not considered). With regard to sliding doors such as fusuma and shouji (Japanese sliding
and paper screen doors), there may be no clearing at the bottom, so the calculation conditions were changed to 0 mm for
the bottom, 3 mm for the top, and 6.5 mm for the slit clearance.
Figure 6-4 Door clearance
Figure 6-5 Sliding door clearance
6.9.3 Initial refrigerant concentration in indoor leakage from multi-connection floor-standing air
conditioners
The concentration of the refrigerant leaking from the air outlet of a multi-floor air conditioner is an important parameter
for calculating the ignition risk. In the previous simulations conducted by the University of Tokyo, the assumed
condition of initial leakage concentration as suggested by the SWG was 100%, which indicated high risk. However, for
more realistic simulation, we used the experimental results (initial: 30%) from each company of JRAIA. Figure 6-6
compares the current analysis conditions and the original simulation conditions. Based on the market investigation
results for refrigerant leakage, we changed the speed of refrigerant leakage to 10 kg/h.
- 166 -
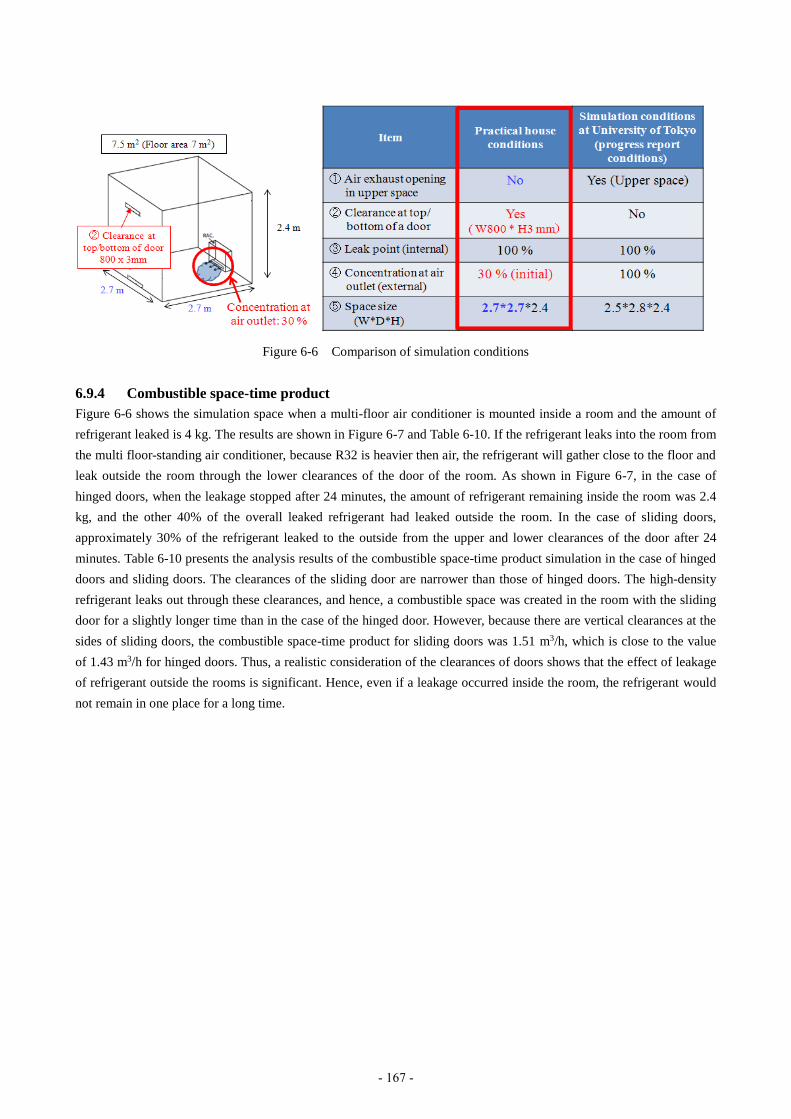
Figure 6-6 Comparison of simulation conditions
6.9.4 Combustible space-time product
Figure 6-6 shows the simulation space when a multi-floor air conditioner is mounted inside a room and the amount of
refrigerant leaked is 4 kg. The results are shown in Figure 6-7 and Table 6-10. If the refrigerant leaks into the room from
the multi floor-standing air conditioner, because R32 is heavier then air, the refrigerant will gather close to the floor and
leak outside the room through the lower clearances of the door of the room. As shown in Figure 6-7, in the case of
hinged doors, when the leakage stopped after 24 minutes, the amount of refrigerant remaining inside the room was 2.4
kg, and the other 40% of the overall leaked refrigerant had leaked outside the room. In the case of sliding doors,
approximately 30% of the refrigerant leaked to the outside from the upper and lower clearances of the door after 24
minutes. Table 6-10 presents the analysis results of the combustible space-time product simulation in the case of hinged
doors and sliding doors. The clearances of the sliding door are narrower than those of hinged doors. The high-density
refrigerant leaks out through these clearances, and hence, a combustible space was created in the room with the sliding
door for a slightly longer time than in the case of the hinged door. However, because there are vertical clearances at the
sides of sliding doors, the combustible space-time product for sliding doors was 1.51 m3/h, which is close to the value
of 1.43 m3/h for hinged doors. Thus, a realistic consideration of the clearances of doors shows that the effect of leakage
of refrigerant outside the rooms is significant. Hence, even if a leakage occurred inside the room, the refrigerant would
not remain in one place for a long time.
- 167 -
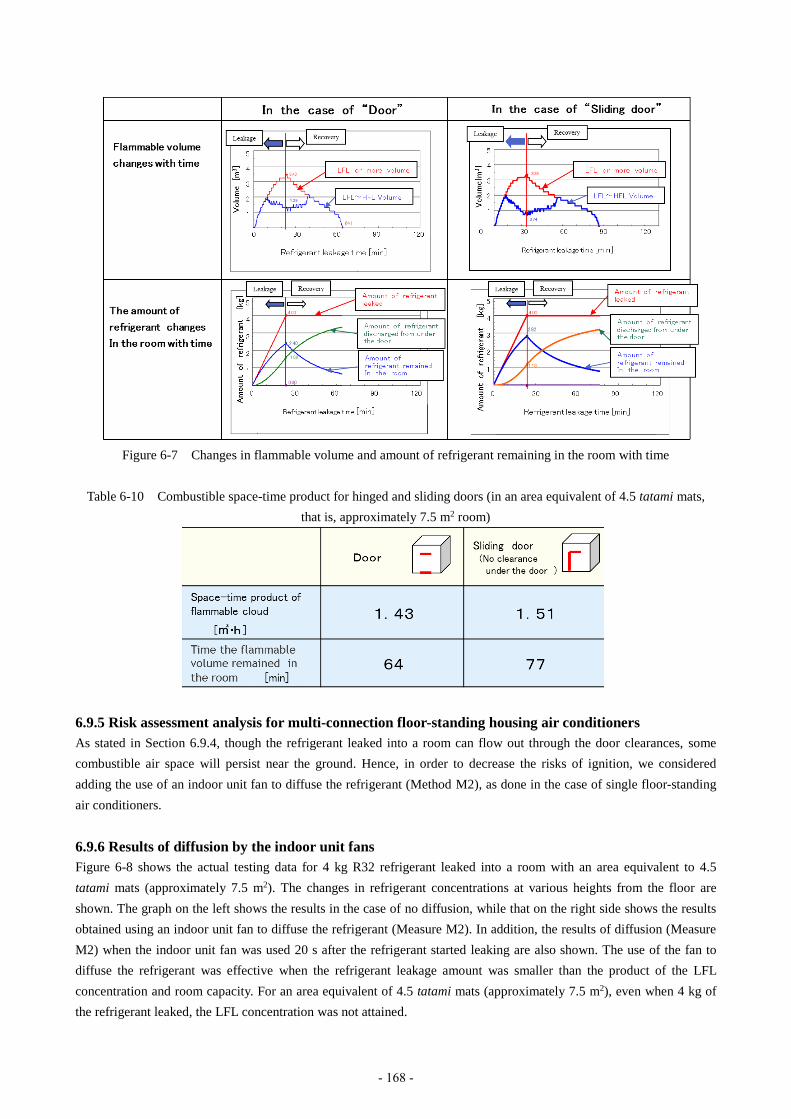
Figure 6-7 Changes in flammable volume and amount of refrigerant remaining in the room with time
Table 6-10 Combustible space-time product for hinged and sliding doors (in an area equivalent of 4.5 tatami mats,
that is, approximately 7.5 m2 room)
6.9.5 Risk assessment analysis for multi-connection floor-standing housing air conditioners
As stated in Section 6.9.4, though the refrigerant leaked into a room can flow out through the door clearances, some
combustible air space will persist near the ground. Hence, in order to decrease the risks of ignition, we considered
adding the use of an indoor unit fan to diffuse the refrigerant (Method M2), as done in the case of single floor-standing
air conditioners.
6.9.6 Results of diffusion by the indoor unit fans
Figure 6-8 shows the actual testing data for 4 kg R32 refrigerant leaked into a room with an area equivalent to 4.5
tatami mats (approximately 7.5 m2). The changes in refrigerant concentrations at various heights from the floor are
shown. The graph on the left shows the results in the case of no diffusion, while that on the right side shows the results
obtained using an indoor unit fan to diffuse the refrigerant (Measure M2). In addition, the results of diffusion (Measure
M2) when the indoor unit fan was used 20 s after the refrigerant started leaking are also shown. The use of the fan to
diffuse the refrigerant was effective when the refrigerant leakage amount was smaller than the product of the LFL
concentration and room capacity. For an area equivalent of 4.5 tatami mats (approximately 7.5 m2), even when 4 kg of
the refrigerant leaked, the LFL concentration was not attained.
- 168 -
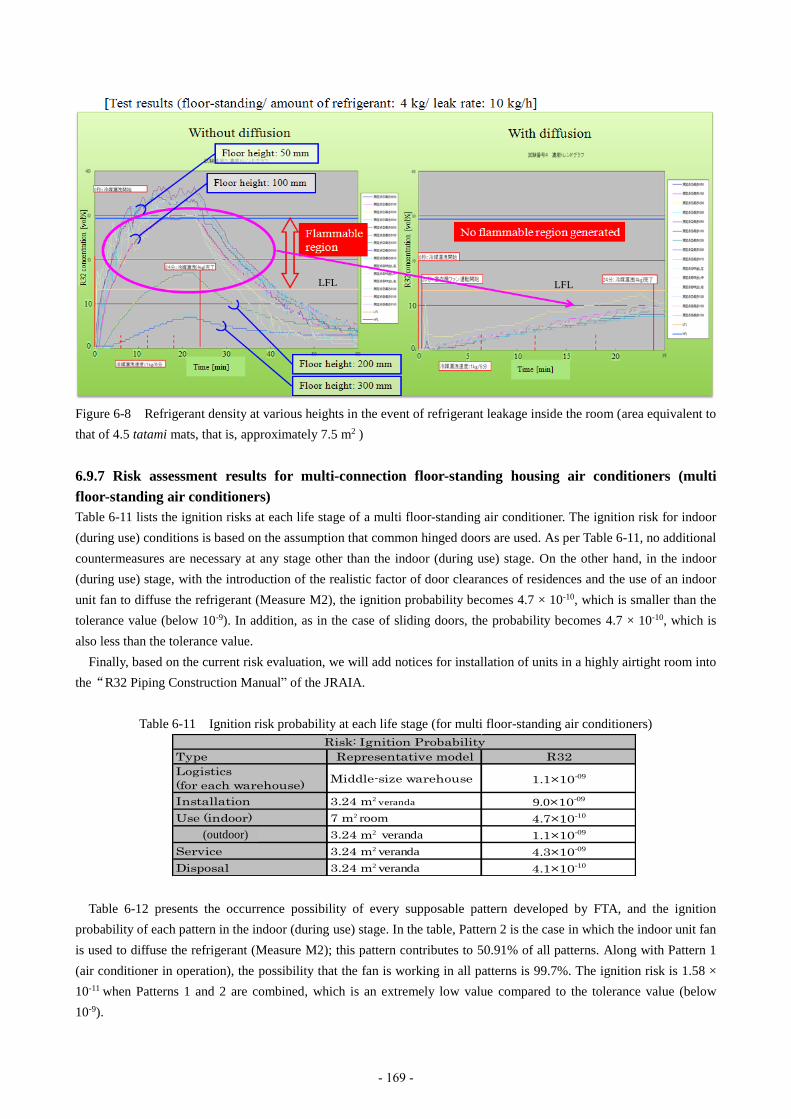
Figure 6-8 Refrigerant density at various heights in the event of refrigerant leakage inside the room (area equivalent to
that of 4.5 tatami mats, that is, approximately 7.5 m2 )
6.9.7 Risk assessment results for multi-connection floor-standing housing air conditioners (multi
floor-standing air conditioners)
Table 6-11 lists the ignition risks at each life stage of a multi floor-standing air conditioner. The ignition risk for indoor
(during use) conditions is based on the assumption that common hinged doors are used. As per Table 6-11, no additional
countermeasures are necessary at any stage other than the indoor (during use) stage. On the other hand, in the indoor
(during use) stage, with the introduction of the realistic factor of door clearances of residences and the use of an indoor
unit fan to diffuse the refrigerant (Measure M2), the ignition probability becomes 4.7 × 10⁻¹⁰, which is smaller than the
tolerance value (below 10-9). In addition, as in the case of sliding doors, the probability becomes 4.7 × 10⁻¹⁰, which is
also less than the tolerance value.
Finally, based on the current risk evaluation, we will add notices for installation of units in a highly airtight room into
the“R32 Piping Construction Manual” of the JRAIA.
Table 6-11 Ignition risk probability at each life stage (for multi floor-standing air conditioners)
Table 6-12 presents the occurrence possibility of every supposable pattern developed by FTA, and the ignition
probability of each pattern in the indoor (during use) stage. In the table, Pattern 2 is the case in which the indoor unit fan
is used to diffuse the refrigerant (Measure M2); this pattern contributes to 50.91% of all patterns. Along with Pattern 1
(air conditioner in operation), the possibility that the fan is working in all patterns is 99.7%. The ignition risk is 1.58 ×
10-11 when Patterns 1 and 2 are combined, which is an extremely low value compared to the tolerance value (below
10-9).
LFL LFL
Type Representative model R32
Logistics
(for each warehouse)Middle-size warehouse 1.1×10-09
Installation 3.24 m2 veranda 9.0×10-09
Use (indoor) 7 m2 room 4.7×10⁻¹⁰
Use (outdoor) 3.24 m2 veranda 1.1×10-09
Service 3.24 m2 veranda 4.3×10-09
Disposal 3.24 m2 veranda 4.1×10⁻¹⁰
Risk: Ignition Probability
(outdoor)
- 169 -

Table 6-12 Ratio of occurrence patterns applying FTA and their ignition risk probabilities in the indoor (use) stage
Pattern
[Method 2]
Power Operation / Stop
Part
malfunction
Yes/No
Occurrence
ratio / all
patterns
Ignition
risk
probability
Diffusion
with I.U. fan
Breaker OFF
countermeasure
General
risk
1
Diffusion
possible
In order to
avoid breaker
OFF, add
caution label to
unit
Breaker ON
Operating
(indoor fan ON) No 48.80% 7.7×10⁻¹²
2 Stop → indoor
fan ON No 50.91% 8.1×10⁻¹²
Risk that
does not
occur in
general
3
Diffusion not
possible Same as above
Breaker ON
Stop
Yes 0.04% 5.6×10⁻¹¹
4 Power
outage No 0.002% 2.4×10⁻¹²
5 Breaker
OFF No 0.25% 3.9×10⁻¹⁰
Sum of ignition risk 4.7×10⁻¹⁰
6.10 Risk Assessment for Multi-connection Wall-Mounted Air Conditioners (Multi-Wall
Mounted Air Conditioners)
Table 6-13 shows the ignition probabilities at each life stage for multi-wall-mounted air conditioners. Because only the
indoor units are different, except for the indoor (during use) stage, the values are the same as those for the multi
floor-standing air conditioners presented in Table 6-11. In the case of multi-wall mounted air conditioners, the ignition
risk probability in the indoor (during use) stage is 1.0 × 10⁻⁹ even without countermeasures, which satisfies the tolerance
value (below 10-9). Hence, in the case of multi-wall mounted air conditioners, there is no need to consider measure M2.
Table 6-13 Ignition risk probability in each life stage (multi-wall mounted air conditioners)
6.11 Summary of Risk Assessment of Housing Air Conditioners
In Mini Split SWG (I), we promoted risk assessment mainly of ordinary wall-mounted air conditioners, but in order to
accelerate the trend of prevention of global warming, risk assessment was carried out by expanding the scope to housing
air conditioners. With regard to housing air conditioners, we conducted the risk assessment of floor-standing type
housing air conditioners, and confirmed that by using measure S1, they can be used safely. In addition, the results of
risk evaluation of multi-connection housing air conditioners with a refrigerant charge amount of 4 kg also showed that
Type Representative model R32
Logistics
(for each warehouse) Middle-size warehouse 1.1×10 -09
Installation 3.24 m 2 veranda 9.0×10 -09
Use (indoor) 7 m 2 room 1.0×10 -09
Use (outdoor) 3.24 m 2 veranda 1.1×10 -09
Service 3.24 m 2 veranda 4.3×10 -09
Disposal 3.24 m 2 veranda 4.1×10 -10
Risk: Ignition Probability
- 170 -

adoption of measure M2 reduced the values to a level lower than the tolerance value (10-9; below 10-8 during the work
conducted by service providers). Accordingly, even in the case of multi-connection floor-standing housing air
conditioners with the highest risks, by considering the clearances within a residence and by using an indoor unit fan to
diffuse the leaked refrigerant, it was proven that these air conditioners could also be used safely. From the above, the
risk assessment for R32 was completed for all types (wall mounted, ceiling mounted cassette, wall embedded,
floor-standing, built-in [low ceiling installation]) housing air conditioners (one-to one and multi-connection), and it has
been confirmed that there are no problems for use of these equipment.
6.12 Diesel Explosion and Combustion Products
In addition to the combustibility hazard, there is a possibility of diesel explosion and generation of toxic substances by
combustion. These are discussed briefly below. For details, please refer to past progress reports.
In the case of installation, service, and retrieving the refrigerant from the compressor after the disposal stage, if the
operation sequence is wrong, the air will be sucked into the system, causing a diesel explosion. After restricting the
release of fluorocarbons into the atmosphere, diesel explosions occurred only a few times within a decade. The danger
posed by diesel explosion is that the debris scattered during the explosion may hit people. When heavy parts such as
stators, rotors, and machine room parts in the compressor hit people, the degree of harm increases to III. Moreover, the
probability is estimated at approximately 3 times in 10 years, and the occurrence probability is estimated at
approximately 3 × 10 -9, taking into account the number of domestic air conditioner in the market. This falls into
Area-B of the R-Map, which means there is no direct risk for users, but certain countermeasures are necessary.
Warnings regarding this hazard have been declared on the homepage of JRAIA and are also written in the operation
manuals and other related documents of each company. However, a diesel explosion accident occurred in Osaka last
year. This accident occurred during the relocation of air conditioners by people with insufficient knowledge and
technology. This diesel explosion also reveal the severe problem of effectively teaching and training nonprofessional
persons in air conditioner installation and relocation tasks to reduce such accidents. In the future, it will be necessary to
continue the education and training of professional technicians; to inform the risks of a diesel explosion to individuals
who are not professional technicians but who conduct related work; and to devise some measures to ensure that the
work is carried out correctly and safely. For the risk assessment of products after combustion, even when no combustion
happens, harmful products are generated when the refrigerant comes in contact with combustion equipment or
high-temperature surfaces, as suggested from the knowledge regarding incombustible refrigerants such as R410A and
R22. The literature of Imamura et al. shows that when a refrigerant leaks from a wall-mounted air conditioner to a
heating device of a reflection-type oil heater or an oil fan heater, the generated hydrofluoric acid exceeds the limit of 3
ppm owing to contact with the heating device. This phenomenon was similar to that observed for R1234yf, R32, and
R410A (current refrigerant). Meanwhile, regardless of the type of the refrigerant, (1) hydrofluoric acid is generated, and
(2) the generated acid reaches the locations where people frequent, (3) and evasive action is not taken against the
stimulation of this hydrofluoric acid6-13). When the above three conditions are satisfied and the amount of hydrofluoric
acid generated with a high concentration of several 10 times or more than 3 ppm, which is the limit, leads to serious
accidents. Although the survey results of the SWG shows that no odor is created during the generation of hydrofluoric
acid, previous experience proves that odor may be detected. However, after the leakage of R410A and R22, the
refrigerant will make contact with the combustion equipment and high-temperature surface. Harmful hydrofluoric acid
and phosgene are then generated along with an unpleasant smell. However, in the past 20 years, these combustion
products never caused serious problems for users. Generally, infants and elder people cannot take avoidance action
against the formation of hydrofluoric acid. However, because such opportunities for these people to exist independently
in a space where air conditioners and combustion equipment are used at the same time are extremely rare, they may not
lead to serious injury (III). Even if the rapid burning of R1234yf and R32 due to heating appliances does not occur, the
- 171 -

use of A2L refrigerants, including R410A, may produce this phenomenon and create a physical hazard by generating
HF and other chemical substances.
Because evasive measures can be taken, the risk evaluation for hazards caused by combustion products is set at level
II (moderate injury) within the R-Map. Further, interviews conducted with the JRAIA and individual companies reveal
that no such accidents were reported for the past 20 years; thus, the estimated probability of occurrence is 5 × 10⁻¹⁰.
Consequently, risk assessment is now focused on Area-C within the R-Map, and there is high probability that this
hazard has not been regarded as a problem for the conventional refrigerants. Based on the results of analysis it carried
out by the University of Tokyo and the National Institute of Advanced Industrial Science and Technology, in the case of
both R32 and R1234yf, there were no major differences in the amount of either toxic or chemical substances as
compared to the conventional refrigerants.
Therefore, a detailed discussion may be necessary, but we believe that the materials generated by the burning of
flammable refrigerants are tolerable to society, as in the case of the conventional refrigerants. Of course, similar to the
conventional refrigerants, it is necessary to arouse the attention for the flammable refrigerant while using
simultaneously with fire.
6.13 Consideration for the Actual Large Ignition Experiment Results
Chapter 3 presented the actual large ignition experiment results of a mildly flammable refrigerant in a small space. We
will not discuss these results in detail in this chapter, but we briefly rearranged the ideas for the results here. When the
concentration of R32 and R1234ze exceed the LFL because of rapid leakage in the experiments, strong combustion
occurs by the ignition from open flames. The phenomenon is considered as deflagration with extremely slow
propagation.
For distinguishing this phenomenon from other deflagration we use the term "weak deflagration" for convenience.
According to the experimental results, since the flame was visible, the burning velocity did not increase significantly
from the general burning velocity of the flammable refrigerant even if acceleration due to some turbulence occurred.
Therefore, it is unlikely that the result of the actual large ignition experiment is detonation or deflagration with a fast
burning velocity. Here, this phenomenon is considered as a "weak deflagration" with low burning velocity, and it is used
for the following description.
The following paragraph discusses the experiment result for weak deflagration. Considering the likelihood and
considering the types of harm and damage of fire accident from the generation of the combustible zone due to leakage
and the existence of the ignition source. And we will discuss the risk of air conditioning equipment actually used as
industry or refrigerating and air conditioning equipment aiming to use.
First, we discuss the likelihood of weak deflagration for a residential air conditioner using a mildly flammable
refrigerant. The installation floor area of the residential air conditioner is restricted so even when the entire refrigerant
leaks, its concentration does not reach the LFL. However, the air conditioner may be installed in a small room.
Assuming that the height of ceiling is 2.2 m, the small room area should be as low as 1.47 m2 for achieving the LFL
when 1 kg of the refrigerant charged in an ordinary household air conditioner leaks. A floor area of 1.47 m2 is
equivalent to a room of approximately 1.2 m square. It is not possible to install an air conditioner in such a small room
without connecting another room. We expect that even in such a worst-case installation, if the floor area of the
connected room is included, the refrigerant concentration will still be less than LFL after uniformly mixing so that the
weak deflagration does not occur. Further, the ignition sources in general residences where domestic air conditioners are
installed are limited to naked fire like oil lighters and candles, and other household appliances and static electricity
sparks do not serve as ignition sources. Therefore, the possibility of weak deflagration is very small according to the
study of Mini Split Air Conditioner Risk Assessment SWG of JRAIA.
With regard to the chillers, package air conditioners, and building multi-air conditioners, only specialists install these
- 172 -
facilities in planned spaces. Hence, even if a large amount of refrigerant leaks out, the refrigerant concentration can be
reduced to a value lower than the LFL by means of the ventilation equipment, refrigerant leakage interruption devise of
air-conditioning cycles, or other safety measures. Hence, ignition combustion will not occur despite the presence of
ignition sources. In particular, weak deflagration generally does not occur in the case of chillers. This is because in the
underground machine room, the ventilation is mandatory as per regulations. However, the ventilation machine may stop
working or the room space may be separated by movable walls. We should consider the event in which both these
situations arise simultaneously. However, the probability of occurrence of such a case is smaller than the probability of
occurrence of the risk assessment result executed by each SWG of JRAIA. Therefore, even in the case of chillers,
package air conditioners, and building multi-air conditioners, weak deflagration does not occur unless a number of
accidental events overlap.
Many types of harm and damage may be expected in the actual large ignition experimental results and the suppliers
of the products that using mildly flammable refrigerants wish to present a common interpretation. The damage caused
by the weak deflagration of a flammable refrigerant can be classified into damage to humans and that to property. With
regard to damage to humans, this phenomenon may cause physical injuries such as burns, damage to eardrum damages,
and fractures. In addition, the influence of harmful chemical substances such as hydrofluoric acid generated during
combustion cannot be ignored. Further, part of the building may be damaged because of the rise in pressure due to gas
expansion in the weak deflagration; other problems such as physical damage to glass need to be considered.
The results of this actual large ignition experiments verified that weak deflagration corresponds to the burning
conditions of mildly flammable refrigerants. Engineers engaged in air-conditioner development should be aware of this
phenomenon.
Lastly, the hydrocarbons are described. The likelihood of deflagration is remarkably large because the ignition energy
of hydrocarbons is small. This deflagration may change to some phenomenon which is similar to detonation. In these
phenomena, pressure rises rapidly, and the burning velocity is extremely high. Hence, humans and building both incur
damage. Incidents of leakage of LPG and resulting accidents in the past are well known.
From the viewpoint of the global environment, the use of mildly flammable refrigerants is necessary. However, for
preventing weak deflagration, it is necessary to properly manage the amount of refrigerant charged, set a ventilation
system or refrigerant leakage interruption devise, establish a standard for installation, and conduct inspections for
freezing leakage test in the air conditioning cycle. The SWG classified the degree of hazards, assessed the possibility of
occurrence of leakage ignition, determined the assumed conditions, and conducted risk assessment. In order to improve
the global environment, the mildly flammable refrigerant should be used under proper regulations, considering human
life and property. Note that the above contents are not aggregated by the JRAIA, but the member companies of JRAIA,
which have marketed air conditioners using mildly flammable refrigerants such as R32, share the intention.
6.14 Summary
The mini-split risk assessment SWG conducted risk assessment for R32 and R1234yf in wall-mounted residential air
conditioners, and confirmed that there are no safety problems. We also analyzed the risk assessment for housing air
conditioners using R32 and confirmed that they can be used without problems if certain measures are adhered. In order
to reduce the risks, we revised the manuals used during installation or servicing. More precisely, in the “Piping
construction manual for residential air conditioners using R32 refrigerant” (industrial society internal material) issued
by the JRAIA, we added cautionary reminders to service manuals and installation manuals, etc., and made suggestions
and manuals about the measures that can be adopted for R32.
Finally, we would like to express gratitude for the study conducted by Tokyo University of Science, Suwa, which
improved the accuracy of the risk assessment. In the future, we expect that once the damage level is clarified, we will be
able to use R32 and R1234yf air conditioners with more safely, thus contributing to prevent global warming. The risk
- 173 -
evaluation of mini-split air conditioners is concluded here.
References
6-1) Kenji. Yao,The International Symposium on HCFC Alternative refrigerants and Environmental Technology,
pp182-189, (2000) (in Japanese)
6-2) Hihara, E., The International Symposium on New refrigerants and Environmental Technology 2014, Kobe(2012),
pp59-60
6-3) Tomohiko Imamura, Osami Sugawa, “Physical Hazard Evaluation for using Air Conditioning Systems having
Low-Flammable Refrigerants with the Fossil-fuel Heating System at the Same Time,” Transactions of Japan
Society of Refrigerating and Air Conditioning Engineers, Vol.29 No.4,pp.401-411 ( 2012) (in Japanese)
6-4) Kenji Takizawa, Study on Minimum Ignition Energy of Mildly Flammable Refrigerant (2011)
6-5) Goetzler et.al., Risk Assessment of HFC-32 and HFC-32/134a(30/7wt.%) in split system residential heat
pumps:DOE/CE/23810-92, ADL, (1998)
6-6) Dean Smith et al., Determining Minimum Ignition Energies and Quenching Distances of Difficult to Ignite
Components, Journal of Testing and Evaluation, Vol. 31, No.3
6-7) Minor et al.: Flammability Characteristics of HFO-1234yf; AIChE Process Safety Progress Vol. 29, No. 2, pp.
150–154 (2010)
6-8) Minor et al.: Next Generation Low GWP Refrigerant HFO-1234yf Part 2; ASHRAE meeting, N.Y. (January
2008)
6-9) Imamura et al., Evaluation of Fire Hazards of A2L Class Refrigerant,The International Symposium on New
refrigerants and Environmental Technology (2012)
6-10) http://www.cao.go.jp/consumer/history/01/kabusoshiki/anzen/doc/006_110201_shiryou2.pdf, 2015.11.30 (in
Japanese)
6-11) Kenji Takaichi, The International Symposium on New refrigerants and Environmental Technology 2012,
pp90-94 (2012) (in Japanese)
6-12) http://www.meti.go.jp/product_safety/recall/risk_assessment_practice.pdf
- 174 -
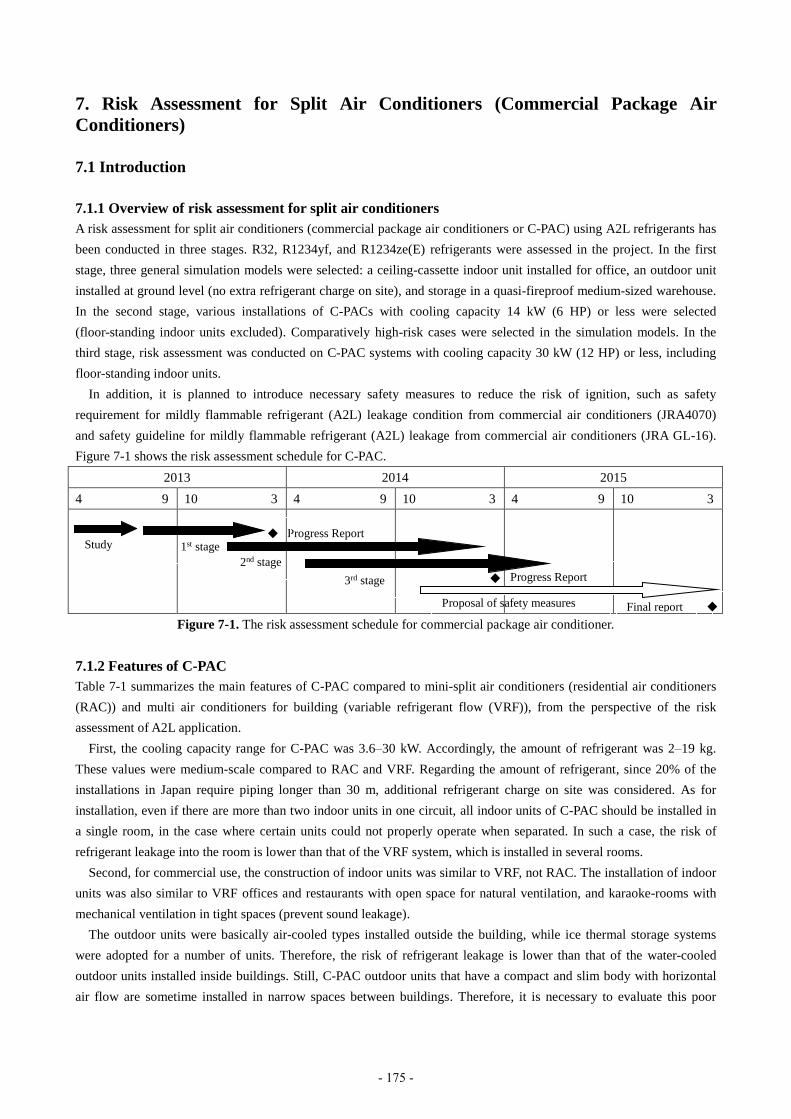
7. Risk Assessment for Split Air Conditioners (Commercial Package Air
Conditioners)
7.1 Introduction
7.1.1 Overview of risk assessment for split air conditioners
A risk assessment for split air conditioners (commercial package air conditioners or C-PAC) using A2L refrigerants has
been conducted in three stages. R32, R1234yf, and R1234ze(E) refrigerants were assessed in the project. In the first
stage, three general simulation models were selected: a ceiling-cassette indoor unit installed for office, an outdoor unit
installed at ground level (no extra refrigerant charge on site), and storage in a quasi-fireproof medium-sized warehouse.
In the second stage, various installations of C-PACs with cooling capacity 14 kW (6 HP) or less were selected
(floor-standing indoor units excluded). Comparatively high-risk cases were selected in the simulation models. In the
third stage, risk assessment was conducted on C-PAC systems with cooling capacity 30 kW (12 HP) or less, including
floor-standing indoor units.
In addition, it is planned to introduce necessary safety measures to reduce the risk of ignition, such as safety
requirement for mildly flammable refrigerant (A2L) leakage condition from commercial air conditioners (JRA4070)
and safety guideline for mildly flammable refrigerant (A2L) leakage from commercial air conditioners (JRA GL-16).
Figure 7-1 shows the risk assessment schedule for C-PAC.
2013 2014 2015
4 9 10 3 4 9 10 3 4 9 10 3
Figure 7-1. The risk assessment schedule for commercial package air conditioner.
7.1.2 Features of C-PAC
Table 7-1 summarizes the main features of C-PAC compared to mini-split air conditioners (residential air conditioners
(RAC)) and multi air conditioners for building (variable refrigerant flow (VRF)), from the perspective of the risk
assessment of A2L application.
First, the cooling capacity range for C-PAC was 3.6–30 kW. Accordingly, the amount of refrigerant was 2–19 kg.
These values were medium-scale compared to RAC and VRF. Regarding the amount of refrigerant, since 20% of the
installations in Japan require piping longer than 30 m, additional refrigerant charge on site was considered. As for
installation, even if there are more than two indoor units in one circuit, all indoor units of C-PAC should be installed in
a single room, in the case where certain units could not properly operate when separated. In such a case, the risk of
refrigerant leakage into the room is lower than that of the VRF system, which is installed in several rooms.
Second, for commercial use, the construction of indoor units was similar to VRF, not RAC. The installation of indoor
units was also similar to VRF offices and restaurants with open space for natural ventilation, and karaoke-rooms with
mechanical ventilation in tight spaces (prevent sound leakage).
The outdoor units were basically air-cooled types installed outside the building, while ice thermal storage systems
were adopted for a number of units. Therefore, the risk of refrigerant leakage is lower than that of the water-cooled
outdoor units installed inside buildings. Still, C-PAC outdoor units that have a compact and slim body with horizontal
air flow are sometime installed in narrow spaces between buildings. Therefore, it is necessary to evaluate this poor
Progress Report
Final report
Study 1st stage ◆
2nd stage
3rd stage
Proposal of safety measures ◆
◆ Progress Report
- 175 -
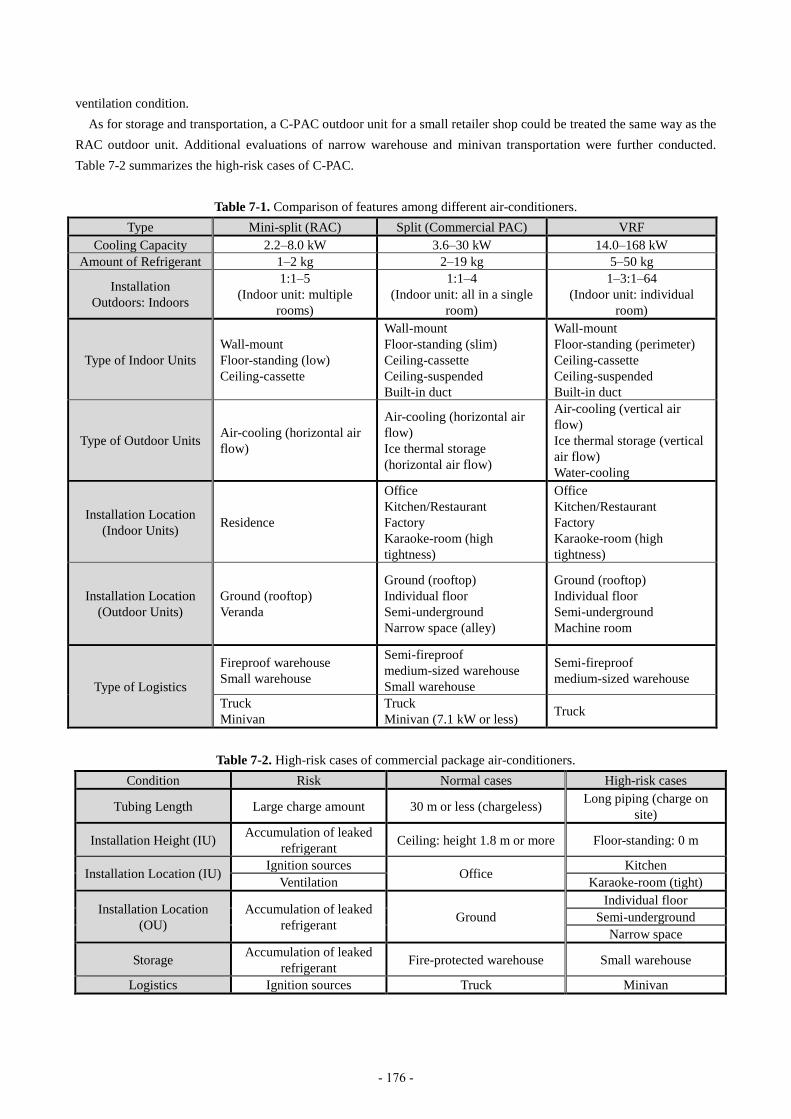
ventilation condition.
As for storage and transportation, a C-PAC outdoor unit for a small retailer shop could be treated the same way as the
RAC outdoor unit. Additional evaluations of narrow warehouse and minivan transportation were further conducted.
Table 7-2 summarizes the high-risk cases of C-PAC.
Table 7-1. Comparison of features among different air-conditioners.
Type Mini-split (RAC) Split (Commercial PAC) VRF
Cooling Capacity 2.2–8.0 kW 3.6–30 kW 14.0–168 kW
Amount of Refrigerant 1–2 kg 2–19 kg 5–50 kg
Installation
Outdoors: Indoors
1:1–5
(Indoor unit: multiple
rooms)
1:1–4
(Indoor unit: all in a single
room)
1–3:1–64
(Indoor unit: individual
room)
Type of Indoor Units
Wall-mount
Floor-standing (low)
Ceiling-cassette
Wall-mount
Floor-standing (slim)
Ceiling-cassette
Ceiling-suspended
Built-in duct
Wall-mount
Floor-standing (perimeter)
Ceiling-cassette
Ceiling-suspended
Built-in duct
Type of Outdoor Units Air-cooling (horizontal air
flow)
Air-cooling (horizontal air
flow)
Ice thermal storage
(horizontal air flow)
Air-cooling (vertical air
flow)
Ice thermal storage (vertical
air flow)
Water-cooling
Installation Location
(Indoor Units) Residence
Office
Kitchen/Restaurant
Factory
Karaoke-room (high
tightness)
Office
Kitchen/Restaurant
Factory
Karaoke-room (high
tightness)
Installation Location
(Outdoor Units)
Ground (rooftop)
Veranda
Ground (rooftop)
Individual floor
Semi-underground
Narrow space (alley)
Ground (rooftop)
Individual floor
Semi-underground
Machine room
Type of Logistics
Fireproof warehouse
Small warehouse
Semi-fireproof
medium-sized warehouse
Small warehouse
Semi-fireproof
medium-sized warehouse
Truck
Minivan
Truck
Minivan (7.1 kW or less) Truck
Table 7-2. High-risk cases of commercial package air-conditioners.
Condition Risk Normal cases High-risk cases
Tubing Length Large charge amount 30 m or less (chargeless) Long piping (charge on
site)
Installation Height (IU) Accumulation of leaked
refrigerant Ceiling: height 1.8 m or more Floor-standing: 0 m
Installation Location (IU) Ignition sources
Office Kitchen
Ventilation Karaoke-room (tight)
Installation Location
(OU)
Accumulation of leaked
refrigerant Ground
Individual floor
Semi-underground
Narrow space
Storage Accumulation of leaked
refrigerant Fire-protected warehouse Small warehouse
Logistics Ignition sources Truck Minivan
- 176 -

7.1.3 Risk assessment methodology
Leakage of refrigerant with flammability slightly higher than the current refrigerant (R410A) may cause fire accident,
which composes the risk of A2L refrigerant application. Figure 7-2 presents the causes of ignition probability of A2L
refrigerants; the ignition probability is influenced by multiplying together the three probabilities shown in the figure. It
is important to verify whether the ignition probability is below the allowable risk level in the risk assessment. If the
ignition probability is higher than the allowable value, safety measures are required to reduce the risk level.
The risk assessment method for C-PAC was conducted based on the idea similar to the risk assessments for RAC7–1)
and VRF7–2) sub-working group (SWG) in the Japan Refrigeration and Air Conditioning Industry Association (JRAIA).
Figure 7-2. Mechanism of ignition for A2L refrigerants.
7.1.4 Setting of the allowable risk level
Because there are 7.8 million units (0.6 million units with product lifetime of 13 years) of C-PAC in Japan’s market, it
is acceptable that one serious accident is allowed to happen every 100 years. In each life stage of the unit, workers
handle the equipment when it is not in the usage stage. The workers have been trained to control the risk, or reduce the
risk level in the case of an accident. Thus, the allowable ignition probability was considered 10 times higher.
[Allowable risk levels for ignition accidents for C-PAC]
- Usage stage: 1.3×10⁻⁹ 1/(unit∙year)
- Logistics, Installation, Service, and Disposal stages (excluding Usage stage): 1.3×10⁻⁸ 1/ (unit∙year)
7.1.5 Factors of ignition accidents for C-PAC with A2L refrigerants
Figure 7-2 shows the mechanism of ignition. Normally, refrigerant leakage from air conditioners does not occur.
However, if unexpected leakage occurs, the ignition probability is calculated by multiplying probability of refrigerant
leakage, probability of flammable region generation, and probability of ignition source presence, as shown in Figure
7-2.
First, the refrigerant leakage probability from C-PAC was determined by the survey result of VRF-SWG where the
design specifications of equipment are similar and the questionnaires from C-PAC manufactures in JRAIA. The
probability of indoor unit leakage for a C-PAC was three times more than that of a VRF. The difference was affected by
the level of leakage checked during installation.
[The probability of refrigerant leakage from a C-PAC]
- Indoor unit: 1.03×10⁻³ 1/(unit∙year) for mild leakage, 1.50×10⁻⁵ 1/(unit∙year) for rapid leakage
- Outdoor unit: 6.13×10⁻² 1/(unit∙year) for mild leakage, 1.34×10⁻³ 1/(unit∙year) for rapid leakage, 1.37×10⁻⁴ 1/(unit∙
year) for mild leakage
In addition, during the product life-cycle stages of Installation, Service, and Disposal, leakage is sometimes caused
by human error, such as improper operation. The probability of human error for a C-PAC was also assumed as 10-3,
which was 10 times greater than that of a VRF, because the professional level of the workers for C-PAC was relatively
lower.
Second, three-dimensional concentration simulation has been conducted to analyze the possible volume needed to
Probability of ignition
source presence
Probability of flammable region generation
[Air condition (ventilation)]
Ignition probability
Probability of
refrigerant leakage
- 177 -
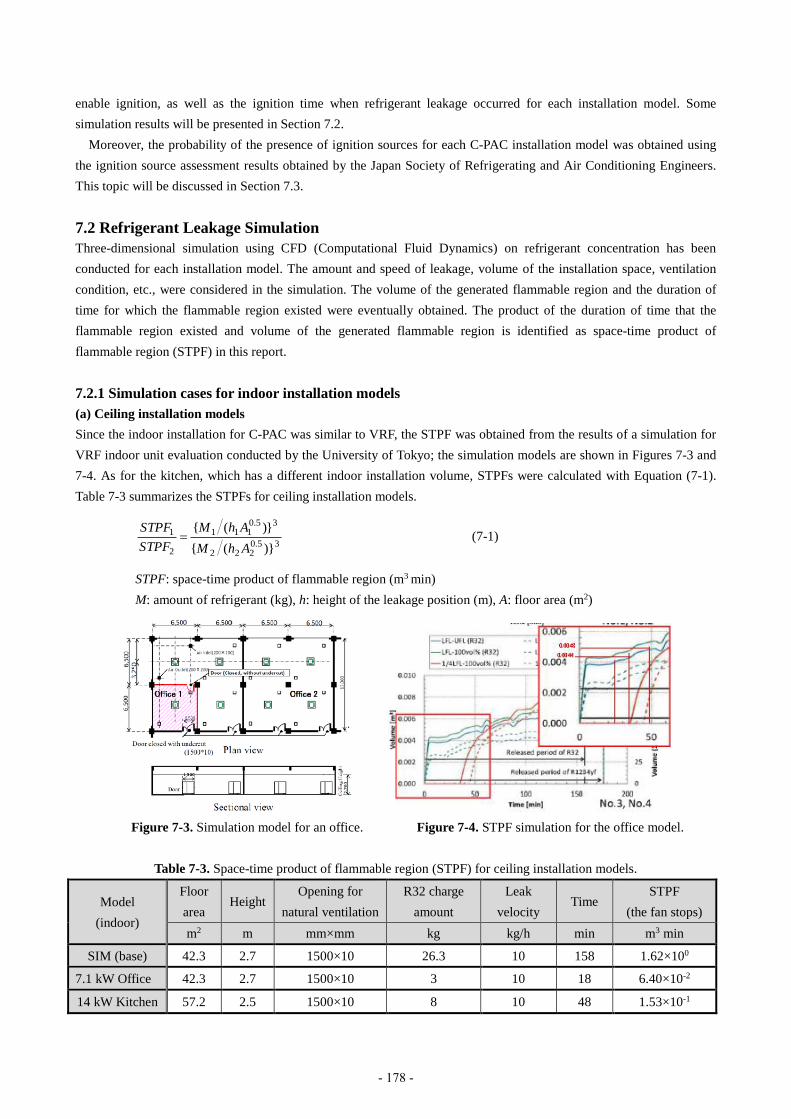
enable ignition, as well as the ignition time when refrigerant leakage occurred for each installation model. Some
simulation results will be presented in Section 7.2.
Moreover, the probability of the presence of ignition sources for each C-PAC installation model was obtained using
the ignition source assessment results obtained by the Japan Society of Refrigerating and Air Conditioning Engineers.
This topic will be discussed in Section 7.3.
7.2 Refrigerant Leakage Simulation
Three-dimensional simulation using CFD (Computational Fluid Dynamics) on refrigerant concentration has been
conducted for each installation model. The amount and speed of leakage, volume of the installation space, ventilation
condition, etc., were considered in the simulation. The volume of the generated flammable region and the duration of
time for which the flammable region existed were eventually obtained. The product of the duration of time that the
flammable region existed and volume of the generated flammable region is identified as space-time product of
flammable region (STPF) in this report.
7.2.1 Simulation cases for indoor installation models
(a) Ceiling installation models
Since the indoor installation for C-PAC was similar to VRF, the STPF was obtained from the results of a simulation for
VRF indoor unit evaluation conducted by the University of Tokyo; the simulation models are shown in Figures 7-3 and
7-4. As for the kitchen, which has a different indoor installation volume, STPFs were calculated with Equation (7-1).
Table 7-3 summarizes the STPFs for ceiling installation models.
35.0
222
35.0111
2
1
)}({
})({
AhM
AhM
STPF
STPF (7-1)
STPF: space-time product of flammable region (m3 min)
M: amount of refrigerant (kg), h: height of the leakage position (m), A: floor area (m2)
Figure 7-3. Simulation model for an office. Figure 7-4. STPF simulation for the office model.
Table 7-3. Space-time product of flammable region (STPF) for ceiling installation models.
Model
(indoor)
Floor
area Height
Opening for
natural ventilation
R32 charge
amount
Leak
velocity Time
STPF
(the fan stops)
m2 m mm×mm kg kg/h min m3 min
SIM (base) 42.3 2.7 1500×10 26.3 10 158 1.62×100
7.1 kW Office 42.3 2.7 1500×10 3 10 18 6.40×10⁻²
14 kW Kitchen 57.2 2.5 1500×10 8 10 48 1.53×10⁻¹
- 178 -
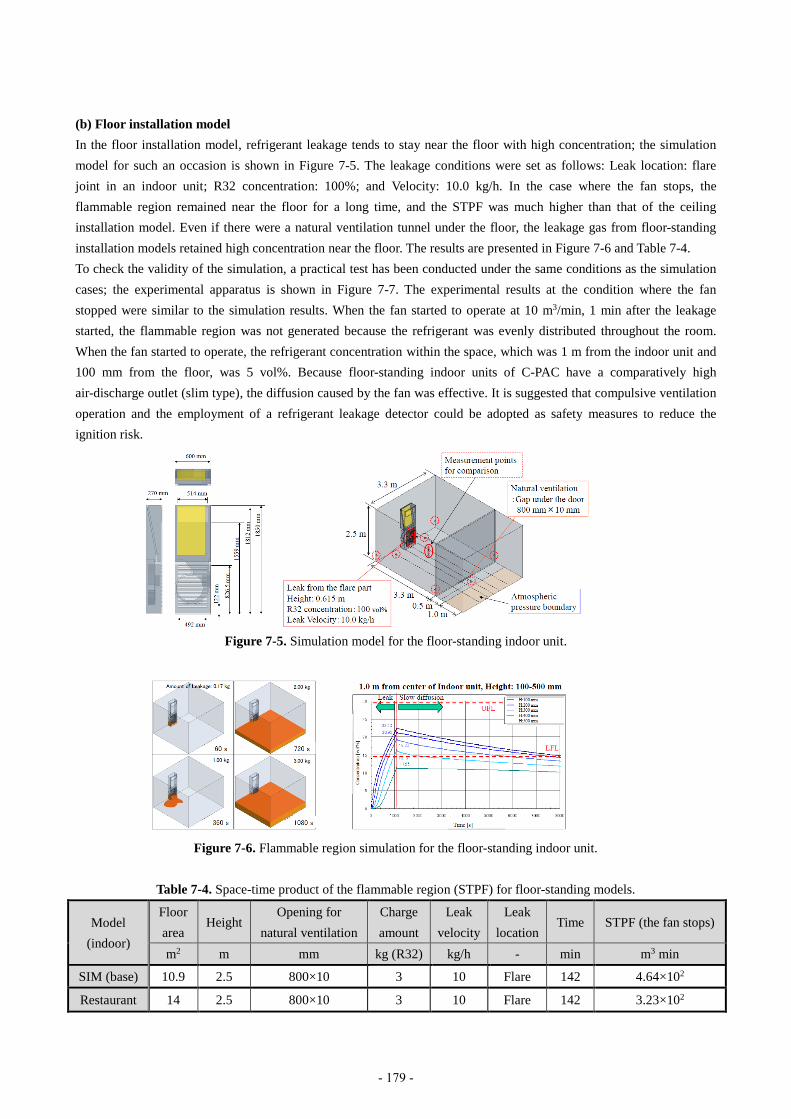
(b) Floor installation model
In the floor installation model, refrigerant leakage tends to stay near the floor with high concentration; the simulation
model for such an occasion is shown in Figure 7-5. The leakage conditions were set as follows: Leak location: flare
joint in an indoor unit; R32 concentration: 100%; and Velocity: 10.0 kg/h. In the case where the fan stops, the
flammable region remained near the floor for a long time, and the STPF was much higher than that of the ceiling
installation model. Even if there were a natural ventilation tunnel under the floor, the leakage gas from floor-standing
installation models retained high concentration near the floor. The results are presented in Figure 7-6 and Table 7-4.
To check the validity of the simulation, a practical test has been conducted under the same conditions as the simulation
cases; the experimental apparatus is shown in Figure 7-7. The experimental results at the condition where the fan
stopped were similar to the simulation results. When the fan started to operate at 10 m3/min, 1 min after the leakage
started, the flammable region was not generated because the refrigerant was evenly distributed throughout the room.
When the fan started to operate, the refrigerant concentration within the space, which was 1 m from the indoor unit and
100 mm from the floor, was 5 vol%. Because floor-standing indoor units of C-PAC have a comparatively high
air-discharge outlet (slim type), the diffusion caused by the fan was effective. It is suggested that compulsive ventilation
operation and the employment of a refrigerant leakage detector could be adopted as safety measures to reduce the
ignition risk.
Figure 7-5. Simulation model for the floor-standing indoor unit.
Figure 7-6. Flammable region simulation for the floor-standing indoor unit.
Table 7-4. Space-time product of the flammable region (STPF) for floor-standing models.
Model
(indoor)
Floor
area Height
Opening for
natural ventilation
Charge
amount
Leak
velocity
Leak
location Time STPF (the fan stops)
m2 m mm kg (R32) kg/h - min m3 min
SIM (base) 10.9 2.5 800×10 3 10 Flare 142 4.64×10²
Restaurant 14 2.5 800×10 3 10 Flare 142 3.23×10²
- 179 -
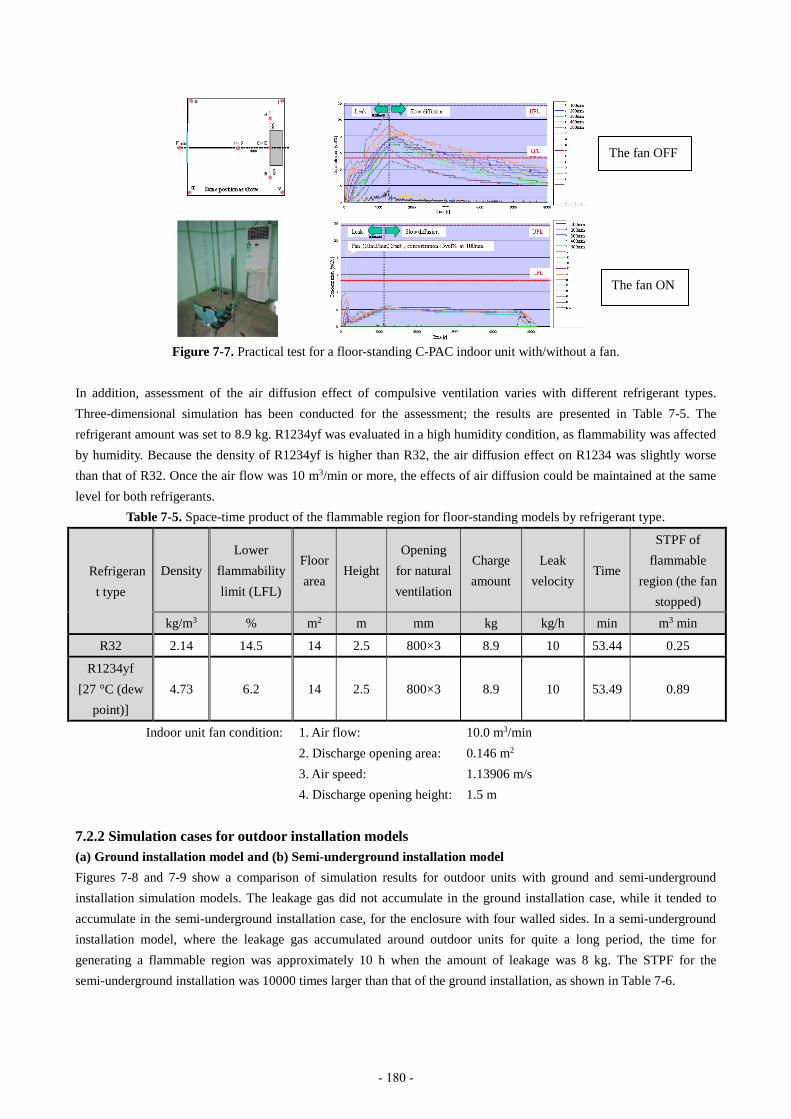
Figure 7-7. Practical test for a floor-standing C-PAC indoor unit with/without a fan.
In addition, assessment of the air diffusion effect of compulsive ventilation varies with different refrigerant types.
Three-dimensional simulation has been conducted for the assessment; the results are presented in Table 7-5. The
refrigerant amount was set to 8.9 kg. R1234yf was evaluated in a high humidity condition, as flammability was affected
by humidity. Because the density of R1234yf is higher than R32, the air diffusion effect on R1234 was slightly worse
than that of R32. Once the air flow was 10 m3/min or more, the effects of air diffusion could be maintained at the same
level for both refrigerants.
Table 7-5. Space-time product of the flammable region for floor-standing models by refrigerant type.
Refrigeran
t type
Density
Lower
flammability
limit (LFL)
Floor
area Height
Opening
for natural
ventilation
Charge
amount
Leak
velocity Time
STPF of
flammable
region (the fan
stopped)
kg/m3 % m2 m mm kg kg/h min m3 min
R32 2.14 14.5 14 2.5 800×3 8.9 10 53.44 0.25
R1234yf
[27 °C (dew
point)]
4.73 6.2 14 2.5 800×3 8.9 10 53.49 0.89
Indoor unit fan condition: 1. Air flow: 10.0 m3/min
2. Discharge opening area: 0.146 m2
3. Air speed: 1.13906 m/s
4. Discharge opening height: 1.5 m
7.2.2 Simulation cases for outdoor installation models
(a) Ground installation model and (b) Semi-underground installation model
Figures 7-8 and 7-9 show a comparison of simulation results for outdoor units with ground and semi-underground
installation simulation models. The leakage gas did not accumulate in the ground installation case, while it tended to
accumulate in the semi-underground installation case, for the enclosure with four walled sides. In a semi-underground
installation model, where the leakage gas accumulated around outdoor units for quite a long period, the time for
generating a flammable region was approximately 10 h when the amount of leakage was 8 kg. The STPF for the
semi-underground installation was 10000 times larger than that of the ground installation, as shown in Table 7-6.
The fan OFF
The fan ON
- 180 -
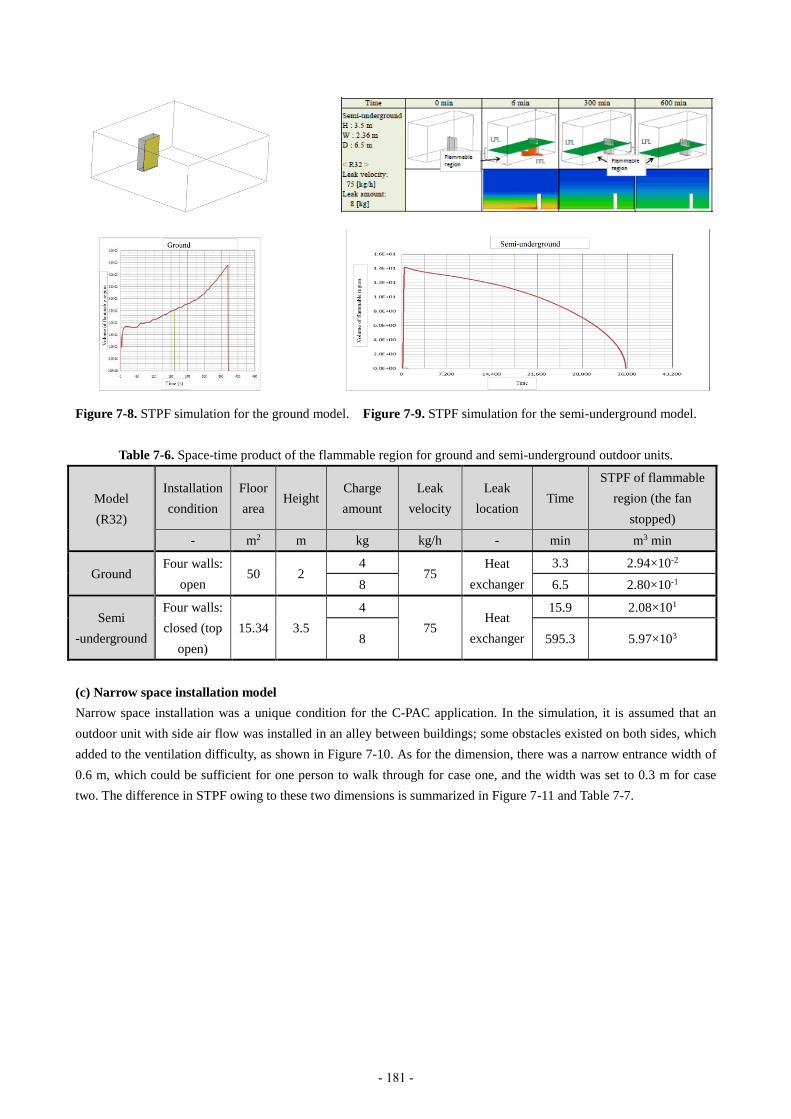
Figure 7-8. STPF simulation for the ground model. Figure 7-9. STPF simulation for the semi-underground model.
Table 7-6. Space-time product of the flammable region for ground and semi-underground outdoor units.
Model
(R32)
Installation
condition
Floor
area Height
Charge
amount
Leak
velocity
Leak
location Time
STPF of flammable
region (the fan
stopped)
- m2 m kg kg/h - min m3 min
Ground Four walls:
open 50 2
4 75
Heat
exchanger
3.3 2.94×10⁻²
8 6.5 2.80×10⁻¹
Semi
-underground
Four walls:
closed (top
open)
15.34 3.5
4
75 Heat
exchanger
15.9 2.08×101
8 595.3 5.97×10³
(c) Narrow space installation model
Narrow space installation was a unique condition for the C-PAC application. In the simulation, it is assumed that an
outdoor unit with side air flow was installed in an alley between buildings; some obstacles existed on both sides, which
added to the ventilation difficulty, as shown in Figure 7-10. As for the dimension, there was a narrow entrance width of
0.6 m, which could be sufficient for one person to walk through for case one, and the width was set to 0.3 m for case
two. The difference in STPF owing to these two dimensions is summarized in Figure 7-11 and Table 7-7.
- 181 -

Figure 7-10. Simulation model for the narrow space outdoors.
Figure 7-11. Flammable region simulation for the narrow space outdoors.
Table 7-7. Space-time product of the flammable region for the narrow space.
Model
(R32)
Distance between
buildings
Opening at
one wall
Floor
area Height
Charge
amount
Leak
velocity Time
STPF of flammable
region (the fan
stopped)
m m m2 m kg kg/h min m3 min
Narrow
space
1.5
(One side
partially open)
0.3
7.5 2
4
75
4.9 3.24×100
0.6 3.5 8.30×10⁻¹
0.3 8
8.6 9.75×100
0.6 7.0 3.75×100
- 182 -

7.3 Ignition Source Assessment
7.3.1 Setting of the ignition source
There are two causes that trigger an ignition. The first cause of trigger is the action of the ignition source, such as a
spark in a flammable region. The second cause is the contact between an open flame and a flammable region. However,
because triggering factors vary according to the ignition scenario, ignition sources were divided into two categories as
shown in Table 7-8.
According to the results of the ignition-source assessment7–3), 7–4) conducted by the Japan Society of Refrigeration and
Air Conditioning Engineers, it is determined that ignition of R32 would not be caused by sparks such as electrical
sockets, electrical switches, electrical lighters among smoking devices (oil lighters and matches were made ignition
sources), or static electricity generated by the human body. Compared to flammable Freon (R290), the occurrence of a
spark in a flammable region as an ignition source for A2L refrigerants was significantly reduced.
7.3.2 Probability of the presence of ignition sources
In the case of each installation model, the probability of the presence of ignition sources was obtained according to
Japanese market statistics7–5), 7–6). Table 7-9 presents a comparison of indoor installation models between a normal office
and a kitchen which have abundant ignition sources. The probability of open flame presence caused by appliances was
calculated by the usage rate of each appliance, and the spark probability was calculated using the probability of the
occurrence of fire accidents caused by appliances, according to the National Institute of Technology and Evaluation
(NITE) reports.
As for outdoor installation, Table 7-10 presents a comparison among ground, individual floor, semi-underground, and
narrow space installation. The probabilities of ignition source presence for all installation models in each life stage were
calculated.
Table 7-8. Ignition sources of A2L refrigerants (Y:Ignited、N:Not ignited)
Ignition source R32, R1234yf, R1234ze(E) R290(ref)
Spark
(in flammable
region)
Electric Parts
Appliance (cause of fire) Y Y
Parts in unit (5 kVA or less) N Y
Power outlet, 100 V N Y
Light switch N Y
Smoking
Equipment
Match Y Y
Oil lighter Y Y
Electric gas lighter N Y
Work Tool
Metal spark (forklift) Y Y
Electric tool N Y
Recovery machine N Y
Human Body Static electricity N Y
Open flame
(contact with
flammable
region)
Smoking
Equipment
Match Y Y
Oil or gas lighter Y Y
Combustion
Equipment
Heater Y Y
Water heater Y Y
Boiler Y Y
Cooker Y Y
Work Tool Gas burner (brazing) Y Y
- 183 -

Table 7-9. Comparison of the probability of the presence of ignition sources for an office and a kitchen. Ignition source [Units] Office Kitchen
Spark
[times/m3min]
Indoor Unit 5.7×10⁻¹⁶ 4.5×10⁻¹⁶ P=installed units×accident rate/numbers on market/space volume/(365×24×60)
Fire accident rate: 3 times/year (NITE), numbers on market: 88.4 mil. units
Applia
nces
Air Cleaner 7.0×10⁻¹⁶ - Installed: 0.2 units/room, accident rate: 3.6/year, numbers on site: 17.3 mil
Humidifier 5.6×10⁻¹⁶ - Installed: 0.09 units, accident rate: 3/year, numbers on site: 8.11 mil
Mobile 7.6×10⁻¹⁶ - Installed: 8.12, accident rate: 23/17 years (LT10year), numbers: 23.9 mil.
PC 1.2×10⁻¹⁴ - Installed: 8.12, accident rate: 174/17 years (LT10year), numbers on site: 11.8 mil
Light 1.3×10⁻¹⁵ 1.6×10⁻¹⁵ Installed: 10/15, accident rate: 227/17 years (LT10year), numbers on site: 165 mil
Tracking 6.7×10⁻¹⁶ 1.1×10⁻¹⁵ Installed: 10/15, accident rate: 202/17 years (LT10year), numbers on site: 298 mil
Refrigerator - 1.6×10⁻¹⁴ Installed: 0/3, accident rate: 267/17 years (LT10year), numbers on site: 3.88 mil
Freezer - 3.8×10⁻¹⁵ Installed: 0/2, accident rate: 16/17 years (LT10year), numbers on site: 0.658 mil
Dishwashers - 9.7×10⁻¹⁵ Installed: 0/2, accident rate: 71/17 years (LT10year), numbers on site: 1.511 mil
Phone - 2.5×10⁻¹⁶ Installed: 0/1, accident rate: 18/17 years (LT10year), numbers on site: 5.67 mil
TV - 1.1×10⁻¹⁵ Installed: 0/1, accident rate: 355/17 years (LT10year), numbers on site: 25.2 mil
Exhaust Fan - 5.5×10⁻¹⁵ Installed: 0/4, accident rate: 105/17 years (LT10year), numbers on site: 5.96 mil
Smoking Equipment
(Match/Oil lighter) 8.8×10⁻⁷ -
P=smoker presence rate in the room×0.209×17.1/space volume/(24×60) ×0.05
Smoker presence in the room: 0.1, smoking rate: 0.209 (Japanese Adult) Smoking numbers: 17.1/day/person(2013JT), use rate Match/Oil lighter: 0.05
Ignition Equipment
(Match/Oil lighter) - 1.2×10⁻⁶
P=5/space volume/(24×60)×0.05
Using rate for gas burner 5 times/day, Use rate Match/Oil lighter: 0.05
Open
flame
[-]
Comb
ustion
equipment
Water Heater 8.3×10⁻³ 6.7×10⁻² [Office]inst.: 0.1, Use rate: 2 h/day, [Kitchen]2, 60 min/day. Installed rate: 0.8
Heater - 2.7×10⁻⁵ Installed: 0.001 units, Use rate: 4 h/day, 60 day/year
Kitchen Burner - 3.1×10⁻¹ Installed: 15 units, Use rate: 0.023. Installed rate: 0.9
Gas Rice Cooker - 5.0×10⁻² Installed: 2 units, Use rate: 2 h/day. Installed rate: 0.3
Gas Oven - 5.8×10⁻⁴ Installed: 2 units, Installed rate: 2.9×10⁻⁴
Coffee Siphon - 8.7×10⁻⁴ Installed: 3 units, Installed rate: 2.9×10⁻⁴
Gas Burner - 6.9×10⁻⁴ Installed: 0.5 units, Use rate: 0.2 min/time。10 times/day
Gas Roaster - 5.8×10⁻⁴ Installed: 2 units, Installed rate: 2.9×10⁻⁴
Table 7-10. Comparison of the probability of the presence of ignition sources for outdoor installations.
Ignition Source [Units] Ground Individual
floor
Semi -Undergro
und
Narrow
Space
Spark
[times/ m3min]
Outdoor Unit 1.4×10⁻¹⁴ 9.5×10⁻¹⁴ 2.5×10⁻¹⁴ 9.1×10⁻¹⁴ P = 5.6/7,800,000/space volume/(365×24×60)
Fire accident rate: 5.6 times/year, numbers: 7.8 mil. units
Smoking
Equipment
(Match/Oil lighter)
Worker 3.6×10⁻¹⁰ 1.3×10⁻⁹ 1.7×10⁻⁹ 1.7×10⁻⁹
[Worker]
P = Smoking rate(near unit)×service rate x 0.322 ×
16/space volume/(24 × 60) × 0.05[spark] × 0.01
Smoking rate (near unit): G: 0.2, EF: 0.1, SU/NS: 0.5
Service rate: 0.1
Smoking rate for workers: 0.322(Japanese Male:JT)
Cigarette numbers (while working): 16/day (Japan)
Use rate for match/oil lighter: 0.05
Rule disregarding rate during work: 0.01 [User]
P = User presence rate (near units) × 0.209 × 17.1/space
volume/(24 × 60) × 0.05 [spark] × smoking area rate Presence rate (near units): G/SU/NS: 0.05, EF: 0.0125
Smoking rate: 0.209, Numbers: 17.1/day (Japanese
Adult), Smoking area rate: EF: 0.5, others: 0.9
User 5.6×10⁻⁸ 5.4×10⁻⁸ 1.1×10⁻⁷ 1.1×10⁻⁷
Open
flame
[-]
Smoking
Worker 6.0×10⁻⁸ 3.0×10⁻⁸ 1.5×10⁻⁷ 1.5×10⁻⁷
[Worker]
P = Worker presence rate (near units) × service rate x0.322
(smoking rate) × 16 (cigarettes) × 5/space volume (seconds/1 cigarette: open fire consistence)/(24 × 60 × 60)
× 0.01 (manual ignorance rate)
[User] P = User presence rate (near units) × 0.209 (smoking rate) ×
17.1 (cigarettes) × 5 (seconds/1 cigarette: open fire
consistence)/space volume /(24 × 60 × 60) × smoking area rate
Open flame generating time: 5 s
User 9.3×10⁻⁶ 1.3×10⁻⁶ 9.3×10⁻⁶ 9.3×10⁻⁶
Boiler 6.6×10⁻⁴ 2.2×10⁻⁴ 2.2×10⁻⁴ 2.2×10⁻⁴
P=Use rate × Installed rate
Installed rate: 0.1%
Use rate…Ground: 0.66 (24 h/day, 20 days/month)
Others: 0.22 (8 h/day, 20 days/month)
- 184 -

7.4 FTA
In each product life stage (Logistics, Installation, Usage, Service, and Disposal), the ignition probability was calculated
by an FTA composed of the assumed risk scenarios. In addition, FTAs of indoor and outdoor installations for each
life-cycle stage were composed separately. Basically, the ignition probability in the FTA was multiplied by the leak
probability, the probability of generating flammable region, and the probability of ignition sources presence. The FTA of
the Service stage was introduced as follows.
7.4.1 FTA of service life stage for outdoor installation
Figure 7-12 shows the FTA of the “Service” stage. The values on this FTA sheet were calculated based on the
following model: - Outdoor Ground installation, Max charge amount: 8 kg (R32) for 14 kW systems.
The main ignition sources during the Service stage were assumed to be gas burner (brazing), and smoking (match/oil
lighter); therefore, the FTA was obtained based on such scenarios. As gas burner (brazing) was a dominant factor in the
risk scenarios in the FTA, the risk scenarios for the gas burner were further subdivided. To illustrate, the possibility
whether a gas burner (brazing) will encounter a generated flammable region near the leakage spot was considered in the
FTA calculation. In the case where brazing encountered the refrigerant leakage spot, the leakage occurred in a burst due
to brazing; thus, the leakage speed was assumed to be 75 kg/h (burst leakage). In the case where brazing is far away
from the leakage spot, it is assumed that the leakage velocity was 1 kg/h (mild leakage), which could hardly be noticed
by the worker.
7.4.2 FTA of service life stage for indoor installation
The factors of FTA for indoor installation are the same for outdoor installation. The probabilities were set to zero,
because the following operations did not occur during the indoor installation in the Service stage:
- Refrigerant charge/recovery
- Smoking in the room in “Service stage”
Although the risk of indoor service by improper work and smoking were lower than that of outdoor service, the effect
of the STPF increased.
- 185 -

7.5 Result of Risk Assessment for Each Model
The risk assessment for C-PAC was conducted in three stages. These stages were illustrated as follows: First stage:
typical C-PAC systems were selected as simulation models; second stage: high-risk cases for systems with capacity 14
kW or less were selected as models (floor-standing indoor unit excluded); and third stage: high-risk cases for all C-PAC
systems 30 kW or less, including floor-standing indoor units, were considered as models. As for refrigerants, R32 was
analyzed first; then comparisons with R1234yf and R1234ze(E) refrigerants were further conducted. In the case where
refrigerant flammability was affected by humidity, a high dew point temperature was selected (27 °C). Risk assessments
of R1234yf and R1234ze(E) were conducted in both the second stage and third stage, which have comparatively higher
risks.
Figure 7-12: FTA of the Service stage
- 186 -

7.5.1 First stage models (typical normal C-PAC models)
Table 7-11 shows the conditions of typical C-PAC models. First, 80% of the C-PAC systems were installed with piping
length 30 m or less; thus, no additional refrigerant charge is necessary on site. The amount of refrigerant was set to the
initial charging amount in the factory. Second, a 7.1 kW cooling capacity, four-way ceiling-cassette system was selected
as the indoor unit; this type was the best seller in the Japanese market. The installation location was an office with
natural ventilation opening. A 14 kW system was selected as the outdoor unit; the charge amount per installation area
was the largest among all the models. The ground installation location was selected for the outdoor unit, and no
accumulation was considered for leakage gas as all four sides were open. The logistics condition was set to normal truck
delivery and fireproof warehouse storage. As no ignition source existed in the luggage space in a truck, truck delivery
was omitted from the first stage model. The ignition source of the warehouse used in the calculation was assumed to be
a metal spark caused by a forklift bar.
Table 7-12 summarizes the results of the risk assessment in the first stage model. The ignition probability was
calculated in each product life-cycle stage. As the ignition probability satisfied the allowable risk level, safety measures
were unnecessary.
Table 7-11. Parameters of the first stage model.
Condition Type Location Feature
Installation space Capacity
(kW)
Piping
length
(m)
Charge
amount
(kg)
Floor
area (m2)
Height
(m)
Indoors Ceiling-cass
ette Office
Opening for natural
ventilation 42.3 2.7 7.1 ≤ 30 3
Outdoors Horizontal
air flow Ground Four sides open 50 2 14.0 ≤ 30 4
Storage Bulk storage Warehouse 2300 units 1000 − 14.0 − 4
Table 7-12: Results of the risk assessment for the first stage model (R32)
Life stage
[allowable level]
Logistics
[≦ 1.3×10⁻⁸ ]
Installation
[≦ 1.3×10⁻⁸ ]
Usage
[≦ 1.3×10⁻⁹ ]
Service
[≦ 1.3×10⁻⁸ ]
Disposal
[≦ 1.3×10⁻⁸ ]
Safety measures without with without with without with without with without with
Office (Indoors) − − 6.59×10⁻¹⁰
None 3.37×10⁻¹²
None 1.19×10⁻¹⁰
None 3.12×10⁻¹²
None
Ground (Outdoors) − − 6.73×10⁻¹⁰
None 6.35×10⁻¹¹
None 2.23×10⁻¹⁰
None 6.05×10⁻¹¹
None
Warehouse 1.55×10⁻¹¹
None − − − − − − − −
7.5.2 Second stage models (high-risk C-PACs)
In the second stage are high-risk C-PAC systems with capacity 14 kW or less (floor-standing indoor unit excluded), as
summarized in Table 7-14.
First, the amount of refrigerant charge amount was selected according to the longest allowed piping length. Second,
indoor installation models were selected for two cases: a kitchen with an abundant number of proper ignition sources
and karaoke-room (tight) without natural ventilation opening. The capacity of the karaoke-room was set to 3.6 kW for
the small indoor space volume.
In the karaoke-room model, the mechanical ventilation is assumed to have malfunctioned. The leakage gas, therefore,
accumulated in the room with the possibility to reach lower flammability limit (LFL) concentration. In practice, the
leakage gas was expected to diffuse throughout the entire room, the time duration for the flammable space is short. Still,
as simulation for a tight-room has not yet been conducted, to ensure its safety, the worst-case scenario was selected in
the simulation. The leakage speed was assumed to be 2 kg/h, a mild leakage, as users will probably open the
- 187 -

karaoke-room door when rapid leak (10 kg/h) occurs. The ignition probability was calculated assuming the
karaoke-room is continuously occupied for 3 h. Figures 7-13 and 7-14 show the assumed conditions, and Table 7-13
summarizes the STPF for karaoke-room models.
Figure 7-13. Simulation model for the karaoke-room. Figure 7-14. Assumed accumulation of gas leakage for the
karaoke–room.
Table 7-13. Space-time product of the flammable region for the karaoke- room (R32).
Height of
flammable
limit
Accumulation
height
Floor
area
Height of
room
R32 charge
amount
Leak
velocity Time
STPF of flammable
region (the fan
stopped)
m m2 m kg (R32) kg/h min m3・min
h1: ULF 0.46 9.7 2.5 3 2
138 6.16×10²
h2: LFL 1.0 9.7 90 8.73×10²
UFL: upper flammability limit, LFL: lower flammability limit
Four locations for outdoor unit installation were selected, as mentioned previously. A small warehouse for the retailer
was set as an additional storage condition. In the case of the delivery of small C-PAC outdoor units (7.1 kW or less with
a single fan), a minivan delivery model was selected. The driver seats and luggage were integrated in a minivan; thus, a
higher ignition risk is considered compared to normal truck delivery. The leakage speed during transportation was
assumed to be 75 kg/h (burst leakage) due to vibration. Tables 7-15 to 7-17 summarize the results of risk assessment for
the second stage model.
In certain cases of outdoor semi-underground installation and narrow space installation, the ignition probability did
not satisfy the allowable level. The dominant risk factors were assessed, and practical safety measures were taken to
reduce the ignition probability to the allowable level. Table 7-18 summaries the dominant risk factors and
corresponding safety measures. The dominant risk factors during work were human errors, such as improper refrigerant
recovery that generated a flammable region, improper wiring of a power supply that caused a spark to occur, and the
probability of the presence of an open flame, such as a gas burner during brazing. Therefore, professional training for
the worker and a requirement to carry a leak detector during operation are considered effective safety measures.
In the usage stages, when the semi-underground condition is considered, if the refrigerant charge amount exceeds the
allowable value (depth ≥ 1.2 m, charge amount > 1/2 × LFL × A (floor area) × 1.2), then compulsive ventilation by
unit’s fan with stirring (minimum wind speed ≥ 4.0 m/s; depth ≤ 2.0 m; distance between the blower outlet and wall ≤ 3
m) or mechanical ventilation are effective to reduce the concentration of the refrigerant. As for installation in narrow
space, an opening of at least 0.6 m is necessary to reduce the concentration to lower than the allowable value.
As for refrigerants, R1234yf and R1234ze(E) have slightly higher STPF than R32 when the humidity is high, and the
- 188 -

probability of ignition increases. The same safety measures stated in Section 7.5.2 also reduce STPF for these three
refrigerants.
Table 7-14. Parameters of the second step models.
Condition Type Location Feature
Installation space Capacity
(kW)
Piping
length
(m)
Charge
amount
(kg)
Floor
area (m2)
Height
(m)
Indoors Ceiling
-cassette
Office Max charge 42.3 2.7 7.1 75 6
Kitchen Ignition source
number is large 57.2 2.7 14.0 75 8
Karaoke-room Tightness 9.7 2.4 3.6 50 3
Outdoors
Horizont
al air
flow
Ground Four sides open 50 2 14.0 75 8
Individual floor Three sides closed 3.6 4 14.0 75 8
Semi-underground Four sides closed 15.3 3.54 14.0 75 8
Narrow space One side (small) open 7.5 2 14.0 75 8
Storage Floor Small warehouse Small space 15 2.7 14.0 -* 8*
Logistics Delivery Minivan Integrated drive set
and luggage space 4.65 1.34 7.1 -* 6*
*Disposal stage: maximum amount of charge with additional charge on site
Table 7-15. Results of the risk assessment for the second step models (R32).
Life stage
[allowable
level]
Logistics
[≤ 1.3×10⁻⁸ ]
Installation
[≤ 1.3×10⁻⁸ ]
Usage
[≤ 1.3×10⁻⁹ ]
Service
[≤ 1.3×10⁻⁸ ]
Disposal
[≤ 1.3×10⁻⁸ ]
Safety
measures without with without with without with without with without with
Indo
ors
Office - - 6.63×10⁻¹⁰ None 4.20×10⁻¹² None 1.21×10⁻¹⁰ None 3.37×10⁻¹² None
Kitchen - - 6.64×10⁻¹⁰ None 1.03×10⁻¹⁰ None 2.65×10⁻¹⁰ None 2.80×10⁻¹² None
Karaoke
room - - 6.77×10⁻¹⁰ None 8.71×10⁻¹¹ None 1.04×10⁻⁹ None 2.04×10⁻¹¹ None
Ou
tdoo
rs
Ground - - 7.53×10⁻¹⁰ None 3.13×10⁻¹⁰ None 5.57×10⁻¹⁰ None 2.60×10⁻¹⁰ None
Individual
floor - - 8.49×10⁻¹⁰ None 5.79×10⁻¹⁰ None 1.47×10⁻⁹ None 6.81×10⁻¹⁰ None
Semi UG - - 3.60×10⁻⁷ 4.89x10⁻⁹ 7.14×10⁻⁷ 1.68x10⁻¹⁰ 1.12×10⁻⁷ 2.33x10⁻⁹ 8.68×10⁻⁸ 9.46×10⁻⁹
Narrow S - - 2.77×10⁻⁹ None 5.96×10⁻⁹ 5.77x10⁻¹⁰ 1.84×10⁻⁸ 4.21x10⁻¹⁰ 7.21×10⁻⁹ None
Lo
gi.
Small WH 1.26×10⁻¹¹ None - - - - - - 1.22×10⁻⁸ None
Minivan 1.73×10⁻¹⁰ None - - - - - - 6.66×10⁻¹⁰ None
- 189 -
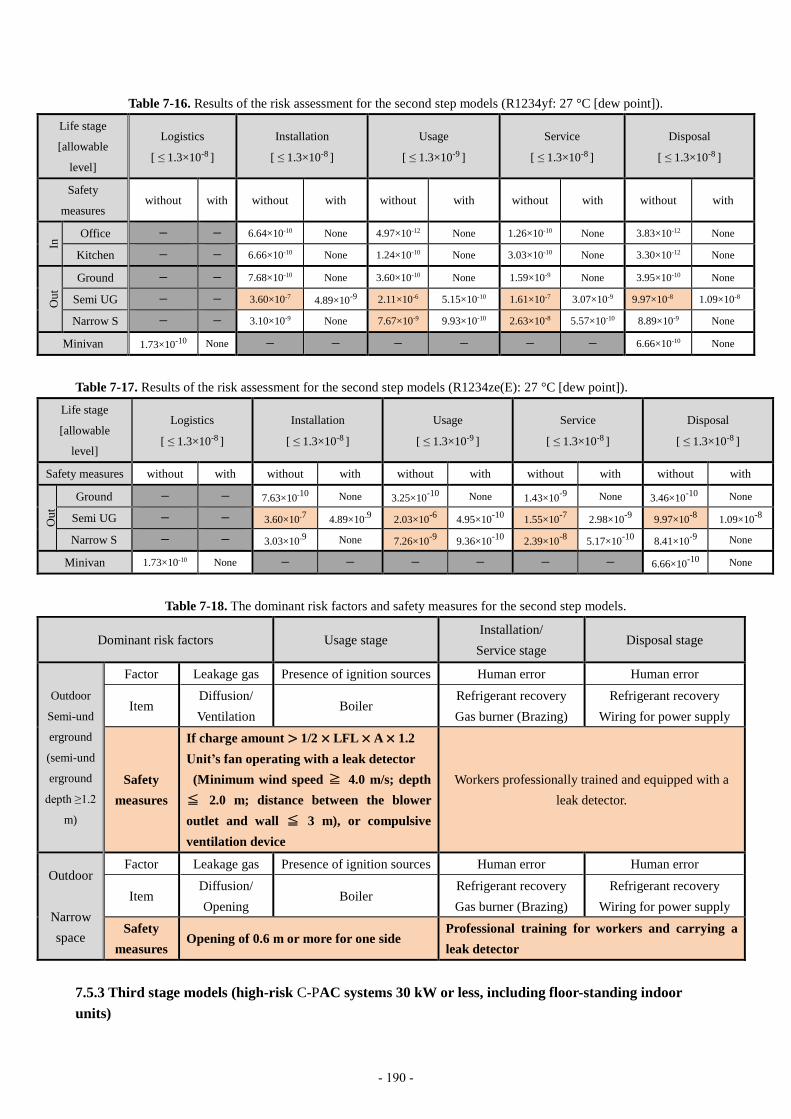
Table 7-16. Results of the risk assessment for the second step models (R1234yf: 27 °C [dew point]).
Life stage
[allowable
level]
Logistics
[ ≤ 1.3×10⁻⁸ ]
Installation
[ ≤ 1.3×10⁻⁸ ]
Usage
[ ≤ 1.3×10⁻⁹ ]
Service
[ ≤ 1.3×10⁻⁸ ]
Disposal
[ ≤ 1.3×10⁻⁸ ]
Safety
measures without with without with without with without with without with
In Office - - 6.64×10⁻¹⁰ None 4.97×10⁻¹² None 1.26×10⁻¹⁰ None 3.83×10⁻¹² None
Kitchen - - 6.66×10⁻¹⁰ None 1.24×10⁻¹⁰ None 3.03×10⁻¹⁰ None 3.30×10⁻¹² None
Ou
t
Ground - - 7.68×10⁻¹⁰ None 3.60×10⁻¹⁰ None 1.59×10⁻⁹ None 3.95×10⁻¹⁰ None
Semi UG - - 3.60×10⁻⁷ 4.89×10⁻⁹ 2.11×10⁻⁶ 5.15×10⁻¹⁰ 1.61×10⁻⁷ 3.07×10⁻⁹ 9.97×10⁻⁸ 1.09×10⁻⁸
Narrow S - - 3.10×10⁻⁹ None 7.67×10⁻⁹ 9.93×10⁻¹⁰ 2.63×10⁻⁸ 5.57×10⁻¹⁰ 8.89×10⁻⁹ None
Minivan 1.73×10⁻¹⁰ None - - - - - - 6.66×10⁻¹⁰ None
Table 7-17. Results of the risk assessment for the second step models (R1234ze(E): 27 °C [dew point]).
Life stage
[allowable
level]
Logistics
[ ≤ 1.3×10⁻⁸ ]
Installation
[ ≤ 1.3×10⁻⁸ ]
Usage
[ ≤ 1.3×10⁻⁹ ]
Service
[ ≤ 1.3×10⁻⁸ ]
Disposal
[ ≤ 1.3×10⁻⁸ ]
Safety measures without with without with without with without with without with
Ou
t
Ground - - 7.63×10⁻¹⁰ None 3.25×10
-10 None 1.43×10
-9 None 3.46×10
-10 None
Semi UG - - 3.60×10⁻⁷ 4.89×10⁻⁹ 2.03×10⁻⁶
4.95×10⁻¹⁰
1.55×10⁻⁷
2.98×10⁻⁹
9.97×10⁻⁸
1.09×10⁻⁸
Narrow S - - 3.03×10⁻⁹ None 7.26×10⁻⁹
9.36×10⁻¹⁰
2.39×10⁻⁸
5.17×10⁻¹⁰
8.41×10⁻⁹
None
Minivan 1.73×10⁻¹⁰ None - - - - - - 6.66×10⁻¹⁰
None
Table 7-18. The dominant risk factors and safety measures for the second step models.
Dominant risk factors Usage stage Installation/
Service stage Disposal stage
Outdoor
Semi-und
erground
(semi-und
erground
depth ≥1.2
m)
Factor Leakage gas Presence of ignition sources Human error Human error
Item Diffusion/
Ventilation Boiler
Refrigerant recovery
Gas burner (Brazing)
Refrigerant recovery
Wiring for power supply
Safety
measures
If charge amount > 1/2 × LFL × A × 1.2
Unit’s fan operating with a leak detector
(Minimum wind speed ≧ 4.0 m/s; depth
≦ 2.0 m; distance between the blower
outlet and wall ≦ 3 m), or compulsive
ventilation device
Workers professionally trained and equipped with a
leak detector.
Outdoor
Narrow
space
Factor Leakage gas Presence of ignition sources Human error Human error
Item Diffusion/
Opening Boiler
Refrigerant recovery
Gas burner (Brazing)
Refrigerant recovery
Wiring for power supply
Safety
measures Opening of 0.6 m or more for one side
Professional training for workers and carrying a
leak detector
7.5.3 Third stage models (high-risk C-PAC systems 30 kW or less, including floor-standing indoor
units)
- 190 -
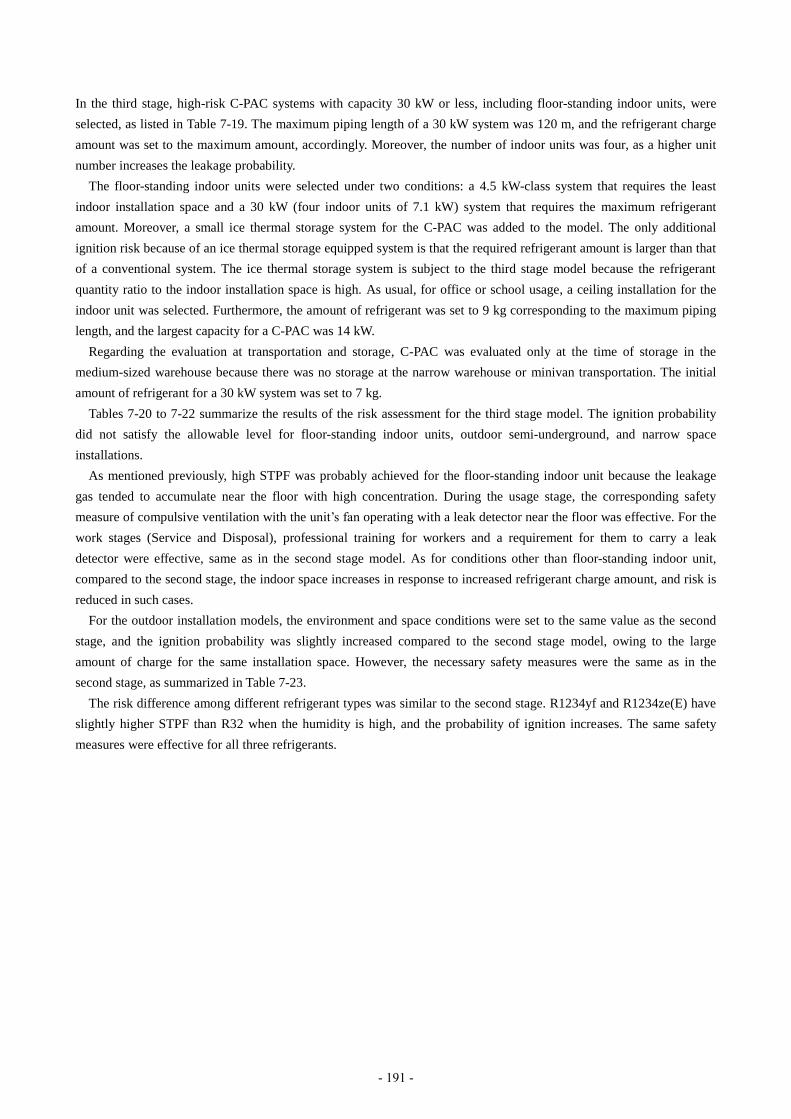
In the third stage, high-risk C-PAC systems with capacity 30 kW or less, including floor-standing indoor units, were
selected, as listed in Table 7-19. The maximum piping length of a 30 kW system was 120 m, and the refrigerant charge
amount was set to the maximum amount, accordingly. Moreover, the number of indoor units was four, as a higher unit
number increases the leakage probability.
The floor-standing indoor units were selected under two conditions: a 4.5 kW-class system that requires the least
indoor installation space and a 30 kW (four indoor units of 7.1 kW) system that requires the maximum refrigerant
amount. Moreover, a small ice thermal storage system for the C-PAC was added to the model. The only additional
ignition risk because of an ice thermal storage equipped system is that the required refrigerant amount is larger than that
of a conventional system. The ice thermal storage system is subject to the third stage model because the refrigerant
quantity ratio to the indoor installation space is high. As usual, for office or school usage, a ceiling installation for the
indoor unit was selected. Furthermore, the amount of refrigerant was set to 9 kg corresponding to the maximum piping
length, and the largest capacity for a C-PAC was 14 kW.
Regarding the evaluation at transportation and storage, C-PAC was evaluated only at the time of storage in the
medium-sized warehouse because there was no storage at the narrow warehouse or minivan transportation. The initial
amount of refrigerant for a 30 kW system was set to 7 kg.
Tables 7-20 to 7-22 summarize the results of the risk assessment for the third stage model. The ignition probability
did not satisfy the allowable level for floor-standing indoor units, outdoor semi-underground, and narrow space
installations.
As mentioned previously, high STPF was probably achieved for the floor-standing indoor unit because the leakage
gas tended to accumulate near the floor with high concentration. During the usage stage, the corresponding safety
measure of compulsive ventilation with the unit’s fan operating with a leak detector near the floor was effective. For the
work stages (Service and Disposal), professional training for workers and a requirement for them to carry a leak
detector were effective, same as in the second stage model. As for conditions other than floor-standing indoor unit,
compared to the second stage, the indoor space increases in response to increased refrigerant charge amount, and risk is
reduced in such cases.
For the outdoor installation models, the environment and space conditions were set to the same value as the second
stage, and the ignition probability was slightly increased compared to the second stage model, owing to the large
amount of charge for the same installation space. However, the necessary safety measures were the same as in the
second stage, as summarized in Table 7-23.
The risk difference among different refrigerant types was similar to the second stage. R1234yf and R1234ze(E) have
slightly higher STPF than R32 when the humidity is high, and the probability of ignition increases. The same safety
measures were effective for all three refrigerants.
- 191 -

Table 7-19. Parameters of the third stage model.
Condition Type Location Feature
Installation space Capacity
(kW)
Piping
length
(m)
Charge
amount
(kg)
Floor area
(m2)
Height
(m)
Indoors
Ceiling
Office Max charge 169 2.7 30.0 120 19
Kitchen Number of ignition
sources is large 80 2.7 30.0 120 19
Floor
Restaurant Leakage gas
accumulated 14 2.5 4.5 50 3
Factory Leakage gas
accumulated 100 3 30.0 120 19
Indoors
(Ice) Ceiling Office Charge rate 50 2.7 14.0 75 9
Outdoors Horizontal
air flow
Ground Four sides open 50 2.5 30.0 120 19
Individual
floor Three sides closed 3.6 4 30.0 120 19
Semi-UG Four sides closed 15.3 3.54 30.0 120 19
Narrow S One side (small)
open 7.5 2.5 30.0 120 19
Storage Bulk storage Warehouse 2300 units
(outdoors) 1000 - 30.0 - 7
Table 7-20. Results of the risk assessment for the third stage model (R32).
Life stage
[allowable
level]
Logistics
[≤ 1.3×10⁻⁸ ]
Installation
[≤ 1.3×10⁻⁸ ]
Usage
[≤ 1.3×10⁻⁹ ]
Service
[≤ 1.3×10⁻⁸ ]
Disposal
[≤ 1.3×10⁻⁸ ]
Safety
measures without with without with without with without with without with
Indo
ors
Office - - 6.61×10⁻¹⁰ None 7.61×10⁻¹³ None 4.82×10⁻¹² None 1.90×10⁻¹² None
Kitchen - - 6.75×10⁻¹⁰ None 7.97×10⁻¹¹ None 1.65×10⁻¹⁰ None 7.33×10⁻¹² None
Restaurant - - 1.70×10⁻⁸ 2.45×10⁻¹⁰ 9.39×10⁻⁹ 1.00x10⁻¹² 9.28×10⁻⁹ 2.81x10⁻⁹ 2.99x10⁻⁹ None
Karaoke
-room - - 2.30×10⁻⁹ None 1.05×10⁻⁹ None 3.11×10⁻⁹ None 7.04×10⁻¹⁰ None
Ice TS 6.68×10⁻¹⁰ None 3.62×10⁻¹² None 4.10×10⁻¹¹ None 2.79×10⁻¹² None
Ou
tdoo
rs
Ground - - 8.02×10⁻¹⁰ None 2.61×10⁻¹⁰ None 5.53×10⁻¹⁰ None 7.60×10⁻¹⁰ None
Individual
floor - - 1.00×10⁻⁹ None 6.15×10⁻¹⁰ None 1.48×10⁻⁹ None 2.01×10⁻⁹ None
Semi UG - - 3.67×10⁻⁷ 5.64x10⁻⁹ 4.65×10⁻⁶ 1.14×10⁻⁹ 1.18×10⁻⁷ 2.93×10⁻⁹ 1.43×10⁻⁷ 1.59×10⁻⁹
Narrow S - - 5.34×10⁻⁹ None 8.49×10⁻⁹ 3.97×10⁻¹⁰ 1.91×10⁻⁸ 4.95×10⁻¹⁰ 2.61×10⁻⁸ 2.84×10⁻⁹
Warehouse 8.30×10⁻¹¹ None - - - - - - 3.51×10⁻⁹ None
- 192 -

Table 7-21. Results of the risk assessment for the third stage model (R1234yf: 27 °C [dew point]).
Life stage
[allowable
level]
Logistics
[≤ 1.3×10⁻⁸ ]
Installation
[≤ 1.3×10⁻⁸ ]
Usage
[≤ 1.3×10⁻⁹ ]
Service
[≤ 1.3×10⁻⁸ ]
Disposal
[≤ 1.3×10⁻⁸ ]
Safety measures without with without with without with without with without with
In Office - - 6.62×10⁻¹⁰ None 8.92×10⁻¹³ None 5.61×10⁻¹² None 2.15×10⁻¹² None
Kitchen - - 6.78×10⁻¹⁰ None 9.36×10⁻¹¹ None 1.93×10⁻¹⁰ None 8.33×10⁻¹² None
Ou
t
Ground - - 8.30×10⁻¹⁰ None 4.12×10⁻¹⁰ None 1.57×10⁻⁹ None 9.77×10⁻¹⁰ None
Semi UG - - 3.67×10⁻⁷ 5.64x10⁻⁹ 9.94×10⁻⁶ 1.28×10⁻⁹ 1.71×10⁻⁷ 4.11×10⁻⁹ 3.41×10⁻⁷ 3.71×10⁻⁹
Narrow S - - 7.02×10⁻⁹ None 1.23×10⁻⁸ 1.14×10⁻⁹ 2.74×10⁻⁸ 6.72×10⁻¹⁰ 3.68×10⁻⁸ 4.01×10⁻⁹
Table 7-22. Results of the risk assessment for the third stage model (R1234ze(E): 27 °C [dew point]).
Life stage
[allowable
level]
Logistics
[≤ 1.3×10⁻⁸ ]
Installation
[≤ 1.3×10⁻⁸ ]
Usage
[≤ 1.3×10⁻⁹ ]
Service
[≤ 1.3×10⁻⁸ ]
Disposal
[≤ 1.3×10⁻⁸ ]
Safety measures without with without with without with without with without with
Ou
t
Ground - - 8.14×10⁻¹⁰ None 3.70×10⁻¹⁰ None 1.42×10⁻⁹ None 8.55×10⁻¹⁰ None
Semi UG - - 3.67×10⁻⁷ 5.64×10⁻⁹ 9.86×10⁻⁶ 1.26×10⁻⁹ 1.66×10⁻⁷ 4.06×10⁻⁹ 3.29×10⁻⁷ 3.58×10⁻⁹
Narrow S - - 6.51×10⁻⁹ None 1.09×10⁻⁸ 1.02×10⁻⁹ 2.45×10⁻⁸ 6.09×10⁻¹⁰ 3.34×10⁻⁸ 3.64×10⁻⁹
- 193 -
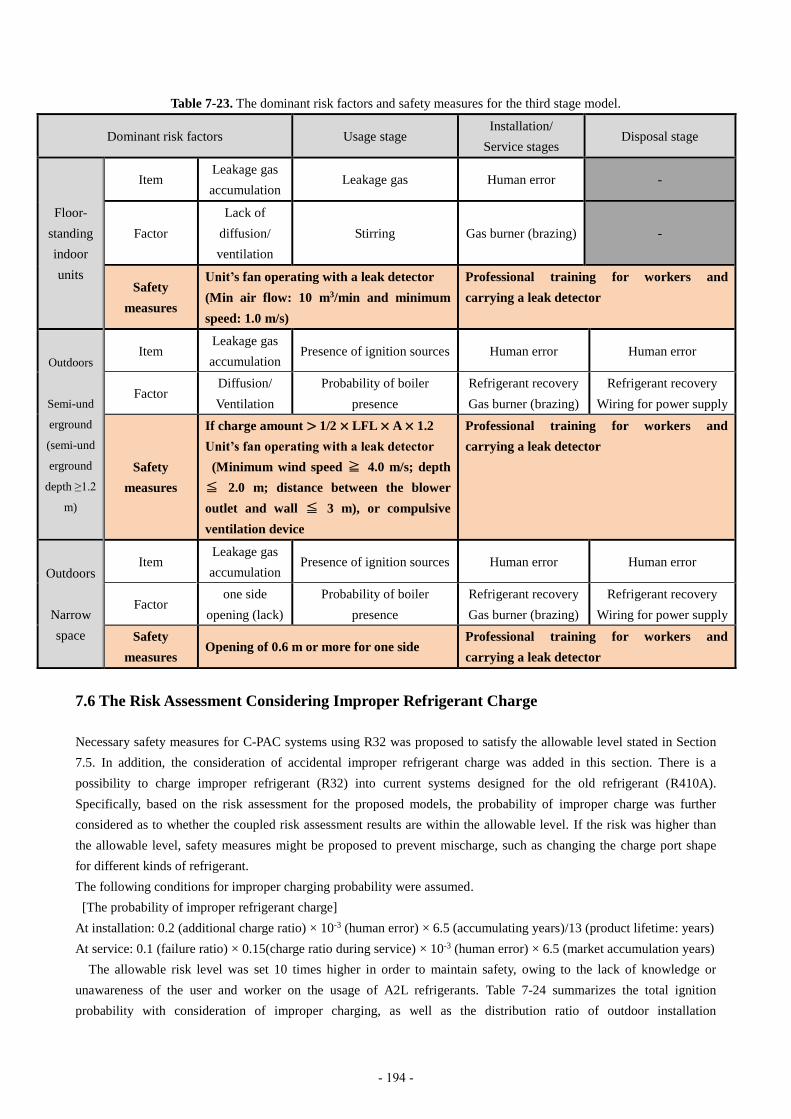
Table 7-23. The dominant risk factors and safety measures for the third stage model.
Dominant risk factors Usage stage Installation/
Service stages Disposal stage
Floor-
standing
indoor
units
Item Leakage gas
accumulation Leakage gas Human error -
Factor
Lack of
diffusion/
ventilation
Stirring Gas burner (brazing) -
Safety
measures
Unit’s fan operating with a leak detector
(Min air flow: 10 m3/min and minimum
speed: 1.0 m/s)
Professional training for workers and
carrying a leak detector
Outdoors
Semi-und
erground
(semi-und
erground
depth ≥1.2
m)
Item Leakage gas
accumulation Presence of ignition sources Human error Human error
Factor Diffusion/
Ventilation
Probability of boiler
presence
Refrigerant recovery
Gas burner (brazing)
Refrigerant recovery
Wiring for power supply
Safety
measures
If charge amount > 1/2 × LFL × A × 1.2
Unit’s fan operating with a leak detector
(Minimum wind speed ≧ 4.0 m/s; depth
≦ 2.0 m; distance between the blower
outlet and wall ≦ 3 m), or compulsive
ventilation device
Professional training for workers and
carrying a leak detector
Outdoors
Narrow
space
Item Leakage gas
accumulation Presence of ignition sources Human error Human error
Factor one side
opening (lack)
Probability of boiler
presence
Refrigerant recovery
Gas burner (brazing)
Refrigerant recovery
Wiring for power supply
Safety
measures Opening of 0.6 m or more for one side
Professional training for workers and
carrying a leak detector
7.6 The Risk Assessment Considering Improper Refrigerant Charge
Necessary safety measures for C-PAC systems using R32 was proposed to satisfy the allowable level stated in Section
7.5. In addition, the consideration of accidental improper refrigerant charge was added in this section. There is a
possibility to charge improper refrigerant (R32) into current systems designed for the old refrigerant (R410A).
Specifically, based on the risk assessment for the proposed models, the probability of improper charge was further
considered as to whether the coupled risk assessment results are within the allowable level. If the risk was higher than
the allowable level, safety measures might be proposed to prevent mischarge, such as changing the charge port shape
for different kinds of refrigerant.
The following conditions for improper charging probability were assumed.
[The probability of improper refrigerant charge]
At installation: 0.2 (additional charge ratio) × 10-3 (human error) × 6.5 (accumulating years)/13 (product lifetime: years)
At service: 0.1 (failure ratio) × 0.15(charge ratio during service) × 10-3 (human error) × 6.5 (market accumulation years)
The allowable risk level was set 10 times higher in order to maintain safety, owing to the lack of knowledge or
unawareness of the user and worker on the usage of A2L refrigerants. Table 7-24 summarizes the total ignition
probability with consideration of improper charging, as well as the distribution ratio of outdoor installation
- 194 -
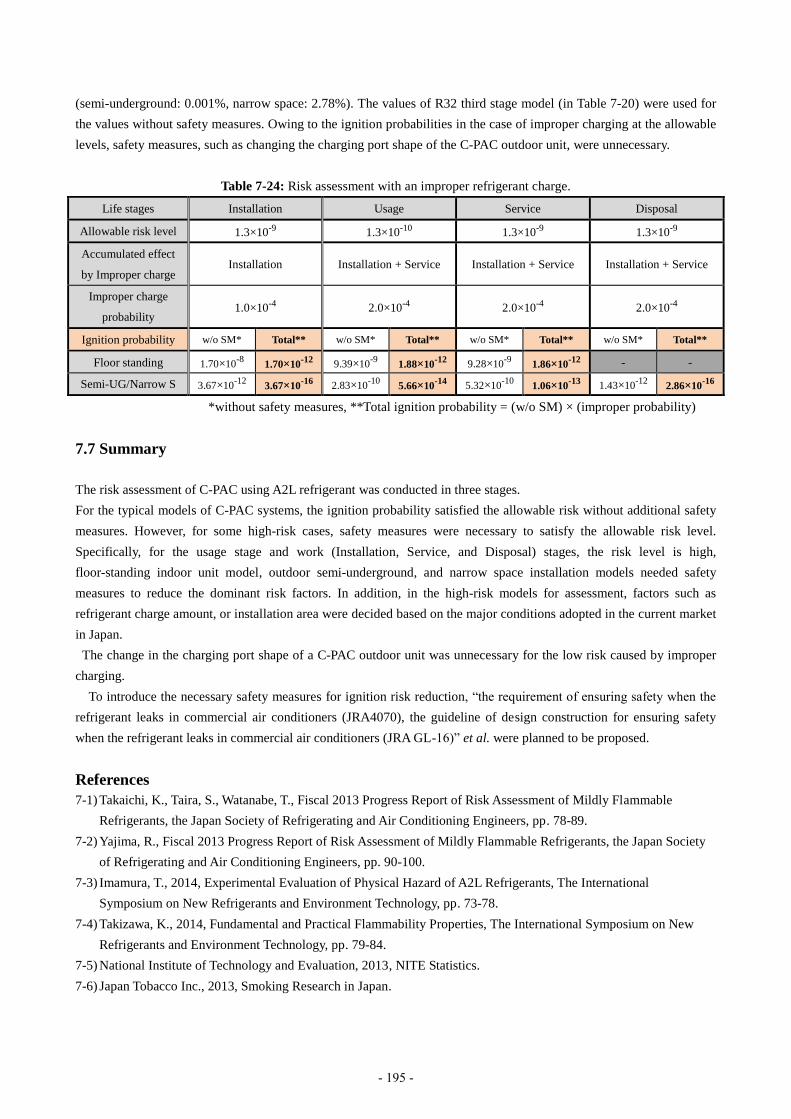
(semi-underground: 0.001%, narrow space: 2.78%). The values of R32 third stage model (in Table 7-20) were used for
the values without safety measures. Owing to the ignition probabilities in the case of improper charging at the allowable
levels, safety measures, such as changing the charging port shape of the C-PAC outdoor unit, were unnecessary.
Table 7-24: Risk assessment with an improper refrigerant charge.
Life stages Installation Usage Service Disposal
Allowable risk level 1.3×10⁻⁹ 1.3×10⁻¹⁰ 1.3×10⁻⁹ 1.3×10⁻⁹
Accumulated effect
by Improper charge Installation Installation + Service Installation + Service Installation + Service
Improper charge
probability 1.0×10⁻⁴ 2.0×10⁻⁴ 2.0×10⁻⁴ 2.0×10⁻⁴
Ignition probability w/o SM* Total** w/o SM* Total** w/o SM* Total** w/o SM* Total**
Floor standing 1.70×10⁻⁸
1.70×10⁻¹²
9.39×10⁻⁹
1.88×10⁻¹²
9.28×10⁻⁹
1.86×10⁻¹²
- -
Semi-UG/Narrow S 3.67×10⁻¹²
3.67×10⁻¹⁶
2.83×10⁻¹⁰
5.66×10⁻¹⁴
5.32×10⁻¹⁰
1.06×10⁻¹³
1.43×10⁻¹²
2.86×10⁻¹⁶
*without safety measures, **Total ignition probability = (w/o SM) × (improper probability)
7.7 Summary
The risk assessment of C-PAC using A2L refrigerant was conducted in three stages.
For the typical models of C-PAC systems, the ignition probability satisfied the allowable risk without additional safety
measures. However, for some high-risk cases, safety measures were necessary to satisfy the allowable risk level.
Specifically, for the usage stage and work (Installation, Service, and Disposal) stages, the risk level is high,
floor-standing indoor unit model, outdoor semi-underground, and narrow space installation models needed safety
measures to reduce the dominant risk factors. In addition, in the high-risk models for assessment, factors such as
refrigerant charge amount, or installation area were decided based on the major conditions adopted in the current market
in Japan.
The change in the charging port shape of a C-PAC outdoor unit was unnecessary for the low risk caused by improper
charging.
To introduce the necessary safety measures for ignition risk reduction, “the requirement of ensuring safety when the
refrigerant leaks in commercial air conditioners (JRA4070), the guideline of design construction for ensuring safety
when the refrigerant leaks in commercial air conditioners (JRA GL-16)” et al. were planned to be proposed.
References
7-1) Takaichi, K., Taira, S., Watanabe, T., Fiscal 2013 Progress Report of Risk Assessment of Mildly Flammable
Refrigerants, the Japan Society of Refrigerating and Air Conditioning Engineers, pp. 78-89.
7-2) Yajima, R., Fiscal 2013 Progress Report of Risk Assessment of Mildly Flammable Refrigerants, the Japan Society
of Refrigerating and Air Conditioning Engineers, pp. 90-100.
7-3) Imamura, T., 2014, Experimental Evaluation of Physical Hazard of A2L Refrigerants, The International
Symposium on New Refrigerants and Environment Technology, pp. 73-78.
7-4) Takizawa, K., 2014, Fundamental and Practical Flammability Properties, The International Symposium on New
Refrigerants and Environment Technology, pp. 79-84.
7-5) National Institute of Technology and Evaluation, 2013, NITE Statistics.
7-6) Japan Tobacco Inc., 2013, Smoking Research in Japan.
- 195 -
8. RISK ASSESSMENT OF VRF SYSTEMS
8.1 Introduction
According to the IPCC Fourth Assessment Report, R410A refrigerant, which is currently used in variable refrigerant flow
(VRF) systems, has a high global warming potential (GWP) estimated as 2090. Hence, developing alternatives that have lesser
global warming potential is necessary. The alternatives, namely, R32, R1234zf, and R1234ze, have low GWP; however, unlike
R410A, which is nonflammable, these gases have mild flammability. Thus, these refrigerants should be examined for deter-
mining whether they can be used in consumer air-conditioning systems and for planning safety measures. For the risk assess-
ment of the flammable refrigerants for residential air-conditioning, the Japanese Refrigeration and Air Conditioning Industry
Association (JRAIA) examined R290 (propane)8-1) and Goetzler et al. examined R32 and R32/R134a 8-2). For example, to
estimate the probability of a fire accident once in a year per unit (hereinafter, referred as ignition probability), it is necessary
to know the probability of occurrence of refrigerant leak because of which the amount of gas in the room reaches a flammable
concentration. In the usage situation, the leakage of refrigerant usually occurs very slowly, taking several days or months until
the entire refrigerant leaks out, and hence, the leakage does not create a flammable space in general. A flammable space is
created when leakage occurs rapidly such that the rate of flow of the leaked refrigerant exceeds, the diffusion velocity and
hence, the so-called rapid leakage accounts for a tiny portion of a whole incident, and is less likely. The probability of total
leakage incidents, including slow leakage, can be known from service data. However, determining the number of incidents
associated only with rapid leakage is difficult. JRAIA8-1) defined the leakage accompanying soldering as rapid leakage, and
Goetzler et al.8-2) assumed that the rapid leakage counts for 5% of all incidents of leakage. The ratio of rapid leakage incidents
to the total leakage incidents has a great influence on the rapid leakage probability and the ignition probability, and conse-
quently the safety evaluation result will be influenced.
To determine the probability of rapid leakage, we collected the product samples for which leakage in the market was ob-
served, and measured the corresponding leakage rate of the refrigerants. Moreover, the probability of rapid leakage for VRF
air conditioners was estimated by using the number of comments of customer or maintenance technicians that show the oc-
currence of rapid leakage, included in repair millions records.
Fire accidents occur when a flammable space encounters an ignition source in time and space. In the JRAIA report8-1), the
ignition source is primarily a smoking device, and the ignition probability is evaluated by finding the number of ignition
actions for a smoking device within a flammable space. Goetzler et al. reported that a burner or smoking device is the primary
source leading to ignition, and the ignition probability was estimated by using the number of cases in which the leaked gas
cloud with flammable concentration encounters an open flame. In this work, ignition probability is evaluated from both these
aspects. We used the test results of Takizawa8-3) and Imamura8-4) for ignition sources susceptible to igniting mildly flammable
refrigerants.
The JRAIA report8-1) focused on residential wall-mounted air conditioners installed in living spaces of 4.5 tatami mat rooms,
and Goetzler et al.8-2) focused on cases of the installation of American style unitary indoor air conditioners in basements, attics,
and closets. In the present work, VRF systems were assumed installed in a variety of indoor and outdoor spaces. After ex-
tracting the high-risk installation cases, we conducted a concentration analysis for each leakage case and investigated the
occurrence of flammable spaces. The analyses were carried out by Okamoto8-5) and each company in JRAIA. With regard to
the probability that an ignition source encounters a flammable space, JRAIA estimated the ignition probability using various
data for each case and reasonable assumptions, and proposed safety countermeasures to lower the possibility to a value below
- 196 -

the allowance. Risk assessment was conducted consider-
ing R32 as the representative refrigerant, and a risk assess-
ment was performed for R1234yf on the basis of these re-
sults. The risk associated with R1234ze is considered
smaller than R1234yf, and the same safety measures as
R1234yf were adopted .
8.2 Characteristics of VRF Systems Using
Mildly flammable Refrigerants
Table 8-1 lists the features of a VRF system. The most dis-
tinctive feature of the VRF system is that a large amount
of refrigerant is charged, and the entire amount of refrig-
erant can be discharged from a single indoor unit in the
event of a leak. Because a refrigerant piping system typi-
cally has numerous connection points, thorough leakage
tests were conducted under positive and negative pressure.
In addition, the operation error was considered less likely
because generally only specialists or highly skilled tech-
nicians are involved in installing the systems.
Table 8-2 lists the burning characteristics of the mildly
flammable refrigerant, R32, and the highly flammable re-
frigerant, R290 (propane). The lower flammability limit
of R32 is greater than that of R290, and hence, in the case of R32, a higher amount of refrigerant should leak for a flammable
space to be created. Further, because the minimum ignition energy (MIE) value of R32 is higher than that of R290, the same
degree of electrical spark that can ignite R290 does not ignite R32.
The likelihood of accumulation of refrigerant depending on the configuration and installation location of indoor units was
considered; the ignition source and the ventilation conditions were investigated depending on the type of business for instal-
lation.
We also investigated the risk of an ignition incident caused by the inadvertent charging of R32 into a R410A device. When
this risk exceeds the allowable level, it becomes necessary to change the service ports only dedicated for R32 and R410A to
prevent such user errors.
8.3 Preparations for Risk Assessment
8.3.1 Setting Allowable Levels
The ignition probability for an allowable risk typically depends on the degree of severity. However, because the assessment
of degree of danger was incomplete at the time, we set allowable levels under the assumption that all fire accidents are serious
and fatal. An allowable level is considered as the occurrence of a serious accident once every 100 years. With approximately
10 million indoor units in stock in the market, the allowable ignition probability at time of indoor use becomes 10-9. The
Table 8-2 Burning characteristics of R32 and R290
Burning characteristics R32 R290
Burning velocity *) [cm/s] 6.7 46
Lower flammable limit *) [kg/m3] 0.307 0.038
Minimum ignition energy **) [mJ] 29 0.35
*) ISO817 2014 : Refrigerants – Designation and safety classification
**) Takizawa, JSRAE, Progress report, P22, 2014
Table 8-1 Features of VRF systems and A2L refrigerants
Comparison of features of a VRF system and single-split system
Risk
A large amount of refrigerant charge can completely leak
into one room
Numerous joints connecting the refrigerant circuit or parts of valves, vessels and sensors
Strict check of refrigerant sealing and leaks
Highly skilled personnel for installation, repair, and
maintenance
A variety of system configuration – mode-free type, water-
cooled or ice-storage type, etc. Risk should be specified
Wide range capacity of outdoor and indoor units
Comparison of features of A2L with A2, A3 refrigerants Risk
Smaller flammable cloud because of larger LFL
Type of ignition source is limited because of larger MIE
up
down
down
- 197 -
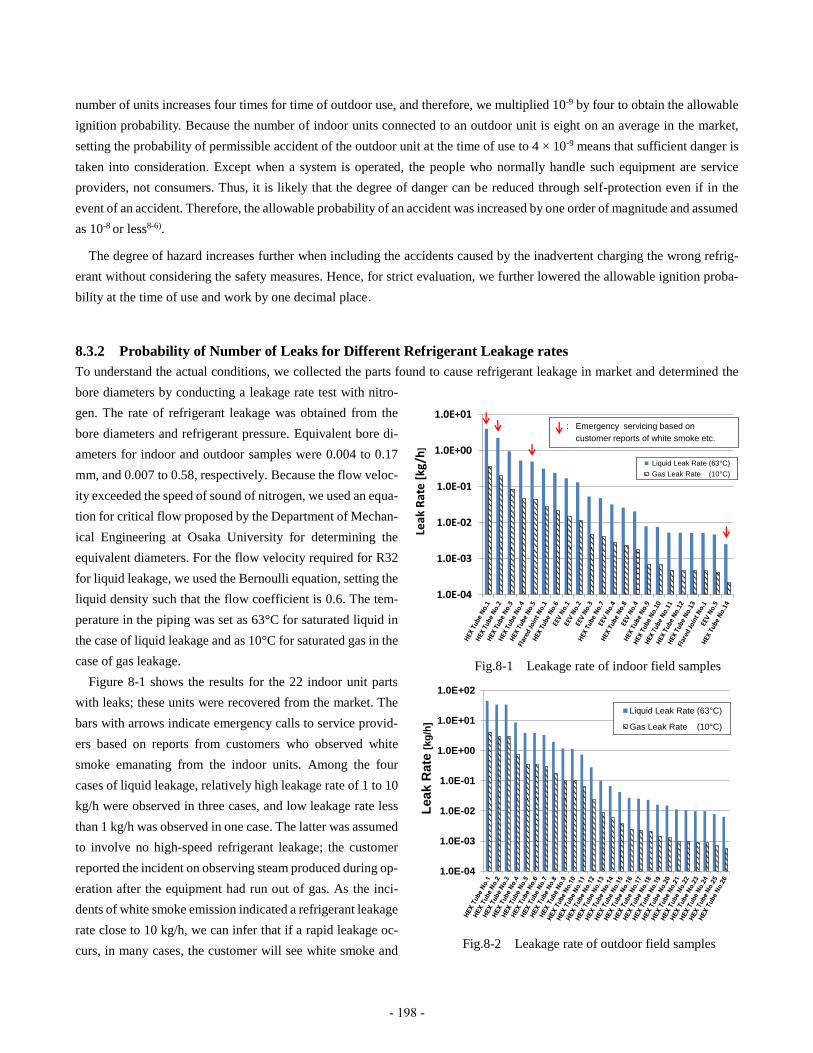
number of units increases four times for time of outdoor use, and therefore, we multiplied 10-9 by four to obtain the allowable
ignition probability. Because the number of indoor units connected to an outdoor unit is eight on an average in the market,
setting the probability of permissible accident of the outdoor unit at the time of use to 4 × 10⁻⁹ means that sufficient danger is
taken into consideration. Except when a system is operated, the people who normally handle such equipment are service
providers, not consumers. Thus, it is likely that the degree of danger can be reduced through self-protection even if in the
event of an accident. Therefore, the allowable probability of an accident was increased by one order of magnitude and assumed
as 10-8 or less8-6).
The degree of hazard increases further when including the accidents caused by the inadvertent charging the wrong refrig-
erant without considering the safety measures. Hence, for strict evaluation, we further lowered the allowable ignition proba-
bility at the time of use and work by one decimal place.
8.3.2 Probability of Number of Leaks for Different Refrigerant Leakage rates
To understand the actual conditions, we collected the parts found to cause refrigerant leakage in market and determined the
bore diameters by conducting a leakage rate test with nitro-
gen. The rate of refrigerant leakage was obtained from the
bore diameters and refrigerant pressure. Equivalent bore di-
ameters for indoor and outdoor samples were 0.004 to 0.17
mm, and 0.007 to 0.58, respectively. Because the flow veloc-
ity exceeded the speed of sound of nitrogen, we used an equa-
tion for critical flow proposed by the Department of Mechan-
ical Engineering at Osaka University for determining the
equivalent diameters. For the flow velocity required for R32
for liquid leakage, we used the Bernoulli equation, setting the
liquid density such that the flow coefficient is 0.6. The tem-
perature in the piping was set as 63°C for saturated liquid in
the case of liquid leakage and as 10°C for saturated gas in the
case of gas leakage.
Figure 8-1 shows the results for the 22 indoor unit parts
with leaks; these units were recovered from the market. The
bars with arrows indicate emergency calls to service provid-
ers based on reports from customers who observed white
smoke emanating from the indoor units. Among the four
cases of liquid leakage, relatively high leakage rate of 1 to 10
kg/h were observed in three cases, and low leakage rate less
than 1 kg/h was observed in one case. The latter was assumed
to involve no high-speed refrigerant leakage; the customer
reported the incident on observing steam produced during op-
eration after the equipment had run out of gas. As the inci-
dents of white smoke emission indicated a refrigerant leakage
rate close to 10 kg/h, we can infer that if a rapid leakage oc-
curs, in many cases, the customer will see white smoke and
1.0E-04
1.0E-03
1.0E-02
1.0E-01
1.0E+00
1.0E+01Le
ak R
ate
[kg
/h]
Liquid Leak Rate (63°C)
Gas Leak Rate (10°C)
: Emergency servicing based on
customer reports of white smoke etc.
1.0E-04
1.0E-03
1.0E-02
1.0E-01
1.0E+00
1.0E+01
1.0E+02
Le
ak R
ate
[kg
/h]
Liquid Leak Rate (63°C)
Gas Leak Rate (10°C)
Fig.8-2 Leakage rate of outdoor field samples
Fig.8-1 Leakage rate of indoor field samples
- 198 -

infer abnormal operation. Using a similar method, we
measured 26 leakage samples from outdoor units. Figure
8-2 shows the results. Compared to conditions correspond-
ing to the indoor units, the outdoor units had higher leak-
age velocities; in three cases, the leakage rate exceeded 10
kg/h.
In the International Organization of Standardization
(ISO51498) Part1A5 Chapter), the refrigerant leakage rate
of indoor VRF systems is set as 10 kg/h under the assump-
tion that as no vibration source such as the compressor.
Test results for the parts of indoor units agree with this
value.
Owing to the low number of samples available, it is dif-
ficult to obtain leakage probability at different velocities on the scale of parts per million (ppm). Therefore, based on all cases
of leakage handled by service providers over one year, we estimated the number of leaks in which customers reported white
smoke or abnormal smell and the number of cases in which service providers diagnosed leaks as originating from a broken
pipe or hole in the heat exchanger or pipe. Admitting the possibility that not all leakage cases were considered, we carefully
calculated the number of rapid leaks by multiplying the number of reported leakage cases by 10 for indoor units and by 100
for outdoor units for which customers do not easily notice abnormalities. Because no burst leakages were reported, the number
of burst leakages for indoor units was assumed as zero. The remaining leakages were determined to be slow leakages of 1
kg/h or less. In the case of outdoor units, as samples exceeding 10 kg/h of leakage were reported, we calculated that 1/10 of
the rapid leakage cases were burst leaks. Table 8-3 presents the probabilities of leakage classified by leakage rate.
8.3.3 Probability of Human Error
Refrigerant leakage during installation, repair, and disposal oc-
cur because of human error, such as incorrect valve operation by
the service technician. Data for the probability of human error
were obtained from the works of Hashimoto8-9) and Suzuki et al.
8-10) Operation was assumed to proceed under normal, relaxed
conditions. Because the technicians and service providers who
work on VRF systems have a relatively high level of technical
expertise, they are less likely to commit operational errors. Con-
sequently, the probability of human error during works for VRF
systems was set as 10-4.
8.3.4 Ignition Source Assessment
Table 8-4 presents the ignition sources considered in the current
assessment. According to the results of Takizawa from the Risk
Assessment Research Committee and Imamura and co-workers
(2013), the mildly flammable refrigerants are not ignited by the
【Method】Leak Probability : Weighted mean value of probability for each JRAIA manufacturerNumber of rapid leaks = Nrp×10 (indoor) or 100 (outdoor)Number of burst leaks = Number of rapid leak × 0.1 (outdoor) , 0 (indoor)
Number of slow leaks = Total - (rapid+burst)
Nrp : Number of leaks as reported by customer or service technician indicating rapid leak, white smoke, smell (customer comment), or breakage or hole in pipe (service technician comment).
Probability of leak classified in leak rate
Number of leaks reports indicating rapid leaks, 2010, Manufacturer B
White Smoke Smelled Burning Holes in Pipe Nrp
Indoor Unit 0 1 0 1
Outdoor Unit 1 3 3 7
Slow Leak Rapid Leak Burst Leak~1 [kg/h] ~10 [kg/h] ~75 [kg/h]
Distribution Ratio [-] 1 0.986 0.014 0Probability of Leak [ppm] 350 345 5 0Distribution Ratio [-] 1 0.806 0.176 0.018Probability of Leak [ppm] 7600 6126 1338 137
Indoor Unit
Outdoor Unit
Total
Table 8-3 Probability of leakage classified by leakage rate
Ignition Source R32 R290(ref.)
Spark
(inflammable
cloud)
Electric Parts
Appliance(cause of fire)
Parts in Unit Power Outlet, 100VLight Switch
YNNN
YYYY
SmokingEquipment
MatchOil LighterElectric Gas Lighter
YY : being evaluated
N
YYY
Work ToolMetal Spark (forklift)
Electric ToolRecovery Machine
YNN
YYY
Body Static Electricity N Y
Open Flame
(contactwith
flammable cloud)
SmokingEquipment
MatchOil or Gas Lighter
YY
YY
CombustionEquipment
HeaterWater HeaterBoilerCooker
YYYY
YYYY
Work Tool Gas Burner Y Y
Y:Ignited N:not ignited
Table 8-4 Ignition sources
- 199 -

electrical outlets commonly found indoors, electrical light switches, sparks from the electrical lighters of smokers, or static
electricity generated by the human body. Oil lighters and matches may be ignition sources and are believed to form 5% of all
smoking tools. Propane is ignited by all of these ignition sources 8-1).
8.3.5 Calculation Method for Ignition Probability
A fire occurs when a huge amount of refrigerant leaks, forming a
flammable space, and an ignition source that can ignite exists in
the flammable space. Table 8-5 presents the probability of a fire
accident.
PF: Ignition probability [time/(yearunit)]
PL: Probability of leakage [time/(yearunit)]
PT: Probability of encounter between the ignition source and flammable gas in
time [-]
PS: Probability of encounter between the ignition source and flammable gas in
space [-]
N: Number of operations of ignition source [time/min]
V: Volume [m3]
T: Flammable space duration per leakage or operation duration per ignition
source operation [min/time]
M: Time multiplied by the volume of flammable space [minm3/time]
For example, in case of an electric spark, fire incidents are
triggered by the activation of the ignition source. The equa-
tion of ignition probability is shown in the upper row in Table
8-5. When the ignition occurs because the flammable gas en-
counters a burning candle, the trigger is the generation of the
flammable space. The corresponding formula is shown in the
middle row in Table 8-5. If the flammable space is formed
first, the lower calculation formula is adopted, and if the op-
eration of the ignition source occurs first, the upper calcula-
tion formula is used. The ignition probability attributed to one
ignition source is the sum of the two cases. In order to calcu-
late the risk of each life stage, the ignition probability is cal-
culated after the dominant trigger is determined.
8.3.6 Calculation Method for Ignition Probability
by Erroneous Refrigerant Charging
Table 8-5 Calculation of ignition probability
Ignition
Fig. 8-3 Calculation of ignition probability
caused by charging R32 into R410A units
< Basic Idea >The fire probability at each life stage for the case without measures is
multiplied by E.
< Equation for probability of charge of R32 to R410A units > Charging of R32 into R410A units is caused by human error during installation
or repair of R410A units. The number of R410A units with R32 becomes
maximum after half the service life duration since the start of R32 sales.
E = Ei+Er = 5.0 × 10⁻⁵ + 1.1 × 10-5 = 6.1 × 10⁻⁵ [-]
NotationEi = Installation 1time/(15 years × unit)×7.5 years × Eh
Er = Repair 0.1time/(year・unit) × refrigerant charge 0.15(time/time)× 7.5year × Eh
E : Probability of charge of R32 into R410A units [-]
Ei : Probability of charge of R32 into R410A units during installation [-]
Er : Probability of charge of R32 into R410A units during repair [-]
Eh : Probability of human error by workers = 1x10⁻⁴ [unit/time]
L : Life year =15 [year]
installation repair
R32 units
1’st year2’nd year1’st year 1’st year
R410A units
2’nd year 2’nd year
installation repair
R410A units with R32
All stock in market
- 200 -

In order to obtain data to determine whether the specifications of a service port for mildly flammable refrigerants should be
separate from that for the conventional refrigerants, we determined the ignition probability for erroneous charging of R32
refrigerant into R410A equipment for the same specifications.Figure 8-3 shows the calculation method of this ignition
probability.
8.3.7 Installing an Indoor Model
The probability was examined based on a concentration
analysis for the refrigerant leakage forming an indoor flam-
mable space.
8.3.7.1 Small conference room in an office
A model of an office was established, assuming a standard
VRF system. The 56 kW model (20 hp) was selected to rep-
resent the capacity of an outdoor unit based on a survey of
the capacity distribution of units for office rooms. For an in-
door unit, a 7.1 kW four-way ceiling cassette model (2.8 hp)
was selected, with a configuration of eight indoor units con-
nected to each outdoor unit for an air conditioning load of
170 W/m2 for an established floor area of 42 m2. The model
is shown in Fig. 8-4. Risk assessment was performed for a
small conference room (6.5 × 6.5 m) in which one indoor
unit is operated. The number of people in the room was assumed as 8.4, with each person exclusively occupying a floor area
of 5 m2. Ventilation flow was set as 169 m3/h 8-11) , 8-12), and ventilation flow per person was 20 m3/h. Wind velocity was set as
2.0 m/s with air inlets and outlets of dimensions 0.2 × 0.2 m8-13). The configuration of the door was as follows: width, 1500
mm; height of the door undercut, which is the gap between the bottom of the door and the ground, 10 mm8-14).
The difference of refrigerant charge amount for each refrigerants was estimated according to the difference of the liquid
density of each refrigerants. The calculation was performed by multiplying this value with a coefficient of 0.85 for R32 and
0.95 for R1234yf. Thus, the refrigerant charge amount for a typical installation was calculated as 26.3 kg, and the maximum
value was 88.l kg. A concentration analysis was performed for these two cases.
A simulation was performed under the conditions listed in Table 8-6 to confirm the impact of each condition, such as the
A-A’断面図
B-B’断面図
床上
~天
井2
,70
0
1,000
給気口排気口
室内機
1,000
床上
~天
井2
,70
0
1,000
給気口排気口
室内機
1,000
平面図
床上
~天
井2
,70
0
ドア
1,500
アンダーカット(下部隙間)1,500×10
床上
~天
井2
,70
0
ドア
1,500
アンダーカット(下部隙間)1,500×10
1,0
00
1,0
006
,50
06
,50
0
3,250
3,2
50
1,000
室内機①
ドア(常時閉 ,アンダーカットあり)
A A´
B B´
3,250
6,500 6,500 6,500 6,500
13,000
13
,00
0
1,500
1,000
給気口(200×200)
排気口(200×200)
間仕切り
シミュレーション部分 壁200mm間仕切60mm
事務室1 事務室2
②
③
④
⑤ ⑥
⑦ ⑧
出入口(常時閉,アンダーカットなし)
3,2
50
1,0
00
1,0
006
,50
06
,50
0
3,250
3,2
50
1,000
室内機①
ドア(常時閉 ,アンダーカットあり)
A A´
B B´
3,250
6,500 6,500 6,500 6,500
13,000
13
,00
0
1,500
1,000
給気口(200×200)
排気口(200×200)
間仕切り
シミュレーション部分 壁200mm間仕切60mm
事務室1 事務室2
②
③
④
⑤ ⑥
⑦ ⑧
出入口(常時閉,アンダーカットなし)
3,2
50
漏洩機
13,000
Door closed with undercut
(1500*10) Plan view
Door
Sectional view
Cei
lin
g H
eigh
t
Fig. 8-4 Meeting room in offices (Ceiling cassette type)
Table 8-6 Conditions and results of CFD simulations for a small office room
[m3・min]
x
x
x
x
x
x
x
x
x
x
3
Region
- 201 -
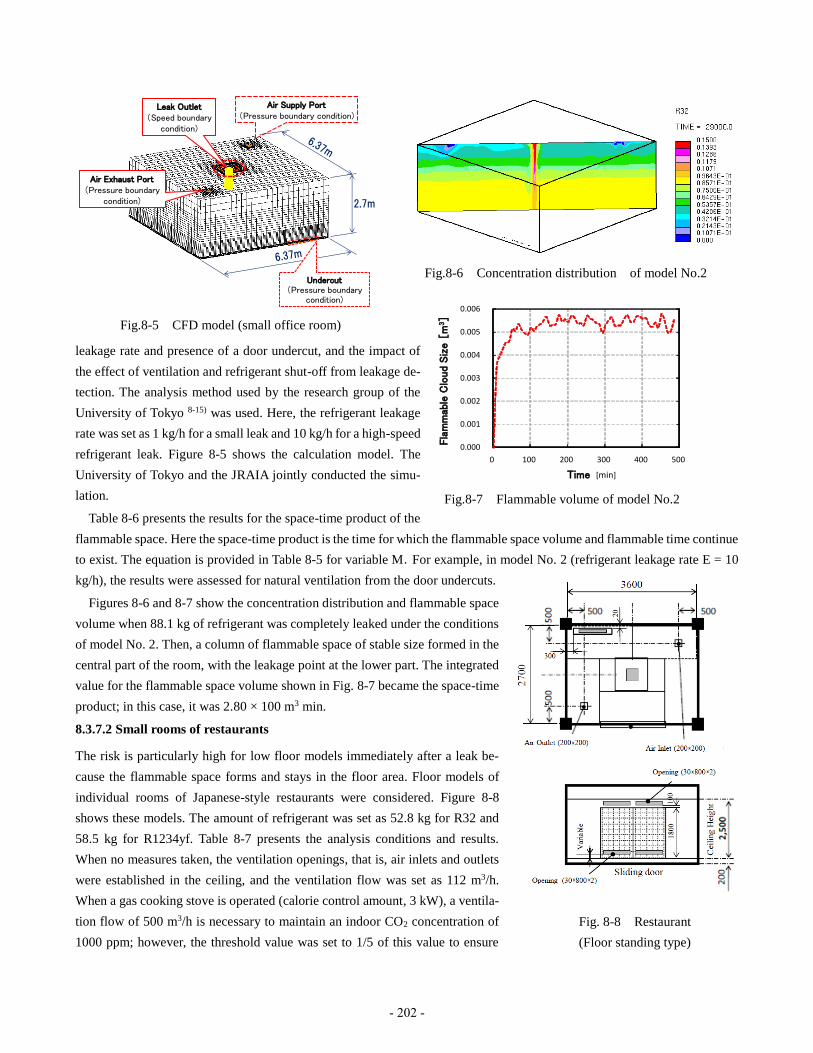
leakage rate and presence of a door undercut, and the impact of
the effect of ventilation and refrigerant shut-off from leakage de-
tection. The analysis method used by the research group of the
University of Tokyo 8-15) was used. Here, the refrigerant leakage
rate was set as 1 kg/h for a small leak and 10 kg/h for a high-speed
refrigerant leak. Figure 8-5 shows the calculation model. The
University of Tokyo and the JRAIA jointly conducted the simu-
lation.
Table 8-6 presents the results for the space-time product of the
flammable space. Here the space-time product is the time for which the flammable space volume and flammable time continue
to exist. The equation is provided in Table 8-5 for variable M.For example, in model No. 2 (refrigerant leakage rate E = 10
kg/h), the results were assessed for natural ventilation from the door undercuts.
Figures 8-6 and 8-7 show the concentration distribution and flammable space
volume when 88.1 kg of refrigerant was completely leaked under the conditions
of model No. 2. Then, a column of flammable space of stable size formed in the
central part of the room, with the leakage point at the lower part. The integrated
value for the flammable space volume shown in Fig. 8-7 became the space-time
product; in this case, it was 2.80 × 100 m3 min.
8.3.7.2 Small rooms of restaurants
The risk is particularly high for low floor models immediately after a leak be-
cause the flammable space forms and stays in the floor area. Floor models of
individual rooms of Japanese-style restaurants were considered. Figure 8-8
shows these models. The amount of refrigerant was set as 52.8 kg for R32 and
58.5 kg for R1234yf. Table 8-7 presents the analysis conditions and results.
When no measures taken, the ventilation openings, that is, air inlets and outlets
were established in the ceiling, and the ventilation flow was set as 112 m3/h.
When a gas cooking stove is operated (calorie control amount, 3 kW), a ventila-
tion flow of 500 m3/h is necessary to maintain an indoor CO2 concentration of
1000 ppm; however, the threshold value was set to 1/5 of this value to ensure
0
20
40
60
80
100
120
0.000
0.001
0.002
0.004
0.005
0.006
0 100 200 300 400 500
Time [min]
Fla
mm
able
Clo
ud
Siz
e [
m3 ]
0.003
Fig.8-7 Flammable volume of model No.2
Air Supply Port(Pressure boundary condition)
Air Exhaust Port(Pressure boundary
condition)
Leak Outlet(Speed boundary
condition)
2.7m
Undercut(Pressure boundary
condition)
Fig.8-5 CFD model (small office room)
Fig.8-6 Concentration distribution of model No.2
xx
x
x
x
x
x
Fig. 8-8 Restaurant
(Floor standing type)
- 202 -

safety. In mechanical ventilation in which an air exhaust outlet was installed in the ceiling, the flammable space was large
because the refrigerant accumulated in the floor area without dilution. According to the JRAIA guidelines GL-138-16), it is
essential to construct air outlets near the floor. In the cases where these guidelines were adopted, the ventilation flow was set
as 164 m3/h (= 10/0.061) at a leakage rate of 10 kg/h to ensure that the concentration did not exceed the refrigerant concen-
tration limit (RCL) value for R32 (0.061 kg/m3). The results showed that changing the height (underside) of air outlets from
30 to 300 mm had a significant impact on the flammable space volume.
8.3.7.3 Karaoke rooms
Because of their high level of air tightness to ensure soundproofing,
karaoke rooms were also assumed to pose high risks. We referred to
actual surveys performed by Kitajima8-17) and Nomura8-18) on kara-
oke rooms. In order to prevent sound leakage, mechanical ventila-
tion was employed. Figure 8-9 presents the models. The maximum
refrigerant amount was set as 88.1 kg, and the volume of the karaoke
room was set as 9.5 m3. The customers changed every 3 h. However,
once the refrigerant concentration was lowered after the customers
changed, the entire room became a flammable space for a short time.
In addition to the karaoke equipment, we assumed candles, combus-
tion-type heaters, gas stoves, and electrical equipment. The concen-
tration was determined by a simplified simulation. The indoor unit
was a ceiling cassette model, and we attempted to create uniform
indoor concentration.
8.3.7.4 Beauty salon backrooms
The case of the water-heating equipment as a fire source in a narrow space with no ventilation was considered (target size:
3150 × 1850 mm). According to a survey by the Ministry of Health, Labour and Welfare, assuming six employees and an
operation time of 10 h, the period of use of a backroom for operating a gas stove for sterilizing tools and taking breaks is
estimated to be 470 h annually. Both ceiling installation and floor types were considered.
8.3.7.5 BBQ restaurants
The risk was also presumed to be high at BBQ restaurants in which high heat is used in individual rooms (target room: 3825
× 2050 mm). The annual operation time for a gas stove in a targeted individual room was estimated as 2050 h from a survey
on the frequency of customer visits to BBQ restaurants. Both ceiling installation and floor-type models were considered.
8.3.7.6 Investigation of stopping of ventilation
Cases in which ventilation is not operated in locations that require ventilation were investigated. Based on the results of a
survey, the failure rate of ventilation equipment was set as 0.025%. This was incorporated into the evaluation because of its
Fig.8-9 Karaoke (Ceiling cassette type)
Table 8-7 Conditions and results of CFD simulations for floor-standing unit in Japanese restaurant
Inlet Outlet
No 1.17 910 1070Yes 1.28 900 1150
300mm above floor level 0.01 320 416200mm above floor level 0.10 317 30.730mm above floor level 1.30 317 2.40
WithoutMeasures
WithMeasures
Mixing inUnit
VentilationAmount
[m3/h]
R32
R32
Time[min]
Ventilation Condition
Analysis Condition Flammable Region
MeanVolume
[m3]
Space-TimeProduct
[m3min]
Refrige-rant
Charge[kg]
LeakRate[kg/h]
Ceiling164Yes1052.8
Ceiling112 Ceiling1052.8
- 203 -
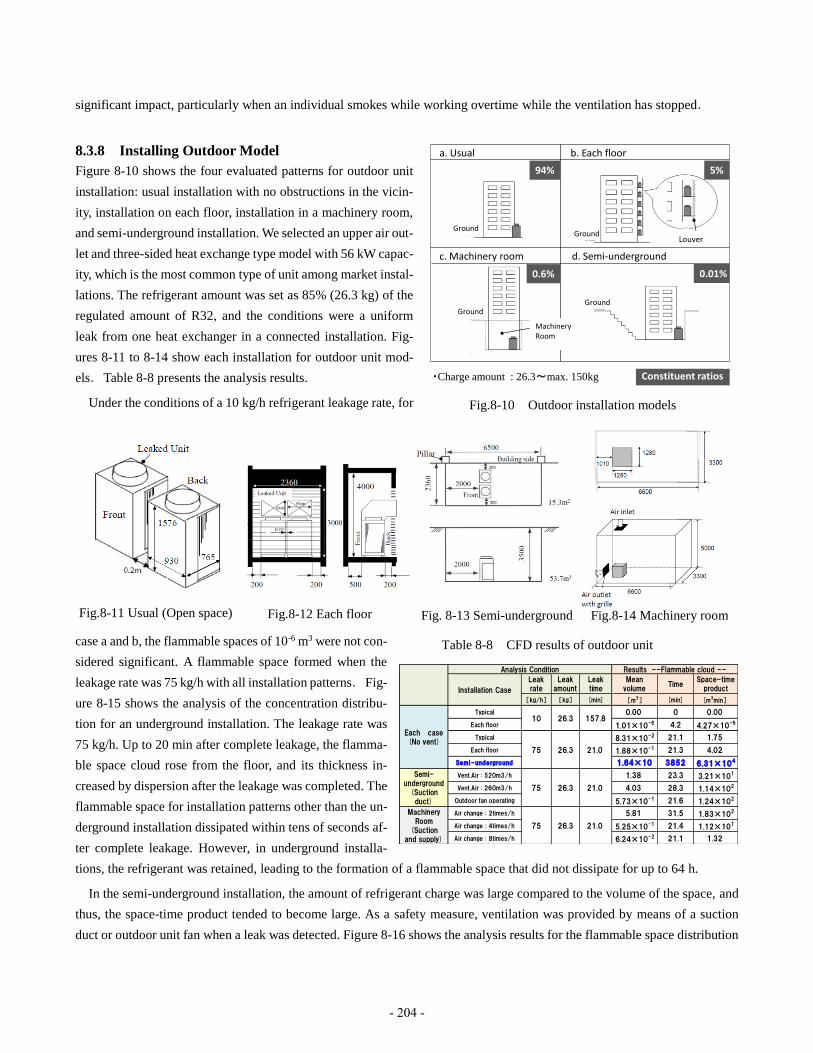
significant impact, particularly when an individual smokes while working overtime while the ventilation has stopped.
8.3.8 Installing Outdoor Model
Figure 8-10 shows the four evaluated patterns for outdoor unit
installation: usual installation with no obstructions in the vicin-
ity, installation on each floor, installation in a machinery room,
and semi-underground installation. We selected an upper air out-
let and three-sided heat exchange type model with 56 kW capac-
ity, which is the most common type of unit among market instal-
lations. The refrigerant amount was set as 85% (26.3 kg) of the
regulated amount of R32, and the conditions were a uniform
leak from one heat exchanger in a connected installation. Fig-
ures 8-11 to 8-14 show each installation for outdoor unit mod-
els.Table 8-8 presents the analysis results.
Under the conditions of a 10 kg/h refrigerant leakage rate, for
case a and b, the flammable spaces of 10-6 m3 were not con-
sidered significant. A flammable space formed when the
leakage rate was 75 kg/h with all installation patterns.Fig-
ure 8-15 shows the analysis of the concentration distribu-
tion for an underground installation. The leakage rate was
75 kg/h. Up to 20 min after complete leakage, the flamma-
ble space cloud rose from the floor, and its thickness in-
creased by dispersion after the leakage was completed. The
flammable space for installation patterns other than the un-
derground installation dissipated within tens of seconds af-
ter complete leakage. However, in underground installa-
tions, the refrigerant was retained, leading to the formation of a flammable space that did not dissipate for up to 64 h.
In the semi-underground installation, the amount of refrigerant charge was large compared to the volume of the space, and
thus, the space-time product tended to become large. As a safety measure, ventilation was provided by means of a suction
duct or outdoor unit fan when a leak was detected. Figure 8-16 shows the analysis results for the flammable space distribution
Leakrate
Leakamount
Leaktime
Meanvolume
TimeSpace-time
product
[kg/h] [kg] [min] [m3] [min] [m3min]
Typical 0.00 0 0.00
Each floor 1.01×10⁻⁶ 4.2 4.27×10⁻⁶
Typical 8.31×10⁻² 21.1 1.75
Each floor 1.88×10⁻¹ 21.3 4.02
Semi-underground 1.64×10 3852 6.31×10⁴
Vent.Air : 520m3/h 1.38 23.3 3.21×101
Vent.Air : 260m3/h 4.03 28.3 1.14×10²
Outdoor fan operating 5.73×10⁻¹ 21.6 1.24×10²
Air change : 2times/h 5.81 31.5 1.83×10²
Air change : 4times/h 5.25×10⁻¹ 21.4 1.12×101
Air change : 8times/h 6.24×10⁻² 21.1 1.32
Analysis Condition Results --Flammable cloud --
Installation Case
Each case(No vent)
10 26.3 157.8
75 26.3
MachineryRoom
(Suctionand supply)
75 26.3 21.0
21.0
Semi-underground
(Suctionduct)
75 26.3 21.0
Table 8-8 CFD results of outdoor unit
Fig.8-11 Usual (Open space) Fig.8-12 Each floor Fig. 8-13 Semi-underground Fig.8-14 Machinery room
Fig.8-10 Outdoor installation models
Constituent ratios
Ground
Ground
Ground
Ground
Louver
MachineryRoom
a. Usual b. Each floor
c. Machinery room d. Semi-underground
・Charge amount : 26.3~max. 150kg
0.6%
94%
0.01%
5%
- 204 -
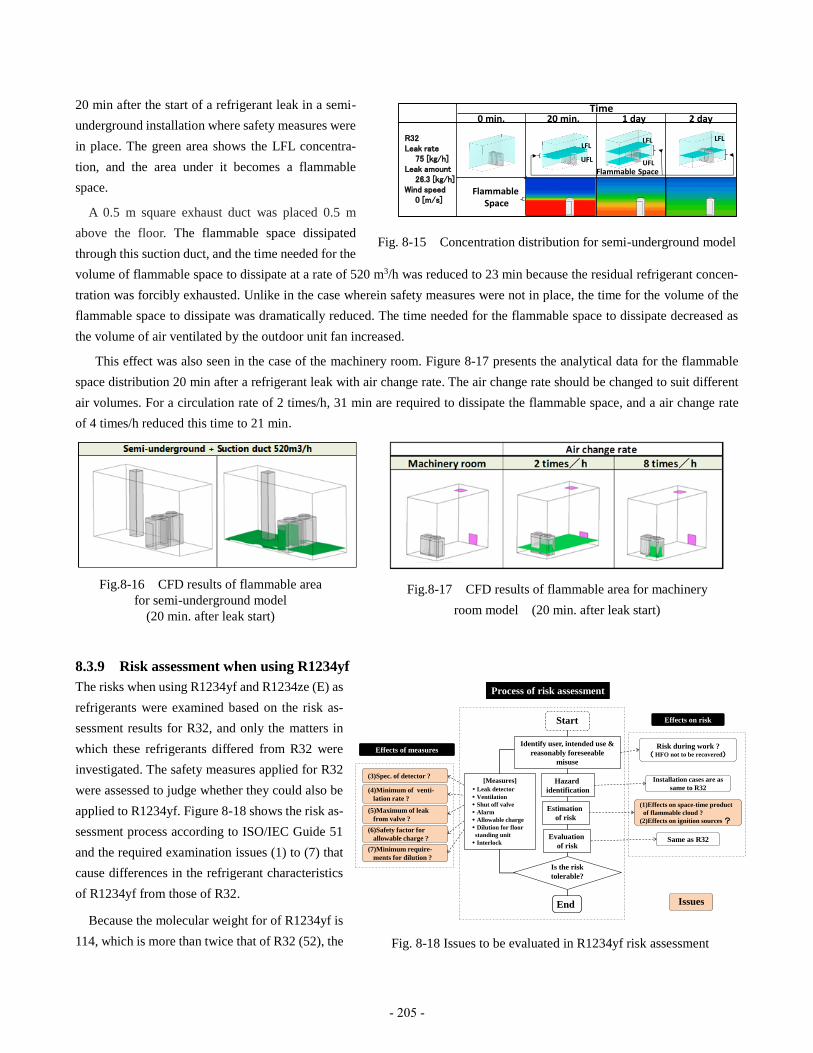
20 min after the start of a refrigerant leak in a semi-
underground installation where safety measures were
in place. The green area shows the LFL concentra-
tion, and the area under it becomes a flammable
space.
A 0.5 m square exhaust duct was placed 0.5 m
above the floor. The flammable space dissipated
through this suction duct, and the time needed for the
volume of flammable space to dissipate at a rate of 520 m3/h was reduced to 23 min because the residual refrigerant concen-
tration was forcibly exhausted. Unlike in the case wherein safety measures were not in place, the time for the volume of the
flammable space to dissipate was dramatically reduced. The time needed for the flammable space to dissipate decreased as
the volume of air ventilated by the outdoor unit fan increased.
This effect was also seen in the case of the machinery room. Figure 8-17 presents the analytical data for the flammable
space distribution 20 min after a refrigerant leak with air change rate. The air change rate should be changed to suit different
air volumes. For a circulation rate of 2 times/h, 31 min are required to dissipate the flammable space, and a air change rate
of 4 times/h reduced this time to 21 min.
8.3.9 Risk assessment when using R1234yf
The risks when using R1234yf and R1234ze (E) as
refrigerants were examined based on the risk as-
sessment results for R32, and only the matters in
which these refrigerants differed from R32 were
investigated. The safety measures applied for R32
were assessed to judge whether they could also be
applied to R1234yf. Figure 8-18 shows the risk as-
sessment process according to ISO/IEC Guide 51
and the required examination issues (1) to (7) that
cause differences in the refrigerant characteristics
of R1234yf from those of R32.
Because the molecular weight for of R1234yf is
114, which is more than twice that of R32 (52), the
Time
0分後 20分後 1日後 2日後
時間
半地下設置
R32
漏洩速度75[kg/h]
漏洩量26.3[kg]
周囲速度0[m/s]
UFLUFL
LFLLFL LFL
R32
Time0 min. 20 min. 1 day 2 day
Flammable Space
Flammable Space
R32Leak rate
75 [kg/h]Leak amount
26.3 [kg/h]Wind speed
0 [m/s]
Fig. 8-15 Concentration distribution for semi-underground model
Fig.8-16 CFD results of flammable area for semi-underground model
(20 min. after leak start)
Fig.8-17 CFD results of flammable area for machinery
room model (20 min. after leak start)
Fig. 8-18 Issues to be evaluated in R1234yf risk assessment
Process of risk assessment
Identify user, intended use &
reasonably foreseeable
misuse
Hazard
identification
Estimation
of risk
Evaluation
of risk
Is the risk
tolerable?
Risk during work ?( HFO not to be recovered)
Installation cases are as
same to R32
(1)Effects on space-time product
of flammable cloud ?
(2)Effects on ignition sources ?
Same as R32
Issues
Effects on risk
End
(3)Spec. of detector ?
(4)Minimum of venti-
lation rate ?
(5)Maximum of leak
from valve ?
(7)Minimum require-
ments for dilution ?
Effects of measures
(6)Safety factor for
allowable charge ?
[Measures]
・Leak detector
・Ventilation
・Shut off valve
・Alarm
・Allowable charge
・Dilution for floor
standing unit
・Interlock
Start
- 205 -

gas density of R1234yf is also twice that of
R32. This may influence the concentration dis-
tribution and space-time product of flammable
space at the time of refrigerant leaks, the venti-
lation, and the stirring of air by a floor-standing
unit. Further, at high humidity, the burning
range widens and exhibits characteristics that
increase burning velocity. Table 8-9 presents
the results obtained by the University of Tokyo
for the space-time product of flammable space
by using Takizawa’s results of the burning
range at the time of high humidity. Under the condition of no ventilation, the space-time product for R1234yf is 1.33 times
that for R32. This is primarily due to the increase in refrigerant quantity. Furthermore, under conditions of high humidity
(27°C, 100% RH), the space-time product in R1234yf becomes 1.58 times that under the ISO817 humidity conditions (23°C,
50% RH). Consequently, the space-time product for R1234yf under conditions of high humidity is considered 2.1 times (1.33
× 1.58) that for R32 under ISO817 conditions. When creating fault tree analysis (FTA) for R1234yf, the space-time product
used is 2.1 times that for R32. However, in offices (where ventilation is stopped at night) and karaoke boxes, the entire indoor
area becomes a flammable space, and in such cases, the flammable space continues to be constant with time.
8.4 Results of Risk Assessment and Safety Measures
8.4.1 Transportation stage
It was hypothesized that risks during transportation could be ignored because of the absence of an ignition source in the cargo
compartment, and that the refrigerant leaked at the time of loading and unloading will dissipate and not generate flammable
spaces.
During storage, 1000 units were
assumed stored in a medium-sized
warehouse with an area of less than
1000 m2 and standard fireproof struc-
ture according to the Building Stand-
ards Act. Based on the space-time
product assuming an R32 leak from
room air conditioners in a spacious
area, the refrigerant charge amount
and floor area were considered, and
the space-time product for flamma-
ble space was assumed as 8.4 × 10⁻³
m3 min. The ignition source was hy-
pothesized to be ignition at the time
of smoking and the electrical spark in
a forklift. This space-time product
Table 8-9 Space-time product of flammable space of R1234yf
[m3min]
No. Ref.Charge
[kg]Vent. ISO817
*1)High
moisture*2)
1 R32 26.3 No 1.622 -
2 R1234yf 29.4 No 2.152 1716
3 R32 26.3 Natulal 0.831 -
4 R1234yf 29.4 Natural 0.661 1.044
°C/RH% 23/50 27/100
LFL%/UFL% 6.2/12.3 5.1/14.2
*1) Space-time product from 2012 progress report
*2) Space-time product from Tokyo University
7.8×10⁻¹⁷~ 1.8×10⁻¹⁶
1/15
1.4×10⁻⁴
Data of VRF’s Leak
8.4×10⁻³ 1
[min×m3] [1/unit×year]
[1/(unit×year]
[1/unit×year][Life 15 years]
[1/unit×year]
Smoking 1.4×10⁻⁶ [1/(min×m3)]Ignore non-smoking 1.0×10⁻² [-]Oil Lighter 5.0×10⁻² [-]
Encounter
Leak
Ignition source by smoking
Leak(rapid + burst)
Packing
Fire
8.4×10⁻⁵ 9.0×10⁻⁸
2.9×10⁻⁴ 3.1×10⁻²
[min×m3] [-/(min×m3]
[-]1/ 100 of smoking
1.2×10⁻¹⁵~ 2.7×10⁻¹⁵
9.0×10⁻¹¹~ 1.4×10⁻⁹
8.3×10⁻¹²~ 1.9×10⁻¹¹
7.5×10⁻¹³~ 1.2×10⁻¹¹
1.4×10⁻⁴
[1/(min×m3)] [-]
[1/(min×m3)]
Spark generation from Fork-lift
Presence of Fork-lift
Static electricity 2.8×10⁻⁴
Metal collision 3.0×10⁻²
Frequency of Storage
[-]
[-]
Ignition source by Fork-lift
Space-time Product
Space-time Product
Fig. 8-19 FTA of Storage in warehouse
- 206 -
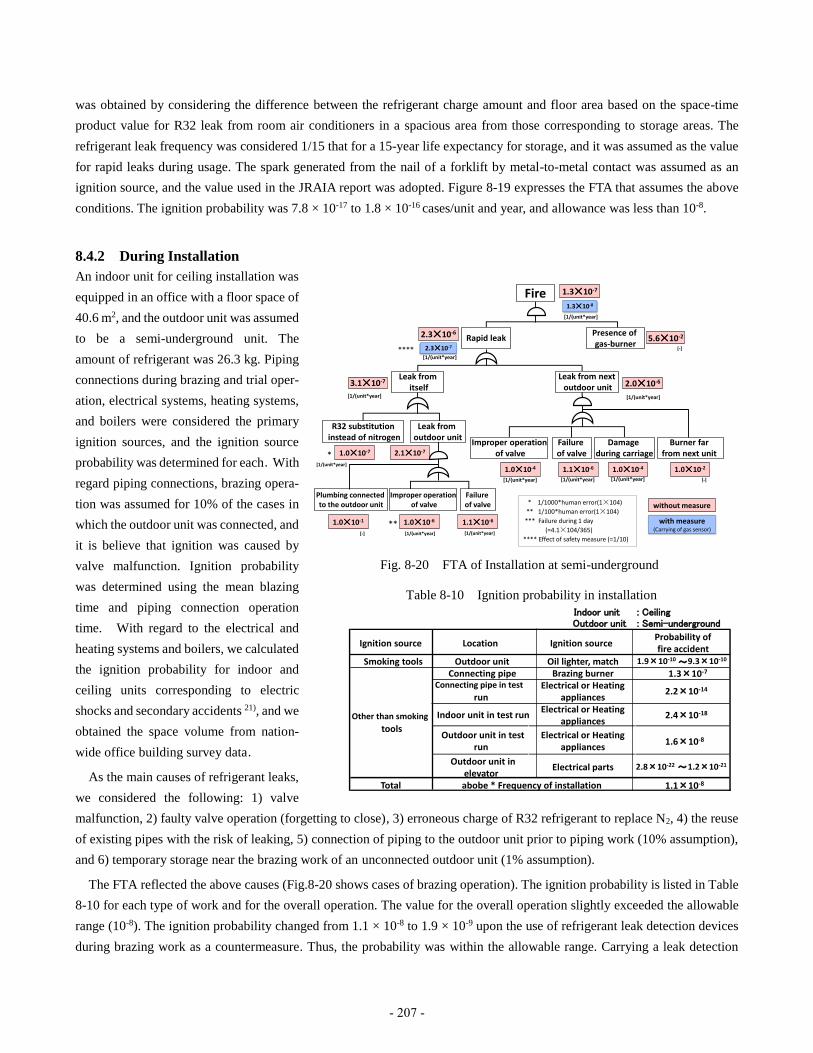
was obtained by considering the difference between the refrigerant charge amount and floor area based on the space-time
product value for R32 leak from room air conditioners in a spacious area from those corresponding to storage areas. The
refrigerant leak frequency was considered 1/15 that for a 15-year life expectancy for storage, and it was assumed as the value
for rapid leaks during usage. The spark generated from the nail of a forklift by metal-to-metal contact was assumed as an
ignition source, and the value used in the JRAIA report was adopted. Figure 8-19 expresses the FTA that assumes the above
conditions. The ignition probability was 7.8 × 10⁻¹⁷ to 1.8 × 10⁻¹⁶ cases/unit and year, and allowance was less than 10-8.
8.4.2 During Installation
An indoor unit for ceiling installation was
equipped in an office with a floor space of
40.6 m2, and the outdoor unit was assumed
to be a semi-underground unit. The
amount of refrigerant was 26.3 kg. Piping
connections during brazing and trial oper-
ation, electrical systems, heating systems,
and boilers were considered the primary
ignition sources, and the ignition source
probability was determined for each.With
regard piping connections, brazing opera-
tion was assumed for 10% of the cases in
which the outdoor unit was connected, and
it is believe that ignition was caused by
valve malfunction. Ignition probability
was determined using the mean blazing
time and piping connection operation
time. With regard to the electrical and
heating systems and boilers, we calculated
the ignition probability for indoor and
ceiling units corresponding to electric
shocks and secondary accidents 21), and we
obtained the space volume from nation-
wide office building survey data.
As the main causes of refrigerant leaks,
we considered the following: 1) valve
malfunction, 2) faulty valve operation (forgetting to close), 3) erroneous charge of R32 refrigerant to replace N2, 4) the reuse
of existing pipes with the risk of leaking, 5) connection of piping to the outdoor unit prior to piping work (10% assumption),
and 6) temporary storage near the brazing work of an unconnected outdoor unit (1% assumption).
The FTA reflected the above causes (Fig.8-20 shows cases of brazing operation). The ignition probability is listed in Table
8-10 for each type of work and for the overall operation. The value for the overall operation slightly exceeded the allowable
range (10-8). The ignition probability changed from 1.1 × 10⁻⁸ to 1.9 × 10⁻⁹ upon the use of refrigerant leak detection devices
during brazing work as a countermeasure. Thus, the probability was within the allowable range. Carrying a leak detection
1.3×10⁻⁷
2.3×10-65.6×10-2
3.1×10⁻⁷ 2.0×10⁻⁶
1.0×10⁻⁷ 2.1×10⁻⁷
1.0×10⁻⁴
****
Leak fromitself
Leak from nextoutdoor unit
Rapid leak
Fire
2.3×10⁻⁷
Improper operationof valve
Failure of valve
1.1×10⁻⁶
1.0×10-6
* 1/1000*human error(1×10⁴)
** 1/100*human error(1×10⁴)
*** Failure during 1 day
(=4.1×10⁴/365)
**** Effect of safety measure (=1/10)
1.0×10⁻⁴
1.1×10⁻⁶
*
**
1.3×10⁻⁸
Presence of gas-burner
Plumbing connected to the outdoor unit
1.0×10⁻¹
1.0×10⁻²
Failure of valve
Damage during carriage
Burner far from next unit
Improper operationof valve
R32 substitutioninstead of nitrogen
Leak from outdoor unit
without measure
with measure(Carrying of gas sensor)
[1/(unit*year]
[1/(unit*year]
[1/(unit*year] [1/(unit*year]
[1/(unit*year]
[1/(unit*year] [1/(unit*year] [-]
[1/(unit*year] [1/(unit*year] [1/(unit*year] [-]
[-]
Fig. 8-20 FTA of Installation at semi-underground
Indoor unit : CeilingOutdoor unit : Semi-underground
Ignition source Location Ignition sourceProbability offire accident
Smoking tools Outdoor unit Oil lighter, match 1.9×10⁻¹⁰ ~9.3×10⁻¹⁰
Connecting pipe Brazing burner 1.3×10⁻⁷
Connecting pipe in test
runElectrical or Heating
appliances2.2×10-14
Indoor unit in test runElectrical or Heating
appliances2.4×10-18
Outdoor unit in testrun
Electrical or Heatingappliances
1.6×10⁻⁸
Outdoor unit inelevator
Electrical parts 2.8×10⁻²² ~1.2×10⁻²¹
Total 1.1×10⁻⁸
Other than smoking
tools
abobe * Frequency of installation
Table 8-10 Ignition probability in installation
- 207 -

device reduces the leak probability during piping brazing by 1/100. Thus, when this device is not used, the probability in-
creases by 1/10; thus, the leak probability was assumed as 11/100.
8.4.3 During System Operation (Indoors)
8.4.3.1 Risk assessment results
The overall FTA was performed in addition to
that for cases cited as standard cases and severe
risks.
Figure 8-21 shows the FTA for ventilation in
office 1 and a small conference room, rapid
leaks, and cases where no measures were taken.
These were investigated as examples of severe
cases. The tree was first roughly divided into
two phenomena: during operation (1), and dur-
ing stopped operation (2). However, because the
various branches of the substructure are similar,
we use operation (2) as an example. The proba-
bility during stopped operation (2) is the product
of the ignition probability per one rapid leak (3)
and the probability of a rapid refrigerant leak in
an indoor unit (4) and the probability of stopped
operation (5).
There are two ignition cases, in one case that the generation of flammable cloud is the trigger of ignition, (6), in another
one that the actuation of ignition source is the trigger of ignition, (7). The ignition probability (3) is the sum of (6) and (7).
The numerical values within the FTA were taken from the results in Section 8.3.7.1 for the space-time product for a flammable
space and the values based on the results in Section 8.3.4 for the probability of ignition sources.
The ignition probability was investigated for the case when ventilation was stopped at night. Oil lighters and matches were
set as the ignition sources—for example, when employees working overtime use them to smoke at night when the ventilation
has stopped. Of the inhabitants, 25% (8.5 people) were assumed to work overtime, and 23.9% were assumed to be smokers.
Then, 1/10 of the room inhabitants (separated for smoking) were assumed to smoke within the office. The smoking frequency
was set to 1.6 cigarettes/h. The usage rate of oil lighters and matches was assumed to be 5% of 6.9 × 10⁻⁸, which contributed
to (11) probability per minute and volume. Based on these results, the probability of an ignition accident occurring when
ventilation is stopped at night was calculated as 7.6 × 10⁻⁹. Thus, the risk was unallowable because it exceeded the 1.0 × 10⁻⁹
level.
8.4.3.2 Summary of results
The probability for the occurrence of ignition was investigated using the aforementioned FTA for all standard and severe risk
cases. The overall total for the product of the constituent ratio and ignition probability for each case became the probability
Fire
Fire while unit is on Fire while unit is off
Unit is off
Space-time product of
flammable cloud
Encounter of ignition source and flammable cloud
Generation of flammable cloud triggers fire
Actuation of ignition source triggers fire
Probability of encounter in
space
Probability of encounter in time
Rapid leak from
indoor unit
Actuation of ignition source in a (minute・m3)
7.6×10⁻⁹
Stove burner and water heater 2.3×10⁻⁵
5.0×10⁻⁶
7.6×10⁻⁹
2.2×10⁻³
2.3×10⁻⁵ 2.2×10⁻³
7.0×10⁻¹
2.3×10-51.03.2×104 6.9×10⁻⁸
3.6×10⁻¹⁶
Ventilation stops at
night 1.0
Forgot turn off once a year(Function to prevent forgetting to
turn off in 2hours)
Air cleaner 0.0Humidifier 0.0Oil lighter and match 6.9×10⁻⁸
Mobile phone 0.0lighting equipment 0.0
Electorikal spark 2.5×10⁻¹⁶
Wiring accesaries 2.0×10⁻¹³
Trucking 1.2×10⁻¹⁵
Personal Computer 0.0
① ②
③ ④ ⑤
⑥ ⑦
⑧ ⑨ ⑩ ⑪
⑫⑬
[1/(unit・year)]
[1/(unit・year)] [1/(unit・year)]
[1/(unit・year)][-] [-] [-]
[-] [-]
[-]
[min・m3][-/(min・m3)]
[-]
Fig.8-21 FTA of indoor operation (office, ventilation stops at night)
- 208 -

for the occurrence of an ignition accident in an in-
door unit. Table 8-11 presents the collected constit-
uent ratios and probabilities of ignition occurrence
for each assumed case and cases without measures.
We determined the ventilation probability of R from
the survey results of actual ventilation conditions in
the market. Using the R so determined, we calcu-
lated the ignition probability for cases without
measures by using the weighted means of ignition
probability with and without ventilation.
The probability of ignition did not reach or go be-
low the target value of 1.0 × 10⁻⁹ for the worst-case
scenario assuming inoperable forced ventilation in
severe cases. The target values were satisfied in
most cases when forced ventilation was applied
based on the Building Standards Law, but further
measures are necessary for restaurants (floor-stand-
ing).
8.4.3.3 Safety measures as function of indoor
units
For the indoor safety of VRF systems when the rate
of refrigerant charge (that is, refrigerant
amount/volume of the room) is greater than values
in the international safety standard ISO51498) Part
1, devices for leak detection, ventilation, warning
alarms, and refrigerant shut-off devices should be
installed. Table 8-12 presents the ignition probability when these safety measures are implemented. The effectiveness of the
safety measures in lowering risk was established for each installation condition related to mechanical ventilation. However,
we assumed 1/50 of a reduction in risk for the shut-off valve and 1/10 considering human intervention in warnings. Further,
implementation of measures for mechanical ventilation and shut-off valves were prioritized.
These safety measures are implemented when installed, but their proper implementation is uncertain. To ensure proper
implementation, they should be interlocked with the indoor unit, or, the detection, ventilation, and refrigerant shut-off devices
are integrated with the main body of the indoor unit. Important points with regard to safety A–E are listed below.
・A: The required refrigerant concentration (refrigerant charge in kilograms/volume of room) should be less than LFL/2.
・B: Detection equipment is established indoors, and mechanical ventilation equipment is provided.
・C: Detection equipment is established indoors, and a means to shut off when a refrigerant leak detected is provided.
・D: Detection equipment is established indoors, and a means to generate a warning when a refrigerant leak is detected is
provided.
・E: The refrigerant charge for a single refrigerant system is less than X kg (X is to be determined).
In A, the safety factor related to LFL was set as 1/2. In conventional international safety standards, this safety factor is 1/4
Table 8-12 Ignition probability during indoor operation
with each safety measure
Installation caseFire accident probability
Without measures
Withmeasures
Site TypeAllowableprobability Mean
Mechanical vent.
Shut offvalve
Safetyalarm
Indoor
Office Ceiling
1.0×10⁻⁹
7.6×10⁻⁹ 3.5×10⁻¹² 1.5×10⁻¹⁰ 7.6×10⁻¹⁰
Karaoke Ceiling 9.0×10⁻⁹ ≃ 0 1.8×10⁻¹⁰ 9.0×10⁻¹⁰
Restaurant Floor 8.0×10⁻⁸ 2.6×10⁻¹⁰ 1.6×10⁻¹⁰ 8.0×10⁻¹⁰
Hairsalon
Ceiling 3.6×10⁻¹⁰ 6.8×10⁻¹² 7.1×10⁻¹² 3.6×10⁻¹¹
BBQrestaurant
Ceiling 6.8×10⁻¹⁰ 1.5×10⁻¹¹ 1.4×10⁻¹¹ 6.8×10⁻¹¹
Ceiling spaceCeiling
concealed 3.0×10⁻¹¹ - - -
Not allowable AllowableIn each installation cases [time/(unit・year)]
Table 8-11 Ignition probability during indoor operation
without safety measures
Installation caseFire accident probability, A
Without measures
Site TypeConstituent
ratio, PAllowableprobability
Ratio of
no vent, RNo vent
A1
VentedA2
MeanAm=RA1+(1-R)A2
Indoor
Office Ceiling 3.8×10⁻¹
1.0×10⁻⁹
1.0 7.6×10-9 *1) 3.5×10⁻¹² 7.6×10⁻⁹
Karaoke Ceiling 2.1×10⁻³ 5.0×10⁻² 1.8×10⁻⁷ 6.2×10⁻¹¹ 9.0×10⁻⁹
Restaurant Floor 2.0×10⁻² 2.0×10⁻¹ 3.8×10⁻⁷ 5.4×10⁻⁹ 8.0×10⁻⁸
Hairsalon
Ceiling 1.6×10⁻³ 2.0×10⁻¹ 1.3×10⁻⁹ 1.2×10⁻¹⁰ 3.6×10⁻¹⁰
BBQrestaurant
Ceiling 7.8×10⁻⁴ 1.0×10⁻¹ 2.8×10⁻⁹ 4.4×10⁻¹⁰ 6.8×10⁻¹⁰
Ceilingspace
Ceiling concealed
1.0×100 1.0×100 3.0×10⁻¹⁰ - 3.0×10⁻¹⁰
Total in market
Total=Σ(P*A) 4.0×10⁻¹ 1.0×10⁻⁹ - 1.1×10⁻⁸ 4.1×10⁻¹⁰ 4.8×10⁻⁹
Not allowable AllowableIn each installation cases [time/(unit・year)]
*1) Ventilation turned off at night from 18:00 to 09:00.
- 209 -
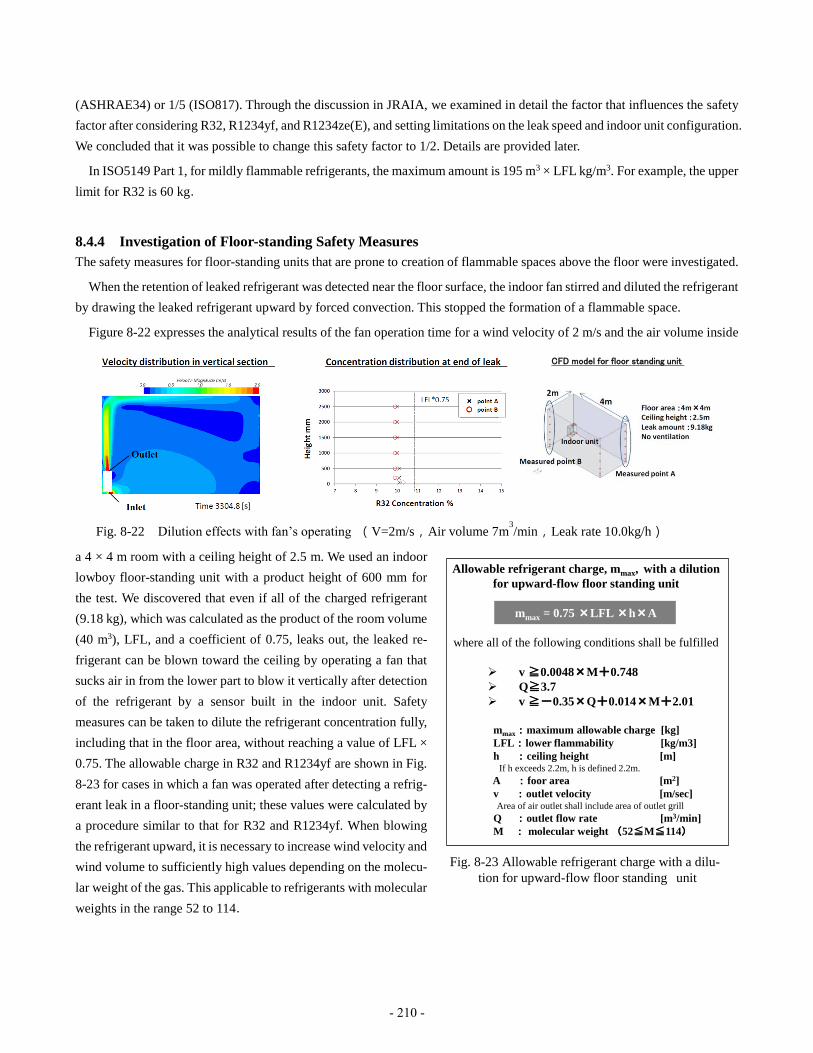
(ASHRAE34) or 1/5 (ISO817). Through the discussion in JRAIA, we examined in detail the factor that influences the safety
factor after considering R32, R1234yf, and R1234ze(E), and setting limitations on the leak speed and indoor unit configuration.
We concluded that it was possible to change this safety factor to 1/2. Details are provided later.
In ISO5149 Part 1, for mildly flammable refrigerants, the maximum amount is 195 m3 × LFL kg/m3. For example, the upper
limit for R32 is 60 kg.
8.4.4 Investigation of Floor-standing Safety Measures
The safety measures for floor-standing units that are prone to creation of flammable spaces above the floor were investigated.
When the retention of leaked refrigerant was detected near the floor surface, the indoor fan stirred and diluted the refrigerant
by drawing the leaked refrigerant upward by forced convection. This stopped the formation of a flammable space.
Figure 8-22 expresses the analytical results of the fan operation time for a wind velocity of 2 m/s and the air volume inside
a 4 × 4 m room with a ceiling height of 2.5 m. We used an indoor
lowboy floor-standing unit with a product height of 600 mm for
the test. We discovered that even if all of the charged refrigerant
(9.18 kg), which was calculated as the product of the room volume
(40 m3), LFL, and a coefficient of 0.75, leaks out, the leaked re-
frigerant can be blown toward the ceiling by operating a fan that
sucks air in from the lower part to blow it vertically after detection
of the refrigerant by a sensor built in the indoor unit. Safety
measures can be taken to dilute the refrigerant concentration fully,
including that in the floor area, without reaching a value of LFL ×
0.75. The allowable charge in R32 and R1234yf are shown in Fig.
8-23 for cases in which a fan was operated after detecting a refrig-
erant leak in a floor-standing unit; these values were calculated by
a procedure similar to that for R32 and R1234yf. When blowing
the refrigerant upward, it is necessary to increase wind velocity and
wind volume to sufficiently high values depending on the molecu-
lar weight of the gas. This applicable to refrigerants with molecular
weights in the range 52 to 114.
Fig. 8-23 Allowable refrigerant charge with a dilu-
tion for upward-flow floor standing unit
Allowable refrigerant charge, mmax, with a dilution
for upward-flow floor standing unit
mmax = 0.75 ×LFL ×h×A
where all of the following conditions shall be fulfilled
v ≧0.0048×M+0.748
Q≧3.7
v ≧-0.35×Q+0.014×M+2.01
mmax:maximum allowable charge [kg]
LFL:lower flammability [kg/m3]
h :ceiling height [m] If h exceeds 2.2m, h is defined 2.2m.
A :foor area [m2]
v :outlet velocity [m/sec]Area of air outlet shall include area of outlet grill
Q :outlet flow rate [m3/min]
M : molecular weight (52≦M≦114)
Fig. 8-22 Dilution effects with fan’s operating (V=2m/s,Air volume 7m3/min,Leak rate 10.0kg/h)
CFD model for floor standing unit
[s]
- 210 -

8.4.5 During System Operation (Outdoors)
8.4.5.1 Results of risk assessment
For outdoor units, we established four installation patterns:
usual, on each floor, in the machinery room, and semi-un-
derground. We selected three ignition sources: smoking
(match or lighter), electrical sparks of the outdoor unit, and
boilers.
We calculated the ignition probability from the space-
time product based on the concentration analysis results and
the number of times that the ignition source was operated.
With regard to smoking, the following conditions are as-
sumed. A 10% probability was considered for other equip-
ment than outdoor unit, they need servicing (50% for semi-
underground and machinery room). The probability of a
day/10 years was selected for the annual servicing of other
equipment. A 10% probability was selected for the event
that service personnel smoke in the workplace for one day,
and a 10% probability was selected for the event that the
service operator would ignore warning labels. Japanese men
have a smoking rate of 33.6% and smoke a daily average of
16 cigarettes (JT statistics). We selected 5% as the probabil-
ity for a match or oil-lighter acting as the ignition source,
and the time to light one cigarette for smoking was set as 5
s. The smoke and ignition from the electrical sparks of an
outdoor unit cause 5.6 fire accidents every year (NITE sta-
tistics). With regard to the boiler, the following assumptions
were made: The market penetration rate was 0.1%; the
boiler operation ratio was 21.9% (annual operation time: 8
h × 20 days/month × 12 months); and the refrigerant has a
flammable concentration that always ignites when drawn
into the burner.
FTA was conducted based on the above preconditions,
and the fire accident probabilities for each installation pat-
tern were calculated. The results are presented in Table 8-
13. Figure 8-24 describes the FTA structure for a semi-underground installation. The ignition probability was found to be less
than the criterion of 4.0 × 10⁻⁹ for usual installation and installation on each floor. Consequently, safety measures were unnec-
essary. However, the refrigerant diffusion velocity for leaks from a semi-underground installation was extremely low, and the
ignition probability was 1.74 × 10⁻⁶, which exceeds the allowance level.In machinery rooms, the allowance level was met
even without any safety measures because of continuous ventilation. However, machinery rooms also may have closed spaces,
Smoking Electric spark Boiler
Usual 9.2×10 -17 5.3×10 -16 2.1×10 -11
Each floor 3.0×10 -14 8.5×10 -14 3.4×10 -9
Semi-underground
3.1×10 -11 7.1×10 -12 1.7×10 -6
Machineryroom
5.5×10 -15 3.1×10 -14 1.2×10 -9
Table 8-13 Ignition probability of outdoor unit
Fig.8-24 FTA of outdoor operating at semi-underground
- 211 -
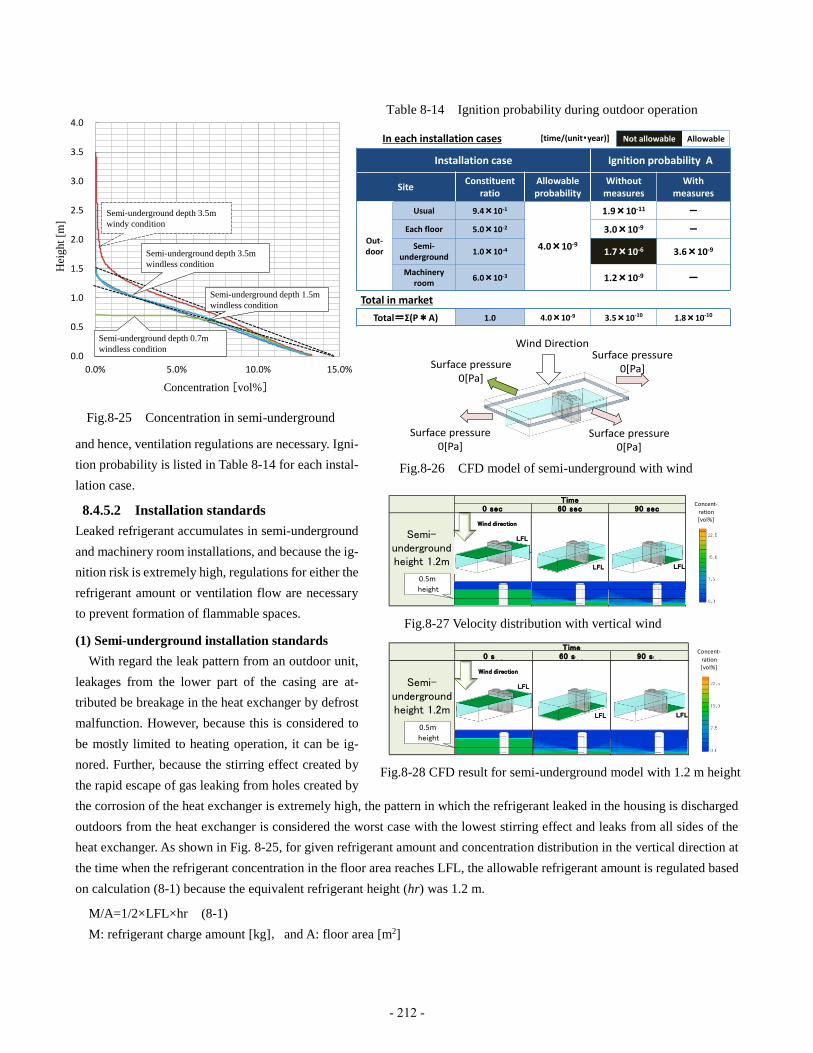
and hence, ventilation regulations are necessary. Igni-
tion probability is listed in Table 8-14 for each instal-
lation case.
8.4.5.2 Installation standards
Leaked refrigerant accumulates in semi-underground
and machinery room installations, and because the ig-
nition risk is extremely high, regulations for either the
refrigerant amount or ventilation flow are necessary
to prevent formation of flammable spaces.
(1) Semi-underground installation standards
With regard the leak pattern from an outdoor unit,
leakages from the lower part of the casing are at-
tributed be breakage in the heat exchanger by defrost
malfunction. However, because this is considered to
be mostly limited to heating operation, it can be ig-
nored. Further, because the stirring effect created by
the rapid escape of gas leaking from holes created by
the corrosion of the heat exchanger is extremely high, the pattern in which the refrigerant leaked in the housing is discharged
outdoors from the heat exchanger is considered the worst case with the lowest stirring effect and leaks from all sides of the
heat exchanger. As shown in Fig. 8-25, for given refrigerant amount and concentration distribution in the vertical direction at
the time when the refrigerant concentration in the floor area reaches LFL, the allowable refrigerant amount is regulated based
on calculation (8-1) because the equivalent refrigerant height (hr) was 1.2 m.
M/A=1/2×LFL×hr (8-1)
M: refrigerant charge amount [kg],and A: floor area [m2]
0.0
0.5
1.0
1.5
2.0
2.5
3.0
3.5
4.0
0.0% 5.0% 10.0% 15.0%
Hei
gh
t [m
]
Concentration [vol%]
Semi-underground depth 3.5m
windy condition
Semi-underground depth 3.5m
windless condition
Semi-underground depth 1.5m
windless condition
Semi-underground depth 0.7m
windless condition
Fig.8-25 Concentration in semi-underground
Wind Direction
Surface pressure 0[Pa]
Surface pressure 0[Pa]
Surface pressure 0[Pa]
Surface pressure 0[Pa]
Fig.8-26 CFD model of semi-underground with wind
0 sec 60 sec 90 secTime
Semi-undergroundheight 1.2m
LFL
LFL
LFL
0.5m
height
Wind direction
Concent-
ration[vol%]
Fig.25 CFD result for semi-underground model with 1.2m heightFig.8-27 Velocity distribution with vertical wind
Fig.8-28 CFD result for semi-underground model with 1.2 m height
0 sec 60 sec 90 secTime
Semi-undergroundheight 1.2m
LFL
LFL
LFL
0.5m
height
Wind direction
Concent-
ration[vol%]
Fig.25 CFD result for semi-underground model with 1.2m height
Table 8-14 Ignition probability during outdoor operation
Installation case Ignition probability A
SiteConstituent
ratioAllowable probability
Without measures
With measures
Out-door
Usual 9.4×10⁻¹
4.0×10⁻⁹
1.9×10⁻¹¹ -
Each floor 5.0×10⁻² 3.0×10⁻⁹ -
Semi-underground
1.0×10⁻⁴ 1.7×10⁻⁶ 3.6×10⁻⁹
Machineryroom
6.0×10⁻³ 1.2×10⁻⁹ -
Total in market
Total=Σ(P*A) 1.0 4.0×10⁻⁹ 3.5×10⁻¹⁰ 1.8×10⁻¹⁰
Not allowable AllowableIn each installation cases [time/(unit・year)]
- 212 -

Further, for outdoor units, the refrigerant diffuses under nat-
ural wind. As shown in the analysis model of Fig.8-26, we de-
termined that wind reaches the floor, as shown in Fig.8-27,
when wind moves vertically to a semi-underground height of
1.2 m at a velocity of 0.3 m/s or more. The flammable space
continuation time then, was 90 s at the maximum, as shown in
Fig.8-28.
Flammable spaces are not created when the wind velocity
exceeds 0.3 m/s. We surveyed annual wind velocity data for
the main cities in Japan. The results are shown in Fig.8-29. The
annual windless probability was 2.5%, and we set windless
probability at 5% by considering the safety margin. Outdoor
wind velocity is ever changing, and flammable spaces may be
created after B hours are elapses from the time that wind stops
blowing. The value of B corresponds to leakage rate at this point,
and it is calculated by using equation (8-1) for an equivalent re-
frigerant height of 1.35 m because of the absence of ignition
sources. The probability that the B hour interval for the windless
condition continues can be expressed as 0.05B, and is 83.5% for
a leakage rate of 75 kg/h, and 26.0% at 10 kg/h. Ignition
probability at that time is obtained by multiplying the probability
of leak (B), probability of windless condition (C), probability of
installing a boiler nearby (D), boiler operation ratio (E), and unit
off ratio (F) by the probability that the B hour internal windless
condition continues (A). This probability satisfies the allowable level, as seen from Table 8-15.
(2) Machinery room installation standards
The relationship between refrigerant leakage rate m [kg/h], air
change rate n [times/h], room volume V [m3] and the
refrigerant concentration for the room C [kg/m3] is shown
below.
C=m/(n×V) (8-2)
where m = 75, V = 95, and n = 4, and hence, C becomes 75/(4
× 95) = 0.197 kg/m3 , and the safety factor is 0.642 for an LFL
of 0.307 kg/m3. The locations where flammable spaces are created for a air change rate of 4 times/h are shown in Fig.8-30,
and they are close to the surface of the outdoor heat exchanger and parts of the floor with a 0.5% space probability for
flammable space to all space of machinery room.There is no energy source from the floor level up to 0.15 m, and when the
safety factor becomes 0.642 because no boilers are installed near the surface of outdoor heat exchanger, it is highly likely that
there will be no opportunity for contact with an ignition source.
・Semi-underground height less than 1.2 m: no restrictions.
Fig.8-30 CFD result for machinery room model
Fig.8-29 Appearance time of wind velocity in 2014,
Japan
Burst leak Rapid leak
75kg/h 10kg/h
Time B h 0.06 0.45
Probability of continuous windless for B hour (A)
% 83.5 26.0
Probability of Leak (B) ppm 137 1338
Probability of windless leak occurred (C)
% 5
Boiler installed next unit ratio (D) % 0.1
Boiler operation ratio (E) % 21.9
Unit off ratio (F) % 70
Ignition probability 8.77x10⁻¹⁰ 2.67x10-09
Table 8-15 Ignition probability of outdoor unit
- 213 -
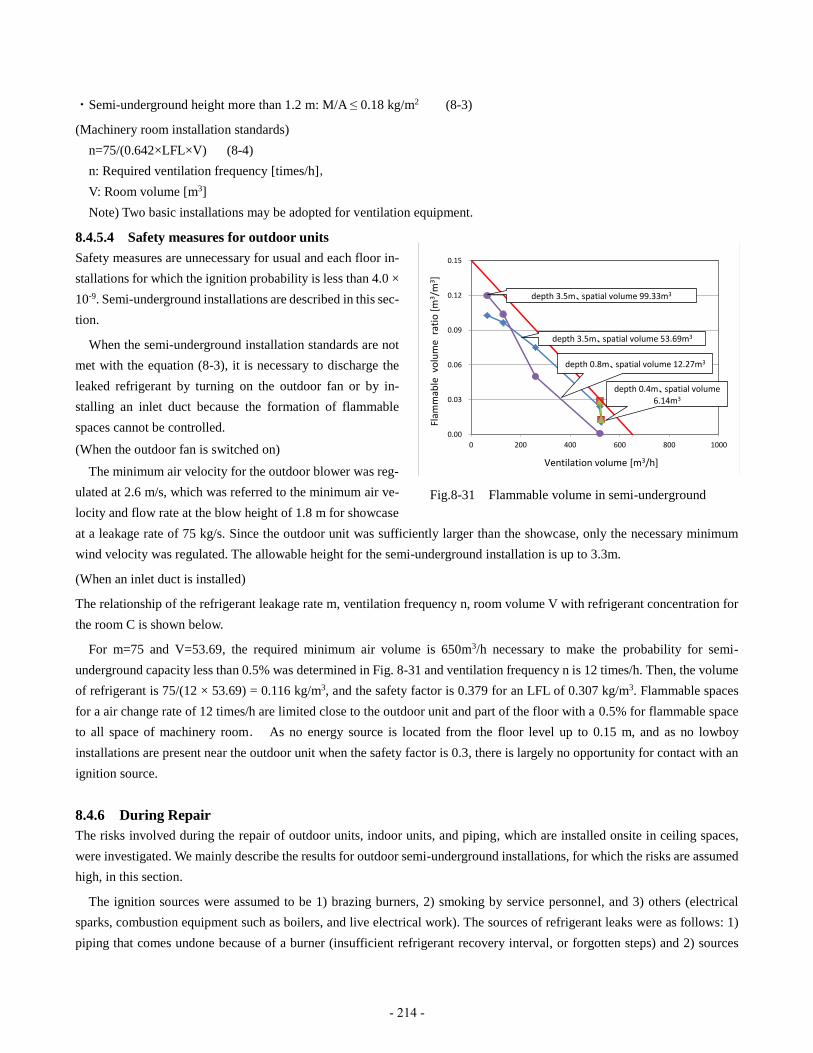
・Semi-underground height more than 1.2 m: M/A ≤ 0.18 kg/m2 (8-3)
(Machinery room installation standards)
n=75/(0.642×LFL×V) (8-4)
n: Required ventilation frequency [times/h],
V: Room volume [m3]
Note) Two basic installations may be adopted for ventilation equipment.
8.4.5.4 Safety measures for outdoor units
Safety measures are unnecessary for usual and each floor in-
stallations for which the ignition probability is less than 4.0 ×
10-9. Semi-underground installations are described in this sec-
tion.
When the semi-underground installation standards are not
met with the equation (8-3), it is necessary to discharge the
leaked refrigerant by turning on the outdoor fan or by in-
stalling an inlet duct because the formation of flammable
spaces cannot be controlled.
(When the outdoor fan is switched on)
The minimum air velocity for the outdoor blower was reg-
ulated at 2.6 m/s, which was referred to the minimum air ve-
locity and flow rate at the blow height of 1.8 m for showcase
at a leakage rate of 75 kg/s. Since the outdoor unit was sufficiently larger than the showcase, only the necessary minimum
wind velocity was regulated. The allowable height for the semi-underground installation is up to 3.3m.
(When an inlet duct is installed)
The relationship of the refrigerant leakage rate m, ventilation frequency n, room volume V with refrigerant concentration for
the room C is shown below.
For m=75 and V=53.69, the required minimum air volume is 650m3/h necessary to make the probability for semi-
underground capacity less than 0.5% was determined in Fig. 8-31 and ventilation frequency n is 12 times/h. Then, the volume
of refrigerant is 75/(12 × 53.69) = 0.116 kg/m3, and the safety factor is 0.379 for an LFL of 0.307 kg/m3. Flammable spaces
for a air change rate of 12 times/h are limited close to the outdoor unit and part of the floor with a 0.5% for flammable space
to all space of machinery room. As no energy source is located from the floor level up to 0.15 m, and as no lowboy
installations are present near the outdoor unit when the safety factor is 0.3, there is largely no opportunity for contact with an
ignition source.
8.4.6 During Repair
The risks involved during the repair of outdoor units, indoor units, and piping, which are installed onsite in ceiling spaces,
were investigated. We mainly describe the results for outdoor semi-underground installations, for which the risks are assumed
high, in this section.
The ignition sources were assumed to be 1) brazing burners, 2) smoking by service personnel, and 3) others (electrical
sparks, combustion equipment such as boilers, and live electrical work). The sources of refrigerant leaks were as follows: 1)
piping that comes undone because of a burner (insufficient refrigerant recovery interval, or forgotten steps) and 2) sources
0.00
0.03
0.06
0.09
0.12
0.15
0 200 400 600 800 1000
Ventilation volume [m3/h]
Flam
mab
le v
olu
me
rat
io [
m3/m
3]
depth 3.5m、spatial volume 99.33m3
depth 3.5m、spatial volume 53.69m3
depth 0.8m、spatial volume 12.27m3
depth 0.4m、spatial volume 6.14m3
Fig.8-31 Flammable volume in semi-underground
- 214 -

other than service work (for example, cracks in the piping).
The conditions were as follows: service time, 5 h (refrigerant recovery: 1 h + changing parts: 0.5 h + leakage check 0.5 h
+ vacuum: 2 h + refrigerant charge: 0.5 h + trial operation: 0.5 h); brazing time, 8 min (2 min × 4: twice for brazing to remove
parts and twice to attach parts); and burner workspace, 1 m3 (height: 2 m × width: 1 m × depth: 0.5 m).
Figure 8-32 shows the FTA (when no safety measures were taken). The calculated ignition probability was 3.6 × 10⁻⁷, which
exceeded the allowable value (1.0 × 10⁻⁸). To reduce the risks from the brazing burner, which was the dominant ignition source,
safety measures related to the handling of the burner during work were necessary. The following measures were proposed to
lower the ignition probability.
Measure ① Provide educational training to the service
personnel (e.g., extinguish the burner immediately when a
refrigerant leak is noticed during burner work).
Measure ② Require the service personnel to carry refrig-
erant leak detection devices and to check for the refrigerant
leaks before and during work.
Ignition probability was calculated for the case in which
both the abovementioned safety measures were applied for
outdoor use (ventilation by an intake duct). The resulting
ignition probability was 2.1 × 10⁻⁹ times/y, unit, which is
less than the allowance (1.0 × 10⁻⁸).
Encounter of ignition source and flammable cloud
Leak rate with flammable cloud
3.6×10⁻⁶
3.6×10⁻⁶
5.5×10⁻⁶
7.0×10⁻²
6.4
7.0×10⁻² 1.0 3.1×10⁻¹
[m3/m3] [min/min]
Generation of flammablecloud triggers fire
Actuation of ignitionsource triggers fire
Probability of encounter in space
Probability of encounter in time
Fire
Service rate
3.6×10⁻⁷
1.0×10⁻¹
Others 1.7×10⁻⁸ 9.9×10⁻¹⁰ Burner for brazing
Smokingby serviceman
Leak accompanied with brazing
Leak not accompaniedwith servicing
Leak rate with flammable cloud
Encounter of ignition source and flammable cloud
Actuation of ignitionsource triggers fire
Generation of flammablecloud triggers fire
Space-time product of flammable cloud
Actuation of ignition source in a (minute * m3)
2.5×10⁻⁴
6.4×10⁻⁴ 1.3×10⁻³
1.8×10⁻⁵
8.6×10⁻⁷
6.4
Probability of encounter in space
Probability of encounter in time
Space-time product of flammable cloud
Actuation of ignition source in a (minute * m3)
7.0×10⁻² 8.3×10⁻⁷
2.7×10⁻²
8.4×10⁻³
4.9×10³ 1.3×10⁻³
Fire in service
1.5×10⁻¹Servicing with brazing
[1/(unit*year)]
[1/(min*m3)]
[-] [1/(unit*year)]
[1/(unit*year)] [1/(unit*year)] [1/(unit*year)]
[-]
[1/(unit*year)][1/(unit*year)]
[1/(unit*year)][1/(unit*year)]
[-][-]
[-]
[-]
[-][-]
[min*m3] [min*m3] [min/min] [1/(min*m3)][min*m3]
Fig.8-32 FTA of Servicing at semi-underground (without measure)
Table 8-16 Ignition probability in servicing
Ignition probability
X X
- 215 -
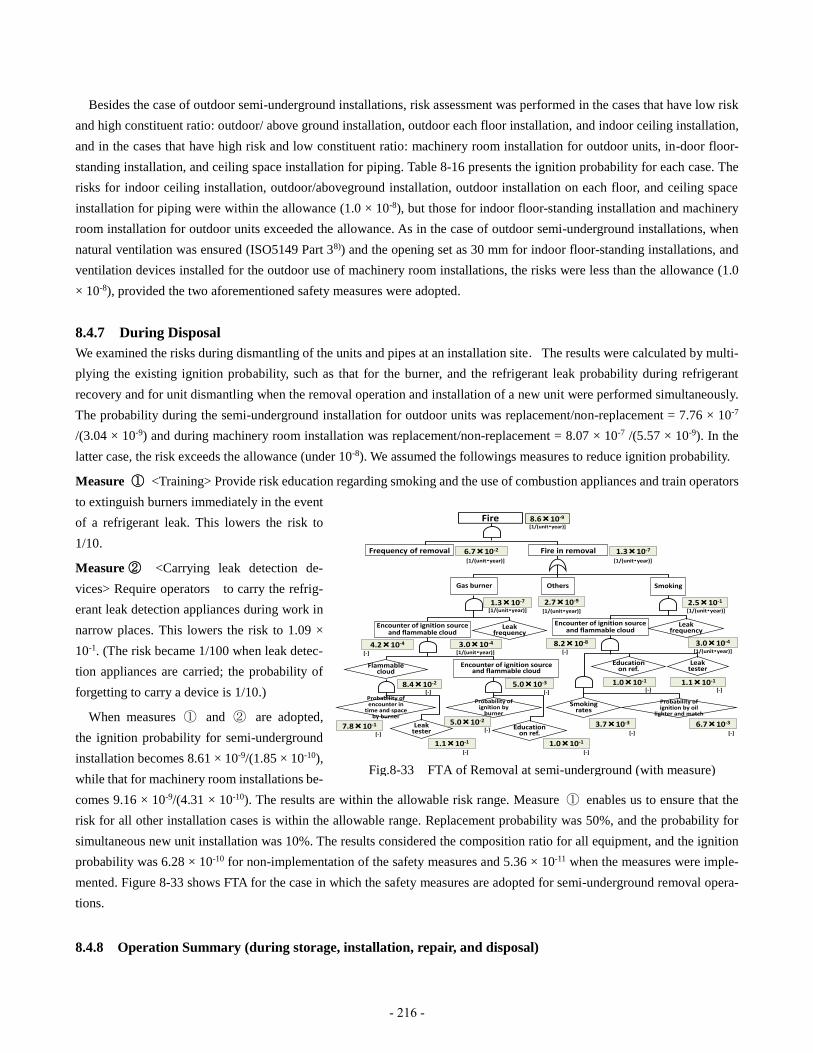
Besides the case of outdoor semi-underground installations, risk assessment was performed in the cases that have low risk
and high constituent ratio: outdoor/ above ground installation, outdoor each floor installation, and indoor ceiling installation,
and in the cases that have high risk and low constituent ratio: machinery room installation for outdoor units, in-door floor-
standing installation, and ceiling space installation for piping. Table 8-16 presents the ignition probability for each case. The
risks for indoor ceiling installation, outdoor/aboveground installation, outdoor installation on each floor, and ceiling space
installation for piping were within the allowance (1.0 × 10⁻⁸), but those for indoor floor-standing installation and machinery
room installation for outdoor units exceeded the allowance. As in the case of outdoor semi-underground installations, when
natural ventilation was ensured (ISO5149 Part 38)) and the opening set as 30 mm for indoor floor-standing installations, and
ventilation devices installed for the outdoor use of machinery room installations, the risks were less than the allowance (1.0
× 10-8), provided the two aforementioned safety measures were adopted.
8.4.7 During Disposal
We examined the risks during dismantling of the units and pipes at an installation site.The results were calculated by multi-
plying the existing ignition probability, such as that for the burner, and the refrigerant leak probability during refrigerant
recovery and for unit dismantling when the removal operation and installation of a new unit were performed simultaneously.
The probability during the semi-underground installation for outdoor units was replacement/non-replacement = 7.76 × 10⁻⁷
/(3.04 × 10-9) and during machinery room installation was replacement/non-replacement = 8.07 × 10⁻⁷ /(5.57 × 10-9). In the
latter case, the risk exceeds the allowance (under 10-8). We assumed the followings measures to reduce ignition probability.
Measure ① <Training> Provide risk education regarding smoking and the use of combustion appliances and train operators
to extinguish burners immediately in the event
of a refrigerant leak. This lowers the risk to
1/10.
Measure ② <Carrying leak detection de-
vices> Require operators to carry the refrig-
erant leak detection appliances during work in
narrow places. This lowers the risk to 1.09 ×
10-1. (The risk became 1/100 when leak detec-
tion appliances are carried; the probability of
forgetting to carry a device is 1/10.)
When measures ① and ② are adopted,
the ignition probability for semi-underground
installation becomes 8.61 × 10⁻⁹/(1.85 × 10-10),
while that for machinery room installations be-
comes 9.16 × 10⁻⁹/(4.31 × 10-10). The results are within the allowable risk range. Measure ① enables us to ensure that the
risk for all other installation cases is within the allowable range. Replacement probability was 50%, and the probability for
simultaneous new unit installation was 10%. The results considered the composition ratio for all equipment, and the ignition
probability was 6.28 × 10⁻¹⁰ for non-implementation of the safety measures and 5.36 × 10⁻¹¹ when the measures were imple-
mented. Figure 8-33 shows FTA for the case in which the safety measures are adopted for semi-underground removal opera-
tions.
8.4.8 Operation Summary (during storage, installation, repair, and disposal)
Fire
Frequency of removal Fire in removal
Gas burner
Encounter of ignition source and flammable cloud
Flammable cloud
Encounter of ignition source and flammable cloud
8.6×10⁻⁹
2.7×10⁻⁹
1.3×10⁻⁷
1.3×10⁻⁷
4.2×10⁻⁴ 3.0×10⁻⁴
2.5×10⁻¹
5.0×10-38.4×10-2
6.7×10⁻²
[1/(unit・year)]
[1/(unit・year)] [1/(unit・year)]
[1/(unit・year)]
[-] [-]
[-]
Others Smoking
[1/(unit・year)][1/(unit・year)]
Leak frequency
3.0×10⁻⁴
Encounter of ignition source and flammable cloud
Leak frequency
8.2×10⁻⁸
[-] [1/(unit・year)][1/(unit・year)]
Leak tester
Education on ref.
1.0×10⁻¹ 1.1×10⁻¹
[-] [-]
Smoking rates
Probability of ignition by oil
lighter and match
3.7×10⁻³ 6.7×10⁻³Education
on ref.
Probability of ignition by
burner
Leak tester
Probability of encounter in
time and space by burner
1.0×10⁻¹
5.0×10⁻²
1.1×10⁻¹
7.8×10⁻¹
[-] [-]
[-][-]
[-] [-]
Fig.8-33 FTA of Removal at semi-underground (with measure)
- 216 -
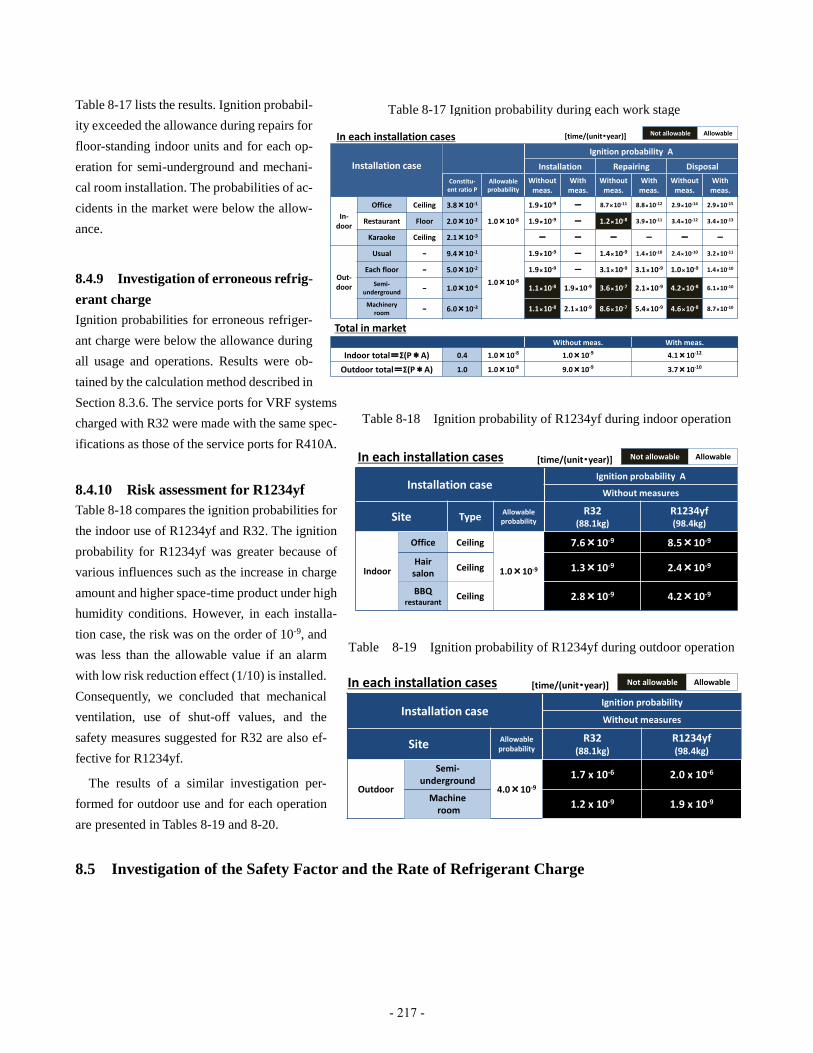
Table 8-17 lists the results. Ignition probabil-
ity exceeded the allowance during repairs for
floor-standing indoor units and for each op-
eration for semi-underground and mechani-
cal room installation. The probabilities of ac-
cidents in the market were below the allow-
ance.
8.4.9 Investigation of erroneous refrig-
erant charge
Ignition probabilities for erroneous refriger-
ant charge were below the allowance during
all usage and operations. Results were ob-
tained by the calculation method described in
Section 8.3.6. The service ports for VRF systems
charged with R32 were made with the same spec-
ifications as those of the service ports for R410A.
8.4.10 Risk assessment for R1234yf
Table 8-18 compares the ignition probabilities for
the indoor use of R1234yf and R32. The ignition
probability for R1234yf was greater because of
various influences such as the increase in charge
amount and higher space-time product under high
humidity conditions. However, in each installa-
tion case, the risk was on the order of 10-9, and
was less than the allowable value if an alarm
with low risk reduction effect (1/10) is installed.
Consequently, we concluded that mechanical
ventilation, use of shut-off values, and the
safety measures suggested for R32 are also ef-
fective for R1234yf.
The results of a similar investigation per-
formed for outdoor use and for each operation
are presented in Tables 8-19 and 8-20.
8.5 Investigation of the Safety Factor and the Rate of Refrigerant Charge
Table 8-17 Ignition probability during each work stage
Installation case
Ignition probability A
Installation Repairing Disposal
Constitu-ent ratio P
Allowableprobability
Without meas.
With meas.
Without meas.
With meas.
Without meas.
With meas.
In-door
Office Ceiling 3.8×10⁻¹
1.0×10⁻⁸
1.9×10⁻⁹ - 8.7×10⁻¹¹ 8.8×10⁻¹² 2.9×10⁻¹⁴ 2.9×10⁻¹⁵
Restaurant Floor 2.0×10⁻² 1.9×10⁻⁹ - 1.2×10⁻⁸ 3.9×10⁻¹¹ 3.4×10⁻¹² 3.4×10⁻¹³
Karaoke Ceiling 2.1×10⁻³ - - - - - -
Out-door
Usual - 9.4×10⁻¹
1.0×10⁻⁸
1.9×10⁻⁹ - 1.4×10⁻⁹ 1.4×10⁻¹⁰ 2.4×10⁻¹⁰ 3.2×10⁻¹¹
Each floor - 5.0×10⁻² 1.9×10⁻⁹ - 3.1×10⁻⁹ 3.1×10⁻⁹ 1.0×10⁻⁹ 1.4×10⁻¹⁰
Semi-underground
- 1.0×10⁻⁴ 1.1×10⁻⁸ 1.9×10⁻⁹ 3.6×10⁻⁷ 2.1×10⁻⁹ 4.2×10⁻⁸ 6.1×10⁻¹⁰
Machineryroom
- 6.0×10⁻³ 1.1×10⁻⁸ 2.1×10⁻⁹ 8.6×10⁻⁷ 5.4×10⁻⁹ 4.6×10⁻⁸ 8.7×10⁻¹⁰
Total in marketWithout meas. With meas.
Indoor total=Σ(P*A) 0.4 1.0×10⁻⁸ 1.0×10⁻⁹ 4.1×10⁻¹²
Outdoor total=Σ(P*A) 1.0 1.0×10⁻⁸ 9.0×10⁻⁹ 3.7×10⁻¹⁰
Not allowable AllowableIn each installation cases [time/(unit・year)]
Table 8-18 Ignition probability of R1234yf during indoor operation
Installation caseIgnition probability A
Without measures
Site TypeAllowableprobability
R32(88.1kg)
R1234yf(98.4kg)
Indoor
Office Ceiling
1.0×10⁻⁹
7.6×10⁻⁹ 8.5×10⁻⁹
Hairsalon
Ceiling 1.3×10⁻⁹ 2.4×10⁻⁹
BBQrestaurant
Ceiling 2.8×10⁻⁹ 4.2×10⁻⁹
Not allowable AllowableIn each installation cases [time/(unit・year)]
Table 8-19 Ignition probability of R1234yf during outdoor operation
Installation caseIgnition probability
Without measures
Site Allowableprobability
R32(88.1kg)
R1234yf(98.4kg)
Outdoor
Semi-underground
4.0×10⁻⁹
1.7 x 10⁻⁶ 2.0 x 10⁻⁶
Machineroom
1.2 x 10⁻⁹ 1.9 x 10⁻⁹
Not allowable AllowableIn each installation cases [time/(unit・year)]
- 217 -
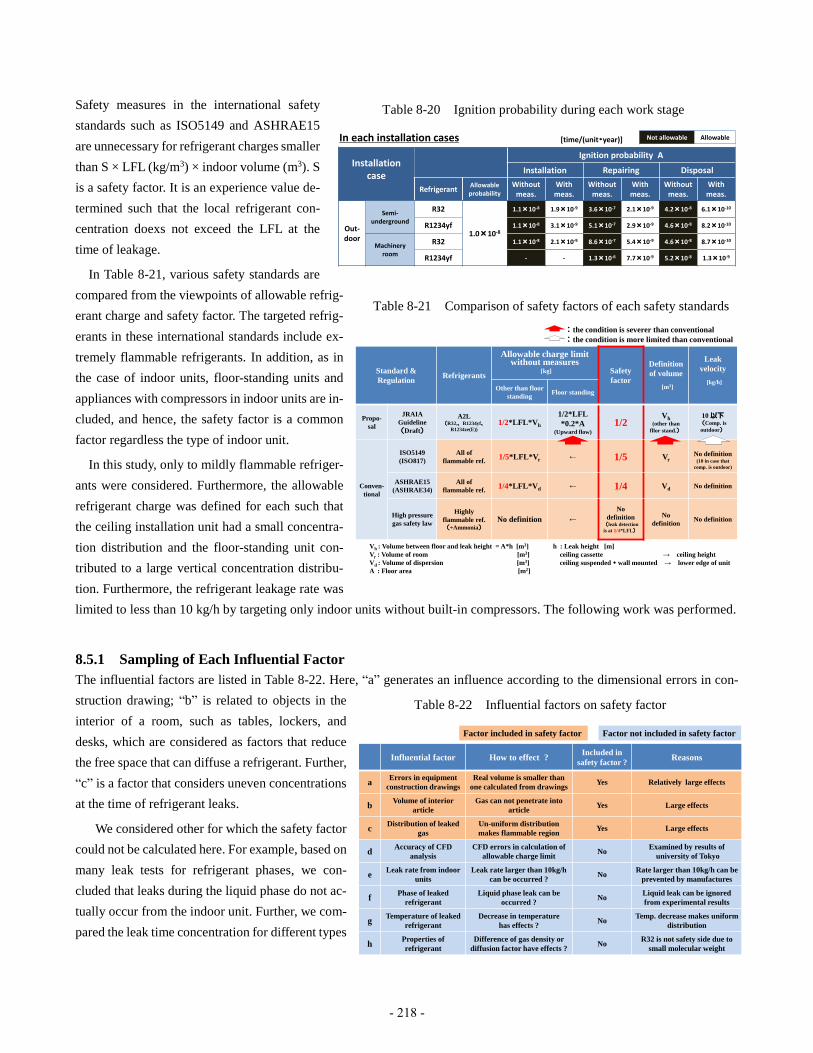
Safety measures in the international safety
standards such as ISO5149 and ASHRAE15
are unnecessary for refrigerant charges smaller
than S × LFL (kg/m3) × indoor volume (m3). S
is a safety factor. It is an experience value de-
termined such that the local refrigerant con-
centration doexs not exceed the LFL at the
time of leakage.
In Table 8-21, various safety standards are
compared from the viewpoints of allowable refrig-
erant charge and safety factor. The targeted refrig-
erants in these international standards include ex-
tremely flammable refrigerants. In addition, as in
the case of indoor units, floor-standing units and
appliances with compressors in indoor units are in-
cluded, and hence, the safety factor is a common
factor regardless the type of indoor unit.
In this study, only to mildly flammable refriger-
ants were considered. Furthermore, the allowable
refrigerant charge was defined for each such that
the ceiling installation unit had a small concentra-
tion distribution and the floor-standing unit con-
tributed to a large vertical concentration distribu-
tion. Furthermore, the refrigerant leakage rate was
limited to less than 10 kg/h by targeting only indoor units without built-in compressors. The following work was performed.
8.5.1 Sampling of Each Influential Factor
The influential factors are listed in Table 8-22. Here, “a” generates an influence according to the dimensional errors in con-
struction drawing; “b” is related to objects in the
interior of a room, such as tables, lockers, and
desks, which are considered as factors that reduce
the free space that can diffuse a refrigerant. Further,
“c” is a factor that considers uneven concentrations
at the time of refrigerant leaks.
We considered other for which the safety factor
could not be calculated here. For example, based on
many leak tests for refrigerant phases, we con-
cluded that leaks during the liquid phase do not ac-
tually occur from the indoor unit. Further, we com-
pared the leak time concentration for different types
Table 8-21 Comparison of safety factors of each safety standards
Standard &
RegulationRefrigerants
Allowable charge limit without measures
[kg] Safety
factor
Definition
of volume
[m3]
Leak
velocity
[kg/h]Other than floor
standingFloor standing
Propo-
sal
JRAIA
Guideline
(Draft)
A2L(R32,、R1234yf、
R1234ze(E))
1/2*LFL*Vh
1/2*LFL
*0.2*A(Upward flow)
1/2Vh
(other than
fllor stand.)
10 以下(Comp. is
outdoor)
Conven-
tional
ISO5149
(ISO817)
All of
flammable ref.1/5*LFL*Vr ← 1/5 Vr
No definition(10 in case that
comp. is outdoor)
ASHRAE15
(ASHRAE34)
All of
flammable ref.1/4*LFL*Vd ← 1/4 Vd No definition
High pressure
gas safety law
Highly
flammable ref.(+Ammonia)
No definition ←
No
definition(leak detection
is at 1/4*LFL)
No
definitionNo definition
:the condition is severer than conventional
:the condition is more limited than conventional
Vh : Volume between floor and leak height = A*h [m3]
Vr : Volume of room [m3]
Vd : Volume of dispersion [m3]
A : Floor area [m2]
h : Leak height [m]
ceiling cassette → ceiling height
ceiling suspended・wall mounted → lower edge of unit
Table 8-22 Influential factors on safety factor
Influential factor How to effect ?Included in
safety factor ?Reasons
aErrors in equipment
construction drawings
Real volume is smaller than
one calculated from drawingsYes Relatively large effects
bVolume of interior
article
Gas can not penetrate into
articleYes Large effects
cDistribution of leaked
gas
Un-uniform distribution
makes flammable regionYes Large effects
dAccuracy of CFD
analysis
CFD errors in calculation of
allowable charge limitNo
Examined by results of
university of Tokyo
eLeak rate from indoor
units
Leak rate larger than 10kg/h
can be occurred ?No
Rate larger than 10kg/h can be
prevented by manufactures
fPhase of leaked
refrigerant
Liquid phase leak can be
occurred ?No
Liquid leak can be ignored
from experimental results
gTemperature of leaked
refrigerant
Decrease in temperature
has effects ? No
Temp. decrease makes uniform
distribution
hProperties of
refrigerant
Difference of gas density or
diffusion factor have effects ? No
R32 is not safety side due to
small molecular weight
Factor included in safety factor Factor not included in safety factor
Table 8-20 Ignition probability during each work stage
Installationcase
Ignition probability A
Installation Repairing Disposal
RefrigerantAllowableprobability
Without meas.
With meas.
Without meas.
With meas.
Without meas.
With meas.
Out-door
Semi-underground
R32
1.0×10⁻⁸
1.1×10⁻⁸ 1.9×10⁻⁹ 3.6×10⁻⁷ 2.1×10⁻⁹ 4.2×10⁻⁸ 6.1×10⁻¹⁰
R1234yf 1.1×10⁻⁸ 3.1×10⁻⁹ 5.1×10⁻⁷ 2.9×10⁻⁹ 4.6×10⁻⁸ 8.2×10⁻¹⁰
Machineryroom
R32 1.1×10⁻⁸ 2.1×10⁻⁹ 8.6×10⁻⁷ 5.4×10⁻⁹ 4.6×10⁻⁸ 8.7×10⁻¹⁰
R1234yf - - 1.3×10⁻⁶ 7.7×10⁻⁹ 5.2×10⁻⁸ 1.3×10⁻⁹
Not allowable AllowableIn each installation cases [time/(unit・year)]
- 218 -
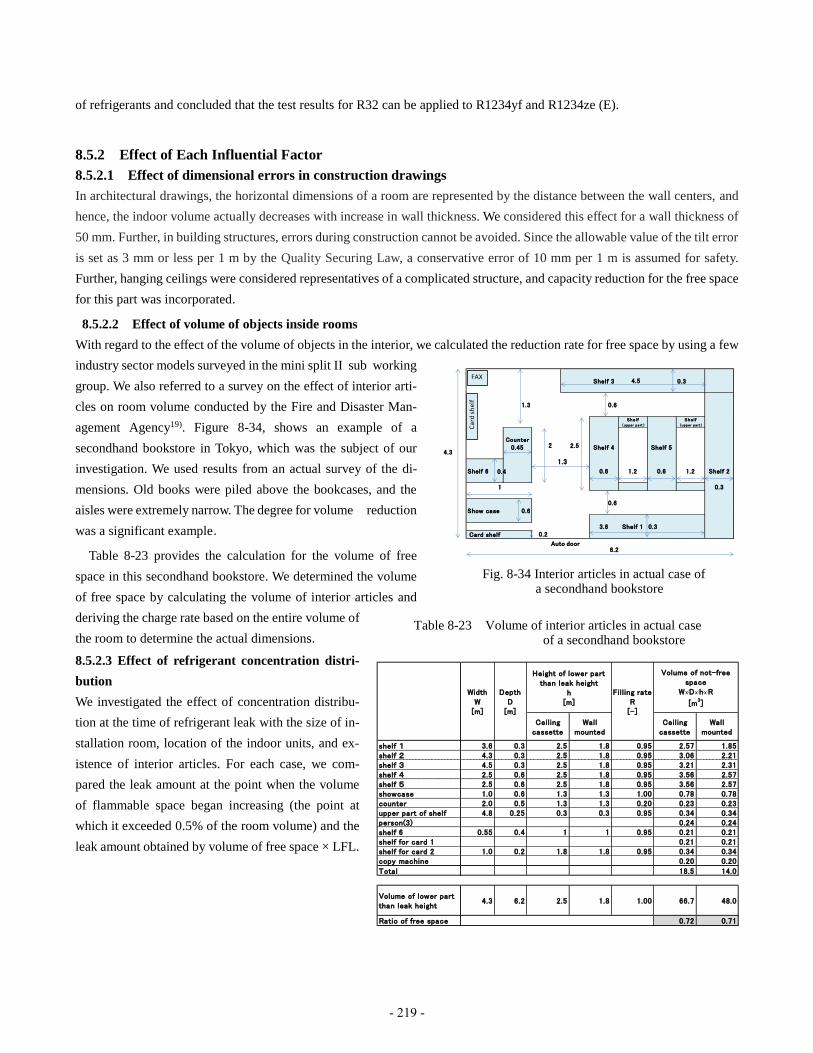
of refrigerants and concluded that the test results for R32 can be applied to R1234yf and R1234ze (E).
8.5.2 Effect of Each Influential Factor
8.5.2.1 Effect of dimensional errors in construction drawings
In architectural drawings, the horizontal dimensions of a room are represented by the distance between the wall centers, and
hence, the indoor volume actually decreases with increase in wall thickness. We considered this effect for a wall thickness of
50 mm. Further, in building structures, errors during construction cannot be avoided. Since the allowable value of the tilt error
is set as 3 mm or less per 1 m by the Quality Securing Law, a conservative error of 10 mm per 1 m is assumed for safety.
Further, hanging ceilings were considered representatives of a complicated structure, and capacity reduction for the free space
for this part was incorporated.
8.5.2.2 Effect of volume of objects inside rooms
With regard to the effect of the volume of objects in the interior, we calculated the reduction rate for free space by using a few
industry sector models surveyed in the mini split II sub working
group. We also referred to a survey on the effect of interior arti-
cles on room volume conducted by the Fire and Disaster Man-
agement Agency19). Figure 8-34, shows an example of a
secondhand bookstore in Tokyo, which was the subject of our
investigation. We used results from an actual survey of the di-
mensions. Old books were piled above the bookcases, and the
aisles were extremely narrow. The degree for volume reduction
was a significant example.
Table 8-23 provides the calculation for the volume of free
space in this secondhand bookstore. We determined the volume
of free space by calculating the volume of interior articles and
deriving the charge rate based on the entire volume of
the room to determine the actual dimensions.
8.5.2.3 Effect of refrigerant concentration distri-
bution
We investigated the effect of concentration distribu-
tion at the time of refrigerant leak with the size of in-
stallation room, location of the indoor units, and ex-
istence of interior articles. For each case, we com-
pared the leak amount at the point when the volume
of flammable space began increasing (the point at
which it exceeded 0.5% of the room volume) and the
leak amount obtained by volume of free space × LFL.
Fig. 8-34 Interior articles in actual case of a secondhand bookstore
Shelf 3 0.3
1.3 0.6
She lf (upper pa rt )
She lf (upper pa rt )
Counter
0.45 Shelf 4 Shelf 5
Shelf 6 0.6 1.2 0.6 1.2 Shelf 2
1 0.3
0.6Show case 0.6
3.6 Shelf 1 0.3Card shelf
FAX
1.3
2.52
0.2
0.4
4.3
6.2Auto door
4.5
Car
d s
hel
f
Table 8-23 Volume of interior articles in actual case of a secondhand bookstore
Ceilingcassette
Wallmounted
Ceilingcassette
Wallmounted
shelf 1 3.6 0.3 2.5 1.8 0.95 2.57 1.85shelf 2 4.3 0.3 2.5 1.8 0.95 3.06 2.21shelf 3 4.5 0.3 2.5 1.8 0.95 3.21 2.31shelf 4 2.5 0.6 2.5 1.8 0.95 3.56 2.57shelf 5 2.5 0.6 2.5 1.8 0.95 3.56 2.57showcase 1.0 0.6 1.3 1.3 1.00 0.78 0.78counter 2.0 0.5 1.3 1.3 0.20 0.23 0.23upper part of shelf 4.8 0.25 0.3 0.3 0.95 0.34 0.34person(3) 0.24 0.24shelf 6 0.55 0.4 1 1 0.95 0.21 0.21shelf for card 1 0.21 0.21shelf for card 2 1.0 0.2 1.8 1.8 0.95 0.34 0.34copy machine 0.20 0.20
Total 18.5 14.0
Volume of lower partthan leak height
4.3 6.2 2.5 1.8 1.00 66.7 48.0
Ratio of free space 0.72 0.71
Filling rateR
[-]
Volume of not-freespace
W*D*h*R
[m3]
WidthW
[m]
DepthD
[m]
Height of lower partthan leak height
h[m]
x x x
- 219 -

For model calculation, we used an ultra-small confer-
ence room model shown in Fig. 8-35 with a small con-
ference room as shown in Fig. 8-5. We considered a
leakage rate of 10 kg/h with no ventilation. In Fig. 8-36,
we show the time changes in the volume of the flamma-
ble space in the small conference room. The results were
obtained without any objects in the room. We also ana-
lyzed the case in which objects such as desks and
screens were added separately. It was confirmed that the
influence of interior objects on the critical fill-
ing rate ratio could be neglected when consid-
ering the reduction in the free space volume
caused by these objects items.
For example, see Fig. 8-36. The refrigerant
charge amount for a large flammable space is
29.2 kg (=10 kg/h × 175 min/60 min), and the
critical change ratio is 0.87 (=29.2 kg/(room
volume of 109.6 m3 × LFL 0.307 kg/m3) .
A summary for the critical charge ratio is
presented in Table 8-24. The degree of influ-
ence of room size and the indoor unit installa-
tion location was approximately 5%.
8.5.3 Summary for the Safety Factor
in Worst-Case Scenarios
The effect of the volume of interior articles is presented in Table 8-25. It was investigated using the survey results of the Fire
2.2m
Leak port(Velocity boundary )
Outlet(Pressure Boundary)
Fig. 8-35 CFD model (the smallest meeting room)
0
25
50
75
100
125
0
25
50
75
100
125
0 40 80 120 160 200 240 280 320 360
1/4LFL-100%
LFL-UFL
Rising up of flammable volume(0.5% of room volume)= 175min
Time [min]
Volu
me (
LFL-U
FL)[
m3]
Fig. 8-36 Rising up of flammable volume
Indoor unitRoom size
W[m]×D[m]×H[m]
Critical charge
ratio *1)
1 Small office
Ceiling mouted
cassette
(center of room)
6.37×6.37×2.7 0.87
2 Smallest officeCeiling suspended
(center of room)3.3×3.3×2.2 0.86
3 Smallest office
Ceiling mouted
cassette
(corner of room)
3.3×3.3×2.2 0.83
*1) Leak amount which generates flammable space (0.5% of room)/
{Room volume×LFL(=0.307[kg/m3])}
Installation case
Table 8-24 Summary of critical charge ratio
Table 8-25 Critical safety factors based on statistical data
for volume of interior article
All volume of
article
decrease free
volume *1)
Half volume
of article
decrease free
volume *2)
Remarks
①Thickness of wall, floor
and ceiling0.948 0.948
Thickness is 0.05m, Room size is 3.3mx3.3mx2.2m,
(3.3-0.05)x(3.3-0.05)x(2.2-
0.05)/(3.3x3.3x2.2)=22.71/23.96=0.948
②Errors in construction 0.970 0.970Error is 10mm per 1m, as allowable decline is
3/1000 by housing quality security acceleration act.
③Volume of pillars 0.9975 0.9975Width of pillar is 0.22m, wall thickness is 0.05m,
then volume of 4 pillars at each corners is 0.25% of
room.
④Errors due to compli-
cated shape of room0.984 0.984
Volume of falling ceiling is 0.3x0.4x3.2=0.384m3,
compared to volume of room, (23.96-
0.384)/23.96=0.984
①x②x③x④ 0.903 0.903
Volume of
interior article
⑤Decrease in free volume
due to interior article0.763 0.882
3σ value of statistical distribution of volume rate of
interior article is 0.237. Free volume ratio is 1-0.237
in case of *1)
, it is 1-0.237/2 in case of *2)
.
⑥Distribution by gas leak 0.83 0.83It follows critical charge ration of No.3 in Table
8.5.4.
⑦Distribution by liquid
leak1.00 1.00
It is clarified that leaked liquid mist evaporates
inside casing or through air filter of indoor unit.
Criticale safety
factor①x②x③x④x⑤x⑥x⑦ 0.57 0.66
Influential factors
Concentration
distribution of
leaked gas
Err
ors
in f
acil
ity
des
ign
d
raw
ings
- 220 -

and Disaster Management Agency19). For the volume
of interior articles, we considered a standard devia-
tion of 3. In addition, with regard to the charge rate,
we considered two types: all volume of articles de-
crease free volume, and half volume of articles de-
crease free volume. In both cases, flammable spaces
were not created even when the safety factor was 1/2.
That approach is expressed in the table related to con-
struction drawing errors mentioned in section 8.5.2.1.
The critical safety factors for which flammable
spaces are not generated in worst-case scenarios for
each industry type are shown in Fig. 8-37. The hori-
zontal axis represents the ceiling cassette model and
the vertical axis represents the wall-mounted model.
For both models, the critical safety factor is ≥0.5.
8.6 Overall Summary and Future Issues
We performed a risk assessment for VRF systems employing mildly flammable refrigerant, R32, that has less impact on global
warming. We calculated the ignition probability for the most severe installation cases for indoor and outdoor use, installation,
repair, and disposal. We determined the refrigerant leakage rate and probability of generating a rapid leak by considering the
comments of customers and service personnel and through bore-diameter investigation for leak product samples and rapid
leaks. For cases in which the ignition probability without any measures exceeds the allowance, we proposed safety measures
to reduce the frequency of an accident to once in 100 years. In the future, we will attempt to organize these safety measures
as JRAIA safety standards.
Furthermore, we performed a detailed investigation of the safety factor for mildly flammable refrigerants to determine the
amount of refrigerant charge for which safety measures are not necessary. Except in the case of a floor-standing machine
wherein the refrigerant is localized or an indoor unit mounted with an indoor compressor that may cause leakage when the
piping breaks because of vibration, the safety factor was sufficient even when halved. Against the background of the move-
ment for regulatory reforms, in which our country is currently making progress, we have achieved progress in the revision of
refrigeration safety regulations that should facilitate the actual use of even flammable refrigerants. However, a careful study
and discussion should be conducted with regard to the easing of regulations. Furthermore, the proposed safety factor differs
from the international safety standards. In the future, we wish to conduct activities to recognize the safety factor from a mid-
term perspective.
References
8-1) Yao et al., Risk Assessment of Room Air Conditioner using R290, International Symposium on Environment and
Alternative Refrigerants, 2000, Kobe,pp.184.
8-2) Goetzler et al., Risk Assessment of HFC-32 and HFC-32/134a(30/70wt%) in Split System Residential Heat Pumps,
Fig. 8-37 Critical safety factors for most severe cases
0.40
0.50
0.60
0.70
0.80
0.40 0.50 0.60 0.70 0.80C
riti
cal
safe
ty f
acto
rs i
n w
all
mounte
d u
nit
Critical safety factor in ceiling mounted cassette unit
Office
Statistical data by
Tokyo fire department *19)
PubSecond-hand book seller
Archive
Locker room
Karaoke
Pro
po
sed
saf
ety f
acto
r
Statistical data by
Tokyo fire department *19)
Proposed safety factor
◆ in case of all volume of interior
equipment decreases free volume.
◆ in case of half volume of interior
equipment decreases free volume.
- 221 -

ARTI MCLR Project, 1998.
8-3) Takizawa, JSRAE, Progress Report (Eng.), 2013, pp.35.
8-4) Imamura, JSRAE, Progress Report (Eng.), 2013, pp.48.
8-5) Okamoto, JSRAE, Progress Report (Eng.), 2012 pp.24.
8-6) Mukaidono, Concept of Safety, Trends in Academic, Sep. 2009, pp.14.
8-7) Osaka Univ. Mech. Eng., Rinkai Ryu, Lecture Note, 2006, pp6.
8-8) ISO5149: Refrigerating systems and heat pumps – Safety and environmental requirements (2014) .
Part 1) Definitions, classification and selection criteria.
Part 2) Design, construction, testing, marking and documentation.
Part 3) Installation site.
Part 4) Operation, maintenance, repair and recovery.
8-9) Hashimoto, Japan Ergonomics, Japan Industrial Safety & Health Association, 1988.
8-10) Suzuki et al., Quality Control, Union of Japanese Scientists and Engineers, 2001, No.9.
8-11) Building Standards Act, Article 28.
8-12) Building Standards Act, Order for Enforcement, Article 20, 2.
8-13) Public Buildings Association, Design Criteria for Building Facility Compiled by MLIT, 2006.
8-14) Better Living, Ventilation Equipment Manual, 2003, pp.17.
8-15) Hihara, JSRAE, Progress Report (Eng.), 2012, pp13.
8-16) JRAIA, Guideline of design construction for ensuring safety against refrigerant leakage from multi-split system air
conditioners, JRA GL-13.
8-17) Kitajima, Actual Survey on the Air Environment at Various Numbers of People in Karaoke Rooms, Shibaura Institute
of Technology, 2011.
8-18) Nomura, Actual Survey of the Air Environment of 20 Karaoke Box Stores in Tokyo, Shibaura Institute of Technology,
2011.
8-19) Morijiri et al., Study of fire characteristics in a standard room, Report of fire technology and safety laboratory, Tokyo
Fire Department, No.39, pp.1, 2012
- 222 -
1
9. Risk Assessment for Chiller Units
9.1 Introduction
The heat source systems supplying hot or cold water to central air-conditioning systems use hydrofluorocarbon
refrigerants such as R134a and R410A. Both refrigerants have high global warming potentials (GWP) exceeding 1,000,
thereby contributing to climate change. Low-GWP alternatives including R1234ze (E), R1234yf, and R32 are receiving
significant attention. Since all of these low-GWP refrigerants are mildly flammable, risk assessments (RAs) must be
performed to eliminate the unallowable risk. RAs9-1),9-2),9-3) for fires and burns in chiller systems which use these mildly
flammable refrigerants have been undertaken by Japan Society of Refrigerating and Air Conditioning Engineers since
2011. The objects of research of this study include water-cooled chillers installed in machine rooms and air-cooled heat
pumps installed outdoors with a cooling capacity ranging from more than or equal 7.5 kW9-4). Mobile chilling
equipment that cannot be permanently installed is excluded.
9.2 Prerequisites for Risk Assessments
Chillers for RAs have the same structures, constitutions and safety devices as conventional equipment using
non-flammable refrigerants, thus the same specifications and standards9-5),9-6) are applied. Therefore, the RAs and safety
design9-7),9-8), which are applied to the leakage assessment of non-flammable refrigerants, are regarded as being
applicable to this study. Fault Tree Analysis (FTA), which can explain the upper and lower order of each event and the
logical connection relationship, is used as the calculation method for the probability of refrigerant leakage.
Refrigerant leakage accidents from chillers must be reported in accordance with the High Pressure Gas Safety Law,
which provides statistical data9-9) on leakages from the similar equipment models. The probability of refrigerant leakage
in an RA is determined based on the actual accident data.
Refrigerants such as R1234ze (E),R1234yf, and R32 have a higher lower-flammable-limit (LFL) and require a
greater minimum ignition energy level than that of the well-known flammable gas R290. More specifically, these
refrigerants are less flammable; hence, they are difficult to ignite since more gas is required to form a combustible zone.
Using CFD methodology, the environment conditions for installed equipment and the scale of formed combustible
space can be evaluated quantitatively by calculating the level of the combustible space as well as its existence time.
In addition, attention was focused on the handling of combustion characteristics of the refrigerant, the ignition source,
and the combustible space analysis. The results are organized in consistency with those for RAs for mini-split air
conditioners and multi-packaged air-conditioning systems.
9.2.1 Features and tasks for the chiller
This section describes the features and challenges for the chillers from the point of view of a leakage accident. The
chiller is a heat source system that provides cold or hot water as the heat transfer medium; therefore, it is suitable for
large-capacity equipment. Thus,a large amount of refrigerant is charged into the system. Typically, a chiller is located
in the machine room meaning the refrigerant is also maintained in a confined space. The procedure installing a chiller
should be performed to ensure no leakage of refrigerant occurs. For the small- or medium-capacity chiller, air tightness
tests will be conducted and the refrigerant will be charged before being shipped. A large-capacity chiller, such as a
centrifugal water-chilling unit, is normally shipped as a unit from the factory, and is then installed before the
completion of air tightness tests and charging of refrigerant. Those units that are disassembled at the time of shipment
and reassembled in the installation site using flanges and joints are charged with refrigerant after reassembling and the
completion of the air tightness tests. This assembly process does not require brazing or welding, however, all the units
should be assembled by trained professional engineers in the same manner as the manufacturer. In addition, periodic
- 223 -

inspections should be implemented to prevent the possibility of refrigerant leakage after installation.
The chiller location is usually in the machine room or outdoors such as on a roof. Both of these areas are limited
areas where people are restricted from accessing. Generally, only trained specialists can access the chiller to conduct
operational checks and for maintenance. Therefore, the installation location is isolated and free from risks, which might
be caused by unspecified individuals. In addition, the machine room or the outdoor area is far away from other rooms
that can be accessed by the public. Based on the risks mentioned above, the possible risks and actions from the RAs are
limited while the countermeasures for avoiding or reducing risks should be clear and effective. However, since other
machinery and electric equipment might also be arranged in the machine room, these potential risks must be taken into
consideration.
9.2.2 Risk assessment procedure
(a) Steps
Risk assessments are conducted according to the process described in the Guide within IEC 519-1) as follows:
1) Start-up
・The basic specifications of the chiller used to develop the RAs are defined according to the application, cooling
capacity, structure, and installation location.
・Select the appropriate RAs.
・Set the life stage (LS) for the RAs.
2) Clarification of usage purpose
・With the given installation locations and usage, clarify the normal situation, safe situation, abnormal situation,
and risks.
3) Survey of risk
・Analyze the factors that possibly lead to abnormality and risks and determine which are risk sources.
4) Estimate of risks
・Estimate the severity of harm due to the risks in each LS including the probability of those accidents.
5) Risk Assessment
・Comprehensively assess the severity of accidents by the probability of the accidents and severity.
6) Judgment of risk assessment
・If the unallowable risks are excluded, the RAs are complete.
・If the severity is not allowable, repeat Steps 2–5 after examining the measure of the risk reduction.
7) Risk reduction
・Take the safety measure to reduce the probability and severity.
8) Determination of safety measures
・Confirm the requirements for completion and determine the safety measure.
Since this RA is conducted based on a mildly flammable refrigerant, its features include the probability of existence
of an ignition source and of refrigerant leakage forming a flammable area. FTA was used to identify the existence of an
ignition source, refrigerant leakage and their relationship. The probability of the ignition source and the refrigerant
leakage as well as the resulting probability of burns and fires can be derived by the space–time product when the
leakage occurs. These investigated cases are considered as independent events, and the probabilities are summed to
show the annual probability of accidents per unit.
RA is generally known as the application of FTA, ETA, and FMEA. In this study, FTA was applied to the case of
risk due to the co-existence of the independent events termed “existence of an ignition source” and “formed
combustible zone”, thereby providing for straightforward calculation of the probabilities. The concept of the risk map is
utilized as a reference for comprehensively determining the safeness of a risk assessment.
On the other hand, the accident data was used for the calculation of the possibility of refrigerant leakage due to the
- 224 -
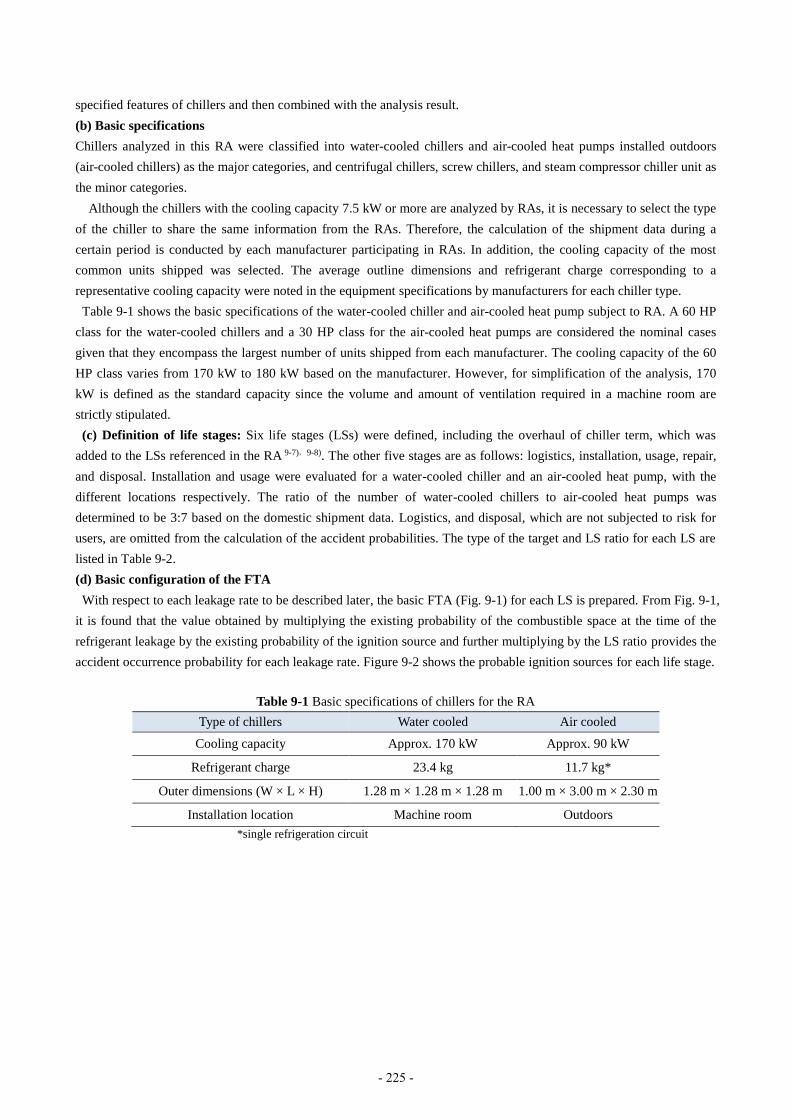
specified features of chillers and then combined with the analysis result.
(b) Basic specifications
Chillers analyzed in this RA were classified into water-cooled chillers and air-cooled heat pumps installed outdoors
(air-cooled chillers) as the major categories, and centrifugal chillers, screw chillers, and steam compressor chiller unit as
the minor categories.
Although the chillers with the cooling capacity 7.5 kW or more are analyzed by RAs, it is necessary to select the type
of the chiller to share the same information from the RAs. Therefore, the calculation of the shipment data during a
certain period is conducted by each manufacturer participating in RAs. In addition, the cooling capacity of the most
common units shipped was selected. The average outline dimensions and refrigerant charge corresponding to a
representative cooling capacity were noted in the equipment specifications by manufacturers for each chiller type.
Table 9-1 shows the basic specifications of the water-cooled chiller and air-cooled heat pump subject to RA. A 60 HP
class for the water-cooled chillers and a 30 HP class for the air-cooled heat pumps are considered the nominal cases
given that they encompass the largest number of units shipped from each manufacturer. The cooling capacity of the 60
HP class varies from 170 kW to 180 kW based on the manufacturer. However, for simplification of the analysis, 170
kW is defined as the standard capacity since the volume and amount of ventilation required in a machine room are
strictly stipulated.
(c) Definition of life stages: Six life stages (LSs) were defined, including the overhaul of chiller term, which was
added to the LSs referenced in the RA 9-7),9-8). The other five stages are as follows: logistics, installation, usage, repair,
and disposal. Installation and usage were evaluated for a water-cooled chiller and an air-cooled heat pump, with the
different locations respectively. The ratio of the number of water-cooled chillers to air-cooled heat pumps was
determined to be 3:7 based on the domestic shipment data. Logistics, and disposal, which are not subjected to risk for
users, are omitted from the calculation of the accident probabilities. The type of the target and LS ratio for each LS are
listed in Table 9-2.
(d) Basic configuration of the FTA
With respect to each leakage rate to be described later, the basic FTA (Fig. 9-1) for each LS is prepared. From Fig. 9-1,
it is found that the value obtained by multiplying the existing probability of the combustible space at the time of the
refrigerant leakage by the existing probability of the ignition source and further multiplying by the LS ratio provides the
accident occurrence probability for each leakage rate. Figure 9-2 shows the probable ignition sources for each life stage.
Table 9-1 Basic specifications of chillers for the RA
Type of chillers Water cooled Air cooled
Cooling capacity Approx. 170 kW Approx. 90 kW
Refrigerant charge 23.4 kg 11.7 kg*
Outer dimensions (W × L × H) 1.28 m × 1.28 m × 1.28 m 1.00 m × 3.00 m × 2.30 m
Installation location Machine room Outdoors
*single refrigeration circuit
- 225 -
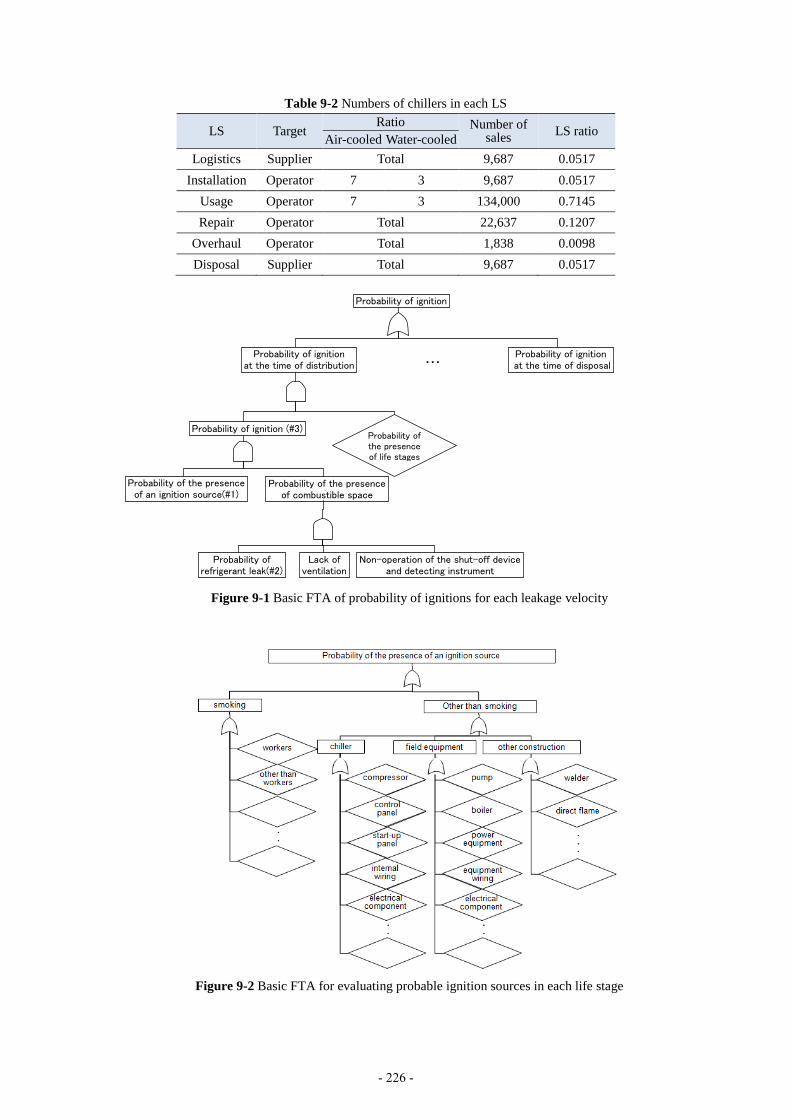
Table 9-2 Numbers of chillers in each LS
LS Target Ratio Number of
sales LS ratio
Air-cooled Water-cooled
Logistics Supplier Total 9,687 0.0517
Installation Operator 7 3 9,687 0.0517
Usage Operator 7 3 134,000 0.7145
Repair Operator Total 22,637 0.1207
Overhaul Operator Total 1,838 0.0098
Disposal Supplier Total 9,687 0.0517
Figure 9-1 Basic FTA of probability of ignitions for each leakage velocity
Figure 9-2 Basic FTA for evaluating probable ignition sources in each life stage
Probability of ignition
Probability ofthe presenceof life stages
Probability of ignitionat the time of distribution
Probability of ignition at the time of disposal
Probability of ignition (#3)
Probability of the presenceof an ignition source(#1)
Probability ofrefrigerant leak(#2)
・・・
Probability of the presenceof combustible space
Lack ofventilation
Non-operation of the shut-off deviceand detecting instrument
- 226 -
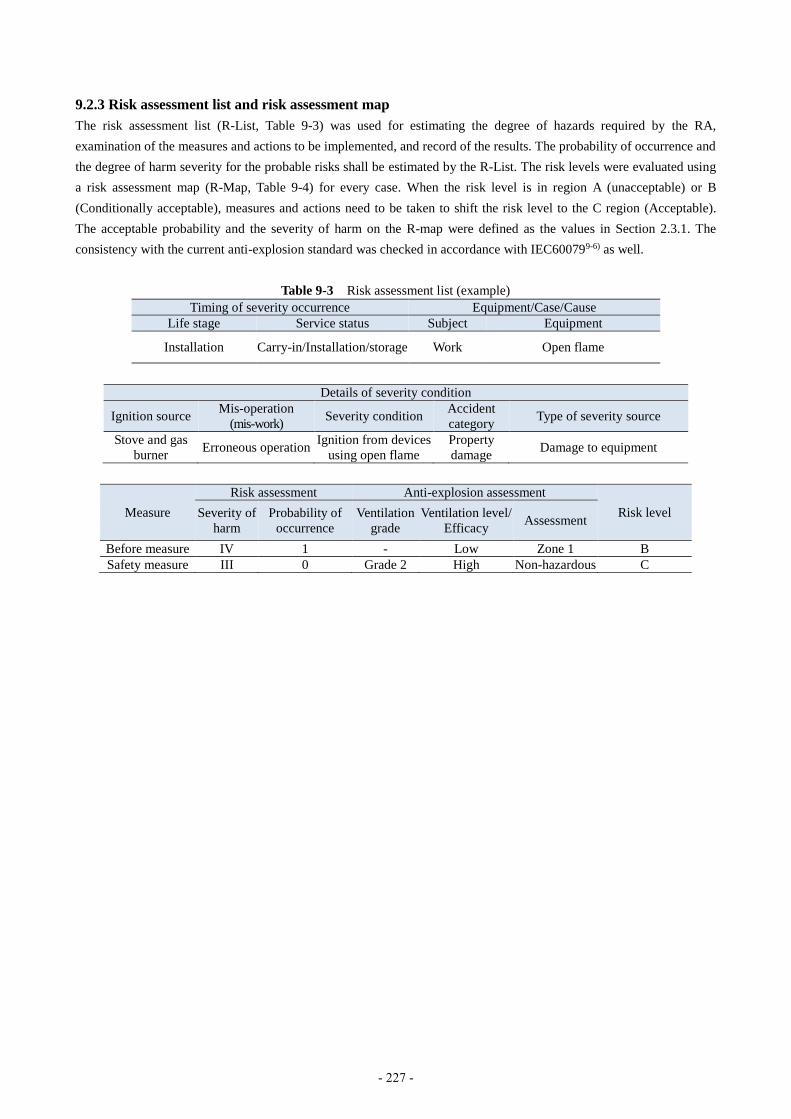
9.2.3 Risk assessment list and risk assessment map
The risk assessment list (R-List, Table 9-3) was used for estimating the degree of hazards required by the RA,
examination of the measures and actions to be implemented, and record of the results. The probability of occurrence and
the degree of harm severity for the probable risks shall be estimated by the R-List. The risk levels were evaluated using
a risk assessment map (R-Map, Table 9-4) for every case. When the risk level is in region A (unacceptable) or B
(Conditionally acceptable), measures and actions need to be taken to shift the risk level to the C region (Acceptable).
The acceptable probability and the severity of harm on the R-map were defined as the values in Section 2.3.1. The
consistency with the current anti-explosion standard was checked in accordance with IEC600799-6) as well.
Table 9-3 Risk assessment list (example) Timing of severity occurrence Equipment/Case/Cause
Life stage Service status Subject Equipment
Installation Carry-in/Installation/storage Work Open flame
Details of severity condition
Ignition source Mis-operation
(mis-work) Severity condition
Accident
category Type of severity source
Stove and gas
burner Erroneous operation
Ignition from devices
using open flame
Property
damage Damage to equipment
Measure
Risk assessment Anti-explosion assessment
Risk level Severity of
harm
Probability of
occurrence
Ventilation
grade
Ventilation level/
Efficacy Assessment
Before measure IV 1 - Low Zone 1 B
Safety measure III 0 Grade 2 High Non-hazardous C
- 227 -

Table 9-4 Risk assessment map9-3)
Reference data from HB Chiller market
(for risk assessment)
Risk region Probability of hazard
cases/(unit-yr)
Frequency
of hazard cases/(unit-yr)
Probability
of hazard cases/(unit-yr)
5
Frequent
Consumer goods:10-3, Industrial products:10-1
1 out of 10 units once every year
1.0×10⁻¹ 13 24 27 29 30
4
Probable
Consumer goods:10-4,
Industrial products:10-2
1 out of 100 units once every year
1.0×10⁻² 12 20 23 26 28
3 Occasional
Consumer goods:10-5,
Industrial products:10-3
134 times once every
year 1.1×10⁻³ 10 16 19 22 25
2 Remote
Consumer goods:10-6,
Industrial products:10-4
14 times
once every year 1.1×10⁻⁴ 6 9 15 18 21
1 Improbable
Consumer goods:10-7,
Industrial products:10-5
1 to 2 times once
every year 7.5×10⁻⁶ 3 4 8 14 17
0
Incredible
Consumer goods:10-8, Industrial products:10-6
1 to 2 times once
every 10 years
7.5×10⁻⁷ 1 2 5 7 11
R-map
(ISO/IEC Guide 51) (JIS Z 8051)
0 Ⅰ Ⅱ Ⅲ Ⅳ
None (No injury)
Negligible (Smoke
generation of
product・Scart)
Marginal (Fire and
ignition of
product・Mild
impairment)
Critical
(Fire・Serious
injury
Catastrophic (Death,
Permanent
fault, Fire (Fire of
building))
Severity of harm →
(a) Acceptable probability of occurrence
The domestic market stock for water-cooled chillers and air-cooled heat pumps in Japan is approximately 134,000 units,
according to the Japan Refrigeration and Air Conditioning Industry Association (JRAIA) shipment statistics (as of
2011). The probability of the occurrence is described in the risk assessment handbook published by the Ministry of
Economy, Trade and Industry9-3) (HB). For units in industrial and commercial applications, the acceptable probability of
occurrence is 1.0 × 10⁻⁶ cases or fewer/(unit∙year) in the market. Given the scale of chillers, this corresponds to a
frequency of occurrence of 7.5 × 10⁻⁷ cases/(unit∙year).
(b) Severity of harm
The severity of harm is evaluated based on the definition of fires and burns in the HB. However, the fires and burns are
not categorized by the severity of harm from the ignition of mildly flammable refrigerant.
9.3 Probable Existence of Flammable Space for Refrigerant Leak
When the refrigerant leaks, the level of diffusion into the air should be analyzed. Additionally, the probability of the
flammable space can be calculated from the combustible zone space and time duration of the leak. In addition, the time
required for the mechanical ventilation to evacuate the combustible space was calculated.
A region:25–30
Intolerable
B region:14–24
Acceptable (If the risk is as low as
reasonably practicable)
C region:1–13
Acceptable
- 228 -

9.3.1 Analysis model
(a) Machine room: A machine room in which a water-cooled chiller is installed should be provided with a specified
amount of ventilation, and fire facilities should be installed in accordance with the technical standards9-10),9-11),9-12) for
each model. The average floor area for a machine room for a specific chiller volume was determined by the research
lists for completed facilities produced by the Journal of Heating and Air-Conditioning Sanitary Engineering
(2007–2010) (Fig. 9-3). The straight line shows the approximation of the average floor area for each chiller capacity.
The floor area was 21.8 m2 for the standard capacity 170 kW chiller (Table 9-1), the height of the machine room was 5
m and the volume was 109 m3. Also, although not shown in detail, the minimum volume in the machine room was 75
m3. The shape of the machine room floor was rectangular (1:2). The chiller was assumed to be installed on half of the
floor in the longitudinal direction, while the auxiliaries were installed on the other half.
The required maintenance space is at least 1.2 m in front of the control panel and 1.0 m at the other sides (Fig. 9-4). The
air supply and exhaust louver area were determined by referring to the Mechanical Equipment Construction Edition 9-13)
of the Kagoshima prefectural building standards. To discharge the refrigerant, which is heavier than air, an air supply
port was installed on the ceiling right above the body of the equipment and an exhaust port was on the lower part of the
wall at the back of the equipment. The opening ratios and the air velocities at the air supply port and exhaust port inlet
were set to 0.7 (2.0 m/s), and 0.3 (4.0 m/s), respectively. Those areas were adjusted according to the ventilation
conditions.
It was assumed that a refrigerant leakage point is located 0.15 m (including legs) from the floor, which is the lowest
part of the equipment. The shape of the leak point was assumed to be a round pipe of 0.10 m in length. It was also
assumed that the machine room was 15 m underground and refrigerant was exhausted through a chimney extended from
an exhaust port to the ground.
Figure 9-3 Relationship between machine room area and chiller capacity
(b) Outdoors: In general, an air-cooled heat pump installed outdoors (such as on a roof) without any surrounding
walls results in little chance to forming a flammable space due to the free-flowing air. A situation where air is subject to
stagnation can develop when the chiller is surrounded by soundproof walls. Based on the soundproofing installation
procedure described by the manufacturer, an analysis model with four walls, two plain and two with an aperture ratio of
25 %, is assumed (Fig. 9-5). Two cases of the refrigerant leakage are assumed. The refrigerant leaks from the air-heat
exchanger to the wall (1) and from the two clearances of panels on the bottom of body (2 m × 0.01 m) (2) inside the
decorative panel of the unit (Fig. 9-5).
0
500
1000
1500
2000
0 2500 5000 7500 10000
Machin
e r
oom
are
a[m
2/k
W]
Capacity[kW]
Centrifugal Chiller
Screw Chiller
Air-cooled Chiller
Water-cooled Chiller
Absorption Chiller
averagey=0.128x
- 229 -
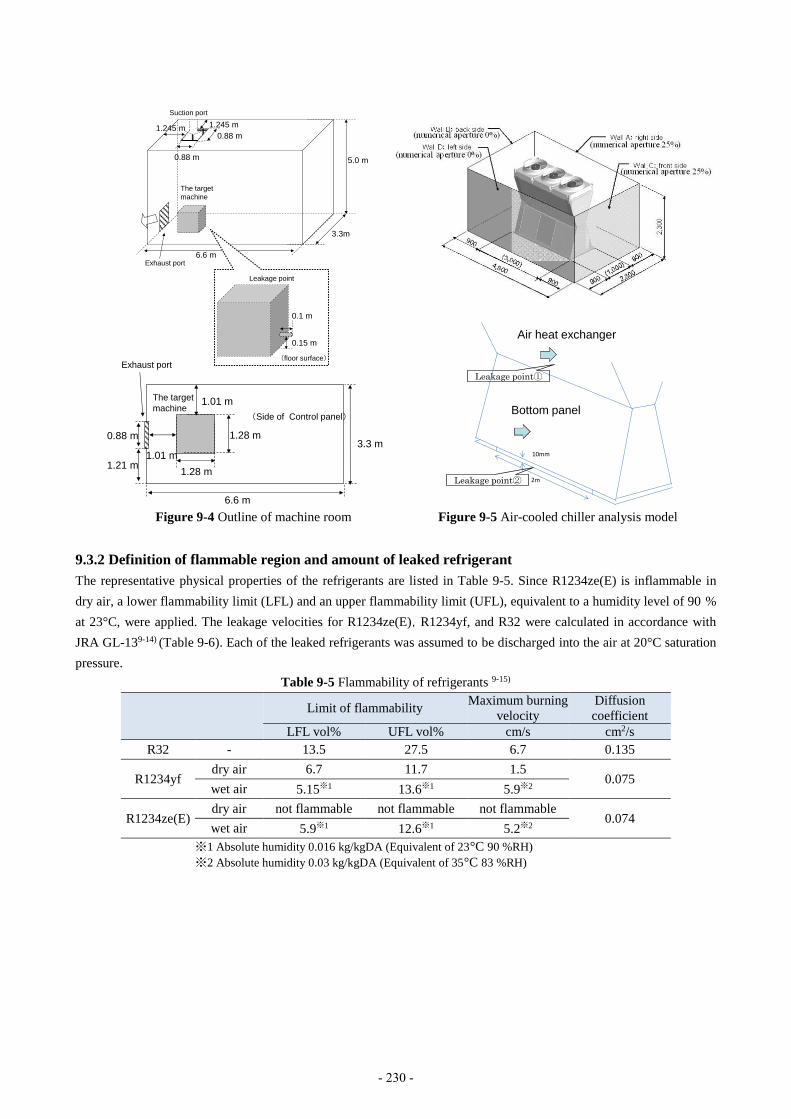
Figure 9-4 Outline of machine room Figure 9-5 Air-cooled chiller analysis model
9.3.2 Definition of flammable region and amount of leaked refrigerant
The representative physical properties of the refrigerants are listed in Table 9-5. Since R1234ze(E) is inflammable in
dry air, a lower flammability limit (LFL) and an upper flammability limit (UFL), equivalent to a humidity level of 90 %
at 23°C, were applied. The leakage velocities for R1234ze(E),R1234yf, and R32 were calculated in accordance with
JRA GL-139-14) (Table 9-6). Each of the leaked refrigerants was assumed to be discharged into the air at 20°C saturation
pressure.
Table 9-5 Flammability of refrigerants 9-15)
Limit of flammability
Maximum burning
velocity
Diffusion
coefficient
LFL vol% UFL vol% cm/s cm2/s
R32 - 13.5 27.5 6.7 0.135
R1234yf dry air 6.7 11.7 1.5
0.075 wet air 5.15※1 13.6※1 5.9※2
R1234ze(E) dry air not flammable not flammable not flammable
0.074 wet air 5.9※1 12.6※1 5.2※2
※1 Absolute humidity 0.016 kg/kgDA (Equivalent of 23°C 90 %RH)
※2 Absolute humidity 0.03 kg/kgDA (Equivalent of 35°C 83 %RH)
6.6 m
5.0 m
The target
machine
3.3m
Suction port
Exhaust port
1.245 m 1.245 m
0.88 m
0.88 m
(floor surface)
0.15 m
0.1 m
Leakage point
6.6 m
1.01 m
1.01 m
1.28 m
The target
machine
1.28 m
3.3 m
(Side of Control panel)
Exhaust port
0.88 m
1.21 m
2m
10mm
空気熱交換器面
下部パネル面
Leakage point①
Air heat exchanger
Bottom panel
Leakage point②
- 230 -

Table 9-6 Flow rate of leak
Slow leak Rapid leak Burst leak
R32 1 kg/h※1 or less 10 kg/h 75※1 or 200 kg/h
R1234yf 0.9 kg/h※1 or less 8.9 kg/h 67※1 or 178 kg/h
R1234ze(E) 0.7 kg/h※1 or less 7.3 kg/h 54※1 or 145 kg/h
Location Pinhole, Welded part,
Brazed part, Cauterized part
Cracking flare, Flare-welded
part, Flare fitting joint,
Cauterized part
Slip-out from flare fitting joint,
Pipe fitting
※1 Analysis condition
9.3.3 Calculation method and conditions
Table 9-7 Leakage scenarios 9-14)
Case
no.Refrigerant
Charged
amount
Room
volume
Leakage
velocity
Ventilation
(Airflow)Air vent
1 R32 23.4 kg 109 m3 10 kg/h 0 m
3/h present
2 (rapid leakage) 218 m3/h present
3 436 m3/h present
4 75 kg/h 0 m3/h present
5 (burst leakage) 218 m3/h present
6 436 m3/h present
7 75 m3 10 kg/h 0 m
3/h present
8 (rapid leakage) 150 m3/h present
9 300 m3/h present
10 75 kg/h 0 m3/h present
11 (burst leakage) 150 m3/h present
12 300 m3/h present
13 R1234ze(E) 23.4 kg 109 m3 7 kg/h 0 m
3/h present
14 (rapid leakage) 218 m3/h present
15 436 m3/h present
16 54 kg/h 0 m3/h present
17 (burst leakage) 218 m3/h present
18 436 m3/h present
19 75 m3 7 kg/h 0 m
3/h present
20 (rapid leakage) 150 m3/h present
21 300 m3/h present
22 54 kg/h 0 m3/h present
23 (burst leakage) 150 m3/h present
24 300 m3/h present
25 R32 11.7 kg 31 m3 10 kg/h (0 m/s) (outdoor)
26 (rapid leakage) (0.5 m/s) (outdoor)
27 75 kg/h (0 m/s) (outdoor)
28 (burst leakage) (0.5 m/s) (outdoor)
29 10 kg/h (0 m/s) (outdoor)
30 (rapid leakage from bottom apertures) (0.5 m/s) (outdoor)
31 75 kg/h (0 m/s) (outdoor)
32 (burst leakage from bottom apertures) (0.5 m/s) (outdoor)
33 R1234ze(E) 11.7 kg 31 m3 7 kg/h (0 m/s) (outdoor)
34 (rapid leakage) (0.5 m/s) (outdoor)
35 54 kg/h (0 m/s) (outdoor)
36 (burst leakage) (0.5 m/s) (outdoor)
37 7 kg/h (0 m/s) (outdoor)
38 (rapid leakage from bottom apertures) (0.5 m/s) (outdoor)
39 54 kg/h (0 m/s) (outdoor)
40 (burst leakage from bottom apertures) (0.5 m/s) (outdoor)
water-cooled chiller
air-cooled chiller
- 231 -
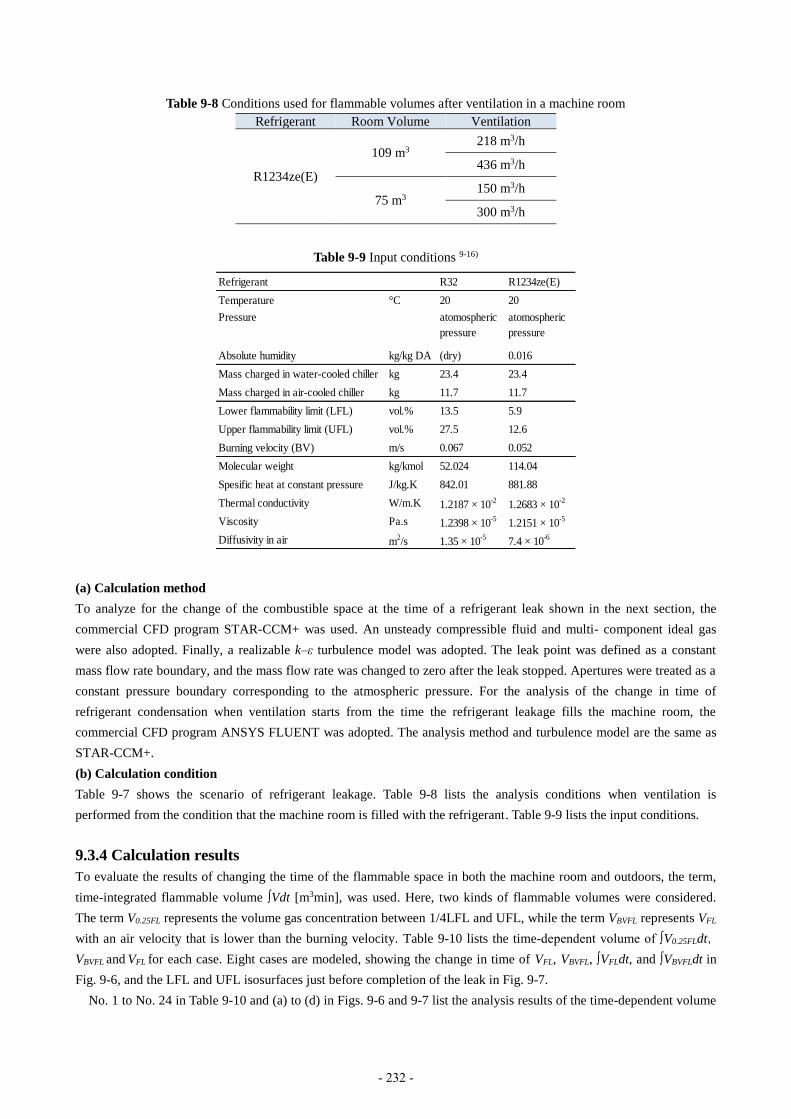
Table 9-8 Conditions used for flammable volumes after ventilation in a machine room
Refrigerant Room Volume Ventilation
R1234ze(E)
109 m3 218 m3/h
436 m3/h
75 m3 150 m3/h
300 m3/h
Table 9-9 Input conditions 9-16)
Refrigerant R32 R1234ze(E)
Temperature °C 20 20
Pressure atomospheric
pressure
atomospheric
pressure
Absolute humidity kg/kg DA (dry) 0.016
Mass charged in water-cooled chiller kg 23.4 23.4
Mass charged in air-cooled chiller kg 11.7 11.7
Lower flammability limit (LFL) vol.% 13.5 5.9
Upper flammability limit (UFL) vol.% 27.5 12.6
Burning velocity (BV) m/s 0.067 0.052
Molecular weight kg/kmol 52.024 114.04
Spesific heat at constant pressure J/kg.K 842.01 881.88
Thermal conductivity W/m.K 1.2187 × 10⁻²
1.2683 × 10⁻²
Viscosity Pa.s 1.2398 × 10⁻⁵
1.2151 × 10⁻⁵
Diffusivity in air m2/s 1.35 × 10
-57.4 × 10
-6
(a) Calculation method
To analyze for the change of the combustible space at the time of a refrigerant leak shown in the next section, the
commercial CFD program STAR-CCM+ was used. An unsteady compressible fluid and multi- component ideal gas
were also adopted. Finally, a realizable k–ε turbulence model was adopted. The leak point was defined as a constant
mass flow rate boundary, and the mass flow rate was changed to zero after the leak stopped. Apertures were treated as a
constant pressure boundary corresponding to the atmospheric pressure. For the analysis of the change in time of
refrigerant condensation when ventilation starts from the time the refrigerant leakage fills the machine room, the
commercial CFD program ANSYS FLUENT was adopted. The analysis method and turbulence model are the same as
STAR-CCM+.
(b) Calculation condition
Table 9-7 shows the scenario of refrigerant leakage. Table 9-8 lists the analysis conditions when ventilation is
performed from the condition that the machine room is filled with the refrigerant. Table 9-9 lists the input conditions.
9.3.4 Calculation results
To evaluate the results of changing the time of the flammable space in both the machine room and outdoors, the term,
time-integrated flammable volume ∫Vdt [m3min], was used. Here, two kinds of flammable volumes were considered.
The term V0.25FL represents the volume gas concentration between 1/4LFL and UFL, while the term VBVFL represents VFL
with an air velocity that is lower than the burning velocity. Table 9-10 lists the time-dependent volume of ∫V0.25FLdt,
VBVFL and VFL for each case. Eight cases are modeled, showing the change in time of VFL, VBVFL, ∫VFLdt, and ∫VBVFLdt in
Fig. 9-6, and the LFL and UFL isosurfaces just before completion of the leak in Fig. 9-7.
No. 1 to No. 24 in Table 9-10 and (a) to (d) in Figs. 9-6 and 9-7 list the analysis results of the time-dependent volume
- 232 -

in the machine room. Nos. 1, 13, and 19 were analyzed for approximately 200 minutes since the condition of no
ventilation led to a longer time-dependent volume VFL and the flammable space was not fully evacuated. These results
show that VFL increased considerably and did not disappear even after the leakage was finished where rapid leakage
occurred in a room with a volume of 109 m3 without air ventilation. However, when the burst leakage occurred or when
the room volume was 75 m3, there was the possibility of the VFL not developing without air ventilation (see case Nos. 4,
7 and 16). When a room volume is large, a high concentration region develops in the lower part of the room and the
refrigerant does not diffuse into the upper part because the leakage port is located near the floor. On the other hand,
when a room volume is smaller or when the leakage velocity is larger, the refrigerant spreads and fills more of the room,
leading to a rise in the average concentration, which tends results in a lower concentration in the bottom portion of the
room. In an unexpectedly small machine room, where the average concentration rises, VFL will develop if the position of
the leakage port and direction of refrigerants change.
No. 25 to No. 40 in Table 9-10 and (e) to (h) in Figs. 9-6 and 9-7 list the analysis results of the time-dependent
volume for outdoor installations. If the leakage is generated from the air heat exchanger (No. 25–28, 33–36),the
refrigerant spreads out and the VFL exists only at the periphery of the leakage port, which leads to being very small
flammable time periods. For a leak from the bottom apertures caused by an inner leak, i.e., a leak occurring near the
ground, the refrigerant does not spread into an upper space. In this case, a VFL layer with a thickness of approximately
0.01 m is generated at the ground level. Especially in the case of burst leakage, VFL developed over the entire ground
area (see case Nos. 31, 32, 39, and 40). However, it vanished immediately after the leakage stops due to two apertures
in the wall. Although no direct comparison was performed on the data listed in Table 9-10, the effect of the airflow (0.5
m/s) was negligible.
Table 9-10 Predicted time-integrated flammable volumes
Case no.
∫V0.25FLdt m3 min
∫VFLdt m3 min
∫VBVFLdt m3 min
Case no.
∫V0.25FLdt m3 min
∫VFLdt m3 min
∫VBVFLdt m3 min
Water-cooled chiller 21 0.32 0.0009 0
1* up to 13487 up to 2481 - 22* up to 2223 0.784 0
2 0.351 0.0004 0 23* up to 2807 0.046 0
3 0.186 0.0007 0 24 1359 0.025 0
4* up to 2759 0.011 0 Air-cooled chiller
5* up to 2283 0.008 0 25 0.018 0.0002 0
6 1396 0.006 0 26 0.021 0.0002 0
7* up to 9711 0.012 0 27 0.071 0.0004 0
8* up to 2.884 0.0008 0 28 0.128 0.0007 0
9 0.223 0.0007 0 29 56.27 3.732 2.827
10* up to 2309 0.037 0 30 53.26 3.775 3.112
11* up to 2500 0.016 0 31 11.5 4.242 0.671
12 1326 0.012 0 32 11.62 4.164 0.693
13* up to 7934 up to 3129 - 33 0.033 0.0003 0
14 0.422 0.001 0 34 0.035 0.0003 0
15 0.277 0.0009 0 35 0.134 0.001 0
16* up to 3293 0.027 0 36 0.174 0.001 0
17* up to 2502 0.017 0 37 58.42 3.989 2.054
18 1483 0.015 0 38 56.82 4.038 2.313
19* up to 9070 up to 6363 up to 1464 39 15.3 5.685 0.646
20* up to 1.353 0.0009 0 40 15.35 5.544 0.662
*Calculations were stopped before the flammable volumes vanished because of their very long residence times
The change in volume of the flammable space after the start-up of the ventilation with the refrigerant filled in a
machine room is shown in Fig. 9-8. The flammable space disappeared after 6 min for a room volume of 109 m3 and
after 20 min for a minimum volume of 75 m3 (using a ventilation rate of four times/h.). This result was assumed that the
flammable space was eliminated when the refrigerant in the chiller leaked without ventilation during the long-term
shutdown.
- 233 -

The analysis of the refrigerant amount for large chillers is as follows. For the state of a chiller with a capacity of 300
kW and a machine room with a volume of 192 m3, which is defined as the smallest in High Pressure Gas Safety Law,
the analysis of the ventilation rate and the flammable space was carried out with the condition of no limit of leak (burst
leakage). The analysis shows that a flammable space did not form at a ventilation rate of four times/h and the
concentration of refrigerant was largely less than 2 %. At a ventilation rate of two air changes/h, the concentration was
approximately 4 %, and a flammable space was not formed (Fig. 9-9). It is assumed that, irrelevant to refrigerant
amount, a flammable space does not form in chillers with 300 kW or more regardless of mechanical ventilations (two
times/h).
0
1.2
2.4
3.6
4.8
6
0
0.1
0.2
0.3
0.4
0.5
0 3 6 9 12 15 18
Inte
gra
ted f
lam
mab
le v
olu
me
[m3m
in]
Fla
mm
able
vo
lum
e [m
3]
time [min]
V FL ∫ V FL dt V BVFL ∫ V BVFL dt
(f) Case no.32 air - cooled chiller R32, airflow: 0.5 m/s leakage (from bottom apertures) : 75 kg/h
(e) Case no.30 air - cooled chiller R32, airflow: 0.5 m/s leakage (from bottom apertures) : 10 kg/h
(a) Case no.4 water - cooled chiller R32, leakage: 75 kg/h vent: 0 m 3 /h, V room = 109 m 3
(b) Case no.7 water - cooled chiller R32, leakage: 10 kg/h vent: 0 m 3 /h, V room = 75 m 3
(c) Case no.16 water - cooled chiller R1234ze(E), leakage: 54 kg/h vent: 0 m 3 /h, V room = 109 m 3
(d) Case no.19 water - cooled chiller R32, leakage: 7 kg/h vent: 0 m 3 /h, V room = 75 m 3
(f) Case no.40 air - cooled chiller R1234ze(E), airflow: 0.5 m/s leakage (from bottom apertures) : 54 kg/h
(e) Case no.38 air - cooled chiller R1234ze(E), airflow: 0.5 m/s leakage (from bottom apertures) : 7 kg/h
0
0.002
0.004
0.006
0.008
0.01
0.012
0
0.0003
0.0006
0.0009
0.0012
0.0015
0.0018
0 5 10 15 20 25
Inte
gra
ted f
lam
mab
le v
olu
me
[m3m
in]
Fla
mm
able
vo
lum
e [m
3]
time [min]
0
0.02
0.04
0.06
0.08
0.1
0.12
0
0.004
0.008
0.012
0.016
0.02
0.024
0 30 60 90 120 150
Inte
gra
ted f
lam
mab
le v
olu
me
[m3m
in]
Fla
mm
able
vo
lum
e [m
3]
time [min]
0
0.005
0.01
0.015
0.02
0.025
0.03
0
0.0006
0.0012
0.0018
0.0024
0.003
0.0036
0 5 10 15 20 25 30
Inte
gra
ted f
lam
mab
le v
olu
me
[m3m
in]
Fla
mm
able
vo
lum
e [m
3]
time [min]
0
700
1400
2100
2800
3500
4200
0
10
20
30
40
50
60
0 40 80 120 160 200
Inte
gra
ted f
lam
mab
le v
olu
me
[m3m
in]
Fla
mm
able
vo
lum
e [m
3]
time [min]
0
0.5
1
1.5
2
2.5
3
3.5
4
0
0.01
0.02
0.03
0.04
0.05
0.06
0.07
0.08
0 15 30 45 60 75
Inte
gra
ted f
lam
mab
le v
olu
me
[m3m
in]
Fla
mm
able
vo
lum
e [m
3]
time [min]
0
1
2
3
4
5
0
0.1
0.2
0.3
0.4
0.5
0 2 4 6 8 10 12
Inte
gra
ted f
lam
mab
le v
olu
me
[m3m
in]
Fla
mm
able
vo
lum
e [m
3]
time [min]
0
1
2
3
4
5
0
0.01
0.02
0.03
0.04
0.05
0 20 40 60 80 100
Inte
gra
ted f
lam
mab
le v
olu
me
[m3m
in]
Fla
mm
able
vo
lum
e [m
3]
time [min]
Figure 9-6 Flammable volumes VFL, VBVFL, and time-integrated flammable volumes ∫VFLdt, ∫VBVFLdt
with change in time
- 234 -

Figure 9-7 LFL and UFL isosurfaces immediately before leakage ends
(a) Case no.4 water - cooled chiller R32, leakage: 75 kg/h vent: 0 m 3 /h, V room = 109 m 3
(f) Case no.32 air - cooled chiller R32, airflow: 0.5 m/s leakage (from bottom apertures) : 75 kg/h
(e) Case no.30 air - cooled chiller R32, airflow: 0.5 m/s leakage (from bottom apertures) : 10 kg/h
(b) Case no.7 water - cooled chiller R32, leakage: 10 kg/h vent: 0 m 3 /h, V room = 75 m 3
(c) Case no.16 water - cooled chiller R1234ze(E), leakage: 54 kg/h vent: 0 m 3 /h, V room = 109 m 3
(d) Case no.19 water - cooled chiller R32, leakage: 7 kg/h vent: 0 m 3 /h, V room = 75 m 3
(f) Case no.40 air - cooled chiller R1234ze(E), airflow: 0.5 m/s leakage (from bottom apertures) : 54 kg/h
(e) Case no.38 air - cooled chiller R1234ze(E), airflow: 0.5 m/s leakage (from bottom apertures) : 7 kg/h
(g) (h)
- 235 -

0
5
10
15
20
0 500 1000 1500 2000 2500
Vo
lum
e o
f fl
amm
abili
ty [
m3
]
Time [sec]
75m3 2 times/h75m3 4 times/h109m3 2 times/h109m3 4 times/h
Figure 9-8 Flammable volume after ventilation
(a) Two times/h (b) Four times/h
Figure 9-9 Concentration distribution resulting from continuous refrigerant leakage
(R1234ze (E), burst leak, 192 m3)
9.3.5 Probability of existence of flammable space
The probability of the existence of a flammable space is defined as follows.
[Probability of the existence of a flammable space]
= [time-dependent volume of flammable space (m3min)]/ [target space (m3)] × [525,600 (min/year)]
The probability of the existence of a flammable space differs depending on the frequency of leakage, operation rate
of mechanical ventilation in each LS, installation ratio of water-cooled chillers and air-cooled heat pumps and other
characteristics of LS. Table 9-11 lists the probability of the existence of a flammable space in each LS and frequency of
leakage.
Table 9-11 Probability of existence of a flammable space in each LS
LS Without ventilation
[case/(unit/year)]
Probability of existence of a flammable space,
Pfs [-]
Burst
leak
Rapid
leak
Slow
leak
Logistics Transportation - 0 0 0
Storage in warehouse 0.01 2.64×10⁻¹⁰ 5.46×10⁻⁷ 0
Installation
Carry-in, installation,
filling refrigerant and
storage
0.5 7.84×10⁻⁸ 8.26×10⁻⁶ 0
Trial 0.01 7.84×10⁻⁸ 2.33×10⁻⁷ 0
Usage
[machine
room]
machine room 0.01 2.64×10⁻¹⁰ 5.46×10⁻⁷ 0
Air-conditioned room - 0 0 0
Usage [outdoor] - 1.12×10⁻⁷ 9.84×10⁻⁸ 0
Repair 0.01 7.84×10⁻⁸ 2.33×10⁻⁷ 0
Overhaul 0.01 7.84×10⁻⁸ 2.33×10⁻⁷ 0
Disposal 0.5 7.84×10⁻⁸ 8.26×10⁻⁶ 0
6 min 12 min 20 min 39 min
- 236 -
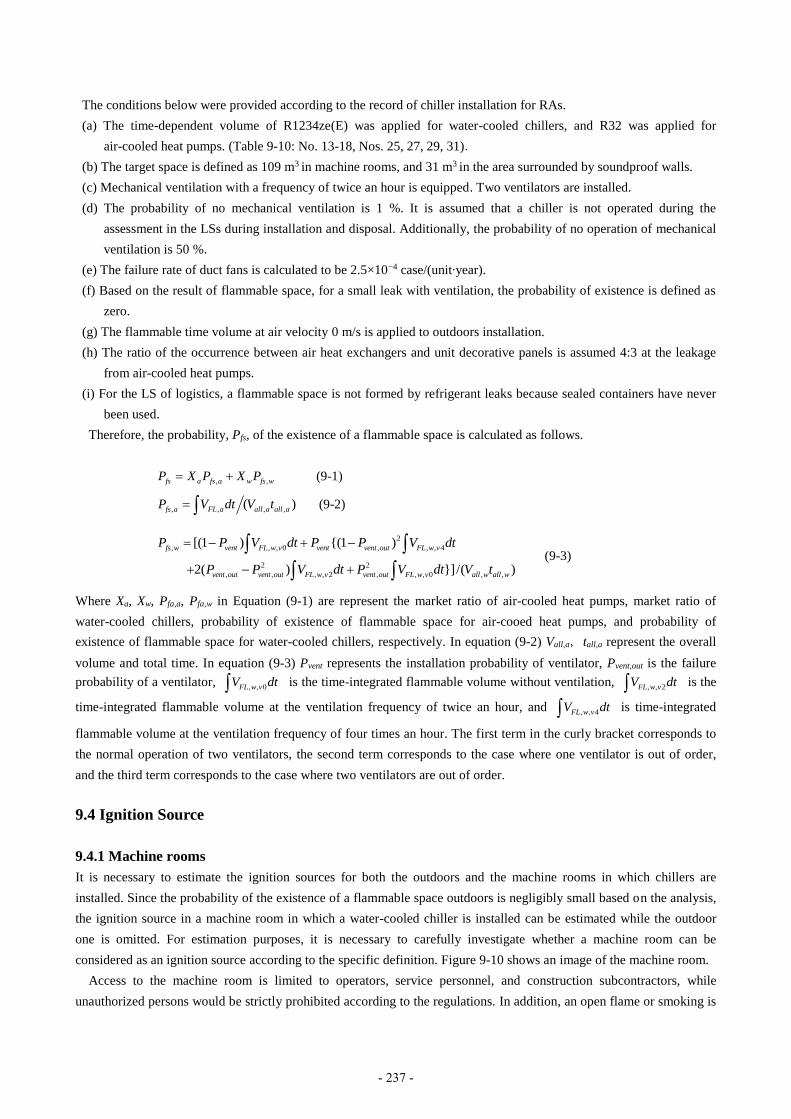
The conditions below were provided according to the record of chiller installation for RAs.
(a) The time-dependent volume of R1234ze(E) was applied for water-cooled chillers, and R32 was applied for
air-cooled heat pumps. (Table 9-10: No. 13-18, Nos. 25, 27, 29, 31).
(b) The target space is defined as 109 m3 in machine rooms, and 31 m3 in the area surrounded by soundproof walls.
(c) Mechanical ventilation with a frequency of twice an hour is equipped. Two ventilators are installed.
(d) The probability of no mechanical ventilation is 1 %. It is assumed that a chiller is not operated during the
assessment in the LSs during installation and disposal. Additionally, the probability of no operation of mechanical
ventilation is 50 %.
(e) The failure rate of duct fans is calculated to be 2.5×10⁻⁴ case/(unit∙year).
(f) Based on the result of flammable space, for a small leak with ventilation, the probability of existence is defined as
zero.
(g) The flammable time volume at air velocity 0 m/s is applied to outdoors installation.
(h) The ratio of the occurrence between air heat exchangers and unit decorative panels is assumed 4:3 at the leakage
from air-cooled heat pumps.
(i) For the LS of logistics, a flammable space is not formed by refrigerant leaks because sealed containers have never
been used.
Therefore, the probability, Pfs, of the existence of a flammable space is calculated as follows.
, ,fs a fs a w fs wP X P X P (9-1)
, , , ,( )fs a FL a all a all aP V dt V t (9-2)
2
, , , 0 , , , 4
2 2
, , , , 2 , , , 0 , ,
[(1 ) {(1 )
2( ) }]/( )
fs w vent FL w v vent vent out FL w v
vent out vent out FL w v vent out FL w v all w all w
P P V dt P P V dt
P P V dt P V dt V t
(9-3)
Where Xa, Xw, Pfa,a, Pfa,w in Equation (9-1) are represent the market ratio of air-cooled heat pumps, market ratio of
water-cooled chillers, probability of existence of flammable space for air-cooed heat pumps, and probability of
existence of flammable space for water-cooled chillers, respectively. In equation (9-2) Vall,a,tall,a represent the overall
volume and total time. In equation (9-3) Pvent represents the installation probability of ventilator, Pvent,out is the failure
probability of a ventilator, , , 0FL w vV dt is the time-integrated flammable volume without ventilation, , , 2FL w vV dt is the
time-integrated flammable volume at the ventilation frequency of twice an hour, and , , 4FL w vV dt is time-integrated
flammable volume at the ventilation frequency of four times an hour. The first term in the curly bracket corresponds to
the normal operation of two ventilators, the second term corresponds to the case where one ventilator is out of order,
and the third term corresponds to the case where two ventilators are out of order.
9.4 Ignition Source
9.4.1 Machine rooms
It is necessary to estimate the ignition sources for both the outdoors and the machine rooms in which chillers are
installed. Since the probability of the existence of a flammable space outdoors is negligibly small based on the analysis,
the ignition source in a machine room in which a water-cooled chiller is installed can be estimated while the outdoor
one is omitted. For estimation purposes, it is necessary to carefully investigate whether a machine room can be
considered as an ignition source according to the specific definition. Figure 9-10 shows an image of the machine room.
Access to the machine room is limited to operators, service personnel, and construction subcontractors, while
unauthorized persons would be strictly prohibited according to the regulations. In addition, an open flame or smoking is
- 237 -

also forbidden. The machine room is equipped with power boards to start the chiller, featuring large-capacity breakers
for power supply, solenoid switches, magnetic contactors, relays and other electric devices, which may spark at startup.
In addition, the chiller itself also contains electric accessories such as a control panel with built-in control equipment
and other various electrical components. Furthermore, it is necessary to consider that a cold-water pump and a cooling
water pump are provided along with an auxiliary power board with built-in breakers for power supply, solenoid
switches, magnetic contactors, relays, and other devices, which may spark in operation. The air drawn into a burning
appliance is introduced directly to the machine room with a blower, and ventilation air is evacuated outdoors through an
insulated, independent air duct. The machine room is equipped with forced ventilation equipment and the ventilation
volume is required to be sufficient to remove the generated heat of the apparatus according to the Building Standards
Act. ISO5149-part39-17) prescribes that a ventilation volume should be equivalent to an air change rate of four times the
volume of the machine room per hour.
Figure 9-10 Image of machine room
9.4.2 Ignition sources
Unlike flammable refrigerant R290, the ignition sources of mildly flammable refrigerants must be determined because
they could be ignited by sparks of power sources, static electricity, and a cigarette light. The study9-18–9-22) performed
along with RAs assessed flammability and ignitability. Open flames, metal sparks, and very large electrical apparatus
(solenoid switched and breakers) can all be the ignition sources of the refrigerants. Tables 9-12 and 9-13 list modeled
sparks and open fires as ignition sources.
Table 9-12 Ignition source apparatus in a machine room (source of sparks)
Category Spark
Ignition Source Ignition Remarks
Electrical parts
Home appliance and a small electrical product N 5 kVA or below
Electrical part inside equipment Yes Solenoid switch with 5 kVA or above
AC power source N Equivalent to quenching distance
Lighting switch N Equivalent to quenching distance
Work tools
Metal spark
(folk of a forklift) Yes -
Electrical power tool N Small capacity
Refrigerant recovery apparatus N Small capacity
Human body Static electricity emitted from a human body N Minimum ignition energy or less
Yes; ignited, N; not ignited
Chiller No2
Chiller No1
P
P
P
P
Operation panel
Operation panel
Starter panel 1
Starter panel 2
Auxiliary machine(Pump)
Auxiliary power panel
Burner
Air vent(Exhaust)
Ventilation(Intake air)
Ventilationfor burner
Absorption chiller by direct boiling
- 238 -

Table 9-13 Ignition source apparatus in a machine room (using open flames)
Category Spark
Ignition Source Ignition Remarks
Smoking
supplies
Match Yes Ignition = open fire
Oil lighter NF Open fire once ignited
Electric lighter N Spark not ignited
Burning
appliance
Electric radiant heater Yes Prohibited to use
Electric fan heater N Prohibited to use
Gas water heater Yes Prohibited to use
Gas boiler (burner) N No timing of ignition
Ventilation duct, boiler surface N 140°C or below
Gas cooking appliance Yes Prohibited to use
Work tool Burner for brazing N High in gas velocity
Yes: ignited, N: not ignited, NF: no flame propagation
Machine roomOutside
Main burner
Pilot burner
ignition transformer
Air fan
Exhaust
Figure 9-11 Image of burner in absorption chillers
Open flames exit the boiler and a direct-type absorption chiller since the fuel gas combusts with air, which is
supplied by the fan from the machine room in the combustion chamber. Figure 9-11 shows an image of burner in the
absorption chillers. The procedures for startup and shutdown operations were confirmed as follows: 1) turn on the
separate fan, 2) ignition of the pilot burner by an ignition device, 3) ignition of the main burner, 4) during normal
operation, turn the pilot burner off while only the main burner is operated. The suspension of operation was as follows;
1) halt the main burner, 2) post purge operation, 3) cool down the combustion chamber using the fan, and 4) halt the
convection fan. While an open flame existed in a combustion chamber, the fan was operated regularly. Even if the
leaked refrigerant gas might flow into the apparatus and ignited, the flame in the combustion chamber was not blown
back into the machine room. Consequently, there is no possibility of ignition sources for the leaked mildly flammable
refrigerant. Since apparatus, such as a stove or an oven is prohibited from being taken into the machine room, it is
excluded from the list of ignition sources.
9.4.3 Ignition by smoking
Smoking gives rise to the possibility of an open flame of a match or lighter9-19)igniting any leaked refrigerant gas. The
smoking behavior of 1,358 service engineers selected in 2012 was investigated by questionnaire, and the conditions
were given as follows.
(a) 53 % of the service engineers smoke. During the past year, 7.1 % of all the service engineers smoked on-site.
- 239 -

(b) Number of cigarettes smoked by a male worker was 19.1 per day9-23).
(c) Service engineers worked 8-hour day within an activity time of 18 hours.
(d) The period in a day in which ignition sources are present is 8 hours, corresponding to the working hours of the
service engineers.
(e) Service engineers work at the site for four days a year.
(f) Two service engineers work at the site.
(g) Duration of an open flame for smoking is 2 seconds.
(h) 99.6 % of smokers use a lighter for an ignition source, while 0.4 % use a match. 95 % of the lighters are electric
types, while 5 % of them are oil liters.
The probable existence of ignition sources is calculated by multiplying the number of cigarettes smoked by service
engineers at site per day by the period of ignition per cigarette and divided by the period when ignition sources are
probably present. The probability is calculated as follows.
{0.07×19.1 pcs/(day∙person) × 8/18 (hr/hr) × 4/365(day/day) × 2 persons × 2/3600 sec/(pcs∙hr)}/8 (hr/day) = 9.04×10⁻⁷
9.4.4 Ignition by electrical components
Among the electrical components in the machine room such as the electric motor, solenoid switch, circuit breakers,
printed board,transformer etc., that may be ignited by a spark are the circuit breaker, solenoid switch, contactor, relay
and the products for which a spark occurs at startup as mentioned above. The power circuit breaker and solenoid switch
are not assumed to be used in flammable atmospheres in general, the opening is provided in order to discharge gases
that occur at the spark. With respect to whether or not the spark that occurs is the ignition source, allowable effective
hole size of the opening portion is discussed in Annex JJ of IEC 60335-2-40, and equation (9-4) has been proposed9-24).
deff = 22,3 × Su-1,09 ≤ 7 mm (9-4)
(deff: Allowable effective hole size [mm],Su: Refrigerant burning velocity [cm/s])
For the case where equation (9-4) is not satisfied (if the allowable effective hole size is greater than 7 mm), it must
be confirmed by experiment whether it becomes an ignition source.
The spark energy increases with the electric capacity, therefore, the spark itself can be a source of ignition. Equation
(9-5) 9-24) has been proposed for the electric capacity which may be an ignition source.
Electric capacity (kVA) ≥ 5× (6.7/BV)4 (9-5)
(BV:Refrigerant burning velocity [cm/s])
Originally, with respect to whether the circuit breaker, solenoid switch, relay and other appliances that may spark are
the ignition source or not, it should be evaluated using the quenching distance which is calculated by equation (9-4)
(allowable effective hole size). According to the report of DOE/CE23810-92(1998)9-8) by Takizawa, AIST and ADL
company, electrical components with capacity of 5 kVA or less were not able to be a source of ignition, which was
confirmed with R32.
When reviewing the cooling capacity (nominal horsepower) and the capacity of the solenoid switch of each
company's chiller, the solenoid switch with less than 5 kVA capacity would be used for a chiller with cooling capacity
less than 7.5 kW (10 HP) 9- 10). Even if the cooling capacity of the chiller (a large-sized turbo chiller is included) is
higher than 10 HP, there are no electric products exceeding 5 kVA in the control system. Therefore, the source of
ignition is restricted to the solenoid switch of a power system, and the source of ignition existence probability can be
estimated from the frequency of the electromagnetic switch which exceeds 5 kVA by a power system (it can become a
- 240 -

source of ignition) of operation. The contact time is assumed to be 1 second; the maximum frequency of the
electromagnetic switch for screw-type chiller is taken as 6 times/h while 2 times/h for the turbo-type. The maximum
frequency of Start/Stop of chillers is set to 6 x 0.952 + 2 × 0.048 = 5.8 times/h when the stocks ratio is assumed
0.952:0.048 of a screw chiller and a turbo one. Operating time is assumed to be 12 h/day.
As mentioned above, the existence probability as a source of ignition is calculated as follows.
(1/3600 × 5.8 × 12)/12 = 1.61 × 10⁻³
9.4.5 Probability of ignition sources
Considering the works at each LS, the possible equipment and the probable existence of an open fire PIi are calculated.
Table 9-14 lists the total probabilities ΣiPIi of ignition sources for each PIi and LS.
Table 9-14 Probability of the existence of an ignition source in each LS
LS Electrical
part inside
equipment
Metal
spark Match Oil lighter
Electrical
Radiant
heater
Gas water
Heater &
Gas
cooking
appliance
Other Total
ΣiPIi
Logistics
Transportation - 1.67×10⁻⁴ 4.72×10⁻⁹ 1.18×10⁻⁶ - - 6.35×10⁻⁸
3.36×10⁻² Storage in warehouse - 8.33×10⁻⁵ 4.72×10⁻⁹ 1.18×10⁻⁶ 3.33×10⁻² - 6.35×10⁻⁸
Installation
Carry-in, installation
and storage - 8.33×10⁻⁵ 9.04×10⁻⁹ 2.25×10⁻⁶ 3.33×10⁻² - 1.47×10⁻⁶
3.63×10⁻² Trial 2.87×10⁻³ - 9.04×10⁻⁹ 2.25×10⁻⁶ - - 1.47×10⁻⁶
Filling refrigerant 8.05×10⁻⁴ - 4.52×10⁻⁹ 1.13×10⁻⁶ 3.33×10⁻² - 6.08×10⁻⁸ 3.41×10⁻²
Usage
[machine room]
Online*1 1.05×10⁻² - 4.72×10⁻⁹ 1.18×10⁻⁶ - - 6.35×10⁻⁸
8.78×10⁻²
Offline*1 1.05×10⁻² - 4.72×10⁻⁹ 1.18×10⁻⁶ - - 6.35×10⁻⁸
Online*2 2.50×10⁻⁴ - 4.72×10⁻⁹ 1.18×10⁻⁶ 3.33×10⁻² 1.18×10⁻⁶ 6.35×10⁻⁸
Offline*2 - - 4.72×10⁻⁹ 1.18×10⁻⁶ 3.33×10⁻² 1.18×10⁻⁶ 6.35×10⁻⁸
Usage
[outdoor]
Online 1.16×10⁻² - 4.72×10⁻⁹ 1.18×10⁻⁶ - - 1.41×10⁻⁶
1.25×10⁻² Offline 9.00×10⁻⁴ - 4.72×10⁻⁹ 1.18×10⁻⁶ - - 1.41×10⁻⁶
Repair
Piping work 8.54×10⁻⁴ - 3.62×10⁻⁹ 9.00×10⁻⁷ 3.33×10⁻² - 4.86×10⁻⁸
2.05×10⁻¹
Cutting work 8.54×10⁻⁴ - 3.62×10⁻⁹ 9.00×10⁻⁷ 3.33×10⁻² - 4.86×10⁻⁸
Discharging
refrigerant 8.54×10⁻⁴ - 3.62×10⁻⁹ 9.00×10⁻⁷ 3.33×10⁻² - 4.86×10⁻⁸
Detecting of
refrigerant 8.54×10⁻⁴ - 3.62×10⁻⁹ 9.00×10⁻⁷ 3.33×10⁻² - 4.86×10⁻⁸
Charging
refrigerant 8.54×10⁻⁴ - 3.62×10⁻⁹ 9.00×10⁻⁷ 3.33×10⁻² - 4.86×10⁻⁸
Checking and repair 8.54×10⁻⁴ - 3.62×10⁻⁹ 9.00×10⁻⁷ 3.33×10⁻² - 4.86×10⁻⁸
Overhaul
Takedown 8.05×10⁻⁴ 8.33×10⁻⁵ 3.62×10⁻⁹ 9.00×10⁻⁷ 3.33×10⁻² - 4.86×10⁻⁸
1.70×10⁻¹
Refrigerant recovery 8.05×10⁻⁴ - 3.62×10⁻⁹ 9.00×10⁻⁷ 3.33×10⁻² - 4.86×10⁻⁸
After refrigerant
recovery - - 3.62×10⁻⁹ 9.00×10⁻⁷ 3.33×10⁻² - 4.86×10⁻⁸
Setup 8.05×10⁻⁴ 8.33×10⁻⁵ 3.62×10⁻⁹ 9.00×10⁻⁷ 3.33×10⁻² - 4.86×10⁻⁸
Filling refrigerant 8.05×10⁻⁴ - 3.62×10⁻⁹ 9.00×10⁻⁷ 3.33×10⁻² - 4.86×10⁻⁸
Disposal
Refrigerant recovery 8.05×10⁻⁴ - 4.52×10⁻⁹ 1.13×10⁻⁶ 3.33×10⁻² - 6.08×10⁻⁸
1.35×10⁻²
After refrigerant
recovery - - 4.52×10⁻⁹ 1.13×10⁻⁶ 3.33×10⁻² - 6.08×10⁻⁸
Dismantling 8.05×10⁻⁴ 8.33×10⁻⁵ 4.52×10⁻⁹ 1.13×10⁻⁶ 3.33×10⁻² - 6.08×10⁻⁸
Take out - 8.33×10⁻⁵ 4.52×10⁻⁹ 1.13×10⁻⁶ 3.33×10⁻² - 6.08×10-8
*1: In machine room *2: In air-conditioned room
- 241 -

9.5 Probability of Occurrence of Refrigerant Leakage
According to the refrigerant leakage accident reports9-9) released by the High Pressure Gas Safety Institute of Japan
(KHK), 59 % of the total number of 76 accidents are found that the leakages where place in the small-bore piping, joints
or valves, whereas only 1 % leakage in vessels. Since the leakages were similar to those from multi-packaged
air-conditioning unit systems, they were categorized as burst leakage, rapid leakage, and slow leakage as described in
JRA-GL139-13). The six leakages categorized as burst leakage were due to the breakage of small-bore pipes as a result of
vibration or slight cracks in the pipes during maintenance work. The seven rapid leakages originated from damage of
heat exchanger tubes during maintenance work. Additionally, in both burst and rapid cases, the refrigerant leaks as gas.
The other sixty-three slow leakage resulted from the deterioration of the sealing materials, cracking, or the insufficient
tightening of joints, corrosion, or deterioration of pinholes or others.
The report was compared with the maintenance data9-25) from each company participating in the SWG. The probability
of the occurrence of a refrigerant leakage(Pl) in each leakage category was calculated for the water-cooled chillers,
air-cooled heat pumps, and centrifugal water chilling units from the proportional available data which was calculated
from past shipment data for each company from 2004 to 2011 (Table 9-15). Compared with the refrigerant leakage
accidents, the total of burst leakage and rapid leakage is the same level, not lower than 1×10⁻⁴ cases/(unit∙ year),
therefore, the data was considered trustworthy. Burst and rapid leakages from centrifugal chilling units with much more
refrigerant have not occurred because slow leakages were repaired during maintenance work.
Table 9-15 Probability of leakage in 2004-2011
2004-
2011Fy
Probability of the occurrence
of refrigerant leakage (case/(unit∙year))
Water-cooled chiller Air-cooled heat pump Centrifugal chiller Total
Burst leak 5.83×10⁻⁶ 1.35×10⁻⁵ 0 1.07×10⁻⁵
Rapid leak 1.07×10⁻⁴ 1.87×10⁻⁴ 0 1.56×10⁻⁴
Slow leak 1.64×10⁻³ 2.21×10⁻³ 7.09×10⁻³ 2.27×10⁻³
9.6 Calculation of Probability of Accidental Fires and Burns
9.6.1 Calculation conditions
The conditions below are provided in order not to underestimate the accidental frequency.
(a) Four units of equipment are normally installed in the machine room, and the startup/ shutdown frequencies of the
chiller and pumps are also considered.
(b) All units installed outdoors are surrounded by soundproof walls, and a flammable space in the case of leak from
the lower units is considered.
(c) Ignition sources are assumed to be evenly distributed throughout the entire flammable space, including the floor
surface. For example, the case of a lighter flame at the ground level is included.
(d) The probability of the existence of a flammable space when there is no ventilation is defined as being the same as
the probability of refrigerant leakage.
9.6.2 Probability of accidental fire
The probability of an accidental fire (Pfire), showing the equation (9-6), is that of an accidental fire at one device in one
year. It is calculated as the sum multiplied by the probability of existence of a flammable space (PfsLV) (Table 9-11), the
number of refrigerant leakages (PlLV) (Table 9-15) and the probability of the existence of an ignition source (PIi) (Table
9-14) in each LS and leakage velocity.
- 242 -
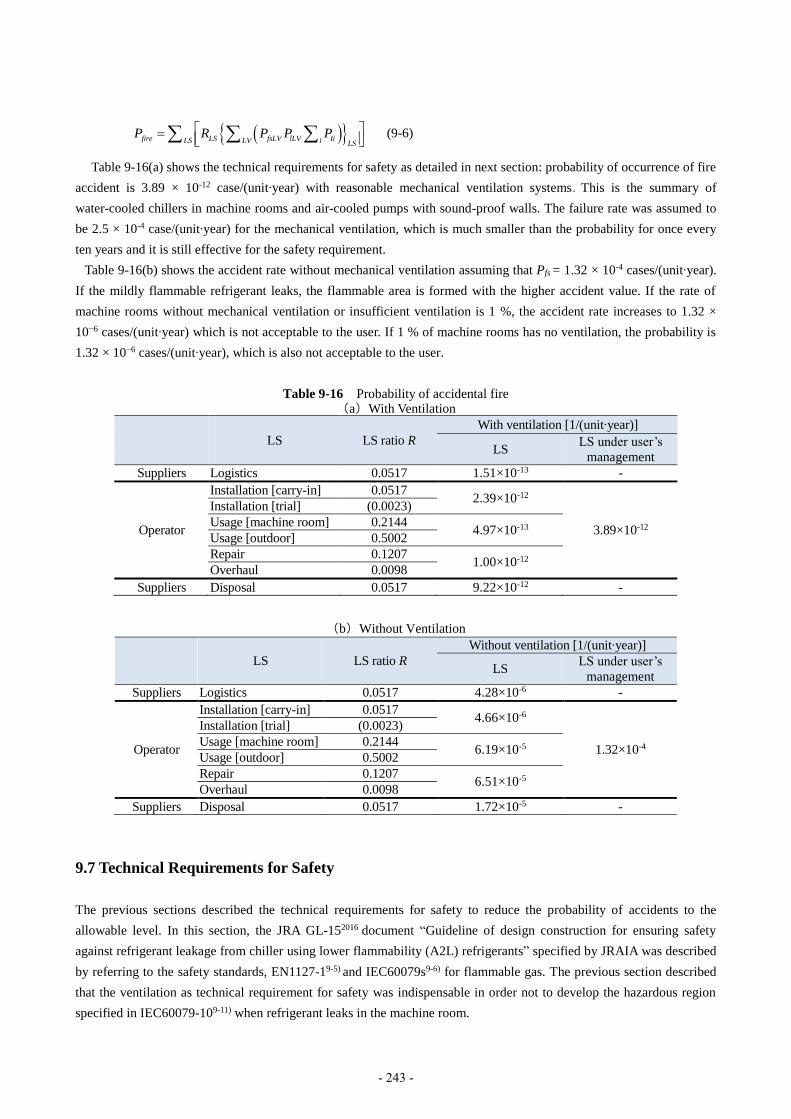
fire LS fsLV lLV IiLS LV i LSP R P P P
(9-6)
Table 9-16(a) shows the technical requirements for safety as detailed in next section: probability of occurrence of fire
accident is 3.89 × 10⁻¹² case/(unit∙year) with reasonable mechanical ventilation systems.This is the summary of
water-cooled chillers in machine rooms and air-cooled pumps with sound-proof walls. The failure rate was assumed to
be 2.5 × 10⁻⁴ case/(unit∙year) for the mechanical ventilation, which is much smaller than the probability for once every
ten years and it is still effective for the safety requirement.
Table 9-16(b) shows the accident rate without mechanical ventilation assuming that Pfs = 1.32 × 10⁻⁴ cases/(unit∙year).
If the mildly flammable refrigerant leaks, the flammable area is formed with the higher accident value. If the rate of
machine rooms without mechanical ventilation or insufficient ventilation is 1 %, the accident rate increases to 1.32 ×
10−6 cases/(unit∙year) which is not acceptable to the user. If 1 % of machine rooms has no ventilation, the probability is
1.32 × 10⁻⁶ cases/(unit∙year), which is also not acceptable to the user.
Table 9-16 Probability of accidental fire (a)With Ventilation
LS LS ratio R
With ventilation [1/(unit∙year)]
LS LS under user’s
management
Suppliers Logistics 0.0517 1.51×10⁻¹³ -
Operator
Installation [carry-in] 0.0517 2.39×10⁻¹²
3.89×10⁻¹²
Installation [trial] (0.0023)
Usage [machine room] 0.2144 4.97×10⁻¹³
Usage [outdoor] 0.5002
Repair 0.1207 1.00×10⁻¹²
Overhaul 0.0098
Suppliers Disposal 0.0517 9.22×10⁻¹² -
(b)Without Ventilation
LS LS ratio R
Without ventilation [1/(unit∙year)]
LS LS under user’s
management
Suppliers Logistics 0.0517 4.28×10⁻⁶ -
Operator
Installation [carry-in] 0.0517 4.66×10⁻⁶
1.32×10⁻⁴
Installation [trial] (0.0023)
Usage [machine room] 0.2144 6.19×10⁻⁵
Usage [outdoor] 0.5002
Repair 0.1207 6.51×10⁻⁵
Overhaul 0.0098
Suppliers Disposal 0.0517 1.72×10⁻⁵ -
9.7 Technical Requirements for Safety
The previous sections described the technical requirements for safety to reduce the probability of accidents to the
allowable level. In this section, the JRA GL-152016 document “Guideline of design construction for ensuring safety
against refrigerant leakage from chiller using lower flammability (A2L) refrigerants” specified by JRAIA was described
by referring to the safety standards, EN1127-19-5) and IEC60079s9-6) for flammable gas. The previous section described
that the ventilation as technical requirement for safety was indispensable in order not to develop the hazardous region
specified in IEC60079-109-11) when refrigerant leaks in the machine room.
- 243 -
9.7.1 Ventilation
(a) Mechanical ventilation
A2L refrigerant, which leaked out in the machine room, tends to be retained in the lower part of the room because the
refrigerant is heavier than air (Fig. 9-7). Typically, an exhaust port would be installed at the lower section of the room
while the air supply is pushed from the position that is higher than the top of the chiller.
(b) Required ventilation volume
In this guideline, the ventilation volume could be determined based on the basic volume of the machine room and the
frequency of ventilation even before the machine is installed. The same specification can be found in
ISO5149-3(2014)9-16) where different rules are determined for the normal and emergency ventilation volume. For
normal ventilation, the ventilation rate is four times per hour, and the ventilation volume in an emergency is specified
by the calculation method using the refrigerant amount.
In Section 9.3 it was confirmed that the flammable space will not be formed with the ventilation rate of two times/h
if a burst leakage event occurs for an average volume of 109 m3 with the minimum volume of 75 m3 (Table 9-10). From
the analysis result for the machine room with a volume of 192 m3 or equivalent to 50 refrigeration ton (approximately
300 kW) in which the chiller is manufactured by the company having the license of high pressure refrigerator of Class
Two, it was confirmed that the flammable space will not be formed using two times air-charges/h ventilation volume
according to the High Pressure Gas Safety Law (Fig. 9-8).
From the above results, the guideline prescribed that the ventilation frequency should be more than 4 times/h
regularly, and for case of the machine room volume of 192 m3 or more the ventilation frequency should be kept 2
times/h or more.
However, if the average concentration of refrigerant leakage from the refrigeration equipment does not exceed LFL/4,
there are no compulsory mechanical ventilation requirements since there is little danger of a fire accident. The guideline
prescribes that it is desirable to ensure the ventilation frequency of 2 times/h or more for the above case.
In addition, the reference volume per ventilation that is prescribed in the guideline refers to those obtained by
multiplying the floor area of a machine room or the area of the compartment that is surrounded by partitioned walls
from floor where refrigeration equipment is installed by the height from the opening of the supply air introduced to the
floor surface.
(c) Backup ventilation
As risk reduction to failure, the guideline prescribed that mechanical ventilation equipment is constituted of 2 times /h ×
2 systems. Although the probability of breakdown of one system of mechanical ventilation equipment is defined into
2.5×10⁻⁴ cases/(unit∙year) in RA, in this case, it is possible to prevent the formation of a flammable space by ensuring a
ventilation rate of 2 times / h. Although the flammable space forms if the failure occurs in two systems, the probability
is very small acceptable level of 6.25×10⁻⁸ cases/(unit∙year).
Next, as a means of risk reduction for the case where the mechanical ventilation equipment is stopped incorrectly or
the mechanical ventilation equipment is not installed, a start-up interlock of the refrigeration equipment is provided in
order to ensure the normal operation of the mechanical ventilation system.
Since maintenance of the ventilation function is essential, it is fundamental to reduce the risk of failure by performing
and recording inspection at the manufacturer's recommended period.
(d) Recovery at long-term stop
In analysis of the case where the ventilation is started from the state that the refrigerant is filled in a room assuming the
leakage at the time of long-term stop, in case of an average volume of 109 m3, if the refrigeration equipment is operated
from long-term stop for the case where the detection alarm equipment detects the leakage, ventilation was prescribed as
- 244 -
the following. Restriction of entry into the machine room and the low-pressure container chamber, access to
compartments refrigeration equipment (except in the refrigerated warehouse) was installed or to compartments where
integrated refrigeration equipment is installed and the startup of the refrigeration equipment until the refrigerant
concentration is less than an alarm setting value after operation of the mechanical ventilation for more than 20 minutes
(Fig. 9-8).
9.7.2 Explosion proof
(a) Refrigeration equipment
In KHKS 0302-3 intended for flammable gas (2011) 9-10), lighting, security equipment (refrigerant leak detector,
working light, local exhaust fan) demand for explosion-proof performance. For A2L refrigerant, the machine with a
surface temperature of 700 °C or the electrical apparatus with the capacity less than 5 kVA are not a source of ignition,
and further, no flammable space will be formed with the necessary ventilation. Therefore, in the guidelines, mechanical
ventilation is required and electrical components with ventilation are not required explosion-proof.
In addition, the guideline prescribes the following items:
・To prohibit open flame such as matches, a stove and lighters.
・On the location of the entrance and places near the refrigeration system of the machine room, warning marks
indicating refrigeration equipment using A2L refrigerant is installed and warning marks of fire bringing prohibited shall
be posted.
(b) Refrigeration equipment
For refrigeration equipment using A2L, if the refrigerant leaks, the refrigeration equipment should be equipped with a
decorative panel with an opening that has the appropriate area or an exhaust fan in order to prevent generating a
hazardous area remaining inside the refrigeration equipment.
9.7.3 Refrigerant gas leak detection alarm equipment
Although two systems of ventilation devices are provided as a means to avoid the risk of failure of the ventilation
device of the machine room, the risk of simultaneous failure of the two systems still does not become zero so that a
refrigerant gas leak detection alarm facility is set up.
Since the detection alarm equipment is required to be fully operational, a separated power supply (including back-up
power supply by the battery) must be provided for the chiller and ventilation equipment. If a refrigerant leakage is
detected, warning shall generate both a light (lamp is lit or flashing) and a sound (warning sound such as a buzzer) in
the place where people gather.
The semiconductor-type refrigerant leakage detector, which measures the change in resistance by adsorbing gas such
as tin oxide, is the primary refrigerant leakage detector systems for A2L refrigerant. It can react to miscellaneous gases
for a relatively low manufacture cost. In the environment with several miscellaneous gases, the infrared-type detector,
which measures the amount of light gas species-specific wavelength to detect gas concentration, is suitable but
relatively expensive. However, it is desirable to perform periodic inspection to avoid the aging problems at appropriate
intervals such as at least once a year for both detector types. In addition, most detection alarms have a failure test
function. Depending on the installation environment, there is possibility that the detector’s deterioration is faster than
expected. Therefore, it is desirable to install spare detection alarm equipment to prepare for the cases where alarm
equipment function does not work or misdetects.
Detector of the semiconductor type has the following disadvantages:
・Due to the effect of miscellaneous gas and moisture with H and OH in the chemical formula, there can be cases of
misdetection or false positives.
・Not able to use in a gas atmosphere that corrodes metals.
- 245 -
・Weak to silicon gas (does not return to the original by silicon poisoning).
In addition, sensitization of the sensor (would like to respond with a thin concentration of refrigerant) will degrade
over the years. Usually, it returns to some extent based on the maintenance. However, if the detector senses
concentrated gas in the order of 10 thousand ppm level, there is a possibility that the characteristics of the detection
surface does not return to its starting point even in the case where the concentration of the gas becomes thinner. (R32:
LFL=144,000 ppm, LFL/4=36,000 ppm). Also, there are few detectors that can sense when temperatures drop to less
than -40 °C.
On the other hand, an infrared type detector is vulnerable to high humidity environment since the detection value
would change if condensation occurs on the light emitting section and the light receiving section. In addition, few
detectors can sense when the temperatures reach -20 °C. In addition, when the detecting function is degraded by dirt on
the light-emitting portion preventing detection of low concentrations of gas, the detector’s ability can be recovered
through maintenance by removing the dirt of light-emitting part and light-receiving portion.
Degradation speed is different based on the environment (the amount of miscellaneous gas, etc.) where the detector is
installed, since the detector ages for all types, it is necessary to perform periodic inspections more than once a year. For
second-class manufacturers or more manufacturing facilities, depending on the type of gas, inspection might be required
according to Refrigeration Safety rules illustrative criteria. For the detection alarm used to detect mildly flammable gas,
it is expected that the provisions of refrigeration safety rules illustrative criteria be applied. On the other hand,
semiconductor type detectors utilizing tin oxide are also used even as household gas alarm equipment. According to the
gas alarm device standard, it can be used for 5 years before replacing when conducting durability tests. Based on these
facts, we are in the process of developing a JRA standard for detection alarms by referring to Refrigeration Safety rules
and the standard of a gas alarm. It desirable to use a detection alarm device fabricated based on those standards.
It should be noted that the detection alarm always deteriorates over time, regardless of whether it is manufactured by
the company with license of high pressure refrigerator of Class 2 or even higher, that of Class 1. In addition, it is also
important that not all kinds of detectors should be used in an environment wherein the detectors are insufficient. What’s
more, erroneous detection can be reduced if the alarm setting is set sufficiently high. When a refrigerant leakage occurs
accompanied by no alarm, it is necessary to conduct the inspection on the detectors and calibrate as needed.
Additionally, the detector must be replaced if its performance still cannot be guaranteed after the above-mentioned
techniques.
9.8. Conclusions
If the mildly flammable refrigerants, R1234ze(E), R1234yf, and R32 are leaked at the same probability of the leakage
accident and velocity, then a small flammable space is formed for a short time. Additionally, since combustibility of
these refrigerants and ignition sources are limited, this results in the smaller probability of the occurrence of a fire. With
two to four times/h air change outs of the two systems as a safety measure, the probability of a fire accident including
air-cooled heat pumps installed outdoors is much smaller than once every ten years and no unallowable risks remain.
Therefore, the mildly flammable refrigerants could be accepted for use in chiller units.
- 246 -

Nomenclature
Pfire Probability of accidental fire
Pfs Probability of existence of flammable space
PIi Probability of existence of ignition source
Pl Number of refrigerant leakage
Pvent Probability of existence of mechanical ventilation
Pvent,out Failure rate of mechanical ventilation
VFL Flammable space volume, m3
VBVFL Flammable space volume with air velocity lower than burning velocity, m3
∫VFL,vndt Time-integrated flammable volume at ventilation frequency of n times an hour, m3min
X market ratio
R LS ratio
Abbreviation
a Air-cooled heat pump
w Water-cooled chiller
vn Ventilation frequency
LV Leakage velocity
LS Life stage
References
9-1) ISO/IEC Guide 51:2014, Safety aspects - Guidelines for their inclusion in standards, 2014.
9-2) ISO 12100:2010, Safety of machinery - General principles for design - Risk assessment and risk reduction,
2010.
9-3) Risk Assessment Handbook (Practice), Ministry of Economy, Trade and Industry, 2011.
9-4) JIS B 8613:1994, Water Chilling Unit, 1994.
9-5) ISO EN1127-1: Explosive atmospheres - Explosion prevention and protection, 2011.
9-6) IEC60079s: Explosive atmospheres, 2011.
9-7) Risk Assessment of room air conditioning using R290, JRAIA, 1999.
9-8) W. Goetzler, L. Bendixen, P. Bartholomew, “Risk Assessment of HFC-32 and HFC-32/134a (30/70 wt%) in
Split System Residential Heat Pumps, Arthur D. Little. Inc., United States, 1998.
9-9) https://www.khk.or.jp/activities/incident_investigation/hpg_incident/refrig_incident.html
9-10) KHKS0302-3: Facility criteria of refrigeration and air conditioning equipment [Facilities of flammable gas
(including mildly flammable gas)], 2011.
9-11) JISC60079-10:2008, Electrical apparatus for explosive gas atmospheres Part 10: Classification of hazardous
areas, 2008.
9-12) IEC60335-2-40: Household and similar electrical appliances-Safety-Part 2-40 - Particular requirements for
electrical heat pumps, air-conditioners and dehumidifiers, 2005.
9-13) Building standards of Kagoshima Prefecture, Machinery and Equipment Construction, Kagoshima Prefecture.
9-14) JRA GL-13: Guideline of design construction for ensuring safety against refrigerant leakage from multi-split
system air conditioners, JRAIA, 2012.
9-15) Risk Assessment of Mildly Flammable Refrigerants 2014 Progress Report, JSRAE, 2014, pp.142–161. (in
Japanese)
- 247 -
9-16) National Institute of Standards and Technology (NIST), Standard Reference Database 23, Version 9.1, 2013.
9-17) ISO5149:2014, Refrigerating systems and heat pumps – Safety and environmental requirements, 2014.
9-18) T. Imamura, “Ignition Hazard Evaluation on Leaked A2L Refrigerants by Commercial-use Electronic Piezo
Lighter,” Journal of Japan Society for Safety Engineering, 2013, 52 (2), pp.91–98. (in Japanese)
9-19) T. Imamura, “Experimental Evaluation of Physical Hazard of A2L Refrigerant Assuming Actual Handling
Situations,” Proceedings of The International Symposium on New Refrigerants and Environmental Technology
2014, 2014, pp.73–78.
9-20) T. Saburi, “Combustion Characteristics of Flammable Refrigerant Gases,” Proceedings of the International
Symposium on New Refrigerants and Environmental Technology 2012, 2012, pp. 69–72.
9-21) K. Takizawa, “Flammability Property of 2L Refrigerants,” Proceedings of the International Symposium on New
Refrigerants and Environmental Technology 2012, 2012, pp. 73–79.
9-22) Risk Assessment of Mildly Flammable Refrigerants 2014 Progress Report, JSRAE, 2014, pp.42–58. (in
Japanese).
9-23) http://www.jti.co.jp/investors/ press_releases/2012/0730_01_appendix_02.html
9-24) IEC: 61D/WG9/2016/151G, (Revision proposal for IEC 60335-2-40: Household and similar electrical
appliances – Safety – [Part 2-40: Particular requirements for electrical heat pumps, air conditioners and
dehumidifiers]), 2016.
9-25) K. Ueda, “Risk Assessment of Chiller with A2L Refrigerant in Progress,” Proceedings of The International
Symposium on New Refrigerants and Environmental Technology 2012, 2012, pp.101–105.
- 248 -
Appendix 1: List of Committee Members
Chair
Eiji HIHARA, Professor
- Graduate School of Frontier Sciences, The University of Tokyo.
Associate Chair
Satoru FUJIMOTO
- The Japan Refrigeration and Air Conditioning Industry Association. (JRAIA)
(Daikin Industries, Ltd.)
Committee Members
Sigeru KOYAMA, Professor
- Interdisciplinary Graduate School of Engineering Sciences, Kyushu University.
Osami SUGAWA, Professor
Tomohiko IMAMURA, Associate Professor
- Department of Mechanical Engineering, Faculty of Engineering, Tokyo University of Science, Suwa.
Chaobin DANG, Associate Professor
- Graduate School of Frontier Sciences, The University of Tokyo.
Hiroyuki SUDA, Group Leader
Kenji TAKIZAWA, Senior Researcher
- Research Institute for Innovation in Sustainable Chemistry, National Institute of Advanced Industrial Science and
Technology (AIST).
Tei SABURI, Senior Researcher
Yuji WADA, Group Leader
- Research Institute of Science for Safety and Sustainability, National Institute of Advanced Industrial Science and
Technology (AIST).
Kenji MATSUDA, Senior Manager of Engineering Department
Kazuhiro HASEGAWA, Section Manager of Engineering Department
- The Japan Refrigeration and Air Conditioning Industry Association. (JRAIA)
Kenji TAKAICHI, Staff Engineer
- The Japan Refrigeration and Air Conditioning Industry Association. (JRAIA)
(Appliances Company Corporation Engineering Division, Panasonic Corporation.)
Takeshi WATANABE, Staff Engineer
- The Japan Refrigeration and Air Conditioning Industry Association. (JRAIA)
(Appliances Company Corporation Engineering Division, Panasonic Corporation.)
Ryuzaburo YAJIMA
- 249 -
- The Japan Refrigeration and Air Conditioning Industry Association. (JRAIA)
(Daikin Industries, Ltd.)
Kenji UEDA
- The Japan Refrigeration and Air Conditioning Industry Association. (JRAIA)
(Machinery, Equipment & Infrastructure Air-Conditioning & Refrigeration Division Chiller & Heat Pump Engineering
Department, Mitsubishi Heavy Industries, Ltd.)
Takeshi ICHINOSE, Group Leader
- Business Affairs Department, Japan Automobile Manufacturers Association, Inc. (JAMA)
Jun ICHIOKA
- Safety Committee, Japan Society of Refrigeration and Air Conditioning Engineers. (JSRAE)
(Mitsubishi Heavy Industries Air-Conditioning & Refrigeration Corporation)
Kenji TSUJI
- Safety Committee, Japan Society of Refrigeration and Air Conditioning Engineers. (JSRAE)
(Daikin Industries, Ltd.)
Observers
Takashi ICHIKAWA, Assistant Director
- Fluoride Gases Management Office, Chemical Management Policy Division, Ministry of Economy, Trade and Industry
Noboru KANUMA, Assistant Director
- Industrial Machinery Division, Ministry of Economy, Trade and Industry
Masamichi ABE, Director
Noboru TAKARAYAMA, Project Coordinator
Mika SUZAWA
- Environment Department, New Energy and Industrial Technology Development Organization. (NEDO)
Moriaki IINUMA, Manager
- Refrigeration Safety Division, High Pressure Gas Safety Department, The High Pressure Gas Safety Institute of Japan
Yasuhisa NAKASO, Manager (Energy Utilization Research)
- Sales Department, The Kansai Electric Power Co, Inc.
- 250 -
Appendix 2: List of Authors
Chapter 1 Eiji HIHARA/ The University of Tokyo
Satoru FUJIMOTO/ Daikin Ind.
Chapter 2 Kenji TAKIZAWA/ AIST
Contributor: Eiji HIHARA, Chaobin DANG, Makoto ITO/ The University of Tokyo
Chapter 3 Tomohiko IMAMURA, Osami SUGAWA/ Tokyo University of Science, Suwa
Contributor: Eiji HIHARA, Chaobin DANG, Tomohiro HIGASHI/ The University of Tokyo
Chapter 4 Tei SABURI, Yuji WADA/ AIST
Chapter 5 Kenji TAKAICHI/ Panasonic
Contributor: Ryuzaburo YAJIMA, Satoru FUJIMOTO/ Daikin Ind.; Kenji UEDA/ Mitsubishi Heavy Ind.; Takeshi
WATANABE/ Panasonic
Chapter 6 Kenji TAKAICHI/ Panasonic
Shigeharu TAIRA/ Daikin Ind.
Contributor: Madoka UENO/ Sharp; Katsunori MURATA, Akio TASAKA, Satoru FUJIMOTO/ Daikin Ind.; Koichi
YAMAGUCHI/ Toshiba Carrier; Ryoichi TAKAFUJI/ Johnson Controls-Hitachi Air Cond.; Toshiyuki FUJI/ Fujitsu
General; Hiroaki MAKINO/ Mitsubishi Elec.
Chapter 7 Takeshi WATANABE/ Panasonic
Contributor: Tsuyoshi YAMADA, Ryuzaburo YAJIMA, Shigeharu TAIRA, Takashi HASEGAWA/ Daikin Ind.; Akihiro
SUZUKI, Hiroichi YAMAGUCHI/ Toshiba Carrier; Kazuhiro TSUCHIHASHI, Shunji SASAKI/ Johnson Controls-Hitachi
Air Cond.; Toshiyuki FUJI/ Fujitsu General; Kenichi MURAKAMI, Kenichi MURAKAMI, Tetsuji FUJINO/ Mitsubishi
Heavy Ind.; Yasuhiro SUZUKI, Takuho HIRAHARA, Naoshi TAKIMOTO/ Mitsubishi Elec.; Kenji TAKAICHI/ Panasonic;
Kazuhiro HASEGAWA/ JRAIA
Chapter 8 Ryuzaburo YAJIMA/ Daikin Ind.
Contributor: Yukio KIGUCHI, Hiroichi YAMAGUCHI/ Toshiba Carrier; Katsuyuki TSUNO, Kenji TAKAICHI/ Panasonic;
Shunji SASAKI, Tetsushi KISHITANI, Eiji SATO/ Johnson Controls-Hitachi Air Cond.; Shuntaro ITO, Takahiro
MATSUNAGA/ Fujitsu General; Koji YAMASHITA/ Mitsubishi Elec.; Tatsumi KANNON/ Mitsubishi Heavy Ind.; Shinya
MATSUOKA, Masato YOSHIZAWA/ Daikin Ind.; Kazuhiro HASEGAWA/ JRAIA
Chapter 9
- 251 -

Kenji UEDA/ Mitsubishi Heavy Ind.
Contributor: Masayuki AIYAMA/ Johnson Controls-Hitachi Air Cond.; Mikio ITO/ Ebara Ref. Equip. Systems; Isao IBA,
Hiroichi YAMAGUCHI/ Toshiba Carrier; Naoki KOBAYASHI, Yosuke MUKAI/ Mitsubishi Heavy Ind.; Tetsuji SAIKUSA,
Yoshihiro SUMIDA, Koji YAMASHITA, Takuho HIRAHARA/ Mitsubishi Elec.; Mamoru SENDA/ Panasonic; Tomokazu
TASHIMO/ Kobe Steel; Shuji FUKANO/ Maekawa Mfg.;Hiroaki OKAMOTO/ Univ. Tokyo
- 252 -