Performances e produção de efeitos subjetivos no Instagram e no YouTube
Upload
khangminh22Category
view
0download
0
UNIVERSITAT POLITÈCNICA DE CATALUNYA (UPC)BarcelonaTech
FACULTAT D’INFORMÀTICA DE BARCELONA (FIB)
MASTER IN INNOVATION AND RESEARCH IN INFORMATICS
Data Science
Predicting the number of likes onInstagram with TensorFlow
AuthorJoel Cantero Priego
AdvisorAlfredo Vellido Alcacena
DepartmentComputer Science
Date of DefenseOctober 26, 2020
Predicting the number of likes on Instagram with TensorFlow
Abstract
1 billion people use Instagram every month[1], which makes it one ofthe most popular social networks worldwide [2]. Currently, there is anenormous scope market with the potential to be optimized to increaseInstagram posts popularity and engagement. In this project, the maingoal is to predict the number of likes given a post, building a deeplearning model. This model will use convolutional neural networks,natural language processing and other deep learning techniques withinthe TensorFlow framework. The input data is composed of categorical,numerical data, as well as some image and text data.
1
Predicting the number of likes on Instagram with TensorFlow
Index
1 Introduction 71.1 Context . . . . . . . . . . . . . . . . . . . . . . . . . . . . . . 71.2 Goals . . . . . . . . . . . . . . . . . . . . . . . . . . . . . . . . 71.3 Motivation . . . . . . . . . . . . . . . . . . . . . . . . . . . . . 8
2 State-of-the-art 92.1 Existing applications . . . . . . . . . . . . . . . . . . . . . . . 9
2.1.1 LikelyAI . . . . . . . . . . . . . . . . . . . . . . . . . . 102.1.2 Beautiful Destinations . . . . . . . . . . . . . . . . . . 10
3 Methodology 103.1 Strategy . . . . . . . . . . . . . . . . . . . . . . . . . . . . . . 113.2 Technologies . . . . . . . . . . . . . . . . . . . . . . . . . . . . 12
3.2.1 R . . . . . . . . . . . . . . . . . . . . . . . . . . . . . . 123.2.2 RStudio . . . . . . . . . . . . . . . . . . . . . . . . . . 133.2.3 Git . . . . . . . . . . . . . . . . . . . . . . . . . . . . . 133.2.4 GitHub . . . . . . . . . . . . . . . . . . . . . . . . . . 133.2.5 TensorFlow . . . . . . . . . . . . . . . . . . . . . . . . 143.2.6 Python packages . . . . . . . . . . . . . . . . . . . . . 14
3.2.6.1 Pandas . . . . . . . . . . . . . . . . . . . . . 143.2.6.2 Selenium WebDriver . . . . . . . . . . . . . . 143.2.6.3 Scikit-learn . . . . . . . . . . . . . . . . . . . 153.2.6.4 fastText . . . . . . . . . . . . . . . . . . . . . 15
4 Development 164.1 Available data . . . . . . . . . . . . . . . . . . . . . . . . . . . 164.2 Gathering Instagram influencers . . . . . . . . . . . . . . . . . 184.3 Selecting variables . . . . . . . . . . . . . . . . . . . . . . . . 204.4 Gathering post information . . . . . . . . . . . . . . . . . . . 204.5 First data preparation . . . . . . . . . . . . . . . . . . . . . . 224.6 Exploratory Data Analysis . . . . . . . . . . . . . . . . . . . . 23
4.6.1 Univariate analysis . . . . . . . . . . . . . . . . . . . . 234.7 Second data preparation . . . . . . . . . . . . . . . . . . . . . 29
4.7.1 Data selection . . . . . . . . . . . . . . . . . . . . . . . 294.7.2 Reconstructing data . . . . . . . . . . . . . . . . . . . 29
4.8 Second exploratory data analysis . . . . . . . . . . . . . . . . 29
2
Predicting the number of likes on Instagram with TensorFlow
4.8.1 Univariate analysis . . . . . . . . . . . . . . . . . . . . 304.8.2 Bivariate analysis . . . . . . . . . . . . . . . . . . . . . 32
4.9 Data preprocess . . . . . . . . . . . . . . . . . . . . . . . . . . 394.9.1 Feature selection . . . . . . . . . . . . . . . . . . . . . 404.9.2 Feature engineering time . . . . . . . . . . . . . . . . . 404.9.3 Normalization . . . . . . . . . . . . . . . . . . . . . . . 414.9.4 Split dataset . . . . . . . . . . . . . . . . . . . . . . . . 424.9.5 Cleaning text . . . . . . . . . . . . . . . . . . . . . . . 424.9.6 Building corpus . . . . . . . . . . . . . . . . . . . . . . 434.9.7 Training fastText model . . . . . . . . . . . . . . . . . 43
4.10 Modeling . . . . . . . . . . . . . . . . . . . . . . . . . . . . . . 444.10.1 Neural network model architecture . . . . . . . . . . . 444.10.2 Optimizer . . . . . . . . . . . . . . . . . . . . . . . . . 554.10.3 Loss function . . . . . . . . . . . . . . . . . . . . . . . 564.10.4 Metric . . . . . . . . . . . . . . . . . . . . . . . . . . . 574.10.5 Training models . . . . . . . . . . . . . . . . . . . . . . 58
5 Evaluation 64
6 Conclusions 656.1 Future work . . . . . . . . . . . . . . . . . . . . . . . . . . . . 66
7 List of References 67
8 Annexes 708.1 R packages used . . . . . . . . . . . . . . . . . . . . . . . . . . 708.2 Python packages used . . . . . . . . . . . . . . . . . . . . . . 71
3
Predicting the number of likes on Instagram with TensorFlow
List of Figures1 Coobis: Content Marketing, Influencers & Branded Content . 192 JSON file obtained for a given influencer . . . . . . . . . . . . 213 Density plot of followers . . . . . . . . . . . . . . . . . . . . . 234 Density plot of following . . . . . . . . . . . . . . . . . . . . . 245 Density plot of total posts . . . . . . . . . . . . . . . . . . . . 246 Density plot of highlight reel count . . . . . . . . . . . . . . . 257 Density plot of the number of likes . . . . . . . . . . . . . . . 258 Bar plot of is_business_account variable . . . . . . . . . . . . 269 Bar plot of is_verified variable . . . . . . . . . . . . . . . . . . 2610 Bar plot of weekdays . . . . . . . . . . . . . . . . . . . . . . . 2711 Bar plot of hours . . . . . . . . . . . . . . . . . . . . . . . . . 2812 Bar plot of minutes . . . . . . . . . . . . . . . . . . . . . . . . 2813 Bar plot of number of likes (second exploratory data analysis) 3014 Bar plot of followers (second exploratory data analysis) . . . . 3015 Bar plot of weekdays (second exploratory data analysis) . . . . 3116 Bar plot of hours (second exploratory data analysis) . . . . . . 3117 Bar plot of weekdays (second exploratory data analysis) . . . . 3118 Bar plot of hours (second exploratory data analysis) . . . . . . 3119 Bar plot of minutes (second exploratory data analysis) . . . . 3120 Bar plot of is_business_account variable (second exploratory
data analysis) . . . . . . . . . . . . . . . . . . . . . . . . . . . 3121 Bar plot of is_sidecar variable (second exploratory data analysis) 3222 Density plot of highlight-reel count (second exploratory data
analysis) . . . . . . . . . . . . . . . . . . . . . . . . . . . . . . 3223 Density plot of total posts (second exploratory data analysis) . 3224 Number of likes according to the number of following . . . . . 3325 Number of likes according to followers . . . . . . . . . . . . . 3426 Number of likes according to the average number of likes . . . 3427 Number of likes according to the weekday . . . . . . . . . . . 3528 Number of likes according to the hour . . . . . . . . . . . . . . 3629 Number of likes according to the minute . . . . . . . . . . . . 3630 Number of likes according to is_business_account variable . . 3731 Number of likes according to is_sidecar variable . . . . . . . . 3832 Number of likes according to is_verified variable . . . . . . . . 3833 Correlation matrix for numerical variables . . . . . . . . . . . 3934 x_time and y_time . . . . . . . . . . . . . . . . . . . . . . . . 40
4
Predicting the number of likes on Instagram with TensorFlow
35 Continuous bag of words example . . . . . . . . . . . . . . . . 4336 Model architecture. . . . . . . . . . . . . . . . . . . . . . . . . 4537 The canonical form of a residual neural network. A layer ℓ1 is
skipped over activation from ℓ2 [33]. . . . . . . . . . . . . . . 4638 Variables model architecture. . . . . . . . . . . . . . . . . . . 4739 fastText model architecture . . . . . . . . . . . . . . . . . . . 4840 Text model branch architecture . . . . . . . . . . . . . . . . . 4941 Output images after applying data augmentation techniques . 5042 ResNet block architecture . . . . . . . . . . . . . . . . . . . . 5243 ResNet block architecture . . . . . . . . . . . . . . . . . . . . 5344 Random image subset of high predicted engagement rate . . . 5445 Random image subset of low predicted engagement rate . . . . 5446 Hybrid model architecture . . . . . . . . . . . . . . . . . . . . 5547 Logistic regression training negative log-likelihood on MNIST
images and IMDB movie reviews with 10,000 bag-of-words(BoW) feature vectors. [36] . . . . . . . . . . . . . . . . . . . . 56
48 Variables model training. Mean Absolute Error along with thenumber of epochs. . . . . . . . . . . . . . . . . . . . . . . . . . 59
49 Image model training. Mean Absolute Error along with thenumber of epochs. . . . . . . . . . . . . . . . . . . . . . . . . . 60
50 Text model training. Mean Absolute Error along the numberof epochs. . . . . . . . . . . . . . . . . . . . . . . . . . . . . . 61
51 Hybrid model training. Mean Absolute Error along the num-ber of epochs. . . . . . . . . . . . . . . . . . . . . . . . . . . . 63
List of Tables1 Available data for user . . . . . . . . . . . . . . . . . . . . . . 162 Available data for post . . . . . . . . . . . . . . . . . . . . . . 173 Selected variables . . . . . . . . . . . . . . . . . . . . . . . . . 204 Prepared data variables . . . . . . . . . . . . . . . . . . . . . . 225 Variables model metrics . . . . . . . . . . . . . . . . . . . . . 596 Variables model: actual number of likes vs the predicted num-
ber of likes . . . . . . . . . . . . . . . . . . . . . . . . . . . . . 597 Image model metrics . . . . . . . . . . . . . . . . . . . . . . . 608 Image model: actual engagement rate vs predicted engagement
rate . . . . . . . . . . . . . . . . . . . . . . . . . . . . . . . . 61
5
Predicting the number of likes on Instagram with TensorFlow
9 Text model metrics . . . . . . . . . . . . . . . . . . . . . . . . 6210 Text model: actual engagement rate vs Predicted engagement
rate . . . . . . . . . . . . . . . . . . . . . . . . . . . . . . . . 6211 Hybrid model metrics . . . . . . . . . . . . . . . . . . . . . . . 6312 Hybrid model: actual number of likes vs the predicted number
of likes . . . . . . . . . . . . . . . . . . . . . . . . . . . . . . . 6313 Comparing results with the baseline model . . . . . . . . . . . 65
6
Predicting the number of likes on Instagram with TensorFlow
1 Introduction
1.1 Context
1 billion people use Instagram every month [1], which makes it one of themost popular social networks worldwide [2]. Besides, 90% of accounts follow abusiness account on Instagram [3]. Due to the app’s content, it is a valuablesocial media marketing tool for business, a huge opportunity for brands.
On the other hand, influencers, who are creators with a large number offollowers that share content on social networks, can build communities aroundtopics and niches. They use Instagram, as a visual platform, to make regularposts and generate large followings of engaged people who pay close attentionto their views.
For that reason, there is a special relationship between influencers and brands.Influencers know their followers and are conscious about what kind of contentthey want to consume, that way, it can help brands to communicate theirmessages. Commonly, Instagram influencers get paid by brands to make thepromotion of a product and service.
Currently, there is an enormous scope market with the potential to be op-timized to increase Instagram posts popularity and engagement. So for thatreason, I proposed to Alfredo Vellido to create a system that predicts thenumber of likes given a post and identify which variables help to increaseit. Using that system, it will generate an estimation so that posts can beoptimized to gather the most amount of visibility as well as engagement.This outcome is interesting to many stakeholders, such as digital marketers,influencers, and even regular users.
1.2 Goals
As mentioned before, the main project goal is to predict the number of likesgiven a post, building a Deep Learning model. This model will use convolu-tional neural networks, natural language processing and other Deep Learningtechniques within the TensorFlow framework. The input data is composedof categorical, numerical data, as well as some image and text data.
Beforehand, we will perform a state of the art study of predicting the popu-larity of an image. Next, we will perform a full univariate and multivariate
7
Predicting the number of likes on Instagram with TensorFlow
analysis in our exploratory data analysis process to study our dataset ob-tained.
To measure our model performance, we will need to establish a methodologythat evaluates our model versions through accuracy indicators.
These goals are going to be detailed and explained in the following sections.
1.3 Motivation
When I was coursing the last year of the bachelor’s degree in InformaticsEngineering, one of my lasts subjects was Applied Engineering Project [4].The goal of this subject is to work on a multi-disciplinary project takinga base on a challenge defined by a company. In my case, I had the firstopportunity to work on a machine learning project in which the aim wasto classify dental implants given a dental x-ray. I really enjoyed the projectdevelopment as well as I was discovering the Data Science world for the firsttime. When I completed my degree, I understood that there are numerousfields of computer science and I had to choose one of them. For that reason,I decided to keep studying coursing a master’s degree in Innovation andResearch in Informatics, major in Data Science.
When I had to choose my master thesis, it was clear to me that I wantedit to be TensorFlow [5] related project, so I asked to Alfredo Vellido to bemy advisor. I chose TensorFlow framework to develop this project for thefollowing reasons:
• I have been working as a data scientist for a year and a half atCatalana Occident [6] and we use TensorFlow to solve our machinelearning problems.
• TensorFlow is one of the most popular deep learning frame-works. Besides, it is still growing fast because of its developer commu-nity, it is an open source library, and of course, because it is created byGoogle, the second most valuable brand in the world [7] .
• TensorFlow uses Keras API which allows us to build complex deepneural networks from a higher implementation level. Keras helps tomanage input layers with different data types: numerical, categorical,text and image data.
8
Predicting the number of likes on Instagram with TensorFlow
2 State-of-the-art
Actually, there is much interest among regular users to predict the popularityin social networks and has received a lot of attention from the researchers.While the greater part of the past works has focused on predicting popularityof text content, such as messages on Twitter, and some recent works onYouTube video popularity, significantly less effort has been expended in theprediction of image popularity.
There is some literature and systems about predicting the popularity of animage before it is uploaded.
In line with Kosha’s work, What Makes An Image Popular? [8], image anal-ysis is divided into two key components:
• Image cues. The image content itself. We can investigate many fea-tures that could be used to explain the popularity of images. In ourproject goal, these features will be identified by a convolutional neuralnetwork.
• Social cues. In the Instagram context, social cues play a significantrole in the number of likes an image will receive. A user with a largernumber of followers would naturally receive a higher number of likes.Additionally, we can assume that the post time of the post and theaverage of number of likes are as well as social indicators, among others.
Crystal J. Qian’s [9] demonstrated that some interesting features that canpredict the popularity of an image. Comment count has the strongest pre-dictive power, corresponding positively to popularity. A greater side lengthimage also corresponds positively, likely because larger images tend to be ofhigher quality.
2.1 Existing applications
Nowadays, many applications try to predict the popularity of Instagramposts.
9
Predicting the number of likes on Instagram with TensorFlow
2.1.1 LikelyAI
LikelyAI [10] was developed by former Facebook and Google employees, itextracts thousands of data points from an image and recognizes the popularpatterns. Objects, colors, emotions, shapes, lighting, size and position – allof them are data points. The user has to select multiple photos to evaluate,then the algorithm evaluates every single photo and finally the app sorts hisphotos and display results.
It seems that the project was discontinued because they have not updatedthe app since October 2017.
2.1.2 Beautiful Destinations
Beautiful Destinations [11], a travel and lifestyle brand that has more than10,5 million followers in 180 countries, built an algorithm [12] that tells howmany likes and comments a photo will get.
They created the algorithm by collecting a lot of photos from many socialnetworks (Instagram, Flicker and Pinterest) that had reactions to make cor-relations.
This software helps to their community managers to choose which Instagramphoto to use, the one that will obtain the most likes.
The fact is that the app is just for company use, it is not public. The algorithmis trained with just travel and lifestyle pictures, and for this reason, thealgorithm works better in this specific topic.
Beautiful Destinations is already working on a new task: predicting audienceengagement with videos.
In line with Beautiful Destinations, this project will focus on just one topicto predict image popularity. This is one of the most key points to fit ouralgorithm on a specific image topic.
3 Methodology
In this following section we are going to specify our methodology that is goingto be applied in this project. Firstly, all the steps included in our workflowwill be described. Also, all the technologies that will be used to successfully
10

Predicting the number of likes on Instagram with TensorFlow
build the model will be listed, as well as the justification for why we havechosen them.
3.1 Strategy
Using a correct machine learning strategy helps to get our machine learningsystems much more quickly and efficiently. As Andrew Ng states in his courseAI For Everyone [13], there are three key steps of a machine learning project:
• Collect data. Data collection is one of the most important tasks in amachine learning project. In this step we gather information from oneor different sources. Collecting data will allows us to use data analysisto find recurring patterns and to build predictive models. Predictivemodels are only as satisfactory as the data from which they are built.Putting all our effort in that step is crucial to developing fine models.After the data is collected, there are two more steps: data preparationand data preprocessing.
– Data preparation: is the process to transform the collected datainto a form that is more appropriate for modeling. It includes adata cleaning (identifying missing values), data selection and datatransformation (changing the type of variables).
– Data preprocessing: is the step in which the data is encoded tobring it to a state that can now be easily interpreted by the ma-chine learning algorithm [14]. This includes proper labeling of cat-egorical variables (converting them to numerical variables), clean-ing text, and standardization of numeric variables.
• Train model. This means we will use a deep learning model to learnour input (variables, text and image) to output the prediction, in thiscase, the number of likes of the post. The process of training a model isto determine correct values for all the weights and the bias from labeledexamples, in this case, posts that we know the number of likes gathered.As we have labeled examples, a supervised learning algorithm is used.These sorts of algorithms build a model by examining a large numberof labeled examples and try to figure out a model that minimizes loss,the penalty for an incorrect prediction.
• Deploy model. Once the model is trained and tested, the model is
11
Predicting the number of likes on Instagram with TensorFlow
deployed. However, the process is not done: we can get data back,obtain new examples of Instagram posts with their number of likes(new labeled data) to maintain and update the model. Hopefully, themodel continually gets better and better to the point where we end upwith a software that can do a good job predicting the number of likesfrom an unpublished Instagram post.
These steps are not sequential. As Andrew Ng states in Machine LearningYearning [15], machine learning workflow is a very iterative process:
"Build your first system quickly, then iterate".
Andrew Ng
For that reason, the first model will be designed and built quickly and thenwe will try many ideas before finding the final model version. This meansthat probably we will iterate collecting, preparing and preprocessing data,even when the model is deployed.
3.2 Technologies
3.2.1 R
R [16] is a language and environment for statistical computingand graphics .R provides a wide variety of statistical (linearand nonlinear modeling, classical statistical tests, time-seriesanalysis, classification, clustering, . . . ) and graphical tech-niques, and is highly extensible. The S language is often thevehicle of choice for research in statistical methodology, andR provides an Open Source route to participation in thatactivity.
R will be used as a programming language to perform theexploratory data analysis, using an Integrated DevelopmentEnvironment (IDE) called RStudio.
12
Predicting the number of likes on Instagram with TensorFlow
3.2.2 RStudio
RStudio [17] is a set of integrated tools designed to helpyou be more productive with R and Python. It includes aconsole, syntax-highlighting editor that supports direct codeexecution, and a variety of robust tools for plotting, viewinghistory, debugging and managing your workspace.
RStudio will be used to perform the exploratory data analysisand to show the results.
3.2.3 Git
Git [18] is a distributed version control system. It is designedfor coordinating work among programmers, but it can be usedto track changes in any set of files. Its goals include speed,data integrity, and support for distributed, non-linear work-flows.
3.2.4 GitHub
GitHub [19] is a distributed version-control platform thatuses Git here users can collaborate on or adopt open sourcecode projects, fork code, share ideas and more. It offers thedistributed version control and source code management(SCM) functionality of Git, plus its own features. GitHuboffers its basic services free of charge. Its more advancedprofessional and enterprise services are commercial.
GitHub will be used as a version control system to managethe project code.
13

Predicting the number of likes on Instagram with TensorFlow
3.2.5 TensorFlow
TensorFlow [5] is a free and open-source software libraryfor dataflow and differentiable programming across a rangeof tasks. It is a symbolic math library, and is also used formachine learning applications such as neural networks. It isused for both research and production at Google.
TensorFlow will be used as a deep learning framework totrain the neural network of our project.
3.2.6 Python packages
In this section, all the python packages needed for the project developmentwill be listed.
3.2.6.1 Pandas
Pandas [20] is a fast, powerful, flexible and easy to use opensource tool for data manipulation and analysis, written forthe Python programming language. In particular, it offersdata structures and operations for manipulating numericaltables and time series.
Pandas will be used as a data manipulation tool for load ourdataset and preprocess it.
3.2.6.2 Selenium WebDriver
Selenium [21] Selenium WebDriver drives a browser natively,as a real user would, either locally or on remote machines.
Pandas will be used as a data manipulation tool to load ourdataset and preprocess it.
14
Predicting the number of likes on Instagram with TensorFlow
3.2.6.3 Scikit-learn
Scikit-learn [22] is a free software machine learning libraryfor Python. It features various classification, regression andclustering algorithms including support vector machines,random forests, gradient boosting, k-means and DBSCAN,and is designed to interoperate with the Python numericaland scientific libraries NumPy and SciPy.
Scikit-learn will be used as a data manipulation tool to splitour dataset into train, validation and test set.
3.2.6.4 fastText
fastText [23] is a library for the learning of word embeddingsand text classification created by Facebook’s AI Research.The model allows one to create an unsupervised learning orsupervised learning algorithms for obtaining vector represen-tations for words. fastText uses a neural network for wordembedding. The algorithm of fasttext is based on these twopapers. Enriching Word Vectors with Subword Information[24] and Bag of Tricks for Efficient Text Classification [25]
fastText will be used for obtaining vector representations forour text data (post caption and user biography). An ownfasttext model will be trained (train_unsupervised function)using cbow (continuous bag of words). Cbow model predictsthe target word according to its context. The context isrepresented as a bag of the words contained in a fixed sizewindow around the target word.
15
Predicting the number of likes on Instagram with TensorFlow
4 Development
In this chapter, the available data for our project are summarily described,followed by the data acquisition methods, data preparation, data preprocess-ing and the strategies to increase the interpretability of the data.
Finally, the model architecture and the training process are explained.
4.1 Available data
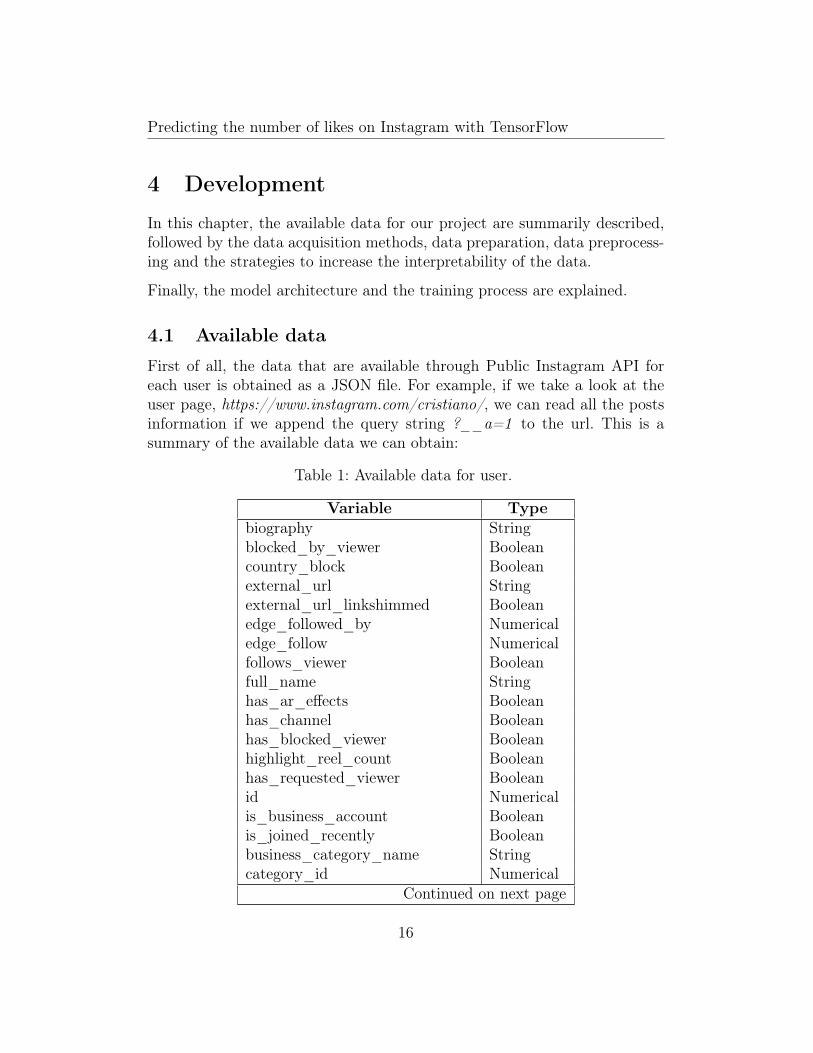
First of all, the data that are available through Public Instagram API foreach user is obtained as a JSON file. For example, if we take a look at theuser page, https://www.instagram.com/cristiano/, we can read all the postsinformation if we append the query string ?__a=1 to the url. This is asummary of the available data we can obtain:
Table 1: Available data for user.
Variable Typebiography Stringblocked_by_viewer Booleancountry_block Booleanexternal_url Stringexternal_url_linkshimmed Booleanedge_followed_by Numericaledge_follow Numericalfollows_viewer Booleanfull_name Stringhas_ar_effects Booleanhas_channel Booleanhas_blocked_viewer Booleanhighlight_reel_count Booleanhas_requested_viewer Booleanid Numericalis_business_account Booleanis_joined_recently Booleanbusiness_category_name Stringcategory_id Numerical
Continued on next page
16

Predicting the number of likes on Instagram with TensorFlow
Table 1 – continued from previous pageVariable Type
overall_category_name Stringis_private Booleanis_verified Booleanedge_mutual_followed_by Numericalprofile_pic_url Stringprofile_pic_url_hd Stringrequested_by_viewer Booleanusername Stringconnected_fb_page Categoricalhiglight_reel_count Numericaledge_felix_video_timeline Numericaledge_media_collections Numericaledge_owner_to_timeline_media Numericaledge_saved_media Numericaledge_felix_video_timeline Numerical
Table 2: Available data for post.
Variable Type__typename Stringid Numericalshortcode Stringheight Numericalwidth Numericaldisplay_url Stringgating_info Numericalfact_check_overall_rating Booleanfact_check_information Stringmedia_preview Stringis_video Booleanaccessibility_caption Booleanedge_media_to_caption Stringedge_media_to_comment Numericalcomments_disabled Boolean
Continued on next page
17
Predicting the number of likes on Instagram with TensorFlow
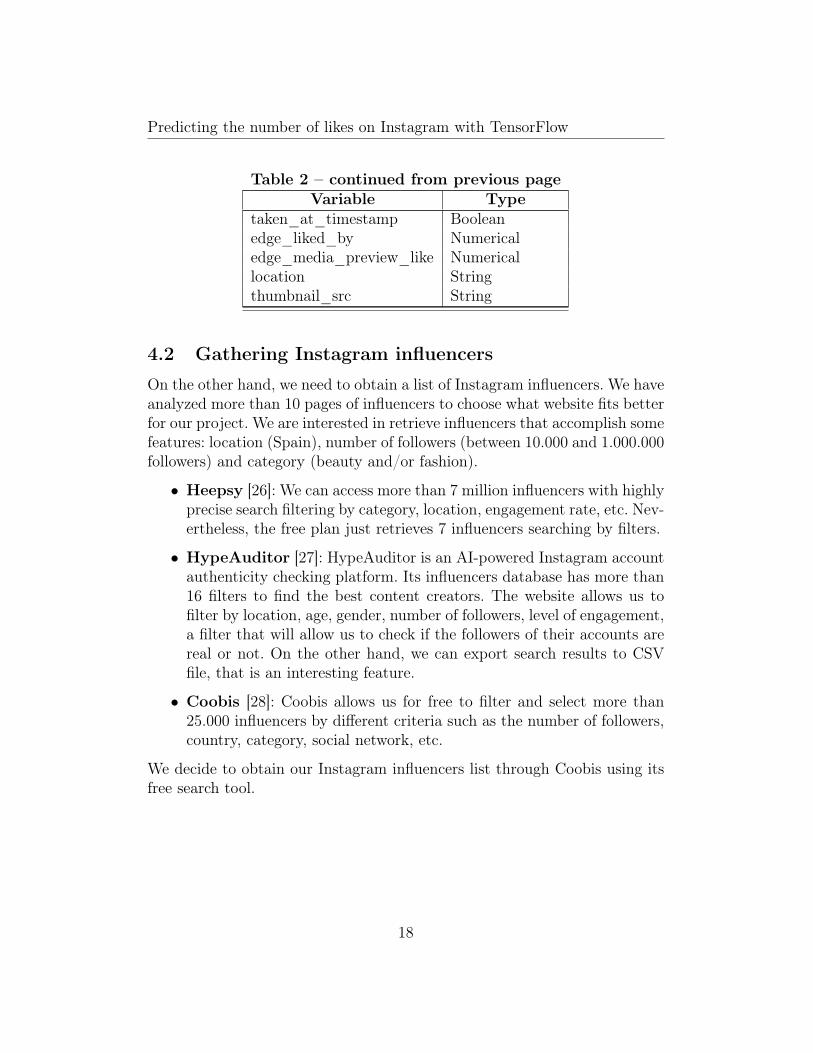
Table 2 – continued from previous pageVariable Type
taken_at_timestamp Booleanedge_liked_by Numericaledge_media_preview_like Numericallocation Stringthumbnail_src String
4.2 Gathering Instagram influencers
On the other hand, we need to obtain a list of Instagram influencers. We haveanalyzed more than 10 pages of influencers to choose what website fits betterfor our project. We are interested in retrieve influencers that accomplish somefeatures: location (Spain), number of followers (between 10.000 and 1.000.000followers) and category (beauty and/or fashion).
• Heepsy [26]: We can access more than 7 million influencers with highlyprecise search filtering by category, location, engagement rate, etc. Nev-ertheless, the free plan just retrieves 7 influencers searching by filters.
• HypeAuditor [27]: HypeAuditor is an AI-powered Instagram accountauthenticity checking platform. Its influencers database has more than16 filters to find the best content creators. The website allows us tofilter by location, age, gender, number of followers, level of engagement,a filter that will allow us to check if the followers of their accounts arereal or not. On the other hand, we can export search results to CSVfile, that is an interesting feature.
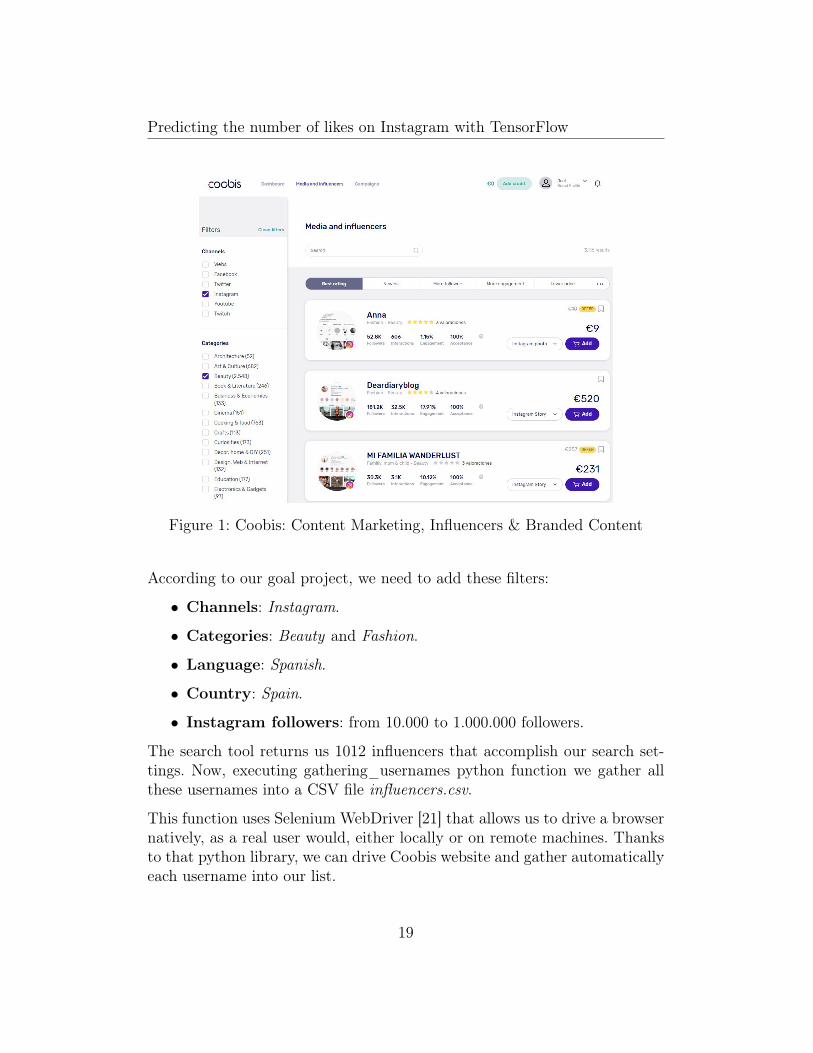
• Coobis [28]: Coobis allows us for free to filter and select more than25.000 influencers by different criteria such as the number of followers,country, category, social network, etc.
We decide to obtain our Instagram influencers list through Coobis using itsfree search tool.
18
Predicting the number of likes on Instagram with TensorFlow
Figure 1: Coobis: Content Marketing, Influencers & Branded Content
According to our goal project, we need to add these filters:
• Channels: Instagram.
• Categories: Beauty and Fashion.
• Language: Spanish.
• Country: Spain.
• Instagram followers: from 10.000 to 1.000.000 followers.
The search tool returns us 1012 influencers that accomplish our search set-tings. Now, executing gathering_usernames python function we gather allthese usernames into a CSV file influencers.csv.
This function uses Selenium WebDriver [21] that allows us to drive a browsernatively, as a real user would, either locally or on remote machines. Thanksto that python library, we can drive Coobis website and gather automaticallyeach username into our list.
19
Predicting the number of likes on Instagram with TensorFlow
4.3 Selecting variables
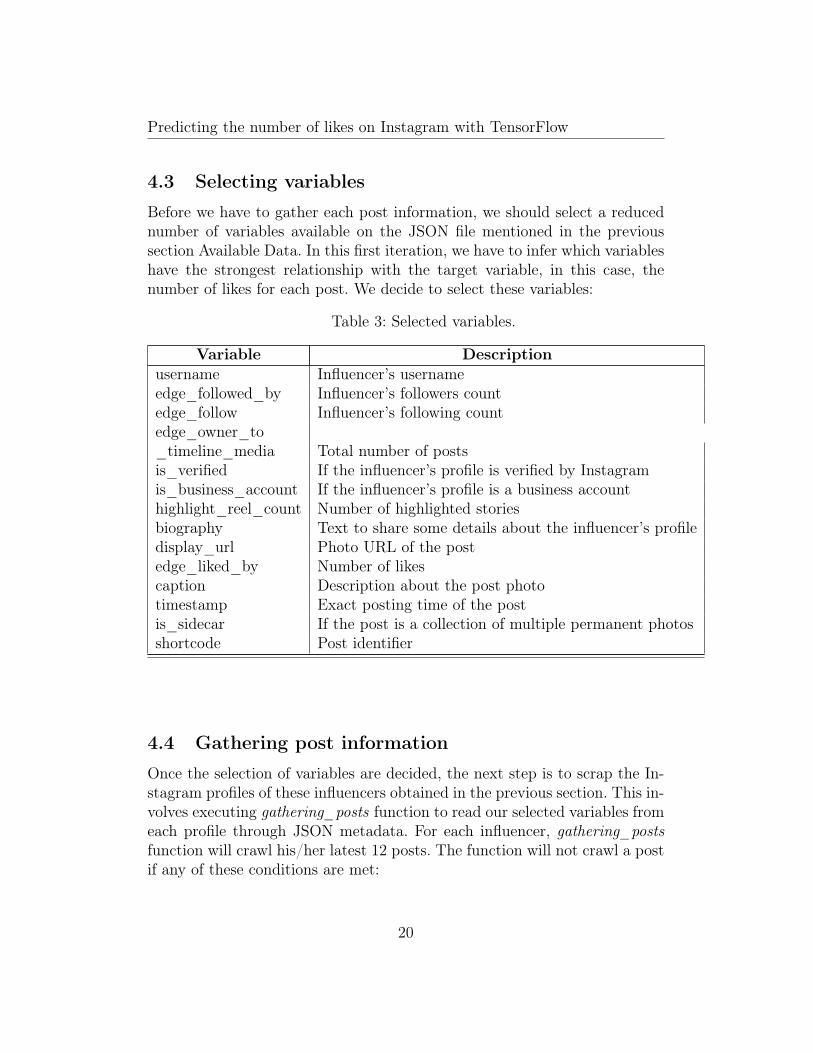
Before we have to gather each post information, we should select a reducednumber of variables available on the JSON file mentioned in the previoussection Available Data. In this first iteration, we have to infer which variableshave the strongest relationship with the target variable, in this case, thenumber of likes for each post. We decide to select these variables:
Table 3: Selected variables.
Variable Descriptionusername Influencer’s usernameedge_followed_by Influencer’s followers countedge_follow Influencer’s following countedge_owner_to_timeline_media Total number of postsis_verified If the influencer’s profile is verified by Instagramis_business_account If the influencer’s profile is a business accounthighlight_reel_count Number of highlighted storiesbiography Text to share some details about the influencer’s profiledisplay_url Photo URL of the postedge_liked_by Number of likescaption Description about the post phototimestamp Exact posting time of the postis_sidecar If the post is a collection of multiple permanent photosshortcode Post identifier
4.4 Gathering post information
Once the selection of variables are decided, the next step is to scrap the In-stagram profiles of these influencers obtained in the previous section. This in-volves executing gathering_posts function to read our selected variables fromeach profile through JSON metadata. For each influencer, gathering_postsfunction will crawl his/her latest 12 posts. The function will not crawl a postif any of these conditions are met:
20

Predicting the number of likes on Instagram with TensorFlow
• Is a video post: If the post is a video the function is not interested tocrawl it. We are looking for posts that contain an image because latera convolutional neural network (CNN) will be used to extract somefeatures of the image.
• Is a recent post: if the post has been published recently (one day), weare not interested in it because the number of likes, our target variable,may not be optimal, it will keep growing.
• It does not contain a caption: If the post has not a caption thefunction will not crawl it. We will extract text features for each postcaption using Natural Language Processing techniques.
The gathering_posts function returns the final result is a hierarchical JSONfile that for each influencer contains each post data. It looks like this:
Figure 2: JSON file obtained for a given influencer
However, executing gathering_posts function we figure out that some profilesthat are private (37) or do not exists (48). So, the total number of profilesgathered is 931.
First of all, we need to convert this JSON file to a CSV file to provide ourfuture model to ingest the data. The json_to_csv python will adapt ourJSON to a single CSV file.
9905 post data from 931 Instagram Beauty & Fashion influencers from Spainwere collected to train and test our model.
21
Predicting the number of likes on Instagram with TensorFlow
4.5 First data preparation
Before performing the exploratory data analysis, we need to transform theraw data that was collected into a form that can be used in modeling. Infirst_dataprep function, we use some techniques such as data cleaning (iden-tify missing values) and data transformation (changing the type of variablesor adding new ones in the dataset).
• Converting timestamp: One of the variables we have selected (Table3) is timestamp. The timestamp is the exact posting time of the post,but it is just an integer that is not understandable. For that reason,the datetime python package is used to convert it into 3 new variables:weekday, hour, and minute.
• Discarding users with just one post: if we have gathered a userwith just one post, it will be discarded because the average number oflikes will not be consistent.
Table 4: Prepared data variables.
Variable Descriptionusername Influencer’s usernamefollowers Influencer’s followers countfollowing Influencer’s following counttotal_scrapped_posts Total number of postsis_verified If the influencer’s profile is verified by Instagramis_business_account If the influencer’s profile is a business accounthighlight_reel_count Number of highlighted storiesbiography Text to share some details about the influencer’s profiletotal_posts Total number of user postspost_id Instagram post identifierdisplay_url Image URL of the postnumber_of_likes Number of post likescaption Description about the postis_sidecar If the post is a collection of multiple permanent photosweekday Posting weekday of the posthour Posting hour of the postminute Posting minute of the postavg_number_of_likes Average of user likes count
22
Predicting the number of likes on Instagram with TensorFlow
Once the data is prepared and we can understand all these variables, thedata is ready to perform an exploratory data analysis.
4.6 Exploratory Data Analysis
4.6.1 Univariate analysis
For the univariate analysis, density plots were obtained for the numericalvariables and bar plots were generated for the categorical variables. Theseare the results obtained:
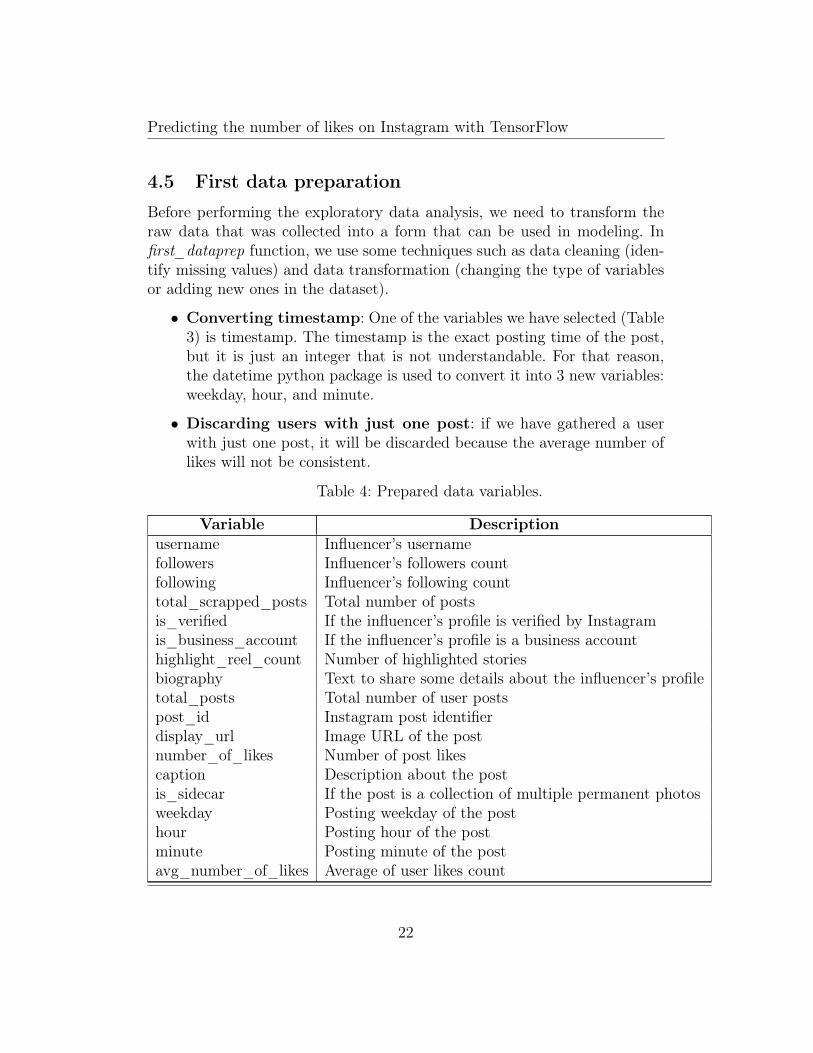
Figure 3: Density plot of followers
When analyzing the followers field, we can see that there are some valueswith very low representation, but with a clear normal tendency.
23
Predicting the number of likes on Instagram with TensorFlow
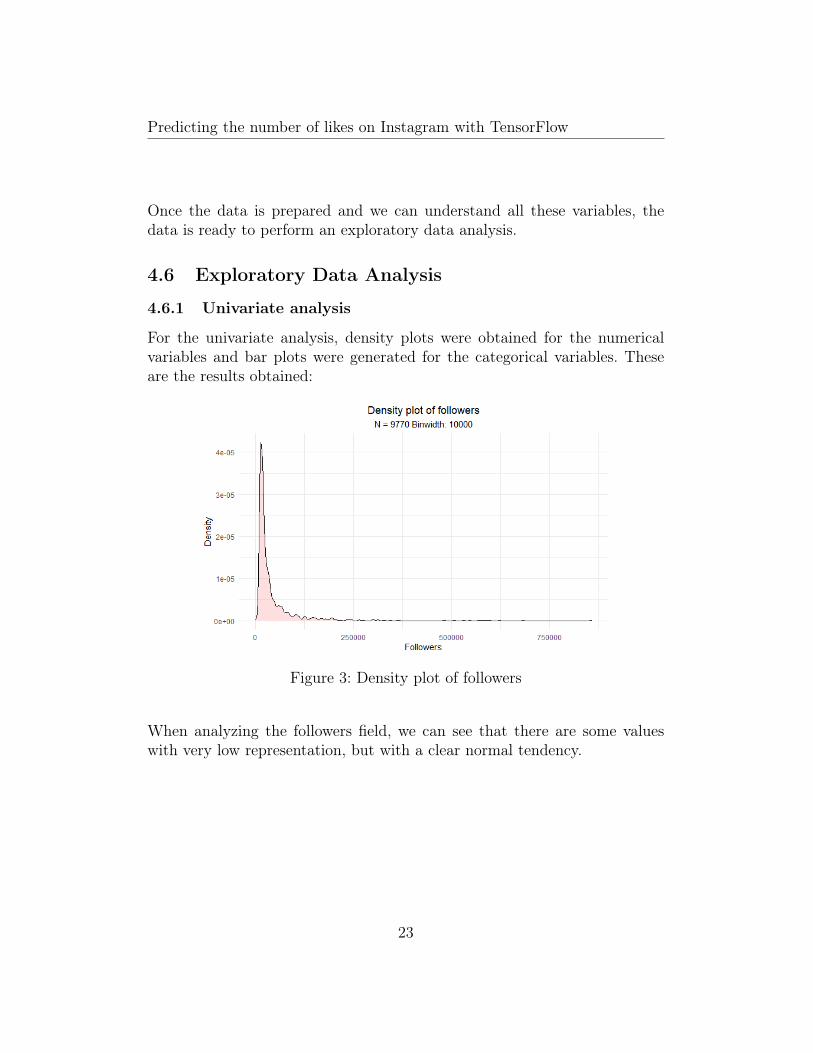
Figure 4: Density plot of following
Here, we can see that the following values are between 0 and 7.500, becauseInstagram does not allow any user to follow more than 7.500 people, tohelp reduce spam. Also following field seems sort of normal, so there are noproblems here.
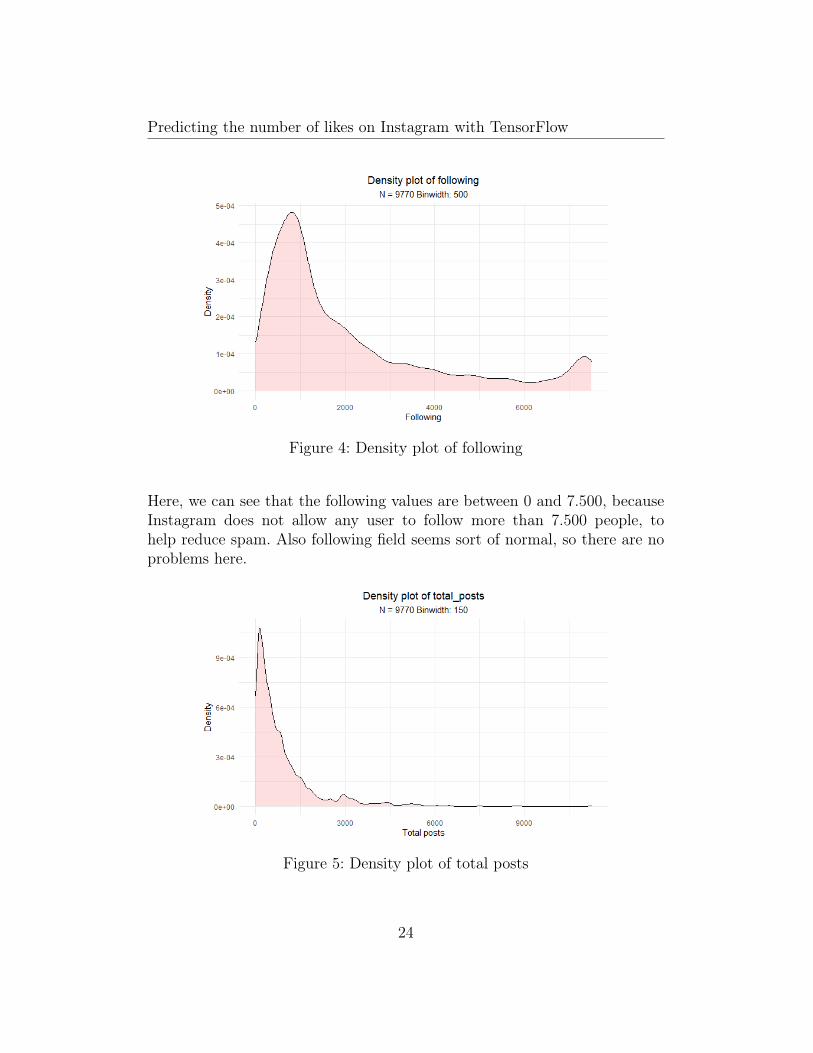
Figure 5: Density plot of total posts
24
Predicting the number of likes on Instagram with TensorFlow
In the total_posts density plot we can observe some outliers values above5000 posts. It seems sort of a normal tendency.
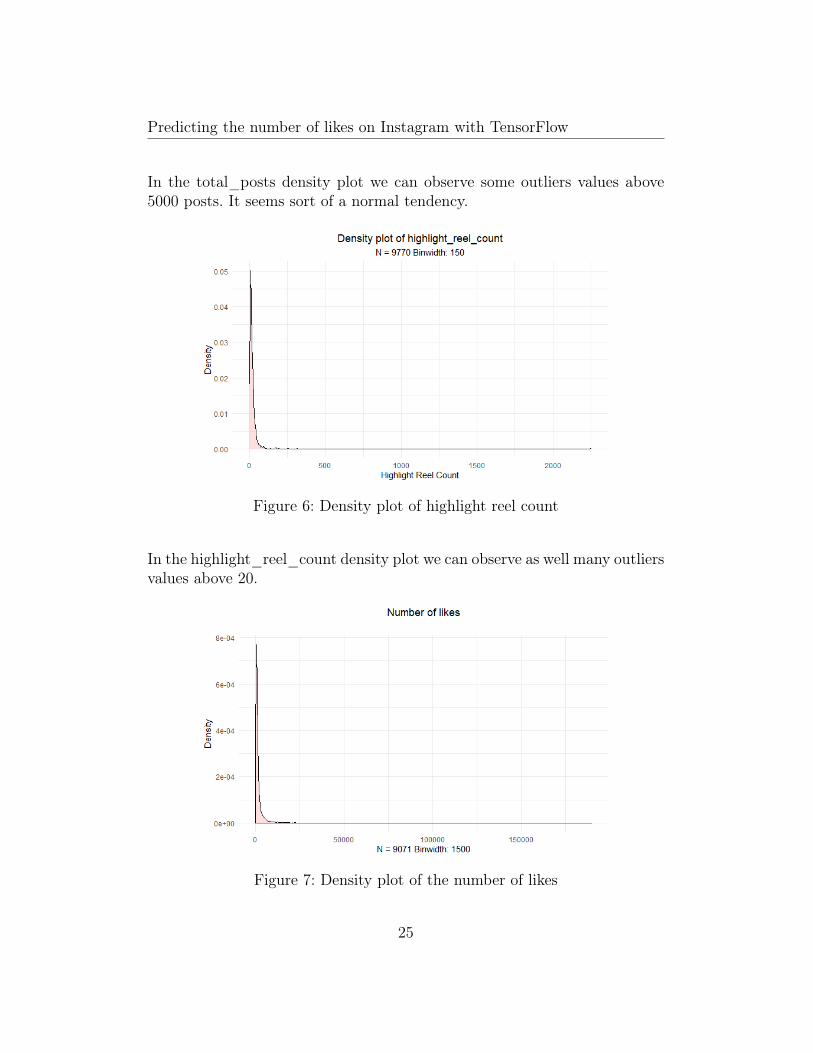
Figure 6: Density plot of highlight reel count
In the highlight_reel_count density plot we can observe as well many outliersvalues above 20.
Figure 7: Density plot of the number of likes
25
Predicting the number of likes on Instagram with TensorFlow
In our target variable, number_of_likes, in its density plot can observe alsomany outliers values above 1678 likes.
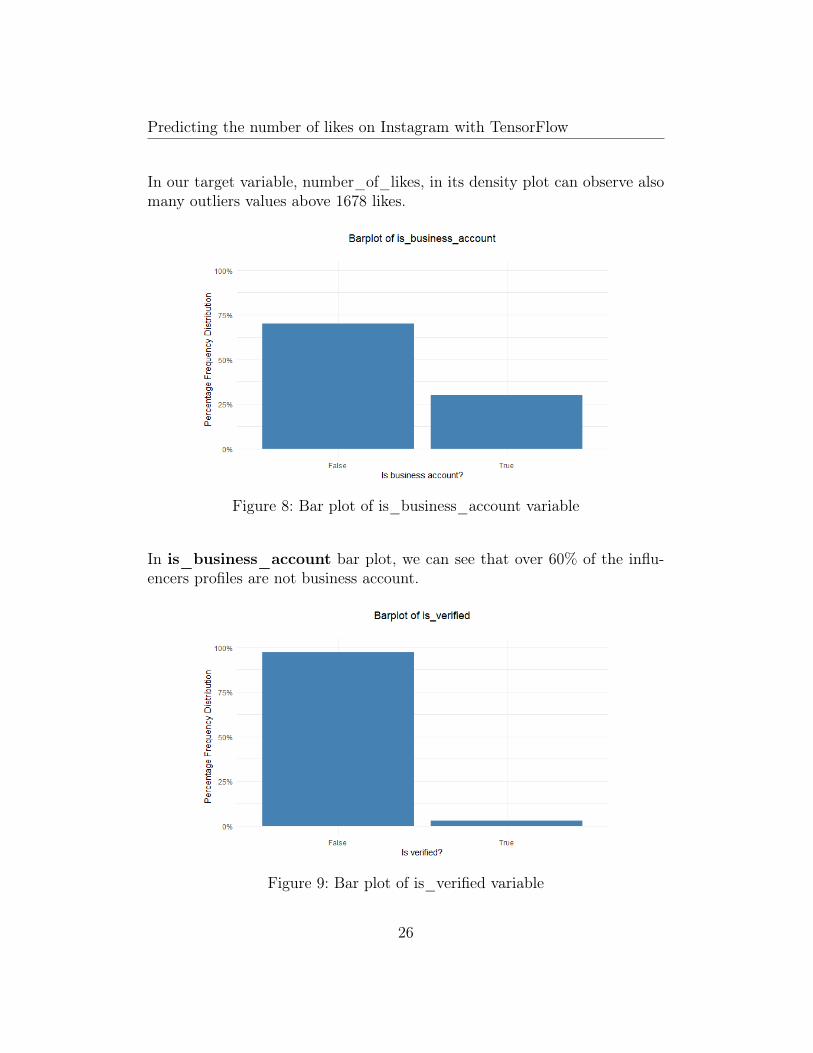
Figure 8: Bar plot of is_business_account variable
In is_business_account bar plot, we can see that over 60% of the influ-encers profiles are not business account.
Figure 9: Bar plot of is_verified variable
26
Predicting the number of likes on Instagram with TensorFlow
On the other hand, no problems for is_verified, except for a certain ex-pected unbalanced in the True-False proportion; most of the accounts arenot verified.
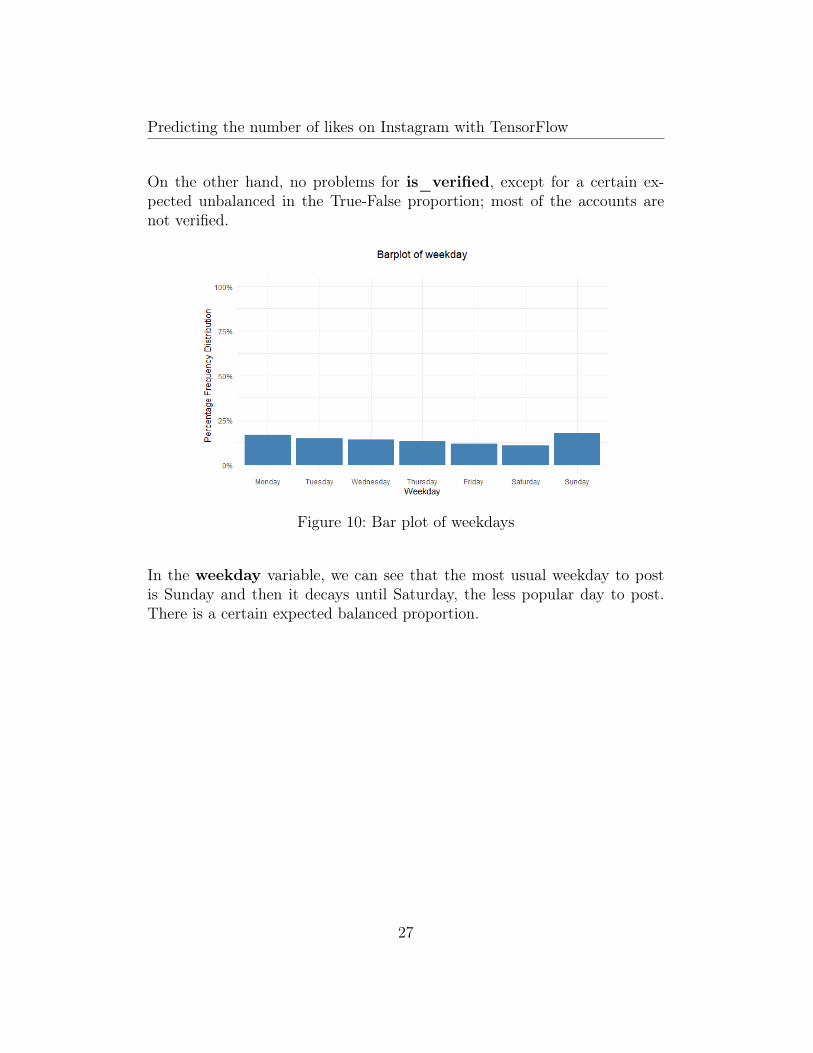
Figure 10: Bar plot of weekdays
In the weekday variable, we can see that the most usual weekday to postis Sunday and then it decays until Saturday, the less popular day to post.There is a certain expected balanced proportion.
27
Predicting the number of likes on Instagram with TensorFlow
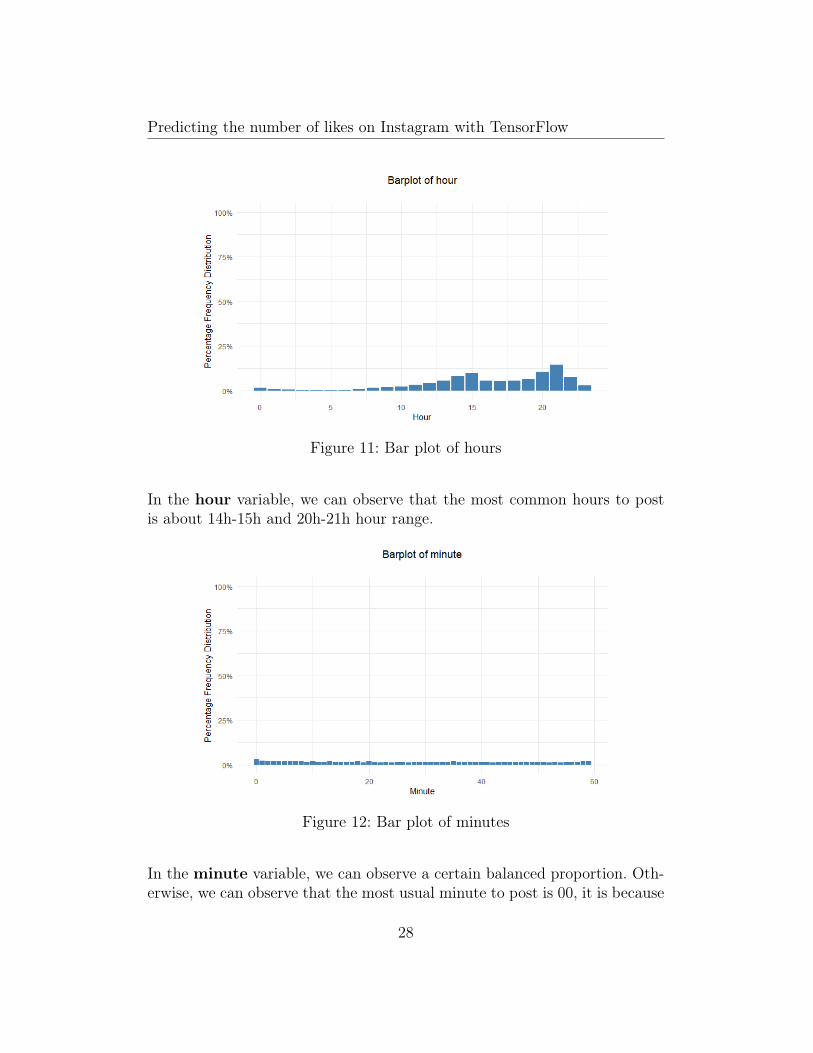
Figure 11: Bar plot of hours
In the hour variable, we can observe that the most common hours to postis about 14h-15h and 20h-21h hour range.
Figure 12: Bar plot of minutes
In the minute variable, we can observe a certain balanced proportion. Oth-erwise, we can observe that the most usual minute to post is 00, it is because
28
Predicting the number of likes on Instagram with TensorFlow
some users can schedule its posts at specific hours using third party tools.
4.7 Second data preparation
After performing the first exploratory data analysis, we applied all the sim-plification suggestions we had based on the data exploration. It is basically adata cleaning (identifying missing values), data selection and reconstructingdata.
4.7.1 Data selection
Due to the huge number of outliers in the number of likes variable, we haveselected all the posts that have obtained less than 5000 likes.
4.7.2 Reconstructing data
Since our mean number of likes variable for each user contains the own ob-servation that the model will predict, we should change it. For this reason, anew average will be calculated without their own observation. Given N thenumber of total user posts, xj the number of likes received for that post:
new_averagej =Nx− xjN − 1
4.8 Second exploratory data analysis
Since the previous data preparation modified significantly the previous anal-ysis, it is interesting to repeat it with new values of the dataset. Since, thisproject aims to perform number of likes prediction, the relation of this vari-able with the rest of variables is also studied.
29
Predicting the number of likes on Instagram with TensorFlow
4.8.1 Univariate analysis
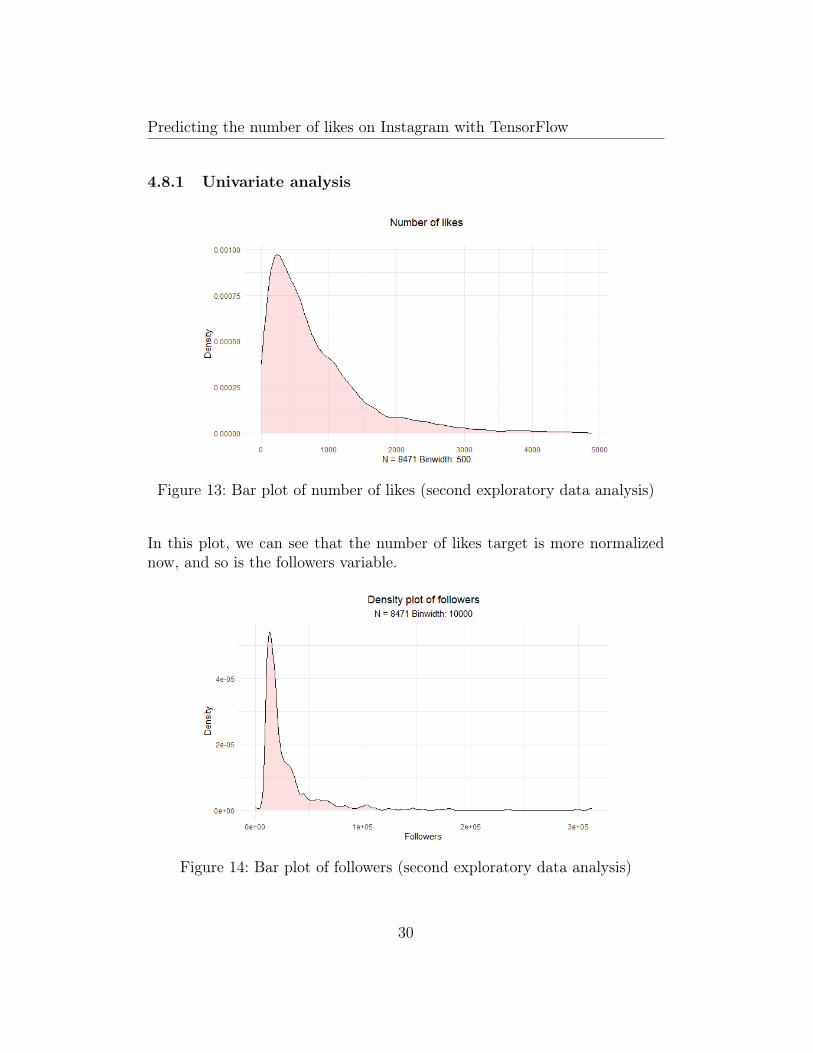
Figure 13: Bar plot of number of likes (second exploratory data analysis)
In this plot, we can see that the number of likes target is more normalizednow, and so is the followers variable.
Figure 14: Bar plot of followers (second exploratory data analysis)
30
Predicting the number of likes on Instagram with TensorFlow
Figure 15: Bar plot of weekdays (sec-ond exploratory data analysis)
Figure 16: Bar plot of hours (secondexploratory data analysis)
Figure 17: Bar plot of weekdays (sec-ond exploratory data analysis)
Figure 18: Bar plot of hours (secondexploratory data analysis)
Figure 19: Bar plot of minutes (sec-ond exploratory data analysis)
Figure 20: Bar plot ofis_business_account variable(second exploratory data analysis)
31

Predicting the number of likes on Instagram with TensorFlow
Figure 21: Bar plot of is_sidecarvariable (second exploratory dataanalysis)
Figure 22: Density plot of highlight-reel count (second exploratory dataanalysis)
Figure 23: Density plot of total posts(second exploratory data analysis)
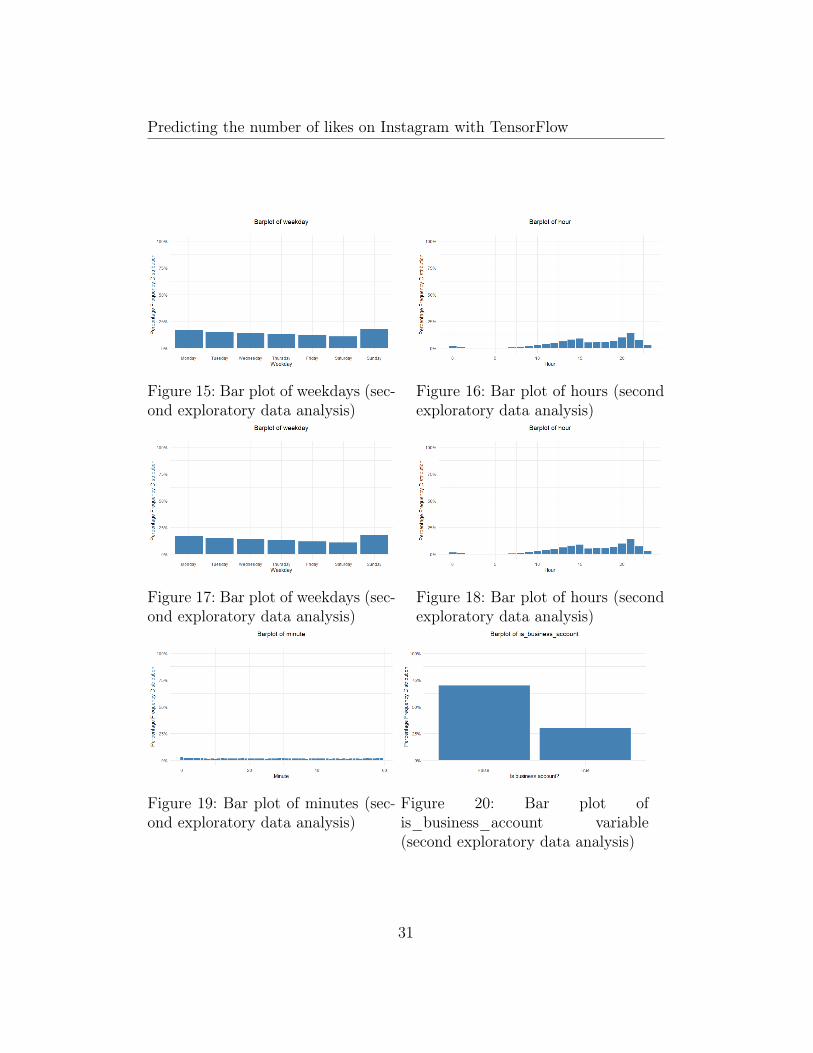
Also, the distribution in the weekday, hour, minute variables is almost thesame even 1299 instances have been discarded.
In the other plots, we can see that the other categorical variables distributionhas not changed. In addition, in numerical variables the density distributionis almost identical.
4.8.2 Bivariate analysis
For the bivariate analysis, we are not able to perform all binary combinations,since d for features there are
d(d− 1)
2
32
Predicting the number of likes on Instagram with TensorFlow
binary combinations of features. In our case, that is 66 combinations! There-fore, only the most interesting pairs are analyzed, the ones we suspect theremight be some interaction.
This bivariate analysis is oriented towards the number of likes prediction.This means that all variables have been plotted against the number of likesvariable to get an insight into its relation.
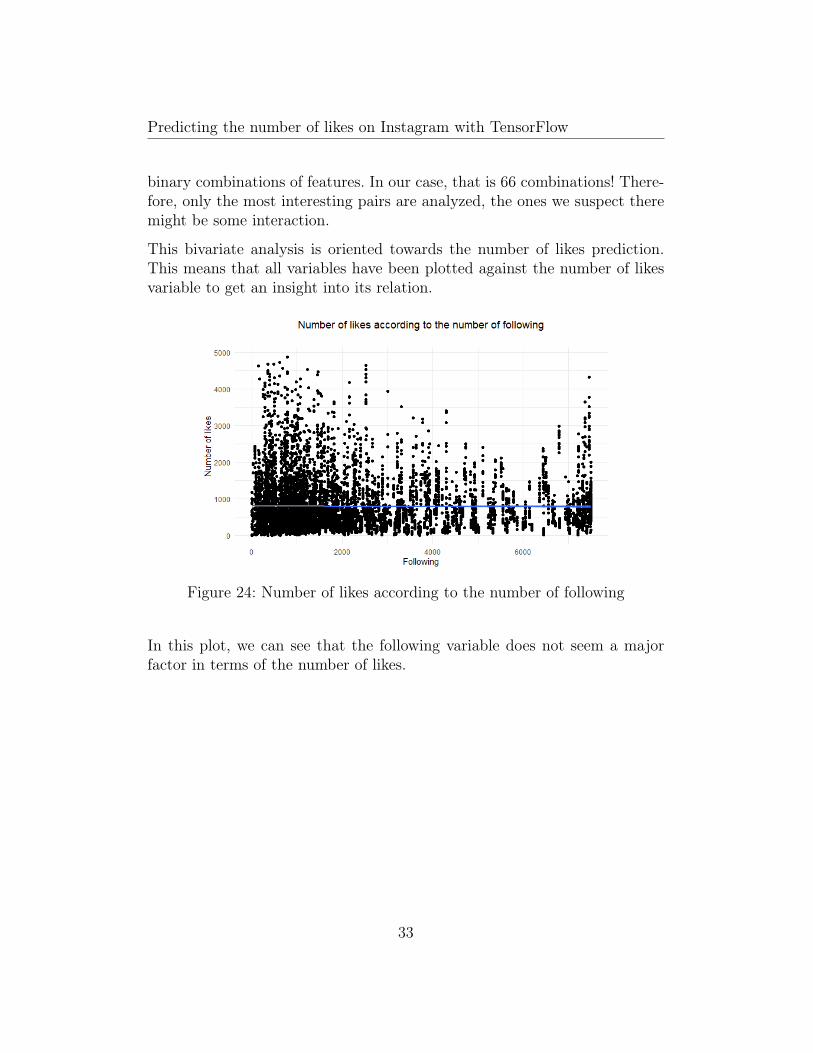
Figure 24: Number of likes according to the number of following
In this plot, we can see that the following variable does not seem a majorfactor in terms of the number of likes.
33
Predicting the number of likes on Instagram with TensorFlow
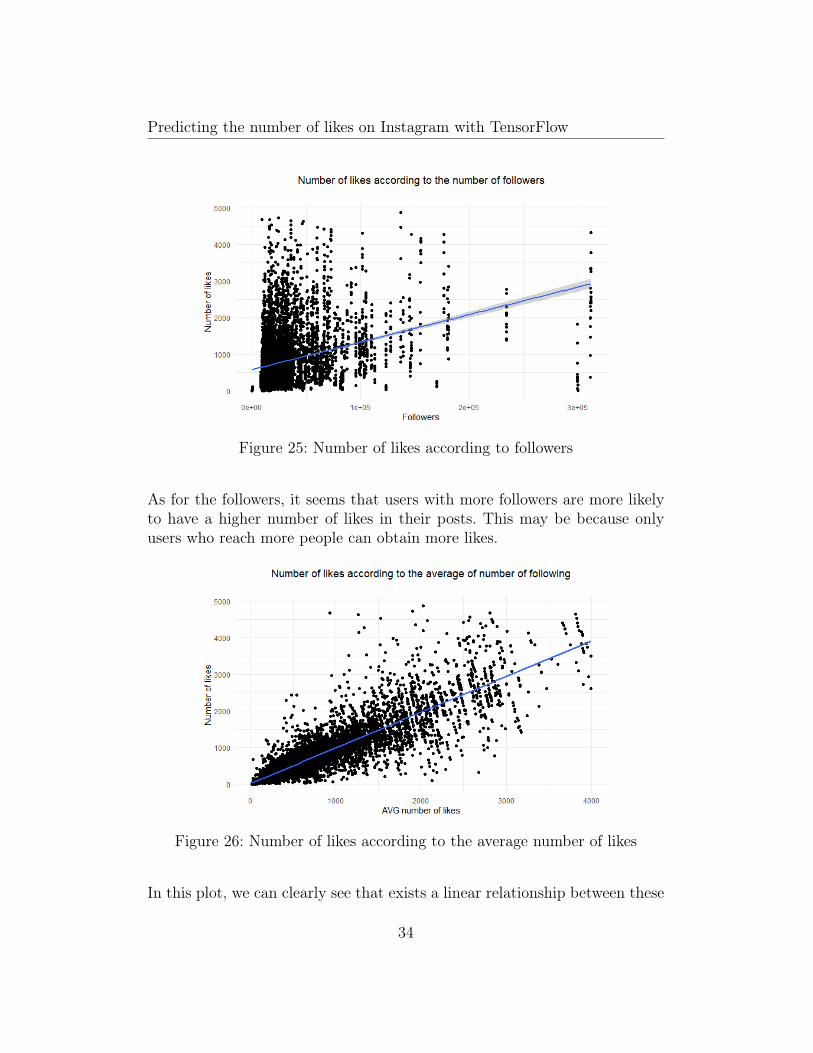
Figure 25: Number of likes according to followers
As for the followers, it seems that users with more followers are more likelyto have a higher number of likes in their posts. This may be because onlyusers who reach more people can obtain more likes.
Figure 26: Number of likes according to the average number of likes
In this plot, we can clearly see that exists a linear relationship between these
34
Predicting the number of likes on Instagram with TensorFlow
two variables. For this reason, this variable will help the model to performaccurate predictions. As we have explained in the previous section, this newaverage is calculated without our own observation.
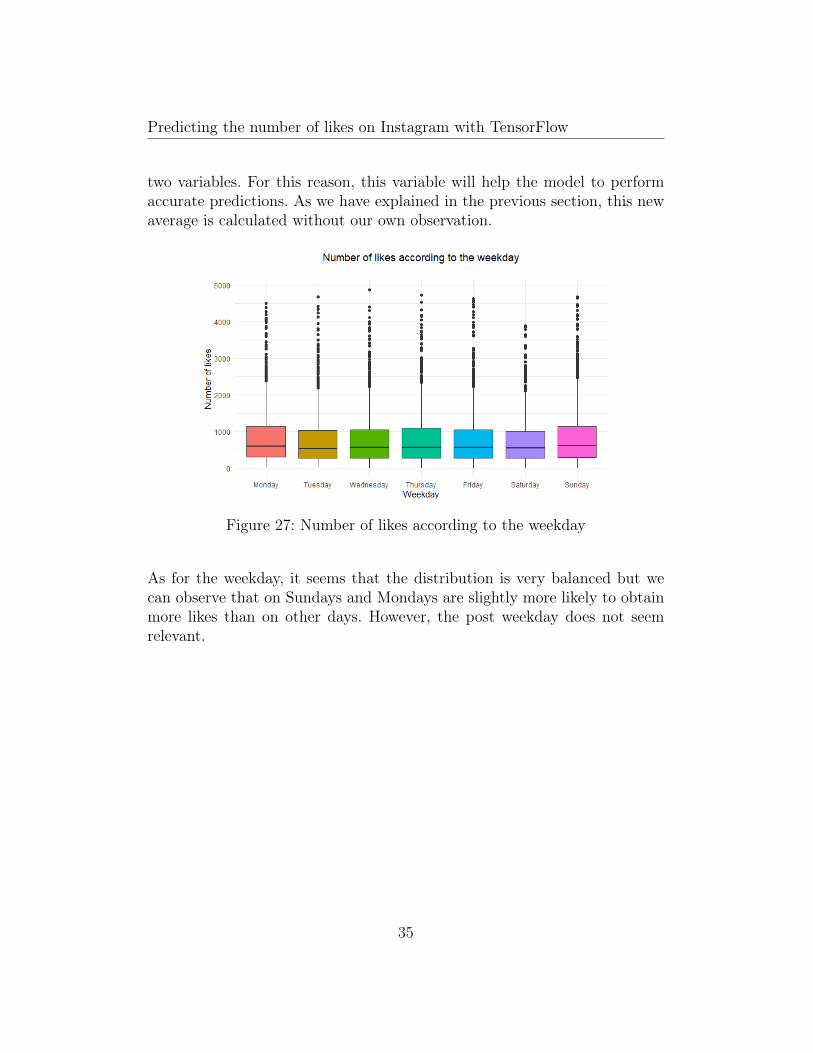
Figure 27: Number of likes according to the weekday
As for the weekday, it seems that the distribution is very balanced but wecan observe that on Sundays and Mondays are slightly more likely to obtainmore likes than on other days. However, the post weekday does not seemrelevant.
35
Predicting the number of likes on Instagram with TensorFlow
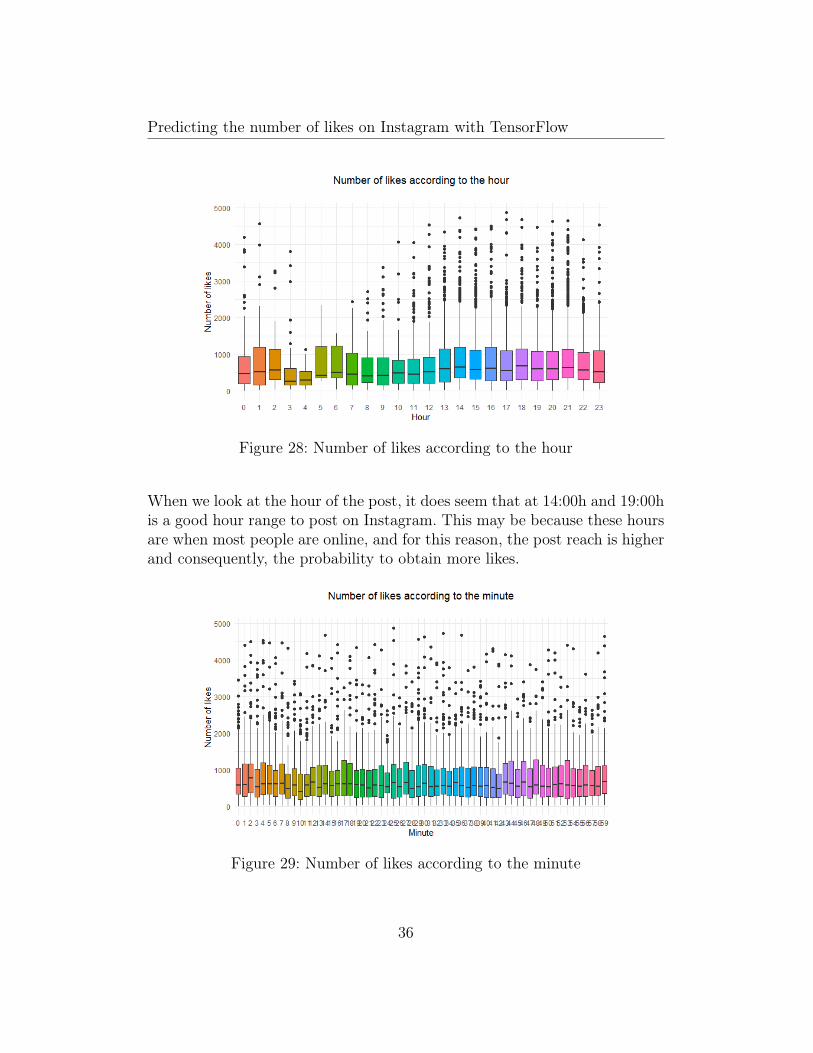
Figure 28: Number of likes according to the hour
When we look at the hour of the post, it does seem that at 14:00h and 19:00his a good hour range to post on Instagram. This may be because these hoursare when most people are online, and for this reason, the post reach is higherand consequently, the probability to obtain more likes.
Figure 29: Number of likes according to the minute
36
Predicting the number of likes on Instagram with TensorFlow
As for the minute, it does not seem that there is any relation between postminute and the number of likes. The distribution is balanced and we cannotassert any conclusion.
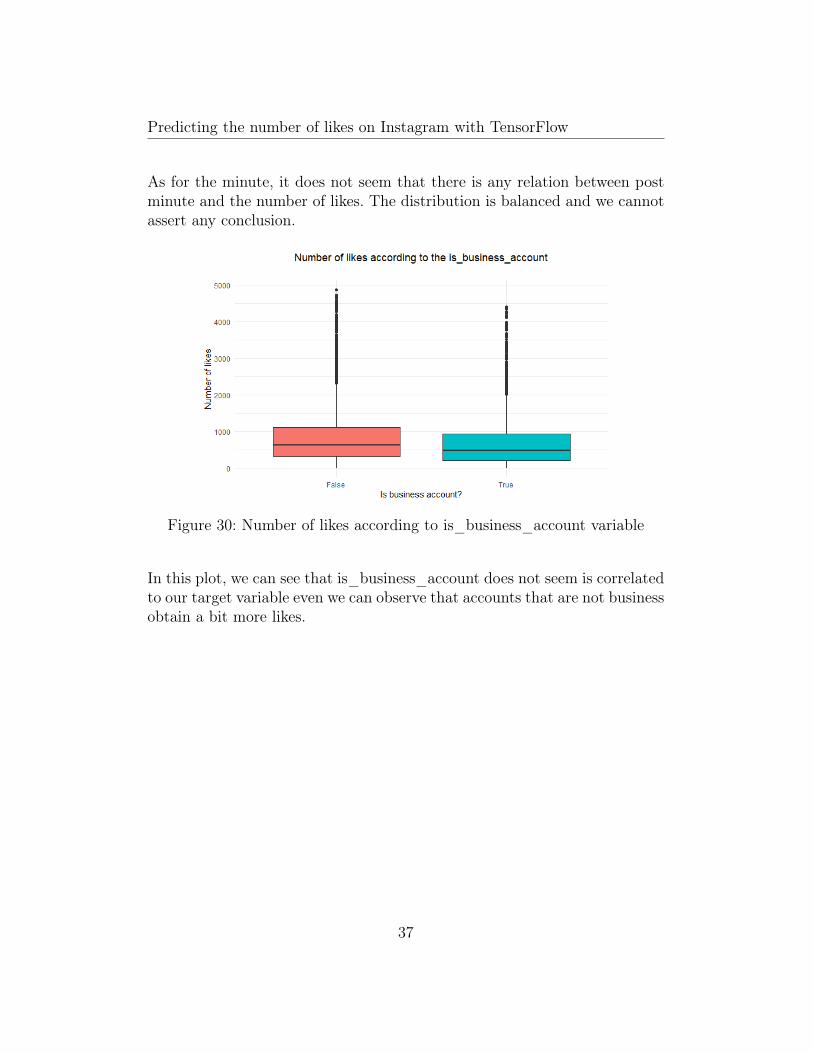
Figure 30: Number of likes according to is_business_account variable
In this plot, we can see that is_business_account does not seem is correlatedto our target variable even we can observe that accounts that are not businessobtain a bit more likes.
37
Predicting the number of likes on Instagram with TensorFlow
Figure 31: Number of likes according to is_sidecar variable
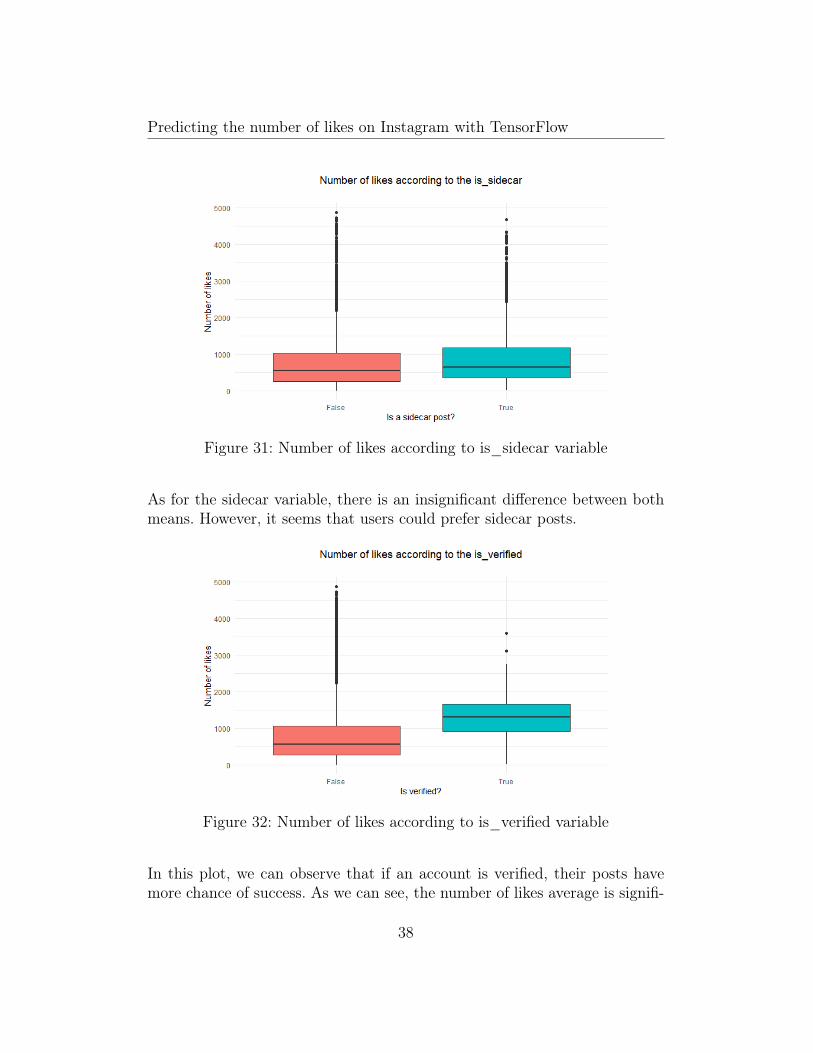
As for the sidecar variable, there is an insignificant difference between bothmeans. However, it seems that users could prefer sidecar posts.
Figure 32: Number of likes according to is_verified variable
In this plot, we can observe that if an account is verified, their posts havemore chance of success. As we can see, the number of likes average is signifi-
38
Predicting the number of likes on Instagram with TensorFlow
cantly higher than no verified accounts. This may be because the Instagramalgorithm increases verified account visibility.
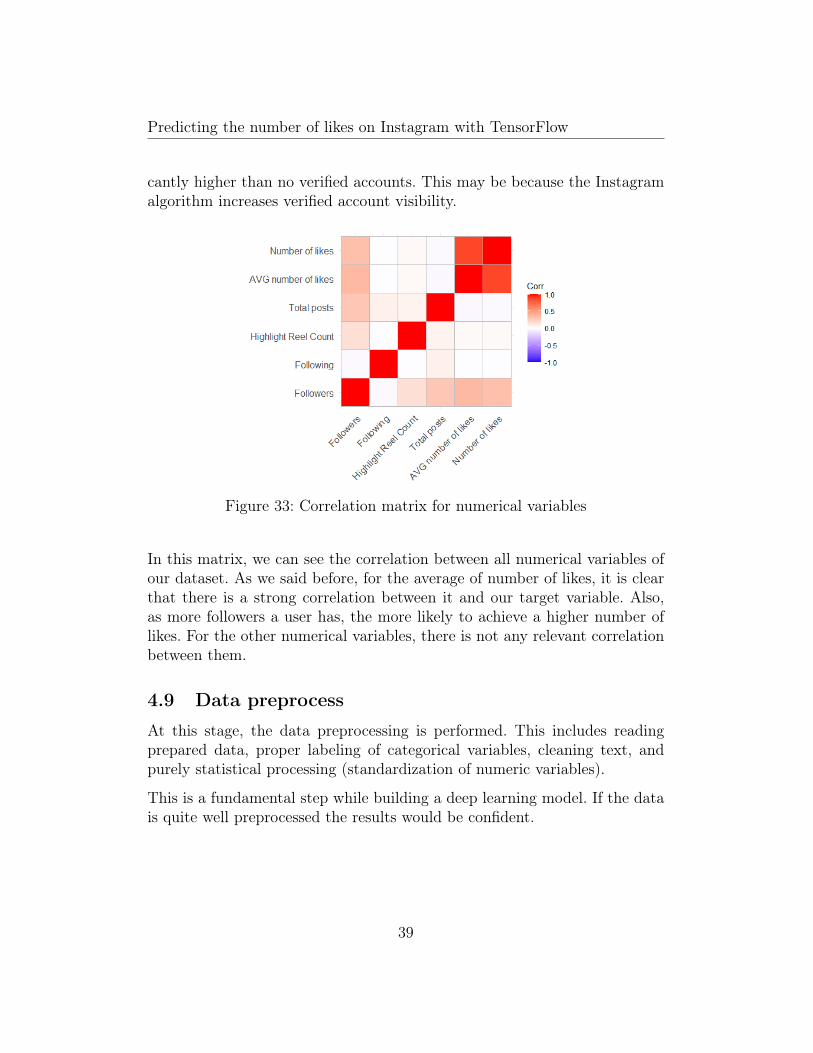
Figure 33: Correlation matrix for numerical variables
In this matrix, we can see the correlation between all numerical variables ofour dataset. As we said before, for the average of number of likes, it is clearthat there is a strong correlation between it and our target variable. Also,as more followers a user has, the more likely to achieve a higher number oflikes. For the other numerical variables, there is not any relevant correlationbetween them.
4.9 Data preprocess
At this stage, the data preprocessing is performed. This includes readingprepared data, proper labeling of categorical variables, cleaning text, andpurely statistical processing (standardization of numeric variables).
This is a fundamental step while building a deep learning model. If the datais quite well preprocessed the results would be confident.
39
Predicting the number of likes on Instagram with TensorFlow
4.9.1 Feature selection
Feature selection is the step of reducing the number of input features toimprove the performance of the predictive model. The main focus is to choosethese variables that represent the data set well, thanks to the exploratorydata analysis performed we can identify irrelevant data to predict our targetvariable. As we have seen in the bivariate analysis, highlight_reel_countand total_posts are not correlated to the number of likes and their standarddeviation is very high, so they are removed.
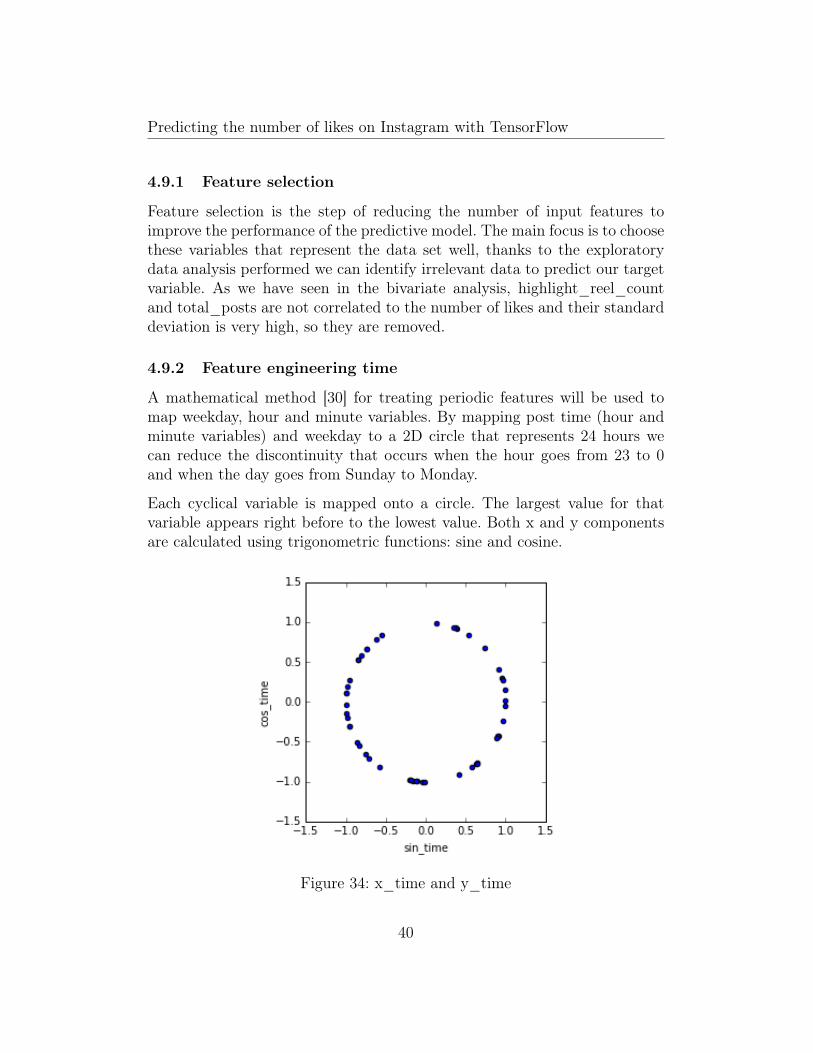
4.9.2 Feature engineering time
A mathematical method [30] for treating periodic features will be used tomap weekday, hour and minute variables. By mapping post time (hour andminute variables) and weekday to a 2D circle that represents 24 hours wecan reduce the discontinuity that occurs when the hour goes from 23 to 0and when the day goes from Sunday to Monday.
Each cyclical variable is mapped onto a circle. The largest value for thatvariable appears right before to the lowest value. Both x and y componentsare calculated using trigonometric functions: sine and cosine.
Figure 34: x_time and y_time
40
Predicting the number of likes on Instagram with TensorFlow
First of all, a post time has to be calculated by hour and minute variables:
post_timei = houri +minutei
60
Then, using sin mathematical functions we can compute x component.
x_timei = sin(2 ∗ π ∗ post_timei24
)
Finally, using cos mathematical function we can do the same for y component.
y_timei = cos(2 ∗ π ∗ post_timei24
)
Now, we will map the weekday using the same procedure:
x_weekdayi = sin(2 ∗ π ∗ weekdayi7
)
y_weekdayi = cos(2 ∗ π ∗ weekdayi7
)
4.9.3 Normalization
In the data preprocess step, is usual to change the values of numeric columnsto a common scale when features have different ranges. The numeric variableswith values that have a higher range will intrinsically influence the predictedresult more due to its larger value, but this does not mean it is more importantas a predictor. So, we normalize the data to bring all the variables to the samerange.
In this case, number_of_likes, avg_likes, followers, and following have differ-ent ranges. For that reason, numeric variables are normalized using Min-Maxscaling.
Xnorm =X −Xmin
Xmax −Xmin
41
Predicting the number of likes on Instagram with TensorFlow
Thanks to the exploratory data analysis the maximum and minimum valuesfor each variable that we need normalize are identified:
avg_likesnorm =avg_likes− 0
5000− 0
followersnorm =followers− 44
312195− 44
followingnorm =following − 2
7502− 2
4.9.4 Split dataset
In this project, since the amount of available data is very low, we decided tosplit our dataset into training (and validation) and test sets.
Therefore, it was decided that each split would hold exactly 95% of the data,reducing the total dataset from 8471 data samples to two different data setsholding 112658 and 5936 data samples each.
The partition was performed randomly using the train_test_split Sci-kitlearn function, and having previously set a seed of 7 to make all the resultsreproducible.
4.9.5 Cleaning text
This dataset contains two variables that consist of text: user biography andpost caption. These steps are needed before tokenize words. Tokenization isa process in which sentences are converted into words and then transferringtext from human language to machine-readable format.
We must remove all the punctuation, non-alphabets, and any other kind ofcharacters that might not be a part of the language. The methods of textcleaning involve regular expressions that we are going to use to filter outmost of the unwanted texts.
For that reason, clean_text will use regular expression and Python functionsfor:
42
Predicting the number of likes on Instagram with TensorFlow
• Lowercasing: converting all words to lower.
• Removing unwanted characters: removing punctuations, accentmarks and other diacritics.
• Remove whitespaces: removing additional whitespaces between wordsand ending/leading spaces.
4.9.6 Building corpus
After text cleaning preprocess, the next step is to build a corpus. To computeword vectors, a large text corpus file is needed. It consists of a text filecontaining all the sentences we can obtain in our dataset, specifically, userbiography and post caption (after cleaned).
Depending on the corpus, the word vectors will capture different information.So for that reason, we are going to train our fastText model using a corpusbuilt for our project purpose.
4.9.7 Training fastText model
Once we have built our corpus file, the fastText model is trained.
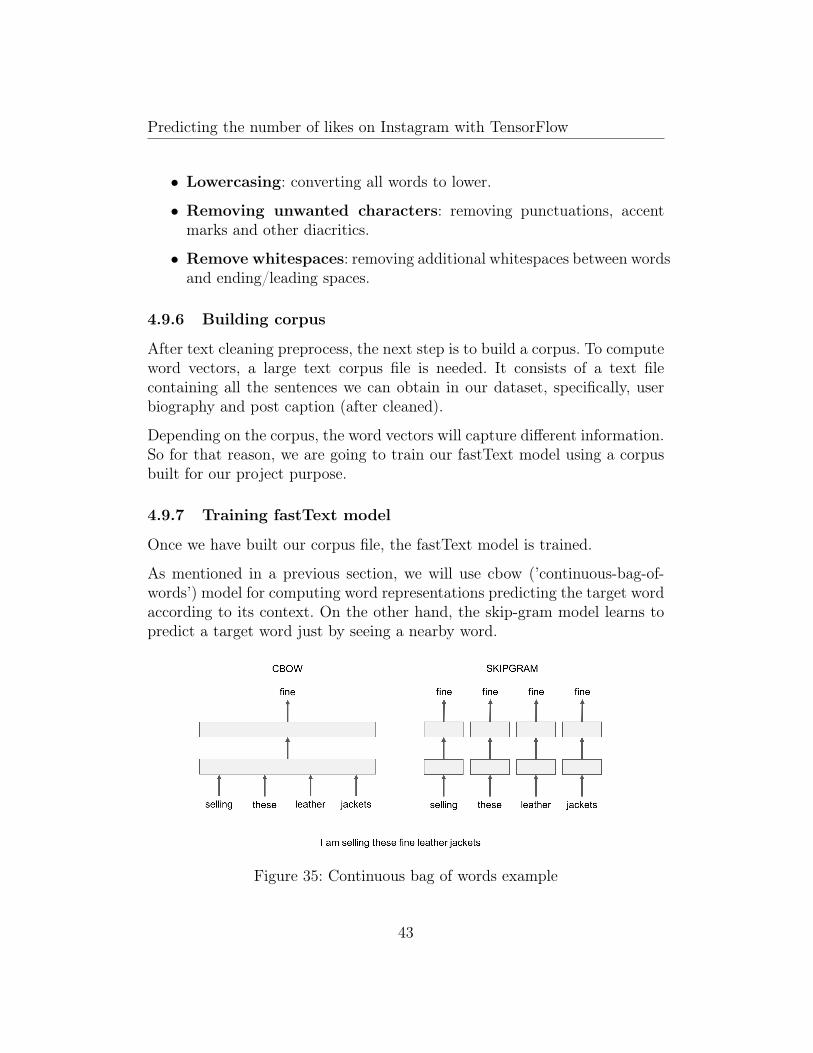
As mentioned in a previous section, we will use cbow (’continuous-bag-of-words’) model for computing word representations predicting the target wordaccording to its context. On the other hand, the skip-gram model learns topredict a target word just by seeing a nearby word.
Figure 35: Continuous bag of words example
43
Predicting the number of likes on Instagram with TensorFlow
Given the sentence ’I am selling these fine leather jackets’ and the targetword ’fine’, a skip-gram model tries to predict the target using a randomclose-by word, like ’these’ or ’leather’. The cbow model takes all the wordsin a surrounding window, like selling, these, leather, jackets
These arguments are passed in the function parameters:
• Input path (input): text file path that was built before.
• Model (model): unsupervised fastText model, cbow or skipgram.cbow is the argument value passed to the parameter.
• Learning rate (lr): tuning parameter that determines the step sizeat each iteration while moving toward a minimum of the loss function.0,05 is the argument value passed to the parameter.
• Epochs (epoch): number of epochs. An epoch is one complete passthrough the corpus file. 100 is the argument value passed to the pa-rameter.
• Dimension (dim): the size of word vectors. 50 is the argument valuepassed to the parameter.
• Thread (thread): number of threads to train the model. 32 is theargument value passed to the parameter.
4.10 Modeling
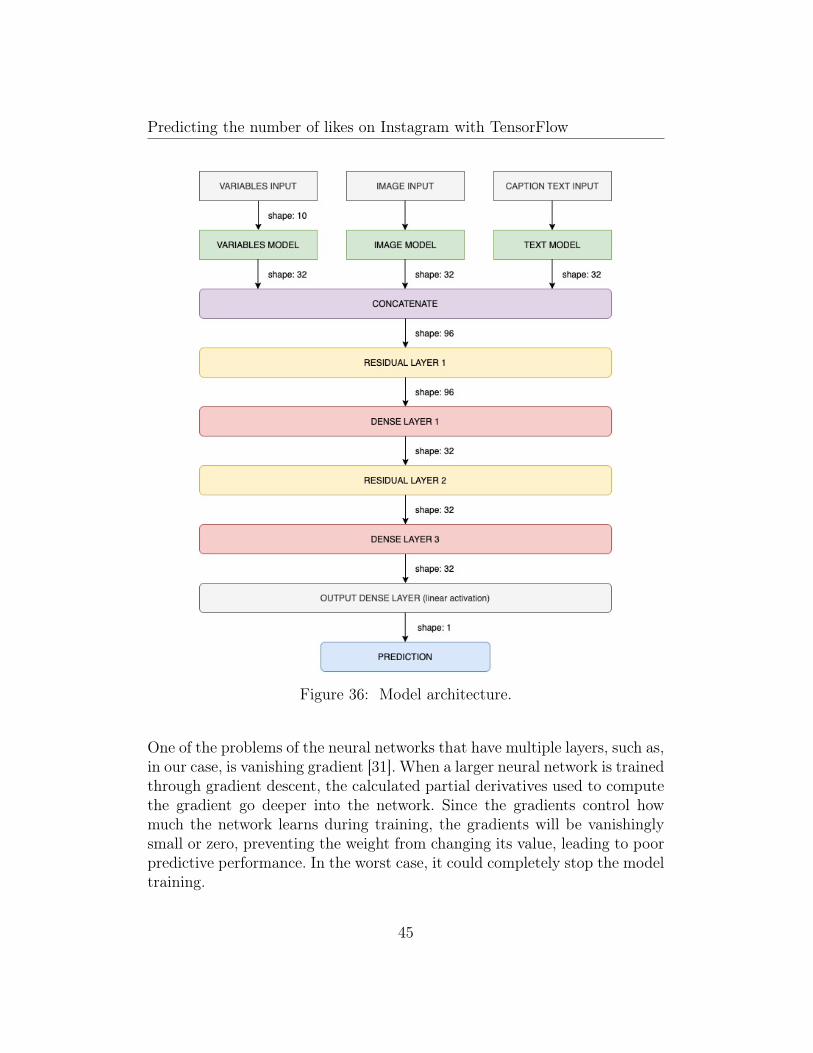
As we decided to use neural networks to solve our problem, a model archi-tecture is needed. Because our problem has mixed data (variables, text andimage), our model must be able to use all of our data. For this reason, athree-branch neural network will be used.
4.10.1 Neural network model architecture
First of all, we need to define three different model architectures to processeach type of data. After this, the three branches will be concatenated to makea final prediction, adding some layers to this and finally a linear activationoutput layer which is the number of likes prediction.
This following figure shows the model architecture proposed:
44
Predicting the number of likes on Instagram with TensorFlow
Figure 36: Model architecture.
One of the problems of the neural networks that have multiple layers, such as,in our case, is vanishing gradient [31]. When a larger neural network is trainedthrough gradient descent, the calculated partial derivatives used to computethe gradient go deeper into the network. Since the gradients control howmuch the network learns during training, the gradients will be vanishinglysmall or zero, preventing the weight from changing its value, leading to poorpredictive performance. In the worst case, it could completely stop the modeltraining.
45

Predicting the number of likes on Instagram with TensorFlow
To solve this problem, we will use three methods to overcome the vanishinggradient:
• Multi-level hierarchy: as we mentioned before, a three-branch neuralnetwork will be used. As Jürgen Schmidhuber states in Learning com-plex, extended sequences using the principle of history compression [32],this technique pretrains one branch at a time, and then performs back-propagation for fine-tuning.
• Residual layers: this technique introduces bypass connections, alsoknown as skip connections or shortcuts, that connect layers furtherbehind the previous layer to a given layer. Using residual layers on ourmodel allows gradients to propagate quicker to deep layers before theycan be attenuated to zero or small values reusing activations from aprevious layer until the adjacent layer learns its weights. [33].
Figure 37: The canonical form of a residual neural network. A layer ℓ1 isskipped over activation from ℓ2 [33].
As we can see in the model architecture, the combined outputs of the threebranches (an encoding for variables, image and text) are the input to theconcatenate layer. Then, the embedding concatenated is connected to thefinal layers. It goes from 64 neurons to 32, 16 and finally a linear activationon our final neuron which is the predicted number of likes.
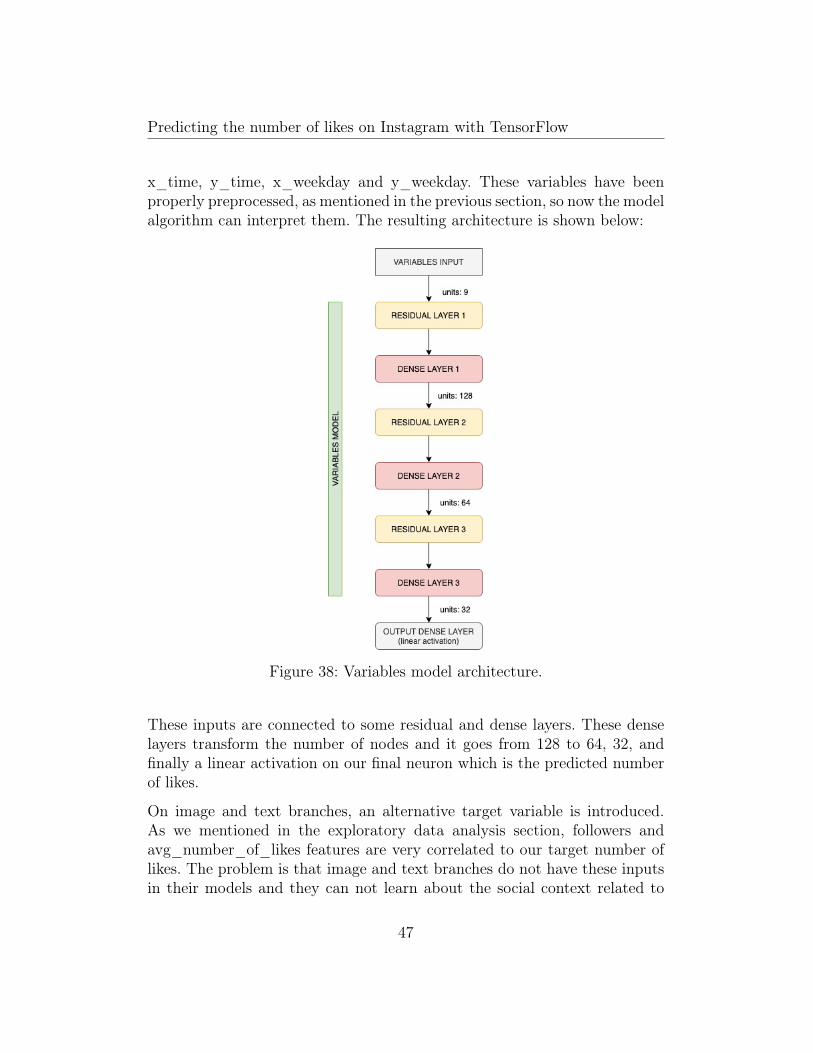
In the variables branch, all numerical and categorical variables are the inputto the model: followers, following, is_verified, is_business_account, is_sidecar,
46
Predicting the number of likes on Instagram with TensorFlow
x_time, y_time, x_weekday and y_weekday. These variables have beenproperly preprocessed, as mentioned in the previous section, so now the modelalgorithm can interpret them. The resulting architecture is shown below:
Figure 38: Variables model architecture.
These inputs are connected to some residual and dense layers. These denselayers transform the number of nodes and it goes from 128 to 64, 32, andfinally a linear activation on our final neuron which is the predicted numberof likes.
On image and text branches, an alternative target variable is introduced.As we mentioned in the exploratory data analysis section, followers andavg_number_of_likes features are very correlated to our target number oflikes. The problem is that image and text branches do not have these inputsin their models and they can not learn about the social context related to
47

Predicting the number of likes on Instagram with TensorFlow
an image or text. For this reason, these models will predict an alternativevariable that tries to exclude social context information: engagement rate.
Engagement rate is the amount of total engagement received by an Insta-gram account over a specific post, expressed as a percentage of followers.Engagement is defined as anytime another user likes on one of your posts.Given a post i:
engagement_ratei = 100 · number_of_likesifollowersi
In text branch, the post caption, and the biography description are the in-put to the model. These variables are preprocessed and then converted toembedding by fastText model, as mentioned in the data preprocess section.
Figure 39: fastText model architecture
Both variables are represented as a 50-dimensional dense vector using ften-coder.encode function and then are concatenated to convert it to a singleembedding. Then, the resulting architecture for the text branch is shownbelow:
48
Predicting the number of likes on Instagram with TensorFlow
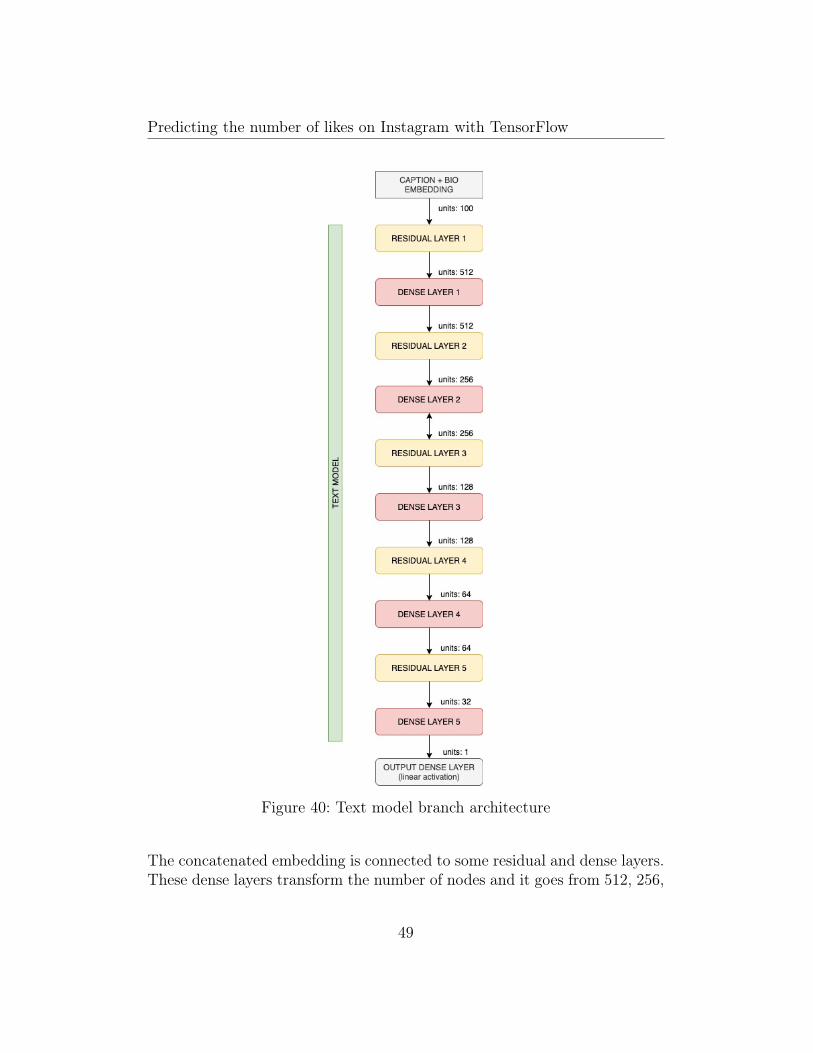
Figure 40: Text model branch architecture
The concatenated embedding is connected to some residual and dense layers.These dense layers transform the number of nodes and it goes from 512, 256,
49
Predicting the number of likes on Instagram with TensorFlow
128, 64, 32, and finally a linear activation on our final neuron which is thepredicted engagement ratio.
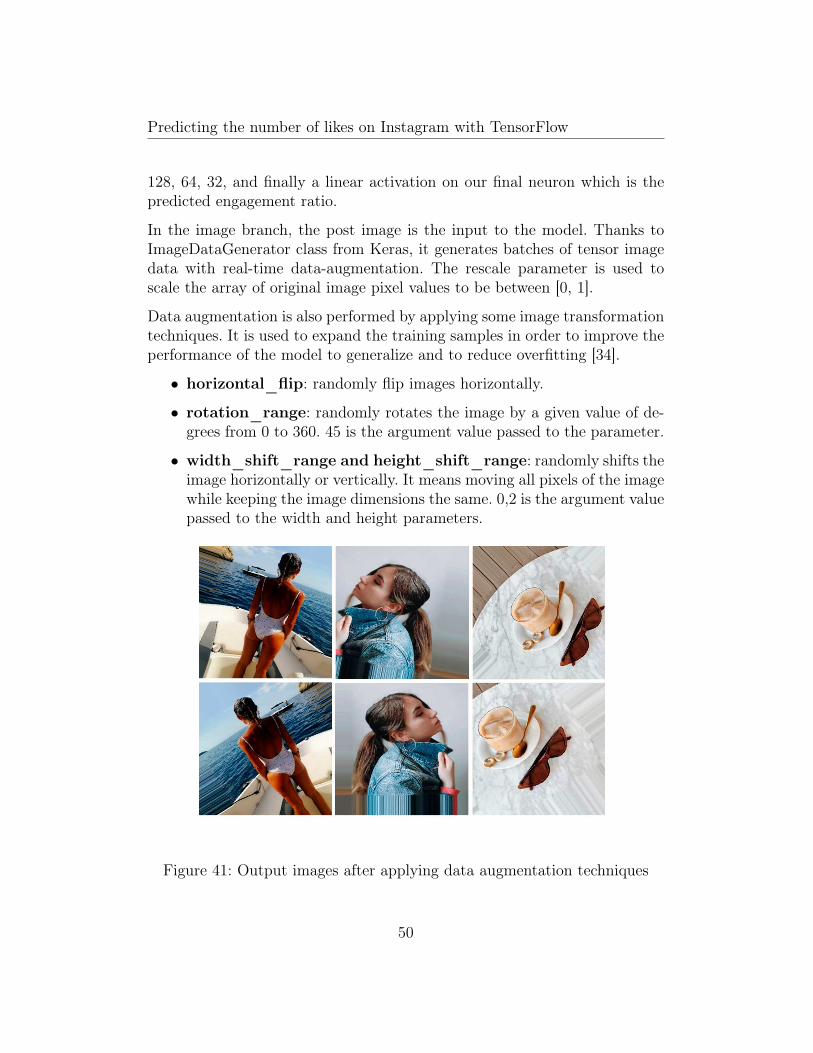
In the image branch, the post image is the input to the model. Thanks toImageDataGenerator class from Keras, it generates batches of tensor imagedata with real-time data-augmentation. The rescale parameter is used toscale the array of original image pixel values to be between [0, 1].
Data augmentation is also performed by applying some image transformationtechniques. It is used to expand the training samples in order to improve theperformance of the model to generalize and to reduce overfitting [34].
• horizontal_flip: randomly flip images horizontally.
• rotation_range: randomly rotates the image by a given value of de-grees from 0 to 360. 45 is the argument value passed to the parameter.
• width_shift_range and height_shift_range: randomly shifts theimage horizontally or vertically. It means moving all pixels of the imagewhile keeping the image dimensions the same. 0,2 is the argument valuepassed to the width and height parameters.
Figure 41: Output images after applying data augmentation techniques
50

Predicting the number of likes on Instagram with TensorFlow
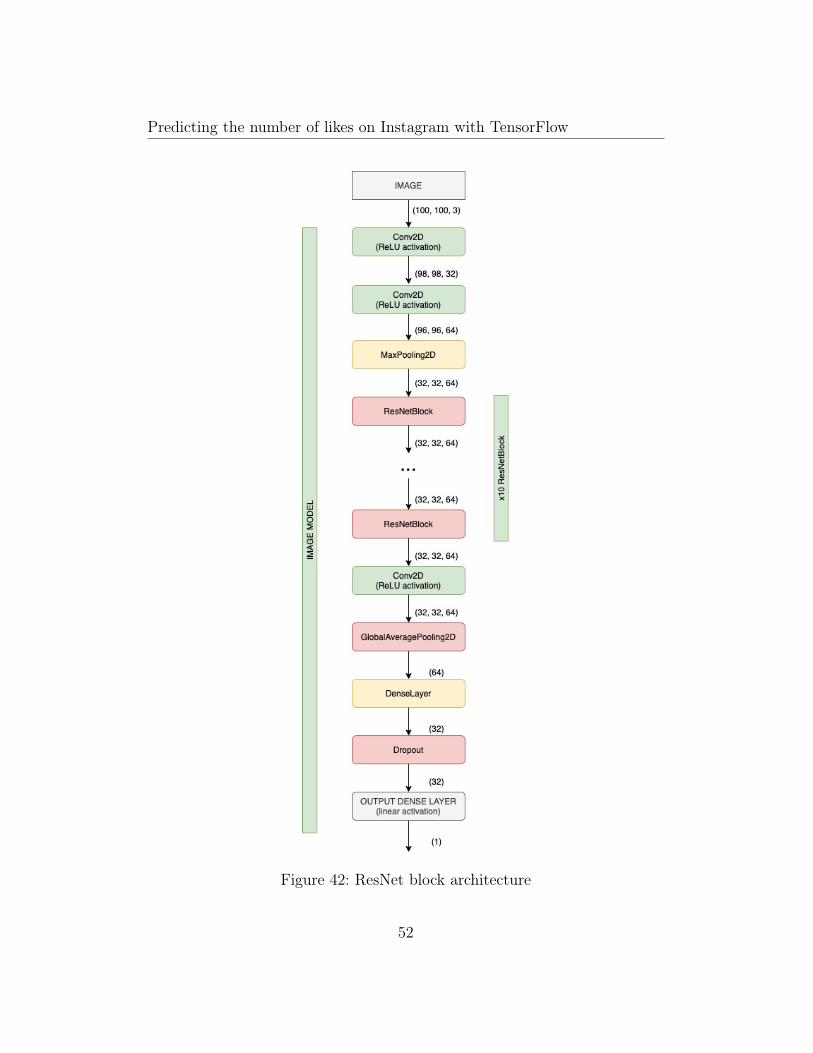
Then, as our image paths are in a Pandas dataframe, the flow_from_dataframefunction from Keras is used to take the dataframe and the path to a direc-tory and then, generates batches. The target_size parameter is used to resizedimension image to 100x100px.
The CNN architecture is based on the original ResNet paper: Deep ResidualLearning for Image Recognition [35] The next figure is what the ResNetmodel architecture looks like:
51
Predicting the number of likes on Instagram with TensorFlow
Figure 42: ResNet block architecture
52
Predicting the number of likes on Instagram with TensorFlow
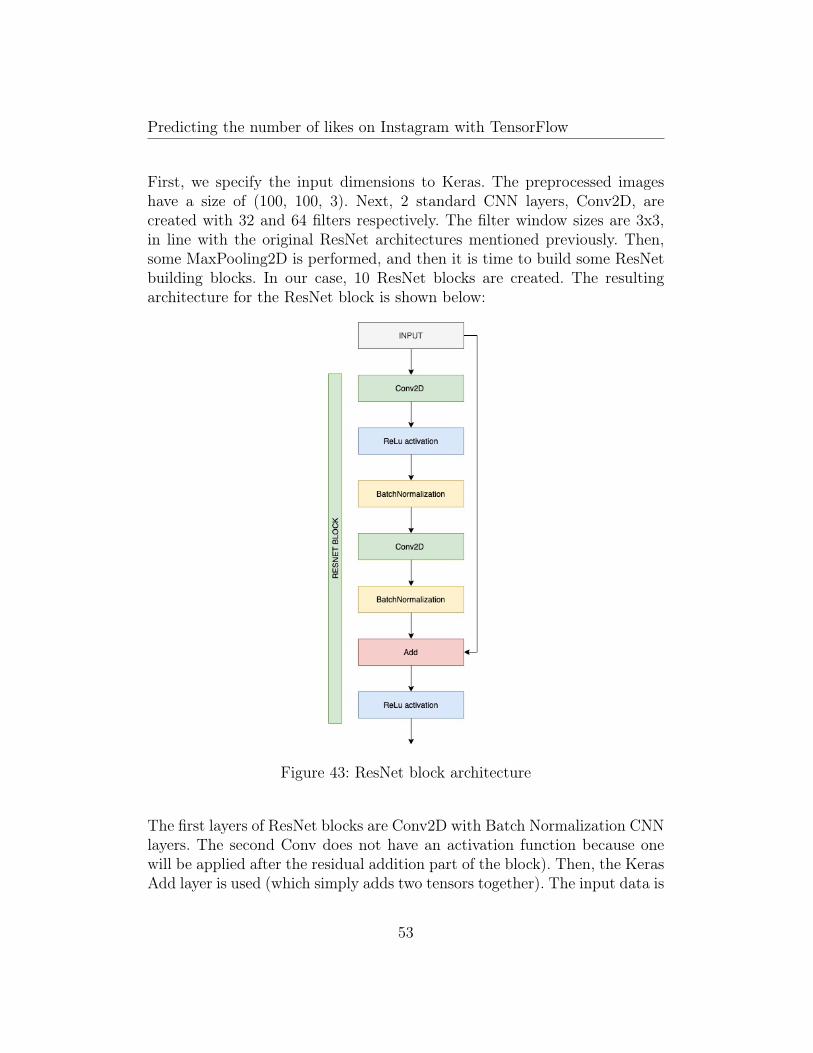
First, we specify the input dimensions to Keras. The preprocessed imageshave a size of (100, 100, 3). Next, 2 standard CNN layers, Conv2D, arecreated with 32 and 64 filters respectively. The filter window sizes are 3x3,in line with the original ResNet architectures mentioned previously. Then,some MaxPooling2D is performed, and then it is time to build some ResNetbuilding blocks. In our case, 10 ResNet blocks are created. The resultingarchitecture for the ResNet block is shown below:
Figure 43: ResNet block architecture
The first layers of ResNet blocks are Conv2D with Batch Normalization CNNlayers. The second Conv does not have an activation function because onewill be applied after the residual addition part of the block). Then, the KerasAdd layer is used (which simply adds two tensors together). The input data is
53
Predicting the number of likes on Instagram with TensorFlow
added to the CNN output. In the end, a ReLU activation is connected to theresult of this addition and the output is the returned value of the function.
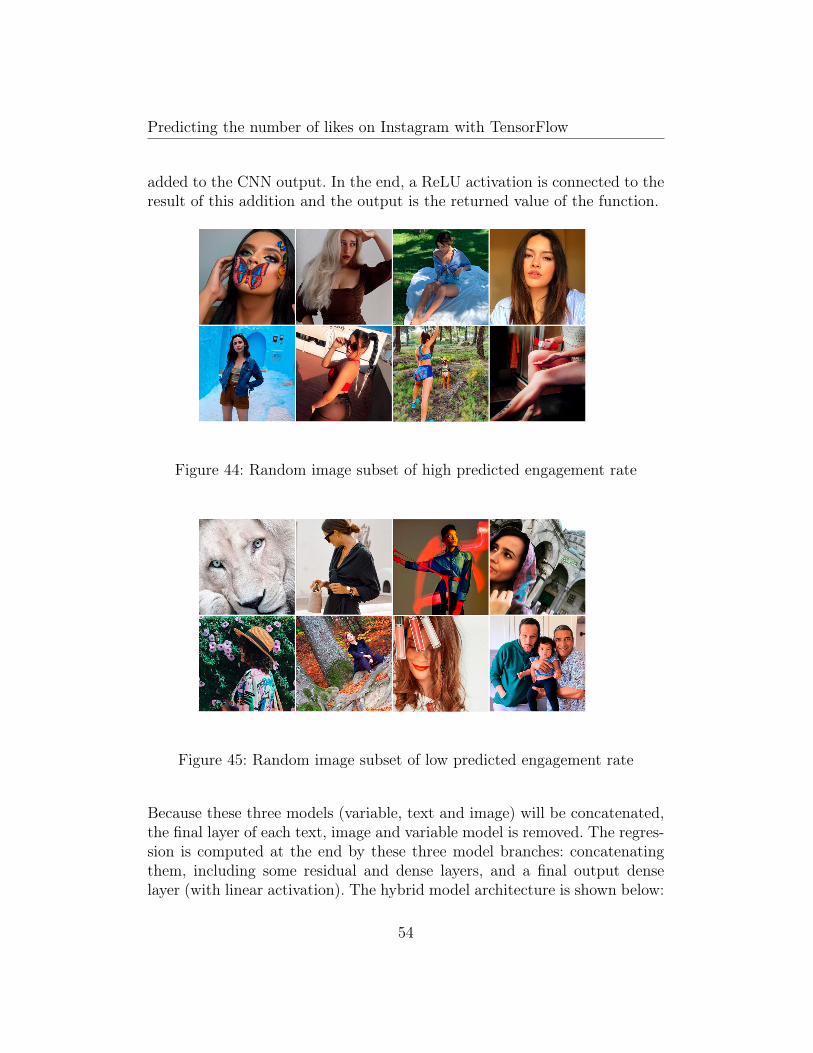
Figure 44: Random image subset of high predicted engagement rate
Figure 45: Random image subset of low predicted engagement rate
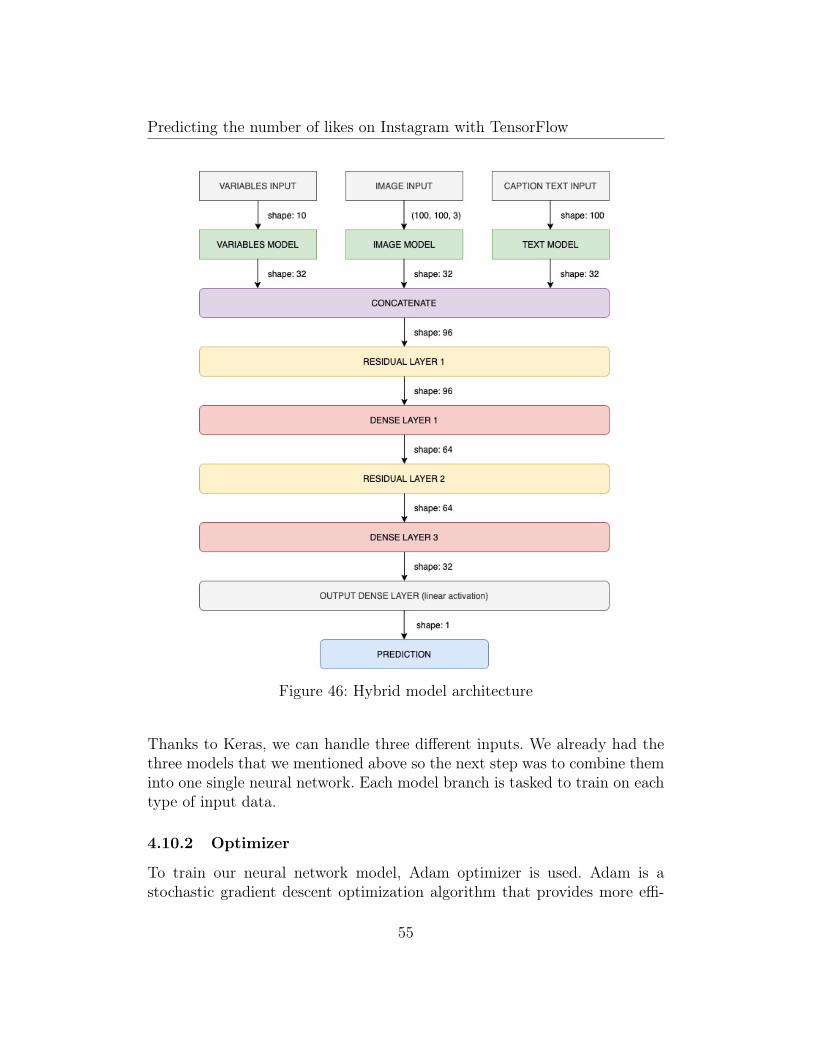
Because these three models (variable, text and image) will be concatenated,the final layer of each text, image and variable model is removed. The regres-sion is computed at the end by these three model branches: concatenatingthem, including some residual and dense layers, and a final output denselayer (with linear activation). The hybrid model architecture is shown below:
54
Predicting the number of likes on Instagram with TensorFlow
Figure 46: Hybrid model architecture
Thanks to Keras, we can handle three different inputs. We already had thethree models that we mentioned above so the next step was to combine theminto one single neural network. Each model branch is tasked to train on eachtype of input data.
4.10.2 Optimizer
To train our neural network model, Adam optimizer is used. Adam is astochastic gradient descent optimization algorithm that provides more effi-
55
Predicting the number of likes on Instagram with TensorFlow
cient neural network weights by running repeated cycles of “adaptive momentestimation. It is most effective in larger datasets by keeping the gradientsmore compacted over many learning iterations.
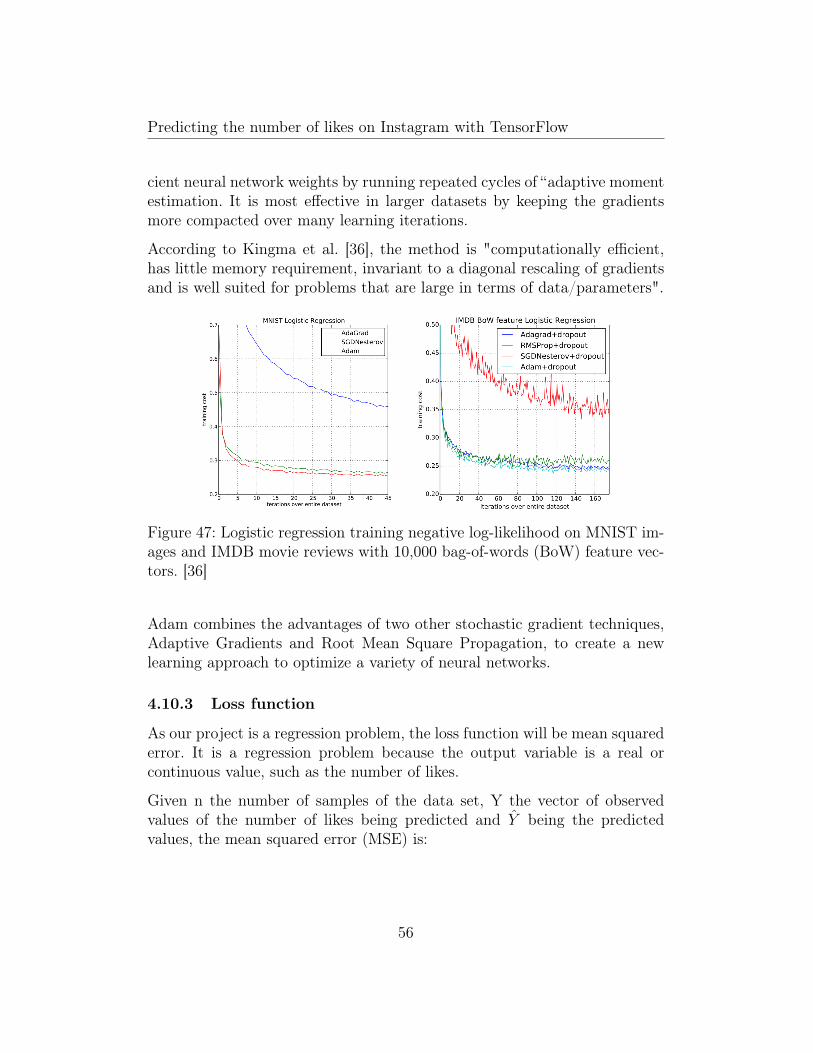
According to Kingma et al. [36], the method is "computationally efficient,has little memory requirement, invariant to a diagonal rescaling of gradientsand is well suited for problems that are large in terms of data/parameters".
Figure 47: Logistic regression training negative log-likelihood on MNIST im-ages and IMDB movie reviews with 10,000 bag-of-words (BoW) feature vec-tors. [36]
Adam combines the advantages of two other stochastic gradient techniques,Adaptive Gradients and Root Mean Square Propagation, to create a newlearning approach to optimize a variety of neural networks.
4.10.3 Loss function
As our project is a regression problem, the loss function will be mean squarederror. It is a regression problem because the output variable is a real orcontinuous value, such as the number of likes.
Given n the number of samples of the data set, Y the vector of observedvalues of the number of likes being predicted and Y being the predictedvalues, the mean squared error (MSE) is:
56
Predicting the number of likes on Instagram with TensorFlow
MSE = (1
n)
n∑i=1
(Yi − Yi
)MSE measures the average of the squares of the errors—that is, the averagesquared difference between the estimated values and the actual value [37].
Our goal is to minimize this value, which will provide us with the best re-gression line that goes through to the set of points.
4.10.4 Metric
The metric refers to the predictive accuracy of the model. In this case, aswe predict a number, we should use a function used for regression models.Mean absolute error (MAE) is chosen. MAE is the sum of absolute differencesbetween predicted and observed variables. The mean absolute error uses thesame scale as the data being measured, in this case, the number_of_likesvariable scale.
Given n the number of samples of the data set, Y the vector of observedvalues of the number of likes being predicted and being the predicted values,the mean absolute error (MAE) is:
MAE =
∑ni=1 yi − xin
This performance metric is also used to compare multiple models if it isanalyzed in the same data set. As we mentioned before, test data is built,holding 5936 data samples.
Root mean squared error (RMSE) is also one of the most common metricsused to measure accuracy for regression problems:
RMSE =
√√√√ n∑i=1
(yi − xi)2
n
Both metrics express average model prediction error in units of the predictionvariable and are indifferent to the direction of errors (positive or negative
57
Predicting the number of likes on Instagram with TensorFlow
errors). However, in our case, we have chosen for MAE for these reasons[38]:
• RMSE increases with the variance of the frequency distribu-tion of error magnitudes: as the variance of our target variable islarge, RMSE gives a will give a high weight to large errors. RMSEshould be more useful when large errors are particularly undesirable,but this is not our case.
• RMSE tends to be larger than MAE as the test sample sizeincreases: this would be a problem when we compare other RMSEresults calculated on different sized test samples on other models.
• More difficult to understand: RMSE does not describe average erroralone because the errors are squared before they are averaged. RMSEby itself does not tell whether our predictions are good.
4.10.5 Training models
After introducing all model architectures in the previous section, the threemodel branches (text, image and variables model) and the hybrid one istrained. While the models are training, TensorBoard is used to tracking MeanAbsolute Error and Root Mean Squared Error metrics through every epoch.TensorBoard is a tool for providing the measurements and visualizationsneeded during the machine learning workflow. It enables tracking experimentmetrics like loss and accuracy, visualizing the model graph and projectingembeddings to a lower dimensional space. [39]
First, the variable model branch is trained:
58
Predicting the number of likes on Instagram with TensorFlow
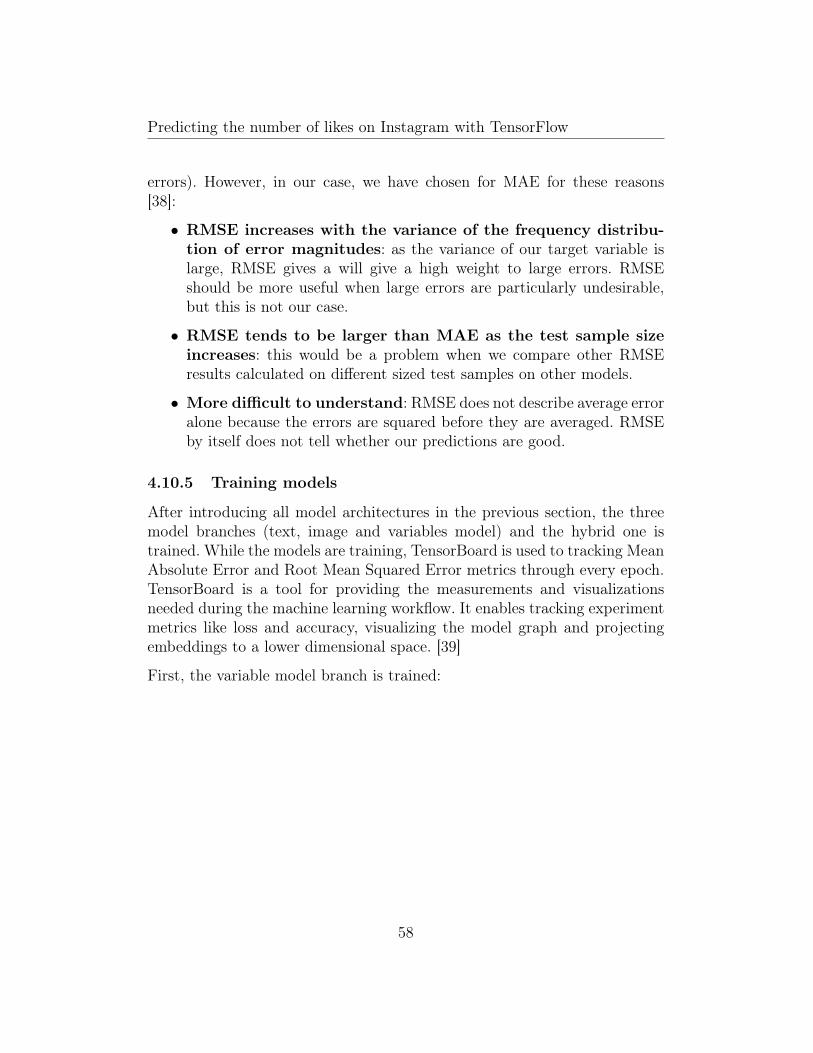
Figure 48: Variables model training. Mean Absolute Error along with thenumber of epochs.
In the previous figure, we can see Mean Absolute Errors values along withthe number of epochs. An epoch is one learning cycle where the trainer seesthe whole training data set. The variables model trains 35 epochs until themean absolute error metric converges, reaching the threshold. We obtain amean absolute error of 231,69 in the train set (RMSE of 377,79) and 232,64in the test set (RMSE of 354,76).
Table 5: Variables model metricsSet Loss Mean Absolute
ErrorRoot MeanSquared Error
Train 141978 231.69 377.79Validation 142128 242.37 381.92Test 125861.60 232.64 354.76
Taken 8 random observations from the test split and their predictions, theabsolute error between the predicted value and the actual value is calculated.
Table 6: Variables model: actual number of likes vs the predicted number oflikes
59
Predicting the number of likes on Instagram with TensorFlow
ID Average#likes
Actual#likes
Predicted#likes
AbsoluteError
1 1230.11 1156 1158.33 2.332 915.81 890 903.24 13.243 306.30 314 409.81 95.814 370.33 451 476.43 25.435 808.81 773 779.43 6.436 216.40 218 341.22 123.227 915.81 890 903.24 13.248 1248.27 935 1228.23 293.23
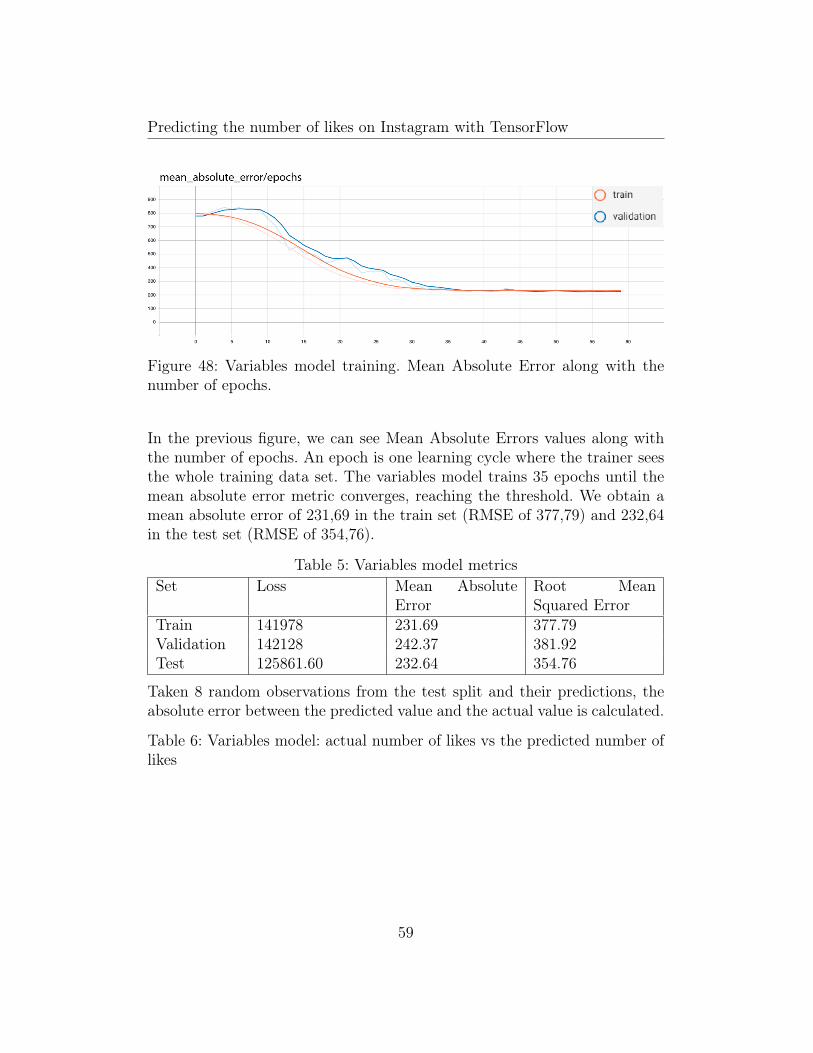
As we can observe, there are really accurate predictions, for example, number1 or 5, but some bad ones like 6 or 8.
Next, the image model branch is trained:
Figure 49: Image model training. Mean Absolute Error along with the numberof epochs.
The image model trains 8 epochs until the mean absolute error metric con-verges, reaching the threshold. We obtain a mean absolute error of 0,0247 inthe train set (RMSE of 0,03557) and 0,0257 in the validation set (RMSE of0,03461). The engagement rate is the prediction target of the image model.It means that the mean absolute error of the engagement rate is about 2,5%,a really interesting result.
Table 7: Image model metrics
60
Predicting the number of likes on Instagram with TensorFlow
Set Loss Mean AbsoluteError
Root MeanSquared Error
Train 0,001265 0,0247 0,03557Validation 0,001976 0,0257 0,03461Test 0,0014 0,0251 0,0383
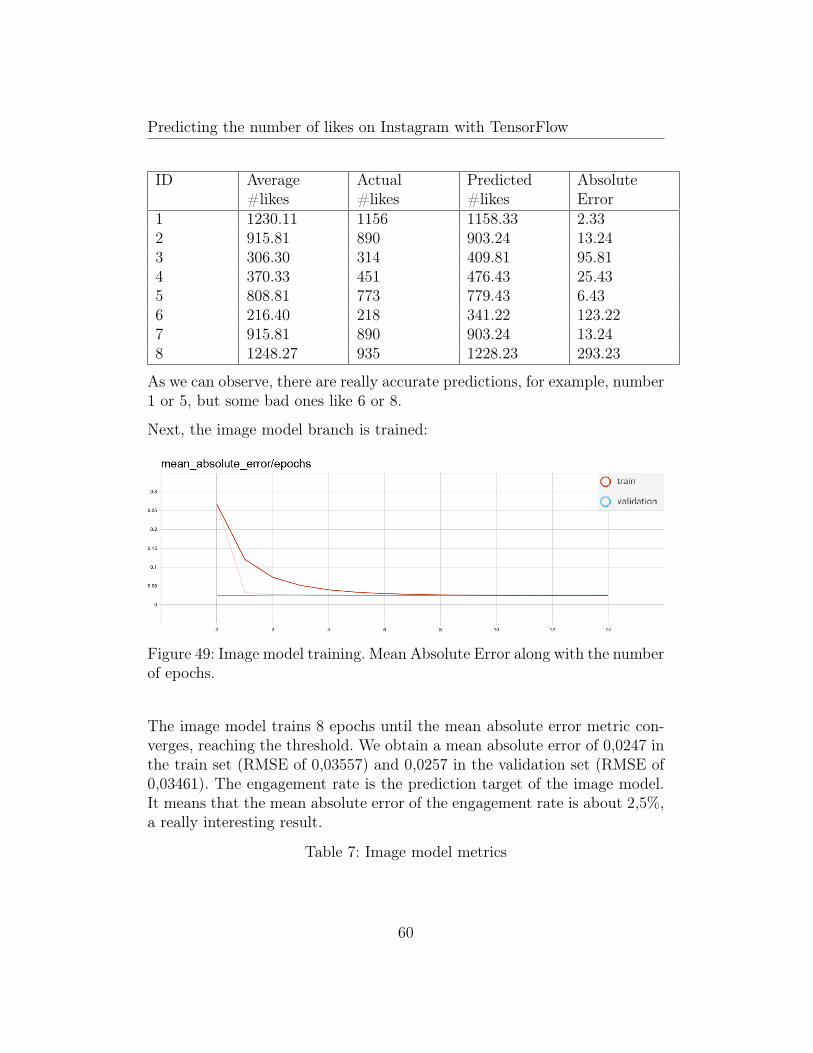
As we did before, 8 random observations are taken from the test split andtheir predictions, the absolute error between the predicted engagement ratevalue and the actual engagement rate value is calculated.
Table 8: Image model: actual engagement rate vs predicted engagement rateID Actual engage-
ment ratePredicted engage-ment rate
Absolute Error
1 3,31% 3,53% 0,21%2 1,78% 3,53% 1,76%3 3,56% 3,44% 0,11%4 1,41% 3,46% 2,05%5 0,73% 3,47% 2,75%6 6,20% 3,52% 2,67%7 3,57% 3,52% 0,04%8 1,49% 3,52% 2,03%
Next, the text model branch is trained:
Figure 50: Text model training. Mean Absolute Error along the number ofepochs.
The text model trains 12 epochs until the mean absolute error metric con-verges, reaching the threshold. A mean absolute error of 0,0244 is obtained
61
Predicting the number of likes on Instagram with TensorFlow
in the train set (RMSE of 0,0345) and 0,0245 in the validation set (RMSEof 0,0350). The engagement rate is the prediction target of the text model.
Table 9: Text model metricsSet Loss Mean Absolute
ErrorRoot MeanSquared Error
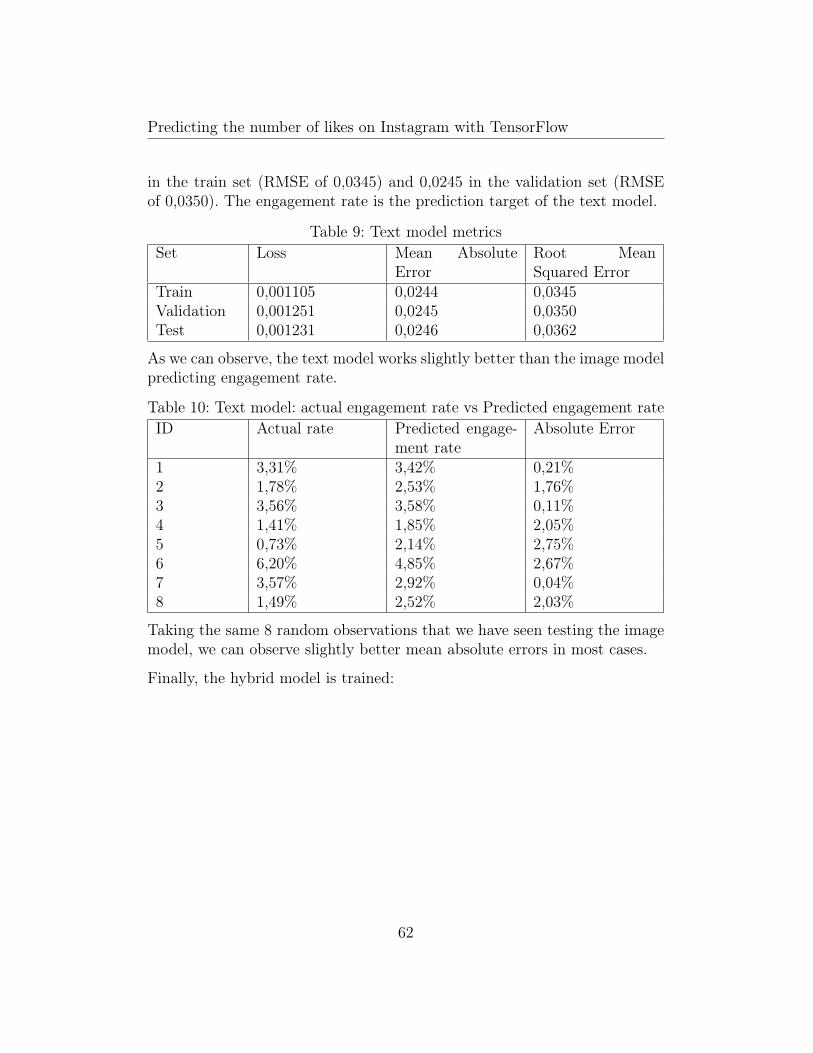
Train 0,001105 0,0244 0,0345Validation 0,001251 0,0245 0,0350Test 0,001231 0,0246 0,0362
As we can observe, the text model works slightly better than the image modelpredicting engagement rate.
Table 10: Text model: actual engagement rate vs Predicted engagement rateID Actual rate Predicted engage-
ment rateAbsolute Error
1 3,31% 3,42% 0,21%2 1,78% 2,53% 1,76%3 3,56% 3,58% 0,11%4 1,41% 1,85% 2,05%5 0,73% 2,14% 2,75%6 6,20% 4,85% 2,67%7 3,57% 2,92% 0,04%8 1,49% 2,52% 2,03%
Taking the same 8 random observations that we have seen testing the imagemodel, we can observe slightly better mean absolute errors in most cases.
Finally, the hybrid model is trained:
62
Predicting the number of likes on Instagram with TensorFlow
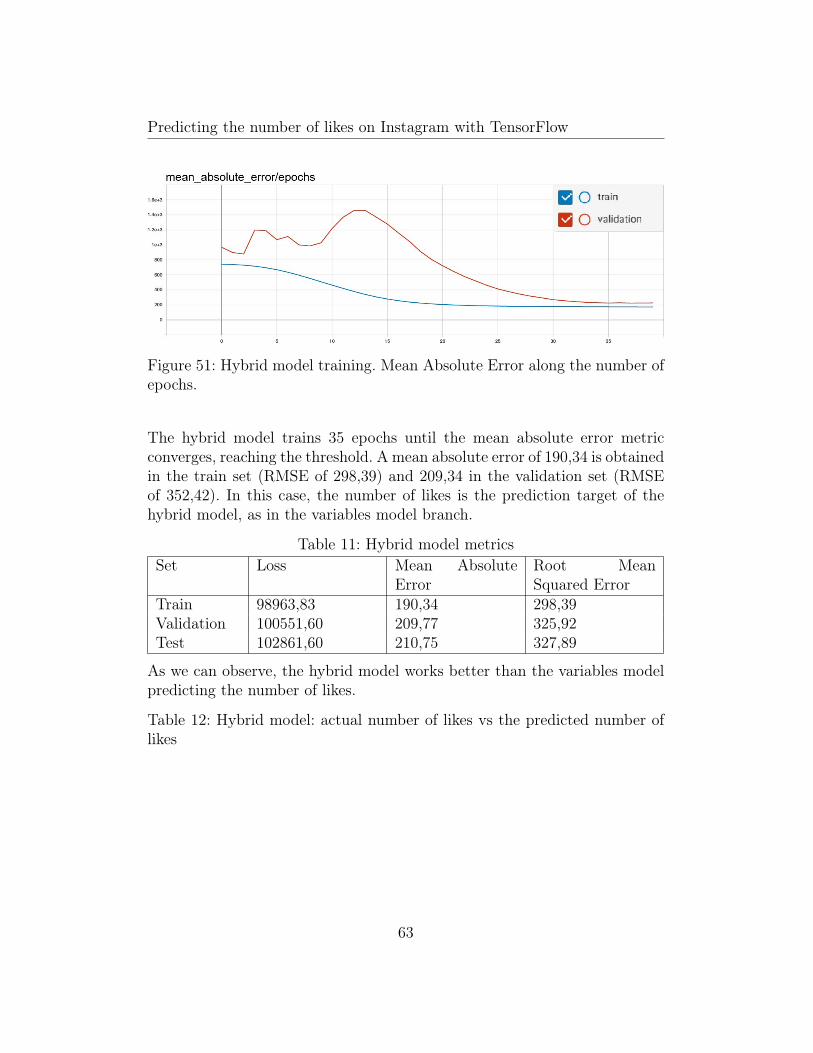
Figure 51: Hybrid model training. Mean Absolute Error along the number ofepochs.
The hybrid model trains 35 epochs until the mean absolute error metricconverges, reaching the threshold. A mean absolute error of 190,34 is obtainedin the train set (RMSE of 298,39) and 209,34 in the validation set (RMSEof 352,42). In this case, the number of likes is the prediction target of thehybrid model, as in the variables model branch.
Table 11: Hybrid model metricsSet Loss Mean Absolute
ErrorRoot MeanSquared Error
Train 98963,83 190,34 298,39Validation 100551,60 209,77 325,92Test 102861,60 210,75 327,89
As we can observe, the hybrid model works better than the variables modelpredicting the number of likes.
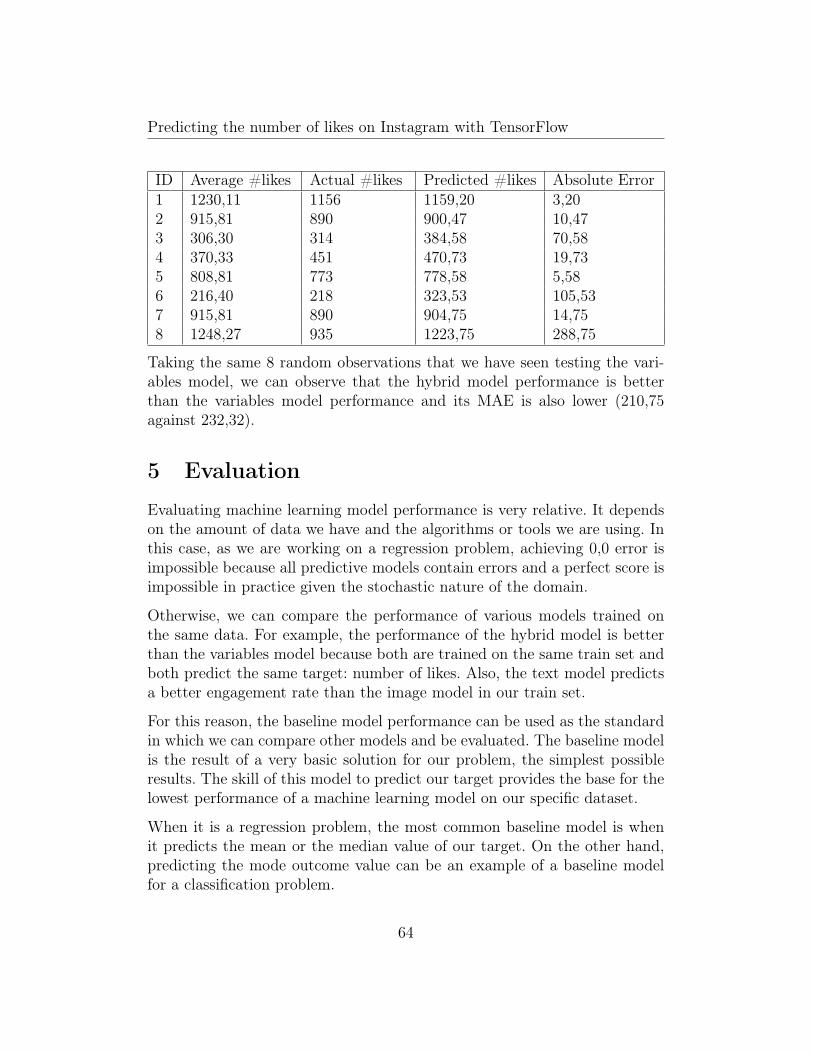
Table 12: Hybrid model: actual number of likes vs the predicted number oflikes
63
Predicting the number of likes on Instagram with TensorFlow
ID Average #likes Actual #likes Predicted #likes Absolute Error1 1230,11 1156 1159,20 3,202 915,81 890 900,47 10,473 306,30 314 384,58 70,584 370,33 451 470,73 19,735 808,81 773 778,58 5,586 216,40 218 323,53 105,537 915,81 890 904,75 14,758 1248,27 935 1223,75 288,75
Taking the same 8 random observations that we have seen testing the vari-ables model, we can observe that the hybrid model performance is betterthan the variables model performance and its MAE is also lower (210,75against 232,32).
5 Evaluation
Evaluating machine learning model performance is very relative. It dependson the amount of data we have and the algorithms or tools we are using. Inthis case, as we are working on a regression problem, achieving 0,0 error isimpossible because all predictive models contain errors and a perfect score isimpossible in practice given the stochastic nature of the domain.
Otherwise, we can compare the performance of various models trained onthe same data. For example, the performance of the hybrid model is betterthan the variables model because both are trained on the same train set andboth predict the same target: number of likes. Also, the text model predictsa better engagement rate than the image model in our train set.
For this reason, the baseline model performance can be used as the standardin which we can compare other models and be evaluated. The baseline modelis the result of a very basic solution for our problem, the simplest possibleresults. The skill of this model to predict our target provides the base for thelowest performance of a machine learning model on our specific dataset.
When it is a regression problem, the most common baseline model is whenit predicts the mean or the median value of our target. On the other hand,predicting the mode outcome value can be an example of a baseline modelfor a classification problem.
64
Predicting the number of likes on Instagram with TensorFlow
For this project, the mean value baseline model is chosen. The average num-ber of likes in the test set is the result of all predictions. As we have used themean absolute error for the accuracy score, we will use it as well to calculatethe error of the baseline model.
Mean Absolute Error for the baseline model is 557,78.
As we can observe, the baseline is a really bad result. It may indicate aparticular difficulty with the project problem. On the other hand, if our modelachieves a performance below that this result, indicates that our model is notappropriate for the problem.
Table 13: Comparing results with the baseline model
Model Mean Absolute ErrorBaseline model 557,78Hybrid model 210,75Difference 347,03
We know that our model is good when the performance falls within a rangebetween the best possible score (0,0) and the baseline. As we can observe,our model performance is 347,03 lowers than the baseline.
Now, we have explored the space of possible models and, in general, theobtained results can be considered to be quite good. In the future, it wouldbe possible to find another model that its performance falls within a rangebetween hybrid model performance (210,75) and 0.
6 Conclusions
After performing all the proposed tasks over the dataset, I could obtain veryinteresting information about the number of likes prediction in Instagramposts. First, we could access to Instagram post data through a web scrapingpython script. After, we have been able to analyze individually all its featuresand perform a significant exploratory data analysis.
To test further insights, the dataset was properly divided into a train, val-idation and a test partitions. The train partition was used to perform theexploration and the modeling, whereas the validation and test dataset wasused to validate the knowledge extracted from that modeling.
65
Predicting the number of likes on Instagram with TensorFlow
Finally, a model was trained to perform the proposed task. The chosen modelis an hybrid model, because it works particularly well with the image, nu-merical and text data and works with the amount of samples in the dataset.The trained model achieved good on the test dataset, given the difficulty ofthe task and the amount of data available.
Also, three is better than one; the idea of combining variable, image and textmodels has been a good choice. Our accuracy has definitely increased.
The quality of a deep learning model is constrained by the quality of thedataset. In this project, 8471 data samples were available. It is not considereda larger dataset to train a deep learning neural network. So, if I could haveaccess to more samples through the Instagram API, I could create a muchrobust model. Machine learning techniques get better with more data, deeplearning especially.
Therefore, all the required tasks have been performed successfully, providingme a lot of information and insights from the dataset. It has also been veryinteresting to work with a dataset so interpretable, because I have learnedto work with a more real-world oriented project. It has helped me a lot inunderstanding the techniques and algorithms used in deep learning, natu-ral language processing and convolutional neural networks and how to takethem into practice. It was a very interesting project I enjoyed a lot and inwhich I learned many interesting concepts I will surely be using in my futureprofessional career.
6.1 Future work
As I mentioned before, In the future, I would like to get access to the In-stagram API to obtain many Instagram post data in batch since a scrappybased web python script is not a model for scalability. It would mitigate themajority of problems currently present in the process. Nowadays, we can onlyaccess public accounts due to privacy. With the right amount of data, thishybrid model could predict Instagram likes through every kind of user, notonly beauty and fashion account categories.
During the project development, an interesting new was published: Instagramremoving likes [40]. Instagram is testing to hide the number of likes on postsin several countries, including Australia and Japan. Likes counters will behidden, so users can still see how many likes an own post obtained, but no
66
Predicting the number of likes on Instagram with TensorFlow
one else can. Adam Mosseri, Instagram’s CEO, has said that removing likeswas the platform’s way to “depressurize” Instagram for young people. Datascience teams at Facebook (which owns Instagram), believe that hiding likesmight motivate people to post more frequently. They also think that it mightextend the length of time that people spend on the app.
It was interesting to notice that maybe someday this project will not bereproducible due likes counter privacy. Then, it will not be to predict thenumber of likes. The number of comments could be the alternative variableto measure the popularity of a post.
7 List of References
References
[1] Instagram. Official Instagram Blog. https://about.instagram.com/about-us
[2] Most used social media platforms. Statista.https://www.statista.com/statistics/272014/global-social-networks-ranked-by-number-of-users/
[3] Instagram Business: Marketing on Instagram.https://business.instagram.com/?locale=en_EN
[4] Applied Project Engineering.https://www.fib.upc.edu/en/studies/bachelors-degrees/bachelor-degree-informatics-engineering/curriculum/syllabus/PAE
[5] TensorFlow.https://www.tensorflow.org/
[6] Seguros Catalana Occidente.https://www.seguroscatalanaoccidente.com/
[7] Ranked: The Most Valuable Brands in the World.https://www.cisualcapitalist.com/ranked-the-most-valuable-brands-in-the-world/
[8] Khosla, Aditya & Sarma, Atish & Hamid, Raffay. (2014). What makesan image popular?
67
Predicting the number of likes on Instagram with TensorFlow
[9] Crystal J. Qian, Jonathan D. Tang, Matthew A. Penza, Christopher M.Ferri. Instagram Popularity Prediction via Neural Networks and Regres-sion Analysis
[10] LikelyAI webpagehttps://www.likelyai.com/
[11] Beautiful Destinations webpagehttps://beautifuldestinations.com/
[12] Forbes. This Company Can Predict The Number Of Likes An InstagramPhoto Will Gethttps://www.forbes.com/sites/alysonkrueger/2016/07/21/this-company-can-predict-the-number-of-likes-an-instagram-photo-will-get/#2260c0195a47
[13] AI for everyone.https://www.coursera.org/learn/ai-for-everyone/
[14] Pranjal Pandev. Data Preprocessing : Concepts.https://towardsdatascience.com/data-preprocessing-concepts-fa946d11c825
[15] Andrew Ng. Machine Learning Yearning.https://towardsdatascience.com/data-preprocessing-concepts-fa946d11c825
[16] R webpagehttps://www.r-project.org/about.html
[17] RStudio webpagehttps://www.rstudio.com
[18] Git webpagehttps://git-scm.com/
[19] Github webpagehttps://github.com/
[20] Pandas webpagehttps://pandas.pydata.org/
[21] Selenium WebDriverhttps://www.selenium.dev/projects/
68
Predicting the number of likes on Instagram with TensorFlow
[22] Scikit-learnhttps://scikit-learn.org/stable/
[23] fastTexthttps://fasttext.cc/
[24] Piotr Bojanowski, Edouard Grave, Armand Joulin and Tomas Mikolov.(2016). Enriching Word Vectors with Subword Informationhttps://arxiv.org/abs/1607.04606
[25] Armand Joulin, Edouard Grave, Piotr Bojanowski, Tomas Mikolov.(2016). Bag of Tricks for Efficient Text Classificationhttps://arxiv.org/abs/1607.01759
[26] Heepsyhttps://www.heepsy.com/
[27] HypeAuditor webpagehttps://hypeauditor.com/en/
[28] Coobis: Content Marketing, Influencers & Branded Content.https://suite.coobis.com/
[29] Chrome websitehttps://www.google.es/chrome/browser/desktop/index.html
[30] Ian London. Encoding cyclical continuous features - 24-hour time.https://ianlondon.github.io/blog/encoding-cyclical-features-24hour-time/
[31] What is the vanishing gradient problem?https://deepai.org/machine-learning-glossary-and-terms/vanishing-gradient-problem
[32] J. Schmidhuber. (1992). Learning complex, extended sequences usingthe principle of history compression.
[33] Wikipedia. Residual neural network.https://en.wikipedia.org/wiki/Residual_neural_network
[34] Wikipedia. Data augmentation.https://en.wikipedia.org/wiki/Data_augmentation
69
Predicting the number of likes on Instagram with TensorFlow
[35] Kaiming He, Xiangyu Zhang, Shaoqing Ren, Jian Sun (2015. DeepResidual Learning for Image Recognition.https://arxiv.org/pdf/1512.03385.pdf
[36] Kingma, D. P., & Ba, J. (2014). Adam: A method for stochastic opti-mization.https://arxiv.org/abs/1412.6980
[37] Wikipedia. Mean squared error.https://en.wikipedia.org/wiki/Mean_squared_error
[38] JJ. MAE and RMSE — Which Metric is Better?https://medium.com/human-in-a-machine-world/mae-and-rmse-which-metric-is-better-e60ac3bde13d
[39] Tensorflow. TensorBoard.https://www.tensorflow.org/tensorboard
[40] MacPaw. Instagram removing likes: Why, when, and what it will looklike.https://macpaw.com/how-to/instagram-removing-likes
8 Annexes
8.1 R packages used
The packages used and required to make the website work are the following:
• dplyr
• ggplot2
• ggpubr
• tidyr
• dplyr
• scales
• ggcorrplot
• readr
70
Predicting the number of likes on Instagram with TensorFlow
• RColorBrewer
• tm
8.2 Python packages used
• tensorflow
• tensorboard
• scikit-learn
• pillow
• pandas
• numpy
• selenium
• urllib3
• fasttext
71
Copyright © 2022 FDOKUMEN