Attention economics of Instagram stars: #instafame and sex ...
30
econstor Make Your Publications Visible. A Service of zbw Leibniz-Informationszentrum Wirtschaft Leibniz Information Centre for Economics Gänßle, Sophia Working Paper Attention economics of Instagram stars: #instafame and sex sells? Ilmenau Economics Discussion Papers, No. 150 Provided in Cooperation with: Ilmenau University of Technology, Institute of Economics Suggested Citation: Gänßle, Sophia (2021) : Attention economics of Instagram stars: #instafame and sex sells?, Ilmenau Economics Discussion Papers, No. 150, Technische Universität Ilmenau, Institut für Volkswirtschaftslehre, Ilmenau This Version is available at: http://hdl.handle.net/10419/235847 Standard-Nutzungsbedingungen: Die Dokumente auf EconStor dürfen zu eigenen wissenschaftlichen Zwecken und zum Privatgebrauch gespeichert und kopiert werden. Sie dürfen die Dokumente nicht für öffentliche oder kommerzielle Zwecke vervielfältigen, öffentlich ausstellen, öffentlich zugänglich machen, vertreiben oder anderweitig nutzen. Sofern die Verfasser die Dokumente unter Open-Content-Lizenzen (insbesondere CC-Lizenzen) zur Verfügung gestellt haben sollten, gelten abweichend von diesen Nutzungsbedingungen die in der dort genannten Lizenz gewährten Nutzungsrechte. Terms of use: Documents in EconStor may be saved and copied for your personal and scholarly purposes. You are not to copy documents for public or commercial purposes, to exhibit the documents publicly, to make them publicly available on the internet, or to distribute or otherwise use the documents in public. If the documents have been made available under an Open Content Licence (especially Creative Commons Licences), you may exercise further usage rights as specified in the indicated licence. www.econstor.eu
-
Upload
khangminh22 -
Category
Documents
-
view
0 -
download
0
Transcript of Attention economics of Instagram stars: #instafame and sex ...

econstorMake Your Publications Visible.
A Service of
zbwLeibniz-InformationszentrumWirtschaftLeibniz Information Centrefor Economics
Gänßle, Sophia
Working Paper
Attention economics of Instagram stars: #instafameand sex sells?
Ilmenau Economics Discussion Papers, No. 150
Provided in Cooperation with:Ilmenau University of Technology, Institute of Economics
Suggested Citation: Gänßle, Sophia (2021) : Attention economics of Instagram stars:#instafame and sex sells?, Ilmenau Economics Discussion Papers, No. 150, TechnischeUniversität Ilmenau, Institut für Volkswirtschaftslehre, Ilmenau
This Version is available at:http://hdl.handle.net/10419/235847
Standard-Nutzungsbedingungen:
Die Dokumente auf EconStor dürfen zu eigenen wissenschaftlichenZwecken und zum Privatgebrauch gespeichert und kopiert werden.
Sie dürfen die Dokumente nicht für öffentliche oder kommerzielleZwecke vervielfältigen, öffentlich ausstellen, öffentlich zugänglichmachen, vertreiben oder anderweitig nutzen.
Sofern die Verfasser die Dokumente unter Open-Content-Lizenzen(insbesondere CC-Lizenzen) zur Verfügung gestellt haben sollten,gelten abweichend von diesen Nutzungsbedingungen die in der dortgenannten Lizenz gewährten Nutzungsrechte.
Terms of use:
Documents in EconStor may be saved and copied for yourpersonal and scholarly purposes.
You are not to copy documents for public or commercialpurposes, to exhibit the documents publicly, to make thempublicly available on the internet, or to distribute or otherwiseuse the documents in public.
If the documents have been made available under an OpenContent Licence (especially Creative Commons Licences), youmay exercise further usage rights as specified in the indicatedlicence.
www.econstor.eu
Ilmenau University of Technology
Institute of Economics ________________________________________________________
Ilmenau Economics Discussion Papers, Vol. 27, No. 150
Attention Economics of Instagram Stars:
#Instafame and Sex Sells?
Sophia Gaenssle
May 2021
Institute of Economics
Ehrenbergstraße 29 Ernst-Abbe-Zentrum D-98 684 Ilmenau Phone 03677/69-4030/-4032 Fax 03677/69-4203
https://www.tu-ilmenau.de/wth ISSN 0949-3859
2
Attention Economics of Instagram Stars: #Instafame and Sex Sells?
Sophia Gaenssle*
Social media stars create stardom with uploads on social media pages like YouTube, TikTok
or Instagram. One of the most popular platforms, especially designed to upload picture contents,
is the service “Instagram” owned by Facebook. The growing social, cultural and economic
power of social media star phenomenon raises the question about key drivers of success. Does
body exposure drive Instagram success? Is there a difference between male and female content
in this regard? This paper empirically analyses 500 top Instagram stars within the categories (1)
fashion and beauty, (2) fitness and sports, (3) music, (4) photo and arts, (5) food and vegan.
The unbalanced panel data set consists of 100 stars within each category over an observation
period of five months. The data provides information on popularity measurements, such as
subscribers, likes and comments, and most importantly, price estimates per post. Since
influencers are not paid by the platform, but mainly by advertisers for promotion of their
products, the estimated price per upload combined with the posting frequency serve as a valid
proxy for weekly revenue and economic success. Mean comparison tests show that accounts
with focus on female accounts have a significantly higher degree in body exposure, while the
price per picture is higher for male content. Weekly revenues do not significantly diverge.
Furthermore, using panel regressions, I estimate the effect of body exposure and sex on
advertising revenue. The results show that body exposure has a positive effect, whereas the sex
has no significant influence in the regression estimations. Eventually, this raises the question
of a gender pay gap in social media.
Keywords: cultural and creative industries, attention economics, superstar theory, social media
stars, influencers, Instagram, gender pay gap
* Researcher, Chair for Economic Theory, Institute of Economics, Ilmenau University of Technology, Germany, email: [email protected]. This research was funded by the Department of Economic Science and Media of the Ilmenau University of Technology. It was part of a young researcher funding and there is no conflict of interest.
3
1. Introduction
Popular content providers on social media, so-called influencers, represent a novel star-type of
the digital era. The fame of social media stars (SMS) is native to social media platforms
(Marwick, 2016). With self-produced content, they build their audiences on pages like
YouTube, TikTok, Instagram, Twitch, etc. In contrast to stars of traditional media, there are no
gatekeepers who manage audience access (Budzinski & Gaenssle, 2020; Gräve, 2017). One of
the main tasks of traditional gatekeepers is the promotion of content and generating audience
attention. Content providers on Instagram & Co are able to control upload frequencies and
audience access themselves, without middlemen like editors or producers. Digital
developments decrease specific technological barriers to enter creative industries, such as high-
quality cameras to take pictures or shoot videos and the possibility to make them publicly
available on your social media page. So from a technological point of view, it is possible to
create content and put it online for the world to see, yet, it is (still) very difficult to gain
consumer attention. The process of audience building can be explained using attention
economics (AE), the concept of attention as a scarce resource (for an overview on AE see:
Taylor & Greg, 2014). Since attention is scarce, it is difficult to gain even initial consumer
access. To stand out and draw attention, nudity is a common way and the idea of “sex sells” has
been subject to various studies (Wirtz et al., 2018). Nudity in media is not only of social and
ethnical interest, but also from an economic point of view. This paper empirically studies if
body exposure (BE) is beneficial for Instagram success. Therefore, I raise the following
research questions: Does body exposure drive Instagram success? Is there a difference between
male and female content in this regard?
The service “Instagram” owned by Facebook is one of the most popular platforms, and is
especially designed to upload picture contents. I empirically analyse 500 top Instagram stars
(IS) within the categories (1) fashion and beauty, (2) fitness and sports, (3) music, (4) photo
and arts, (5) food and vegan. The panel data set consists of 100 stars within each category over
an observation period of approximately five months (see Section 3.1 for details on sampling).
The data set contains information on popularity measurements, such as followers, likes and
comments, and most importantly, price estimates per post. Since IS are not paid by the platform,
but mainly by advertisers for promotion of their products (see Section 3.2 for details on SMS
income), the estimated price per upload is a valid proxy for economic success. The combination
of weekly post frequency and price per post gives the estimated weekly revenue for each IS.
Using panel regression, I statistically analyse the influence of body exposure, sex, and
4
popularity measurements on revenue. The results show that BE positively influences
advertising revenue, while impact of sex is more complex and needs careful interpretation.
Therefore, further statistical methods are used to examine differences between sexes.
The paper is structured as follows. Section 2 provides an overview on theoretical aspects such
as attention economics and the role of stars. Section 3 contains information on the data set,
sample, and variables. In the following Section 4 the data is empirically analysed and discussed.
Section 5 gives concluding remarks, limitations and implications.
2. Stars in Attention Economics
The concept of limited consumer attention is not a new phenomenon of the digital age, but it
excessively increased due to its’ developments. Simon (1971) first pointed out the problem of
scarcity in an information-rich society, since information “consumes the attention of its
recipients” (Simon, 1971, p. 40). With the shift to digital economy, the importance of
information drastically increased, since former tangible goods could be digitised. Shapiro and
Varian (1999) explain (way ahead of their time) that information goods can be all sorts of goods
which can be digitised, such as films or books. The rise in available information shifted the
focus; not information access, but information overload becomes prevalent in modern society
(Shapiro & Varian, 1999; Taylor & Greg, 2014). Limited attention needs to be efficiently
allocated dynamically over different sources and platforms (Che & Mierendorff, 2019).
Therefore, limited consumer attention becomes the de facto barrier to entry in a lot of digital
markets, among them social media platforms.
Budzinski and Gaenssle (2020) apply attention economics to the field of social media. This
paper extends their work and theoretical idea of audience building. Audience building is
separated in two economic effects, which take place simultaneously but can be distinguished
analytically: audience attraction and audience maintenance. The former, translates into first
contact and creating initial attention – an eye-catcher and first connection with consumers. A
common way to gain consumer attention is the paradigm “sex sells”. The exposure to sexual
appeals for advertising, brand recognition/memory and purchase intentions has been subject to
many scientific studies (for detailed meta-analyses see: Wirtz et al., 2018; or: Lull & Bushman,
2015). Nudity and ads with sexual appeal produce mixed results and disagreement among
researchers regarding their effects on buying intentions of consumers; nudity not always
increases sales (inter alia, Dudley, 1999; Mittal & Lassar, 2000; Severn et al., 1990). This study
5
seeks to analyse the influence of body exposure and its’ influence on Instagram success,
regarding the star income. Franck (2019) analyses the “economy of attention” and refers to
celebrity income as “attention income”. In the following nudity serves as variable of audience
attraction and means to increase attention income.
The second aspect of audience building is audience maintenance. For sustainable success it is
not only necessary to generate one-time attention, but to keep followers on board. The concept
of consumption capital and “building of taste” can be applied here (Stigler & Becker, 1977).
According to the superstar theory of Adler (1985, 2006) there are three ways to acquire
consumption capital:
(1) Direct consumption of content: When consumers are exposed to content they build specific
knowledge, e.g. about the star, the type of content, and all other details and knowledge which
is transmitted. A food account, for instance, can serve as information on health and cooking
advice, and additionally the fans get used to the content provider and her type of presentation
and communication. As Adler puts it in his seminal paper on superstars: “The more you know,
the more you enjoy” (Adler, 1985, pp. 208–209). The more videos are available on an Instagram
account, the better the possibility to acquire consumption capital. Fans can get to know the
content provider, scroll through her page and build specific knowledge. Therefore, in this study
the number of total posts on the account serve as proxy for the possibility to acquire
consumption capital.
(2) Communication about content (communality effects): Consumers not only build specific
knowledge and derive utility from consuming the content itself, but also through
communications with others (commonality effect), i.e. exchanging information with others and
learning even more. Consumption capital, thus, drives bandwagon effects (Leibenstein, 1950).-
The communicational aspect gained importance in the digital environment. Cost of
communication drastically lowered on the demand and the supply side (Gaenssle & Budzinski,
2020). Fans can easily comment on posts of their favourite stars and connect among each other;
emojis and likes even simplify this process and further reduce costs of communication. It is
very easy to find like-minded people and forward content to friends and family. This leads to
considerable network effects (Katz & Shapiro, 1985, 1994). Jung and Nüesch (2019) find that
popularity serves not only as a quality signal, but the mere number of historical views on a
YouTube video generates utility itself. Consumers perceive these videos as popular; they can
share and talk about it. There are different popularity indicators; the most common ones are
views, followers, likes, and comments (Burgess & Green, 2018). To operationalise the
6
popularity concept in this paper, I use the total number of followers, and the average of recent
likes and comments.
(3) Media coverage (availability): According to Adler (1985, 2006), the cost of consumption
arise from (1) actual cost of consumption, i.e. watching videos, looking at pictures, reading
captions, and (2) search cost of finding suitable content and conversation partners. If content
availability is necessary to lower cost of consumption and drive social media success,
multihoming strategies have to be taken into account. Multihoming could lower search costs for
consumers and make the star’s content broadly available. An IS might decide to post a video
on Tiktok and also share it on Instagram. The variable multihoming will serve as another input
factor for audience maintenance.
Both theoretical parts of audience building deal with scarce attention; attraction and
maintenance need the consumers’ time and focus. The second part, however, pertains to
superstar theory, which is very well researched. A lot of empirical evidence can be found
focusing on ideas of Adler and his concept of snowballing into superstardom.1 This paper aims
to contribute to filling the research gap and analyse the first part, the initial attraction of
audience attention, using body exposure as a proxy.
3. Data and Variables
3.1 Sample
The data is retrieved from Heepsy.com and Instagram. Heepsy.com primarily provides data for
companies, who want to find influencers for ads on Instagram. Therefore, the service includes
prices per post. To retrieve data from Heepsy a professional account with payment is needed.
The funding of the paper allowed a time series of 5 month and 500 influencers, with
observations approximately every ten days (translating into 15 observations per account on
average). Consequently, I have an unbalanced data set (unbalanced due to availability issues
und cleaning of duplicates), with 7,362 observations in total.
1 A literature overview on economics of superstars can be found in: Budzinski and Gaenssle (2020). Empirical papers testing Adler’s concepts: Budzinski and Pannicke (2017); Candela et al. (2016); Crain and Tollison (2002); Ehrmann et al. (2009); Filimon et al. (2011), Franck and Nüesch (2008, 2012), Giles (2006); Hofmann and Opitz (2019); Jung and Nüesch (2019); Lehmann and Schulze (2008); Lucifora and Simmons (2003); Meiseberg (2014); Salganik et al. (2006).
7
It is possible to select the IS according to specific settings on Heepsy. Only accounts which
stated their mail address on Instagram are included in the sample. Adding a mail address to the
profile can be interpreted as interest in further contact, apart from direct messages within
Instagram. It can be expected that stars with email address want to be contacted and show
business interest. Five popular but distinct categories are selected: (1) beauty & fashion
(Fashion); (2) fitness and yoga (Fitness); (3) food and health (Food) (3) music (Music); (4)
photo and arts (Photo). The choice was influenced by the popularity of the categories and their
distinctiveness (Hypeauditor, 2020). Some categories are broadly overlapping (e.g. sports and
fitness). In case of doubt and considering double sampling, only the more popular one was
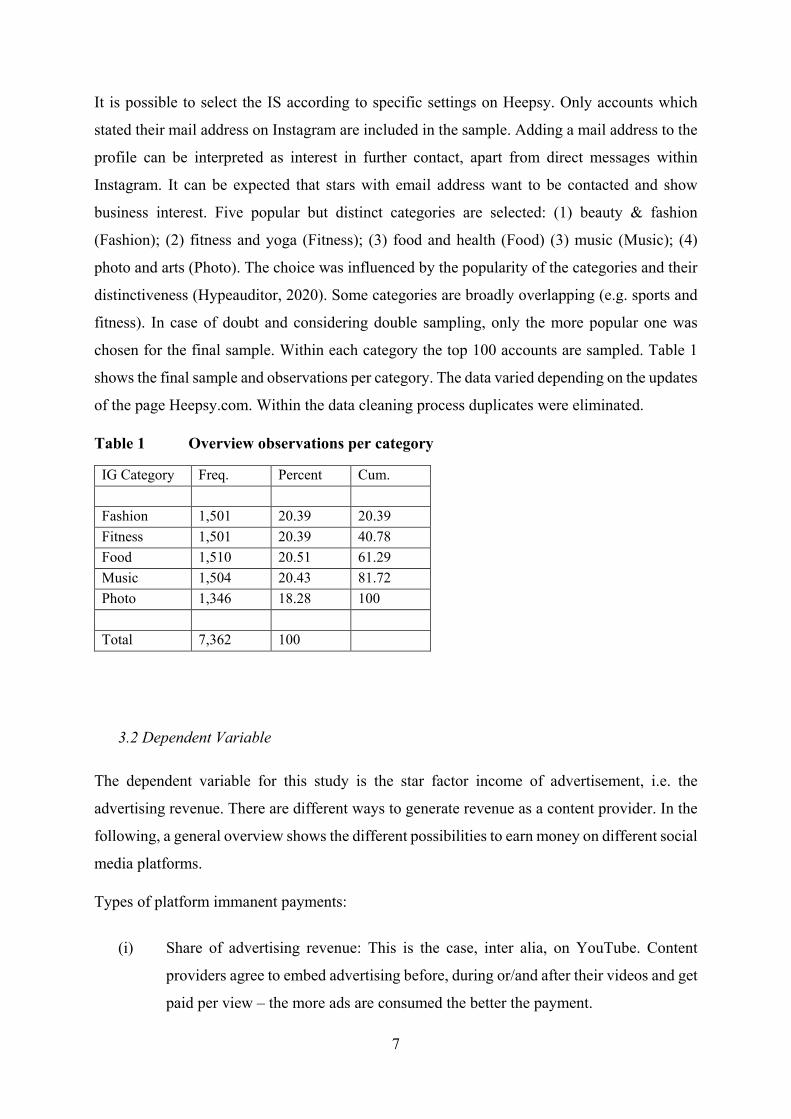
chosen for the final sample. Within each category the top 100 accounts are sampled. Table 1
shows the final sample and observations per category. The data varied depending on the updates
of the page Heepsy.com. Within the data cleaning process duplicates were eliminated.
Table 1 Overview observations per category
IG Category Freq. Percent Cum.
Fashion 1,501 20.39 20.39 Fitness 1,501 20.39 40.78 Food 1,510 20.51 61.29 Music 1,504 20.43 81.72 Photo 1,346 18.28 100
Total 7,362 100
3.2 Dependent Variable
The dependent variable for this study is the star factor income of advertisement, i.e. the
advertising revenue. There are different ways to generate revenue as a content provider. In the
following, a general overview shows the different possibilities to earn money on different social
media platforms.
Types of platform immanent payments:
(i) Share of advertising revenue: This is the case, inter alia, on YouTube. Content
providers agree to embed advertising before, during or/and after their videos and get
paid per view – the more ads are consumed the better the payment.
8
(ii) Direct donations (tips): It is possible to directly send money to the content providers
i.e. tip them. This is (among other payment methods) possible on Twitch.
(iii) A payment barrier to access content: The content provider can establish a paywall,
for instance, a monthly flat rate (all you can eat) system or pay per view (à la carte)
system, e.g. Patreon.
Types of external payments:
(iv) Own sponsored content or own brands: With growing reach content providers often
start their own business or sell and promote their own products. A baker for example
sells baking equipment, a makeup artist own makeup products. This is broadly used
on WeChat in connection with Taobao shops in China; content providers have their
own shop and products connected to the social media page. New options of
Instagram enable similar functions.
(v) Commission and affiliated links: It is possible to embed affiliate links (e.g. Amazon
cooperates with many retailers) or use discount codes to get a commission for sales.
The latter is also popular on Instagram.
(vi) Ad financed (or sponsored) content: This can start very small with product
placements and free samples. Content providers include products in their content
and promote them. Very successful SMS are able to earn vast amounts of money to
include ads in their posts. This payment strategy is predominant on Instagram.
Version (vi) is used within this study. It is a valid proxy for IS income on Instagram, since most
of the top stars use ad financing and Instagram does not offer platform immanent payments.
Figure 1 shows the Instagram payment system for deeper understanding. There are two
advertising parties, those directly paying Instagram for placing ads in user chronics (Advertisers
2) and those financing IS, i.e. transmitting ads indirectly via the star (Advertisers 1). The
consumers pay with their personal data and attention as they consume ads.

9
Figure 1 Multisided platform Instagram
The stream between Advertisers 1 and IS is operationalised in this paper. The price per picture
is the price an advertiser needs to pay for one sponsored picture on the respective account. For
instance, the price for makeup artist Patrickstarrr end of January 2020 was USD 6.100 per
picture. This data is offered by Heepsy.com, who have market based information and
complement those values with estimated values (data interpolation).2 To calculate the
dependent variable, the price per picture is combined with the posting frequency, hence, a
weekly revenue can be estimated.
The factor income proxy “revenue per week” varies between USD 46 and 5,635,000, with a
mean at USD 90,461.32. Since the data is very right skewed and, thus, residuals have a skewed
distribution, the data is transformed to obtain symmetrically distributed values. The logarithm
of the income proxy provides a good fit, compared to the log-normal distribution (see Figure
2). A similar approach is used in other studies on superstars, measuring income or market value
effects (inter alia, Franck & Nüesch, 2008; Lucifora & Simmons, 2003).
2 Further details of data collection etc. are business secrets and not publicly available. This information can be obtained only through personal contact. As correctness and reliability is essential for Heepsy to calculate accurate costs for their customers, it can be expected that the proxy is valid.
Advertisers 1 Instagram Stars
Instagram Advertisers 2
Consumers
ad service/attention
content content space/business account
payment(p > 0)
ad space/attention
attention/data
content/ads
payment(p > 0)

10
Figure 2 Density allocation of logarithm of factor income
3.3 Independent Variables and Controls
I use two sets of independent variables. The ones for audience attraction and those for audience
maintenance. Body exposure is used as a proxy for audience attraction. The information on BE
is collected directly from Instagram. This is a time invariant variable, since the coding is very
extensive, i.e. the process was only performed once. The last 12 pictures of the account and
their respective degree of nudity are analysed.3 Different types of nudity can be defined
theoretically, as in everyday dresses (“demure”), mini-skirts or shorts (“suggestive”), bathing
suits/shorts (“partially clad”), without clothes (“nude”) (Reichert, 2002; Wirtz et al., 2018).
Instagram’s guidelines restrict nudity to a certain degree.4 For this study the category “partially
clad” is defined more closely into the degree of nudity. Therefore, the degree of nudity within
the last active pictures posted (12 pics per account) are analysed. If a picture shows 50 per cent
or more naked skin (excluding portrait pictures), the BE is coded as 1. If there is less nudity in
the picture it is coded as 0. To account for the degree of suggestiveness, if 50 per cent or more
focus lie on “dressed” primary sexual characteristics (breasts, bottom, genitals), this is also
coded as 1 (see examples in the appendix). I operationalise the degree of nudity on the account
3 Heepsy uses 12 pictures for their analyses and displays them for customers. Those 12 pictures are also used for further manual coding in this paper. Instagram Stories are not part of the analysis. 4 Community guidelines by Instagram (as in spring 2021): “Post photos and videos that are appropriate for a diverse audience: We know that there are times when people might want to share nude images that are artistic or creative in nature, but for a variety of reasons, we don’t allow nudity on Instagram. This includes photos, videos, and some digitally-created content that show sexual intercourse, genitals, and close-ups of fully-nude buttocks. It also includes some photos of female nipples, but photos in the context of breastfeeding, birth giving and after-birth moments, health-related situations (for example, post-mastectomy, breast cancer awareness or gender confirmation surgery) or an act of protest are allowed. Nudity in photos of paintings and sculptures is OK, too.” Facebook (2021)

11
by summing up the “nude pictures”, i.e. accounts with BE = 12 have a very high degree of
nudity, accounts with BE = 0 have no nude pictures. The percentage of BE pictures is calculated
for every account, to improve transparency and understanding in the descriptive analysis. Since
the coding process is sensitive to subjective perception, a second person evaluated the pictures
for inter-coder reliability. Moreover, to ensure intra-coder reliability, a second test was
performed, i.e. the same coder rechecked the pictures a few months later.
The second set of independent variables are the ones for audience maintenance: followers, likes,
comments, total posts, and multihoming. They are summarised in Table 2
Table 2 Independent Variables: Audience Maintenance
Variable Obs Mean Std. Dev. Min Max
Followers 7,362 6,474,005.00 6,587,006.00 1,436,180 65,800,000
Avg Likes 7,362 162,385.10 258,043.00 91 3,234,545
Avg Comments 7,362 1,497.38 3,813.10 2 85,580
Number of Posts 7,362 2,968.96 4,278.14 12 57,048
Multihoming 7,362 1.88 0.82 0 4
The total number of followers are all followers of the account at the time of observation, with
a mean of 6.4 million. There are huge differences for followers, likes, and comments, which is
why logarithmic values are used for the regression model. Likes and comments (there are no
dislikes on Instagram) are the so-called audience engagement, the engagement of followers with
the star. Average likes and are calculated by Heepsy according to the last 12 pictures posted.
This gives the active engagement of the audience at the moment (i.e. calculating over the whole
sample does not reflect the accurate engagement at that very moment. Historical outliers may
bias results). For this study the average number of likes and comments over the last 12 pictures
is a good proxy for the active engagement, influencing the IS success.
The number of posts is the number of total uploads on the account, i.e. total content available.
The mean number of posts is 2968.96 pictures with a standard deviation of 4278.14; there are
huge differences between accounts. Some post a lot more (higher frequency) then others. The
age of the account is unknown, hence, it is not possible to control how much time the IS spend
to upload content. For this variable I also use log values in the regression model.
Multihoming is a generated variable. I have information on secondary accounts of every IS, if
they have a (a) website, a (b) Facebook, (c) YouTube, (d) Twitter or (e) Snapchat account. At
12
maximum this variable can be 5 (all five channels are used), at a minimum 0 (nothing other
than Instagram is used). No account has more than 4 channel next to Instagram. The sample has
1.88 other channels with a standard deviation of 0.82. For the last observation period in June
2020, 404 had a website, 45 had Facebook, 295 had YouTube, 63 had Twitter, 55 had Snapchat.
More complex is the information on the type of content on the account. The measurement of
sex refers to the type of content and what the focus of the account is, i.e. is there a focus on
male, female or no specific focus on the account. Therefore, all accounts are analysed
individually. For decades researchers have carefully studied the terms sex (biology/physiology)
and gender (social/sexual identity) (Lorber, 1996, 2005). An external identification of the sex
is only possible as “read as” female or male, according to visible features. I coded five different
variables (1) female (clearly female features, one or more women), (2) male (clearly male
features, one or more men), (3) mixed (clearly male and female, if more than one person in the
picture), (4) ambivalent (sexual characteristics recognizable, but not clearly attributable to a
man or a woman, e.g. transvestite or similar), (5) no identification (no characteristics visible).
Paintings, statues of humans are also coded accordingly. This goes hand in hand with the body
exposure analysis; 12 pictures per account are analysed and coded. If all 12 pictures show a
woman this is coded as 12-0-0-0-0, if there are 6 pictures of women and 6 pictures of men, this
is coded as 6-6-0-0-0 (see example in the appendix). Thus, it is possible to implement a proxy,
the degree of female or male pictures of every account. On average there is more female content
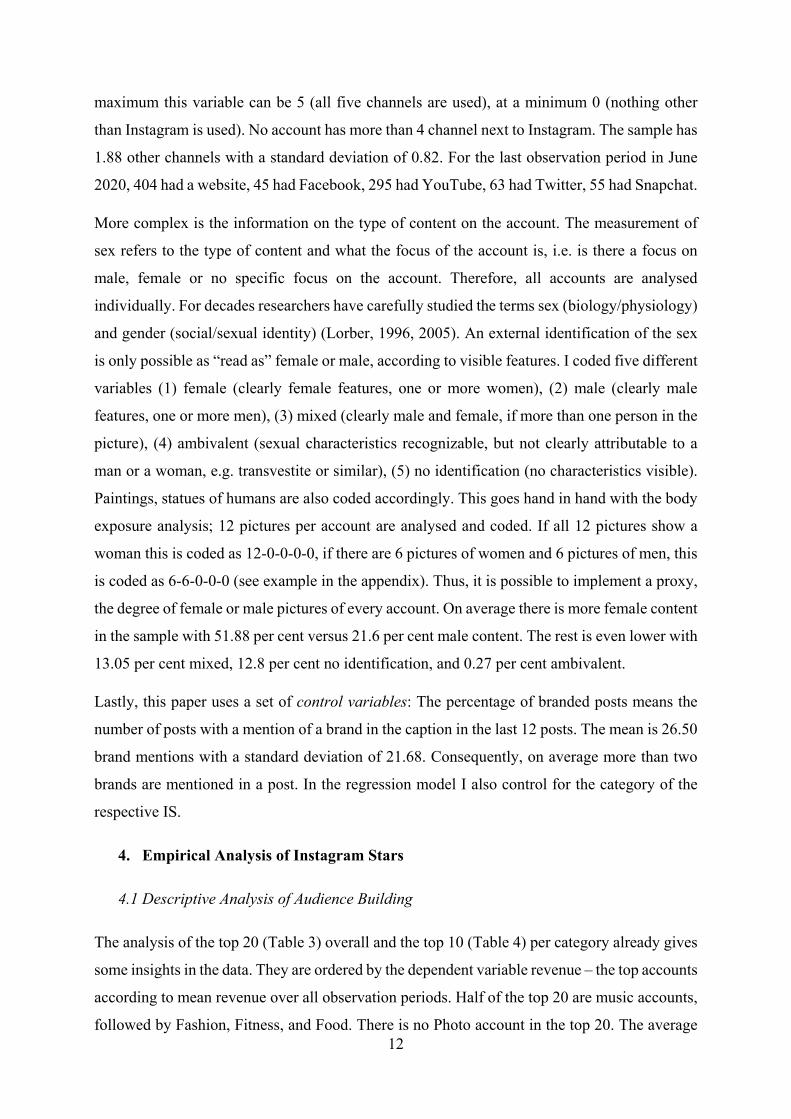
in the sample with 51.88 per cent versus 21.6 per cent male content. The rest is even lower with
13.05 per cent mixed, 12.8 per cent no identification, and 0.27 per cent ambivalent.
Lastly, this paper uses a set of control variables: The percentage of branded posts means the
number of posts with a mention of a brand in the caption in the last 12 posts. The mean is 26.50
brand mentions with a standard deviation of 21.68. Consequently, on average more than two
brands are mentioned in a post. In the regression model I also control for the category of the
respective IS.
4. Empirical Analysis of Instagram Stars
4.1 Descriptive Analysis of Audience Building
The analysis of the top 20 (Table 3) overall and the top 10 (Table 4) per category already gives
some insights in the data. They are ordered by the dependent variable revenue – the top accounts
according to mean revenue over all observation periods. Half of the top 20 are music accounts,
followed by Fashion, Fitness, and Food. There is no Photo account in the top 20. The average
13
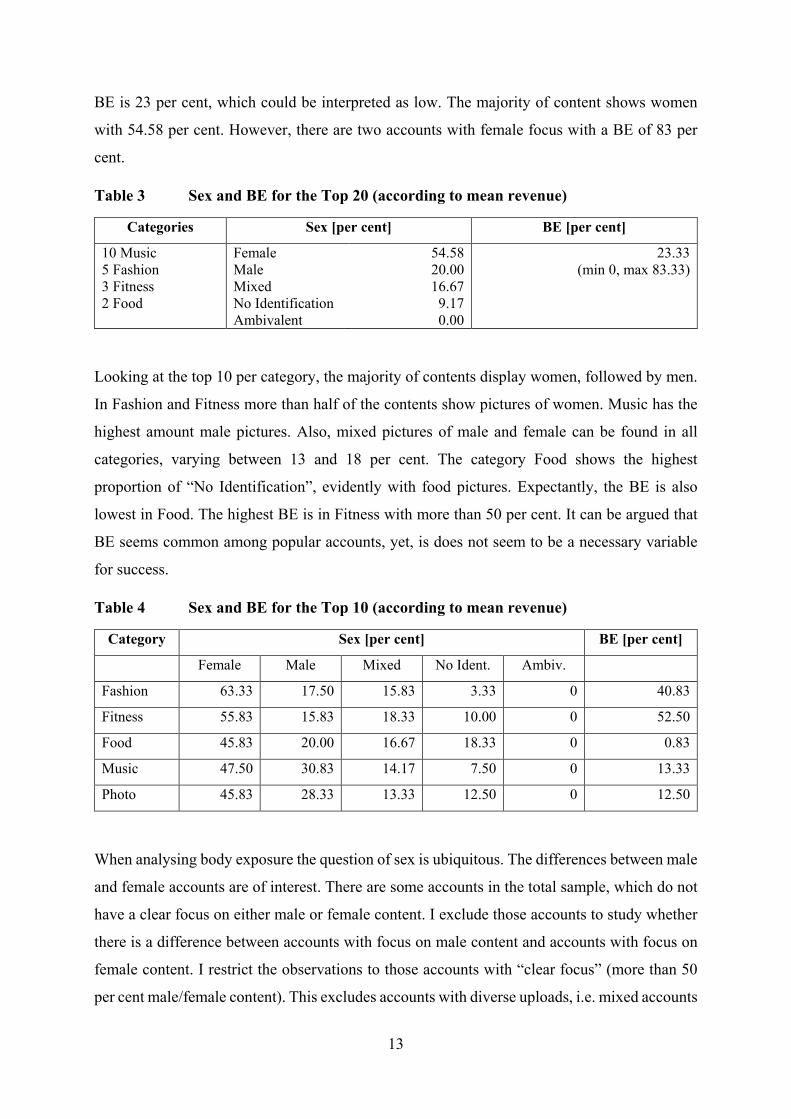
BE is 23 per cent, which could be interpreted as low. The majority of content shows women
with 54.58 per cent. However, there are two accounts with female focus with a BE of 83 per
cent.
Table 3 Sex and BE for the Top 20 (according to mean revenue)
Categories Sex [per cent] BE [per cent]
10 Music 5 Fashion 3 Fitness 2 Food
Female Male Mixed No Identification Ambivalent
54.58 20.00 16.67 9.17 0.00
23.33 (min 0, max 83.33)
Looking at the top 10 per category, the majority of contents display women, followed by men.
In Fashion and Fitness more than half of the contents show pictures of women. Music has the
highest amount male pictures. Also, mixed pictures of male and female can be found in all
categories, varying between 13 and 18 per cent. The category Food shows the highest
proportion of “No Identification”, evidently with food pictures. Expectantly, the BE is also
lowest in Food. The highest BE is in Fitness with more than 50 per cent. It can be argued that
BE seems common among popular accounts, yet, is does not seem to be a necessary variable
for success.
Table 4 Sex and BE for the Top 10 (according to mean revenue)
Category Sex [per cent] BE [per cent]
Female Male Mixed No Ident. Ambiv.
Fashion 63.33 17.50 15.83 3.33 0 40.83
Fitness 55.83 15.83 18.33 10.00 0 52.50
Food 45.83 20.00 16.67 18.33 0 0.83
Music 47.50 30.83 14.17 7.50 0 13.33
Photo 45.83 28.33 13.33 12.50 0 12.50
When analysing body exposure the question of sex is ubiquitous. The differences between male
and female accounts are of interest. There are some accounts in the total sample, which do not
have a clear focus on either male or female content. I exclude those accounts to study whether
there is a difference between accounts with focus on male content and accounts with focus on
female content. I restrict the observations to those accounts with “clear focus” (more than 50
per cent male/female content). This excludes accounts with diverse uploads, i.e. mixed accounts

14
with females and males, non-human accounts (like memes, landscapes or pets), and non-focus
accounts (a little bit of everything). This leaves 348 accounts.
With this sample, I perform mean-comparison tests (t-tests) to see if there are differences
between women and men. The results show that accounts with focus on female contents have
significantly higher BE than accounts with focus on male contents (p-value 0.0000). As such,
women appear to show more nudity. While there is no statistically significant dissimilarity in
posting frequency (p-value 0.9023), i.e. they seem to upload comparable amounts of pictures,
there is a difference in price per picture (p-value 0.0017). Male contents achieve significantly
higher price per picture. Yet, this difference is not reflected for the mean revenue, where no
significant difference can be found (p-value 0.6385). Both groups earn similar advertising
revenue on average. Since revenue (R) is price (p) times frequency (q) (𝑅𝑅 = 𝑝𝑝𝑝𝑝) and prices
diverge, but revenue does not, it seems that women actually upload somewhat more than men
(even if not statistically significant; mean men = 7.69 pics per week, mean women 7.77 pics
per week). To sum up, accounts with female contents show a higher degree in nudity and upload
slightly more pictures, while they earn less per picture and on average the same amount as their
male counterparts.
4.2 Analytic Analysis of Audience Building
If BE actually positively influences revenue is studied in the following analytical analysis using
random effects regression estimations:
𝑌𝑌𝑖𝑖𝑖𝑖 = 𝛼𝛼 + 𝛽𝛽𝑥𝑥𝑖𝑖𝑖𝑖 + 𝑢𝑢𝑖𝑖𝑖𝑖 + 𝜀𝜀𝑖𝑖𝑖𝑖
where α is a constant, β is the coefficient, u is the between-entity error and ε is the within entity
error. Y is the dependent variable of star i in observation period t. In a random effects model
differences across entities (in this case BE and sex) have influence on the dependent variable.
In contrast to fixed effects, time invariant variables can be included in the analysis. This is
necessary, since BE and sex do not change over time. Moreover, a Hausman test was performed
to test between random effects and fixed effects and to confirm this choice.
To obtain symmetrically distributed residuals, the dependent variable revenue per week is
logged, as well as the values for the number of posts, followers, likes, and comments. Since
followers like and comment on pictures of their stars, the variables are correlated. Therefore, I
implement a time lag for comments and likes. This reduces the number of observations to n =
15
5,978 and number of accounts to 498. To check the specification and robustness, I estimated
OLS regressions and tested the restrictions. There is no problem of multi-collinearity, as
variance inflation factors are below 5. Standard errors are robust in all models, to control for
heteroscedasticity. The values for BE and sex are logged to improve transparency and means
of interpretation.5
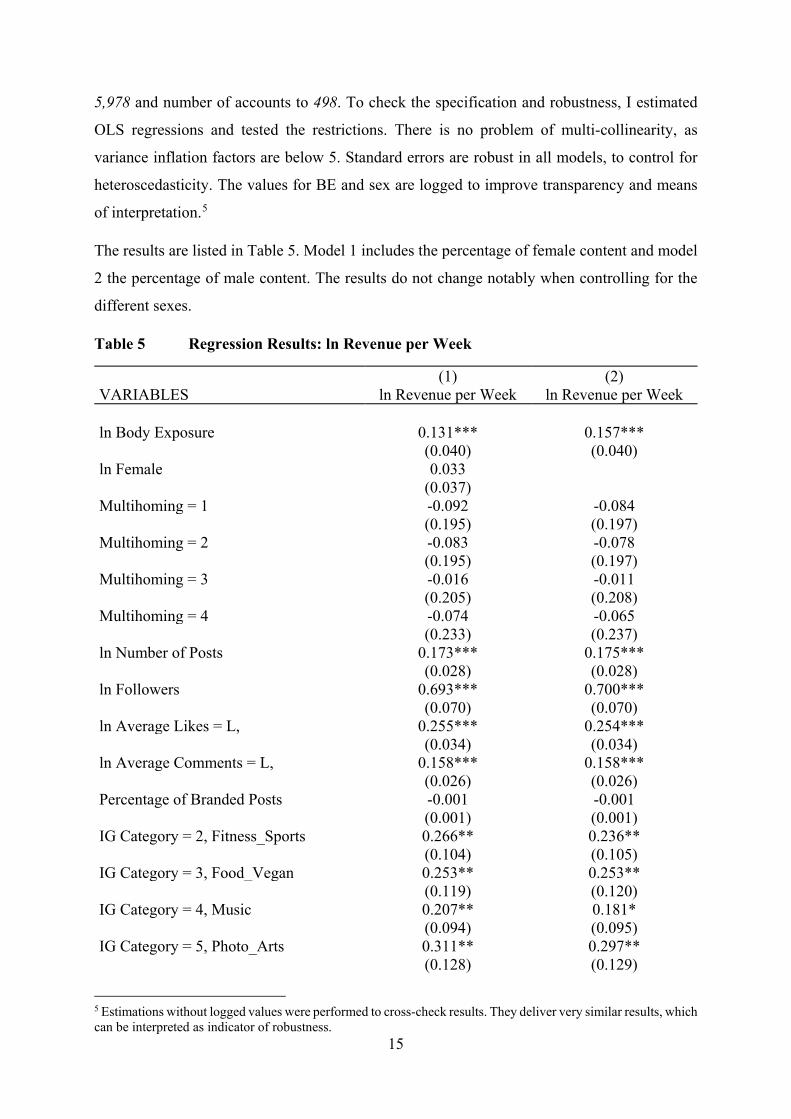
The results are listed in Table 5. Model 1 includes the percentage of female content and model
2 the percentage of male content. The results do not change notably when controlling for the
different sexes.
Table 5 Regression Results: ln Revenue per Week
(1) (2) VARIABLES ln Revenue per Week ln Revenue per Week ln Body Exposure 0.131*** 0.157*** (0.040) (0.040) ln Female 0.033 (0.037) Multihoming = 1 -0.092 -0.084 (0.195) (0.197) Multihoming = 2 -0.083 -0.078 (0.195) (0.197) Multihoming = 3 -0.016 -0.011 (0.205) (0.208) Multihoming = 4 -0.074 -0.065 (0.233) (0.237) ln Number of Posts 0.173*** 0.175*** (0.028) (0.028) ln Followers 0.693*** 0.700*** (0.070) (0.070) ln Average Likes = L, 0.255*** 0.254*** (0.034) (0.034) ln Average Comments = L, 0.158*** 0.158*** (0.026) (0.026) Percentage of Branded Posts -0.001 -0.001 (0.001) (0.001) IG Category = 2, Fitness_Sports 0.266** 0.236** (0.104) (0.105) IG Category = 3, Food_Vegan 0.253** 0.253** (0.119) (0.120) IG Category = 4, Music 0.207** 0.181* (0.094) (0.095) IG Category = 5, Photo_Arts 0.311** 0.297** (0.128) (0.129)
5 Estimations without logged values were performed to cross-check results. They deliver very similar results, which can be interpreted as indicator of robustness.

16
ln Male 0.025 (0.038) Constant -5.522*** -5.624*** (1.057) (1.073) Observations 5,978 5,978 Number of IG_Handle 498 498
Robust standard errors in parentheses *** p<0.01, ** p<0.05, * p<0.1
Main results on BE and sex: BE has a significantly positive influence on advertising revenue
in both models. The logged values can be interpreted as follows. An increase of one per cent
BE leads to 0.131 per cent higher weekly revenue. Accordingly, one more nude picture
increases revenue by 1.09 per cent.6 For the mean revenue over the whole sample (91,535.48
USD) this means posting one more naked picture increases the weekly advertising income by
997,73 USD. In contrast, the type of content i.e. female or male content does not seem to have
an impact. Additional estimations with interaction terms between sex and BE (not reported) fail
to deliver insights on differences between content types. The effects are not significant.
Although women show a higher degree in nudity (see Section 4.1), the interaction between sex
and BE does not significantly influence the revenue in the sample. Therefore, it is not
specifically profitable to be female and show naked skin. Rather, across all sexes, BE seems to
have a positive effect. If revealing parts of your body is interpreted as cost or investment into
success (since BE has a positive effect on income), accounts with female focus invest more into
their success. It seems that, according to the results, females have to invest more to achieve the
same income.
Further results are: Multihoming is not significant in any model, while the popularity indicators
are (expectantly) highly significant. Further control variables are not interpreted, since they
only serve as additional information against omitted variable bias. These results are in line with
past studies (Budzinski & Gaenssle, 2020; Jung & Nüesch, 2019), which can be seen as a quality
indicator and shows reliability of the data set.
6 One picture equals 8.33 per cent.

17
5. Discussion and Conclusion
This paper empirically studies the effects of body exposure on Instagram success. Stars need to
invest heavily into audience building, by drawing attention to themselves (audience attraction)
and managing attention in the long run (audience maintenance). BE was studied as part of
audience attraction within this paper. To answer the research question “Does body exposure
drive Instagram success?” it can be said that BE positively influences advertising revenue of
IS. A descriptive study of the data shows that a high level of BE is not exclusively necessary
for top income positions, but is still common among the big ones. A more detailed statistical
analysis shows that more BE is significantly better than no BE. The second question was: “Is
there a difference between male and female content in this regard?”. There was no significant
effect of female or male content on advertising revenue in the regression model. Hence, the
focus on a specific type of content does not have significant influence on advertising revenue.
Yet, looking at the differences of female and male content, a T-test shows that BE is
significantly higher for accounts with focus on female content. However, it does not directly
translate into monetary success of advertising revenue. There is no significant difference in
revenues between the groups. These results raise a number of questions: Do women need to
invest more to earn the same money? Is there a gender pay gap in social media?
The results can only be interpreted carefully and used as a first indicator. More research is
needed to study differences in income, between sexes, categories, platforms etc. There are some
limitations to this study, which open possibilities for further studies. As mentioned in the
beginning, there are no traditional gatekeepers in social media markets (although agencies like
multi-channel-networks established themselves during the last years (Budzinski & Gaenssle,
2020)). Yet, there are new gatekeepers, first and foremost the platform immanent algorithms.
Sophisticated recommendation services manage scarce consumer attention and pre-select
content according to individual preferences (Budzinski et al., 2021). A study by Richard et al.
(2020) shows indicators that Instagram biases content allocation and favours nude content.
According to their results, Instagram prioritises contents with high BE over others and pushes
those posts. Since the algorithms are business secrets and ever-changing, it is not possible to
subtract its’ influence on income in my study. However, if this is the case, the gap between
male and female income is expected to be even bigger – with females’ higher degree in BE,
further algorithmic support of the platform and, yet, no difference in payment. In any case,
algorithm management and upload behaviour matter, as already pointed out by Budzinski and
Gaenssle (2020) and Gaenssle and Budzinski (2020).

18
Nonetheless, it has to be considered that this study only focuses on the top group in five
categories, which are dominated by female content (51.9 per cent female content; 21.6 per cent
male content). A specific sampling according to sex would be interesting, to compare
representative groups. From an economic point of view, scarcity for male content is higher than
for female content, which is why it can be argued that it is more costly to advertise with them.
There are multiple sources of income for social media stars (see Section 3.2). In this paper, only
the advertising revenue is observable. It serves as a good proxy, since it is common practice to
earn money from ads and brand communication on Instagram. However, especially for nudity,
there might be other sources of income. The website Onlyfans became very popular over the
last years, featuring predominantly adult entertainment content. For very popular accounts with
high BE, this might be a source of income, with Instagram merely being a marketing platform.
Popular accounts link to Onlyfans, where a payment barrier is established to access further
contents. However, the average of advertising revenue in this sample (USD 90.5k) shows a high
degree of ad business and professional interactions between stars and advertisers. While the
income proxy of this paper is legitimate, further studies on other sources of income would be
interesting (if data is available).
There are limits to the data used in this paper. I use estimations of revenue, the exact numbers
are not available. The data seems very reliable, conforming effects of past studies (see Section
4.2). Lastly, there is no classification of sex appeals within this data set. I do not differentiate
e.g. between sportswear and lingerie. The sexual appeal of the pictures varies. Yet, sexual
appeals are very subjective and leave room for further biases in coding.
References
Adler, M. (1985). Stardom and Talent. The American Economic Review, 75(1), 208–212.
Adler, M. (2006). Stardom and Talent. In V. A. Ginsburgh & D. Throsby (Eds.), Handbook of
the Economics of Art and Culture (Vol. 1, pp. 895–906). Elsevier.
https://doi.org/10.1016/S1574-0676(06)01025-8
Budzinski, O., & Gaenssle, S. (2020). The economics of social media (super-)stars: an
empirical investigation of stardom and success on YouTube. Journal of Media Economics,
31(3-4), 75–95. https://doi.org/10.1080/08997764.2020.1849228
19
Budzinski, O., Gaenssle, S., & Lindstädt-Dreusicke, N. (2021). Data (R)Evolution – The
Economics of Algorithmic Search and Recommender Services. In S. Baumann (Ed.),
Handbook of Digital Business Ecosystems (forthcoming). Elgar.
Budzinski, O., & Pannicke, J. (2017). Does Popularity Matter in a TV Song Competition?
Evidence from a National Music Contest. Ilmenau Discussion Papers, 21(106).
Burgess, J., & Green, J. (2018). Youtube: Online Video and Participatory Culture (2nd ed.).
Digital Media and Society. Polity Press.
Candela, G., Castellani, M., Pattitoni, P., & Di Lascio, F. M. L. (2016). On Rosen’s and
Adler’s hypotheses in the modern and contemporary visual art market. Empirical
Economics, 51(1), 415–437. https://doi.org/10.1007/s00181-015-1002-3
Che, Y.-K., & Mierendorff, K. (2019). Optimal Dynamic Allocation of Attention. American
Economic Review, 109(8), 2993–3029. https://doi.org/10.1257/aer.20171000
Crain, W. M., & Tollison, R. D. (2002). Consumer Choice and the Popular Music Industry: A
Test of the Superstar Theory. Empirica, 29(1), 1–9.
https://doi.org/10.1023/A:1014651130414
Dudley, S. C. (1999). Consumer Attitudes Toward Nudity in Advertising. Journal of
Marketing Theory and Practice, 7(4), 89–96.
https://doi.org/10.1080/10696679.1999.11501854
Ehrmann, T., Meiseberg, B., & Ritz, C. (2009). Superstar Effects in Deluxe Gastronomy - An
Empirical Analysis of Value Creation in German Quality Restaurants. KYKLOS, 62(4),
526–541. https://doi.org/10.1111/J.1467-6435.2009.00449.X
Facebook. (2021). Instagram Community Guidelines. Facebook.
https://www.facebook.com/help/instagram/477434105621119/
Filimon, N., López-Sintas, J., & Padrós-Reig, C. (2011). A test of Rosen’s and Adler’s
theories of superstars. Journal of Cultural Economics, 35(2), 137–161.
https://doi.org/10.1007/s10824-010-9135-x
Franck, E., & Nüesch, S. (2008). Mechanisms of Superstar Formation in German Soccer:
Empirical Evidence. European Sport Management Quarterly, 8(2), 145–164.
https://doi.org/10.1080/16184740802024450
Franck, E., & Nüesch, S. (2012). Talent and/or Popularity: What does it take to be a
Superstar? Economic Inquiry, 50(1), 202–216. https://doi.org/10.1111/j.1465-
7295.2010.00360.x

20
Franck, G. (2019). The economy of attention. Journal of Sociology, 55(1), 8–19.
https://doi.org/10.1177/1440783318811778
Gaenssle, S., & Budzinski, O. (2020). Stars in social media: new light through old windows?
Journal of Media Business Studies, 1–27. https://doi.org/10.1080/16522354.2020.1738694
Giles, D. E. (2006). Superstardom in the US popular music industry revisited. Economics
Letters, 92(1), 68–74. https://doi.org/10.1016/j.econlet.2006.01.022
Gräve, J.-F. (2017). Exploring the Perception of Influencers vs. Traditional Celebrities. In
Association for Computing Machinery (Ed.), Proceedings of the 8th International
Conference on Social Media & Society - #SMSociety17 (pp. 1–5). ACM Press.
https://doi.org/10.1145/3097286.3097322
Hofmann, K. H., & Opitz, C. (2019). Talent and publicity as determinants of superstar
incomes: empirical evidence from the motion picture industry. Applied Economics, 51(13),
1383–1395. https://doi.org/10.1080/00036846.2018.1527452
Hypeauditor. (2020). The State of Influencer Marketing 2020: Influencer Fraud Dynamics.
https://hypeauditor.com/blog/state-2020/
Jung, C., & Nüesch, S. (2019). The more others care, the more you share? – Social contagion
as a stardom trigger of social media superstars. Applied Economics, 51(9), 881–888.
https://doi.org/10.1080/00036846.2018.1497849
Katz, M. L., & Shapiro, C. (1985). Network Externalities, Competition, and Compatibility.
The American Economic Review, 75(3), 424–440. http://www.jstor.org/stable/1814809
Katz, M. L., & Shapiro, C. (1994). Systems Competition and Network Effects. Journal of
Economic Perspectives, 8(2), 93–115. https://doi.org/10.1257/jep.8.2.93
Lehmann, E. E., & Schulze, G. G. (2008). What Does it Take to be a Star? – The Role of
Performance and the Media for German Soccer Players. Applied Economics Quarterly,
54(1), 59–70. https://doi.org/10.3790/aeq.54.1.59
Leibenstein, H. (1950). Bandwagon, Snob, and Veblen Effects in the Theory of Consumers’
Demand. Quarterly Journal of Economics, 64(2), 183–207.
Lorber, J. (1996). Beyond the Binaries: Depolarizing the Categories of Sex, Sexuality, and
Gender. Sociological Inquiry, 66(2), 143–160. https://doi.org/10.1111/j.1475-
682X.1996.tb00214.x
Lorber, J. (2005). Breaking the bowls: Degendering and feminist change. WW Norton New
York.
21
Lucifora, C., & Simmons, R. (2003). Superstar Effects in Sport: Evidence From Italian
Soccer. Journal of Sports Economics, 4(1), 35–55.
https://doi.org/10.1177/1527002502239657
Lull, R. B., & Bushman, B. J. (2015). Do Sex and Violence Sell? A Meta-Analytic Review of
the Effects of Sexual and Violent Media and Ad Content on Memory, Attitudes, and
Buying Intentions. Psychological Bulletin, 141(5), 1022–1048.
https://doi.org/10.1037/bul0000018
Marwick, A. E. (2016). You May Know Me from YouTube: (Micro-)Celebrity in Social
Media. In P. D. Marshall & S. Redmond (Eds.), A companion to celebrity (pp. 333–350).
Wiley Blackwell.
Meiseberg, B. (2014). Trust the artist versus trust the tale: performance implications of talent
and self-marketing in folk music. Journal of Cultural Economics, 38(1), 9–42.
https://doi.org/10.1007/s10824-012-9196-0
Mittal, B., & Lassar, W. M. (2000). Sexual Liberalism as a Determinant of Consumer
Response to Sex in Advertising. Journal of Business and Psychology, 15(1), 111–127.
https://doi.org/10.1023/A:1007723003376
Reichert, T. (2002). Sex in Advertising Research: A Review of Content, Effects, and
Functions of Sexual Information in Consumer Advertising. Annual Review of Sex
Research, 13(1), 241–273. https://doi.org/10.1080/10532528.2002.10559806
Richard, É., Duportail, J., Kayser-Bril, N., & Schacht, K. (2020). Undress or fail: Instagram’s
algorithm strong-arms users into showing skin. https://algorithmwatch.org/en/instagram-
algorithm-nudity/
Salganik, M. J., Dodds, P. S., & Watts, D. J. (2006). Experimental study of inequality and
unpredictability in an artificial cultural market. Science, 311(5762), 854–856.
https://doi.org/10.1126/science.1121066
Severn, J., Belch, G. E., & Belch, M. A. (1990). The Effects of Sexual and Non-Sexual
Advertising Appeals and Information Level on Cognitive Processing and Communication
Effectiveness. Journal of Advertising, 19(1), 14–22.
https://doi.org/10.1080/00913367.1990.10673176
Shapiro, C., & Varian, H. R. (1999). Information rules: A strategic guide to the network
economy. Harvard Business School Press.

22
Simon, H. A. (1971). Designing organizations for an information rich world. In M.
Greenberger (Ed.), Computers, communications, and the public interest (pp. 37–72). Johns
Hopkins P.
Stigler, G. J., & Becker, G. S. (1977). De Gustibus Non Est Disputandum. American
Economic Review, 67(2), 76–90.
Taylor, & Greg. (2014). Scarcity of Attention for a Medium of Abundance. In M. Graham &
W. H. Dutton (Eds.), Society and the Internet: How Networks of Information and
Communication are Changing Our Lives (pp. 257–271). Oxford University Press.
https://doi.org/10.1093/acprof:oso/9780199661992.003.0017
Wirtz, J. G., Sparks, J. V., & Zimbres, T. M. (2018). The effect of exposure to sexual appeals
in advertisements on memory, attitude, and purchase intention: a meta-analytic review.
International Journal of Advertising, 37(2), 168–198.
https://doi.org/10.1080/02650487.2017.1334996

23
Appendix
Coding BE: 0-12
Coding Sex: 0-12, in (female, male, mixed, ambivalent, no identification)
Example 1:
BE: 8 (1 = 1; 2 = 1; 3 = 1; 4 = 1; 5 = 1; 6 = 0; 7 = 1; 8 = 1; 9 = 0; 10 = 1; 11 = 0; 12 = 0)
Sex: 0-12-0-0-0 (all male)
Example 2:
BE: 10 (1 = 1; 2 = 0; 3 = 0; 4 = 1; 5 = 1; 6 = 1; 7 = 1; 8 = 1; 9 = 1; 10 = 1; 11 = 1; 12 = 1) with picture 7 and
8 dressed, but 50 per cent or more focus is on primary sex characteristics
Sex: 11-0-0-0-1 (all female, except second picture “no identification”)
Example 3:
BE: 0 (no nudity in any picture)
Sex: 0-0-0-0-12 (all “no identification”, no human characteristics)

24
Diskussionspapiere aus dem Institut für Volkswirtschaftslehre
der Technischen Universität Ilmenau Nr. 69 Budzinski, Oliver: Empirische Ex-Post Evaluation von wettbewerbspolitischen
Entscheidungen: Methodische Anmerkungen, Januar 2012. Nr. 70 Budzinski, Oliver: The Institutional Framework for Doing Sports Business:
Principles of EU Competition Policy in Sports Markets, January 2012. Nr. 71 Budzinski, Oliver; Monostori, Katalin: Intellectual Property Rights and the WTO,
April 2012. Nr. 72 Budzinski, Oliver: International Antitrust Institutions, Juli 2012. Nr. 73 Budzinski, Oliver; Lindstädt, Nadine: Newspaper vs. Online Advertising - Is
There a Niche for Newspapers in Modern Advertising Markets?, Juli 2012a.
Nr. 74 Budzinski, Oliver; Lindstädt, Nadine: Newspaper and Internet Display Advertising
- Co-Existence or Substitution?, Juli 2012b. Nr. 75 Budzinski, Oliver: Impact Evaluation of Merger Control Decisions, August 2012. Nr. 76 Budzinski, Oliver; Kuchinke, Björn A.: Deal or No Deal? Consensual Arrangements
as an Instrument of European Competition Policy, August 2012. Nr. 77 Pawlowski, Tim, Budzinski, Oliver: The (Monetary) Value of Competitive Balance
for Sport Consumers, Oktober 2012. Nr. 78 Budzinski, Oliver: Würde eine unabhängige europäische Wettbewerbsbehörde eine
bessere Wettbewerbspolitik machen?, November 2012. Nr. 79 Budzinski, Oliver; Monostori, Katalin; Pannicke, Julia: Der Schutz geistiger
Eigentumsrechte in der Welthandelsorganisation - Urheberrechte im TRIPS Abkommen und die digitale Herausforderung, November 2012.
Nr. 80 Beigi, Maryam H. A.; Budzinski, Oliver: On the Use of Event Studies to Evaluate
Economic Policy Decisions: A Note of Caution, Dezember 2012. Nr. 81 Budzinski, Oliver; Beigi, Maryam H. A.: Competition Policy Agendas for
Industrializing Countries, Mai 2013. Nr. 82 Budzinski, Oliver; Müller, Anika: Finanzregulierung und internationale
Wettbewerbsfähigkeit: der Fall Deutsche Bundesliga, Mai 2013. Nr. 83 Doose, Anna Maria: Methods for Calculating Cartel Damages: A Survey,
Dezember 2013.
25
Nr. 84 Pawlowski, Tim; Budzinski, Oliver: Competitive Balance and Attention Level Effects: Theore-tical Considerations and Preliminary Evidence, März 2014.
Nr. 85 Budzinski, Oliver: The Competition Economics of Financial Fair Play, März 2014. Nr. 86 Budzinski, Oliver; Szymanski, Stefan: Are Restrictions of Competition by Sports
Associations Horizontal or Vertical in Nature?, März, 2014. Nr. 87 Budzinski, Oliver: Lead Jurisdiction Concepts Towards Rationalizing Multiple
Competition Policy Enforcement Procedures, Juni 2014. Nr. 88 Budzinski, Oliver: Bemerkungen zur ökonomischen Analyse von Sicherheit,
August 2014. Nr. 89 Budzinski, Oliver; Pawlowski, Tim: The Behavioural Economics of Competitive
Balance: Implications for League Policy and Championship Management, September 2014.
Nr. 90 Grebel, Thomas; Stuetzer, Michael: Assessment of the Environmental Performance
of European Countries over Time: Addressing the Role of Carbon Leakage and Nuclear Waste, September 2014.
Nr. 91 Emam, Sherief; Grebel, Thomas: Rising Energy Prices and Advances in Renewable
Energy Technologies, July 2014. Nr. 92 Budzinski, Oliver; Pannicke, Julia: Culturally-Biased Voting in the Eurovision
Song Contest: Do National Contests Differ?, December 2014. Nr. 93 Budzinski, Oliver; Eckert, Sandra: Wettbewerb und Regulierung, März 2015. Nr. 94 Budzinski, Oliver; Feddersen, Arne: Grundlagen der Sportnachfrage: Theorie und
Empirie der Einflussfaktoren auf die Zuschauernachfrage, Mai 2015. Nr. 95 Pannicke, Julia: Abstimmungsverhalten im Bundesvision Song Contest:
Regionale Nähe versus Qualität der Musik, Oktober 2015. Nr. 96 Budzinski, Oliver; Kretschmer, Jürgen-Peter: Unprofitable Horizontal Mergers,
External Effects, and Welfare, October 2015. Nr. 97 Budzinski, Oliver; Köhler, Karoline Henrike: Is Amazon The Next Google?, October 2015. Nr. 98 Kaimann, Daniel; Pannicke, Julia: Movie success in a genre specific contest:
Evidence from the US film industry, December 2015. Nr. 99 Pannicke, Julia: Media Bias in Women’s Magazines: Do Advertisements Influence
Editorial Content?, December 2015. Nr. 100 Neute, Nadine; Budzinski, Oliver: Ökonomische Anmerkungen zur aktuellen
Netzneutralitätspolitik in den USA, Mai 2016.
26
Nr. 101 Budzinski, Oliver; Pannicke, Julia: Do Preferences for Pop Music Converge across Countries? - Empirical Evidence from the Eurovision Song Contest, Juni 2016.
Nr. 102 Budzinski, Oliver; Müller-Kock, Anika: Market Power and Media Revenue
Allocation in Professonal Sports: The Case of Formula One, Juni 2016. Nr. 103 Budzinski, Oliver: Aktuelle Herausforderungen der Wettbewerbspolitik durch
Marktplätze im Internet, September 2016. Nr. 104 Budzinski, Oliver: Sind Wettbewerbe im Profisport Rattenrennen?, Februar 2017. Nr. 105 Budzinski, Oliver; Schneider, Sonja: Smart Fitness: Ökonomische Effekte einer
Digitalisierung der Selbstvermessung, März 2017. Nr. 106 Budzinski, Oliver; Pannicke, Julia: Does Popularity Matter in a TV Song
Competition? Evidence from a National Music Contest, April 2017. Nr. 107 Budzinski, Oliver; Grusevaja, Marina: Die Medienökonomik personalisierter
Daten und der Facebook-Fall, April 2017. Nr. 108 Budzinski, Oliver: Wettbewerbsregeln für das Digitale Zeitalter – Die Ökonomik
personalisierter Daten, Verbraucherschutz und die 9.GWB-Novelle, August 2017. Nr. 109 Budzinski, Oliver: Four Cases in Sports Competition Policy: Baseball, Judo,
Football, and Motor Racing, September 2017. Nr. 110 Budzinski, Oliver: Market-internal Financial Regulation in Sports as an
Anticompetitive Institution, October 2017. Nr. 111 Bougette, Patrice; Budzinski, Oliver; Marty, Frédéric: EXPLOITATIVE ABUSE
AND ABUSE OF ECONOMIC DEPENDENCE: WHAT CAN WE LEARN FROM THE INDUSTRIAL ORGANIZATION APPROACH?, December 2017.
Nr. 112 Budzinski, Oliver; Gaenssle, Sophia: The Economics of Social Media Stars: An
Empirical Investigation of Stardom, Popularity, and Success on YouTube, Januar 2018.
Nr. 113 Gaenssle, Sophia; Budzinski, Oliver; Astakhova Daria: Conquering the Box Office:
Factors, influencing Success of International Movies in Russia, Mai 2018. Nr. 114 Budzinski, Oliver; Stöhr, Annika: Die Ministererlaubnis als Element der deutschen
Wettbewerbsordnung: eine theoretische und empirische Analyse, Juli 2018. Nr. 115 Budzinski, Oliver; Kuchinke, Björn A.: Modern Industrial Organization Theory of
Media Markets and Competition Policy Implications, September 2018. Nr. 116 Budzinski, Oliver; Lindstädt-Dreusicke, Nadine: The New Media Economics of
Video-on-Demand Markets: Lessons for Competition Policy, Oktober 2018. Nr. 117 Budzinski, Oliver; Stöhr, Annika: Competition Policy Reform in Europe and
Germany – Institutional Change in the Light of Digitization, November 2018.
27
Nr. 118 Budzinski, Oliver; Noskova, Victoriia; Zhang, Xijie: The Brave New World of
Digital Personal Assistants: Benefits and Challenges from an Economic Perspective, December 2018.
Nr. 119 Bougette, Patrice; Budzinski, Oliver & Marty, Frédéric: EXPLOITATIVE ABUSE
AND ABUSE OF ECONOMIC DEPENDENCE: WHAT CAN WE LEARN FROM AN INDUSTRIAL ORGANIZATION APPROACH? [Updated Version 2018], December 2018.
Nr. 120 Bartelt, Nadja: Bundling in Internetmärkten - Ökonomische Besonderheiten,
Wettbewerbseffekte und Regulierungsimplikationen, Dezember 2018. Nr. 121 Budzinski, Oliver; Feddersen, Arne: Measuring Competitive Balance in Formula
One Racing, März 2019. Nr. 122 Budzinski, Oliver; Kohlschreiber, Marie; Kuchinke, Björn A. & Pannicke, Julia:
Does Music Quality Matter for Audience Voters in a Music Contest, März 2019. Nr. 123 Gaenssle, Sophia; Budzinski, Oliver: Stars in Social Media: New Light Through
Old Windows?, April 2019. Nr. 124 Stöhr, Annika; Budzinski, Oliver: Ex-post Analyse der Ministererlaubnis-Fälle -
Geminwohl durch Wettbewerbsbeschränkungen?, April 2019. Nr. 125 Budzinski, Oliver; Lindstädt-Dreusicke, Nadine: The New Media Economics of
Video-on-Demand Markets: Lessons for Competition Policy (Updated Version), May 2019.
Nr. 126 Stöhr, Annika; Noskova, Victoriia; Kunz-Kaltenhäuser, Philipp; Gaenssle, Sophia
& Budzinski, Oliver: Happily Ever After? – Vertical and Horizontal Mergers in the U.S. Media Industry, June 2019.
Nr. 127 Budzinski, Oliver; Stöhr, Annika: Der Ministererlaubnis-Fall Miba/Zollern:
Europäische Champions statt Wettbewerb?, Juni 2019. Nr. 128 Budzinski, Oliver; Gaenssle, Sophia & Kunz-Kaltenhäuser, Philipp: How Does
Online Streaming Affect Antitrust Remedies to Centralized Marketing? The Case of European Football Broadcasting, Rights, July 2019.
Nr. 129 Budzinski, Oliver; Haucap, Justus: Kartellrecht und Ökonomik: Institutions
Matter!, Juli 2019. Nr. 130 Budzinski, Oliver & Stöhr, Annika: Public Interest Considerations in European
Merger Control Regimes, August 2019. Nr. 131 Gaenssle, Sophia; Budzinski, Oliver & Astakhova: Daria: Conquering the Box
Office: Factors Influencing Succes of International Movies in Russia (Update), October 2019.
28
Nr. 132 Stöhr, Annika; Budzinski, Oliver & Jasper, Jörg: Die Neue E.ON auf dem deutschen Strommarkt – Wettbewerbliche Auswirkungen der innogy-Übernahme, November 2019.
Nr. 133 Budzinski, Oliver; Grebel, Thomas; Wolling, Jens & Zhang, Xijie: Drivers of
Article Processing Charges in Open Access, December 2019. Nr. 134 Gaenssle, Sophia; Kuchinke, Björn, A.: Die Hörspielserie „Die drei ???“ – Der
wirtschaftliche Erfolg und Gründe dafür, Januar 2020. Nr. 135 Budzinski, Oliver: The Economics of International Competition Policy: New
Challenges in the Light of Digitization?, January 2020. Nr. 136 Dittmann, Heidi & Kuchinke, Björn A.: Die Theorie mehrseitiger Marktplätze in
der US-amerikanischen und deutschen Zusammenschlusskontrolle: Eine empirische Untersuchung für den Mediensektor, Januar 2020.
Nr. 137 Budzinski, Oliver; Gaenssle, Sophia & Lindstädt-Dreusicke, Nadine: The Battle of
YouTube, TV and Netflix – An Empirical Analysis of Competition in Audio-visual Media Markets, April 2020.
Nr. 138 Gaenssle, Sophia & Kunz-Kaltenhäuser, Philipp: What Drives Binge-Watching?
An Economic Theory and Analysis of Impact Factors, April 2020. Nr. 139 Budzinski, Oliver; Grusevaja, Marina & Noskova, Victoriia: The Economics oft he
German Investigation of Facebook’s Data Collection, May 2020. Nr. 140 Budzinski, Oliver; Gaenssle, Sophia & Stöhr, Annika: Der Entwurf zur 10. GWB
Novelle: Interventionismus oder Laissezfaire?, Juni 2020. Nr. 141 Budzinski, Oliver & Kunz-Kaltenhäuser, Philipp: Promoting or Restricting
Competition? – The 50plus1-Rule in German Football, June 2020. Nr. 142 Budzinski, Oliver; Gaenssle, Sophia & Stöhr, Annika: The Draft for the 10th
Amendment of German Competition Law: Towards a new Concept of „Outstanding Relevance across Markets“?, June 2020.
Nr. 143 Budzinski, Oliver & Stöhr, Annika: Ministererlaubnis für Kartellfälle: Kooperation
im Sinne des Gemeinwohls?, August 2020. Nr. 144 Gaenssle, Sophia: Big Data Comes to Hollywood – Audiovisuelle Medienmärkte
im Digitalen Zeitalter, August 2020. Nr. 145 Zhang, Xijie; Grebel, Thomas & Budzinski, Oliver: The Prices of Open Access
Publishing: The Composition of APC across Different Fields of Sciences, Oktober 2020.
Nr. 146 Huppert, Caroline: Die Fairsten werden die Letzten sein? Herausforderungen für
die deutschen Wettbewerbsregeln durch die digitale Wirtschaft, Oktober 2020.

29
Nr. 147 Budzinski, Oliver; Gaenssle, Sophia & Lindstädt-Dreusicke, Nadine: Wettbewerb und Antitrust in Unterhaltungsmärkten, Januar 2021.
Nr. 148 Budzinski, Oliver; Gaenssle, Sophia & Lindstädt-Dreusicke, Nadine: Data
(R)Evolution – The Economics of Algorithmic Search and Recommender Services, January 2021.
Nr. 149 Kunz-Kaltenhäuser, Philipp: Is the NFL´s Pro Bowl Broken? Considering the
Players´ Perspective, April 2021.