Predicting small molecule fluorescent probe localization in living cells using QSAR modeling. 1....
16
Correspondence: Richard W. Horobin, School of Life Sciences, College of Medical, Veterinary and Life Sciences, The University of Glasgow, University Avenue, Glasgow G12 8QQ, Scotland UK. Tel: 44 (0)1796 474 480, E-mail: Richard.Horobin@glasgow. ac.uk Predicting small molecule fluorescent probe localization in living cells using QSAR modeling. 2. Specifying probe, protocol and cell factors; selecting QSAR models; predicting entry and localization RW Horobin 1 , F Rashid-Doubell 2 1 School of Life Sciences, College of Medical, Veterinary and Life Sciences, The University of Glasgow, University Avenue, Glasgow G12 8QQ, Scotland UK, and 2 School of Medicine, Royal College of Surgeons in Ireland–Medical University Bahrain, PO Box 15503, Busaiteen, Kingdom of Bahrain Abstract We describe the practical issues and the methodological procedures that must be carried out to construct and use QSAR models for predicting localization of probes in single cells. We address first the determination of probe factors starting with a consideration of the chemical nature of probe molecules present. What is their identity? Do new compounds arise in incubation media or intracellularly? For each probe, how many distinct chemical species are present? For each probe species, the derivation of the following numerical structure parameters, or descriptors, is set out with worked examples of electric charge and acid/base strength (Z and pK a ); hydrophilicity/lipophilicity (log P); amphiphilicity (AI and HGH); conjugated bond number and largest conjugated fragment (CBN and LCF); width and length (W and L); and molecular and ionic weights, head group size and substituent bulk (MW, IW, HGS and SB). Next, proto- col factors are specified by focusing separately on the mode of introduction of the probe to the cells, other application phenomena, and factors that influence directly observations of out- comes. Cell factors then are specified by considering separately structural and functional aspects. The next step is to select appropriate QSAR models and to integrate probe, protocol and cell factors to predict the interactions of the probe with the cell. Finally, we use an extended case example to explore the intracellular localization of certain photodynamic therapy dyes to illustrate these procedures. Key words: intracellular localization, PDT, QSAR models, single cell systems In Part 1 of this paper (Horobin et al. 2013a), we described small molecule fluorescent probes and their applications, and provided a general account of using QSAR rules to predict patterns of probe uptake and localization in the context of single cell systems. Here in Part 2, we consider the practical issues and methodological procedures required to construct and use QSAR models for single cells. We defer until Part 3 discussion of integration of mod- els to allow analysis of more complex events and of multicellular organisms. We discuss first details concerning probe factors, especially estimation of structure parameters, protocol factors and cell fac- tors. Next, we consider the choice of appropriate QSAR core models and the integration of these with © 2013 The Biological Stain Commission Biotechnic & Histochemistry 2013, 88(8): 461–476. DOI:10.3109/10520295.2013.780635 461 Biotech Histochem Downloaded from informahealthcare.com by University of Glasgow on 11/03/13 For personal use only.
-
Upload
independent -
Category
Documents
-
view
1 -
download
0
Transcript of Predicting small molecule fluorescent probe localization in living cells using QSAR modeling. 1....
Correspondence: Richard W. Horobin, School of Life Sciences,
College of Medical, Veterinary and Life Sciences, The University
of Glasgow, University Avenue, Glasgow G12 8QQ, Scotland UK.
Tel: � 44 (0)1796 474 480, E-mail: Richard.Horobin@glasgow.
ac.uk
Predicting small molecule fl uorescent probe localization in living cells using QSAR modeling. 2. Specifying probe, protocol and cell factors; selecting QSAR models; predicting entry and localization
RW Horobin 1 , F Rashid-Doubell 2
1 School of Life Sciences, College of Medical, Veterinary and Life Sciences, The University of Glasgow, University Avenue,
Glasgow G12 8QQ, Scotland UK, and 2 School of Medicine, Royal College of Surgeons in Ireland – Medical University
Bahrain, PO Box 15503, Busaiteen, Kingdom of Bahrain
Abstract
We describe the practical issues and the methodological procedures that must be carried out to construct and use QSAR models for predicting localization of probes in single cells. We address fi rst the determination of probe factors starting with a consideration of the chemical nature of probe molecules present. What is their identity? Do new compounds arise in incubation media or intracellularly? For each probe, how many distinct chemical species are present? For each probe species, the derivation of the following numerical structure parameters, or descriptors, is set out with worked examples of electric charge and acid/base strength (Z and pK a ); hydrophilicity/lipophilicity (log P); amphiphilicity (AI and HGH); conjugated bond number and largest conjugated fragment (CBN and LCF); width and length (W and L); and molecular and ionic weights, head group size and substituent bulk (MW, IW, HGS and SB). Next, proto-col factors are specifi ed by focusing separately on the mode of introduction of the probe to the cells, other application phenomena, and factors that infl uence directly observations of out-comes. Cell factors then are specifi ed by considering separately structural and functional aspects. The next step is to select appropriate QSAR models and to integrate probe, protocol and cell factors to predict the interactions of the probe with the cell. Finally, we use an extended case example to explore the intracellular localization of certain photodynamic therapy dyes to illustrate these procedures.
Key words: intracellular localization , PDT , QSAR models , single cell systems
In Part 1 of this paper (Horobin et al. 2013a), we described small molecule fl uorescent probes and their applications, and provided a general account of using QSAR rules to predict patterns of probe
uptake and localization in the context of single cell systems. Here in Part 2, we consider the practical issues and methodological procedures required to construct and use QSAR models for single cells. We defer until Part 3 discussion of integration of mod-els to allow analysis of more complex events and of multicellular organisms. We discuss fi rst details concerning probe factors, especially estimation of structure parameters, protocol factors and cell fac-tors. Next, we consider the choice of appropriate QSAR core models and the integration of these with
© 2013 The Biological Stain Commission
Biotechnic & Histochemistry 2013, 88(8): 461–476.
DOI:10.3109/10520295.2013.780635 461
Bio
tech
His
toch
em D
ownl
oade
d fr
om in
form
ahea
lthca
re.c
om b
y U
nive
rsity
of
Gla
sgow
on
11/0
3/13
For
pers
onal
use
onl
y.
462 Biotechnic & Histochemistry 2013, 88(8): 461–476
quantities of contaminating dyes. In either case, dyes with signifi cantly different chemical charac-teristics may be present simultaneously in the mixture.
Examples of such problems are given in Appendix 1.
From this point forward, the correct identity of the probe of interest is assumed to be known, or if impure or a mixture, the identities of all the compounds present are assumed to be known. The issues of stability and reactivity can therefore be addressed. Is a compound likely to be chemi-cally or biochemically transformed, either inside or outside a live cell? More specifi c questions follow from this.
Are new chemical compounds generated within
the incubation medium or live cell under
physiological conditions?
Because new compounds can be formed, such an assessment must be made for each probe present. It is convenient to categorize these phenomena as: chemical reactivity, i.e., instability of the probe; acci-dental or artifactual biochemical reactivity of the probe; and biochemical reactivity of the probe that is intended or at least acknowledged and allowed for in the protocol.
Failure to account for such phenomena can preclude, and often will confuse, QSAR analyses. Examples of these problems are given in Appendix 2. While it is useful also to consider any concomi-tant modifi cation or damage of the cell resulting from dye – cell reactions, such effects are considered under the heading of cell structural factors and are discussed later (Table 5).
The next question is: for each probe compound, how many distinct chemical species are pres-ent under physiological conditions? Owing to a number of physicochemical phenomena, a single chemical compound may be present in different forms with different physicochemical characters. Each of these species must be treated separately in a QSAR analysis as reported by Franco and Trapp (2008) concerning their physicochemical modeling. This assessment must be carried out for both compounds present in the incubation medium (or its equivalent) and those present in the varied compartments of a live cell. The more common phenomena considered here are: acid/base equilibria, which are infl uenced by the varied pH of different cellular compartments (Table 1); pseudobase/carbinol formation; and oxidation/reduction phenomena.
the various factors listed above. Finally, we present a case example of the intracellular localizations using QSAR modeling of a group of dyes used in photodynamic therapy research.
Determining probe factors
How many and which probe species
are present?
Answers to this question often are surprisingly complex. Some complexities and suggestions about how best to deal with them are discussed here using a checklist format.
What is the identity of the probe?
The simplest approach is to seek answers in hard-copy or online resources. Sources of particular value include:
• Conn ’ s Biological Stains : editions 9 and 10 of this handbook complement each other and the ear-lier volume includes reagents of historical inter-est. For bibliographic details for this resource, see Lillie (1977) and Horobin and Kiernan (2002) for the 9 th and 10 th editions, respectively. Many fl uorescent probes in current use, however, post date both editions. There are several other relevant handbooks and •monographs including those by Green (1990) and Rost (1995). Hard copy versions of the ear-lier editions of the Molecular Probes catalogue (Haugland 1996) also provide useful resources. All suffer from the limitation noted above. Online sources are more current, but in some cases •less reliable. Useful examples include the NIH databases, ChemIDplus and PubChem. Online catalogues such as those from Life Technologies and Sigma-Aldrich often are informative. Although Google Images may offer a useful •shortcut to molecular structures for some probes, one may need to be a chemist to use this major resource at all, and a sceptical chemist to use it without error (see Appendix 1).
Several problems can preclude, and do confuse, QSAR analyses. For example:
Some proprietary probes have undisclosed •structures. Certain structures of probes given in the litera- •ture or on websites are incorrect. Other structures, although not incorrect, are pre- •sented in a way likely to mislead non-chemists. Commercial lots of probes may comprise •mixtures of dyes or at least contain substantial
Bio
tech
His
toch
em D
ownl
oade
d fr
om in
form
ahea
lthca
re.c
om b
y U
nive
rsity
of
Gla
sgow
on
11/0
3/13
For
pers
onal
use
onl
y.
Symposium: QSAR for localizing fl uorescent probes 463
Google also can be used to fi nd on-line sources of additional kinds. Resources generated by individual academics include course handouts and substan-tial data compilations on personal websites. Other materials come from institutional educational sites that are posted by both universities and the news media; other substantial information sources are vendor based. Although this approach sometimes may provide values of parameters such as log P and pK a , little or no information about more specialized parameters can be expected. In the latter case, val-ues must be estimated or measured, as for log P or pK a , Possibilities and problems vary with each parameter as discussed below.
Because multiple species of a single compound can be present simultaneously, a caution is offered. The pK a and log P values required are those related to individual species, termed log P and pK a micro values. For discussion of this issue, see Avdeef (2003) and Perrin et al. (1981). When seeking information, especially online, note that some sources present the macro rather than the required micro values for these parameters. Also, online sources may quote log P val-ues for neutral species even when queried for the ionic species that exist under physiological conditions.
Z/pK a : procedures
Why these parameters are signifi cant
Intracellular distribution of probes may be infl u-enced directly and strongly by electric charge as out-lined in Part 1 of this review (Horobin et al. 2013a), e.g., owing to the presence of membrane potentials across organelle membranes. Indirect effects of electric charge also arise by the effect of charge on hydrophilicity/lipophilicity, because ionic substitu-ents increase probe hydrophilicity.
Evaluating the electric charge of a probe under physiological conditions often requires knowing, at least approximately, the acid and base strengths of the probe ’ s substituents, which usually are assessed by their pK a values. Consequently, pK a also is a signifi cant factor that infl uences both uptake and localization. Weak bases accumulate in acidic organelles, such as lysosomes, whereas strong bases localize in the nucleus if hydrophilic, or favor the mitochondria if lipophilic. Indirect effects of pK a on uptake also may occur. The cat-ionic form of a weak base may be hydrophilic and membrane impermeable, while the electrically neutral free-base species may be lipophilic and therefore permeable.
Unfortunately, published chemical structures can mislead the non-chemist, because the species
Such problems also may preclude, and do complicate, QSAR analyses. For examples, see Appendix 3.
Obtaining numerical structure parameters (descriptors)
We consider parameters cited most frequently in published QSAR reports that address intracellular probe localization. These parameters were listed in Table 1 of Part 1 of this paper (Horobin et al. 2013a) under the rubric, “ Summary account of numerical structure parameters used to describe and model fl uorescent probes. ”
Seeking parameter values: options
and examples
Some parameter values may be obtained from the literature in the usual manner, e.g., by searching:
Research papers and review articles using •freely accessible databases such as PubMed and PubChem . Proprietary databases such as ChemSpider, CrossFire Beilstein, NIST Chemistry Webbook or SciFinder also can be used for those with access. The monograph literature in addition to the •above by using Google Scholar .
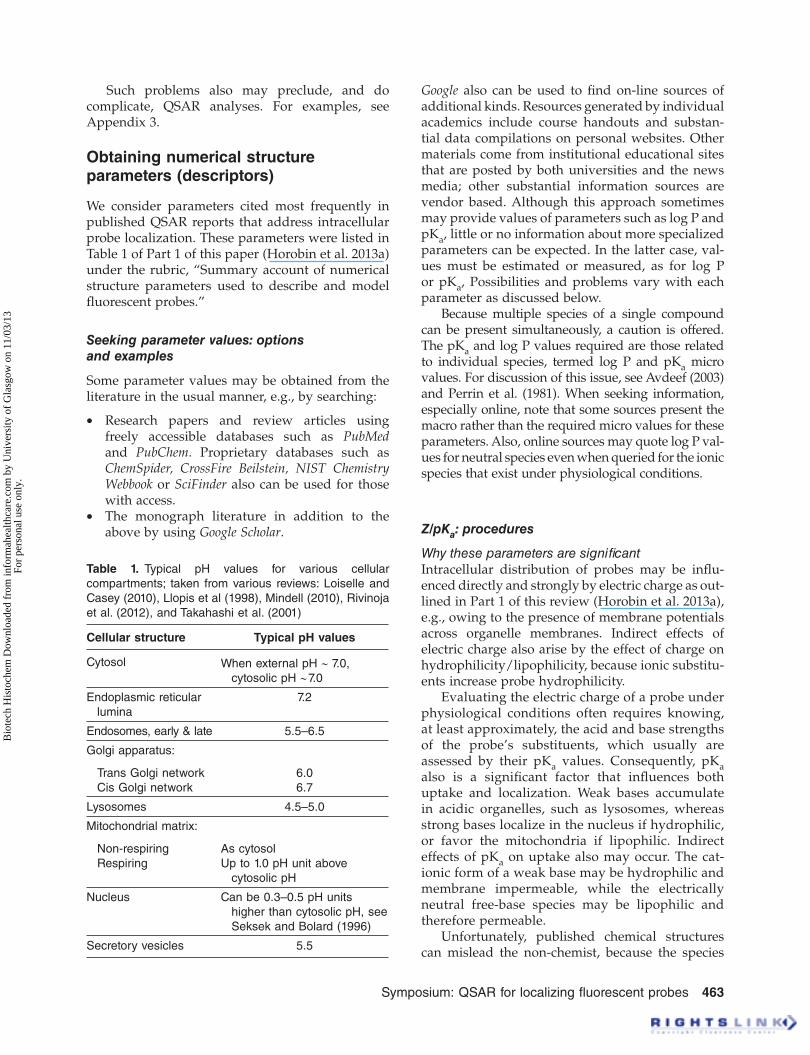
Table 1 . Typical pH values for various cellular
compartments; taken from various reviews: Loiselle and
Casey (2010), Llopis et al (1998), Mindell (2010), Rivinoja
et al. (2012), and Takahashi et al. (2001)
Cellular structure Typical pH values
Cytosol When external pH ~ 7.0,
cytosolic pH ~ 7.0
Endoplasmic reticular
lumina
7.2
Endosomes, early & late 5.5 – 6.5
Golgi apparatus:
Trans Golgi network
Cis Golgi network
6.0
6.7
Lysosomes 4.5 – 5.0
Mitochondrial matrix:
Non-respiring
Respiring
As cytosol
Up to 1.0 pH unit above
cytosolic pH
Nucleus Can be 0.3 – 0.5 pH units
higher than cytosolic pH, see
Seksek and Bolard (1996)
Secretory vesicles 5.5
Bio
tech
His
toch
em D
ownl
oade
d fr
om in
form
ahea
lthca
re.c
om b
y U
nive
rsity
of
Gla
sgow
on
11/0
3/13
For
pers
onal
use
onl
y.
464 Biotechnic & Histochemistry 2013, 88(8): 461–476
Log P procedures and case examples
Why this parameter is signifi cant
Both probe uptake into cells and subsequent intracellular distribution are infl uenced by probe lipophilicity, for which the log P parameter is a model, as outlined in Part 1 (Horobin et al. 2013a).
Sources of log P values
Information concerning approximately 15,000 compounds is available in publications from the Pomona College MedChem Database (Leo et al. 1971, Hansch and Leo 1979). This material also is available electronically as the MedChem database maintained by BioByte Corp.
As a widely used alternative to direct mea-surement of partition coeffi cients for both actual and proposed compounds, log P values often are obtained using software-implemented computa-tional systems based on knowledge of the molecu-lar structure of the compound. Available systems vary in terms of their physicochemical and com-putational basis, ease of use, range of application, and accuracy of outcome as critically reviewed by Mannhold et al. (2009). In particular, many commercially available software-implemented systems, including the CLOGP method of Hansch and Leo (1979), do not provide log P values
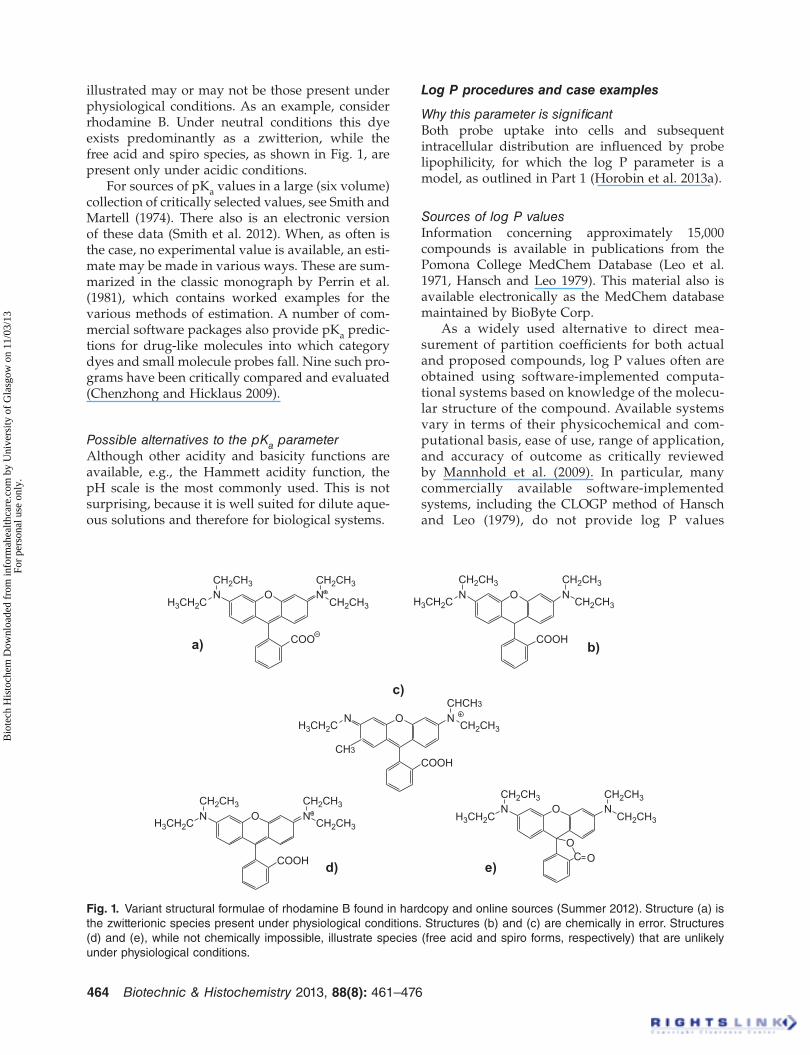
illustrated may or may not be those present under physiological conditions. As an example, consider rhodamine B. Under neutral conditions this dye exists predominantly as a zwitterion, while the free acid and spiro species, as shown in Fig. 1, are present only under acidic conditions.
For sources of pK a values in a large (six volume) collection of critically selected values, see Smith and Martell (1974). There also is an electronic version of these data (Smith et al. 2012). When, as often is the case, no experimental value is available, an esti-mate may be made in various ways. These are sum-marized in the classic monograph by Perrin et al. (1981), which contains worked examples for the various methods of estimation. A number of com-mercial software packages also provide pK a predic-tions for drug-like molecules into which category dyes and small molecule probes fall. Nine such pro-grams have been critically compared and evaluated (Chenzhong and Hicklaus 2009).
Possible alternatives to the pK a parameter
Although other acidity and basicity functions are available, e.g., the Hammett acidity function, the pH scale is the most commonly used. This is not surprising, because it is well suited for dilute aque-ous solutions and therefore for biological systems.
b)
ON N
COO
CH2CH3
CH2CH3CH2CH3
H3CH2CON N
COOH
CH2CH3
CH2CH3CH2CH3
H3CH2C
ON N
COOH
CH2CH3
CH2CH3CH2CH3
H3CH2CON N
CH2CH3
CH2CH3CH2CH3
H3CH2C
ON N
COOH
CH2CH3
CHCH3
H3CH2C
a)
c)
d) e)
CH3
CO
O
Fig. 1. Variant structural formulae of rhodamine B found in hardcopy and online sources (Summer 2012). Structure (a) is
the zwitterionic species present under physiological conditions. Structures (b) and (c) are chemically in error. Structures
(d) and (e), while not chemically impossible, illustrate species (free acid and spiro forms, respectively) that are unlikely
under physiological conditions.
Bio
tech
His
toch
em D
ownl
oade
d fr
om in
form
ahea
lthca
re.c
om b
y U
nive
rsity
of
Gla
sgow
on
11/0
3/13
For
pers
onal
use
onl
y.

Symposium: QSAR for localizing fl uorescent probes 465
for ionic species. The choice of procedure thus is a compromise, because the QSAR models used and discussed here require log P values for ionic species. Consequently, we have used the manual method developed by Hansch and Leo (1979) despite its distinct lack of user friendliness compared to software-mediated systems.
The manual Hansch and Leo (1979) approach is described in some detail in the cited book chap-ter, which also includes many worked examples of log P estimation of both uncharged and ionic species. The procedure is based on splitting a molecule into fragments composed of an atom or group of atoms whose contributions to overall log P (fragment or ƒ values) have been derived from experimental measurements made on a set of test compounds. This approach is described as “ group contribution, ” “ fragmental ” or “ sub-structure based. ” Certain structural effects, e.g., chain length and chain branching, or interactions between polar fragments, e.g., electronic and steric effects, however, are not accounted for by merely aggregating ƒ values. To deal with such complications, bond and interaction factors ( F ) are used, which again are derived from experimental measurements on a set of test compounds. The cited chapter of Hansch and Leo (1979) provides an extensive tabulation of both ƒ and F values. When the appropriate values are available, log P values for a known structure are obtained as follows: inspect the molecular structure to iden-tify fragments with tabulated ƒ values, sum the ƒ values, inspect the molecular structure to identify structural features or interactions with tabulated F values, and sum the F values. The totalled ƒ and F values provide an estimated log P value.
Example estimations
These are carried out on three fl uorescent probes with very different physicochemical characteristics. Note that the symbolic formalism used in the fol-lowing examples is that of Hansch and Leo (1979).
Example 1 is pyranine whose structure is given in Fig. 2a. Only fragment values are required for this estimation.
Fragments: 6 ƒ φ CH � 6 ƒ φC � 4 ƒ φ C � 3 ƒ φ SO 3 � � 1 ƒ φ OH
� 6(0.36) � 6(0.23) � 4(0.13) � 3(4.53) � 1(0.44)
Calculated log P � � 10.0
Example 2 is Nile red whose structure is given in Fig. 2b. Both fragment and factor values are required for this estimation.
Fragments: 8 ƒ φ CH � 5 ƒ φ C ∗ � 1 ƒ φ C � 1 ƒ φ C � 1 ƒ φ N � 1 ƒ φ O
� 1 ƒ φ CO � 1 ƒ φ N � 2 ƒ CH 3 � 2 ƒ CH 2
� 8(0.36) � 5(0.44) � 1(0.23) � 1(0.13) � 1(1.12) � 1(0.08)
� 1(0.59) � 1(0.93) � 2(0.89) � 2(0.66)
Factors: 2 F bYN � 2 F φ P2 ( N / O ) � 1 F φ P2 ( N / CO )
� � 2(0.2) � 2[0.8(1.12 � 0.08)] � 1[0.08(1.12 � 0.59)
Calculated log P � 5.8 – 0.1 � 5.7
Example 3 is the probe, TMA-DPH (trimeth-ylammonium diphenylhexatriene), whose structure is given in Fig. 2c. Both fragment and factor values are required for this estimation.
Fragments: 15 ƒ φ CH � 3 ƒ φ C � 3 ƒ CH 3 � 1 ƒ φ N �
� 15(0.36) � 3(0.13) � 3(0.89) � 1(4.41)
Factors: 3 F bx � 1 � � 3(0.9)
Calculated log P � 4.1 � 2.7 � 1.4
Possible alternatives to this parameter
A major disadvantage of the procedure described above is its complexity. Consequently, investigation of an alternative software-based procedure has been explored by Dapson (2013) and is reported in this symposium issue. To date, all of our papers con-cerning QSAR have used the manual Hansch and Leo (1979) approach and the limiting parameter val-ues in the published models refl ect this. Alterna-tive computational methods would need either to provide an alternative set of limiting values or the
O
N
N
N
O
H2C
CH2
OH
SO3O3S
O3S
CH3
CH3
H3C
H3C
H3C
a)
b)
c)
Log P = –10
Log P = 5.7
Log P = 1.4
HGH = –4.4AI = 5.8
Fig. 2. Graphical and numerical representations of the
lipophilicity and amphiphilicity of three probes. a) Pyranine,
a hydrophilic probe with no distinct hydrophilic (head
group) or lipophilic (tail) domains, hence not signifi cantly
amphiphilic. b) Nile red, a lipophilic probe with no distinct
hydrophilic domain or substantial lipophilic domain, hence
not signifi cantly amphiphilic. c) TMA-DPH, a lipophilic
probe with distinct hydrophilic and lipophilic domains,
hence strongly amphiphilic. Red color coding indicates
lipophilicity, blue indicates hydrophilicity; strong colors
indicate domain properties, pale colors indicate overall
properties.
Bio
tech
His
toch
em D
ownl
oade
d fr
om in
form
ahea
lthca
re.c
om b
y U
nive
rsity
of
Gla
sgow
on
11/0
3/13
For
pers
onal
use
onl
y.
466 Biotechnic & Histochemistry 2013, 88(8): 461–476
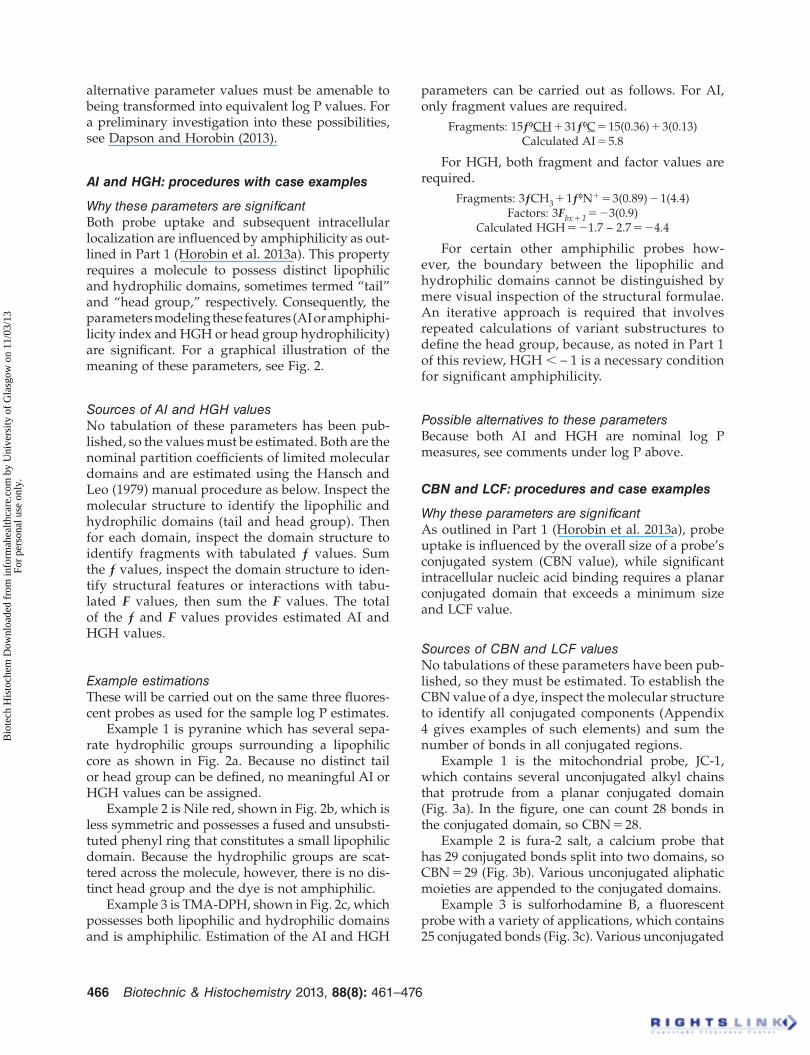
parameters can be carried out as follows. For AI, only fragment values are required.
Fragments: 15 ƒ φ CH � 31 ƒ φ C � 15(0.36) � 3(0.13)
Calculated AI � 5.8
For HGH, both fragment and factor values are required.
Fragments: 3 ƒ CH 3 � 1 ƒ φ N � � 3(0.89) � 1(4.4)
Factors: 3 F bx � 1 � � 3(0.9)
C alculated HGH � � 1.7 – 2.7 � � 4.4
For certain other amphiphilic probes how-ever, the boundary between the lipophilic and hydrophilic domains cannot be distinguished by mere visual inspection of the structural formulae. An iterative approach is required that involves repeated calculations of variant substructures to defi ne the head group, because, as noted in Part 1 of this review, HGH � – 1 is a necessary condition for signifi cant amphiphilicity.
Possible alternatives to these parameters
Because both AI and HGH are nominal log P measures, see comments under log P above.
CBN and LCF: procedures and case examples
Why these parameters are signifi cant
As outlined in Part 1 (Horobin et al. 2013a), probe uptake is infl uenced by the overall size of a probe ’ s conjugated system (CBN value), while signifi cant intracellular nucleic acid binding requires a planar conjugated domain that exceeds a minimum size and LCF value.
Sources of CBN and LCF values
No tabulations of these parameters have been pub-lished, so they must be estimated. To establish the CBN value of a dye, inspect the molecular structure to identify all conjugated components (Appendix 4 gives examples of such elements) and sum the number of bonds in all conjugated regions.
Example 1 is the mitochondrial probe, JC-1, which contains several unconjugated alkyl chains that protrude from a planar conjugated domain (Fig. 3a). In the fi gure, one can count 28 bonds in the conjugated domain, so CBN � 28.
Example 2 is fura-2 salt, a calcium probe that has 29 conjugated bonds split into two domains, so CBN � 29 (Fig. 3b). Various unconjugated aliphatic moieties are appended to the conjugated domains.
Example 3 is sulforhodamine B, a fl uorescent probe with a variety of applications, which contains 25 conjugated bonds (Fig. 3c). Various unconjugated
alternative parameter values must be amenable to being transformed into equivalent log P values. For a preliminary investigation into these possibilities, see Dapson and Horobin (2013).
AI and HGH: procedures with case examples
Why these parameters are signifi cant
Both probe uptake and subsequent intracellular localization are infl uenced by amphiphilicity as out-lined in Part 1 (Horobin et al. 2013a). This property requires a molecule to possess distinct lipophilic and hydrophilic domains, sometimes termed “ tail ” and “ head group, ” respectively. Consequently, the parameters modeling these features (AI or amphiphi-licity index and HGH or head group hydrophilicity) are signifi cant. For a graphical illustration of the meaning of these parameters, see Fig. 2.
Sources of AI and HGH values
No tabulation of these parameters has been pub-lished, so the values must be estimated. Both are the nominal partition coeffi cients of limited molecular domains and are estimated using the Hansch and Leo (1979) manual procedure as below. Inspect the molecular structure to identify the lipophilic and hydrophilic domains (tail and head group). Then for each domain, inspect the domain structure to identify fragments with tabulated ƒ values. Sum the ƒ values, inspect the domain structure to iden-tify structural features or interactions with tabu-lated F values, then sum the F values. The total of the ƒ and F values provides estimated AI and HGH values.
Example estimations
These will be carried out on the same three fl uores-cent probes as used for the sample log P estimates.
Example 1 is pyranine which has several sepa-rate hydrophilic groups surrounding a lipophilic core as shown in Fig. 2a. Because no distinct tail or head group can be defi ned, no meaningful AI or HGH values can be assigned.
Example 2 is Nile red, shown in Fig. 2b, which is less symmetric and possesses a fused and unsubsti-tuted phenyl ring that constitutes a small lipophilic domain. Because the hydrophilic groups are scat-tered across the molecule, however, there is no dis-tinct head group and the dye is not amphiphilic.
Example 3 is TMA-DPH, shown in Fig. 2c, which possesses both lipophilic and hydrophilic domains and is amphiphilic. Estimation of the AI and HGH
Bio
tech
His
toch
em D
ownl
oade
d fr
om in
form
ahea
lthca
re.c
om b
y U
nive
rsity
of
Gla
sgow
on
11/0
3/13
For
pers
onal
use
onl
y.
Symposium: QSAR for localizing fl uorescent probes 467
Possible alternatives to these parameters
Some modeling software computes the number of pi atoms (atoms connected by double bonds) in each conjugated system (Dapson and Horobin 2013). This is useful for correctly identifying certain atoms and conjugated systems that may not be evi-dent to non-chemists.
Width (W) and length (L): procedures and
case examples
Why these parameters are signifi cant
Binding of cationic probes to nucleic acids is infl u-enced strongly by the shape of the planar fl uoro-phore as outlined in Part 1 (Horobin et al. 2013a). More rectangular probes tend to intercalate with DNA in solution, and to bind selectively to ribo-somal RNA in nucleoli and cytoplasm in living eukaryotic cells. Probes that are more rod shaped tend to be minor groove binders; in living cells, these bind selectively to chromatin. Such differ-ences in aspect ratio of the fl uorophore may be defi ned in terms of W and L of molecular structures (Del Castillo et al. 2010).
Sources of W and L values
A tabulation of such data is available for some nucleic acid targeting probes (Del Castillo et al. 2010). As described in detail by Del Castillo et al.
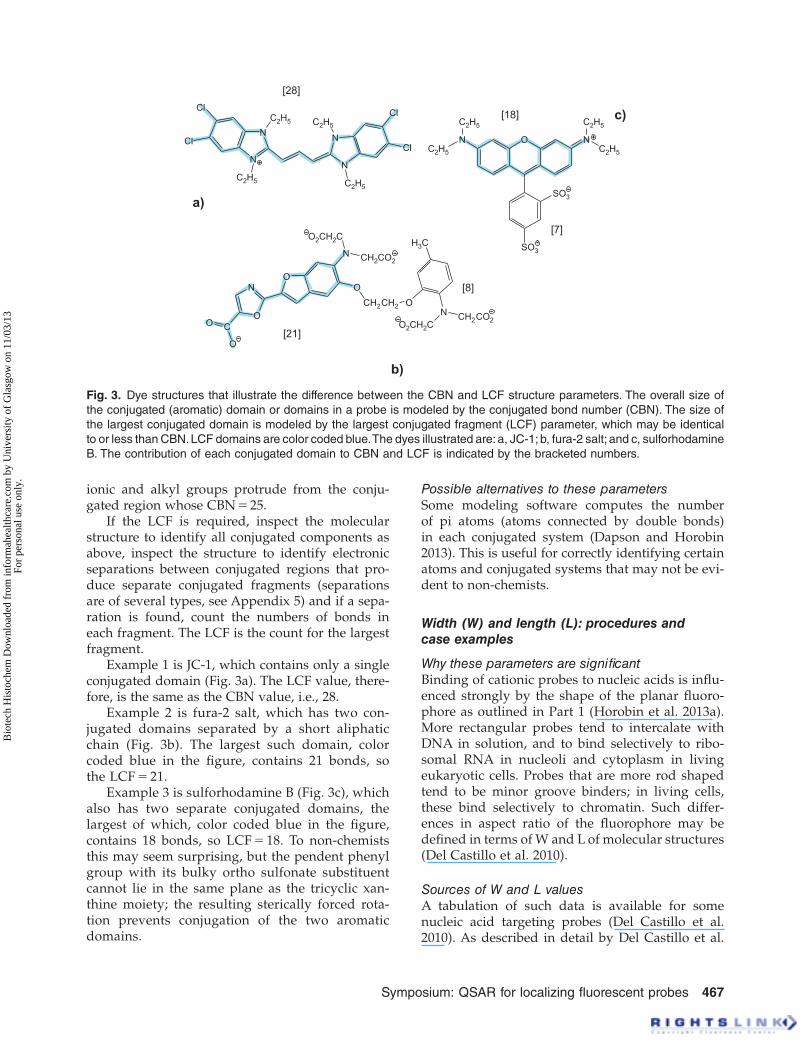
ionic and alkyl groups protrude from the conju-gated region whose CBN � 25.
If the LCF is required, inspect the molecular structure to identify all conjugated components as above, inspect the structure to identify electronic separations between conjugated regions that pro-duce separate conjugated fragments (separations are of several types, see Appendix 5) and if a sepa-ration is found, count the numbers of bonds in each fragment. The LCF is the count for the largest fragment.
Example 1 is JC-1, which contains only a single conjugated domain (Fig. 3a). The LCF value, there-fore, is the same as the CBN value, i.e., 28.
Example 2 is fura-2 salt, which has two con-jugated domains separated by a short aliphatic chain (Fig. 3b). The largest such domain, color coded blue in the fi gure, contains 21 bonds, so the LCF � 21.
Example 3 is sulforhodamine B (Fig. 3c), which also has two separate conjugated domains, the largest of which, color coded blue in the fi gure, contains 18 bonds, so LCF � 18. To non-chemists this may seem surprising, but the pendent phenyl group with its bulky ortho sulfonate substituent cannot lie in the same plane as the tricyclic xan-thine moiety; the resulting sterically forced rota-tion prevents conjugation of the two aromatic domains.
N
N
N
N
Cl
Cl
Cl
Cl
C2H5
C2H5 C2H5
C2H5
O NN
SO3
SO3
C2H5
C2H5
C2H5
C2H5
ON
O
N
C
O
O
O
CH2CH2
CH2CO2
O2CH2C
ON
H3C
O2CH2CCH2CO2
a)
b)
c)
[28]
[7]
[18]
[8]
[21]
Fig. 3. Dye structures that illustrate the difference between the CBN and LCF structure parameters. The overall size of
the conjugated (aromatic) domain or domains in a probe is modeled by the conjugated bond number (CBN). The size of
the largest conjugated domain is modeled by the largest conjugated fragment (LCF) parameter, which may be identical
to or less than CBN. LCF domains are color coded blue. The dyes illustrated are: a, JC-1; b, fura-2 salt; and c, sulforhodamine
B. The contribution of each conjugated domain to CBN and LCF is indicated by the bracketed numbers.
Bio
tech
His
toch
em D
ownl
oade
d fr
om in
form
ahea
lthca
re.c
om b
y U
nive
rsity
of
Gla
sgow
on
11/0
3/13
For
pers
onal
use
onl
y.
468 Biotechnic & Histochemistry 2013, 88(8): 461–476
MW, IW, HGS and SB: procedures and
case examples
Why these parameters are signifi cant
The overall size of a probe infl uences its ability to pass through gap junctions and plasmodesmata and overall size can be modeled by molecular or ionic weight (MW, IW) as is outlined in Part 1 (Horobin et al. 2013a). The size of the hydrophilic domain (head group) of an amphiphilic probe infl uences the rate of fl ip-fl op across a membrane bilayer, hence membrane permeability, or conversely, retention of a probe within the plasma membrane. Size may be modeled by the sum of the atomic weights of atoms within the head group (HGS). The size, or “ bulk, ” of the substituents attached to the conju-gated domain that constitutes the fl uorophore of a probe can infl uence possible binding mechanisms with double-stranded DNA (M ü ller et al. 1973).
Examples of overall size
Inspecting the probes whose structures already have been illustrated, it is apparent visually that fura-2 and TMA-DPH (Figs. 3b and 2c, respectively) are the largest and smallest respectively. Also, the IW of fura-2 is 636 and that of TMA-DPH is 291; these values are the extreme numerical values of this parameter for this data set. Because of the visually unassuming character of – SO 3
– in conventional two-dimensional chemical structures, the relative sizes of sulforhodamine B and HPTS are much harder to estimate from mere visual inspection. Use of numerical parameters, however, gives IWs of 558 and 455, respectively and renders the size differ-ences obvious.
Examples of head group size
Inspection of the structures of the two amphiphilic probes, TMA-DPH and sulforhodamine B (Figs. 2c and 3c, respectively), suggests that the former has the smaller head group. This difference, however, is dramatically obvious when the HGSs, of 59 and 235, respectively, are compared.
Examples of substituent bulk
Preliminary modeling of substituent bulk (SB) as the sum of the atomic weights of the constituent atoms suggests that rectangular fl uorophores able to bind to DNA fail to intercalate and instead bind in the minor groove when SB is greater than 100 (M ü ller et al. 1973, Horobin et al. 2013b). Thus, although the fl uorophore of the well known nuclear probe, DRAQ5, is rectangular, with W/L � 0.33, the value of SB is greater than 140 and the dye binds in the minor groove of double-stranded DNA.
(2010), W and L can be determined using appro-priate molecular modeling software. These inves-tigators also showed, however, that an alternative simplistic approach often is satisfactory. One can count the numbers of bonds along the length of a fl uorophore to obtain L and count the number of bonds orthogonal to the long axis of the fl uorophore to obtain W.
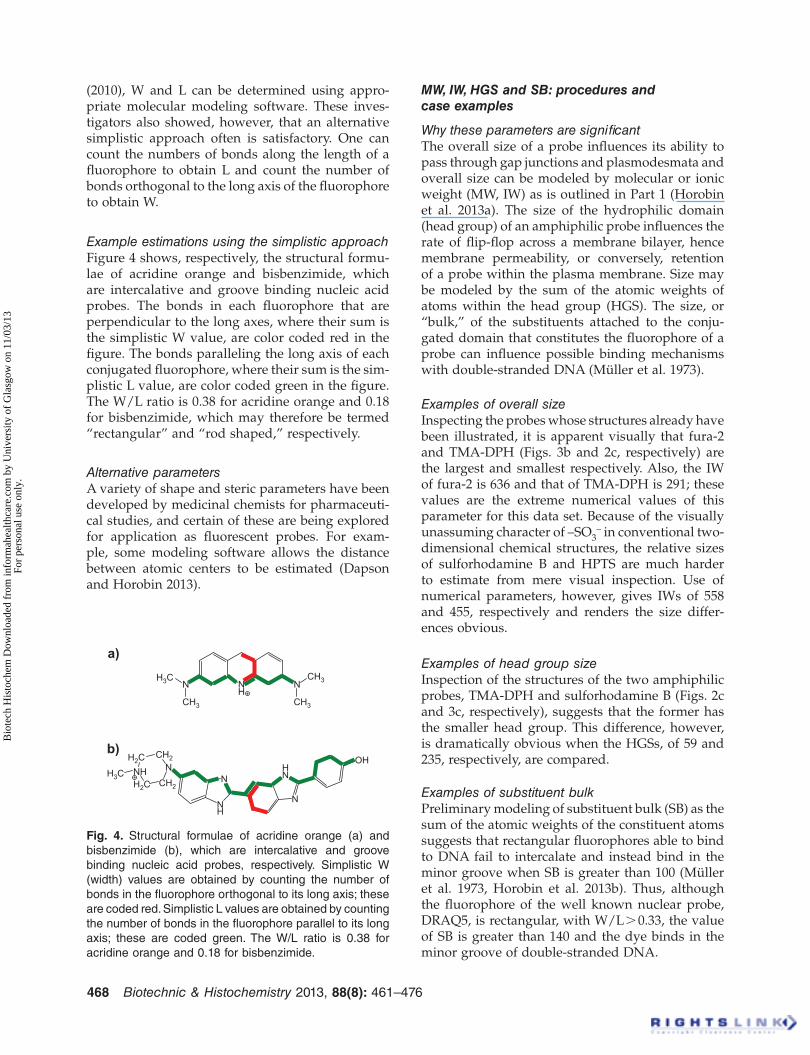
Example estimations using the simplistic approach
Figure 4 shows, respectively, the structural formu-lae of acridine orange and bisbenzimide, which are intercalative and groove binding nucleic acid probes. The bonds in each fl uorophore that are perpendicular to the long axes, where their sum is the simplistic W value, are color coded red in the fi gure. The bonds paralleling the long axis of each conjugated fl uorophore, where their sum is the sim-plistic L value, are color coded green in the fi gure. The W/L ratio is 0.38 for acridine orange and 0.18 for bisbenzimide, which may therefore be termed “ rectangular ” and “ rod shaped, ” respectively.
Alternative parameters
A variety of shape and steric parameters have been developed by medicinal chemists for pharmaceuti-cal studies, and certain of these are being explored for application as fl uorescent probes. For exam-ple, some modeling software allows the distance between atomic centers to be estimated (Dapson and Horobin 2013).
NH
NNH3C
CH3 CH3
CH3
NH
N
N
HN
NOHCH2H2C
NHH2C CH2
H3C
a)
b)
Fig. 4 . Structural formulae of acridine orange (a) and
bisbenzimide (b), which are intercalative and groove
binding nucleic acid probes, respectively. Simplistic W
(width) values are obtained by counting the number of
bonds in the fl uorophore orthogonal to its long axis; these
are coded red. Simplistic L values are obtained by counting
the number of bonds in the fl uorophore parallel to its long
axis; these are coded green. The W/L ratio is 0.38 for
acridine orange and 0.18 for bisbenzimide.
Bio
tech
His
toch
em D
ownl
oade
d fr
om in
form
ahea
lthca
re.c
om b
y U
nive
rsity
of
Gla
sgow
on
11/0
3/13
For
pers
onal
use
onl
y.
Symposium: QSAR for localizing fl uorescent probes 469
Possible alternative molecular volume parameters
A wide variety of alternative measures of molecular volume are available. For example, some modeling software sums atomic weights for specifi ed con-stituent atoms, which provides estimates of HGS and SB without requiring the manual procedures described above (Dapson and Horobin 2013).
What additional structure parameters
might be useful?
Drug designers have devised and explored many structure descriptors. For example, the E-Dragon software (developed by Prof. Todeschini ’ s Milano Chemometrics and QSAR Research Group), widely used by pharmaceutical chemists, enables the esti-mation of more than 1600 descriptors. While it is likely that some may prove of use for predicting probe localization the only additional parameter currently of known signifi cance is solubility. This is an underestimated limiting factor. If a probe is poorly soluble, then transfer from solvent to cell, and sometimes the maximum possible amount of probe in a cell target, will be restricted. For a general discussion, including procedures for esti-mating solubility from structural information, see Avdeef (2003). Tabulations of solubility data for fl uorochromes and dyes exist (e.g., Baugh-man et al. 1996, Green 1990, Horobin and Kiernan 2002, Lillie 1977), but the accuracy of these data
is uncertain, because determining valid solubili-ties of dyes is diffi cult, as explained by Baughman et al. (1996).
A fi nal phenomenon can be mentioned at this point, i.e., probe reactivity with cell components. This can occur, for example, with the covalently binding isothiocyanates, FITC-fl uorescein and SITS, and also with the reactive ester Cy dyes. If these species are applied from an external solution, and if they react rapidly, they bind to proteins in the plasma membrane and the resulting fl uorescent labeling internalizes only if the membrane inter-nalizes. Slower reacting probes, such as the various “ Tracker ” compounds, are intended to react with the proteins of the organelles to which the other physicochemical features of the probe directs them, hence the terms LysoTracker, MitoTracker etc. Of course, hopes will not always be satisfi ed.
Specifying protocol factors
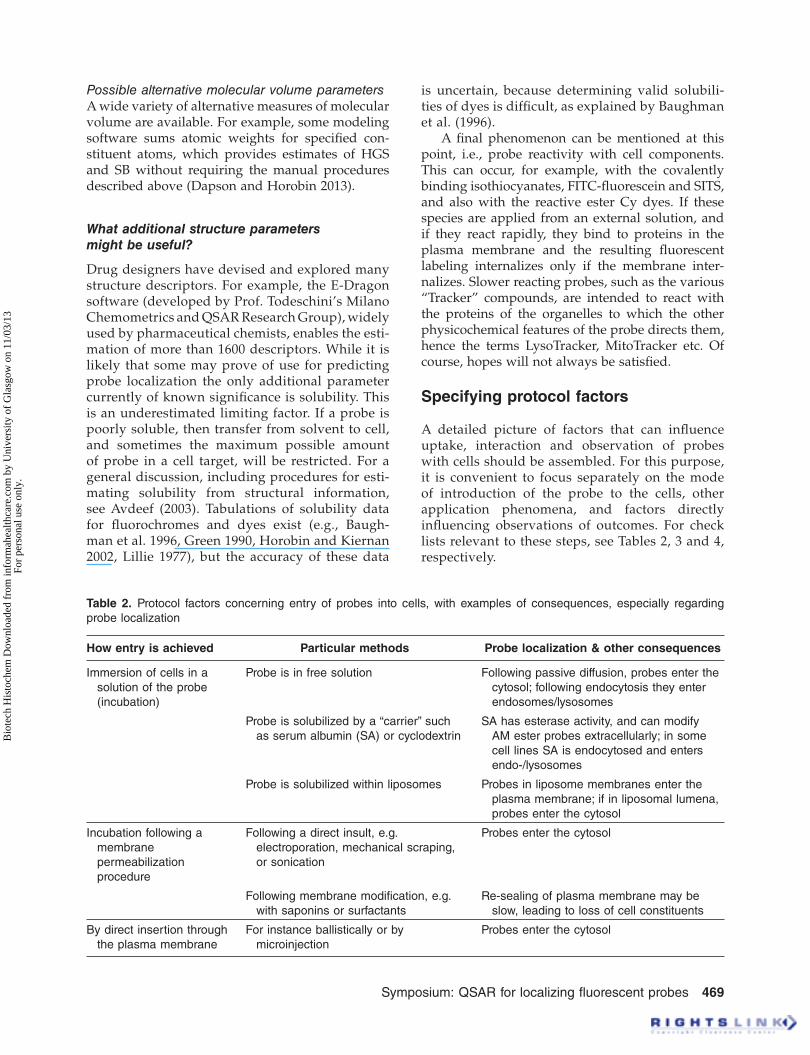
A detailed picture of factors that can infl uence uptake, interaction and observation of probes with cells should be assembled. For this purpose, it is convenient to focus separately on the mode of introduction of the probe to the cells, other application phenomena, and factors directly infl uencing observations of outcomes. For check lists relevant to these steps, see Tables 2, 3 and 4, respectively.
Table 2 . Protocol factors concerning entry of probes into cells, with examples of consequences, especially regarding
probe localization
How entry is achieved Particular methods Probe localization & other consequences
Immersion of cells in a
solution of the probe
(incubation)
Probe is in free solution Following passive diffusion, probes enter the
cytosol; following endocytosis they enter
endosomes/lysosomes
Probe is solubilized by a “ carrier ” such
as serum albumin (SA) or cyclodextrin
SA has esterase activity, and can modify
AM ester probes extracellularly; in some
cell lines SA is endocytosed and enters
endo-/lysosomes
Probe is solubilized within liposomes Probes in liposome membranes enter the
plasma membrane; if in liposomal lumena,
probes enter the cytosol
Incubation following a
membrane
permeabilization
procedure
Following a direct insult, e.g.
electroporation, mechanical scraping,
or sonication
Probes enter the cytosol
Following membrane modifi cation, e.g.
with saponins or surfactants
Re-sealing of plasma membrane may be
slow, leading to loss of cell constituents
By direct insertion through
the plasma membrane
For instance ballistically or by
microinjection
Probes enter the cytosol
Bio
tech
His
toch
em D
ownl
oade
d fr
om in
form
ahea
lthca
re.c
om b
y U
nive
rsity
of
Gla
sgow
on
11/0
3/13
For
pers
onal
use
onl
y.
470 Biotechnic & Histochemistry 2013, 88(8): 461–476
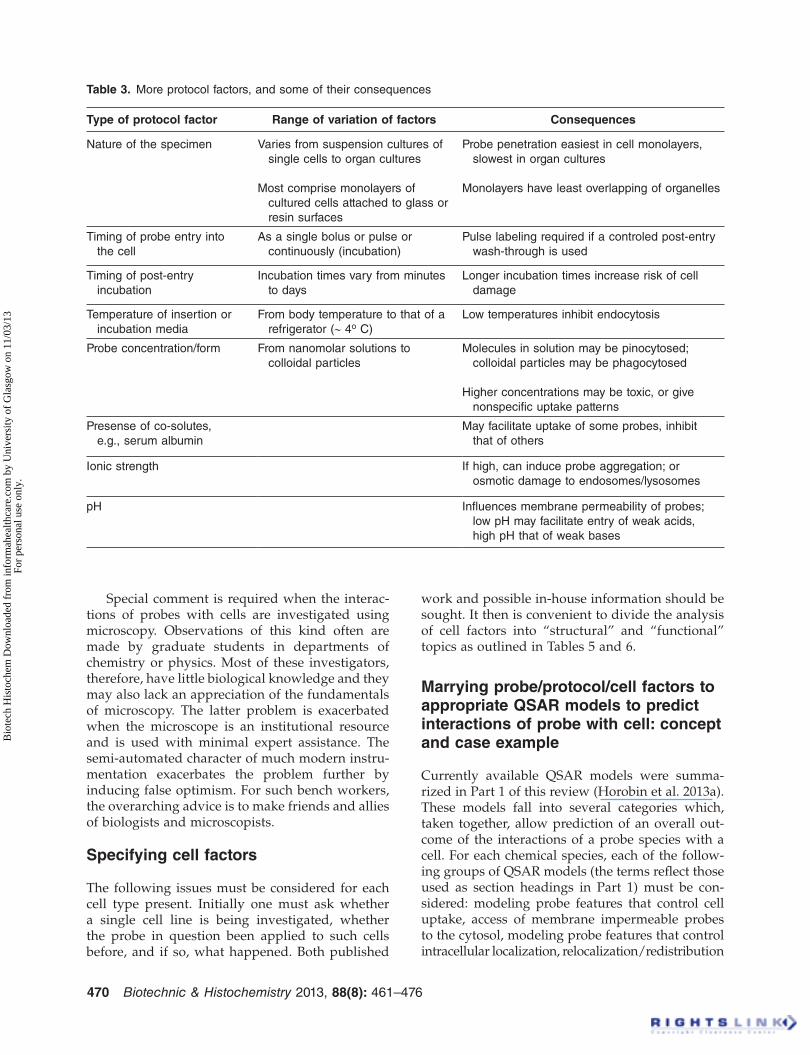
Table 3 . More protocol factors, and some of their consequences
Type of protocol factor Range of variation of factors Consequences
Nature of the specimen Varies from suspension cultures of
single cells to organ cultures
Most comprise monolayers of
cultured cells attached to glass or
resin surfaces
Probe penetration easiest in cell monolayers,
slowest in organ cultures
Monolayers have least overlapping of organelles
Timing of probe entry into
the cell
As a single bolus or pulse or
continuously (incubation)
Pulse labeling required if a controled post-entry
wash-through is used
Timing of post-entry
incubation
Incubation times vary from minutes
to days
Longer incubation times increase risk of cell
damage
Temperature of insertion or
incubation media
From body temperature to that of a
refrigerator ( ~ 4 o C)
Low temperatures inhibit endocytosis
Probe concentration/form From nanomolar solutions to
colloidal particles
Molecules in solution may be pinocytosed;
colloidal particles may be phagocytosed
Higher concentrations may be toxic, or give
nonspecifi c uptake patterns
Presense of co-solutes,
e.g., serum albumin
May facilitate uptake of some probes, inhibit
that of others
Ionic strength If high, can induce probe aggregation; or
osmotic damage to endosomes/lysosomes
pH Infl uences membrane permeability of probes;
low pH may facilitate entry of weak acids,
high pH that of weak bases
Special comment is required when the interac-tions of probes with cells are investigated using microscopy. Observations of this kind often are made by graduate students in departments of chemistry or physics. Most of these investigators, therefore, have little biological knowledge and they may also lack an appreciation of the fundamentals of microscopy. The latter problem is exacerbated when the microscope is an institutional resource and is used with minimal expert assistance. The semi-automated character of much modern instru-mentation exacerbates the problem further by inducing false optimism. For such bench workers, the overarching advice is to make friends and allies of biologists and microscopists.
Specifying cell factors
The following issues must be considered for each cell type present. Initially one must ask whether a single cell line is being investigated, whether the probe in question been applied to such cells before, and if so, what happened. Both published
work and possible in-house information should be sought. It then is convenient to divide the analysis of cell factors into “ structural ” and “ functional ” topics as outlined in Tables 5 and 6.
Marrying probe/protocol/cell factors to appropriate QSAR models to predict interactions of probe with cell: concept and case example
Currently available QSAR models were summa-rized in Part 1 of this review (Horobin et al. 2013a). These models fall into several categories which, taken together, allow prediction of an overall out-come of the interactions of a probe species with a cell. For each chemical species, each of the follow-ing groups of QSAR models (the terms refl ect those used as section headings in Part 1) must be con-sidered: modeling probe features that control cell uptake, access of membrane impermeable probes to the cytosol, modeling probe features that control intracellular localization, relocalization/redistribution
Bio
tech
His
toch
em D
ownl
oade
d fr
om in
form
ahea
lthca
re.c
om b
y U
nive
rsity
of
Gla
sgow
on
11/0
3/13
For
pers
onal
use
onl
y.
Symposium: QSAR for localizing fl uorescent probes 471
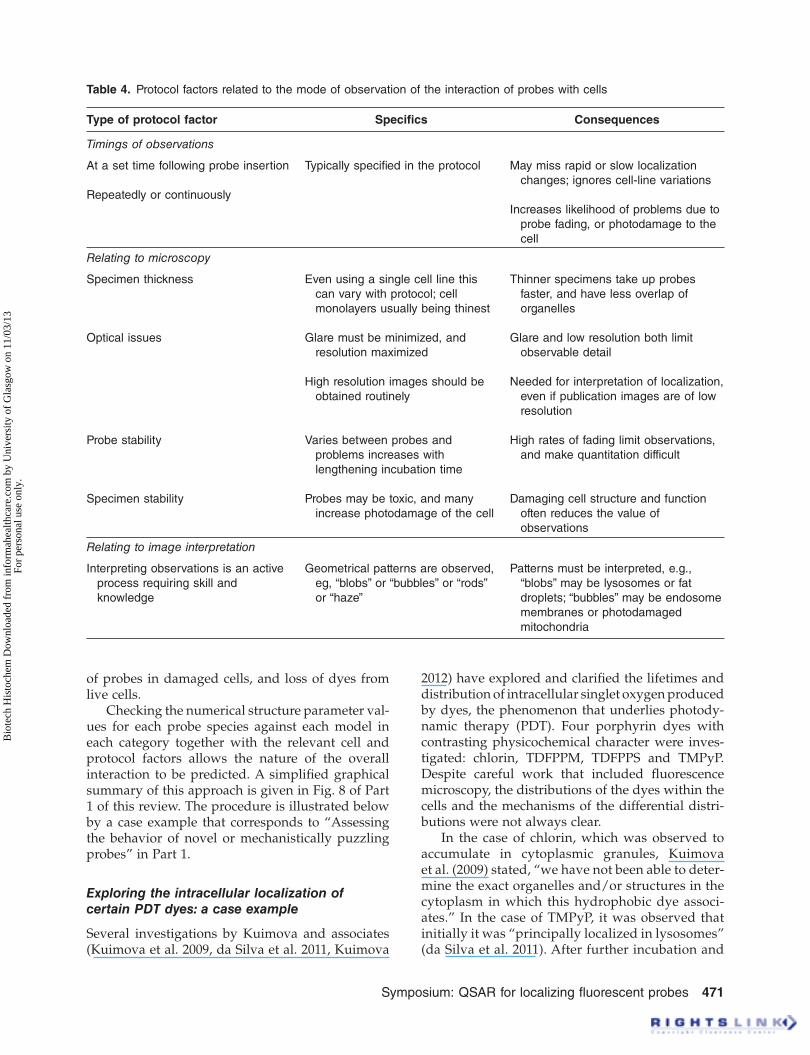
Table 4 . Protocol factors related to the mode of observation of the interaction of probes with cells
Type of protocol factor Specifi cs Consequences
Timings of observations
At a set time following probe insertion
Repeatedly or continuously
Typically specifi ed in the protocol May miss rapid or slow localization
changes; ignores cell-line variations
Increases likelihood of problems due to
probe fading, or photodamage to the
cell
Relating to microscopy
Specimen thickness
Optical issues
Probe stability
Specimen stability
Even using a single cell line this
can vary with protocol; cell
monolayers usually being thinest
Glare must be minimized, and
resolution maximized
High resolution images should be
obtained routinely
Varies between probes and
problems increases with
lengthening incubation time
Probes may be toxic, and many
increase photodamage of the cell
Thinner specimens take up probes
faster, and have less overlap of
organelles
Glare and low resolution both limit
observable detail
Needed for interpretation of localization,
even if publication images are of low
resolution
High rates of fading limit observations,
and make quantitation difficult
Damaging cell structure and function
often reduces the value of
observations
Relating to image interpretation
Interpreting observations is an active
process requiring skill and
knowledge
Geometrical patterns are observed,
eg, “blobs” or “bubbles” or “rods”
or “haze”
Patterns must be interpreted, e.g.,
“blobs” may be lysosomes or fat
droplets; “bubbles” may be endosome
membranes or photodamaged
mitochondria
of probes in damaged cells, and loss of dyes from live cells.
Checking the numerical structure parameter val-ues for each probe species against each model in each category together with the relevant cell and protocol factors allows the nature of the overall interaction to be predicted. A simplifi ed graphical summary of this approach is given in Fig. 8 of Part 1 of this review. The procedure is illustrated below by a case example that corresponds to “ Assessing the behavior of novel or mechanistically puzzling probes ” in Part 1.
Exploring the intracellular localization of
certain PDT dyes: a case example
Several investigations by Kuimova and associates (Kuimova et al. 2009, da Silva et al. 2011, Kuimova
2012) have explored and clarifi ed the lifetimes and distribution of intracellular singlet oxygen produced by dyes, the phenomenon that underlies photody-namic therapy (PDT). Four porphyrin dyes with contrasting physicochemical character were inves-tigated: chlorin, TDFPPM, TDFPPS and TMPyP. Despite careful work that included fl uorescence microscopy, the distributions of the dyes within the cells and the mechanisms of the differential distri-butions were not always clear.
In the case of chlorin, which was observed to accumulate in cytoplasmic granules, Kuimova et al. (2009) stated, “ we have not been able to deter-mine the exact organelles and/or structures in the cytoplasm in which this hydrophobic dye associ-ates. ” In the case of TMPyP, it was observed that initially it was “ principally localized in lysosomes ” (da Silva et al. 2011). After further incubation and
Bio
tech
His
toch
em D
ownl
oade
d fr
om in
form
ahea
lthca
re.c
om b
y U
nive
rsity
of
Gla
sgow
on
11/0
3/13
For
pers
onal
use
onl
y.
472 Biotechnic & Histochemistry 2013, 88(8): 461–476
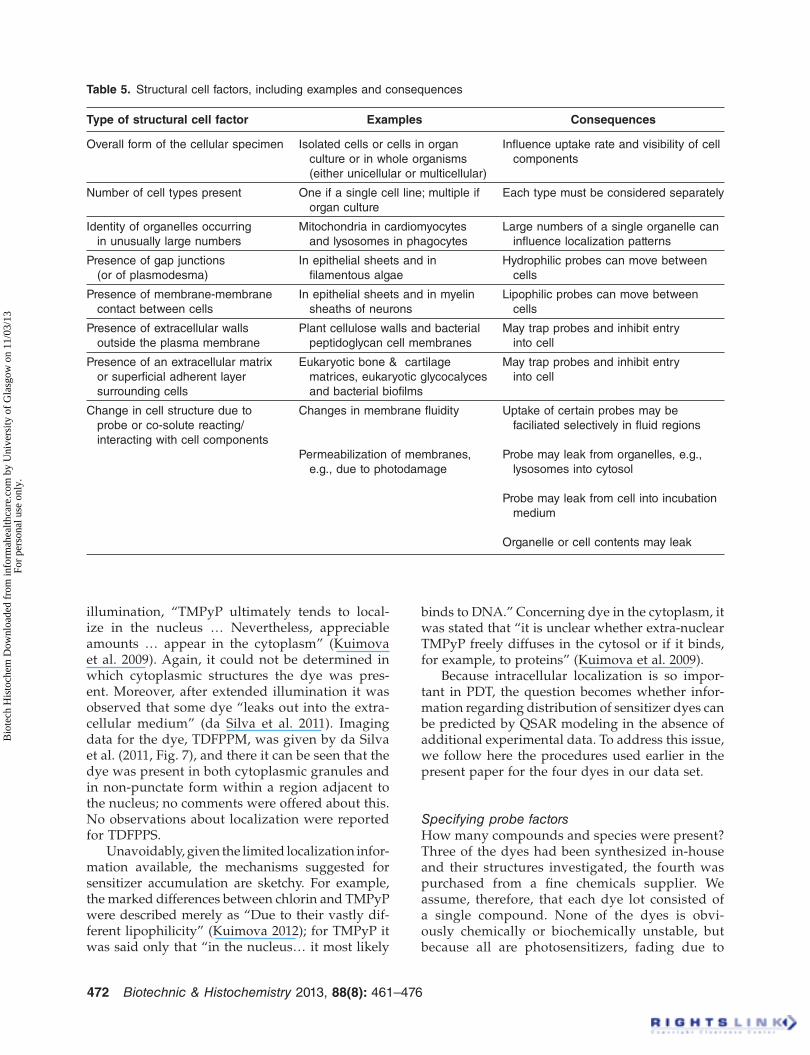
Table 5 . Structural cell factors, including examples and consequences
Type of structural cell factor Examples Consequences
Overall form of the cellular specimen Isolated cells or cells in organ
culture or in whole organisms
(either unicellular or multicellular)
Infl uence uptake rate and visibility of cell
components
Number of cell types present One if a single cell line; multiple if
organ culture
Each type must be considered separately
Identity of organelles occurring
in unusually large numbers
Mitochondria in cardiomyocytes
and lysosomes in phagocytes
Large numbers of a single organelle can
infl uence localization patterns
Presence of gap junctions
(or of plasmodesma)
In epithelial sheets and in
fi lamentous algae
Hydrophilic probes can move between
cells
Presence of membrane-membrane
contact between cells
In epithelial sheets and in myelin
sheaths of neurons
Lipophilic probes can move between
cells
Presence of extracellular walls
outside the plasma membrane
Plant cellulose walls and bacterial
peptidoglycan cell membranes
May trap probes and inhibit entry
into cell
Presence of an extracellular matrix
or superfi cial adherent layer
surrounding cells
Eukaryotic bone & cartilage
matrices, eukaryotic glycocalyces
and bacterial biofi lms
May trap probes and inhibit entry
into cell
Change in cell structure due to
probe or co-solute reacting/
interacting with cell components
Changes in membrane fl uidity
Permeabilization of membranes,
e.g., due to photodamage
Uptake of certain probes may be
faciliated selectively in fl uid regions
Probe may leak from organelles, e.g.,
lysosomes into cytosol
Probe may leak from cell into incubation
medium
Organelle or cell contents may leak
illumination, “ TMPyP ultimately tends to local-ize in the nucleus … Nevertheless, appreciable amounts … appear in the cytoplasm ” (Kuimova et al. 2009). Again, it could not be determined in which cytoplasmic structures the dye was pres-ent. Moreover, after extended illumination it was observed that some dye “ leaks out into the extra-cellular medium ” (da Silva et al. 2011). Imaging data for the dye, TDFPPM, was given by da Silva et al. (2011, Fig. 7), and there it can be seen that the dye was present in both cytoplasmic granules and in non-punctate form within a region adjacent to the nucleus; no comments were offered about this. No observations about localization were reported for TDFPPS.
Unavoidably, given the limited localization infor-mation available, the mechanisms suggested for sensitizer accumulation are sketchy. For example, the marked differences between chlorin and TMPyP were described merely as “ Due to their vastly dif-ferent lipophilicity ” (Kuimova 2012); for TMPyP it was said only that “ in the nucleus … it most likely
binds to DNA. ” Concerning dye in the cytoplasm, it was stated that “ it is unclear whether extra-nuclear TMPyP freely diffuses in the cytosol or if it binds, for example, to proteins ” (Kuimova et al. 2009).
Because intracellular localization is so impor-tant in PDT, the question becomes whether infor-mation regarding distribution of sensitizer dyes can be predicted by QSAR modeling in the absence of additional experimental data. To address this issue, we follow here the procedures used earlier in the present paper for the four dyes in our data set.
Specifying probe factors
How many compounds and species were present? Three of the dyes had been synthesized in-house and their structures investigated, the fourth was purchased from a fi ne chemicals supplier. We assume, therefore, that each dye lot consisted of a single compound. None of the dyes is obvi-ously chemically or biochemically unstable, but because all are photosensitizers, fading due to
Bio
tech
His
toch
em D
ownl
oade
d fr
om in
form
ahea
lthca
re.c
om b
y U
nive
rsity
of
Gla
sgow
on
11/0
3/13
For
pers
onal
use
onl
y.
Symposium: QSAR for localizing fl uorescent probes 473
self-generated singlet oxygen is possible. Because this would probably yield colorless compounds, fading would not confuse discussion of probe localization.
Because each of the four porphyrin dyes pos-sesses potentially protonatable ring N atoms (Falk and Phillips 1964, Phillips 1960, 1963), several chemical species may have been present. Therefore, the two compounds with electron-rich conjugated systems, TDFPPM and TDFPPS, are expected by similarity with analogous compounds to have pK a values for ring Ns in the range 4 – 5. Consequently, dyes in the incubation media and in the cytosol would be mostly deprotonated, whereas species within low pH organelles, such as lysosomes, would be mostly protonated. The resulting overall electric charges are controlled by the protonation equilibria, the non-ionic character of the other components of TDFPPM, and the four sulfonic acid substituents of TDFPPS; the latter always are present as anions under physiological conditions.
TMPyP, however, is an electron-defi cient por-phyrin and for this reason the pK a values for pro-tonation of its ring N atoms are lower (approx imately 1.4 and 0.6; tabulation in Kano 2004). Consequently, this dye exists predominantly as a single species under physiological conditions,
i.e., as a tetracation owing to the presence of four quaternary nitrogen groups. The pK a values for ring N atoms of the chlorin dye should, based on comparison with related compounds (Cavaleiro et al. 1984), be near 4 – 5 and 3. Therefore, the dye in incubation media and cytosol would be mostly deprotonated, whereas the dye in acidic organelles would be mostly protonated.
The resulting overall charges on the various spe-cies of these four compounds are listed in Table 7. Also included in Table 7 are other relevant struc-ture parameters for the dyes that were estimated as described earlier in the present paper.
Specifying protocol factors
Prior to microscopic inspection, all four dyes were applied to cells by adding them to the incubation media under normal physiological conditions. Initial exposure to dyes was in the dark for extended periods (24 h) using no permeabilization proce-dure. Effects of potentially toxic solvents (D 2 O, ethanol) and of fetal calf serum were assessed, and considered not to infl uence probe localization. Subsequent illumination, which permitted micro-scopic observation of fl uorescence, was for varying periods from short to extended.
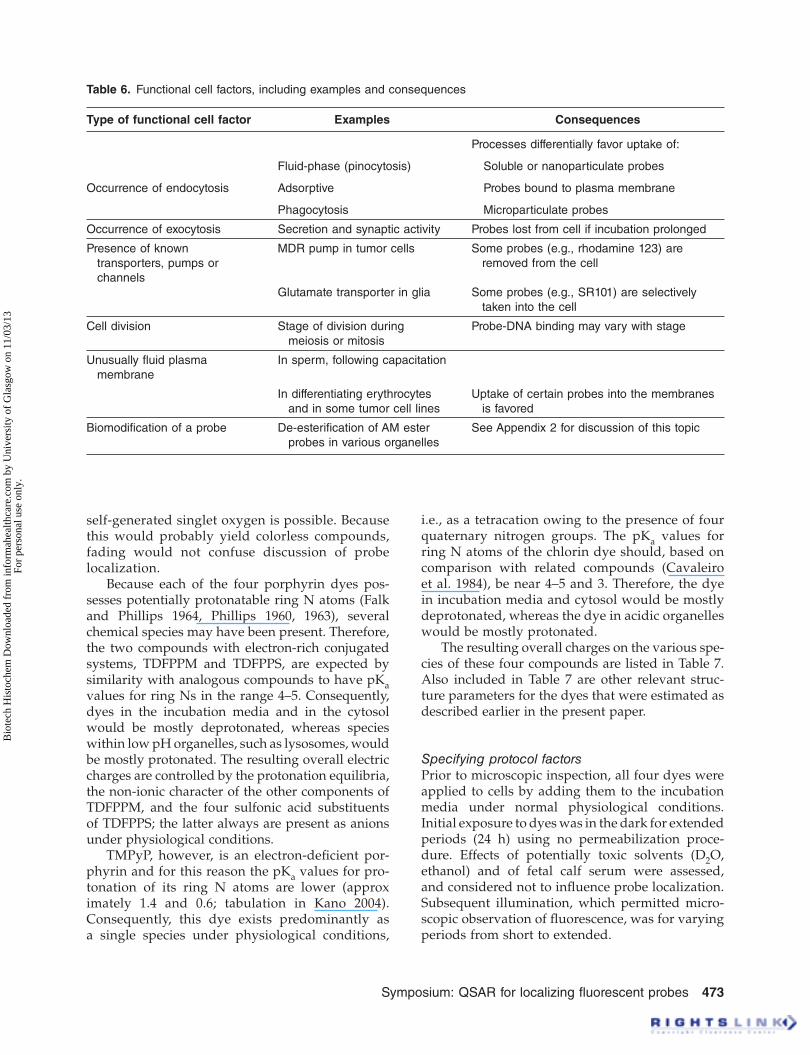
Table 6 . Functional cell factors, including examples and consequences
Type of functional cell factor Examples Consequences
Processes differentially favor uptake of:
Occurrence of endocytosis
Fluid-phase (pinocytosis) Soluble or nanoparticulate probes
Adsorptive Probes bound to plasma membrane
Phagocytosis Microparticulate probes
Occurrence of exocytosis Secretion and synaptic activity Probes lost from cell if incubation prolonged
Presence of known
transporters, pumps or
channels
MDR pump in tumor cells
Glutamate transporter in glia
Some probes (e.g., rhodamine 123) are
removed from the cell
Some probes (e.g., SR101) are selectively
taken into the cell
Cell division Stage of division during
meiosis or mitosis
Probe-DNA binding may vary with stage
Unusually fl uid plasma
membrane
In sperm, following capacitation
In differentiating erythrocytes
and in some tumor cell lines
Uptake of certain probes into the membranes
is favored
Biomodifi cation of a probe De-esterifi cation of AM ester
probes in various organelles
See Appendix 2 for discussion of this topic
Bio
tech
His
toch
em D
ownl
oade
d fr
om in
form
ahea
lthca
re.c
om b
y U
nive
rsity
of
Gla
sgow
on
11/0
3/13
For
pers
onal
use
onl
y.
474 Biotechnic & Histochemistry 2013, 88(8): 461–476
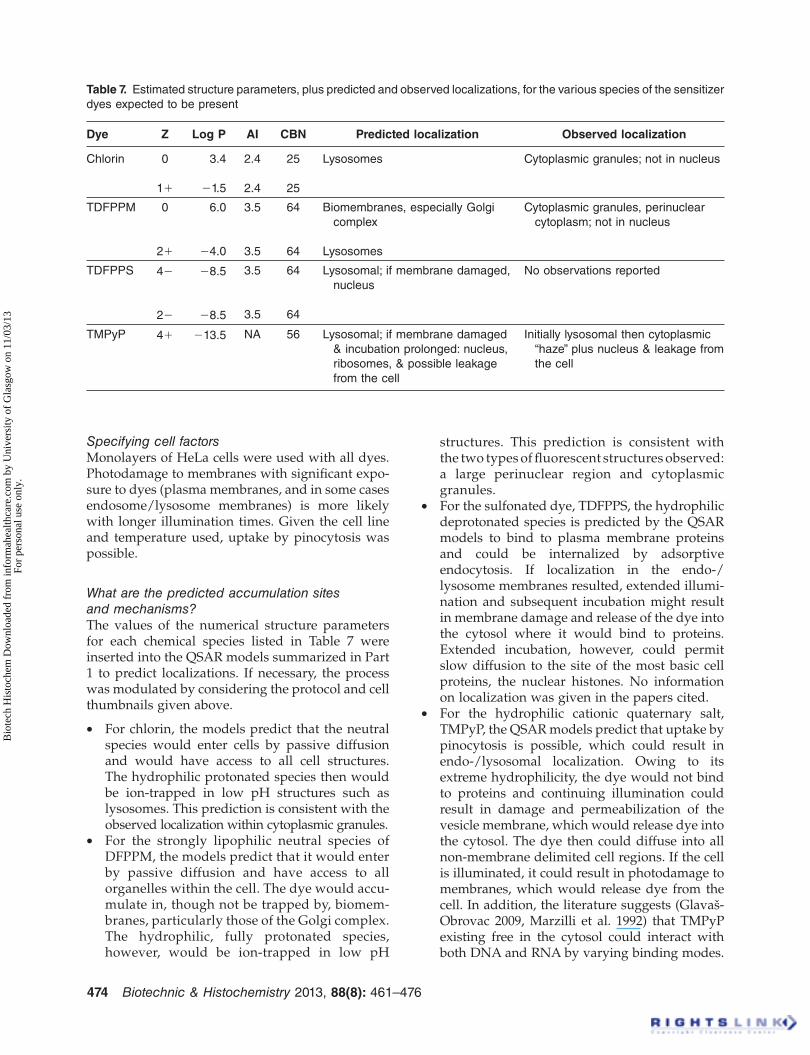
Table 7 . Estimated structure parameters, plus predicted and observed localizations, for the various species of the sensitizer
dyes expected to be present
Dye Z Log P AI CBN Predicted localization Observed localization
Chlorin 0
1 �
3.4
� 1.5
2.4
2.4
25
25
Lysosomes Cytoplasmic granules; not in nucleus
TDFPPM 0
2 �
6.0
� 4.0
3.5
3.5
64
64
Biomembranes, especially Golgi
complex
Lysosomes
Cytoplasmic granules, perinuclear
cytoplasm; not in nucleus
TDFPPS 4 �
2 �
� 8.5
� 8.5
3.5
3.5
64
64
Lysosomal; if membrane damaged,
nucleus
No observations reported
TMPyP 4 � � 13.5 NA 56 Lysosomal; if membrane damaged
& incubation prolonged: nucleus,
ribosomes, & possible leakage
from the cell
Initially lysosomal then cytoplasmic
“ haze ” plus nucleus & leakage from
the cell
Specifying cell factors
Monolayers of HeLa cells were used with all dyes. Photodamage to membranes with signifi cant expo-sure to dyes (plasma membranes, and in some cases endosome/lysosome membranes) is more likely with longer illumination times. Given the cell line and temperature used, uptake by pinocytosis was possible.
What are the predicted accumulation sites
and mechanisms?
The values of the numerical structure parameters for each chemical species listed in Table 7 were inserted into the QSAR models summarized in Part 1 to predict localizations. If necessary, the process was modulated by considering the protocol and cell thumbnails given above.
For chlorin, the models predict that the neutral •species would enter cells by passive diffusion and would have access to all cell structures. The hydrophilic protonated species then would be ion-trapped in low pH structures such as lysosomes. This prediction is consistent with the observed localization within cytoplasmic granules. For the strongly lipophilic neutral species of •DFPPM, the models predict that it would enter by passive diffusion and have access to all organelles within the cell. The dye would accu-mulate in, though not be trapped by, biomem-branes, particularly those of the Golgi complex. The hydrophilic, fully protonated species, however, would be ion-trapped in low pH
structures. This prediction is consistent with the two types of fl uorescent structures observed: a large perinuclear region and cytoplasmic granules. For the sulfonated dye, TDFPPS, the hydrophilic •deprotonated species is predicted by the QSAR models to bind to plasma membrane proteins and could be internalized by adsorptive endocytosis. If localization in the endo-/lysosome membranes resulted, extended illumi-nation and subsequent incubation might result in membrane damage and release of the dye into the cytosol where it would bind to proteins. Extended incubation, however, could permit slow diffusion to the site of the most basic cell proteins, the nuclear histones. No information on localization was given in the papers cited. For the hydrophilic cationic quaternary salt, •TMPyP, the QSAR models predict that uptake by pinocytosis is possible, which could result in endo-/lysosomal localization. Owing to its extreme hydrophilicity, the dye would not bind to proteins and continuing illumination could result in damage and permeabilization of the vesicle membrane, which would release dye into the cytosol. The dye then could diffuse into all non-membrane delimited cell regions. If the cell is illuminated, it could result in photodamage to membranes, which would release dye from the cell. In addition, the literature suggests (Glava š -Obrovac 2009, Marzilli et al. 1992) that TMPyP existing free in the cytosol could interact with both DNA and RNA by varying binding modes.
Bio
tech
His
toch
em D
ownl
oade
d fr
om in
form
ahea
lthca
re.c
om b
y U
nive
rsity
of
Gla
sgow
on
11/0
3/13
For
pers
onal
use
onl
y.
Symposium: QSAR for localizing fl uorescent probes 475
hydrophilic/lipophilic index, and new methods for
estimating degrees of amphiphilicity . Biotech. & Histochem .
88 : 489 – 497 .
da Silva EFF , Pedersen BW , Breitenbach T , Toftegaard R , Kuimova MK , Arnaut LG , Ogilby PR (2011) Irradia-
tion- and sensitizer-dependent changes in the lifetime
of intracellular singlet oxygen produced in a photosensi-
tized process . J. Phys. Chem. B 116 : 445 – 461 .
Del Castillo P , Horobin RW , Bl á zquez-Castro A , Stockert JC (2010) Binding of cationic dyes to DNA: distinguish-
ing intercalation and groove binding mechanisms by use
of simple experimental and numerical models . Biotech. & Histochem. 85 : 247 – 256 .
Falk JE , Phillips JN (1963) Physical and coordination
chemistry of the tetrapyrrole pigments . In: Chelating Agents and Metal Chelates . Dwyer FP , Mellor DP , Eds.
Academic Press, New York . pp. 441 – 490 .
Franco A , Trapp S (2008) Estimation of the soil-water
partition coeffi cient normalized to organic carbon for
ionizable organic chemicals . Environ. Toxicol. Chem . 27 :
1995 – 2004 .
Glava š -Obrovac L , Piantanida I , Marczi S , Ma š ic L , Timcheva II , Deligeorgiev TG (2009) Minor structural
differences of monomethine cyanine derivatives yield
strong variation in their interactions with DNA, RNA as
well as on their in vitro antiproliferative activity . Bioorg. Med. Chem. 17 : 4747 – 4755 .
Green FJ (1990) The Sigma-Aldrich Handbook of Stains, Dyes and Indicators . Aldrich Chemical Company, Milwaukee
WI .
Hansch C , Leo A (1979) Substituent Constants for Correlation Analysis in Chemistry and Biology . Wiley-Interscience, New
York . Chapter 4 , pp. 18 – 43 .
Haugland RP (1996) Handbook of Fluorescent Probes and Research Chemicals , 6th ed . Molecular Probes, Eugene OR .
Horobin RW , Kiernan JA (2002) Conn ’ s Biological Stains: a Handbook of Dyes, Stains and Fluorochromes for Use in Biology and Medicine , 10 th ed . BIOS Scientifi c Publishers,
Oxford .
Horobin RW , Rashid-Doubell F , Pediani JD , Milligan G (2013a) Predicting small-molecule fl uorescent probe
localization in living cells using QSAR modeling. 1.
Overview and models for probes of structure, proper-
ties and function in single cells . Biotech. & Histochem. 88 : 440 – 460 .
Horobin RW , Stockert JC , Rashid-Doubell F (2013b)
Uptake and localisation of small-molecule fl uorescent
probes in living cells: a critical appraisal of QSAR models
and a case study concerning probes for DNA and RNA .
Histochem. Cell Biol . 139 : 623 – 637. DOI: 10.1007/s00418-
013-1090-0 .
Kano K (2004) Molecular complexes of water-soluble
porphyrins . J. Porphyr. Phthalocya. 8 : 148 – 155 .
Kuimova MK (2012) Mapping viscosity in cells using
molecular rotors . Phys. Chem. Chem. Phys . 14 : 12671 – 12686 .
Kuimova MK , Yahioglu G , Ogilby PR (2009) Singlet oxy-
gen in a cell: spatially dependent lifetimes and quenching
rate constants . J. Am. Chem. Soc. 131 : 332 – 340 .
Leo A , Hansch C , Elkins D (1971) Partition coeffi cients
and their uses . Chem. Rev . 71 : 525 – 616 .
These outcomes are consistent with the observed loss of TMPyP from the cell into the incubation medium, and staining of both nucleus and cytoplasm.
Predicted intracellular localizations of probes agree with those of the experimentalists in one case and in two other cases suggest precise accumulation sites consistent with reported observations. The predic-tion for TDFPPS could not be evaluated, because no observations for this compound have been reported. In terms of mechanism, the QSAR pre-dictions confi rm the experimentalists ’ suggestions in one case, and in other cases make new and/or more detailed suggestions. Overall, therefore, these four dyes demonstrate that QSAR modeling of dye uptake and localization can provide a value added approach to experimental studies that involve intra-cellular localization of dyes, probes, or indeed, of other xenobiotics.
Acknowledgment
RWH thanks Dr. R. Aitken, School of Life Sciences, College of Medical, Veterinary and Life Sciences, University of Glasgow, for providing facilities.
Declaration of interest: The authors report no con-fl icts of interest. The authors alone are responsible for the content and writing of the paper.
References
Avdeef A (2003) Adsorption and Drug Development. Solubility, Permeability and Charge State . Wiley-Interscience,
Hoboken NJ . Chapter 6, sections 4.0, 4.9, 3.7 .
Baughman GL , Banerjee S , Perenich TA (1996)
Dye solubility . In : Advances in Color Chemistry . vol. 4 . Physicochemical Principles of Color Chemistry. Blackie,
London . pp. 145 – 195 .
Cavaleiro JAS , Jackson AH , Ali SA (1984) The proto-
nation of chlorins (dihdyroporphyrins) . Tetrahed. Lett. 25 : 229 – 232 .
Chenzhong L , Hicklaus MC (2009) Comparisons of
nine programs predicting pKa values of pharmaceutical
substances . J. Chem. Inf. Model . 49 : 2801 – 2812 .
Dapson RW (2013) Alternative methods for estimat-
ing common descriptors for QSAR studies of dyes and
fl uorescent probes using molecular modeling software.
1. Concepts and procedures . Biotech. & Histochem .
88 : 477 – 488 .
Dapson RW , Horobin RW (2013) Alternative methods
for estimating common descriptors for QSAR studies
of dyes and fl uorescent probes using molecular mod-
eling software. 2. Correlations between log P and the
Bio
tech
His
toch
em D
ownl
oade
d fr
om in
form
ahea
lthca
re.c
om b
y U
nive
rsity
of
Gla
sgow
on
11/0
3/13
For
pers
onal
use
onl
y.
476 Biotechnic & Histochemistry 2013, 88(8): 461–476
Phillips JN (1960) The ionization and coordination
behaviour of porphyrins . Rev. Pure Appl. Chem. (Australia) 10 : 35 – 60 .
Phillips JN (1963) Physicochemical properties of por-
phyrins . In: Comprehensive Biochemistry , vol. 9 , Florkin M ,
Stotz EH , Eds ., Elsevier, Amsterdam . pp. 34 – 72 .
Rivinoja A , Pujol FM , Hassinen A , Kellokumpu S (2012) Golgi pH, its regulation and roles in human
disease . Ann. Med. 44 : 542 – 554 .
Rost F (1995) Fluorescence Microscopy , vol. 2 . Cambridge
University Press, Cambridge .
Seksek O , Bolard J (1996) Nuclear pH gradient in
mammalian cells revealed by laser microspectrofl uori-
metry . J. Cell Sci. 109 (Part 1) : 257 – 262 .
Smith RM , Martell AE (1974) Critical Stability Constants ,
vols. 1 – 6 . Plenum Press, New York .
Smith RM , Martell AE , Motekaitis RJ (2012) NIST Critically Selected Stability Constants of Metal Complexes Database , Version 8.0, NIST standard reference database
46, US Department of Commerce, Gaithersburg, MD .
Takahashi A , Zhang Y , Centonze E , Herman B (2001)
Measurement of mitochondrial pH in situ . Biotechniques
30 : 804 – 810, 812 .
Lillie RD (1977) Conn ’ s Biological Stains: a Handbook on the Nature and Uses of the Dyes Employed in the Biological Laboratory, 9 th ed ., Williams and Wilkins, Baltimore .
Llopis J , McCaffery JM , Miyawaki A , Farquhar MG , Tsien RY (1998) Measurement of cytosolic, mitochondrial,
and Golgi pHi in single living cells with green fl uorescent
proteins . Proc. Natl. Acad. Sci. USA 95 : 6803 – 6808 .
Loiselle FB , Casey JR (2010) Measurement of intracellular
pH . Methods Mol. Biol . 637 : 311 – 331 .
Mannhold R , Poda GI , Osermann C , Tetko IV (2009)
Calculation of molecular lipophilicity: state-of-the-art
and comparison of log P methods on more than 96,000
compounds . J. Pharm. Sci . 98 : 861 – 893 .
Marzilli LG , Peth � G , Lin M , Kim MS , Dixon DW (1992)
Tentacle porphyrins: DNA interactions . J. Am. Chem. Soc. 114 : 7575 – 7577 .
Mindell JA (2012) Lysosomal acidifi cation mechanisms .
Ann. Rev. Physiol. 74 : 69 – 86 .
M ü ller W , Crothers DM , Waring MJ (1973) A non-
intercalating profl avine derivative . Eur. J. Biochem. 39 :
223 – 234 .
Perrin DD , Dempsey B , Serjeant EP (1981) pKa Prediction for Organic Acids and Bases . Chapman and Hall, London . p. 17 .
Supplementary material available online
Appendices 1–5 to be found online at http://informahealthcare .com/doi/abs/10.3109/10520295.2013.780635
Bio
tech
His
toch
em D
ownl
oade
d fr
om in
form
ahea
lthca
re.c
om b
y U
nive
rsity
of
Gla
sgow
on
11/0
3/13
For
pers
onal
use
onl
y.