Emerging Significance of Flavonoids as P-Glycoprotein Inhibitors in Cancer Chemotherapy
Upload
independentCategory
view
0download
0
Predicting P-Glycoprotein-Mediated Drug TransportBased On Support Vector Machine and Three-Dimensional Crystal Structure of P-glycoproteinZsolt Bikadi1, Istvan Hazai1, David Malik1, Katalin Jemnitz2, Zsuzsa Veres2, Peter Hari3, Zhanglin Ni5,
Tip W. Loo4, David M. Clarke4, Eszter Hazai1, Qingcheng Mao5*
1 Virtua Drug Ltd., Budapest, Hungary, 2 Chemical Research Center, Hungary Academy of Sciences, Budapest, Hungary, 3 Delta Services Ltd., Budapest, Hungary,
4 Department of Medicine, Department and Biochemistry, University of Toronto, Toronto, Ontario, Canada, 5 Department of Pharmaceutics, School of Pharmacy,
University of Washington, Seattle, Washington, United States of America
Abstract
Human P-glycoprotein (P-gp) is an ATP-binding cassette multidrug transporter that confers resistance to a wide range ofchemotherapeutic agents in cancer cells by active efflux of the drugs from cells. P-gp also plays a key role in limiting oralabsorption and brain penetration and in facilitating biliary and renal elimination of structurally diverse drugs. Thus,identification of drugs or new molecular entities to be P-gp substrates is of vital importance for predicting thepharmacokinetics, efficacy, safety, or tissue levels of drugs or drug candidates. At present, publicly available, reliable in silicomodels predicting P-gp substrates are scarce. In this study, a support vector machine (SVM) method was developed topredict P-gp substrates and P-gp-substrate interactions, based on a training data set of 197 known P-gp substrates and non-substrates collected from the literature. We showed that the SVM method had a prediction accuracy of approximately 80%on an independent external validation data set of 32 compounds. A homology model of human P-gp based on the X-raystructure of mouse P-gp as a template has been constructed. We showed that molecular docking to the P-gp structuressuccessfully predicted the geometry of P-gp-ligand complexes. Our SVM prediction and the molecular docking methodshave been integrated into a free web server (http://pgp.althotas.com), which allows the users to predict whether a givencompound is a P-gp substrate and how it binds to and interacts with P-gp. Utilization of such a web server may provevaluable for both rational drug design and screening.
Citation: Bikadi Z, Hazai I, Malik D, Jemnitz K, Veres Z, et al. (2011) Predicting P-Glycoprotein-Mediated Drug Transport Based On Support Vector Machine andThree-Dimensional Crystal Structure of P-glycoprotein. PLoS ONE 6(10): e25815. doi:10.1371/journal.pone.0025815
Editor: Hendrik W. van Veen, University of Cambridge, United Kingdom
Received June 29, 2011; Accepted September 11, 2011; Published October 4, 2011
Copyright: � 2011 Bikadi et al. This is an open-access article distributed under the terms of the Creative Commons Attribution License, which permitsunrestricted use, distribution, and reproduction in any medium, provided the original author and source are credited.
Funding: This work was supported by the Hungarian State and the European Union (European Regional Development Fund), under the aegis of New HungaryDevelopment Plan (KMOP-1.1.1-09/1-2009-0044). Dr. Clarke is the holder of the Canada Research Chair in Membrane Biology and the research was supported bygrants from the National Cancer Institute of Canada through the Canadian Cancer Society (Grant 19074) and from the Canadian Institutes of Health Research(Grant 25043). Dr. Mao gratefully acknowledges financial support by the National Institutes of Health Grant (GM073715). The funders had no role in study design,data collection and analysis, decision to publish, or preparation of the manuscript.
Competing Interests: I have read the journal’s policy and have the following conflicts: Dr. Bikadi, Dr. Istvan Hazai, Dr. Malik, and Dr. Eszter Hazai are employeesof Virtua Drug Ltd. Dr. Hari is an employee of Delta Services Ltd. There are no other relevant declarations. We confirm that this does not alter our adherence to allthe PLoS ONE policies on sharing data and materials.
* E-mail: [email protected]
Introduction
Human P-glycoprotein (P-gp, gene symbol ABCB1) is a large
polytopic membrane protein belonging to the ATP-binding
cassette (ABC) multidrug transporter superfamily. P-gp mediates
efflux of a wide range of xenobiotics and endogenous compounds
out of cells utilizing ATP hydrolysis as the source of energy for
substrate translocation [1,2,3]. P-gp substrates are mainly
hydrophobic and weakly amphipathic substances, including
antibiotics, steroid hormones, chemotherapeutics, immunosup-
pressants, and anti-HIV protease inhibitors [3,4,5]. In addition to
its ability of conferring multidrug resistance in cancer cells, P-gp is
highly expressed in normal organs important for the absorption
(the small intestine), elimination (the liver and kidney) and
distribution (e.g., the placental and blood-brain barriers) of drugs
and xenobiotics, and has been recognized as one of the most
important drug transporters that are involved in clinically relevant
drug disposition and drug-drug interactions [6]. P-gp consists of
1280 amino acid residues arranged into two homologous and
symmetrical halves, each comprising one membrane-spanning
domain (MSD) with six transmembrane (TM) a-helices followed
by one cytosolic nucleotide-binding domain (NBD) [1,3].
Since P-gp can influence the pharmacokinetics, efficacy, safety,
and tissue levels of substrate drugs, increasing efforts are being
devoted to investigating whether new molecular entities (NMEs)
are potential P-gp substrates in early drug discovery and
development. It is also very important to know if any existing
drugs are P-gp substrates so that clinically important drug
disposition and drug-drug interactions may be predicted. A
variety of in vitro assays, including drug-stimulated ATPase activity,
rhoadmine 123 or calcein-AM cellular accumulation, cell-based
bi-directional transwell transport, drug permeability, and radio-
active ligand binding have been used to classify drugs or drug
candidates as P-gp substrates or non-substrates [7]. The data
obtained from such in vitro studies can then be validated in vivo in
preclinical animal models or in human subjects to assess the
PLoS ONE | www.plosone.org 1 October 2011 | Volume 6 | Issue 10 | e25815

interactions of drugs or drug candidates with P-gp [7,8,9,10].
Although the in vitro assays are highly efficient compared to in vivo
studies, they are nonetheless still time-consuming, particularly
when screening of a large number of NMEs is required in the early
drug discovery stage. Therefore, in silico methods for predicting P-
gp substrates and interactions are of high value for both rational
drug discovery and screening. The availability of a vast amount of
experimental transport data and the recently resolved X-ray
structure of mouse P-gp [11] would now make it possible to
develop much improved in silico prediction models.
Ligand-based and protein structure-based prediction methods
are the two main classes of in silico prediction methods for protein-
ligand interactions. Protein structure-based methods such as
molecular docking allow prediction of protein-ligand interactions
in atomic details, when high resolution experimental protein
structures are available. Low resolution structures and homology
models decrease the accuracy of docking calculations mostly due
to the uncertainty of side chain conformations. However, a
drawback of this method lies in the generation of a large number
of potentially false positive results – that is, non substrates could
also be calculated to bind to protein with high affinity. Thus,
docking calculations alone cannot accurately predict P-gp
substrates. On the other hand, ligand-based models, such as
QSAR and SVM may be capable of predicting transport
properties of test compounds based on their similarity to chemical
structures of known substrates as well as their physicochemical
properties. However, ligand-based methods do not provide
information on protein-ligand interactions at the molecular level.
Although a number of classification methodologies have been used
in the development of QSAR models for P-gp substrates, there is
no general rule concerning the selection of the best method for a
specific classification problem. Penzotti et al. reported a compu-
tational ensemble pharmacophore model that had an overall
classification rate of 80% for the training set and a prediction
accuracy of 63% for a hold-out set [12]. Chang et al. applied
pharmacophore models combined with screening of databases to
retrieve molecules that bind to P-gp [13]. De Cerqueira Lima et al.
developed a QSAR model for classification of drugs as P-gp
substrates or non-substrates using a combination of methods and
descriptor types [14]. Cabrera et al. used a topological substructural
molecular design approach to predict whether a compound is a P-gp
substrate and achieved a prediction accuracy of ,71% on an
external test set of marketed drugs [15]. Self-organizing maps
(SOMs) represent another promising approach, and neural network
can be used for classification purposes, too. Wang et al. [16] and
Kaiser et al. [17] used SOMs to discriminate between P-gp
inhibitors and substrates. In the latter study, the trained maps were
subsequently used to identify highly active P-gp substrates in a
virtual screening of a large compound library. Zhang et al. [18]
applied the recursive partitioning method to classification of P-gp
substrates and non-substrates based on in vitro bi-directional Caco-2
cell permeability and five descriptors of 14 marketed drugs and
more than 100 discovery compounds. For a validation set of 46
compounds, the prediction accuracy was ,72% and 89% for non-
substrates and substrates, respectively [18].
Another ligand-based approach, namely, the support vector
machine (SVM) technique, has been successfully used in a wide
range of applications in computational biology [19]. The theory of
SVM has been extensively reviewed elsewhere [20] and will only
be briefly discussed here. The key point of SVM is to treat the
objects that are to be classified as points in a high-dimensional
space and to find a line (hyperplane) that separates them.
Molecules are presented in the space with the help of molecular
descriptors. The margin of the hyperplane is defined as the
distance from the separating hyperplane to the nearest data point
and SVM finds the maximum margin separating the hyperplane.
The selection of this hyperplane maximizes the capability of SVM
to predict the correct classification of new compounds. There are
other hyperplane-based classification methods; however, SVM is
distinct from them in the way how the hyperplane is selected.
SVM is a mathematical entity, an algorithm used for maximizing a
mathematical function with respect to collection of data. Since the
SVM method is an excellent tool particularly for classification
problems in chemometrics [21], it has been used to classify
molecules as substrates or non-substrates of enzymes. For example,
Mishra et al. developed an SVM-based web server for predicting
the metabolizing capability of major isoforms of cytochrome P450
enzymes [22]. Likewise, SVM has also been used to predict P-gp
substrates. Xue et al. used SVM and reported a prediction
accuracy of 81% for P-gp substrates and 79% for non-substrates
[23]. Huang et al. applied SVM optimized by a particle swarm
and reported a prediction accuracy of 90% for P-gp substrates
[24]. Most recently, Wang et al. developed several models using
SVM based on a large training set of 212 compounds (131 P-gp
substrates and 81 non-substrates), and the best model gave a
prediction accuracy of 88% for a test set of 120 compounds [25].
It is important to note that the current in silico models are not
readily available to experimental scientists, and hence do not
significantly aid in the design of experiments for scientists who do
not have access to these models. The goal of this study was to
develop a predictive model and a free web server that can be used
for in silico prediction of binding and transport characteristics of P-
gp substrates for the scientific community. We have recently
developed a similar system for evaluation of drug-human serum
albumin binding interactions [26]. As discussed above, ligand-
based and protein structure-based prediction methods are
complementary to each other – that is, ligand-based methods
may give a high prediction accuracy for given classes of drugs or
drug candidates, while molecular docking calculations provide
atomic details on protein-ligand interactions. Therefore, in the
present study, both ligand-based (SVM) and P-gp structure-based
(molecular docking) in silico methods were used for predicting P-gp-
mediated transport and complex geometry. These prediction
methods have now been integrated into a free web server (http://
pgp.althotas.com). This web-based platform enables the users to
predict the capability of P-gp to transport the query ligands and
the complex geometries in the inward-facing conformation of
human and mouse P-gp calculated using molecular docking tools.
Methods
Data SetP-gp substrates and non-substrates used in this study were
primarily taken from four compilations previously published
[10,27,28,29], which contain structurally diverse compounds. A
number of compounds from other sources were also included in
order to further increase molecular diversity of the data set. It should
be noted that a number of contradictions exist in the literature in
classification of compounds as P-gp substrates or non-substrates,
which are discussed in details in the Results and Discussion section.
Finally, 197 compounds (99 P-gp substrates and 98 non-substrates)
were selected in our data set. 32 compounds were defined as ‘‘the
external validation set’’ containing 16 P-gp substrates and 16 non-
substrates and was set up for evaluation of prediction power with no
bias as follows. Each compound was placed into n-dimensional
space defined by the calculated molecular descriptors (see below).
Correlation of the descriptors was used to calculate molecular
similarity. The molecular space of P-gp substrates or non-substrates
Predicting P-gp-Mediated Drug Transport
PLoS ONE | www.plosone.org 2 October 2011 | Volume 6 | Issue 10 | e25815
was then divided into 16 subsets and one molecule was randomly
selected from each of these subsets to form the external validation
set. All the compounds in the data sets are listed in Table S1.
Support Vector Machine (SVM)Structures of all P-gp substrates or non-substrates in the data
sets were downloaded from the PubChem Database (http://
pubchem.ncbi.nlm.nih.gov). All molecules were subjected to
geometry optimization using the Molconvert software (Che-
mAxon, Budapest, Hungary), which applies the Dreiding molec-
ular mechanics force field, and to calculation of the Gasteiger
partial charges [30]. The DragonX software (www.talete.mi.it) was
used to calculate a total of 3250 molecular descriptors for each
molecule. The descriptors with .80% zero values and too small
standard deviation values (less than 3%) were eliminated. The
Libsvm software (www.csie.ntu.edu.tw/,cjlin/libsvm) was then
used for SVM calculations. Linear, polynomial, and radial basis
function (RBF) kernels were tested in the course of the study. The
average Matthews coefficient of the external set based on 100
independent SVM calculations was 0.53, 0.18 or 0.54 using linear,
polynomial or Gaussian RBF kernel, respectively. Therefore, in
our SVM calculations, a Gaussian RBF was chosen as the kernel
function:
K(xi, xj)~exp(- jjxi-xjjj2)
where c is a kernel width parameter, xi and xj are instance label
pairs, and K is the kernel function. In the training process, the
regularization parameter ‘C’ and the kernel width parameter ‘c’
were optimized using a grid search approach. The prediction
power of SVM is greatly influenced by the selection of kernel and
the parameters C and c. The best combination of C and c was
selected by a grid-search with exponentially growing sequences of
C and c. Each combination of parameter choices was checked
using cross validation, and the parameters with best cross-
validation accuracy were selected. After the best parameters C
and c were found, the whole training set was trained again to
generate the final model. The feature selection tool fselect.py
(http://www.csie.ntu.edu.tw/,cjlin/libsvmtools) provided by the
Libsvm developer was used to measure the relative importance of
each feature. For each feature, an F-score can be calculated using
fselect.py. Generally, the larger the F-score, the more likely the
feature is discriminative. Therefore, this score was used as a
feature selection criterion. Features with high F-scores were
selected and then SVM was applied. High-F-score features were
gradually added until the validation accuracy decreased. Descrip-
tors were checked for their correlation. Among the descriptors
with a correlation of .0.9, the descriptors with higher F-scores
were kept for further SVM calculations. One hundred SVM
calculations were run using the training data set, trained, and
validated by cross-validation in such a way that a test set with a
data size comparable to that of the external validation set was
generated (i.e. a ratio of the training set to the test set of 0.8 was
chosen, generating test sets of 33 compounds).
Prediction power of the above SVM method was evaluated
based on the number of true positive (TP), true negative (TN), false
positive (FP), and false negative (FN) predictions. Additional widely
used parameters, namely accuracy (ACC), sensitivity (SE),
specificity (SP) as well as the Matthews correlation coefficient
(MCC) were also calculated using the equations given below [31].
ACC~(TPzTN)=(TPzTNzFPzFN)|100
SE~TP=(TPzFN)|100
SP~TN=(FPzTN)|100
MCC~(TP|TN{FP|FN)
=½(TPzFN)(TPzFP)(TNzFP)(TNzFN)� 1=2
Prediction power is a measure of true hits in the entire
calculations with both P-gp substrates and non-substrates
included, whereas sensitivity and specificity reflect the prediction
accuracies for P-gp substrates and non-substrates, respectively.
The Matthews correlation coefficient considers over and under
prediction and often provides a much more balanced evaluation of
prediction than, for example, accuracy. MCC = 1 means a perfect
prediction, whereas MCC = 0 indicates a random prediction.
Homology modelingThe primary sequence of human P-gp was taken from Universal
Protein Resource (http://www.uniprot.org) with the accession
code P08183. For homology modeling of human P-gp, the X-ray
structure of mouse P-gp (PDB code 3G60) was used as a template.
The X-ray structure of the template was downloaded from the
Protein Data Bank (http://www.rcsb.org). A sequence alignment
between mouse and human P-gp was performed using ClustalW
[32]. The alignment – as mouse and human P-gp share 87%
sequence identity – was the same as that in previously published
models [33]. Three-dimensional (3D) atomic models comprising all
non-hydrogen atoms were generated by the Modeller9.8 package
[34] using the refine.very slow option for simulated annealing. A
bundle of ten models from random generation of the starting
structures were calculated. The model possessing the lowest DOPE
score was chosen for docking calculations. The quality of the model
was evaluated using Procheck [35]. Ramachandran plot showed
that 97% of the residues fell into the allowed region. The backbone
root mean square deviation (RMSD) between the mouse P-gp
template and the human P-gp model was 0.63 A.
Molecular dockingMolecular docking calculations were carried out using the
Autodock Vina software [36] integrated in the Molecular Docking
Server (http://www.dockingserver.com) [37]. Structures of the
query ligands were optimized using the Dreiding force field
integrated in the Molconvert program of ChemAxon (ChemAxon,
Budapest, Hungary). Gasteiger partial charges were calculated on
ligand atoms [30]. The X-ray structure of mouse P-gp (PDB code
3G60) and our human P-gp model were used for docking
calculations. Polar hydrogen atoms were added to P-gp and
Gasteiger partial charges were calculated using Autodock Tools.
Water molecules and heteroatoms were removed from the
structures, since water is implicitly included in Autodock.
Simulation boxes were centered on ligands in the structures of
P-gp-ligand complexes. A simulation box of 22622622 A was
used in each docking calculation with an exhaustiveness option of
8 (average accuracy).
The web serverA free web server (http://pgp.althotas.com) has been developed
based on the SVM and molecular docking methods described
Predicting P-gp-Mediated Drug Transport
PLoS ONE | www.plosone.org 3 October 2011 | Volume 6 | Issue 10 | e25815

above. This web server allows the users to predict whether a query
ligand may be a P-gp substrate, its binding property, and the
geometry of P-gp-ligand complex. The Autodock Vina software was
integrated in the web server for complex geometry calculations. The
server was developed with PHP-MySQL and several external
programs. The chemical structure of a query ligand can be
uploaded or drawn in by the users using the built-in Chemaxon
Marvin Java applet. The web server is linked to Pubchem so that
ligands can be directly retrieved with text search. Structural
conversions and 3D geometry optimization by the Dreiding method
are carried out using the Molconvert software. 2-dimensional and 3-
dimensional molecular descriptors are calculated using the
DragonX software. The built-in SVM model of this study is used
to predict P-gp substrates. The geometry of P-gp-ligand complex is
predicted by docking calculations using the Autodock Vina
algorithm [36] integrated in the web server. The X-ray structures
of mouse P-gp (PDB codes 3G60 and 3G61) and the homology
model of human P-gp are integrated in the web server.
Results and Discussion
SVM CalculationsSVM has some advantages – that is, it can treat both linear and
non-linear data sets, and can be used for both classification and
regression analysis; and the results can be easily interpreted. The
method has gained popularity in a wide variety of biochemical
applications, because it can be used for classification of small
molecules on a given biological target [19]. Basically, compounds
are represented with N calculated properties in the N dimensional
space and the main task of an SVM calculation is to find a
hyperplane in this space capable of separating the active molecules
from the non-active ones. In order to build a reliable model, data
selection is crucial in SVM. There are a number of experimental
methods for determining P-gp substrate properties. The results of
the different experimental methods might contradict. Stimulation of
ATPase activity may be taken as an indication of direct interaction
with P-gp. However, daunorubicin, which is an excellent P-gp
substrate, does not significantly stimulate ATPase activity of P-gp,
while verapamil and vincristine, also P-gp substrates, stimulate it
well [10]. The MDCK cell monolayer model shows a net difference
in substrate concentration between the apical and basal compart-
ments only if the substrates are transported by P-gp at a rate that is
higher than that of reuptake into cells (carrier mediated or passive
diffusion). In direct drug binding studies, even if the binding affinity
is high (low kd values), the compounds may still not be well
transported because the ratio between association (Kon) and
dissociation (Koff) rates may be unfavorable. Moreover, different
experimental conditions (e.g., pH and temperature) besides different
methods used in determining substrate properties in different studies
could also result in conflicting results for the same compounds. All
the above factors often led to contradictions in the literature as to
whether certain compounds are P-gp substrates or non-substrates.
For example, yohimbine was considered as a P-gp substrate by
Seelig [27], but was not classified as a P-gp substrate by Varma et al.
[28]. Doxorubicin was considered as a non-substrate [10,28], but
was found to be transported by P-gp in other studies [38]. Similar
situation exists for trazodone (non-substrate [10,28] and substrate
[16]) and venlaflaxine (non-susbtrate [39] and substrate [40]).
Lidocaine, lovastatine, propranolol, and itraconazole were charac-
terized to be non-substrates by Varma et al. [28] and Polli et al.
[10], and simvastatine was characterized to be a non-substrate by
Susanto et al. [41]; however, these compounds were all published as
P-gp substrates or inhibitors in Pharmacology Weekly. Therefore, if
the ability of compounds to be net-transported or have a high
binding affinity, or the ability of compounds to stimulate ATPase
activity is used synonymously to evaluate whether the compounds
are P-gp substrates or non-substrates, this can lead to conflicting
results on certain compounds and compromise correct classification
in the training and validation data sets. Thus, in our data sets, a
compound that had conflicting reports in the literature was treated
as a P-gp substrate or non-substrate only if more independent
studies confirmed its classification. We indicated the assay methods
used to identify these compounds as P-gp substrates or non-
substrates and references in Table S1.
SVM prediction of P-gp substrates or non-substrates was carried
out by means of 100-fold cross-validation. Cross-validation serves
two purposes: i) estimation of prediction power of the models
generated, i.e. approximation of the general character of the
models; and ii) comparison of prediction performance of the
models and identification of the ‘best model’ for available data sets.
The choice of the kernel is crucial in SVM calculations. Therefore,
linear, polynomial, and Gaussian RBF kernels were tested in
preliminary calculations. Our results showed that the average
Matthews coefficient of the external set based on 100 independent
SVM calculations (different ligand sets were used as the training
and test data set in different runs) was 0.53, 0.18 or 0.54 using
linear, polynomial or Gaussian RBF kernel, respectively. This is
consistent with the results of previous P-gp SVM studies in which
RBF was suggested as a reasonable choice [23,24,25]. Thus, the
Gaussian RBF kernel was used throughout this study. The mean
values of SVM prediction performance parameters of the 100 runs
are presented in Table 1. These data indicate that the average
accuracy of prediction for an external validation data set is near
80%. Note that specificity (SP) and sensitivity (SE) values are very
close to each other (Table 1), indicating that the prediction for P-
gp substrates and non-substrates is not discriminative, i.e. the
model does not have preference for a random ligand to be a
substrate or non-substrate. We did not compare our prediction
results with those reported by others regarding prediction
performance because such a direct comparison seems not
appropriate due to large differences in compounds collected in
data sets and data size. Nonetheless, Huang et al. [24] and Wang
et al. [25] noticed that the prediction accuracy varied between 63
and 90% in 7 previous studies, and four of the studies gave a
prediction accuracy of approximately 80%, which is comparable
to that of this study.
There is no general rule concerning the selection of ‘‘the best
model’’. An obvious approach would be to select the model which
provides the highest prediction accuracy for the training data set.
However, this approach could be misleading because a model with
the highest accuracy for a training data set does not necessarily
give the highest accuracy for an independent external data set. For
example, one of our models gave an accuracy of 94% for the
training set and 75% for the test and external data sets. It is
Table 1. The mean values of SVM prediction performanceparameters of 100 runs.
Data Set ACC SP SE MCC
Training 80 81 79 0.6064
Test 75 75 75 0.5117
External 76 77 74 0.5176
ACC, SP, SE, and MCC are accuracy, specificity, sensitivity, and the Matthewscorrelation coefficient, respectively.doi:10.1371/journal.pone.0025815.t001
Predicting P-gp-Mediated Drug Transport
PLoS ONE | www.plosone.org 4 October 2011 | Volume 6 | Issue 10 | e25815

therefore necessary to take prediction accuracies for both the
training and test sets into account when the ‘‘best model’’ is to be
selected. Hence, the differences in prediction accuracies between
the training and test data sets were calculated, and the models with
the smallest differences (below 5%) were selected. We obtained 6
models using this criterion, and the prediction performance
parameters of the 6 ‘‘best models’’ are summarized in Table S2. A
large difference can be observed between specificity and sensitivity
in the test set in models 1–4, indicating an overfitting of the
models. These models contain a larger number of descriptors (48
descriptors in models 1–3 and 12 descriptors in model 4)
compared to models 5 and 6 (6 descriptors). Indeed, it is known
that the inclusion of too many descriptors in the SVM model
decreases the accuracy of the performance for two reasons. First,
the inclusion of too many descriptors may produce overfitted
models. Second, the inclusion of unnecessary or irrelevant
descriptors creates noise in the model. Thus, the model with the
smallest number of descriptors and the highest MCC value for the
external validation set was selected as the final model, which is the
model 5 (Table S2). We noted that classification of individual
compounds in the independent external data set as P-gp substrates
or non-substrates were very similar in these models. The
predictions of the external data set by the above-mentioned 6
best models are indicated in Table S3. Among the external data
set of 32 molecules, twenty-three compounds were classified
correctly by each model (Figures 1 and 2), and 6 compounds
Figure 1. SVM prediction results for compounds in the external validation data set. Shown are chemical structures of the correctlypredicted P-gp substrates by all the 6 best models.doi:10.1371/journal.pone.0025815.g001
Predicting P-gp-Mediated Drug Transport
PLoS ONE | www.plosone.org 5 October 2011 | Volume 6 | Issue 10 | e25815

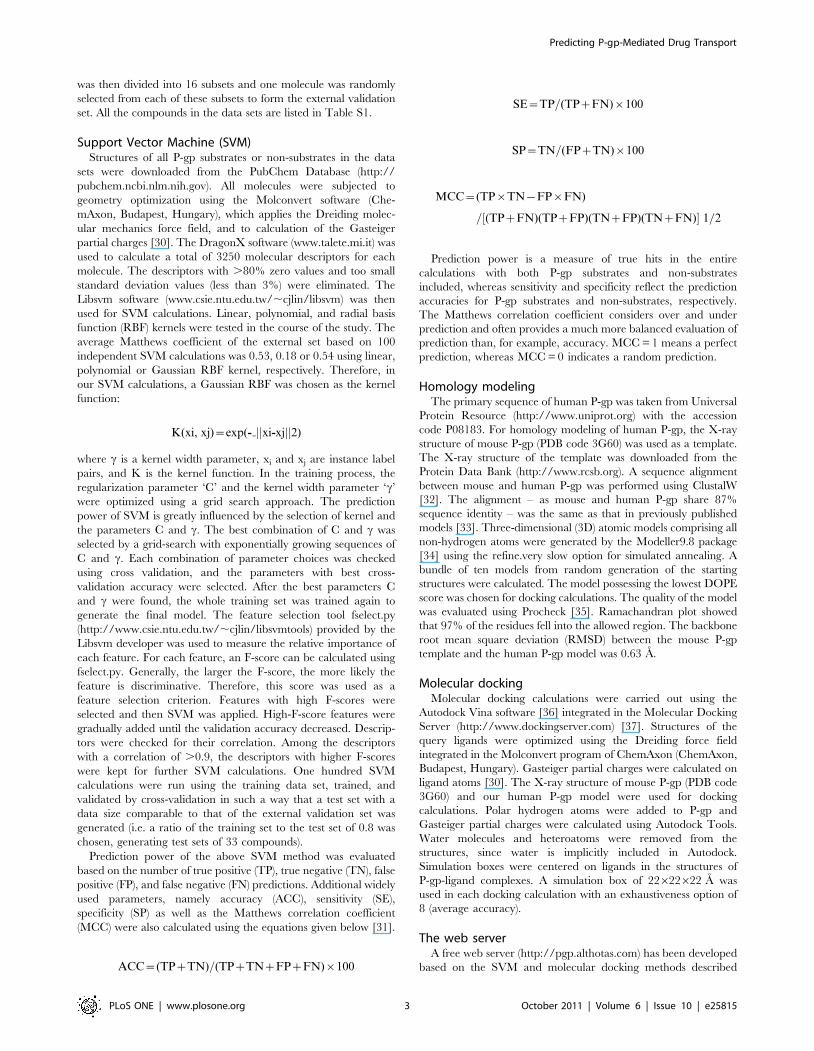
(chloroquine, estriol, L-glutamic acid, doxapram, itraconazole,
and narcotine) were misclassified unambiguously by all the 6
models (Figure 3). We note that all the unambiguously
misclassified substrates are relatively small in size, whereas the
misclassified non-substrates possess larger molecular weights
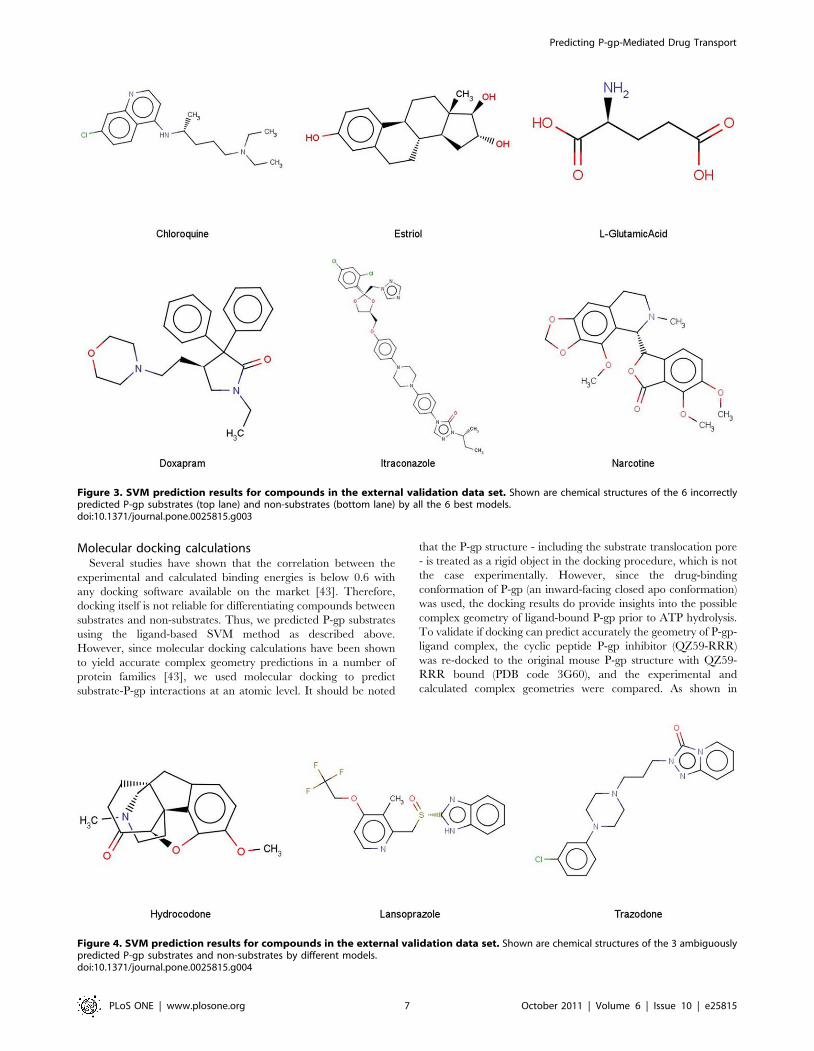
(Figure 3). Only 3 compounds (lansoprazole, hydrocodone, and
trazodone) were not uniformly predicted as P-gp substrates or non-
substrates by the 6 models (Figure 4).
The final model (the model 5) is based on the following
descriptors: ATS1m (Broto-Moreau autocorrelation of a topolog-
ical structure-lag 1/weighted by atomic masses), EEig12x
(Eigenvalue 12 from edge adj. matrix weighted by edge degrees),
ESpm02d (Spectral moment 02 from edge adj. matrix weighted by
dipole moments), BELv6 (lowest eigenvalue n. 6 of Burden
matrix/weighted by atomic van der Waals volumes), BELe6
(lowest eigenvalue n. 6 of Burden matrix/weighted by atomic
Sanderson electronegativities), BELp6 (highest eigenvalue n. 6 of
Burden matrix/weighted by atomic polarizabilities). These
descriptors are well suited to quantify transport properties relevant
to P-gp substrates. This is manifested by the fact that the descriptor
values are weighted by the atomic mass (ATS1m), the size
(BELv6), the polarizibility and logP (BELp6), electronegativity
(BELe6), and dipole moment (ESpm02d) of the ligands of the data
set. Our findings are consistent with previous SVM studies,
namely, it has been showed that 60% of the molecular descriptors
important for P-gp substrates are of topological nature [42]. The
X-Ray structure of mouse P-gp reveals a large hydrophobic
binding site packed with a number of aromatic residues. Thus,
substrate binding seems to be a result of a combination of
hydrophobic, aromatic, and electrostatic interactions. The pres-
ence of aromatic residues in the binding pocket explains the role of
polarizability and logP in the descriptors.
Figure 2. SVM prediction results for compounds in the external validation data set. Shown are chemical structures of the correctlypredicted non-substrates of P-gp by all the 6 best models.doi:10.1371/journal.pone.0025815.g002
Predicting P-gp-Mediated Drug Transport
PLoS ONE | www.plosone.org 6 October 2011 | Volume 6 | Issue 10 | e25815
Molecular docking calculationsSeveral studies have shown that the correlation between the
experimental and calculated binding energies is below 0.6 with
any docking software available on the market [43]. Therefore,
docking itself is not reliable for differentiating compounds between
substrates and non-substrates. Thus, we predicted P-gp substrates
using the ligand-based SVM method as described above.
However, since molecular docking calculations have been shown
to yield accurate complex geometry predictions in a number of
protein families [43], we used molecular docking to predict
substrate-P-gp interactions at an atomic level. It should be noted
that the P-gp structure - including the substrate translocation pore
- is treated as a rigid object in the docking procedure, which is not
the case experimentally. However, since the drug-binding
conformation of P-gp (an inward-facing closed apo conformation)
was used, the docking results do provide insights into the possible
complex geometry of ligand-bound P-gp prior to ATP hydrolysis.
To validate if docking can predict accurately the geometry of P-gp-
ligand complex, the cyclic peptide P-gp inhibitor (QZ59-RRR)
was re-docked to the original mouse P-gp structure with QZ59-
RRR bound (PDB code 3G60), and the experimental and
calculated complex geometries were compared. As shown in
Figure 3. SVM prediction results for compounds in the external validation data set. Shown are chemical structures of the 6 incorrectlypredicted P-gp substrates (top lane) and non-substrates (bottom lane) by all the 6 best models.doi:10.1371/journal.pone.0025815.g003
Figure 4. SVM prediction results for compounds in the external validation data set. Shown are chemical structures of the 3 ambiguouslypredicted P-gp substrates and non-substrates by different models.doi:10.1371/journal.pone.0025815.g004
Predicting P-gp-Mediated Drug Transport
PLoS ONE | www.plosone.org 7 October 2011 | Volume 6 | Issue 10 | e25815

Figure 5, QZ59-RRR was docked to the experimentally
determined structure of mouse P-gp with a high accuracy with a
RMSD value of 1.27 A, thus confirming the capability of docking
calculations to predict P-gp-ligand complex geometry. Obviously,
the side chains of P-gp residues are appropriately oriented for
QZ59-RRR, which is not the case for other compounds. Therefore,
docking calculations of other ligands are expected to yield lower
prediction accuracies than this validation with QZ59-RRR.
We next investigated whether docking calculations to our
homology model of human P-gp can predict complex geometry. In
the modeling, mouse P-gp was used as a template. As human and
mouse P-gp share 87% amino acid identity, a reliable homology
model of human P-gp can be built with simple modeling
procedure. This high sequence identity makes the sequence
alignment obvious (data not shown). Indeed, recent studies have
revealed identical sequence alignments in developing homology
models of human P-gp [44]. The inward-facing closed apo
conformation of P-gp has been used to predict residues that are
experimentally implicated in drug transport and demonstrate that
P-gp has a high affinity for drug substrates [45].
To validate our homology model of human P-gp, rhodamine B,
a known P-gp substrate with experimental binding data available
was docked to our human P-gp model. Rhodamine B is a highly
hydrophobic compound and a well-characterized P-gp substrate
[46]. It was included in our SVM training set and was correctly
predicted to be a P-gp substrate by our SVM model. Since
numerous studies have shown that the drug-binding cavity in P-gp
is primarily formed by TM helices [11,47], we anticipate that
rhodamine B would most likely bind to P-gp in the MSD through
hydrophobic interactions. Indeed, such interactions and location
of the rhodamine B binding site in P-gp can be directly visualized
by docking calculations (Figure 6). Rhodamine B may interact
with the following aromatic residues that form a binding pocket:
Phe72, Phe336, Phe728, Phe732, Tyr307, and Tyr310. These
residues may have hydrophobic interactions with the hydrophobic
side chains of rhodamine B as well as pi-pi interactions with the
aromatic ring system of the compound. Hydrophobic side chains
of other residues, namely Leu975, Val981 and Val982, are also
possibly within the interacting distance. Additionally, two cation-pi
interactions were observed between the two positively charged
nitrogens of rhodamine B and Phe728 and Tyr307. The
carboxylate side chain of rhodamine B could form a double
hydrogen bond with the hydroxyl groups of Tyr307 and Tyr310.
These results of docking calculations appear to be consistent with
experimental data. For example, activities of the human P-gp
mutants, I340C (in TM6), L975C (in TM12), V981C (in TM12),
and V982C (in TM12), were found to be highly protected from
inhibition by MTS-rhodamine by pre-treatment with rhodamine
B, indicating that these residues likely participate in rhodamine B
binding to human P-gp [48]. It is important to note that several
binding residues for rhodamine B identified in this study (e.g.,
Phe336/(Ile in mouse P-gp), Phe728, and Leu975 (Ser in mouse P-
gp) were the same or proximate to the binding residues for ligands
such as QZ59-RRR identified in the X-ray structure of mouse P-
gp [11] which served as the template for the human P-gp model,
suggesting that these hydrophobic ligands may occupy distinct, but
overlapping binding sites or bind to different regions within the
same binding site in the large drug-binding cavity.
A free web serverTo make the SVM and docking methods publicly available, we
have developed a free web server (http://pgp.althotas.com) which
enables the users to predict if a compound is a P-gp substrate, as well
as its complex geometry in P-gp. The PubChem database is
integrated so that any compounds can be searched and submitted
by their names. With this web server, any molecule of interest can be
searched by its name, uploaded in PDB, mol, mol2, hin, or SMILES
format or drawn in using a Marvin applet by the users. After
submitting the molecule, the web server performs: i) SVM
prediction for P-gp substrate; ii) identification of physicochemical
parameters of the ligand such as molecular weight, logP, and
polarizability; and iii) docking calculations for predicting the
complex geometry, docking energy, and interaction surface of the
ligand in the structure of mouse P-gp and the homology model of
human P-gp.
In summary, P-gp confers multidrug resistance in cancer cells
[1,3], and is also involved in clinically relevant drug disposition
and drug-drug interactions [6]. Therefore, to evaluate the
pharmacokinetics, safety, and efficacy of drugs or NMEs, it is of
important value to predict whether they are P-gp substrates and
how they might interact with P-gp, which, at present, remains
largely unknown. As an effort to address this issue, in the present
study, we have applied an SVM method to predict potential P-gp
substrates based on a relatively large data set of 197 known P-gp
substrates and non-substrates. This SVM method showed a
prediction accuracy of ,80% in an independent external data
set of 32 compounds. The selected descriptors were related to
molecular properties such as molecular weight, electronegativity
and polarizability. Since the 3D crystal structures of mouse P-gp
with or without ligands are already available [11], homology
model of human P-gp was constructed and interactions of P-gp
substrates with particular residues in the transporter could be
investigated by molecular docking calculations. We have shown,
by the example of rhodamine B, a known P-gp substrate, that
molecular docking calculations can predict the complex geometry
in an internal drug-binding cavity of P-gp that is consistent with
experimental data. Therefore, SVM prediction and molecular
docking calculations may prove valuable for prediction of P-gp
substrates as well as analysis of P-gp-substrate interactions at the
molecular level, and hence facilitate both rational drug design and
Figure 5. The Docking of QZ59-RRR to P-gp. Docking of QZ59-RRRto the X-ray structure of P-gp-QZ59-RRR complex (PDB code: 3G60) wasperformed using the Autodock Vina algorithm to validate the accuracyof docking calculations. The geometry of P-gp-QZ59-RRR complexobtained by docking calculations (yellow carbons) was compared withthat of the P-gp-QZ59-RRR complex in the X-ray structure (bluecarbons). Potential binding residues of P-gp for QZ59-RRR in theinternal cavity are indicated.doi:10.1371/journal.pone.0025815.g005
Predicting P-gp-Mediated Drug Transport
PLoS ONE | www.plosone.org 8 October 2011 | Volume 6 | Issue 10 | e25815

screening. This approach is particularly useful and cost-effective in
the early drug discovery stage. To make the prediction methods
described in this study available to the large scientific community,
a free web server (http://pgp.althotas.com) has been developed
which integrates both the SVM prediction and molecular docking
calculations. To the best of our knowledge, this is the first free web
server for predicting P-gp-mediated drug transport and complex
geometry.
Supporting Information
Table S1 P-gp substrates (class 1) and non-substrates(class 0) in the training or test (t) and the independentexternal validation (e) data sets used for SVM prediction.(DOCX)
Table S2 SVM prediction performance parameters ofthe 6 best models.
(DOCX)
Table S3 Prediction results in the external validationdata set by the 6 best models.
(DOCX)
Author Contributions
Conceived and designed the experiments: ZB EH QM. Performed the
experiments: ZB IH DM KJ ZV PH EH. Analyzed the data: ZB IH DM
KJ ZV PH ZN TWL DMC EH QM. Contributed reagents/materials/
analysis tools: KJ ZV. Wrote the paper: ZB IH TWL ZN DMC EH QM.
References
1. Sauna ZE, Kim IW, Ambudkar SV (2007) Genomics and the mechanism of P-
glycoprotein (ABCB1). J Bioenerg Biomembr 39: 481–487.
2. Ueda K, Cardarelli C, Gottesman MM, Pastan I (1987) Expression of a full-
length cDNA for the human ‘‘MDR1’’ gene confers resistance to colchicine,
doxorubicin, and vinblastine. Proc Natl Acad Sci U S A 84: 3004–3008.
3. Ambudkar SV, Kimchi-Sarfaty C, Sauna ZE, Gottesman MM (2003) P-
glycoprotein: from genomics to mechanism. Oncogene 22: 7468–7485.
4. Kim RB, Fromm MF, Wandel C, Leake B, Wood AJ, et al. (1998) The drug
transporter P-glycoprotein limits oral absorption and brain entry of HIV-1
protease inhibitors. J Clin Invest 101: 289–294.
5. Lee CG, Gottesman MM, Cardarelli CO, Ramachandra M, Jeang KT, et al.
(1998) HIV-1 protease inhibitors are substrates for the MDR1 multidrug
transporter. Biochemistry 37: 3594–3601.
6. Giacomini KM, Huang SM, Tweedie DJ, Benet LZ, Brouwer KL, et al. (2010)
Membrane transporters in drug development. Nat Rev Drug Discov 9: 215–
236.
7. Adachi Y, Suzuki H, Sugiyama Y (2001) Comparative studies on in vitro
methods for evaluating in vivo function of MDR1 P-glycoprotein. Pharm Res
18: 1660–1668.
8. Balimane PV, Patel K, Marino A, Chong S (2004) Utility of 96 well Caco-2 cell
system for increased throughput of P-gp screening in drug discovery. Eur J Pharm
Biopharm 58: 99–105.
9. Perloff MD, Stormer E, von Moltke LL, Greenblatt DJ (2003) Rapid assessment
of P-glycoprotein inhibition and induction in vitro. Pharm Res 20: 1177–1183.
10. Polli JW, Wring SA, Humphreys JE, Huang L, Morgan JB, et al. (2001) Rational
use of in vitro P-glycoprotein assays in drug discovery. J Pharmacol Exp Ther
299: 620–628.
11. Aller SG, Yu J, Ward A, Weng Y, Chittaboina S, et al. (2009) Structure of P-
glycoprotein reveals a molecular basis for poly-specific drug binding. Science
323: 1718–1722.
12. Penzotti JE, Lamb ML, Evensen E, Grootenhuis PD (2002) A computationalensemble pharmacophore model for identifying substrates of P-glycoprotein.
J Med Chem 45: 1737–1740.
13. Chang C, Bahadduri PM, Polli JE, Swaan PW, Ekins S (2006) Rapididentification of P-glycoprotein substrates and inhibitors. Drug Metab Dispos
34: 1976–1984.
14. de Cerqueira Lima P, Golbraikh A, Oloff S, Xiao Y, Tropsha A (2006)Combinatorial QSAR modeling of P-glycoprotein substrates. J Chem Inf Model
46: 1245–1254.
15. Cabrera MA, Gonzalez I, Fernandez C, Navarro C, Bermejo M (2006) Atopological substructural approach for the prediction of P-glycoprotein
substrates. J Pharm Sci 95: 589–606.
16. Wang YH, Li Y, Yang SL, Yang L (2005) Classification of substrates and
inhibitors of P-glycoprotein using unsupervised machine learning approach.J Chem Inf Model 45: 750–757.
17. Kaiser D, Terfloth L, Kopp S, Schulz J, de Laet R, et al. (2007) Self-organizing
maps for identification of new inhibitors of P-glycoprotein. J Med Chem 50:1698–1702.
18. Zhang L, Balimane PV, Johnson SR, Chong S (2007) Development of an in
silico model for predicting efflux substrates in Caco-2 cells. Int J Pharm 343:98–105.
19. Noble WS (2004) Support vector machine applications in computational
biology. In: Schoelkopf B, Tsuda K, Vert J-P, eds. Kernel methods incomputational biology. CambridgeMA: MIT Press. pp 71–92.
20. Vapnik VN (1995) The nature of statistical learning theory. New York, USA:
Springer-Verlag New York.
21. Luts J, Ojeda F, Van de Plas R, De Moor B, Van Huffel S, et al. (2010) Atutorial on support vector machine-based methods for classification problems in
chemometrics. Anal Chim Acta 665: 129–145.
22. Mishra NK, Agarwal S, Raghava GP (2010) Prediction of cytochrome P450
isoform responsible for metabolizing a drug molecule. BMC Pharmacol 10: 8.
Figure 6. Location of rhodamine B in P-gp and the geometry of the P-gp-rhodamine B complex. Docking of rhodamine B to the X-raystructure of P-gp (PDB code: 3G60) was performed using the Autodock Vina software. A. Location of rhodamine B (blue carbons) in the internal cavityof the inward-facing from of P-gp. B. The geometry of the P-gp-rhodamine B (blue carbons) complex. Potential binding residues of P-gp forrhodamine B in the internal cavity are indicated.doi:10.1371/journal.pone.0025815.g006
Predicting P-gp-Mediated Drug Transport
PLoS ONE | www.plosone.org 9 October 2011 | Volume 6 | Issue 10 | e25815

23. Xue Y, Yap CW, Sun LZ, Cao ZW, Wang JF, et al. (2004) Prediction of P-
glycoprotein substrates by a support vector machine approach. J Chem InfComput Sci 44: 1497–1505.
24. Huang J, Ma G, Muhammad I, Cheng Y (2007) Identifying P-glycoprotein
substrates using a support vector machine optimized by a particle swarm. J ChemInf Model 47: 1638–1647.
25. Wang Z, Chen Y, Liang H, Bender A, Glen R, et al. (2011) P-glycoproteinSubstrate Models Using Support Vector Machines Based on a Comprehensive
Dataset. J Chem Inf Model, Epub ahead of print.
26. Zsila F, Bikadi Z, Malik D, Hari P, Pechan I, et al. (2011) Evaluation of drug-human serum albumin binding interactions with support vector machine aided
online automated docking. Bioinformatics, Epub ahead of print.27. Seelig A (1998) A general pattern for substrate recognition by P-glycoprotein.
Eur J Biochem 251: 252–261.28. Varma MV, Sateesh K, Panchagnula R (2005) Functional role of P-glycoprotein
in limiting intestinal absorption of drugs: contribution of passive permeability to
P-glycoprotein mediated efflux transport. Mol Pharm 2: 12–21.29. Mahar Doan KM, Humphreys JE, Webster LO, Wring SA, Shampine LJ, et al.
(2002) Passive permeability and P-glycoprotein-mediated efflux differentiatecentral nervous system (CNS) and non-CNS marketed drugs. J Pharmacol Exp
Ther 303: 1029–1037.
30. Gasteiger J, Marsili M (1980) Iterative Partial Equalization of OrbitalElectronegativity - a Rapid Access to Atomic Charges. Tetrahedron 36:
3219–3228.31. Baldi P, Brunak S, Chauvin Y, Andersen CA, Nielsen H (2000) Assessing the
accuracy of prediction algorithms for classification: an overview. Bioinformatics16: 412–424.
32. Thompson JD, Higgins DG, Gibson TJ (1994) CLUSTAL W: improving the
sensitivity of progressive multiple sequence alignment through sequenceweighting, position-specific gap penalties and weight matrix choice. Nucleic
Acids Res 22: 4673–4680.33. Tarcsay A, Keseru GM (2011) Homology modeling and binding site assessment
of the human P-glycoprotein. Future Med Chem 3: 297–307.
34. Sali A, Blundell TL (1993) Comparative protein modelling by satisfaction ofspatial restraints. J Mol Biol 234: 779–815.
35. Laskowski RA, Macarthur MW, Moss DS, Thornton JM (1993) Procheck - aProgram to Check the Stereochemical Quality of Protein Structures. Journal of
Applied Crystallography 26: 283–291.36. Trott O, Olson AJ (2010) AutoDock Vina: improving the speed and accuracy of
docking with a new scoring function, efficient optimization, and multithreading.
J Comput Chem 31: 455–461.
37. Bikadi Z, Hazai E (2009) Application of the PM6 semi-empirical method of
modeling proteins enhances docking accuracy of AutoDock. Journal of
Cheminformatics 1: 15.
38. van der Sandt IC, Blom-Roosemalen MC, de Boer AG, Breimer DD (2000)
Specificity of doxorubicin versus rhodamine-123 in assessing P-glycoprotein
functionality in the LLC-PK1, LLC-PK1:MDR1 and Caco-2 cell lines.
Eur J Pharm Sci 11: 207–214.
39. Feng B, Mills JB, Davidson RE, Mireles RJ, Janiszewski JS, et al. (2008) In vitro
P-glycoprotein assays to predict the in vivo interactions of P-glycoprotein with
drugs in the central nervous system. Drug Metab Dispos 36: 268–275.
40. Uhr M, Grauer MT, Holsboer F (2003) Differential enhancement of
antidepressant penetration into the brain in mice with abcb1ab (mdr1ab) P-
glycoprotein gene disruption. Biol Psychiatry 54: 840–846.
41. Susanto M, Benet LZ (2002) Can the enhanced renal clearance of antibiotics in
cystic fibrosis patients be explained by P-glycoprotein transport? Pharm Res 19:
457–462.
42. Xue Y, Li ZR, Yap CW, Sun LZ, Chen X, et al. (2004) Effect of molecular
descriptor feature selection in support vector machine classification of
pharmacokinetic and toxicological properties of chemical agents. J Chem Inf
Comput Sci 44: 1630–1638.
43. Warren GL, Andrews CW, Capelli AM, Clarke B, LaLonde J, et al. (2006) A
critical assessment of docking programs and scoring functions. J Med Chem 49:
5912–5931.
44. Klepsch F, Chiba P, Ecker GF (2011) Exhaustive sampling of docking poses
reveals binding hypotheses for propafenone type inhibitors of p-glycoprotein.
PLoS Comput Biol 7: e1002036.
45. Loo TW, Bartlett MC, Clarke DM (2010) Human P-glycoprotein is active when
the two halves are clamped together in the closed conformation. Biochem
Biophys Res Commun 395: 436–440.
46. Eytan GD, Regev R, Oren G, Hurwitz CD, Assaraf YG (1997) Efficiency of P-
glycoprotein-mediated exclusion of rhodamine dyes from multidrug-resistant
cells is determined by their passive transmembrane movement rate.
Eur J Biochem 248: 104–112.
47. Loo TW, Bartlett MC, Clarke DM (2009) Identification of residues in the drug
translocation pathway of the human multidrug resistance P-glycoprotein by
arginine mutagenesis. J Biol Chem 284: 24074–24087.
48. Loo TW, Clarke DM (2002) Location of the rhodamine-binding site in the
human multidrug resistance P-glycoprotein. J Biol Chem 277: 44332–44338.
Predicting P- p-Mediated Drug Transport
PLoS ONE | www.plosone.org 10 October 2011 | Volume 6 | Issue 10 | e25815
g
Copyright © 2022 FDOKUMEN