acid glycoprotein (ORM*) gene locus in Caucasians
10
ABSTRACT. Human α 1 -acid glycoprotein (AGP) or orosomucoid (ORM) is a major acute phase protein that is thought to play a crucial role in maintaining homeostasis. Human AGP is the product of a cluster of at least two adjacent genes located on HSA chromosome 9. Using a range of restriction endonucleases we have investigated DNA variation at the locus encoding the AGP genes in a group of healthy Caucasians. Polymorphisms were identified using BamHI, EcoRI, BglII, PvuII, HindIII, TaqI and MspI. Nonrandom associations were found between the BamHI, EcoRI and BglII RFLPs. The RFLPs detected with PvuII, TaqI and MspI were all located in exon 6 of both AGP genes. The dupli- cation of an AGP gene was observed in 11% of the individuals studied and was in linkage disequilibrium with the TaqI RFLP. The identifica- tion and characterization of these polymorphisms should prove useful for other population and forensic studies. Key words: Human α 1 -acid glycoprotein, RFLP, Linkage disequilibrium Identification and characterization of polymorphisms at the HSA α α α 1 -acid acid acid acid acid glycoprotein glycoprotein glycoprotein glycoprotein glycoprotein (ORM* ORM* ORM* ORM* ORM*) gene locus in Caucasians Genetics and Molecular Research 1 (1): 96-105 (2002) FUNPEC-RP www.funpecrp.com.br Catherine M. Owczarek 1 , Aleksander L. Owczarek 2 and Philip G. Board 3 1 Centre for Functional Genomics and Human Disease, Monash Institute of Reproduction and Development, Monash University, Melbourne, Victoria 3168, Australia 2 Department of Mathematics and Statistics, University of Melbourne, Parkville, Australia 3 Molecular Genetics Group, John Curtin School of Medical Research, Canberra ACT 2601, Australia Corresponding author: C.M. Owczarek E-mail: [email protected] Genet. Mol. Res. 1 (1): 96-105 (2002) Received February 28, 2002 Published March 28, 2002
-
Upload
khangminh22 -
Category
Documents
-
view
0 -
download
0
Transcript of acid glycoprotein (ORM*) gene locus in Caucasians

C.M. Owczarek et al. 96
Genetics and Molecular Research 1 (1): 96-105 (2002) www.funpecrp.com.br
ABSTRACT. Human α1-acid glycoprotein (AGP) or orosomucoid
(ORM) is a major acute phase protein that is thought to play a crucialrole in maintaining homeostasis. Human AGP is the product of a clusterof at least two adjacent genes located on HSA chromosome 9. Using arange of restriction endonucleases we have investigated DNA variationat the locus encoding the AGP genes in a group of healthy Caucasians.Polymorphisms were identified using BamHI, EcoRI, BglII, PvuII,HindIII, TaqI and MspI. Nonrandom associations were found betweenthe BamHI, EcoRI and BglII RFLPs. The RFLPs detected with PvuII,TaqI and MspI were all located in exon 6 of both AGP genes. The dupli-cation of an AGP gene was observed in 11% of the individuals studiedand was in linkage disequilibrium with the TaqI RFLP. The identifica-tion and characterization of these polymorphisms should prove usefulfor other population and forensic studies.
Key words: Human α1-acid glycoprotein, RFLP, Linkage disequilibrium
Identification and characterization ofpolymorphisms at the HSA ααααα11111-----acidacidacidacidacidglycoproteinglycoproteinglycoproteinglycoproteinglycoprotein (ORM*ORM*ORM*ORM*ORM*) gene locusin Caucasians
Genetics and Molecular Research 1 (1): 96-105(2002)
FUNPEC-RP www.funpecrp.com.br
Catherine M. Owczarek1, Aleksander L. Owczarek2 andPhilip G. Board3
1Centre for Functional Genomics and Human Disease, MonashInstitute of Reproduction and Development, Monash University,Melbourne, Victoria 3168, Australia2Department of Mathematics and Statistics, University of Melbourne,Parkville, Australia3Molecular Genetics Group, John Curtin School of Medical Research,Canberra ACT 2601, AustraliaCorresponding author: C.M. OwczarekE-mail: [email protected]
Genet. Mol. Res. 1 (1): 96-105 (2002)Received February 28, 2002Published March 28, 2002

Identification and characterization at the AGP gene locus 97
Genetics and Molecular Research 1 (1): 96-105 (2002) www.funpecrp.com.br
INTRODUCTION
HSA (Homo sapiens) α1-acid glycoprotein (AGP, orosomucoid, ORM) is an abun-
dantly expressed plasma protein whose levels rise dramatically during the acute phase response.A member of the lipocalin protein family, AGP, is thought to function mainly as a transportprotein for basic drugs although several other functions have been ascribed (Flower, 1996). Theexpression of the ORM protein product in most individuals is controlled by two genes, AGP1and AGP2 (Dente et al., 1987; Merritt and Board, 1988), which are closely linked on HSAchromosome 9q31-q34.1 (Webb et al., 1987). A third gene, structurally identical to AGP2, hasbeen reported to exist in some individuals (Dente et al., 1987), and duplication of the AGP1gene occurs in the Japanese population at an appreciable frequency (Nakamura et al., 2000).Considerable variation in the ORM polypeptide chain has been described. In addition to thetwo common alleles ORM1*F and ORM1*S (Johnson et al., 1969), a large number of variantshave been identified in different populations (Yuasa et al., 1993).
In the present study we have used RFLP analysis to investigate DNA variation at the AGPgene locus. We have demonstrated the existence of RFLPs in the region upstream of the AGP genelocus as well as polymorphisms within the AGP gene cluster, and have examined linkage disequi-librium between these sites. A duplication of one of the AGP genes was observed in the populationstudied and was strongly linked with the presence of a TaqI polymorphism.
MATERIAL AND METHODS
Genomic DNA samples
The samples of DNA used for screening for RFLPs were from a set of unrelated Cauca-sian blood donors recruited at the Canberra Red Cross Blood Transfusion Centre. An additional20 random controls were obtained from healthy staff members at the John Curtin School ofMedical Research. Family material was obtained from healthy Caucasian volunteers.
Genomic RFLP analysis
High molecular weight genomic DNA was extracted from the buffy coat from 10 mlperipheral blood (Grunebaum et al., 1984). Approximately 10 µg of genomic DNA was di-gested with the following enzymes according to the manufacturer’s specifications: BamHI,EcoRI, BglII, PvuII, HindIII, MspI, and TaqI and electrophoresed through a 0.8% agarose gel.After Southern blotting of the DNA (Reed and Mann, 1985) onto Gene-Screen Plus (Dupont)nylon membranes, the filters were hybridized overnight at 65oC with an α32P-dCTP labeled α
1-
AGP cDNA probe (Board et al., 1986).
Hardy-Weinberg and linkage disequilibrium analysis
Standard χ2 tests were used to compare observed genotype frequencies with those ex-pected under the Hardy-Weinberg equilibrium (Weir, 1996). In order to test for linkage disequi-librium between the alleles of the different polymorphisms, contingency tables were used, withstandard χ2 tests and Fisher’s exact tests, producing identical results. When using Fisher’s exact

C.M. Owczarek et al. 98
Genetics and Molecular Research 1 (1): 96-105 (2002) www.funpecrp.com.br
test we used a two-sided P value that was the minimum of one and twice the one-sided P value.Because the data cannot distinguish the two possible double heterozygotes, gametic frequen-cies could not be inferred (Weir, 1996), and hence the standard test for linkage equilibriumusing haplotype frequencies was not possible. In such cases various alternative approaches arepossible. However, because in all cases when the data were analyzed using 2 x 2 contingencytables between the two less common alleles the results were extreme in one direction or theother, the inferences of linkage disequilibrium/equilibrium were unequivocal.
RESULTS
Polymorphisms detected by BamBamBamBamBamHI, EcoEcoEcoEcoEcoRI and BglBglBglBglBglII
When human genomic DNA digested with BamHI was hybridized to the α1-AGP cDNA
probe, two constant bands: 4.5 kb and 2.5 kb and two variable bands: 14.8 kb (B1) and 13.6 kb (B2)were observed (Figure 1a). Co-dominant segregation was observed in families D and M for the B1and B2 alleles of the BamHI RFLP (Figure 2). Mapping data (Merritt and Board, 1988) indicatedthat these hybridizing bands corresponded to exons 1-5 of AGP2 and exon 6 of both AGP genesrespectively placing the polymorphic BamHI site approximately 11 kb upstream of the AGP1 gene.
Digestion of human DNA with EcoRI detected a two-allele polymorphism with bandsat 12.6 kb (E1) and 11.6 kb (E2) and invariant bands at 16.8 kb and 6.9 kb (Figure 1b). Co-dominant segregation of the EcoRI RFLP was demonstrated in family D (Figure 2). The 6.9-kbinvariant band contains exon 1 of AGP1 and exons 1-5 of AGP2 (Merritt and Board, 1988).Hybridization with a probe specific to exon 1 of AGP1/2 (data not shown) indicated that thepolymorphic EcoRI site was located upstream of AGP1.
BglII digestion also detected a two-allele polymorphism. Fragment lengths of 9.8 kb(Bg1) and 8.5 kb (Bg2) with invariant bands at 12.0, 5.2, 0.8 and 0.7 kb were observed. Genetictransmission of the BglII RFLP was observed in family D (Figure 2). The position of the poly-morphic BglII site was determined from the nucleotide sequence (Merritt and Board, 1988) andadditional mapping experiments (data not shown). Fragments of 0.8 and 0.7 kb corresponded toexons 2-3 and exons 4-5, respectively, of both AGP genes. The 5.2-kb fragment contained exon
Figure 1. Southern blot analysis of the DNA polymorphisms generated by digestion with a. BamHI (B); b. EcoRI (E); c. BglII (Bg)and probed with the cDNA probe pα
1AGP. The phenotype is given below each sample. The sizes of the polymorphic fragments are
indicated and described in the text.
Identification and characterization at the AGP gene locus 99
Genetics and Molecular Research 1 (1): 96-105 (2002) www.funpecrp.com.br
6 of AGP1 and exon 1 of AGP2 plus intergenic sequence. The polymorphic BglII band was detectedwith an exon 1-specific probe indicating that it was located upstream of the AGP1 gene.
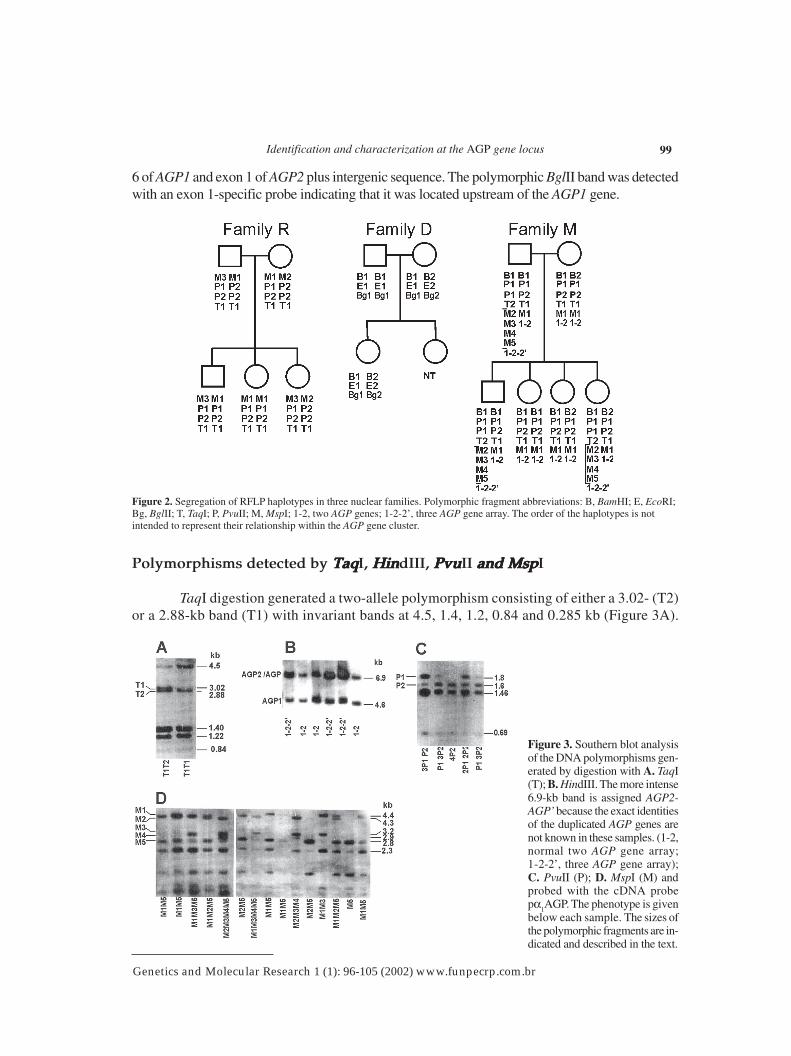
Figure 3. Southern blot analysisof the DNA polymorphisms gen-erated by digestion with A. TaqI(T); B. HindIII. The more intense6.9-kb band is assigned AGP2-AGP’ because the exact identitiesof the duplicated AGP genes arenot known in these samples. (1-2,normal two AGP gene array;1-2-2’, three AGP gene array);C. PvuII (P); D. MspI (M) andprobed with the cDNA probepα
1AGP. The phenotype is given
below each sample. The sizes ofthe polymorphic fragments are in-dicated and described in the text.
Polymorphisms detected by TaqTaqTaqTaqTaqI, HinHinHinHinHindIII, PvuPvuPvuPvuPvuII and Mspand Mspand Mspand Mspand MspI
TaqI digestion generated a two-allele polymorphism consisting of either a 3.02- (T2)or a 2.88-kb band (T1) with invariant bands at 4.5, 1.4, 1.2, 0.84 and 0.285 kb (Figure 3A).
Figure 2. Segregation of RFLP haplotypes in three nuclear families. Polymorphic fragment abbreviations: B, BamHI; E, EcoRI;Bg, BglII; T, TaqI; P, PvuII; M, MspI; 1-2, two AGP genes; 1-2-2’, three AGP gene array. The order of the haplotypes is notintended to represent their relationship within the AGP gene cluster.

C.M. Owczarek et al. 100
Genetics and Molecular Research 1 (1): 96-105 (2002) www.funpecrp.com.br
Co-dominant segregation for the TaqI RFLP was observed in two informative families (Figure 2).Hybridization experiments and analysis of sequence data (Merritt and Board, 1988) indicatedthat the TaqI polymorphic site was located on an exon 6-containing fragment.
When human genomic DNA was digested with HindIII and hybridized to the α1-AGP
cDNA probe two bands at 4.6 kb (AGP1) and 6.9 kb (AGP2) were detected (Figure 3B) but the6.9-kb band relative to the 4.6-kb band was more intense in 7 of 65 individuals examined (11%)(Table 1). The greater intensity of the 6.9-kb HindIII band relative to the 4.6-kb band in some
Table 1. Genotype and allele frequencies of the α1-acid glycoprotein RFLPs.
Restriction site d.f.
χ2 tests the goodness of fit to Hardy-Weinberg expectations. * Inferred allele frequencies under the assumption of Hardy-Weinbergequilibrium. #Allele frequencies under the assumption that the frequency at each locus is the same. d.f. = degrees of freedom.
BamHI
EcoRI
BglII
HindIII
TaqI
PvuII
1
1
1
-
1
3
94
85
75
65
87
76
N P
0.7
0.3
0.7
-
0.6
0.03
χ2
0.15
1.05
0.1
-
0.26
9.3
B10.88E10.89Bg10.90
0.94*T10.95P10.47#
B20.12E20.11Bg20.10
0.06*T20.05P20.53#
Allele frequency
B1B172
E1E168
Bg1Bg1611-258
T1T178
4P10
Genotype
B2B21
E2E22
Bg2Bg21
T2T20
P13P217
4P24
B1B221
E1E215
Bg1Bg213
1-2-2’7
T1T29
3P1P216
2P12P239
individuals has been previously noted (Dente et al., 1985; Merritt and Board, 1988) and corre-lates with an extra AGP gene (Dente et al., 1987; Nakamura et al., 2000). Individuals werescored either as 1-2 (AGP1-AGP2 on each chromosome) or 1-2-2’ indicating the presence of anextra AGP gene on one or both chromosomes (since homozygotes and heterozygotes would beindistinguishable under the conditions used in this study). Co-dominant segregation was ob-served in family M (Figure 2) where the father had the intense 6.9-kb HindIII band and themother had 6.9- and 4.5-kb HindIII bands of equal intensity. Two siblings inherited the intense6.9-kb HindIII band and the other two had HindIII bands of equal intensity indicating that thefather was heterozygous for the presence of a third AGP gene and the mother was homozygousfor the more common two AGP gene arrangement. Family M had the same pattern of inherit-ance for the TaqI RFLP.
A complex polymorphism was detected in human genomic DNA digested with PvuII(Figure 3C). A total of four bands of different intensities were detected. Alleles P1 and P2 weredefined by 1.8- and 1.6-kb bands, respectively, and invariant bands were observed at 1.46, 1.38and 0.69 kb. Hybridization experiments (data not shown) indicated that the polymorphic PvuIIsite was present in fragments containing exon 6 of either AGP gene. Because of the duplicatedand sometimes triplicated genes in the AGP gene locus it was not possible to determine exactlywhich AGP gene contained the polymorphic allele/s or what the allelic distribution was in agiven individual. Cases of equal intensities of bands P1 and P2 could be the consequence ofseveral possible arrangements of the P1 and P2 alleles, e.g., P1 could arise from AGP1 and P2from AGP2 on one chromosome (or vice versa). The same number of P1 and P2 alleles will bepresent on the other chromosome but the arrangement could either be reversed or the same.
Identification and characterization at the AGP gene locus 101
Genetics and Molecular Research 1 (1): 96-105 (2002) www.funpecrp.com.br
Five phenotypic classes were therefore assigned based on the intensity of each allele (P1, P2)relative to each other on an autoradiogram (Figure 3C). 1) 4P1 (P1 present, P2 absent); 2) 3P11P2 (P1 band more intense than P2); 3) 2P1 2P2 (P1 and P2 bands equally intense); 4) 1P1 3P2(P2 band more intense than P1), and 5) 4P2 (P2 present, P1 absent).
Co-dominant segregation was observed in families R and M (Figure 2). In family R,the father was 2P1 2P2 and the mother P1 3P2. One child was 2P1 2P2 indicating that a P1 anda P2 allele are co-segregating in the father and two P2 alleles are co-segregating in the mother.The two other children in this family were 2P1 2P2. Family M demonstrated Mendelian inher-itance of a different phenotypic class where the father was 3P1 P2 and the mother was 2P1 2P2.The phenotypic class of the offspring indicated that a P1 and a P2 allele must be co-segregatingin the mother while the father is P1/P1 on one chromosome and P1/P2 on the other.
Digestion of human genomic DNA with MspI and hybridization to the α1-AGP cDNA
probe also resulted in a complex band pattern. The variant fragments were designated M1 toM5 in order of decreasing size: 4.4 kb (M1), 4.3 kb (M2), 3.2 kb (M3), 2.9 kb (M4), and 2.8 kb(M5). The polymorphic fragments all hybridized to an exon 6-specific probe. A total of 47random individuals were screened and several different arrangements of the variant MspI frag-ments were observed. Some representative combinations are presented in Figure 3D. The vari-ous alleles that these fragments represent were not examined for deviation from Hardy-Weinbergequilibrium since extensive family studies would be necessary in order to determine the correctnumber of alleles in a particular individual. However, a segregation pattern consistent withMendelian inheritance was observed in families R and M (Figure 2). In family R each allelewas interpreted as being alleles at a separate locus. The father had bands M1, M3 and themother had bands M1 and M2. These segregated independently in each parent to give siblingswith allele distributions of M1 M3, M1 M1, and M3 M2. The pattern of inheritance in family Mwas more complex. Fragment M1 in the father segregated independently from bands M2, M3,M4, and M5. The mother was homozygous for M1. Two of the siblings have inherited an M1band from either parent. The remaining two siblings derived an M1 band from their mother andthe M2, M3, M4 and M5 bands from their father. The bands appeared to be transmitted as asingle allele although they most likely represented multiple closely linked sites on a singlechromosome. Interestingly, the M2, M3, M4, M5 band arrangement had the same pattern ofinheritance as the HindIII and TaqI polymorphisms in this family.
The allele frequencies for the BamHI, EcoRI, BglII, TaqI, PvuII RFLPs and occurrenceof an extra AGP gene in a sample of Caucasians are given in Table 1. The observed frequencydistribution of genotypes for the BamHI, EcoRI, BglII and TaqI RFLPs did not differ signifi-cantly from those expected on the basis of a Hardy-Weinberg equilibrium (Table 1). As men-tioned above, tests were carried out using the standard χ2 statistic. As each RFLP was concor-dant with Hardy-Weinberg equilibrium the more conservative Fisher’s exact test was unneces-sary (despite some small expected counts).
The distribution of genotypes for the PvuII RFLP was examined for deviation from“Hardy-Weinberg equilibrium” under the assumption that the probability of the occurrence ofsimilar alleles at each of the polymorphic sites is identical. In this case the null hypothesis ofHardy-Weinberg equilibrium (Table 1) amongst the alleles at the two loci is rejected on thebasis of a χ2 statistic using a standard significance level of 0.05. This disequilibrium could bedue to one or more causes. Firstly, one or more of the loci separately may be out of Hardy-Weinberg equilibrium, or secondly, that the probability of the occurrence of similar alleles at
C.M. Owczarek et al. 102
Genetics and Molecular Research 1 (1): 96-105 (2002) www.funpecrp.com.br
each of the polymorphic sites is not identical, or thirdly, that the two loci are in linkage disequi-librium. The experimental data does not allow reasonable discrimination between these alterna-tives since the two loci cannot be distinguished.
Analysis of linkage disequilibrium between polymorphic sites
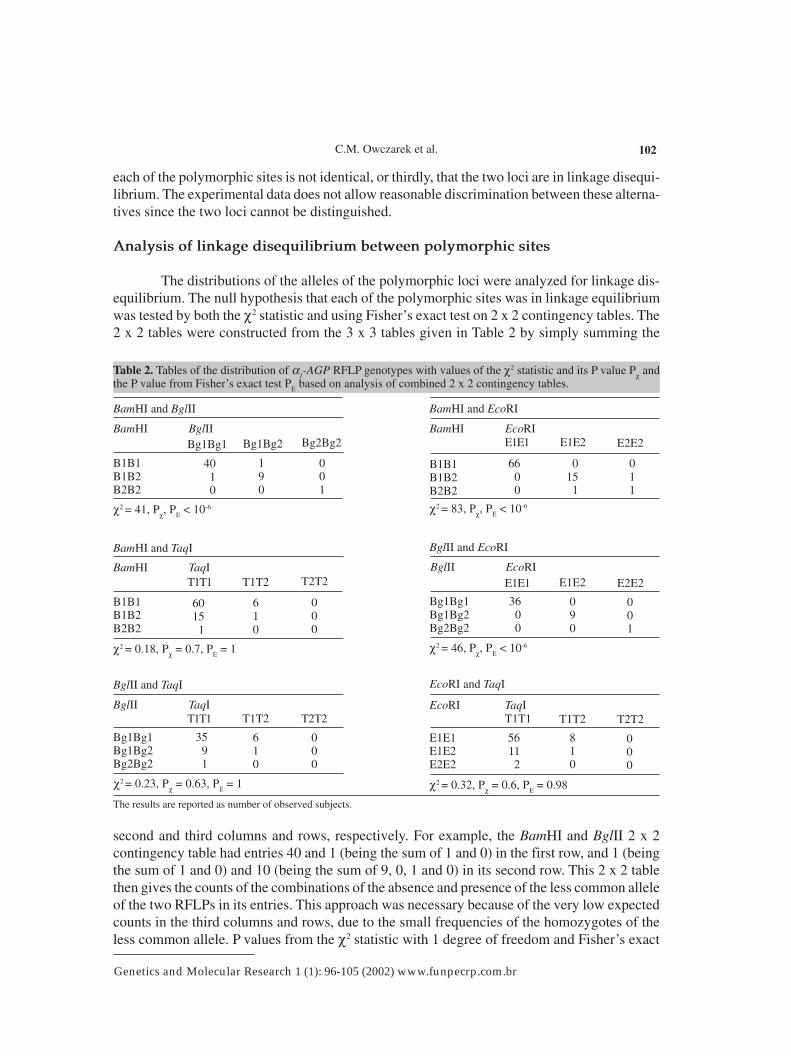
The distributions of the alleles of the polymorphic loci were analyzed for linkage dis-equilibrium. The null hypothesis that each of the polymorphic sites was in linkage equilibriumwas tested by both the χ2 statistic and using Fisher’s exact test on 2 x 2 contingency tables. The2 x 2 tables were constructed from the 3 x 3 tables given in Table 2 by simply summing the
second and third columns and rows, respectively. For example, the BamHI and BglII 2 x 2contingency table had entries 40 and 1 (being the sum of 1 and 0) in the first row, and 1 (beingthe sum of 1 and 0) and 10 (being the sum of 9, 0, 1 and 0) in its second row. This 2 x 2 tablethen gives the counts of the combinations of the absence and presence of the less common alleleof the two RFLPs in its entries. This approach was necessary because of the very low expectedcounts in the third columns and rows, due to the small frequencies of the homozygotes of theless common allele. P values from the χ2 statistic with 1 degree of freedom and Fisher’s exact
Table 2. Tables of the distribution of α1-AGP RFLP genotypes with values of the χ2 statistic and its P value Pχ and
the P value from Fisher’s exact test PE based on analysis of combined 2 x 2 contingency tables.
BamHI and BglII
Bg1Bg1
B1B1B1B2B2B2
Bg1Bg2 Bg2Bg2
χ2 = 41, Pχ, PE < 10-6
BamHI BglII
4010
190
001
BamHI and EcoRI
E2E2E1E1 E1E2
B1B1B1B2B2B2
χ2 = 83, Pχ, PE < 10-6
BamHI EcoRI
6600
0151
011
BglII and TaqI
T1T1 T1T2 T2T2
χ2 = 0.23, Pχ = 0.63, PE = 1
BglII TaqI
3591
610
000
Bg1Bg1Bg1Bg2Bg2Bg2
BamHI and TaqI
T1T1 T1T2 T2T2
B1B1B1B2B2B2
χ2 = 0.18, Pχ = 0.7, PE = 1
BamHI TaqI
60151
610
000
The results are reported as number of observed subjects.
BglII and EcoRI
E1E1 E1E2 E2E2
Bg1Bg1Bg1Bg2Bg2Bg2
χ2 = 46, Pχ, PE < 10-6
BglII EcoRI
3600
090
001
EcoRI and TaqI
T1T1 T1T2 T2T2
E1E1E1E2E2E2
χ2 = 0.32, Pχ = 0.6, PE = 0.98
EcoRI TaqI
56112
810
000

Identification and characterization at the AGP gene locus 103
Genetics and Molecular Research 1 (1): 96-105 (2002) www.funpecrp.com.br
test are both given. In all cases the two tests lead to the same conclusions. We note that Fisher’sexact test is more conservative than the χ2 statistic. Hence when linkage equilibrium is ob-served using the χ2 statistic, the use of Fisher’s exact text leads to the same conclusion. Further-more, where linkage disequilibrium is inferred, the results are so extreme, with P values of lessthan 10-6, no ambiguity occurs. Linkage disequilibrium was observed between the followingRFLPs: BamHI and EcoRI, BamHI and BglII, BglII and EcoRI (Table 2).
In order to test for linkage disequilibrium between the RFLP genotypes and the pres-ence of multiple AGP genes (as detected by a 6.9-kb HindIII band that was more intense rela-tive to the 4.5-kb HindIII band), 2 x 2 contingency tables were constructed from the 3 x 2 tablesgiven in Table 3 in an analogous fashion to that described above. These 2 x 2 tables were thentested for association using, as above, the χ2 statistic and Fisher’s exact test. Linkage disequi-librium was observed between the presence of the relatively intense 6.9-kb HindIII band (1-2-2’) and hence extra AGP gene(s), and the TaqI RFLP (Table 3).
Table 3. Contingency tables of the distribution of α1-AGP RFLP genotypes and presence of multiple AGP genes.
EcoRI
1-2 1-2-2’
χ2 = 1.9, Pχ = 0.16, PE = 0.39
EcoRI
E1E1E1E2E2E2
42111
700
BamHI
1-2 1-2-2’
χ2 = 2, Pχ = 0.15, PE = 0.36
BamHI
B1B1B1B2B2B2
43121
700
BglII
1-2 1-2-2’
χ2 = 1.7, Pχ = 0.2, PE = 0.5
BglII
Bg1Bg1Bg1Bg2Bg2Bg2
2461
600
The results are reported as number of observed subjects.1-2 indicates 6.9-kb (AGP2) and 4.6-kb (AGP1) HindIII bands of equalintensity. 1-2-2’ indicates 6.9-kb (AGP2) band more intense than the 4.6-kb (AGP1) HindIII band.
DISCUSSION
Since the initial studies of Johnson et al., 1969, there have been many reports of geneticvariation at the human α
1-acid glycoprotein or ORM locus. In this study we have investigated
DNA variation in and around the human AGP genes in a Caucasian population using RFLPanalysis. RFLPs were detected with the use of restriction enzymes BamHI, EcoRI, BglII, PvuII,HindIII, MspI, and TaqI.
RFLPs detected by enzymes BamHI, EcoRI, BglII were located at least 11 kb upstreamof the AGP gene cluster and were in linkage disequilibrium with each other. This group ofpolymorphic loci did not deviate from a random association with the TaqI RFLP that was lo-cated within the AGP gene cluster. Two complex polymorphisms were detected within noncodingregions of the AGP gene cluster using PvuII and MspI. Interestingly, the PvuII, MspI, and TaqIpolymorphisms could be detected with an exon 6-specific probe, indicating a higher degree ofrecombination in this region of the AGP genes.
TaqI
1-2 1-2-2’
χ2 = 50, Pχ, PE < 10-6
TaqI
T1T1T1T2T2T2
5010
070
C.M. Owczarek et al. 104
Genetics and Molecular Research 1 (1): 96-105 (2002) www.funpecrp.com.br
Previous studies have suggested that the two AGP gene arrays seen in the majority ofindividuals arose as a consequence of gene duplication subsequent to the divergence of humansfrom rodents (Merritt et al., 1990). Individuals with three AGP genes have been reported (Denteet al., 1987; Merritt and Board, 1988; Nakamura et al., 2000). These three gene arrays (AGP1-AGP2-AGP2 or AGP1-AGP1-AGP2) represent polymorphisms in the populations studied andare the result of further crossover events that must have occurred relatively recently since therewere no changes in the duplicated genes studied. In the Caucasian population studied herelinkage disequilibrium was observed between the presence of an intense 6.9-kb HindIII frag-ment (1-2-2’ and hence multiple AGP1 or AGP2 genes) and the TaqI RFLP. The simplest expla-nation for the origin of the TaqI polymorphism would be a point mutation that caused the lossof the TaqI site in the region between the AGP1 and AGP2 genes. However, if one considersthat unequal crossing over events generated three member AGP gene arrays (Dente et al., 1987;Merritt and Board, 1988; Merritt et al., 1990; Nakamura et al., 2000) it is possible that a cross-over event could cause the loss of a TaqI site. In this study individuals who may be homozygousfor the presence of a third AGP gene would be indistinguishable from heterozygotes sinceincreased intensity of the 6.9-kb band relative to the 4.5 kb was used as the basis for scoring.Interestingly, however, family M (Figure 2) was informative for both the TaqI polymorphismand the presence of an extra AGP gene and those individuals that were heterozygous for theTaqI polymorphism were also heterozygous for an extra AGP gene. Furthermore, in the popu-lation studied there were no T2T2 individuals, suggesting that there were no individuals ho-mozygous for an extra AGP gene. Further sequence analysis of the AGP locus from the indi-viduals studied would be required to confirm the genetic basis for observed linkage betweenthe TaqI polymorphism and the presence of multiple AGP genes and to determine if the particu-lar duplicated gene was AGP1 or AGP2.
The HSA orosomucoid polymorphisms (Yuasa et al., 1993, 1997) have been widelystudied in a range of populations. The results presented in this survey provide evidence forfurther variation at the AGP gene locus and the polymorphisms described may be useful asgenetic markers in a variety of forensic, linkage and population studies.
REFERENCES
Board, P.G, Jones, I.M. and Bentley, A.K. (1986). Molecular cloning and nucleotide sequence of human α1-
acid glycoprotein cDNA. Gene 44: 127-131.Dente, L., Ciliberto, G. and Cortese, R. (1985). Structure of the human α
1-acid glycoprotein gene: Sequence
homology with other acute phase proteins. Nucleic Acids Res. 13: 3941-3952.Dente, L., Pizza, M.G., Metspalu, A. and Cortese, R. (1987). Structure and expression of the genes coding
for human α1-acid glycoprotein. EMBO J. 6: 2289-2296.
Flower, D.R. (1996). The lipocalin protein family: structure and function. Biochem. J. 318: 1-14.Grunebaum, L., Casenave, J.P., Camerino, G., Kloepfer, C., Mandel, J.L., Tolstoshev, P., Jaye, M., De la
Salle, H. and Lecocq, J.P. (1984). Carrier detection of hemophilia B by using a restriction site polymor-phism associated with the coagulation factor IX gene. J. Clin. Invest. 73: 1491-1495.
Johnson, A.M., Schmid, K. and Alper, C.A. (1969). Inheritance of human α1-acid glycoprotein (orosomucoid)
variants. J. Clin. Invest. 48: 2293-2299.Merritt, C.M. and Board, P.G. (1988). Structure and characterization of a duplicated human α
1-acid glyco-
protein gene. Gene 66: 97-106.Merritt, C.M., Easteal, S. and Board, P.G. (1990). Evolution of human α
1-acid glycoprotein genes and
surrounding Alu repeats. Genomics 6: 659-665.Nakamura, H., Yuasa, I., Umetsu, K., Nakagawa, M., Nanba, E. and Kimura, K. (2000). The rearrange-
ment of the human α1-acid glycoprotein/orosomucoid gene: Evidence for tandemly triplicated genes

Identification and characterization at the AGP gene locus 105
Genetics and Molecular Research 1 (1): 96-105 (2002) www.funpecrp.com.br
consisting of two AGP1 and one AGP2. Biochem. Biophys. Res. Commun. 276: 779-784.Reed, K.C. and Mann, D.A. (1985). Rapid transfer of DNA from agarose gels to nylon membranes. Nucleic
Acids Res. 13: 7202-7221.Webb, G.C., Earle, E.A., Merritt, C.M. and Board, P.G. (1987). Localization of human α
1-acid glycopro-
tein genes to 9q31-34.1. Cytogenet. Cell Genet. 47: 18-21.Weir, B.S. (1996), Genetic Data Analysis II. 2nd edn. Sinauer Associates, Sunderland, MA, USA.Yuasa, I., Weidinger, S., Umetsu, K., Suenaga, K., Ishimoto, G., Eap, B.C., Duche, J.C. and Baumann, P.
(1993). Orosomucoid system: 17 additional orosomucoid variants and proposal for a new nomenclature.Vox Sang. 64: 47-55.
Yuasa, I., Umetsu, K., Vogt, U., Nakamura, H., Nanba, E., Tamaki, N. and Irizawa, Y. (1997). Humanorosomucoid polymorphism: molecular basis of the three common ORM1 alleles ORM1*F1, ORM1*F2,and ORM1*S. Hum. Genet. 99: 393-398.