Predicting Functional Alternative Splicing by Measuring RNA Selection Pressure from Multigenome...
14
Predicting Functional Alternative Splicing by Measuring RNA Selection Pressure from Multigenome Alignments Hongchao Lu 1 , Lan Lin 2 , Seiko Sato 2 , Yi Xing 2,3 , Christopher J. Lee 1 * 1 Molecular Biology Institute, Center for Computational Biology, Institute for Genomics and Proteomics, Department of Chemistry and Biochemistry, University of California Los Angeles, Los Angeles, California, United States of America, 2 Department of Internal Medicine, University of Iowa, Iowa City, Iowa, United States of America, 3 Department of Biomedical Engineering, University of Iowa, Iowa City, Iowa, United States of America Abstract High-throughput methods such as EST sequencing, microarrays and deep sequencing have identified large numbers of alternative splicing (AS) events, but studies have shown that only a subset of these may be functional. Here we report a sensitive bioinformatics approach that identifies exons with evidence of a strong RNA selection pressure ratio (RSPR) —i.e., evolutionary selection against mutations that change only the mRNA sequence while leaving the protein sequence unchanged—measured across an entire evolutionary family, which greatly amplifies its predictive power. Using the UCSC 28 vertebrate genome alignment, this approach correctly predicted half to three-quarters of AS exons that are known binding targets of the NOVA splicing regulatory factor, and predicted 345 strongly selected alternative splicing events in human, and 262 in mouse. These predictions were strongly validated by several experimental criteria of functional AS such as independent detection of the same AS event in other species, reading frame-preservation, and experimental evidence of tissue-specific regulation: 75% (15/20) of a sample of high-RSPR exons displayed tissue specific regulation in a panel of ten tissues, vs. only 20% (4/20) among a sample of low-RSPR exons. These data suggest that RSPR can identify exons with functionally important splicing regulation, and provides biologists with a dataset of over 600 such exons. We present several case studies, including both well-studied examples (GRIN1) and novel examples (EXOC7). These data also show that RSPR strongly outperforms other approaches such as standard sequence conservation (which fails to distinguish amino acid selection pressure from RNA selection pressure), or pairwise genome comparison (which lacks adequate statistical power for predicting individual exons). Citation: Lu H, Lin L, Sato S, Xing Y, Lee CJ (2009) Predicting Functional Alternative Splicing by Measuring RNA Selection Pressure from Multigenome Alignments. PLoS Comput Biol 5(12): e1000608. doi:10.1371/journal.pcbi.1000608 Editor: Wen-Hsiung Li, University of Chicago, United States of America Received June 18, 2009; Accepted November 12, 2009; Published December 18, 2009 Copyright: ß 2009 Lu et al. This is an open-access article distributed under the terms of the Creative Commons Attribution License, which permits unrestricted use, distribution, and reproduction in any medium, provided the original author and source are credited. Funding: This work was supported from grants from the National Institutes of Health (CJL, U54 RR021813; YX, 1R01HG004634), Department of Energy (DE-FC02- 02ER63421) and a grant from the Hereditary Disease Foundation (YX). The funders had no role in study design, data collection and analysis, decision to publish, or preparation of the manuscript. Competing Interests: The authors have declared that no competing interests exist. * E-mail: [email protected] Introduction Global analyses of alternative splicing (AS) have established its importance in protein diversity and gene regulation in higher eukaryotes [1,2]. Alternative splicing can regulate biological function by altering the sequence of protein products and modulating transcript expression levels [3]. Alternative splicing can modify binding properties, intracellular localization, enzymat- ic activity, protein stability or post-translational modifications[4]. Alternative splicing is often regulated in a tissue-specific manner [5] and can undergo important changes in disease states such as cancer [6,7]. All of these illustrate that it is necessary to study the functional effects of alternative splicing to understand the complexity of biological system and human disease. One major challenge is the identification of functional alternative splicing events. In general, experimental methods that can directly demonstrate a biological function for an AS event are time-consuming, ad hoc, and impractical on a genome-wide scale. By contrast, high-throughput methods for surveying the tran- scriptome, such as EST sequencing [8], microarrays [9] or deep sequencing [10], mainly enable detection of whether a given splicing event is ‘‘present’’ or ‘‘absent’’ in a sample. Genome-wide analysis of such datasets has produced large databases of detected alternative splicing events, but with limited guidance for biologists about which ones are likely to be functional. More importantly, a number of studies have shown that a significant fraction of these detected events are probably not functional [2,11,12]. In this context, biologists need improved ways of distinguishing AS events that are likely to have important biological functions, before initiating costly experiments, such as high-throughput studies of regulation [13,14]. There are multiple aspects of function that can be assessed using bioinformatics. Many studies have used the independent observa- tion of the same alternative splicing event in multiple species as evidence that it is functional [15–18]. By contrast, introduction of a STOP codon more than 50 nt from the last exon-exon junction is predicted to cause nonsense-mediated decay; such a splice form will not produce a functional protein product (although the AS event itself might still play an important role in regulating function by down-regulating the transcript level) [19–22]. Mapping of the AS exon to known protein domains or structures has also been suggested as an indicator of useful biological function [23,24]. Many studies have indicated that an AS sequence segment consisting of an exact multiple of 3 nt length is more likely to be PLoS Computational Biology | www.ploscompbiol.org 1 December 2009 | Volume 5 | Issue 12 | e1000608
-
Upload
sciencenet -
Category
Documents
-
view
0 -
download
0
Transcript of Predicting Functional Alternative Splicing by Measuring RNA Selection Pressure from Multigenome...
Predicting Functional Alternative Splicing by MeasuringRNA Selection Pressure from Multigenome AlignmentsHongchao Lu1, Lan Lin2, Seiko Sato2, Yi Xing2,3, Christopher J. Lee1*
1 Molecular Biology Institute, Center for Computational Biology, Institute for Genomics and Proteomics, Department of Chemistry and Biochemistry, University of
California Los Angeles, Los Angeles, California, United States of America, 2 Department of Internal Medicine, University of Iowa, Iowa City, Iowa, United States of America,
3 Department of Biomedical Engineering, University of Iowa, Iowa City, Iowa, United States of America
Abstract
High-throughput methods such as EST sequencing, microarrays and deep sequencing have identified large numbers ofalternative splicing (AS) events, but studies have shown that only a subset of these may be functional. Here we report asensitive bioinformatics approach that identifies exons with evidence of a strong RNA selection pressure ratio (RSPR) —i.e.,evolutionary selection against mutations that change only the mRNA sequence while leaving the protein sequenceunchanged—measured across an entire evolutionary family, which greatly amplifies its predictive power. Using the UCSC 28vertebrate genome alignment, this approach correctly predicted half to three-quarters of AS exons that are known bindingtargets of the NOVA splicing regulatory factor, and predicted 345 strongly selected alternative splicing events in human, and262 in mouse. These predictions were strongly validated by several experimental criteria of functional AS such asindependent detection of the same AS event in other species, reading frame-preservation, and experimental evidence oftissue-specific regulation: 75% (15/20) of a sample of high-RSPR exons displayed tissue specific regulation in a panel of tentissues, vs. only 20% (4/20) among a sample of low-RSPR exons. These data suggest that RSPR can identify exons withfunctionally important splicing regulation, and provides biologists with a dataset of over 600 such exons. We present severalcase studies, including both well-studied examples (GRIN1) and novel examples (EXOC7). These data also show that RSPRstrongly outperforms other approaches such as standard sequence conservation (which fails to distinguish amino acidselection pressure from RNA selection pressure), or pairwise genome comparison (which lacks adequate statistical power forpredicting individual exons).
Citation: Lu H, Lin L, Sato S, Xing Y, Lee CJ (2009) Predicting Functional Alternative Splicing by Measuring RNA Selection Pressure from MultigenomeAlignments. PLoS Comput Biol 5(12): e1000608. doi:10.1371/journal.pcbi.1000608
Editor: Wen-Hsiung Li, University of Chicago, United States of America
Received June 18, 2009; Accepted November 12, 2009; Published December 18, 2009
Copyright: � 2009 Lu et al. This is an open-access article distributed under the terms of the Creative Commons Attribution License, which permits unrestricteduse, distribution, and reproduction in any medium, provided the original author and source are credited.
Funding: This work was supported from grants from the National Institutes of Health (CJL, U54 RR021813; YX, 1R01HG004634), Department of Energy (DE-FC02-02ER63421) and a grant from the Hereditary Disease Foundation (YX). The funders had no role in study design, data collection and analysis, decision to publish, orpreparation of the manuscript.
Competing Interests: The authors have declared that no competing interests exist.
* E-mail: [email protected]
Introduction
Global analyses of alternative splicing (AS) have established its
importance in protein diversity and gene regulation in higher
eukaryotes [1,2]. Alternative splicing can regulate biological
function by altering the sequence of protein products and
modulating transcript expression levels [3]. Alternative splicing
can modify binding properties, intracellular localization, enzymat-
ic activity, protein stability or post-translational modifications[4].
Alternative splicing is often regulated in a tissue-specific manner
[5] and can undergo important changes in disease states such as
cancer [6,7]. All of these illustrate that it is necessary to study the
functional effects of alternative splicing to understand the
complexity of biological system and human disease.
One major challenge is the identification of functional
alternative splicing events. In general, experimental methods that
can directly demonstrate a biological function for an AS event are
time-consuming, ad hoc, and impractical on a genome-wide scale.
By contrast, high-throughput methods for surveying the tran-
scriptome, such as EST sequencing [8], microarrays [9] or deep
sequencing [10], mainly enable detection of whether a given
splicing event is ‘‘present’’ or ‘‘absent’’ in a sample. Genome-wide
analysis of such datasets has produced large databases of detected
alternative splicing events, but with limited guidance for biologists
about which ones are likely to be functional. More importantly, a
number of studies have shown that a significant fraction of these
detected events are probably not functional [2,11,12]. In this
context, biologists need improved ways of distinguishing AS events
that are likely to have important biological functions, before
initiating costly experiments, such as high-throughput studies of
regulation [13,14].
There are multiple aspects of function that can be assessed using
bioinformatics. Many studies have used the independent observa-
tion of the same alternative splicing event in multiple species as
evidence that it is functional [15–18]. By contrast, introduction of
a STOP codon more than 50 nt from the last exon-exon junction
is predicted to cause nonsense-mediated decay; such a splice form
will not produce a functional protein product (although the AS
event itself might still play an important role in regulating function
by down-regulating the transcript level) [19–22]. Mapping of the
AS exon to known protein domains or structures has also been
suggested as an indicator of useful biological function [23,24].
Many studies have indicated that an AS sequence segment
consisting of an exact multiple of 3 nt length is more likely to be
PLoS Computational Biology | www.ploscompbiol.org 1 December 2009 | Volume 5 | Issue 12 | e1000608
functional, since it can be alternatively spliced without affecting
the protein reading frame [25,26]. Evidence of tissue-specific
regulation (from EST or microarray data) has also been taken as
evidence of function [27–30]. While all of these criteria have been
shown to be useful indicators of ‘‘function’’, it should be
emphasized that no one method can adequately capture this ill-
defined concept, precisely because it has many different aspects.
Functions that are important for reproductive success are
subject to selection pressure, which can be defined as a reduction
in the frequency of observed mutations relative to that expected
under a neutral model. For example, sequence conservation both
within alternatively spliced exons and in flanking introns has been
cited as evidence of important regulatory motifs. One useful
extension of this principle is to separate total conservation into
non-synonymous sites (i.e. where mutations will change the amino
acid sequence) vs. synonymous sites (where mutations leave the
amino acid sequence unchanged). Whereas alternative exons show
poorer conservation than constitutive exons by total conservation
metrics like phastCons [31], several studies have reported that
measures of synonymous mutations (Ks, or ds) drop dramatically
in certain types of alternative exons [26,32,33], particularly those
that show tissue-specific regulation. Unlike standard conservation,
such Ks effects cannot be attributed to protein function, and have
thus been used as a measure of ‘‘RNA selection pressure’’ for
features such as splicing factor binding sites, RNA secondary
structure etc. [26,34–40].
With the rapid growth in complete genome sequences for
animals and plants [41], the strategy of seeking to detect RNA
selection pressure gains increasing power as a way of predicting
strongly selected AS regions [42,43]. Past applications of Ks to this
problem typically relied upon comparing a single pair of related
genomes (e.g. human vs. mouse). Given the high level of identity
seen in such exon comparisons (around 87% for human vs.
mouse), the number of synonymous mutations expected in an
alternative exon (just based on size, with no RNA selection
pressure) is low, perhaps ten or fewer. Even if the observed
number of synonymous mutations were three-fold lower, i.e. three
or fewer, implying strong RNA selection pressure, the result would
not be statistically significant, due to the small number of counts
being compared. For this reason, such studies have typically not
tried to predict which individual AS exons are strongly selected, but
instead to compare entire groups of exons, e.g. all ‘‘minor-form
exons’’ vs. all constitutive exons.
However, large multigenome alignments such as the UCSC 28
vertebrate genome alignment could improve predictive power, by
measuring Ks simultaneously in many separate species. This has
two benefits. First, the dataset of mutation counts for any given
exon is greatly increased (naively, by a factor of up to 20-fold
compared with a single pair of species), increasing the statistical
power for detecting real selection pressure cases. Second, the
ability to discriminate spurious cases is enhanced by utilizing a
much more diverse set of genomes: various types of artifacts that
might occur in one genome (e.g. a mutation ‘‘cold-spot’’ in mouse
evolution) are unlikely to be conserved over 28 genomes spanning
300 million years of vertebrate evolution (such conservation would
in fact indicate consistently strong selection).
In this paper we present a robust method for applying this
approach, combining multigenome alignment data and RNA
selection pressure calculations. This approach enables the detection
of statistically significant RNA selection pressure for each individual
exon, providing a direct prediction of whether that AS event has
been strongly selected during vertebrate evolution. We have tested
these prediction using a wide variety of data including known sets of
regulatory targets, large-scale EST and microarray data, and RT-
PCR analysis of tissue-specific splicing regulation.
Results
RNA selection pressure analysis of GRIN1As an initial test of the RNA selection pressure ratio (RSPR)
metric, we applied it to GRIN1, a gene whose alternative splicing is
well understood [44]. Of the 21 coding region exons, two exons
(exons 5 and 21) show evidence of dramatically increased RSPR
(RSPR values of 7 and 10 respectively) compared with the remaining
exons (Figure 1). These two exons correspond to the well-studied N1
and C1 alternative exons, which have been shown to be regulated by
PTB, NOVA2, hnRNP H and hnRNP A1 [45], and in turn control
receptor desensitization [46] and NMDA receptor interactions [47].
The RSPR data indicate that these two exons have synonymous
mutation rate approximately ten-fold lower than the surrounding
exons (p-value = 7.7610225). This very strong signal suggests that it
should be possible to detect regulated alternative exons using the
RSPR metric. These data suggest that more than half of the
synonymous sites in the N1 and C1 exons are under some kind of
negative selection pressure. This seems compatible with existing
splicing factor motif databases. RESCUE-ESE [48] and FAS-ESS
[49] predicted 43% of the N1 exon sequence and 50% of the C1 exon
sequence as splicing factor binding sites (Figure 1D).
The GRIN1 data provide evidence that using multigenome
alignments (in this case GRIN1 sequences from 16 species) can
make RSPR more sensitive than simply comparing a pair of
genomes. Figure 1C shows the synonymous substitution data (Ks)
used to compute RSPR, annotated on the lineages leading to each
species. The Ks values for the GRIN1 N1 and C1 alternative exons
are about ten-fold lower than the Ks values for the other exons, on
each lineage. For example, within the primate lineage, these
alternative exons showed a Ks level of 0.027 vs. 0.26 in the
neighboring exons. Independent data for other mammal lineages
(mouse, rat, dog) show a similar pattern, with total Ks values of
Author Summary
Alternative splicing is an important mechanism forregulating gene function in complex organisms, and hasbeen shown to play a key role in human diseases such ascancer. Recently, high-throughput technologies have beenused in an effort to detect alternative splicing eventsthroughout the human genome. However, validating theresults of these automated detection methods, andshowing that the minor splice forms they detected playan important role in regulating biological functions, havetraditionally required time-consuming experiments. In thisstudy we show that such regulatory functions can veryoften be detected by a distinctive pattern of strongselection on RNA sequence motifs within the alternativelyspliced region. We have measured this ‘‘RNA selectionpressure ratio’’ (RSPR) across 28 animal species represent-ing 400 million years of evolution, and show that thismetric successfully predicts known patterns of alternativesplicing, and also have validated its predictions experi-mentally. For example, whereas high-RSPR alternativesplices were found experimentally to undergo tissue-specific regulation in 75% of cases, only 20% of low-RSPRcases were found to be tissue-specific. Using RSPR, wehave predicted over 600 human and mouse alternativesplicing events that appear to be under strong selection.These data should be valuable for biologists seeking tounderstand the functional effects and underlying mecha-nisms of splicing regulation.
Predicting Functional Alternative Splicing
PLoS Computational Biology | www.ploscompbiol.org 2 December 2009 | Volume 5 | Issue 12 | e1000608
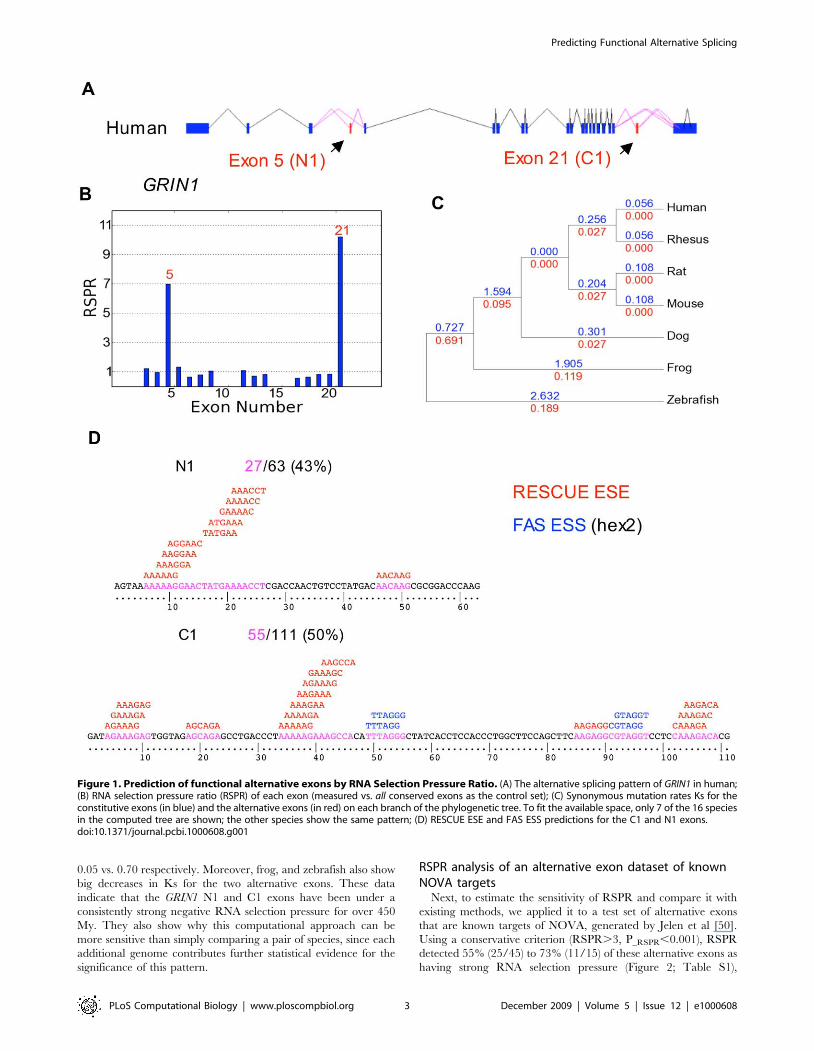
0.05 vs. 0.70 respectively. Moreover, frog, and zebrafish also show
big decreases in Ks for the two alternative exons. These data
indicate that the GRIN1 N1 and C1 exons have been under a
consistently strong negative RNA selection pressure for over 450
My. They also show why this computational approach can be
more sensitive than simply comparing a pair of species, since each
additional genome contributes further statistical evidence for the
significance of this pattern.
RSPR analysis of an alternative exon dataset of knownNOVA targets
Next, to estimate the sensitivity of RSPR and compare it with
existing methods, we applied it to a test set of alternative exons
that are known targets of NOVA, generated by Jelen et al [50].
Using a conservative criterion (RSPR.3, P_RSPR,0.001), RSPR
detected 55% (25/45) to 73% (11/15) of these alternative exons as
having strong RNA selection pressure (Figure 2; Table S1),
Figure 1. Prediction of functional alternative exons by RNA Selection Pressure Ratio. (A) The alternative splicing pattern of GRIN1 in human;(B) RNA selection pressure ratio (RSPR) of each exon (measured vs. all conserved exons as the control set); (C) Synonymous mutation rates Ks for theconstitutive exons (in blue) and the alternative exons (in red) on each branch of the phylogenetic tree. To fit the available space, only 7 of the 16 speciesin the computed tree are shown; the other species show the same pattern; (D) RESCUE ESE and FAS ESS predictions for the C1 and N1 exons.doi:10.1371/journal.pcbi.1000608.g001
Predicting Functional Alternative Splicing
PLoS Computational Biology | www.ploscompbiol.org 3 December 2009 | Volume 5 | Issue 12 | e1000608
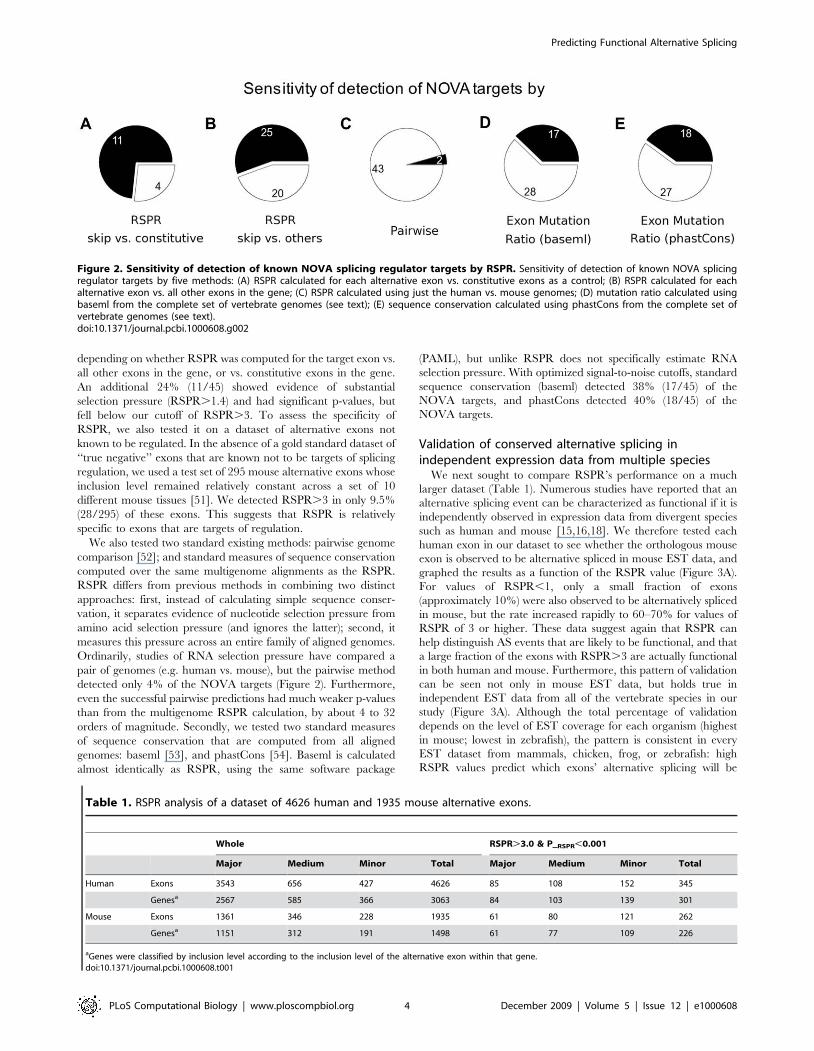
depending on whether RSPR was computed for the target exon vs.
all other exons in the gene, or vs. constitutive exons in the gene.
An additional 24% (11/45) showed evidence of substantial
selection pressure (RSPR.1.4) and had significant p-values, but
fell below our cutoff of RSPR.3. To assess the specificity of
RSPR, we also tested it on a dataset of alternative exons not
known to be regulated. In the absence of a gold standard dataset of
‘‘true negative’’ exons that are known not to be targets of splicing
regulation, we used a test set of 295 mouse alternative exons whose
inclusion level remained relatively constant across a set of 10
different mouse tissues [51]. We detected RSPR.3 in only 9.5%
(28/295) of these exons. This suggests that RSPR is relatively
specific to exons that are targets of regulation.
We also tested two standard existing methods: pairwise genome
comparison [52]; and standard measures of sequence conservation
computed over the same multigenome alignments as the RSPR.
RSPR differs from previous methods in combining two distinct
approaches: first, instead of calculating simple sequence conser-
vation, it separates evidence of nucleotide selection pressure from
amino acid selection pressure (and ignores the latter); second, it
measures this pressure across an entire family of aligned genomes.
Ordinarily, studies of RNA selection pressure have compared a
pair of genomes (e.g. human vs. mouse), but the pairwise method
detected only 4% of the NOVA targets (Figure 2). Furthermore,
even the successful pairwise predictions had much weaker p-values
than from the multigenome RSPR calculation, by about 4 to 32
orders of magnitude. Secondly, we tested two standard measures
of sequence conservation that are computed from all aligned
genomes: baseml [53], and phastCons [54]. Baseml is calculated
almost identically as RSPR, using the same software package
(PAML), but unlike RSPR does not specifically estimate RNA
selection pressure. With optimized signal-to-noise cutoffs, standard
sequence conservation (baseml) detected 38% (17/45) of the
NOVA targets, and phastCons detected 40% (18/45) of the
NOVA targets.
Validation of conserved alternative splicing inindependent expression data from multiple species
We next sought to compare RSPR’s performance on a much
larger dataset (Table 1). Numerous studies have reported that an
alternative splicing event can be characterized as functional if it is
independently observed in expression data from divergent species
such as human and mouse [15,16,18]. We therefore tested each
human exon in our dataset to see whether the orthologous mouse
exon is observed to be alternative spliced in mouse EST data, and
graphed the results as a function of the RSPR value (Figure 3A).
For values of RSPR,1, only a small fraction of exons
(approximately 10%) were also observed to be alternatively spliced
in mouse, but the rate increased rapidly to 60–70% for values of
RSPR of 3 or higher. These data suggest again that RSPR can
help distinguish AS events that are likely to be functional, and that
a large fraction of the exons with RSPR.3 are actually functional
in both human and mouse. Furthermore, this pattern of validation
can be seen not only in mouse EST data, but holds true in
independent EST data from all of the vertebrate species in our
study (Figure 3A). Although the total percentage of validation
depends on the level of EST coverage for each organism (highest
in mouse; lowest in zebrafish), the pattern is consistent in every
EST dataset from mammals, chicken, frog, or zebrafish: high
RSPR values predict which exons’ alternative splicing will be
Figure 2. Sensitivity of detection of known NOVA splicing regulator targets by RSPR. Sensitivity of detection of known NOVA splicingregulator targets by five methods: (A) RSPR calculated for each alternative exon vs. constitutive exons as a control; (B) RSPR calculated for eachalternative exon vs. all other exons in the gene; (C) RSPR calculated using just the human vs. mouse genomes; (D) mutation ratio calculated usingbaseml from the complete set of vertebrate genomes (see text); (E) sequence conservation calculated using phastCons from the complete set ofvertebrate genomes (see text).doi:10.1371/journal.pcbi.1000608.g002
Table 1. RSPR analysis of a dataset of 4626 human and 1935 mouse alternative exons.
Whole RSPR.3.0 & P__RSPR,0.001
Major Medium Minor Total Major Medium Minor Total
Human Exons 3543 656 427 4626 85 108 152 345
Genesa 2567 585 366 3063 84 103 139 301
Mouse Exons 1361 346 228 1935 61 80 121 262
Genesa 1151 312 191 1498 61 77 109 226
aGenes were classified by inclusion level according to the inclusion level of the alternative exon within that gene.doi:10.1371/journal.pcbi.1000608.t001
Predicting Functional Alternative Splicing
PLoS Computational Biology | www.ploscompbiol.org 4 December 2009 | Volume 5 | Issue 12 | e1000608
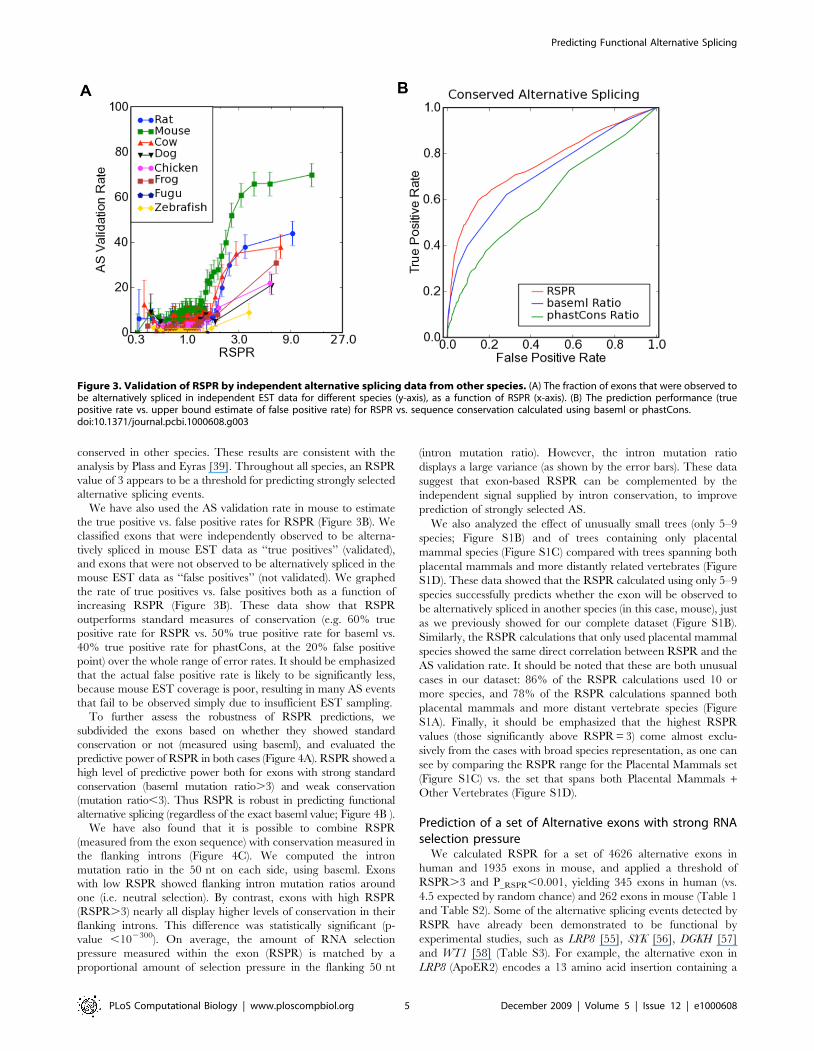
conserved in other species. These results are consistent with the
analysis by Plass and Eyras [39]. Throughout all species, an RSPR
value of 3 appears to be a threshold for predicting strongly selected
alternative splicing events.
We have also used the AS validation rate in mouse to estimate
the true positive vs. false positive rates for RSPR (Figure 3B). We
classified exons that were independently observed to be alterna-
tively spliced in mouse EST data as ‘‘true positives’’ (validated),
and exons that were not observed to be alternatively spliced in the
mouse EST data as ‘‘false positives’’ (not validated). We graphed
the rate of true positives vs. false positives both as a function of
increasing RSPR (Figure 3B). These data show that RSPR
outperforms standard measures of conservation (e.g. 60% true
positive rate for RSPR vs. 50% true positive rate for baseml vs.
40% true positive rate for phastCons, at the 20% false positive
point) over the whole range of error rates. It should be emphasized
that the actual false positive rate is likely to be significantly less,
because mouse EST coverage is poor, resulting in many AS events
that fail to be observed simply due to insufficient EST sampling.
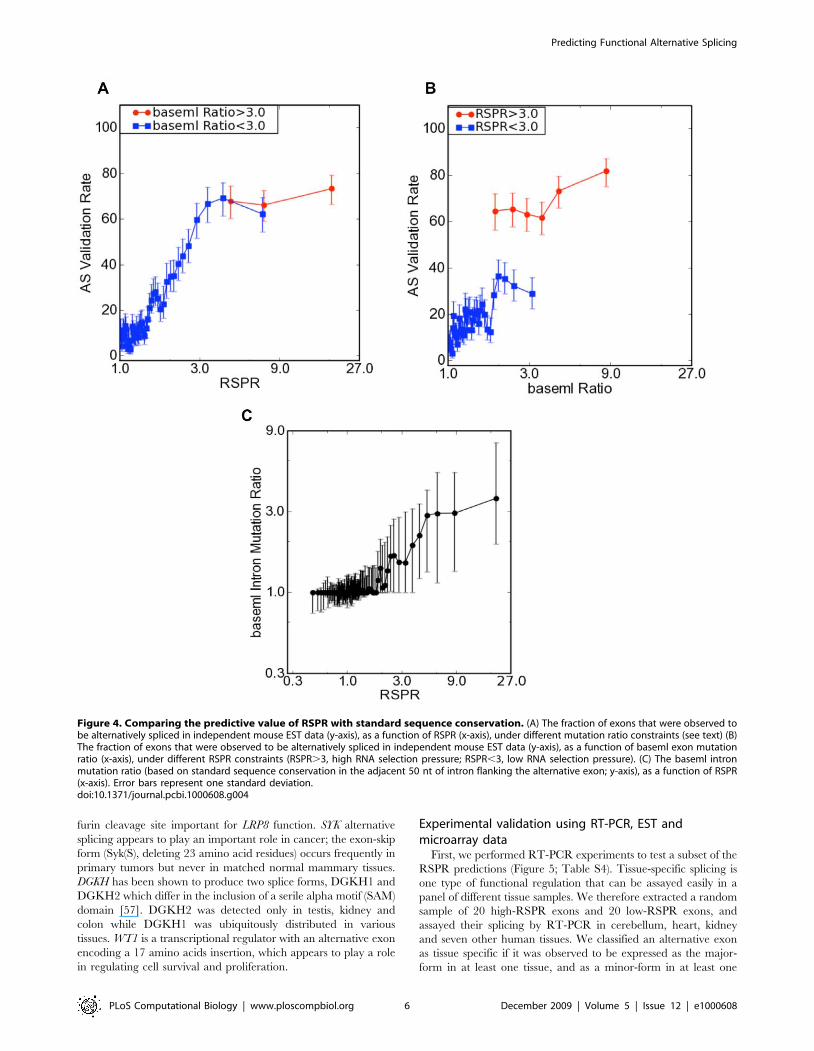
To further assess the robustness of RSPR predictions, we
subdivided the exons based on whether they showed standard
conservation or not (measured using baseml), and evaluated the
predictive power of RSPR in both cases (Figure 4A). RSPR showed a
high level of predictive power both for exons with strong standard
conservation (baseml mutation ratio.3) and weak conservation
(mutation ratio,3). Thus RSPR is robust in predicting functional
alternative splicing (regardless of the exact baseml value; Figure 4B ).
We have also found that it is possible to combine RSPR
(measured from the exon sequence) with conservation measured in
the flanking introns (Figure 4C). We computed the intron
mutation ratio in the 50 nt on each side, using baseml. Exons
with low RSPR showed flanking intron mutation ratios around
one (i.e. neutral selection). By contrast, exons with high RSPR
(RSPR.3) nearly all display higher levels of conservation in their
flanking introns. This difference was statistically significant (p-
value ,102300). On average, the amount of RNA selection
pressure measured within the exon (RSPR) is matched by a
proportional amount of selection pressure in the flanking 50 nt
(intron mutation ratio). However, the intron mutation ratio
displays a large variance (as shown by the error bars). These data
suggest that exon-based RSPR can be complemented by the
independent signal supplied by intron conservation, to improve
prediction of strongly selected AS.
We also analyzed the effect of unusually small trees (only 5–9
species; Figure S1B) and of trees containing only placental
mammal species (Figure S1C) compared with trees spanning both
placental mammals and more distantly related vertebrates (Figure
S1D). These data showed that the RSPR calculated using only 5–9
species successfully predicts whether the exon will be observed to
be alternatively spliced in another species (in this case, mouse), just
as we previously showed for our complete dataset (Figure S1B).
Similarly, the RSPR calculations that only used placental mammal
species showed the same direct correlation between RSPR and the
AS validation rate. It should be noted that these are both unusual
cases in our dataset: 86% of the RSPR calculations used 10 or
more species, and 78% of the RSPR calculations spanned both
placental mammals and more distant vertebrate species (Figure
S1A). Finally, it should be emphasized that the highest RSPR
values (those significantly above RSPR = 3) come almost exclu-
sively from the cases with broad species representation, as one can
see by comparing the RSPR range for the Placental Mammals set
(Figure S1C) vs. the set that spans both Placental Mammals +Other Vertebrates (Figure S1D).
Prediction of a set of Alternative exons with strong RNAselection pressure
We calculated RSPR for a set of 4626 alternative exons in
human and 1935 exons in mouse, and applied a threshold of
RSPR.3 and P_RSPR,0.001, yielding 345 exons in human (vs.
4.5 expected by random chance) and 262 exons in mouse (Table 1
and Table S2). Some of the alternative splicing events detected by
RSPR have already been demonstrated to be functional by
experimental studies, such as LRP8 [55], SYK [56], DGKH [57]
and WT1 [58] (Table S3). For example, the alternative exon in
LRP8 (ApoER2) encodes a 13 amino acid insertion containing a
Figure 3. Validation of RSPR by independent alternative splicing data from other species. (A) The fraction of exons that were observed tobe alternatively spliced in independent EST data for different species (y-axis), as a function of RSPR (x-axis). (B) The prediction performance (truepositive rate vs. upper bound estimate of false positive rate) for RSPR vs. sequence conservation calculated using baseml or phastCons.doi:10.1371/journal.pcbi.1000608.g003
Predicting Functional Alternative Splicing
PLoS Computational Biology | www.ploscompbiol.org 5 December 2009 | Volume 5 | Issue 12 | e1000608
furin cleavage site important for LRP8 function. SYK alternative
splicing appears to play an important role in cancer; the exon-skip
form (Syk(S), deleting 23 amino acid residues) occurs frequently in
primary tumors but never in matched normal mammary tissues.
DGKH has been shown to produce two splice forms, DGKH1 and
DGKH2 which differ in the inclusion of a serile alpha motif (SAM)
domain [57]. DGKH2 was detected only in testis, kidney and
colon while DGKH1 was ubiquitously distributed in various
tissues. WT1 is a transcriptional regulator with an alternative exon
encoding a 17 amino acids insertion, which appears to play a role
in regulating cell survival and proliferation.
Experimental validation using RT-PCR, EST andmicroarray data
First, we performed RT-PCR experiments to test a subset of the
RSPR predictions (Figure 5; Table S4). Tissue-specific splicing is
one type of functional regulation that can be assayed easily in a
panel of different tissue samples. We therefore extracted a random
sample of 20 high-RSPR exons and 20 low-RSPR exons, and
assayed their splicing by RT-PCR in cerebellum, heart, kidney
and seven other human tissues. We classified an alternative exon
as tissue specific if it was observed to be expressed as the major-
form in at least one tissue, and as a minor-form in at least one
Figure 4. Comparing the predictive value of RSPR with standard sequence conservation. (A) The fraction of exons that were observed tobe alternatively spliced in independent mouse EST data (y-axis), as a function of RSPR (x-axis), under different mutation ratio constraints (see text) (B)The fraction of exons that were observed to be alternatively spliced in independent mouse EST data (y-axis), as a function of baseml exon mutationratio (x-axis), under different RSPR constraints (RSPR.3, high RNA selection pressure; RSPR,3, low RNA selection pressure). (C) The baseml intronmutation ratio (based on standard sequence conservation in the adjacent 50 nt of intron flanking the alternative exon; y-axis), as a function of RSPR(x-axis). Error bars represent one standard deviation.doi:10.1371/journal.pcbi.1000608.g004
Predicting Functional Alternative Splicing
PLoS Computational Biology | www.ploscompbiol.org 6 December 2009 | Volume 5 | Issue 12 | e1000608
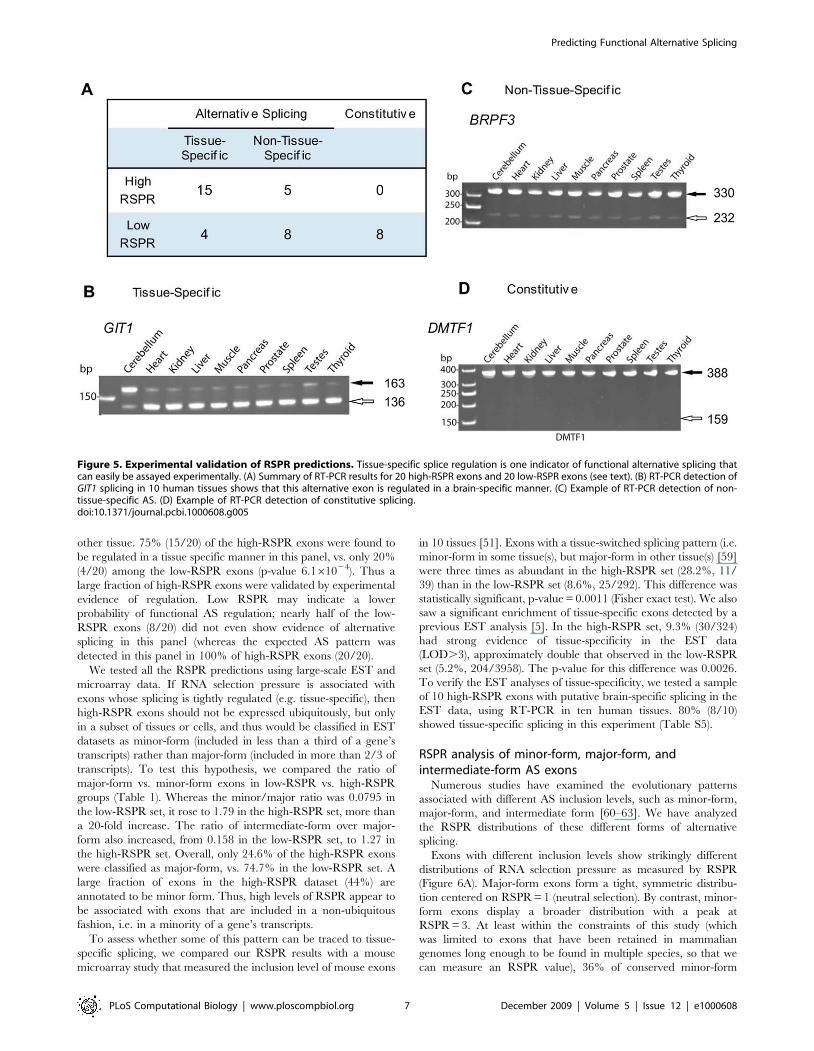
other tissue. 75% (15/20) of the high-RSPR exons were found to
be regulated in a tissue specific manner in this panel, vs. only 20%
(4/20) among the low-RSPR exons (p-value 6.161024). Thus a
large fraction of high-RSPR exons were validated by experimental
evidence of regulation. Low RSPR may indicate a lower
probability of functional AS regulation; nearly half of the low-
RSPR exons (8/20) did not even show evidence of alternative
splicing in this panel (whereas the expected AS pattern was
detected in this panel in 100% of high-RSPR exons (20/20).
We tested all the RSPR predictions using large-scale EST and
microarray data. If RNA selection pressure is associated with
exons whose splicing is tightly regulated (e.g. tissue-specific), then
high-RSPR exons should not be expressed ubiquitously, but only
in a subset of tissues or cells, and thus would be classified in EST
datasets as minor-form (included in less than a third of a gene’s
transcripts) rather than major-form (included in more than 2/3 of
transcripts). To test this hypothesis, we compared the ratio of
major-form vs. minor-form exons in low-RSPR vs. high-RSPR
groups (Table 1). Whereas the minor/major ratio was 0.0795 in
the low-RSPR set, it rose to 1.79 in the high-RSPR set, more than
a 20-fold increase. The ratio of intermediate-form over major-
form also increased, from 0.158 in the low-RSPR set, to 1.27 in
the high-RSPR set. Overall, only 24.6% of the high-RSPR exons
were classified as major-form, vs. 74.7% in the low-RSPR set. A
large fraction of exons in the high-RSPR dataset (44%) are
annotated to be minor form. Thus, high levels of RSPR appear to
be associated with exons that are included in a non-ubiquitous
fashion, i.e. in a minority of a gene’s transcripts.
To assess whether some of this pattern can be traced to tissue-
specific splicing, we compared our RSPR results with a mouse
microarray study that measured the inclusion level of mouse exons
in 10 tissues [51]. Exons with a tissue-switched splicing pattern (i.e.
minor-form in some tissue(s), but major-form in other tissue(s) [59]
were three times as abundant in the high-RSPR set (28.2%, 11/
39) than in the low-RSPR set (8.6%, 25/292). This difference was
statistically significant, p-value = 0.0011 (Fisher exact test). We also
saw a significant enrichment of tissue-specific exons detected by a
previous EST analysis [5]. In the high-RSPR set, 9.3% (30/324)
had strong evidence of tissue-specificity in the EST data
(LOD.3), approximately double that observed in the low-RSPR
set (5.2%, 204/3958). The p-value for this difference was 0.0026.
To verify the EST analyses of tissue-specificity, we tested a sample
of 10 high-RSPR exons with putative brain-specific splicing in the
EST data, using RT-PCR in ten human tissues. 80% (8/10)
showed tissue-specific splicing in this experiment (Table S5).
RSPR analysis of minor-form, major-form, andintermediate-form AS exons
Numerous studies have examined the evolutionary patterns
associated with different AS inclusion levels, such as minor-form,
major-form, and intermediate form [60–63]. We have analyzed
the RSPR distributions of these different forms of alternative
splicing.
Exons with different inclusion levels show strikingly different
distributions of RNA selection pressure as measured by RSPR
(Figure 6A). Major-form exons form a tight, symmetric distribu-
tion centered on RSPR = 1 (neutral selection). By contrast, minor-
form exons display a broader distribution with a peak at
RSPR = 3. At least within the constraints of this study (which
was limited to exons that have been retained in mammalian
genomes long enough to be found in multiple species, so that we
can measure an RSPR value), 36% of conserved minor-form
Figure 5. Experimental validation of RSPR predictions. Tissue-specific splice regulation is one indicator of functional alternative splicing thatcan easily be assayed experimentally. (A) Summary of RT-PCR results for 20 high-RSPR exons and 20 low-RSPR exons (see text). (B) RT-PCR detection ofGIT1 splicing in 10 human tissues shows that this alternative exon is regulated in a brain-specific manner. (C) Example of RT-PCR detection of non-tissue-specific AS. (D) Example of RT-PCR detection of constitutive splicing.doi:10.1371/journal.pcbi.1000608.g005
Predicting Functional Alternative Splicing
PLoS Computational Biology | www.ploscompbiol.org 7 December 2009 | Volume 5 | Issue 12 | e1000608
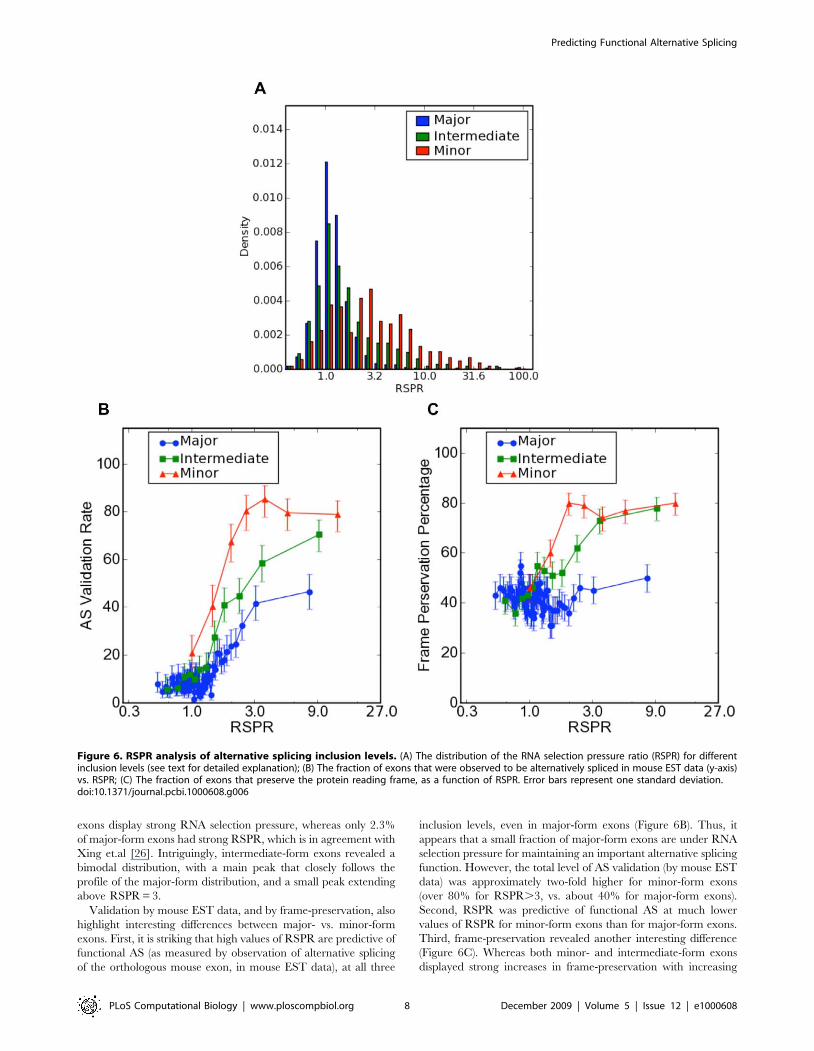
exons display strong RNA selection pressure, whereas only 2.3%
of major-form exons had strong RSPR, which is in agreement with
Xing et.al [26]. Intriguingly, intermediate-form exons revealed a
bimodal distribution, with a main peak that closely follows the
profile of the major-form distribution, and a small peak extending
above RSPR = 3.
Validation by mouse EST data, and by frame-preservation, also
highlight interesting differences between major- vs. minor-form
exons. First, it is striking that high values of RSPR are predictive of
functional AS (as measured by observation of alternative splicing
of the orthologous mouse exon, in mouse EST data), at all three
inclusion levels, even in major-form exons (Figure 6B). Thus, it
appears that a small fraction of major-form exons are under RNA
selection pressure for maintaining an important alternative splicing
function. However, the total level of AS validation (by mouse EST
data) was approximately two-fold higher for minor-form exons
(over 80% for RSPR.3, vs. about 40% for major-form exons).
Second, RSPR was predictive of functional AS at much lower
values of RSPR for minor-form exons than for major-form exons.
Third, frame-preservation revealed another interesting difference
(Figure 6C). Whereas both minor- and intermediate-form exons
displayed strong increases in frame-preservation with increasing
Figure 6. RSPR analysis of alternative splicing inclusion levels. (A) The distribution of the RNA selection pressure ratio (RSPR) for differentinclusion levels (see text for detailed explanation); (B) The fraction of exons that were observed to be alternatively spliced in mouse EST data (y-axis)vs. RSPR; (C) The fraction of exons that preserve the protein reading frame, as a function of RSPR. Error bars represent one standard deviation.doi:10.1371/journal.pcbi.1000608.g006
Predicting Functional Alternative Splicing
PLoS Computational Biology | www.ploscompbiol.org 8 December 2009 | Volume 5 | Issue 12 | e1000608
RSPR, major-form exons remained at background frame-
preservation levels (around 40%) across the whole range of RSPR
values. This implies that RNA selection pressure is associated with
‘‘modular’’ protein sequence insertions for minor- and intermedi-
ate-form exons (i.e. insertions that do not alter the reading frame
of the downstream protein sequence), but not for major-form
exons.
Prediction of a strongly selected AS event in the EXOC7gene
Our RSPR results predict hundreds of alternative exons as
strongly selected alternative splicing events. As one example,
EXOC7 is a component of the exocyst, an evolutionarily conserved
octameric protein complex essential for exocytosis. The protein
structure of mouse Exoc7 [64], published recently, includes 19 a-
helices linked with loops. EST data reveal several alternative exons,
including two groups that map to disordered regions in the protein
structure, one between helix 6 and helix 7, and the other between
helix 12 and helix 13 (see Table S6). The latter (exon_id 25261 in
ASAP II) contains 39 nucleotides, and is alternatively spliced within
independent EST data not only for human, but also for mouse, dog,
cow and frog (Figure 7). Our RSPR analysis detected this exon as
having strong RNA selection pressure: RSPR = 6.24, measured
over Human, Chimpanzee, Rhesus, Rat, Mouse, Hedgehog, Dog,
Cat, Horse, Cow, Opossum, Platypus, Chicken, Lizard, Frog,
Tetraodon, Fugu, Medaka and Zebrafish, with a P_RSPR of
1.67610210. ASAP2 reports this splicing event as tissue-specific to
brain_nerve (with LOD 2.5) and retina (LOD 2.2) [5], and RT-
PCR experiments confirmed its brain-specific splicing pattern
(Figure 7D). NetPhos analysis [65] indicates a set of phosphorylation
sites nearby (See Figure 7B). FAS-ESS (http://genes.mit.edu/
fas-ess/) [49] identifies four ESS motifs in this exon (Figure 7E).
Although the function of this exon is unknown, all these clues
suggest that its alternative splicing has played an important
functional role over a very long period of vertebrate evolution.
Discussion
We have presented an effective method for estimating RNA
selection pressure within an individual exon, and have tested its
predictions against a variety of empirical measures of functional
alternative splicing, such as known NOVA-regulated exons,
conserved alternative splicing, frame preservation, and tissue-
specific splicing patterns. We have also predicted a large dataset of
strongly selected AS exons that can be useful targets for biologists
to study the regulation of alternative splicing. Not only can the
high-RSPR dataset furnish biologists with new insights into well-
studied genes, but also identifies many new targets worthy of
experimental study, in the form of strongly selected alternative
splicing events.
These data suggest several possible benefits of RSPR. It
provides a general way for distinguishing selection pressures that
operate at the nucleotide level rather than protein level. RNA
selection pressure may reflect many possible functional mecha-
nisms, such as binding sites of splicing regulators including exon
splicing enhancers (ESE) and exon splicing silencers (ESS) [48,49].
As an example, ESE/ESS analyses for GRIN1 and EXOC7
annotated slightly under one-half of sites in these high-RSPR
exons as ESEs or ESSs. Finally, RSPR integrates several powerful
tools in comparative genomics, such as MULTIZ multiple genome
alignments and PAML evolutionary model inference, and can in
principle be applied to any genome.
Previous studies have reported that minor-form exons were
associated with increased values of Ka/Ks and Ka compared with
neighboring constitutive exons [26,35–37] (for a review see [42]).
Our results are consistent with this pattern; the distributions of
Ka/Ks and Ka for minor-form exons showed significant increases
relative to their control regions (neighboring consitutive exons;
Figure S2 AB). Moreover, this pattern was also observed for
minor-form exons with high RSPR values (Figure S2 C ).
Our approach has important limitations. First, it is important to
emphasize that it seeks to detect RNA selection pressure, but gives
no suggestion of what specific functional mechanism might cause
it. Other possible patterns of selection that might be detected by
RSPR include RNA secondary structure present within the pre-
mRNA [42], miRNA binding sites, or binding sites in the parent
DNA sequence. While some RSPR may be associated with ESE
and ESS motifs, we cannot assume that they fully explain the
RSPR in alternative exons. Consistent with several previous
studies [35,66] (see [43] for a review), we did not observe an
overall correlation between the RESCUE-ESE density and RSPR,
or between FAS-ESS density and RSPR in alternative exons (data
not shown). Second, in this paper we have focused on
demonstrating the predictive value of calculating RSPR within
exonic sequence, without taking into account other useful
information such as the flanking intron sequence, frame
preservation, expression data from multiple species etc. An
integrated prediction method would presumably make use of all
available information [18]. A naive initial approach, based on
simply multiplying the p-values from baseml (for the flanking
intron conservation) and from codeml (for the exon RSPR
conservation) did not appear to give major improvements of
prediction accuracy in our preliminary tests, compared with
simply using the codeml p-value. Since the two calculations use
different programs (baseml vs. codeml) and different mutation
models (single-nucleotide based vs. codon based), combining them
in a single integrated calculation is not trivial. Third, RSPR is
calculated based on the multiple genome alignment, and thus
requires that an exon be sufficiently conserved among several
genomes to be aligned.
Materials and Methods
DataWe obtained data for alternative exons (exon skipping) and
constitutive exons in the same gene, from the ASAP II database
[67]. Based on EST data, ASAPII classified each alternative exon
as Major form (exon inclusion level greater than 2/3), Minor-form
(exon inclusion level less than 1/3) and Intermediate-form (exon
inclusion level between 1/3 and 2/3). We defined a constitutive
exon as an exon that is included in all transcript isoforms of the
gene (inclusion level 100%). We used several additional kinds of
data to validate the prediction of functional alternative splicing,
such as conserved alternative splicing based on independent EST
data from multiple species assembled in the ASAPII database [67],
tissue-switched alternative exons identified in the mouse micro-
array data of Pan et al. [51,59].
We obtained all genome alignment information used in this
study from the UCSC 28 vertebrate genome alignment
hg18_multiz28way [68], available from ftp://hgdownload.cse.
ucsc.edu/. This alignment includes the following complete
genomes: Human, Armadillo, Bushbaby, Cat, Chicken, Chim-
panzee, Cow, Dog, Elephant, Frog, Fugu, Guinea Pig, Hedgehog,
Horse, Lizard, Medaka, Mouse, Opossum, Platypus, Rabbit, Rat,
Rhesus, Shrew, Stickleback, Tenrec, Tetraodon, Tree shrew and
Zebrafish.
We used the list of NOVA target exons of Jelen et al. [50] as a
validation testset for our RSPR predictions. We were able to
Predicting Functional Alternative Splicing
PLoS Computational Biology | www.ploscompbiol.org 9 December 2009 | Volume 5 | Issue 12 | e1000608
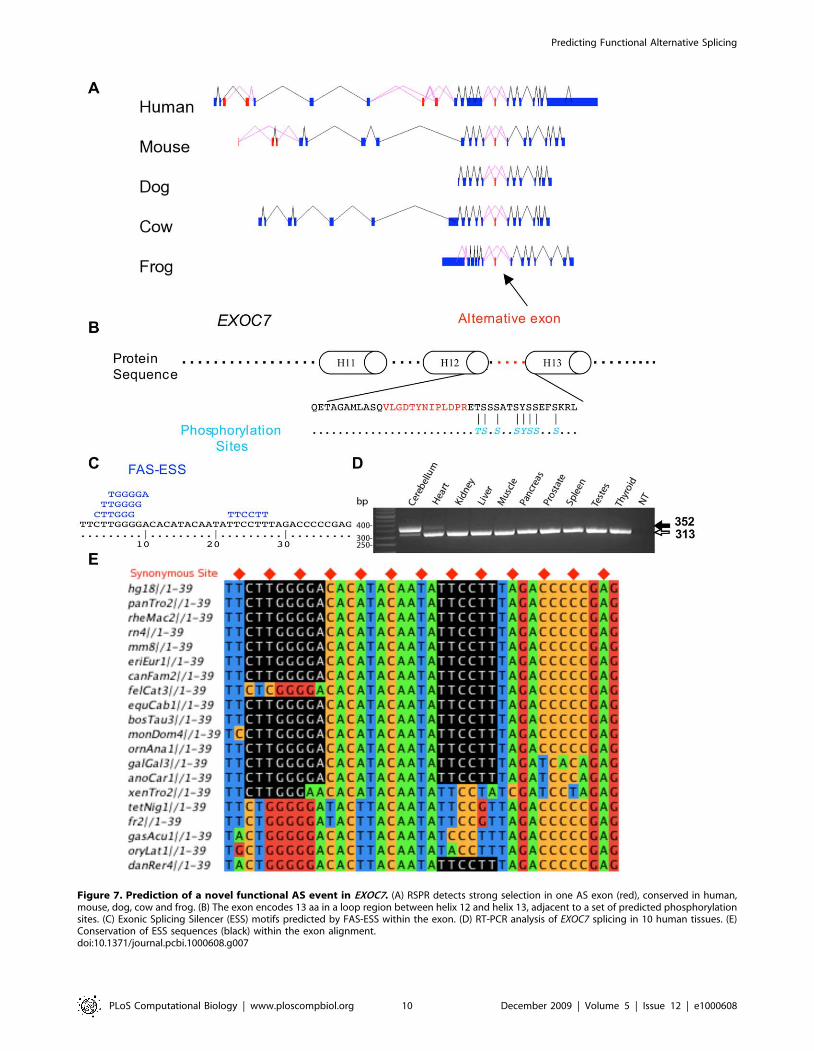
Figure 7. Prediction of a novel functional AS event in EXOC7. (A) RSPR detects strong selection in one AS exon (red), conserved in human,mouse, dog, cow and frog. (B) The exon encodes 13 aa in a loop region between helix 12 and helix 13, adjacent to a set of predicted phosphorylationsites. (C) Exonic Splicing Silencer (ESS) motifs predicted by FAS-ESS within the exon. (D) RT-PCR analysis of EXOC7 splicing in 10 human tissues. (E)Conservation of ESS sequences (black) within the exon alignment.doi:10.1371/journal.pcbi.1000608.g007
Predicting Functional Alternative Splicing
PLoS Computational Biology | www.ploscompbiol.org 10 December 2009 | Volume 5 | Issue 12 | e1000608

obtain genomic coordinates and genome alignments for 45 of
NOVA targets published in Jelen et al., which were used for the
validation tests presented in Figure 1D and Table S1.
RNA selection pressure ratio calculationWe calculated the RNA Selection Pressure Ratio (RSPR) for
each alternative exon compared with the constitutive exons within
the same transcript isoform. Here we briefly summarize each step
(See Figure S3): 1) each exon was mapped to orthologous exons in
the 28 aligned genomes using the NLMSA alignment query tool
[69] in the Pygr software package (http://code.google.com/p/
pygr/). 2) each orthologous exon was required to retain the aligned
splice sites and maintain a minimum of 70% amino acid identity
(calculated by needle in EMBOSS [70]. For each exon, a minimum
of 5 species was required. We ranked constitutive exons in a given
gene by the number of species with orthologous exons, and
identified the top third (i.e. most widely conserved exons), or a
minimum of four constitutive exons, to represent that gene. 3) We
then found the subset of species that were each aligned to all of these
exons as well as to the alternative exon. That is, we computed the
intersection of the sets of species that are aligned to each of these
exons. This yielded the subset of species that we used for the RSPR
calculation. 4) Next, we generated the list of constitutive exons that
were aligned to all of these species, and used these as the control
region for the RSPR calculation. 5) We extracted the alignment
consisting of just this subset of species, for the control region + the
alternative exon. 6) Prior to calculating RSPR, gaps were removed
from the alignment. Specifically, only codons that were present in
each of the species in the subset were retained in the alignment:
amino acid sequences for the orthologous exons were aligned using
clustalw [71], columns containing gaps were removed. This
procedure ensures that RSPR is calculated using the exact same
tree of species for the control region as for the alternative exon.
We used the multi-partition model D [72] of the PAML
program codeml (http://abacus.gene.ucl.ac.uk/software/paml.
html) to calculate maximum likelihood estimates of the RSPR,
and a p-value for the null hypothesis of neutral RNA selection (i.e.
RSPR = 1). Codeml uses a codon substitution model that is similar
to the HKY85 nucleotide substitution model. Although codeml
does not directly compute RSPR, its output parameters can be
used to calculate RSPR. The gap-trimmed nucleotide sequences
and a tree file including the phylogenetic tree for the subset of
aligned species[68] were submitted to the codeml program, which
estimates a set of evolutionary parameters from the whole tree, by
maximum likelihood. We defined the RSPR as the ratio of
synonymous mutation rate Ks for the alternative exon vs. the
constitutive exons among all branches in the phylogenetic tree:
r~Ks0
Ks1
ð1Þ
where subscript 0 indicates the constitutive exons, and subscript 1
indicates the alternative exon. Based on this definition, a high
RSPR value implies the alternative exon is under stronger negative
RNA selection pressure than the corresponding constitutive exons.
Ordinarily, for each branch in the tree, codeml estimates the total
branch length t [73], which is related to the synonymous and non-
synonymous substitution densities Ks and Ka via the ratio
t~Ks:SzKa:N
SzN~Ks
Szv:N
SzNð2Þ
where S and N are the number of synonymous and non-
synonymous sites respectively. In multiple partition mode, tb for
each branch b is replaced by t0b (for the constitutive exons) and t1b
(for the alternative exon), related by the partition ratio
r~t0
t1ð3Þ
which has a single value over the entire tree (i.e. for every branch
b, t0b is constrained to be equal to t0b = r t1b). Based on the input
phylogenetic tree and sequence alignment, codeml simultaneously
estimates t1b (for each branch), r (for the whole tree), as well as the
pj, k0, k1, and v0, v1 values (for the whole tree). Finally,
combining equations 1, 2, and 3, we computed the RNA selection
pressure ratio r:
r~rS1zN1v1ð Þ S0zN0ð ÞS0zN0v0ð Þ S1zN1ð Þ ð4Þ
where S0, S1 and N0, N1 are the number of synonymous and non-
synonymous sites in the constitutive exons vs. the alternative exon,
respectively.
We also modified codeml to be able to compute the likelihood
under the constraint r= 1. We computed the p-value P_RSPR for
the null hypothesis RSPR = 1 based on the log-odds ratio
2log(L(rML)/L(r= 1)), which follows a x2 distribution with one
degree of freedom, where rML is the original maximum likelihood
estimate of r obtained above.
Sequence conservation scoringWe used two different standard methods for computing sequence
conservation, baseml [53] and phastCons [54]. The baseml
calculation used the HKY85 nucleotide substitution model
(model = 4) and the Mgene = 3 multiple partition mode, similar to
our codeml calculation. RSPR and baseml are calculated almost
identically using the PAML package; the only difference is that
whereas RSPR is calculated from the Ks ratio (eq. 1, above), for
baseml we simply used the total nucleotide substitution ratio r (eq. 3,
above). We calculated this ratio both for the alternative exon, and its
flanking intronic regions (50 nt flanking each exon on each side).
PhastCons [54] is a widely used method for measuring sequence
conservation in multiple genome alignments, used for example in
the UCSC genome browser. We used phastCons to compute the
ratio g for a region of interest compared with a control region
(analogous to the RSPR), as follows:
g~N0
N1
~1{C0
1{C1
ð5Þ
where N0 is the average probability of the phastCons non-
conserved state in the control region, vs. N1 in the region of
interest, and C0 is the average phastCons score in the control
region, vs. C1 in the region of interest. We applied this both to
exons (constitutive exons vs. alternative exon), and their flanking
introns (50 nt flanking each exon on each side). We also calculated
a P value based on the phastCons score for the null hypothesis that
the mutation density is equal in the control region vs. region of
interest. Specifically, we performed the Wilcoxon rank sum test on
the phastCons scores for each nucleotide from the control region,
vs. for each nucleotide from the region of interest.
For performing the NOVA analysis (Figure 2), we first
determined cutoffs for the baseml ratio and phastCons ratio that
yielded the same false positive rate in our ROC analysis (Figure 3B)
as our RSPR cutoff (RSPR = 3): baseml ratio = 2.9; phastCons
ratio = 45. Thus the NOVA analysis compares the sensitivity of
Predicting Functional Alternative Splicing
PLoS Computational Biology | www.ploscompbiol.org 11 December 2009 | Volume 5 | Issue 12 | e1000608
these different methods, when calibrated to the same level of
specificity.
Validation sample constructionWe generated a random sample of 20 high-RSPR exons
(RSPR.3 and p,0.001), and a random sample of 20 low-RSPR
exons (RSPR,1.0 and p,0.001). We then designed primers and
performed RT-PCR as described below. As a separate test to confirm
putative brain-specific splicing identified from EST data, we
performed a join of the high-RSPR exon set and a previous database
of EST evidence of brain-specific splicing [5]. We selected ten exons
from this group, and performed RT-PCR as described below.
RT-PCR and sequencing analysis of high RSPR exons inten human tissues
Total RNA samples from 10 human tissues were purchased
from Clontech (Mountain View, CA). Single-pass cDNA was
synthesized using High-Capacity cDNA Reverse Transcription
Kit (Applied Biosystems, Foster City, CA) according to manufac-
turer’s instructions. For each tested exon, we designed a pair of
forward and reverse PCR primers at flanking constitutive exons
using PRIMER3. Two mg of total RNA were used for each 20 ul
cDNA synthesis reaction. For each exon, 15 ng total RNA
equivalent of cDNA were used for the amplification in a 10 ml
PCR reaction. For each exon tested, three DNA polymerase
systems were used to optimize RT-PCR reaction: HerculaseH II
Fusion DNA Polymerase (Stratagene, La Jolla, CA), HotStarTaq
DNA Polymerase (Qiagen, Valencia CA) and PhireH Hot Start
DNA Polymerase (NEB, Ipswich, MA). PCR reactions were run
between 25 to 35 cycles (optimized for each exon) in a Bio-Rad
thermocycler with an annealing temperature of 62 to 66uC(optimized for each exon). The reaction products were resolved on
2% TAE/agarose gels or 5% TBE polyacrylamide gels. Each
result was a representation of 3–6 RT-PCR replications. DNA
fragments with ambiguous sizes were cloned for sequencing using
Zero BluntH TOPOH PCR Cloning Kit (Invitrogen, Carlsbad,
CA). Gel images (Table S4 and Table S5) were visually assessed as
tissue specific if the alternative exon’s splicing fraction (percentage
of the exon-inclusion isoform vs. the exon-skip isoform) changed
by a factor of two or greater in different tissues.
Supporting Information
Table S1 RSPR for NOVA target exons with all other exons as
control. RSPR results for known NOVA targets tabulated from
Jelen et al. Significant RSPR results with RSPR .3.0 or
P_RSPR,0.001 are marked in red.
Found at: doi:10.1371/journal.pcbi.1000608.s001 (0.09 MB PDF)
Table S2 Complete Dataset of Alternative Exons with Strong
RNA Selection Pressure in Human and Mouse. All human and
mouse AS exons with RSPR.3 and P_RSPR,0.001 are listed.
Found at: doi:10.1371/journal.pcbi.1000608.s002 (0.35 MB PDF)
Table S3 Confirmed functional alternative splicing in predicted
dataset. RSPR predictions that were validated as functional AS
events by published literature.
Found at: doi:10.1371/journal.pcbi.1000608.s003 (0.12 MB PDF)
Table S4 RT-PCR Analysis of 20 High-RSPR AS Exons vs. 20
Low-RSPR AS Exons. No. 1–20 exons are with high RSPR
(RSPR.3.0, P_RSPR,0.001), No. 21–40 exons are with low
RSPR (RSPR,1.0, P_RSPR,0.001). Tissue-specific AS: T-AS,
Non-Tissue-specific AS: NT-AS, Constitutive: Const; Solid arrow:
Inclusion, Hollow arrow: Skipping, Dashed arrow: Non-specific
amplification by PCR.
Found at: doi:10.1371/journal.pcbi.1000608.s004 (3.20 MB PDF)
Table S5 RT-PCR Validation of 10 Brain-Specific Exons. We
performed RT-PCR experiments to test a subset of the RSPR
predictions. Tissue-specific splicing is one type of functional
regulation that can be assayed easily in a panel of different tissue
samples. We therefore extracted a subset of high RSPR exons that
were also predicted by bioinformatics to up-regulated in brain
based on available EST counts. We assayed their splicing by RT-
PCR in cerebellum, heart, kidney and seven other human tissues.
80% (8/10) were found to be regulated in a tissue-specific manner.
Thus a large fraction of high-RSPR exons were validated by
experimental evidence of functional regulation.
Found at: doi:10.1371/journal.pcbi.1000608.s005 (1.09 MB PDF)
Table S6 Alternative Exons in Exoc7. RSPR results for AS
exons in Exoc7. TISSUE LOD: Log Odds score (log-base 10) for
tissue-specific AS in the specified tissues.
Found at: doi:10.1371/journal.pcbi.1000608.s006 (0.07 MB PDF)
Figure S1 Analysis of the species used for RSPR calculations on
human AS exons. (A) A histogram of the number of species used
for each RSPR calculation. (B–D) The fraction of exons that were
observed to be alternatively spliced in independent mouse EST
data (y-axis), as a function of RSPR (x-axis), for (B) the set of
RSPR calculations with 5–9 species; (C) the set of RSPR
calculation that used only placental mammal species; (D) the set
of RSPR calculations that used both placental mammals and other
vertebrates.
Found at: doi:10.1371/journal.pcbi.1000608.s007 (0.61 MB TIF)
Figure S2 Ka/Ks and Ka distributions for different exon
inclusion levels. For each alternative exon, we calculated the log-
difference for its Ka/Ks or Ka relative to its control region
(constitutive exons in the same gene). We then plotted their
distributions for minor form, major form, and intermediate form
alternative exons. (A) Histograms of the amino acid selection
pressure (Ka/Ks); (B) Histograms of the non-synonymous
mutation rate (Ka); (C) A scatter plot of the non-synonymous
mutation rate (y-axis) vs. RSPR (x-axis).
Found at: doi:10.1371/journal.pcbi.1000608.s008 (0.43 MB TIF)
Figure S3 A flow chart of the RNA selection pressure ratio
(RSPR) calculation.
Found at: doi:10.1371/journal.pcbi.1000608.s009 (0.07 MB TIF)
Acknowledgments
We wish to thank Peng Jiang for technical assistance, and Drs. Grace Xiao,
Doug Black, Meenakshi Roy, Alex Alekseyenko, Namshin Kim and Qi
Wang for helpful comments on this work.
Author Contributions
Conceived and designed the experiments: HL YX CJL. Performed the
experiments: HL LL SS. Analyzed the data: HL YX. Wrote the paper: HL
CJL.
References
1. Black DL (2003) Mechanisms of alternative pre-messenger RNA splicing. Annu
Rev Biochem 72: 291–336.
2. Graveley BR (2001) Alternative splicing: increasing diversity in the proteomic
world. Trends Genet 17: 100–107.
Predicting Functional Alternative Splicing
PLoS Computational Biology | www.ploscompbiol.org 12 December 2009 | Volume 5 | Issue 12 | e1000608
3. Blencowe BJ (2006) Alternative splicing: new insights from global analyses. Cell126: 37–47.
4. Stamm S, Ben-Ari S, Rafalska I, Tang Y, Zhang Z, et al. (2005) Function of
alternative splicing. Gene 344: 1–20.
5. Xu Q, Modrek B, Lee C (2002) Genome-wide detection of tissue-specific
alternative splicing in the human transcriptome. Nucleic Acids Res 30:
3754–3766.
6. Xing Y (2007) Genomic analysis of RNA alternative splicing in cancers. Front
Biosci 12: 4034–4041.
7. Xu Q, Lee C (2003) Discovery of novel splice forms and functional analysis of
cancer-specific alternative splicing in human expressed sequences. Nucleic AcidsRes 31: 5635–5643.
8. Brett D, Pospisil H, Valcarcel J, Reich J, Bork P (2002) Alternative splicing and
genome complexity. Nat Genet 30: 29–30.
9. Johnson JM, Castle J, Garrett-Engele P, Kan Z, Loerch PM, et al. (2003)
Genome-wide survey of human alternative pre-mRNA splicing with exon
junction microarrays. Science 302: 2141–2144.
10. Sultan M, Schulz MH, Richard H, Magen A, Klingenhoff A, et al. (2008) A
global view of gene activity and alternative splicing by deep sequencing of the
human transcriptome. Science 321: 956–960.
11. Sorek R, Shamir R, Ast G (2004) How prevalent is functional alternative splicing
in the human genome? Trends Genet 20: 68–71.
12. Lareau LF, Green RE, Bhatnagar RS, Brenner SE (2004) The evolving roles ofalternative splicing. Curr Opin Struct Biol 14: 273–282.
13. Pan Q, Shai O, Lee LJ, Frey BJ, Blencowe BJ (2008) Deep surveying of
alternative splicing complexity in the human transcriptome by high-throughputsequencing. Nat Genet.
14. Wang ET, Sandberg R, Luo S, Khrebtukova I, Zhang L, et al. (2008)
Alternative isoform regulation in human tissue transcriptomes. Nature.
15. Nurtdinov RN, Artamonova II, Mironov AA, Gelfand MS (2003) Low
conservation of alternative splicing patterns in the human and mouse genomes.
Hum Mol Genet 12: 1313–1320.
16. Sugnet CW, Kent WJ, Ares M, Jr., Haussler D (2004) Transcriptome and
genome conservation of alternative splicing events in humans and mice. Pac
Symp Biocomput. pp 66–77.
17. Thanaraj TA, Clark F, Muilu J (2003) Conservation of human alternative splice
events in mouse. Nucleic Acids Res 31: 2544–2552.
18. Yeo GW, Van Nostrand E, Holste D, Poggio T, Burge CB (2005) Identification
and analysis of alternative splicing events conserved in human and mouse. ProcNatl Acad Sci U S A 102: 2850–2855.
19. McGlincy NJ, Smith CW (2008) Alternative splicing resulting in nonsense-
mediated mRNA decay: what is the meaning of nonsense? Trends Biochem Sci.
20. Lareau LF, Brooks AN, Soergel DA, Meng Q, Brenner SE (2007) The coupling
of alternative splicing and nonsense-mediated mRNA decay. Adv Exp Med Biol
623: 190–211.
21. Hentze MW, Kulozik AE (1999) A perfect message: RNA surveillance and
nonsense-mediated decay. Cell 96: 307–310.
22. Lewis BP, Green RE, Brenner SE (2003) Evidence for the widespread couplingof alternative splicing and nonsense-mediated mRNA decay in humans. Proc
Natl Acad Sci U S A 100: 189–192.
23. Kriventseva EV, Koch I, Apweiler R, Vingron M, Bork P, et al. (2003) Increaseof functional diversity by alternative splicing. Trends Genet 19: 124–128.
24. Yura K, Shionyu M, Hagino K, Hijikata A, Hirashima Y, et al. (2006)
Alternative splicing in human transcriptome: functional and structural influenceon proteins. Gene 380: 63–71.
25. Resch A, Xing Y, Alekseyenko A, Modrek B, Lee C (2004) Evidence for a
subpopulation of conserved alternative splicing events under selection pressurefor protein reading frame preservation. Nucleic Acids Res 32: 1261–1269.
26. Xing Y, Lee C (2005) Evidence of functional selection pressure for alternative
splicing events that accelerate evolution of protein subsequences. Proc Natl Acad
Sci USA 102: 13526–13531.
27. Nawa H, Kotani H, Nakanishi S (1984) Tissue-specific generation of two
preprotachykinin mRNAs from one gene by alternative RNA splicing. Nature
312: 729–734.
28. Turner JD, Schote AB, Macedo JA, Pelascini LP, Muller CP (2006) Tissue
specific glucocorticoid receptor expression, a role for alternative first exon usage?
Biochem Pharmacol 72: 1529–1537.
29. Chretien S, Dubart A, Beaupain D, Raich N, Grandchamp B, et al. (1988)
Alternative transcription and splicing of the human porphobilinogen deaminase
gene result either in tissue-specific or in housekeeping expression. Proc NatlAcad Sci U S A 85: 6–10.
30. Clark TA, Schweitzer AC, Chen TX, Staples MK, Lu G, et al. (2007) Discovery
of tissue-specific exons using comprehensive human exon microarrays. GenomeBiol 8: R64.
31. Chen L, Zheng S (2008) Identify alternative splicing events based on position-
specific evolutionary conservation. PLoS ONE 3: e2806.
32. Hurst LD, Pal C (2001) Evidence for purifying selection acting on silent sites in
BRCA1. Trends Genet 17: 62–65.
33. Iida K, Akashi H (2000) A test of translational selection at ‘silent’ sites in thehuman genome: base composition comparisons in alternatively spliced genes.
Gene 261: 93–105.
34. Ermakova EO, Nurtdinov RN, Gelfand MS (2006) Fast rate of evolution in
alternatively spliced coding regions of mammalian genes. BMC Genomics 7: 84.
35. Parmley JL, Chamary JV, Hurst LD (2006) Evidence for purifying selectionagainst synonymous mutations in mammalian exonic splicing enhancers. Mol
Biol Evol 23: 301–309.
36. Chen FC, Wang SS, Chen CJ, Li WH, Chuang TJ (2006) Alternatively andconstitutively spliced exons are subject to different evolutionary forces. Mol Biol
Evol 23: 675–682.
37. Baek D, Green P (2005) Sequence conservation, relative isoform frequencies,
and nonsense-mediated decay in evolutionarily conserved alternative splicing.Proc Natl Acad Sci USA 102: 12813–12818.
38. Chen FC, Chaw SM, Tzeng YH, Wang SS, Chuang TJ (2007) Opposite
evolutionary effects between different alternative splicing patterns. Mol Biol Evol24: 1443–1446.
39. Plass M, Eyras E (2006) Differentiated evolutionary rates in alternative exonsand the implications for splicing regulation. BMC Evol Biol 6: 50.
40. Zhang XH, Chasin LA (2006) Comparison of multiple vertebrate genomes
reveals the birth and evolution of human exons. Proc Natl Acad Sci U S A 103:13427–13432.
41. Karolchik D, Baertsch R, Diekhans M, Furey TS, Hinrichs A, et al. (2003) TheUCSC Genome Browser Database. Nucleic Acids Res 31: 51–54.
42. Xing Y, Lee C (2006) Alternative splicing and RNA selection pressure–
evolutionary consequences for eukaryotic genomes. Nat Rev Genet 7: 499–509.
43. Xing Y, Lee C (2007) Relating alternative splicing to proteome complexity and
genome evolution. Adv Exp Med Biol 623: 36–49.
44. Llansola M, Sanchez-Perez A, Cauli O, Felipo V (2005) Modulation of NMDA
receptors in the cerebellum. 1. Properties of the NMDA receptor that modulate
its function. Cerebellum 4: 154–161.
45. Li Q, Lee JA, Black DL (2007) Neuronal regulation of alternative pre-mRNA
splicing. Nat Rev Neurosci 8: 819–831.
46. Zukin RS, Bennett MV (1995) Alternatively spliced isoforms of the NMDARI
receptor subunit. Trends Neurosci 18: 306–313.
47. Tingley W, Roche K, Thompson A, Huganir R (1993) Regulation of NMDAreceptor phosphorylation by alternative splicing of the C-terminal domain.
Nature 364.
48. Fairbrother WG, Yeh RF, Sharp PA, Burge CB (2002) Predictive identification
of exonic splicing enhancers in human genes. Science 297: 1007–1013.
49. Wang Z, Rolish ME, Yeo G, Tung V, Mawson M, et al. (2004) Systematicidentification and analysis of exonic splicing silencers. Cell 119: 831–845.
50. Jelen N, Ule J, Zivin M, Darnell RB (2007) Evolution of Nova-dependentsplicing regulation in the brain. PLoS Genet 3: 1838–1847.
51. Pan Q, Shai O, Misquitta C, Zhang W, Saltzman AL, et al. (2004) Revealingglobal regulatory features of mammalian alternative splicing using a quantitative
microarray platform. Mol Cell 16: 929–941.
52. Artamonova II, Gelfand MS (2007) Comparative genomics and evolution ofalternative splicing: the pessimists’ science. Chem Rev 107: 3407–3430.
53. Yang Z (2007) PAML 4: Phylogenetic Analysis by Maximum Likelihood. MolBiol Evol 24: 1586–1591.
54. Siepel A, Bejerano G, Pedersen JS, Hinrichs AS, Hou M, et al. (2005)
Evolutionarily conserved elements in vertebrate, insect, worm, and yeastgenomes. Genome Res 15: 1034–1050.
55. Koch S, Strasser V, Hauser C, Fasching D, Brandes C, et al. (2002) A secretedsoluble form of ApoE receptor 2 acts as a dominant-negative receptor and
inhibits Reelin signaling. EMBO J 21: 5996–6004.
56. Wang L, Duke L, Zhang PS, Arlinghaus RB, Symmans WF, et al. (2003)Alternative splicing disrupts a nuclear localization signal in spleen tyrosine kinase
that is required for invasion suppression in breast cancer. Cancer Res 63:4724–4730.
57. Murakami T, Sakane F, Imai S, Houkin K, Kanoh H (2003) Identification and
characterization of two splice variants of human diacylglycerol kinase eta. J BiolChem 278: 34364–34372.
58. Richard DJ, Schumacher V, Royer-Pokora B, Roberts SG (2001) Par4 is acoactivator for a splice isoform-specific transcriptional activation domain in
WT1. Genes Dev 15: 328–339.
59. Xing Y, Lee CJ (2005) Protein modularity of alternatively spliced exons isassociated with tissue-specific regulation of alternative splicing. PLoS Genet 1:
e34.
60. Modrek B, Lee C (2002) A genomic view of alternative splicing. Nat Genet 30:
13–19.
61. Boue S, Letunic I, Bork P (2003) Alternative splicing and evolution. Bioessays 25:
1031–1034.
62. Ast G (2004) How did alternative splicing evolve? Nat Rev Genet 5: 773–782.
63. Lee C, Wang Q (2005) Bioinformatics analysis of alternative splicing. Brief
Bioinform 6: 23–33.
64. Moore BA, Robinson HH, Xu Z (2007) The crystal structure of mouse Exo70
reveals unique features of the mammalian exocyst. J Mol Biol 371: 410–421.
65. Blom N, Gammeltoft S, Brunak S (1999) Sequence and structure-basedprediction of eukaryotic protein phosphorylation sites. J Mol Biol 294:
1351–1362.
66. Irimia M, Rukov JL, Roy SW (2009) Evolution of alternative splicing regulation:
changes in predicted exonic splicing regulators are not associated with changes
in alternative splicing levels in primates. PLoS One 4: e5800.
67. Kim N, Alekseyenko AV, Roy M, Lee C (2007) The ASAP II database: analysis
and comparative genomics of alternative splicing in 15 animal species. NucleicAcids Res 35: D93–98.
Predicting Functional Alternative Splicing
PLoS Computational Biology | www.ploscompbiol.org 13 December 2009 | Volume 5 | Issue 12 | e1000608
68. Miller W, Rosenbloom K, Hardison RC, Hou M, Taylor J, et al. (2007) 28-way
vertebrate alignment and conservation track in the UCSC Genome Browser.Genome Res 17: 1797–1808.
69. Alekseyenko AV, Lee CJ (2007) Nested Containment List (NCList): a new
algorithm for accelerating interval query of genome alignment and intervaldatabases. Bioinformatics 23: 1386–1393.
70. Rice P, Longden I, Bleasby A (2000) EMBOSS: the European MolecularBiology Open Software Suite. Trends Genet 16: 276–277.
71. Chenna R, Sugawara H, Koike T, Lopez R, Gibson TJ, et al. (2003) Multiple
sequence alignment with the Clustal series of programs. Nucleic Acids Res 31:3497–3500.
72. Yang Z, Swanson WJ (2002) Codon-substitution models to detect adaptive
evolution that account for heterogeneous selective pressures among site classes.Mol Biol Evol 19: 49–57.
73. Yang Z, Nielsen R (2000) Estimating synonymous and nonsynonymoussubstitution rates under realistic evolutionary models. Mol Biol Evol 17: 32–43.
Predicting Functional Alternative Splicing
PLoS Computational Biology | www.ploscompbiol.org 14 December 2009 | Volume 5 | Issue 12 | e1000608