Pre-spawning herring in a protected area showed only moderate reaction to a surveying vessel
9
Fisheries Research 78 (2006) 359–367 Pre-spawning herring in a protected area showed only moderate reaction to a surveying vessel Georg Skaret a,b,∗ , Aril Slotte a , Nils Olav Handegard a , Bjørn Erik Axelsen a , Roar Jørgensen c a Institute of Marine Research, P.O. Box. 1870, Nordnes, NO-5817 Bergen, Norway b Department of Biology, University of Bergen, Bergen High-Technology Centre, NO-5020 Bergen, Norway c Norwegian College of Fishery Science, University of Tromsø, NO-9037 Tromsø, Norway Received 12 October 2004; received in revised form 1 November 2005; accepted 9 November 2005 Abstract We studied the influence of a surveying vessel on the behaviour of shallowly distributed local pre-spawning herring (Clupea harengus L.) in a protected area in the Trondheimsfjord (West Norway). The vessel passed an acoustic buoy at standard survey speed at a distance of 10–40 m four times at night and seven times by day. Bottom depths ranged from 40 to 60 m and a herring layer consisting mostly of pre-spawners was recorded from transducer depth (2.5 m) down to 15–30 m. The herring mass centre was deeper during vessel passage than during undisturbed reference periods, indicating a diving reaction. Backscattered echo energy also decreased during most passages, but the trend was less consistent than increased centre depth, especially during night-time passages. In summary, indications of vessel avoidance were weaker than those previously reported for herring in the same period. We interpret vessel avoidance as the reaction to a perceived threat, and the weak response was unexpected. Pre-spawning herring should act in order to maximise their chances of survival until reproduction and a strong reaction to perceived threats as documented from earlier studies was therefore expected. The shallowness of the location in combination with many gadoids close to the bottom, as observed acoustically, may have been important factors that attenuated the reaction of the fish to the vessel in our study. © 2005 Elsevier B.V. All rights reserved. Keywords: Herring; Pre-spawning; Vessel avoidance; Anti-predator behaviour 1. Introduction Fish avoidance of survey vessels is sometimes strong and may seriously bias acoustic abundance estimates (e.g. Olsen et al., 1983a; Fr´ eon and Misund, 1999), while at other times no bias is recorded (Fernandes et al., 2000a,b). From a biolog- ical viewpoint, avoidance is the functional response of fish to stimuli that they interpret as threats (Fr´ eon and Misund, 1999; Vabø et al., 2002), and predation should thus be the driving evolutionary force (Fuiman and Magurran, 1994). Avoidance may be elicited either as a general precautionary response to an unknown danger (Fern¨ o and Huse, Institute of Marine Research, pers. commun.) or because fish interpret the noise ∗ Corresponding author. Tel.: +47 55236993; fax: +47 55238555. E-mail address: [email protected] (G. Skaret). stimuli from vessels as large predators due to similarities in frequency range (Richardson et al., 1995). Avoidance reactions are energy intensive and selective forces will drive the fish towards optimal response levels relative to risk levels (Magurran et al., 1985). Stronger stim- uli elicit stronger responses (Olsen et al., 1983a; Schwartz and Greer, 1984), suggesting the existence of a cost-benefit balance of reactions and stimuli. However, quasi-identical stimuli may produce very different responses (Misund, 1990), and it is known that the motivational state of the fish influ- ences their reactions (Magurran et al., 1985), in that they trade off predator avoidance against other activities such as spawning or feeding (Milinski, 1993; Ryer and Olla, 1998). Previous studies have shown that the risk-averse herring react strongly to vessels during wintering as pre-spawners (Olsen et al., 1983b; Misund, 1990; Vabø et al., 2002), whereas 0165-7836/$ – see front matter © 2005 Elsevier B.V. All rights reserved. doi:10.1016/j.fishres.2005.11.007
-
Upload
independent -
Category
Documents
-
view
0 -
download
0
Transcript of Pre-spawning herring in a protected area showed only moderate reaction to a surveying vessel

Fisheries Research 78 (2006) 359–367
Pre-spawning herring in a protected area showed onlymoderate reaction to a surveying vessel
Georg Skaret a,b,∗, Aril Slotte a, Nils Olav Handegard a,Bjørn Erik Axelsen a, Roar Jørgensen c
a Institute of Marine Research, P.O. Box. 1870, Nordnes, NO-5817 Bergen, Norwayb Department of Biology, University of Bergen, Bergen High-Technology Centre, NO-5020 Bergen, Norway
c Norwegian College of Fishery Science, University of Tromsø, NO-9037 Tromsø, Norway
Received 12 October 2004; received in revised form 1 November 2005; accepted 9 November 2005
Abstract
We studied the influence of a surveying vessel on the behaviour of shallowly distributed local pre-spawning herring (Clupea harengusL.) in a protected area in the Trondheimsfjord (West Norway). The vessel passed an acoustic buoy at standard survey speed at a distanceopdtwtswt©
K
1
menisVemaR
0d
f 10–40 m four times at night and seven times by day. Bottom depths ranged from 40 to 60 m and a herring layer consisting mostly ofre-spawners was recorded from transducer depth (2.5 m) down to 15–30 m. The herring mass centre was deeper during vessel passage thanuring undisturbed reference periods, indicating a diving reaction. Backscattered echo energy also decreased during most passages, but therend was less consistent than increased centre depth, especially during night-time passages. In summary, indications of vessel avoidance wereeaker than those previously reported for herring in the same period. We interpret vessel avoidance as the reaction to a perceived threat, and
he weak response was unexpected. Pre-spawning herring should act in order to maximise their chances of survival until reproduction and atrong reaction to perceived threats as documented from earlier studies was therefore expected. The shallowness of the location in combinationith many gadoids close to the bottom, as observed acoustically, may have been important factors that attenuated the reaction of the fish to
he vessel in our study.2005 Elsevier B.V. All rights reserved.
eywords: Herring; Pre-spawning; Vessel avoidance; Anti-predator behaviour
. Introduction
Fish avoidance of survey vessels is sometimes strong anday seriously bias acoustic abundance estimates (e.g. Olsen
t al., 1983a; Freon and Misund, 1999), while at other timeso bias is recorded (Fernandes et al., 2000a,b). From a biolog-cal viewpoint, avoidance is the functional response of fish totimuli that they interpret as threats (Freon and Misund, 1999;abø et al., 2002), and predation should thus be the drivingvolutionary force (Fuiman and Magurran, 1994). Avoidanceay be elicited either as a general precautionary response to
n unknown danger (Ferno and Huse, Institute of Marineesearch, pers. commun.) or because fish interpret the noise
∗ Corresponding author. Tel.: +47 55236993; fax: +47 55238555.E-mail address: [email protected] (G. Skaret).
stimuli from vessels as large predators due to similarities infrequency range (Richardson et al., 1995).
Avoidance reactions are energy intensive and selectiveforces will drive the fish towards optimal response levelsrelative to risk levels (Magurran et al., 1985). Stronger stim-uli elicit stronger responses (Olsen et al., 1983a; Schwartzand Greer, 1984), suggesting the existence of a cost-benefitbalance of reactions and stimuli. However, quasi-identicalstimuli may produce very different responses (Misund, 1990),and it is known that the motivational state of the fish influ-ences their reactions (Magurran et al., 1985), in that theytrade off predator avoidance against other activities such asspawning or feeding (Milinski, 1993; Ryer and Olla, 1998).Previous studies have shown that the risk-averse herring reactstrongly to vessels during wintering as pre-spawners (Olsenet al., 1983b; Misund, 1990; Vabø et al., 2002), whereas
165-7836/$ – see front matter © 2005 Elsevier B.V. All rights reserved.oi:10.1016/j.fishres.2005.11.007

360 G. Skaret et al. / Fisheries Research 78 (2006) 359–367
weak or a complete lack of avoidance reactions have beenreported during spawning (Mohr, 1971; Skaret et al., 2005)and after spawning when feeding is resumed (Hafsteinssonand Misund, 1995; Fernandes et al., 2000a,b). These observeddifferences in reaction are totally coherent with expectedbehaviour to maximise fitness: herring minimise predationrisk prior to spawning in order to maximise their chancesof successful reproduction, whereas they allow for a higherpredation risk when their attention is focussed on the essen-tial activities of spawning and later feeding (Milinski, 1993;Nøttestad et al., 1996). Despite the documented shift in reac-tion with spawning, more data points are needed to coverchanges in avoidance reaction that may be more gradual andlinked to the maturity of the fish. In the present study weinvestigate the vessel response of a local non-migratory stock(Jørstad et al., 1991) of pre-spawning herring.
2. Material and methods
Two experiments were carried out in a bay in the Trond-heimsfjord on the west coast of Norway (N63◦35′, E10◦53′)on 18 and 19 February 2001 (Fig. 1). The Bergen AcousticBuoy (BAB) (Godø and Totland, 1996) and the research ves-sel ‘Michael Sars’ (MS) (47.5 m, 690 GRT) were used. Thisitcmt
t
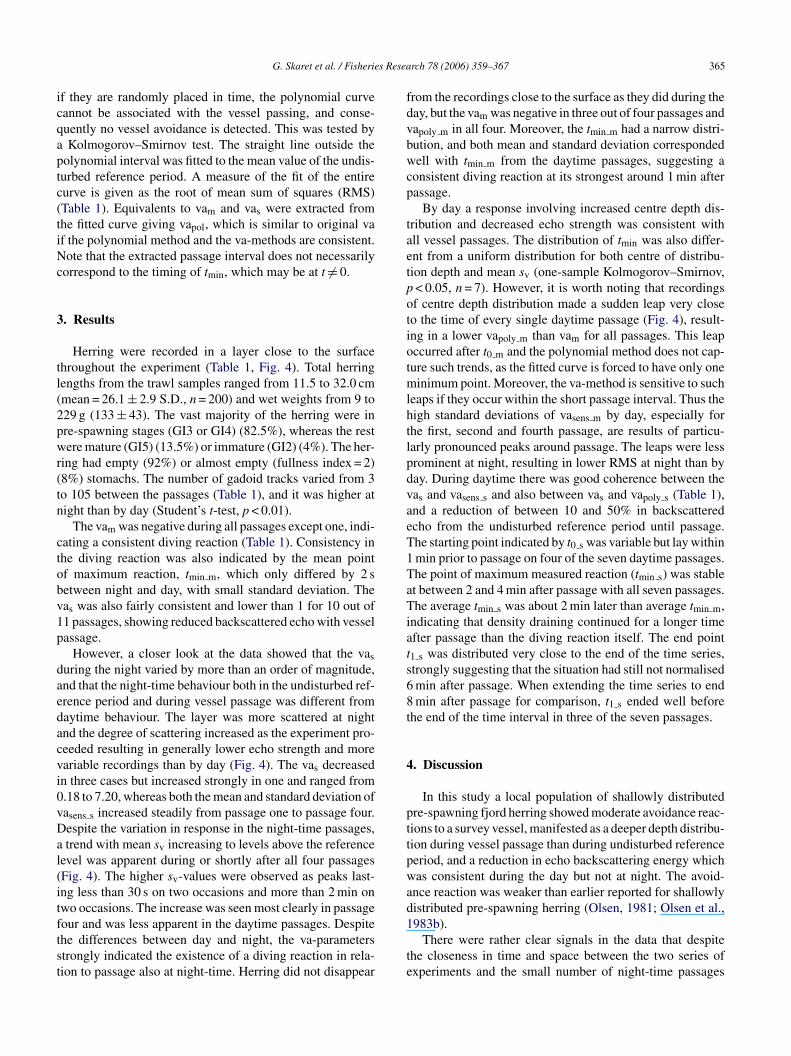
Fig. 2. Celerity profiles from two locations adjacent to the study site atpositions N63◦51′, E11◦04′ (location A) and N63◦57′, E11◦10′ (locationB).
38 kHz, with beam width 8◦, 1 ms pulse duration and mediumbandwidth. The buoy was placed above a dense layer ofherring located close to the surface, and the herring distri-bution area was roughly estimated (Fig. 1). Four passageswere made in darkness, and seven in daylight (Table 1).Weather conditions were calm and the lunar phase 1/4 of fulland waning. For each passage cycle MS started from a posi-tion about 1 nautical mile (nmi) from the BAB and headeddirectly towards it at standard cruising speed (10–11 knots).MS passed the buoy at a distance of 10–40 m (Table 1) andcontinued another 0.5 nmi past the buoy before turning.
Herring were sampled once at night and once during theday, trawling pelagically from the surface down to 20 m. From
F g distri( Februa
s a relatively noisy vessel, and the noise signature lies abovehe ICES CRR (Mitson, 1995; Jørgensen et al., 2004). Theonditions for sound propagation at the time of the experi-ents based on a conductivity temperature depth-profile from
wo areas adjacent to the study location are shown in Fig. 2.The floating part of the BAB was anchored and connected
o a transducer rig situated at 2.5 m depth and logging at
ig. 1. Map of the study location in the Trondheimsfjord. Estimated herrinBAB) during the experiments at night on 18 February and E2 by day on 19
bution area is shaded. E1 marks the position of the Bergen Acoustic Buoyry.

G.Skaretetal./F
isheriesR
esearch78
(2006)359–367
361
Table 1Avoidance reactions based on data from the BAB (all passages) during night-time (18 February) and daytime (19 February)
PT (UTC) PD (m) BD (m) Ping rate(s−1)
VD (m) Centre of depth distribution Mean volume backscattering coefficient (sv) NG
t0 m (s) tmin m (s) t1 m (s) vam Meanvasens m
S.D.vasens m
vapoly m RMSm t0 s (s) tmin s (s) t1 s (s) vas Meanvasens s
S.D.vasens s
vapoly s RMSs
(×10−3)
Night 1746 40 40 1 5–17 −19 93 316 0.17 0.24 0.12 −0.52 0.72 199 269 356 0.15 0.17 0.02 1.00 0.65 *Night 1820 20 40 1 5–7.5 −74 91 356 −0.64 −0.72 0.55 −1.12 0.79 174 216 283 0.19 0.34 0.17 1.00 0.33 101Night 1856 10 40 1 5–8 −92 73 357 −0.82 −0.79 0.11 −0.97 0.67 167 262 337 0.80 0.78 0.36 1.00 0.19 105Night 2119 10 44 1 5–7 −9 19 66 −0.20 −0.45 0.39 −0.64 0.48 −357 −239 −142 7.20 7.01 1.87 1.00 0.17 48
Mean −49 69 274 −0.37 −0.43 0.29 −0.81 0.67 46 127 209 2.09 2.07 0.61 1.00 0.33 85
S.D. 41 35 140 0.45 0.47 0.21 0.28 0.13 269 245 236 3.42 3.30 0.85 0.00 0.23 32Day 1158 10 62 1 5–18 −39 97 208 −2.14 −2.40 1.98 −4.34 3.02 −45 211 356 0.62 0.67 0.13 0.85 0.17 4Day 1233 10 62 1 6–29 −96 92 245 −1.19 −1.19 1.27 −7.12 3.07 −164 166 357 0.73 0.70 0.16 0.49 0.25 11Day 1311 10 56 2.5 6–17 −73 65 134 −2.55 −2.61 0.39 −4.31 2.34 −54 191 359 0.60 0.57 0.08 0.73 0.15 9Day 1400 15 61 2.5 5–26 −73 71 282 −0.36 −0.94 0.94 −4.68 2.00 55 215 359 0.90 0.89 0.08 1.00 0.17 3Day 1435 15 60 2.5 5–24 −126 60 153 −1.01 −1.16 0.25 −4.49 1.55 −43 188 358 0.70 0.67 0.16 0.75 0.21 4Day 1521 15 60 2.5 5–24 −79 8 182 −2.87 −3.15 0.33 −5.86 1.22 −10 170 359 0.76 0.80 0.20 0.92 0.25 3Day 1554 15 61 2.5 5–23 −122 76 251 −2.52 −2.58 0.28 −4.26 1.36 −144 148 359 0.53 0.60 0.12 0.41 0.24 6
Mean −87 67 208 −1.81 −2.01 0.78 −5.01 2.08 −58 184 358 0.69 0.70 0.13 0.74 0.21 6
S.D. 31 29 55 0.95 0.88 0.66 1.09 0.76 75 25 1 0.12 0.11 0.04 0.22 0.04 3
Passing time (PT), passing distance (PD) and bottom depth (BD) are noted for all passages. Vertical fish distribution (VD) refers to the minimum and maximum school depth during the undisturbed referenceperiod (70 s). Values of t0, tmin and t1 are start, minimum and end points of the fitted polynomials. vam is the centre of the depth distribution at the passage (cPASS) less the one during reference period (cREF). vas isthe ratio between mean volume backscattering coefficient at the passage (svPASS) and during reference period (svREF). vasens is the va-coefficient obtained from the sensitivity analysis. vapoly is the va-coefficientextracted from the fitted straight line and polynomial curve. RMS is the root of the sum of squares from the fitted polynomial. Mean values are given with standard deviation. The number of gadoid tracks (NG)is also noted. *Echogram with gadoid tracks was not available.

362 G. Skaret et al. / Fisheries Research 78 (2006) 359–367
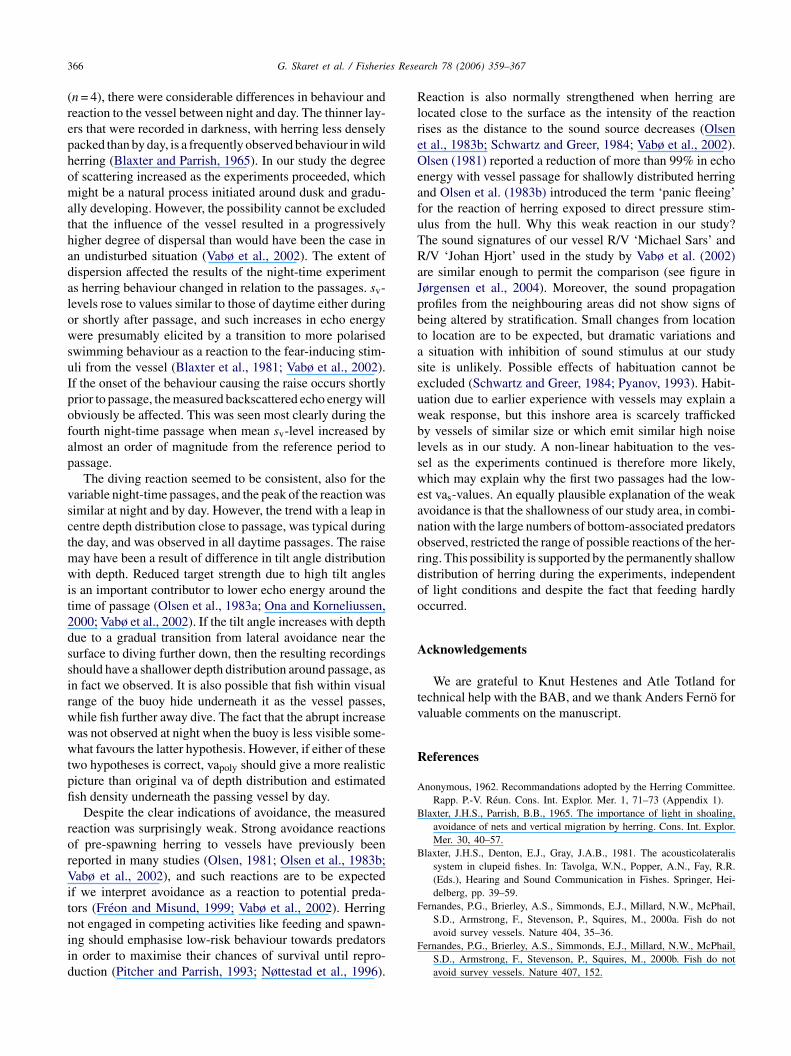
Fig. 3. Echogram from RV ‘Michael Sars’ showing the herring layer, gadoid predators and the bottom topography at 19 UTC on 18 February. Total distance is0.9 nautical miles.
the hauls, samples of 100 herring were analysed for totalweight and length, maturity stage (Anonymous, 1962) andstomach fullness (1–5, 1 = empty, 5 = full). Acoustic raw datawere logged continuously on the BAB and processed usingSonardata Echoview v. 3.00 (http://www.sonardata.com/)and software developed in-house at IMR. In order to quan-tify the predation pressure on herring beneath the buoy,the number of acoustic gadoid tracks on the echogramof MS was counted manually within a pre-defined ‘dan-ger zone’ covering the whole water column and start-ing 0.1 nmi before the recorded herring layer and end-ing 0.1 nmi after (Fig. 3). For each vessel passage, timeseries with mean water column volume backscattering coef-ficient and centre of the depth distribution were calculated.Time series started 6 min before and ended 6 min after pas-sage. The centre of depth distribution ci was calculatedas
ci =∑
j(djsvij )∑
jsvij
, (1)
where svij is the volume backscattering coefficient (m−1) forping i and depth bin j and dj is the depth (m) of depth bin j.An undisturbed reference period was defined as a 70 s intervalending 88 s prior to passage, and the passage as a 7-s intervala(f
from Jørgensen et al. (2004):
vas = svPASS
svREF
, (2)
vam = cPASS − cREF, (3)
where svPASS is the mean volume backscattering coefficientduring the passage interval and svREF during the undisturbedreference period, while cPASS is the mean centre of depth dis-tribution during passage and cREF during the reference period.In order to investigate the robustness of the va-coefficients, weconducted sensitivity analyses, rendering a new coefficientvasens. The analysis perturbs the time interval that definesthe vessel passing by p = n s where n ∈ [−4, −3, . . ., 3, 4],and perturbs the time interval defining the reference periodby p = 6m s, where m ∈ [−4, −3, . . ., 3, 4]. The reason formultiplication by six is that the relative perturbation betweenthe two intervals then becomes more similar (12 s/4 s = 3 and70 s/24 s ≈ 3). This results in 9 × 9 calculations of the va-coefficient using the perturbed time intervals, with (n = 0,m = 0) being the original va. If the va-coefficient is robust,then the standard deviation of vasens should be low, and meanvasens should be similar to the original va.
We also treated each passage separately by applying amethod due to Jørgensen et al. (2004), whereby a combinedthird-order polynomial and a straight line were fitted to thetet
round the exact time of passage, as defined by Vabø et al.2002). Vessel avoidance (va-) coefficients were calculatedor each passage (Vabø et al., 2002) and only slightly modified
ime series in a least squares sense starting 6 min prior to andnding 6 min past each passage (Fig. 4). The time indica-ors t0, tmin and t1 specify when the polynomial curve starts,

G. Skaret et al. / Fisheries Research 78 (2006) 359–367 363
Fig. 4. Echograms from the BAB including all passages and the fitted polynomials. (a–d) are the night-time passages and (e–k) the daytime passages. 0 marksthe point of passage, and the light grey curve shows mean ping-to-ping values for the centre of depth distribution in the upper panel and backscattering echocoefficient in the lower. The yellow line indicates a floating average over five pings. The green line shows the fitted polynomial and straight line, in which thered parts indicate position and level for undisturbed reference period and passage, respectively, and the blue line and cross shows passage level extracted fromthe fitted curve.

364 G. Skaret et al. / Fisheries Research 78 (2006) 359–367
Fig. 4. (Continued ).
has its minimum and ends. The polynomial was forced tohave only one minimum and all combinations of t0 and t1,such that t0 < t1, were tried. The combination with lowestsquare error was chosen. The time parameters were used
as estimates of when the reaction started, was strongest andended. The similarity in these parameters between passagesis also a measure of consistency in the reaction. If they areuniformly distributed over the time span as to be expected
G. Skaret et al. / Fisheries Research 78 (2006) 359–367 365
if they are randomly placed in time, the polynomial curvecannot be associated with the vessel passing, and conse-quently no vessel avoidance is detected. This was tested bya Kolmogorov–Smirnov test. The straight line outside thepolynomial interval was fitted to the mean value of the undis-turbed reference period. A measure of the fit of the entirecurve is given as the root of mean sum of squares (RMS)(Table 1). Equivalents to vam and vas were extracted fromthe fitted curve giving vapol, which is similar to original vaif the polynomial method and the va-methods are consistent.Note that the extracted passage interval does not necessarilycorrespond to the timing of tmin, which may be at t �= 0.
3. Results
Herring were recorded in a layer close to the surfacethroughout the experiment (Table 1, Fig. 4). Total herringlengths from the trawl samples ranged from 11.5 to 32.0 cm(mean = 26.1 ± 2.9 S.D., n = 200) and wet weights from 9 to229 g (133 ± 43). The vast majority of the herring were inpre-spawning stages (GI3 or GI4) (82.5%), whereas the restwere mature (GI5) (13.5%) or immature (GI2) (4%). The her-ring had empty (92%) or almost empty (fullness index = 2)(8%) stomachs. The number of gadoid tracks varied from 3to 105 between the passages (Table 1), and it was higher atn
ctobv1p
daedacvi0vDal(itftst
from the recordings close to the surface as they did during theday, but the vam was negative in three out of four passages andvapoly m in all four. Moreover, the tmin m had a narrow distri-bution, and both mean and standard deviation correspondedwell with tmin m from the daytime passages, suggesting aconsistent diving reaction at its strongest around 1 min afterpassage.
By day a response involving increased centre depth dis-tribution and decreased echo strength was consistent withall vessel passages. The distribution of tmin was also differ-ent from a uniform distribution for both centre of distribu-tion depth and mean sv (one-sample Kolmogorov–Smirnov,p < 0.05, n = 7). However, it is worth noting that recordingsof centre depth distribution made a sudden leap very closeto the time of every single daytime passage (Fig. 4), result-ing in a lower vapoly m than vam for all passages. This leapoccurred after t0 m and the polynomial method does not cap-ture such trends, as the fitted curve is forced to have only oneminimum point. Moreover, the va-method is sensitive to suchleaps if they occur within the short passage interval. Thus thehigh standard deviations of vasens m by day, especially forthe first, second and fourth passage, are results of particu-larly pronounced peaks around passage. The leaps were lessprominent at night, resulting in lower RMS at night than byday. During daytime there was good coherence between theva and va and also between va and va (Table 1),aeT1TaTiats68t
4
pttpwad1
te
ight than by day (Student’s t-test, p < 0.01).The vam was negative during all passages except one, indi-
ating a consistent diving reaction (Table 1). Consistency inhe diving reaction was also indicated by the mean pointf maximum reaction, tmin m, which only differed by 2 setween night and day, with small standard deviation. Theas was also fairly consistent and lower than 1 for 10 out of1 passages, showing reduced backscattered echo with vesselassage.
However, a closer look at the data showed that the vasuring the night varied by more than an order of magnitude,nd that the night-time behaviour both in the undisturbed ref-rence period and during vessel passage was different fromaytime behaviour. The layer was more scattered at nightnd the degree of scattering increased as the experiment pro-eeded resulting in generally lower echo strength and moreariable recordings than by day (Fig. 4). The vas decreasedn three cases but increased strongly in one and ranged from.18 to 7.20, whereas both the mean and standard deviation ofasens s increased steadily from passage one to passage four.espite the variation in response in the night-time passages,trend with mean sv increasing to levels above the reference
evel was apparent during or shortly after all four passagesFig. 4). The higher sv-values were observed as peaks last-ng less than 30 s on two occasions and more than 2 min onwo occasions. The increase was seen most clearly in passageour and was less apparent in the daytime passages. Despitehe differences between day and night, the va-parameterstrongly indicated the existence of a diving reaction in rela-ion to passage also at night-time. Herring did not disappear
s sens s s poly snd a reduction of between 10 and 50% in backscatteredcho from the undisturbed reference period until passage.he starting point indicated by t0 s was variable but lay withinmin prior to passage on four of the seven daytime passages.he point of maximum measured reaction (tmin s) was stablet between 2 and 4 min after passage with all seven passages.he average tmin s was about 2 min later than average tmin m,
ndicating that density draining continued for a longer timefter passage than the diving reaction itself. The end point1 s was distributed very close to the end of the time series,trongly suggesting that the situation had still not normalisedmin after passage. When extending the time series to endmin after passage for comparison, t1 s ended well before
he end of the time interval in three of the seven passages.
. Discussion
In this study a local population of shallowly distributedre-spawning fjord herring showed moderate avoidance reac-ions to a survey vessel, manifested as a deeper depth distribu-ion during vessel passage than during undisturbed referenceeriod, and a reduction in echo backscattering energy whichas consistent during the day but not at night. The avoid-
nce reaction was weaker than earlier reported for shallowlyistributed pre-spawning herring (Olsen, 1981; Olsen et al.,983b).
There were rather clear signals in the data that despitehe closeness in time and space between the two series ofxperiments and the small number of night-time passages
366 G. Skaret et al. / Fisheries Research 78 (2006) 359–367
(n = 4), there were considerable differences in behaviour andreaction to the vessel between night and day. The thinner lay-ers that were recorded in darkness, with herring less denselypacked than by day, is a frequently observed behaviour in wildherring (Blaxter and Parrish, 1965). In our study the degreeof scattering increased as the experiments proceeded, whichmight be a natural process initiated around dusk and gradu-ally developing. However, the possibility cannot be excludedthat the influence of the vessel resulted in a progressivelyhigher degree of dispersal than would have been the case inan undisturbed situation (Vabø et al., 2002). The extent ofdispersion affected the results of the night-time experimentas herring behaviour changed in relation to the passages. sv-levels rose to values similar to those of daytime either duringor shortly after passage, and such increases in echo energywere presumably elicited by a transition to more polarisedswimming behaviour as a reaction to the fear-inducing stim-uli from the vessel (Blaxter et al., 1981; Vabø et al., 2002).If the onset of the behaviour causing the raise occurs shortlyprior to passage, the measured backscattered echo energy willobviously be affected. This was seen most clearly during thefourth night-time passage when mean sv-level increased byalmost an order of magnitude from the reference period topassage.
The diving reaction seemed to be consistent, also for thevariable night-time passages, and the peak of the reaction wassctmwit2dssirwwwtpfi
rorVitniid
Reaction is also normally strengthened when herring arelocated close to the surface as the intensity of the reactionrises as the distance to the sound source decreases (Olsenet al., 1983b; Schwartz and Greer, 1984; Vabø et al., 2002).Olsen (1981) reported a reduction of more than 99% in echoenergy with vessel passage for shallowly distributed herringand Olsen et al. (1983b) introduced the term ‘panic fleeing’for the reaction of herring exposed to direct pressure stim-ulus from the hull. Why this weak reaction in our study?The sound signatures of our vessel R/V ‘Michael Sars’ andR/V ‘Johan Hjort’ used in the study by Vabø et al. (2002)are similar enough to permit the comparison (see figure inJørgensen et al., 2004). Moreover, the sound propagationprofiles from the neighbouring areas did not show signs ofbeing altered by stratification. Small changes from locationto location are to be expected, but dramatic variations anda situation with inhibition of sound stimulus at our studysite is unlikely. Possible effects of habituation cannot beexcluded (Schwartz and Greer, 1984; Pyanov, 1993). Habit-uation due to earlier experience with vessels may explain aweak response, but this inshore area is scarcely traffickedby vessels of similar size or which emit similar high noiselevels as in our study. A non-linear habituation to the ves-sel as the experiments continued is therefore more likely,which may explain why the first two passages had the low-est va -values. An equally plausible explanation of the weakanordoo
A
tv
R
A
B
B
F
F
imilar at night and by day. However, the trend with a leap inentre depth distribution close to passage, was typical duringhe day, and was observed in all daytime passages. The raise
ay have been a result of difference in tilt angle distributionith depth. Reduced target strength due to high tilt angles
s an important contributor to lower echo energy around theime of passage (Olsen et al., 1983a; Ona and Korneliussen,000; Vabø et al., 2002). If the tilt angle increases with depthue to a gradual transition from lateral avoidance near theurface to diving further down, then the resulting recordingshould have a shallower depth distribution around passage, asn fact we observed. It is also possible that fish within visualange of the buoy hide underneath it as the vessel passes,hile fish further away dive. The fact that the abrupt increaseas not observed at night when the buoy is less visible some-hat favours the latter hypothesis. However, if either of these
wo hypotheses is correct, vapoly should give a more realisticicture than original va of depth distribution and estimatedsh density underneath the passing vessel by day.
Despite the clear indications of avoidance, the measuredeaction was surprisingly weak. Strong avoidance reactionsf pre-spawning herring to vessels have previously beeneported in many studies (Olsen, 1981; Olsen et al., 1983b;abø et al., 2002), and such reactions are to be expected
f we interpret avoidance as a reaction to potential preda-ors (Freon and Misund, 1999; Vabø et al., 2002). Herringot engaged in competing activities like feeding and spawn-ng should emphasise low-risk behaviour towards predatorsn order to maximise their chances of survival until repro-uction (Pitcher and Parrish, 1993; Nøttestad et al., 1996).
svoidance is that the shallowness of our study area, in combi-ation with the large numbers of bottom-associated predatorsbserved, restricted the range of possible reactions of the her-ing. This possibility is supported by the permanently shallowistribution of herring during the experiments, independentf light conditions and despite the fact that feeding hardlyccurred.
cknowledgements
We are grateful to Knut Hestenes and Atle Totland forechnical help with the BAB, and we thank Anders Ferno foraluable comments on the manuscript.
eferences
nonymous, 1962. Recommandations adopted by the Herring Committee.Rapp. P.-V. Reun. Cons. Int. Explor. Mer. 1, 71–73 (Appendix 1).
laxter, J.H.S., Parrish, B.B., 1965. The importance of light in shoaling,avoidance of nets and vertical migration by herring. Cons. Int. Explor.Mer. 30, 40–57.
laxter, J.H.S., Denton, E.J., Gray, J.A.B., 1981. The acousticolateralissystem in clupeid fishes. In: Tavolga, W.N., Popper, A.N., Fay, R.R.(Eds.), Hearing and Sound Communication in Fishes. Springer, Hei-delberg, pp. 39–59.
ernandes, P.G., Brierley, A.S., Simmonds, E.J., Millard, N.W., McPhail,S.D., Armstrong, F., Stevenson, P., Squires, M., 2000a. Fish do notavoid survey vessels. Nature 404, 35–36.
ernandes, P.G., Brierley, A.S., Simmonds, E.J., Millard, N.W., McPhail,S.D., Armstrong, F., Stevenson, P., Squires, M., 2000b. Fish do notavoid survey vessels. Nature 407, 152.
G. Skaret et al. / Fisheries Research 78 (2006) 359–367 367
Freon, P., Misund, O.A., 1999. Dynamics of Pelagic Fish Distributionand Behaviour: Effects on Fisheries and Stock Assessment. FishingNews Books, Blackwell Science Inc, 348 pp.
Fuiman, L.A., Magurran, A.E., 1994. Development of predator defencesin fishes. Rev. Fish Biol. Fisher., 146–183.
Godø, O.R., Totland, A., 1996. A stationary acoustic system for monitor-ing undisturbed and vessel affected fish behaviour. Int. Coun. Explor.Sea CM 1996/B:12, 6 pp.
Hafsteinsson, M.T., Misund, O.A., 1995. Recording the migrationbehaviour of fish schools by multibeam sonar during conventionalacoustic surveys. ICES J. Mar. Sci. 52 (6), 915–924.
Jørgensen, R., Handegard, N.O., Gjøsæter, H., Slotte, A., 2004. Possiblevessel avoidance behaviour of capelin in a feeding area and on aspawning ground. Fish. Res. 69, 251–261.
Jørstad, K.E., King, D.P.F., Nævdal, G., 1991. Population structure ofAtlantic herring Clupea harengus L. J. Fish. Biol. 39 (Suppl. A),43–52.
Magurran, A.E., Oulton, W.J., Pitcher, T.J., 1985. Vigilant behaviour andshoal size in minnows. Z. Tierpsychol. 67, 167–178.
Milinski, M., 1993. Predation risk and feeding behaviour. In: Pitcher, T.J.(Ed.), The Behaviour of Teleost Fishes, 2nd ed. Chapman & Hall,London, pp. 285–305.
Misund, O.A., 1990. Sonar observations of schooling herring: schooldimensions, swimming behaviour, and avoidance of vessel and purseseine. Rapp. P.-V. Reun. Cons. Int. Explor. Mer. 189, 135–146.
Mitson, R.B., 1995. Underwater noise of research vessels. Review andrecommendations. ICES Co-op. Res. Rep. 209, 61 pp.
Mohr, H., 1971. Behaviour patterns of different herring stocks in relationto ship and midwater trawl. In: Kristjonsson, H. (Ed.), Modern FishingGear of the World, vol. 3. Fishing News Books, London, pp. 368–371.
Nøttestad, L., Aksland, M., Beltestad, A., Ferno, A., Johannessen, A.,
Olsen, K., 1981. The significance of fish behaviour in the evaluation ofhydroacoustic survey data. Int. Coun. Explor. Sea CM 1981/B:22, 25pp.
Olsen, K., Angell, J., Løvik, A., 1983a. Quantitative estimations of theinfluence of fish behaviour on acoustically determined fish abundance.FAO Fish. Rep. 300, 139–149 (Selected papers of the ICES/FAO Sym-posium on Fisheries Acoustics. Bergen, Norway, 21–24 June 1982).
Olsen, K., Angell, J., Petterson, F., Løvik, A., 1983b. Observed fish reac-tions to a surveying vessel with special reference to herring, cod,capelin and polar cod. FAO Fish. Rep. 300, 131–138 (Selected papersof the ICES/FAO Symposium on Fisheries Acoustics. Bergen, Nor-way, 21–24 June 1982).
Ona, E., Korneliussen, R.J., 2000. Herring vessel avoidance; diving ordensity draining. In: Proceedings of the Fifth European Conferenceon Underwater Acoustics, ECUA 2000, Lyon, France, pp. 1515–1520.
Pitcher, T.J., Parrish, J.K., 1993. Functions of shoaling behaviour inteleosts. In: Pitcher, T.J. (Ed.), The Behaviour of Teleost Fishes, 2nded. Chapman & Hall, London, pp. 364–439.
Pyanov, A.I., 1993. Fish learning in response to trawl fishing, fishbehaviour in relation to fishing operations. ICES Mar. Sci. Symp.196, 12–16.
Richardson, W.J., Greene, C.R., Malme, C.I., Thomson, D.H., 1995.Marine Mammals and Noise. Academic Press, San Diego.
Ryer, C.H., Olla, B.L., 1998. Shifting the balance between foraging andpredator avoidance: the importance of food distribution for a schoolingpelagic forager. Env. Biol. Fish. 52 (4), 467–475.
Schwartz, A.L., Greer, G.L., 1984. Responses of Pacific herring, Clupeaharengus pallasi, to some underwater sounds. Can. J. Fish. Aquat.Sci. 41, 1183–1192.
Skaret, G., Axelsen, B.E., Nøttestad, L., Ferno, A., Johannessen, A., 2005.The behaviour of spawning herring in relation to a survey vessel. ICES
V
Misund, O.A., 1996. Schooling dynamics of Norwegian spring spawn-ing herring (Clupea harengus) in a coastal spawning area. Sarsia 80,277–284.J. Mar. Sci. 62 (6), 1061–1064.abø, R., Olsen, K., Huse, I., 2002. The effect of vessel avoidance of
wintering Norwegian spring spawning herring. Fish. Res. 58, 59–77.