Developing Baltic cod recruitment models. I. Resolving spatial and temporal dynamics of spawning...
18
Developing Baltic cod recruitment models. I. Resolving spatial and temporal dynamics of spawning stock and recruitment for cod, herring, and sprat Friedrich W. Köster, Christian Möllmann, Stefan Neuenfeldt, Michael A. St. John, Maris Plikshs, and Rüdiger Voss Abstract: The Baltic Sea comprises a heterogeneous oceanographic environment influencing the spatial and temporal potential for reproductive success of cod (Gadus morhua) and sprat (Sprattus sprattus) in the different spawning basins. Hence, to quantify stock and recruitment dynamics, it is necessary to resolve species-specific regional reproductive suc- cess in relation to size, structure, and distribution of the spawning stock. Furthermore, as species and fisheries interac- tions vary between areas, it is necessary to include these interactions on an area-specific basis. Therefore, area- disaggregated multispecies virtual population analyses (MSVPA) were performed for interacting species cod, herring (Clupea harengus), and sprat in the different subdivisions of the Central Baltic. The MSVPA runs revealed distinct spa- tial trends in population abundance, spawning biomass, recruitment, and predation-induced mortality. Results, when evaluated with respect to trends in population sizes from research surveys, were similar for the cod and sprat stocks but different for herring. Horizontal distributions from MSVPA runs and research surveys indicate that cod and sprat undergo migrations between basins during different life stages. This is an observation potentially influencing estimates for the different stock components but not affecting the overall stock sizes. Résumé : La mer Baltique est un environnement océanique hétérogène qui influence la variation spatiale et temporelle du succès potentiel de la reproduction chez la Morue franche (Gadus morhua) et le Sprat (Sprattus sprattus) dans les différents bassins de fraye. Pour quantifier les stocks et la dynamique du recrutement, il est donc nécessaire de connaître la relation entre le succès de la reproduction régionale de chaque espèce et la taille, la structure et la réparti- tion du stock des géniteurs. De plus, comme les interactions entre les espèces et la pêche varient d’une région à l’autre, il est nécessaire de les inclure région par région. Des analyses de populations virtuelles plurispécifiques (MSVPA), désagrégées quant à la région, ont été menées sur les espèces en interaction, la Morue, le Hareng (Clupea harengus) et le Sprat dans les différentes subdivisions de la Baltique centrale. Les MSVPA mettent en lumière des structures spatiales distinctes dans la densité de population, la biomasse des géniteurs, le recrutement et la mortalité due à la prédation. Lorsque les résultats sont évalués en tenant compte des tendances dans les tailles des populations obtenues par les inventaires scientifiques, ils sont semblables pour les stocks de Morue et de Sprat mais différents pour le Hareng. Les répartitions horizontales générées par les MSVPA et les inventaires scientifiques montrent que les Mo- rues et les Sprats migrent d’un bassin à l’autre au cours de leur vie. Cette observation peut potentiellement affecter les estimations des différentes composantes des stocks mais non des densités totales des stocks. [Traduit par la Rédaction] Köster et al. 1533 Introduction In the Baltic Sea, the spatial and temporal suitability of the spawning habitats of cod (Gadus morhua) vary dramati- cally with the oxygen conditions at the depth of incubation of the eggs (Nissling and Westin 1991; Wieland et al. 1994). As a consequence, the population dynamics of cod exhibit distinct trends in different areas of the Central Baltic (Sparholt and Tomkiewicz 2000), with a corresponding vari- ation in predation pressure on its major prey species, herring (Clupea harengus) and sprat (Sprattus sprattus) (Sparholt 1994). In turn, the population development of these plankti- Can. J. Fish. Aquat. Sci. 58: 1516–1533 (2001) © 2001 NRC Canada 1516 DOI: 10.1139/cjfas-58-8-1516 Received August 18, 2000. Accepted March 5, 2001. Published on the NRC Research Press Web site at http://cjfas.nrc.ca on July 18, 2001. J15930 F.W. Köster, 1 C. Möllmann, and R. Voss. Institute of Marine Sciences, Düsternbrooker Weg 20, D-24105 Kiel, Germany. S. Neuenfeldt and M.A. St. John. 2 Danish Institute for Fisheries Research, Charlottenlund Castle, DK-2920 Charlottenlund, Denmark. M. Plikshs. Latvian Fisheries Research Institute, Daugavgrivas Street 8, LV-1007 Riga, Latvia. 1 Corresponding author (e-mail: [email protected]). 2 Present address: Institute of Hydrobiology and Fisheries Science, Hamburg University, Olbersweg 24, D-22767 Hamburg, Germany.
-
Upload
independent -
Category
Documents
-
view
3 -
download
0
Transcript of Developing Baltic cod recruitment models. I. Resolving spatial and temporal dynamics of spawning...

Developing Baltic cod recruitment models.I. Resolving spatial and temporal dynamics ofspawning stock and recruitment for cod, herring,and sprat
Friedrich W. Köster, Christian Möllmann, Stefan Neuenfeldt, Michael A. St. John,Maris Plikshs, and Rüdiger Voss
Abstract: The Baltic Sea comprises a heterogeneous oceanographic environment influencing the spatial and temporalpotential for reproductive success of cod (Gadus morhua) and sprat (Sprattus sprattus) in the different spawning basins.Hence, to quantify stock and recruitment dynamics, it is necessary to resolve species-specific regional reproductive suc-cess in relation to size, structure, and distribution of the spawning stock. Furthermore, as species and fisheries interac-tions vary between areas, it is necessary to include these interactions on an area-specific basis. Therefore, area-disaggregated multispecies virtual population analyses (MSVPA) were performed for interacting species cod, herring(Clupea harengus), and sprat in the different subdivisions of the Central Baltic. The MSVPA runs revealed distinct spa-tial trends in population abundance, spawning biomass, recruitment, and predation-induced mortality. Results, whenevaluated with respect to trends in population sizes from research surveys, were similar for the cod and sprat stocksbut different for herring. Horizontal distributions from MSVPA runs and research surveys indicate that cod and spratundergo migrations between basins during different life stages. This is an observation potentially influencing estimatesfor the different stock components but not affecting the overall stock sizes.
Résumé: La mer Baltique est un environnement océanique hétérogène qui influence la variation spatiale et temporelledu succès potentiel de la reproduction chez la Morue franche (Gadus morhua) et le Sprat (Sprattus sprattus) dans lesdifférents bassins de fraye. Pour quantifier les stocks et la dynamique du recrutement, il est donc nécessaire deconnaître la relation entre le succès de la reproduction régionale de chaque espèce et la taille, la structure et la réparti-tion du stock des géniteurs. De plus, comme les interactions entre les espèces et la pêche varient d’une région àl’autre, il est nécessaire de les inclure région par région. Des analyses de populations virtuelles plurispécifiques(MSVPA), désagrégées quant à la région, ont été menées sur les espèces en interaction, la Morue, le Hareng (Clupeaharengus) et le Sprat dans les différentes subdivisions de la Baltique centrale. Les MSVPA mettent en lumière desstructures spatiales distinctes dans la densité de population, la biomasse des géniteurs, le recrutement et la mortalitédue à la prédation. Lorsque les résultats sont évalués en tenant compte des tendances dans les tailles des populationsobtenues par les inventaires scientifiques, ils sont semblables pour les stocks de Morue et de Sprat mais différents pourle Hareng. Les répartitions horizontales générées par les MSVPA et les inventaires scientifiques montrent que les Mo-rues et les Sprats migrent d’un bassin à l’autre au cours de leur vie. Cette observation peut potentiellement affecter lesestimations des différentes composantes des stocks mais non des densités totales des stocks.
[Traduit par la Rédaction] Köster et al. 1533
Introduction
In the Baltic Sea, the spatial and temporal suitability ofthe spawning habitats of cod (Gadus morhua) vary dramati-cally with the oxygen conditions at the depth of incubationof the eggs (Nissling and Westin 1991; Wieland et al. 1994).
As a consequence, the population dynamics of cod exhibitdistinct trends in different areas of the Central Baltic(Sparholt and Tomkiewicz 2000), with a corresponding vari-ation in predation pressure on its major prey species, herring(Clupea harengus) and sprat (Sprattus sprattus) (Sparholt1994). In turn, the population development of these plankti-
Can. J. Fish. Aquat. Sci.58: 1516–1533 (2001) © 2001 NRC Canada
1516
DOI: 10.1139/cjfas-58-8-1516
Received August 18, 2000. Accepted March 5, 2001. Published on the NRC Research Press Web site at http://cjfas.nrc.ca onJuly 18, 2001.J15930
F.W. Köster,1 C. Möllmann, and R. Voss. Institute of Marine Sciences, Düsternbrooker Weg 20, D-24105 Kiel, Germany.S. Neuenfeldt and M.A. St. John.2 Danish Institute for Fisheries Research, Charlottenlund Castle, DK-2920 Charlottenlund,Denmark.M. Plikshs. Latvian Fisheries Research Institute, Daugavgrivas Street 8, LV-1007 Riga, Latvia.
1Corresponding author (e-mail: [email protected]).2Present address: Institute of Hydrobiology and Fisheries Science, Hamburg University, Olbersweg 24, D-22767 Hamburg, Germany.
J:\cjfas\cjfas58\cjfas-08\F01-092.vpFriday, July 13, 2001 8:57:18 AM
Color profile: DisabledComposite Default screen

© 2001 NRC Canada
Köster et al. 1517
vores determines the predation intensity on early life stagesof cod (Köster and Möllmann 2000). Hence, to develop sus-tainable management strategies for the Central Baltic stocks,assessments and stock projections need to resolve and incor-porate the effects of environmental variability and speciesinteractions on reproductive success, in particular the poten-tial for different spawning localities to contribute to recruit-ment success.
Multispecies virtual population analysis (MSVPA) has beenapplied addressing the biological interactions between fishstocks in the North Sea (Pope 1991; Stokes 1992) and theBaltic (Sparholt 1991, 1994). Sparre (1991) and Magnusson(1995) presented the theory and methods employed in theMSVPA as well as the underlying assumptions. The model
considers predation by specific piscivores on their major fishprey species as biological interactions affecting the popula-tion dynamics of the prey stocks. In the Central Baltic, cod,herring, and sprat are the most important fish species and arepresently the only species incorporated into the MSVPA(Sparholt 1994). Cod is assumed to be the top predator inthe system, exhibiting cannibalistic behaviour, while herringand sprat are treated as prey species. These interactions arebased on the analyses of the stomach contents of over62 000 cod, the majority of samples originating from Inter-national Council for the Exploration of the Sea (ICES) Sub-divisions 25, 26, and 28 in the Central Baltic (Fig. 1)collected during 1977–1993. At present, MSVPAs are runfor two areas in the Baltic, a Western and a Central Baltic
Fig. 1. Study area in the Baltic Sea with ICES subdivisions indicated.
J:\cjfas\cjfas58\cjfas-08\F01-092.vpFriday, July 13, 2001 8:57:20 AM
Color profile: DisabledComposite Default screen

component to match the stock units used in the regular stockassessments (Neuenfeldt and Köster 2000), with the CentralBaltic component dominating in terms of biomass and abun-dance (ICES 1998).
Within these two regions, the abundance and biologicalcharacteristics of the three species are heterogeneous bothspatially (between subdivisions) and temporally (inter- andintra-annually). For example, population sizes of CentralBaltic cod, as resolved by international bottom trawl(Sparholt and Tomkiewicz 2000) and ichthyoplankton sur-veys (Köster et al. 2001), have revealed distinct distribu-tional trends. Furthermore, for cod, substantial differences inweight at age and maturity ogives have been reported fordifferent subdivisions (ICES 1997a; Tomkiewicz et al.1997). The abundance and characteristics of herring andsprat have also been observed to vary spatially and tempo-rally in the different subdivisions of the Central Baltic (e.g.,Ojaveer 1989). The herring stock in the Central Baltic iscomposed of a number of different spawning componentsexhibiting variations in spawning period and growth rates aswell as meristic, morphometric, and otolith characteristics(e.g., Ojaveer 1981; Parmanne et al. 1994). For sprat, the ex-istence of distinct populations is controversial, as deviationsin growth rates observed between subareas have been ex-plained by immigration from the western Baltic and by mi-gration between different basins (Parmanne et al. 1994).However, other authors stated that sprat in the eastern Cen-tral Baltic form local populations (Ojaveer 1989), which canbe separated, primarily by otolith characteristics (Aps et al.1981).
In this study, we investigate the feasibility of conductingarea-disaggregated MSVPA runs to resolve the dynamics ofcod, herring, and sprat subpopulations in the different subdi-visions (Fig. 1) corresponding roughly to the Central Balticbasins (Ojaveer and Elken 1995). The major objective of thisexercise is to establish cod and sprat spawning populationsizes in their different spawning regions, i.e., the BornholmBasin located in Subdivision 25, the Gdansk Deep in Subdi-vision 26, and the Gotland Basin in Subdivision 28 (e.g.,Ojaveer 1981; Bagge et al. 1994), as characterised by dis-tinct hydrographic conditions (Bagge and Thurow 1993;MacKenzie et al. 2000). This exercise will thereby allow theinvestigation of regional reproductive success in relation tosize and structure of the originating spawning population(Köster et al. 2001).
Resolution of a number of issues is necessary before de-termining the applicability of the area-disaggregated MSVPAapproach. First is the validation of the area-disaggregatedMSVPA results with respect to temporal trends in abundanceand biomass of cod, herring, and sprat. In order to addressthis issue, results from trawl and hydroacoustic surveys arecompared with the MSVPA output. Secondly, the impact ofmigration on population abundance may invalidate the ap-proach. This issue is addressed by examining the relativehorizontal distributions between subdivisions as determinedby area-disaggregated MSVPA and research surveys. Finally,in order to assess the estimates relative to existing informa-tion of stock fluctuations, population sizes derived by theMSVPA runs were integrated over Subdivisions 25, 26, and28 and compared with standard ICES stock assessments(ICES 1998).
Methods
Area-disaggregated MSVPA parameterisationCod, herring, and sprat in Subdivisions 25, 26, and 28 (Fig. 1)
were assumed to be unit stocks composed of age-groups 0–9 forcod and herring and 0–7 for sprat with the oldest age-groups nothandled as plus groups. Quarterly catch at age in numbers andweight at age in the catch were utilised for the different subdivi-sions for 1977–1992 as revised by ICES (1997a) with inputs for1993–1996 based on national data reported to ICES (1997b).Weight at age in the catch was assumed to be equal to weight atage in the stock, exceptions being weight at age for cod age-groups0 and 1. Here, due to size selection by commercial gear, mean val-ues for the whole period were applied as determined by Sparholt(1991). To identify the spawning component of the stocks in thedifferent basins, existing maturity estimates were employed. Matu-rity ogives for cod in different subdivisions represent averages over5-year periods available from 1980 onwards for combined sexes(Tomkiewicz et al. 1997). As no data are at present available forthe period 1977–1979, estimates from the period 1980–1984 wereapplied. For herring and sprat stocks, maturity ogives were as-sumed to be constant over time and the estimates used are thosepreviously employed for these stocks in the Baltic (ICES 1997b).
Estimates of cod predation on herring and sprat as well as ofcannibalism are based on quarterly cod stomach content data bysubdivision as revised in ICES (1997a). Average age-specific quar-terly consumption rates were estimated by subdivision as describedin ICES (1999a). The residual natural mortality rate was assumedto be 0.2·year–1, equally distributed over quarters, corresponding tostandard MSVPA runs in the Baltic (Sparholt 1991). Suitability co-efficients of prey species age-groups as food of specific predatorage-groups (Sparre 1991) were estimated according to the standardsuitability submodel implemented in the Baltic MSVPA (ICES1997a). The tuning of the MSVPAs was performed by iterativelyrunning extended survivor analyses (Shepherd 1999) and MSVPAsexchanging updated terminal fishing and predation mortalities untilconvergence was achieved (Neuenfeldt and Köster 2000). Abun-dance indices utilised for tuning originated from the internationalbottom trawl survey directed to cod, performed annually inFebruary–March (Sparholt and Tomkiewicz 2000), and the interna-tional hydroacoustic survey directed to herring and sprat, con-ducted annually in September–October (ICES 1998).
Validation of area-disaggregated MSVPA resultsTo assess the feasibility of employing the area-disaggregated
MSVPA for resolving temporal trends of stock abundance in thedifferent basins, results from the model are compared with trawland hydroacoustic surveys estimates. Data from these sources fallinto two categories: those being data used to tune the area-disaggregated MSVPA, thus nonindependent, and data not em-ployed for tuning purposes. The international surveys utilised fortuning, although having an impact on the MSVPA results duringthe later part of the time series, have a reduced effect on the out-puts back in time. This feature makes these data valid for a com-parison of trends for a major part of the time series.
As a second mode of validation, independent population size in-dices are available from other research surveys, e.g., directed tospawning concentrations and young fish abundance. These indices,although independent, are typically not focused on monitoring pop-ulation sizes and hence are of a lower quality than thenonindependent data designed for this task. For the purposes ofvalidation, however, these sources are applicable for examiningtrends in abundance.
The third method of validation involves the temporal coherenceof population abundance and structure in the various basins. Thecomparison of relative horizontal distributions and correspondingage structures of the different subpopulations from area-
© 2001 NRC Canada
1518 Can. J. Fish. Aquat. Sci. Vol. 58, 2001
J:\cjfas\cjfas58\cjfas-08\F01-092.vpFriday, July 13, 2001 8:57:20 AM
Color profile: DisabledComposite Default screen

© 2001 NRC Canada
Köster et al. 1519
disaggregated MSVPA runs and corresponding research surveyswill validate the suitability of the approach regarding age-specificmigration between subdivisions.
Finally, spawning stock sizes and recruitment derived by thearea-disaggregated MSVPAs were summed over Subdivisions 25,26, and 28 and compared with corresponding estimates from thestandard stock assessment for the Central Baltic. These are compa-rable, as the standard assessment utilises predation mortalities fromarea-aggregated MSVPAs as input. This exercise resolves whetherthe approach of running a suite of independent MSVPAs generatesrobust results when compared with the best available informationon stock development.
Results
Output from area-disaggregated MSVPA runs
Spawning populationsSpawning stock biomass (SSB) values for cod, herring,
and sprat in the different subdivisions from the area-disaggregated MSVPA runs are presented in Fig. 2 and Ap-pendix Table A1. The Central Baltic cod stock displayed asubstantial decrease in SSB in all three areas from 1983 on-wards. The SSB increased again in the early 1990s in Subdi-visions 25 and 26 due to enhanced reproductive success anda reduction in fishing mortality; however, no recovery wasevident in Subdivision 28.
The herring SSB in Subdivisions 25 and 26 showed amore or less continuous decline to less than half of the origi-nal level from the beginning of the time series until the early1990s. Thereafter, the SSB stabilised, being substantiallylower in Subdivision 26. The SSB in Subdivision 28 exhib-ited an increase in stock size in the second half of the timeseries, reaching spawning stock sizes similar to those inSubdivision 25 in most recent years.
The SSB of sprat in Subdivisions 25 and 26 showed arather similar time trend, with an increase from very low
Fig. 2. SSB (second quarter) of (a) cod, (b) herring, and (c) sprat and recruitment at age 1 (beginning of the year) of (d) cod, (e) her-ring, and (f) sprat from area-disaggregated MSVPA in different subdivisions of the Central Baltic Sea (solid circles, Subdivision 25;open circles, Subdivision 26; triangles, Subdivision 28).
J:\cjfas\cjfas58\cjfas-08\F01-092.vpFriday, July 13, 2001 8:57:21 AM
Color profile: DisabledComposite Default screen

levels in the beginning of the 1980s to stable intermediatevalues in the second half of the decade. In the beginning ofthe 1990s, a substantial increase in the spawning stock is es-timated for both areas. In Subdivision 28, fluctuations in theSSB were much less pronounced; however, the general trendwas rather similar to that in Subdivisions 25 and 26.
RecruitmentEstimated recruitment of cod, herring, and sprat at age 1
for the different subdivisions is displayed in Fig. 2 and Ap-pendix Table A1. A declining trend in cod recruitment is ev-ident in the 1980s for all areas. The abundance of 1-group
cod was estimated to be lowest in Subdivision 28 throughoutthe time series, with extremely low estimates of recruitmentin this subdivision since 1990. During the second half of thetime series, cod recruitment was estimated to be highest inSubdivision 25 (with the exception of the 1993 year-class).An increase in recruitment from 1990 to 1994 is visible forSubdivision 26, followed by a decline in recent years.
Trends of herring recruitment to age 1 are in general simi-lar in all subareas, with a decline throughout the decadefrom maximum values during the beginning of the 1980s.Thereafter, recruitment stabilised in all areas, being highestin Subdivision 25 and lowest in Subdivision 26.
© 2001 NRC Canada
1520 Can. J. Fish. Aquat. Sci. Vol. 58, 2001
Fig. 3. Annual predation mortality rates of cod, herring, and sprat (a) age-group 0, (b) age-group 1, and (c) cod age-group 2, herringage-group 2–7, and sprat age-group 2–5 from area-disaggregated MSVPA in different subdivisions of the Central Baltic Sea (solid cir-cles, Subdivision 25; open circles, Subdivision 26; triangles, Subdivision 28). Note that predation mortality of the 0-group refers to thethird and fourth quarters.
J:\cjfas\cjfas58\cjfas-08\F01-092.vpFriday, July 13, 2001 8:57:22 AM
Color profile: DisabledComposite Default screen

Sprat recruitment was variable during the early part of thetime series, with an outstanding year-class evidenced in1982. During this period, recruitment in Subdivision 26 wasin general highest. Since 1982, recruitment in Subdivision28 was estimated to be the lowest, with a less pronouncedincrease in reproductive success than in the other basins af-ter the late 1980s. Recruitment success in Subdivisions 25and 26 has shown a similar trend since 1990, first with inter-mediate and finally with high recruitment.
Predation mortalityA substantial difference in cod cannibalism rates between
areas is apparent (Fig. 3), with the lowest predation on codestimated for 1978–1985 in Subdivision 25. Furthermore,age-specific differences in predation mortality are pro-nounced, with cannibalism rates on 0-group cod being con-siderably higher than on 1-group cod. Predation on 2-groupcod was in general low, i.e., less than 50% of the applied re-sidual mortality of 0.2. In Subdivision 28, cannibalism ratesdeclined from maximum values in 1983 to extremely lowvalues in the 1990s.
Predation rates of cod on herring (Fig. 3) were highest inSubdivision 26 in the beginning and at the end of the timeseries, independent of prey age. In all areas, predation mor-tality rates declined throughout the 1980s to lowest levels inearly 1990s, with a subsequent increase in most recent yearsin Subdivision 25 and 26, while predation in Subdivision 28remained rather low. Estimated predation mortality rateswere in general highest for 1-group herring, intermediate for0-group herring, and comparatively low for older herring.
Maximum predation pressure on 0-group sprat occurred in1983 and on older age-groups 3–4 years earlier (Fig. 3). In-dependent of the prey age, a decrease in predation mortalityoccurred until 1991, with a subsequent increase in recentyears in Subdivisions 25 and 26. Cod predation on juvenilesprat was of a similar magnitude to that estimated for her-ring, while predation mortality rates of adult sprat were con-siderably higher than for adult herring.
Validation of area-disaggregated MSVPA results
Validation employing trawl and hydroacoustic surveys usedfor MSVPA tuning
Significant linear relationships were obtained between area-disaggregated MSVPA estimates of cod population size(age-group 2+) (Appendix Table A1) and abundance indicesbased on bottom trawl surveys (Appendix Table A2) in allthree subareas (Fig. 4), with the lowestr2 values observed inSubdivision 25 (r2 = 0.64), intermediate in Subdivision 26(r2 = 0.69), and highest in Subdivision 28 (r2 = 0.80). Inter-cepts were significant for Subdivisions 26 and 28 (p = 0.039and 0.041) but not in Subdivision 25 (p = 0.052). Largeinterannual variability was observed in the internationaltrawl survey in Subdivision 25 in 1980–1982 and 1985–1987, causing large deviations between observed and mod-elled population abundance. Similarly, in Subdivision 26,considerable deviations occurred in the beginning of thetime series, with a high trawl survey abundance index in1982 and a relatively low one in 1983. Interestingly, in Sub-division 28, the 1983 survey revealed the highest abundanceindices on record, potentially indicating a shift in distribu-tion compared with 1982 and subsequent years. Apart from
this observation, evidence of interannual shifts in distribu-tion between different subareas is not apparent. Correlatingthe age-specific abundance values obtained from the area-disaggregated MSVPA runs against corresponding indicesfrom the trawl survey revealed a dome-shaped pattern ofr2
values with age, being lowest in the oldest age-groups. Thismight indicate tuning problems encountered for these age-groups, while the decreasing fit in younger age-groups canbe explained mainly by trawl selectivity. Cod recruitmentestimates at age 1 derived by area-disaggregated MSVPAruns (Appendix Table A1) were nevertheless significantlycorrelated with abundance indices from the survey (Appen-dix Table A3), with highest variability in Subdivision 25(Table 1). Here, an especially low abundance index of the1979 year-class in the 1980 survey does not coincide withhigh recruitment estimated by the area-disaggregatedMSVPA. Excluding this year-class from the correlation im-proved the relationship between both recruitment estimatesconsiderably (r2 = 0.60).
In contrast with cod, correlation between abundance esti-mates of herring from area-disaggregated MSVPA runs (Ap-pendix Table A1) and hydroacoustic surveys (AppendixTable A2) revealed no significant relationships for any of thesubdivisions (Fig. 4).
For sprat, the comparison between international hydro-acoustic survey results (Appendix Table A2) and area-disaggregated MSVPA output (Appendix Table A1) revealedtrends similar to those observed for cod (Fig. 4), also withlowestr2 values in Subdivision 25 (r2 = 0.59) and highest inSubdivision 28 (r2 = 0.80). The increase in population sizein the 1990s observed in the MSVPA estimates for Subdivi-sion 25 is less pronounced in the hydroacoustic surveys. Inparticular, the survey estimate obtained in 1992 appears tobe rather low. Due to technical and area coverage problems,the hydroacoustic surveys in 1992 and 1993 (the latter omit-ted here) have been suggested to be the most unreliable inthe present time series and are in fact excluded from regularassessment runs (ICES 1997b). In Subdivision 28, contraryto Subdivision 25, the increase in population size in recentyears is more pronounced in the hydroacoustic survey thanin the area-disaggregated MSVPA. A similar comparison forsprat recruitment at age 1 (Appendix Tables A1 and A3) re-vealed significant correlations for all subareas, with highestr2 values in Subdivision 25 and lowest in Subdivision 28(Table 1). In the latter area as well as in Subdivision 26,large deviations occurred for the 1982 year-class, with theMSVPA estimates being significantly higher. Excluding thisyear from the correlation increased ther2 values consider-ably (0.65 in Subdivision 26 and 0.79 in Subdivision 28).Thus, recruitment of the 1982 year-class appears to be se-verely overestimated by the area-disaggregated MSVPA,while in general, hydroacoustic- and MSVPA-derived re-cruitment estimates are in good agreement.
Validation employing independent research surveysValidation of the area-disaggregated MSVPA estimates for
cod was performed against Latvian bottom trawl surveys con-ducted in Subdivisions 26 and 28 in January and November–December during 1976–1991 (Appendix Table A2). Theseestimates of age-group 3+ cod abundance were significantlycorrelated with the corresponding area-disaggregated MSVPA
© 2001 NRC Canada
Köster et al. 1521
J:\cjfas\cjfas58\cjfas-08\F01-092.vpFriday, July 13, 2001 8:57:22 AM
Color profile: DisabledComposite Default screen

output (Fig. 5), withr2 values ranging from 0.52 to 0.90.Despite these significant relationships, a number of notewor-thy deviations were evident. Outstandingly high abundancesof 3+ cod in Subdivision 28 were encountered in the trawlsurveys in January 1983, a result not reflected in theMSVPA estimates. In Subdivision 26, a reverse situationwas encountered, with comparatively low catch rates in Jan-uary and November–December 1983 as compared with high
population abundance estimated by the MSVPA. These re-sults may indicate an anomalous distribution of the stock in1983 as in the previous section identified by the interna-tional bottom trawl survey.
Further corroborative results come from Latvian demersaltrawl surveys on cod spawning concentrations in the GotlandBasin (Uzars et al. 1991). These show a decline in biomassindices of 84% during the period 1980–1989, a result corre-
© 2001 NRC Canada
1522 Can. J. Fish. Aquat. Sci. Vol. 58, 2001
Fig. 4. Population sizes of cod (age-group 2+), herring (age-group 1+), and sprat (age-group 1+) derived by area-disaggregated MSVPA atthe time of survey versus abundance indices from tuning fleets. (a) Subdivision 25; (b) Subdivision 26; (c) Subdivision 28. The coefficientof determination (r2) is from a linear regression model, allowing for an intercept. BITS, Baltic international trawl survey.
J:\cjfas\cjfas58\cjfas-08\F01-092.vpFriday, July 13, 2001 8:57:23 AM
Color profile: DisabledComposite Default screen

© 2001 NRC Canada
Köster et al. 1523
Subdivision Year-classes ParameterParameterestimate p r2
Cod25 1979–1995 Slope 6.2329 × 10⁶ 0.015 0.34
Intercept 1.4396 × 10⁸ <0.00126 1980–1995 Slope 3.2003 × 10⁶ <0.001 0.73
Intercept 9.1831 × 10⁷ <0.00128 1981–1995 Slope 8.3191 × 10⁶ <0.001 0.88
Intercept 98 953 <0.001Sprat25 1981–1995 Slope 5.4102 <0.001 0.68
Intercept 2.1162 × 10¹⁰ <0.00126 1981–1995 Slope 1.3676 0.012 0.42
Intercept 1.1497 × 10¹⁰ 0.14628 1981–1995 Slope 0.2798 0.002 0.35
Intercept 9.8700 × 10¹⁰ 0.024
Table 1. Linear regressions performed to validate cod and sprat recruitment (age-group 1) fromarea-disaggregated MSVPA (dependent variable) (numbers) using results from the internationalbottom trawl survey for cod (no.·h–1) and the international hydroacoustic survey for sprat (num-bers), parameter estimates, and their significance level andr2 value.
Fig. 5. Population sizes of cod (age-group 3+) derived by area-disaggregated MSVPA versus abundance indices from the Latvian bot-tom trawl survey in Subdivisions (SD) 26 and 28. (a) January; (b) November–December. The coefficient of determination (r2) is froma linear regression model, allowing for an intercept.
J:\cjfas\cjfas58\cjfas-08\F01-092.vpFriday, July 13, 2001 8:57:23 AM
Color profile: DisabledComposite Default screen

sponding to a similar decline of the SSB derived by the area-disaggregated MSVPA for the same period. Catch rates frompelagic trawl surveys covering the Bornholm Basin at differ-ent times of the spawning season revealed on average a 53%reduction in abundance of sexually mature cod from 1995 to1996 (ICES 1999b), a trend that is not obvious from thearea-disaggregated MSVPA. Comparing the daily egg pro-duction at peak spawning time as derived by ichthyo-plankton surveys with corresponding potential annual eggproduction from 1986 to 1996 (Köster et al. 2001) revealedmaximum egg production by both methods in the BornholmBasin in 1994 and 1995. In 1996, a large potential egg pro-duction (only 5% lower than the maximum in 1994) is con-trasted by a 46% lower egg production as obtained from theichthyoplankton survey. This indicates an overestimation ofthe most recent cod population size obtained by the area-disaggregated MSVPA for Subdivision 25.
Unfortunately, hydroacoustic surveys by the formerGDR/USSR conducted in May–June 1979–1986 (Sjöstrand1989) are not representative of the abundance of herring.The majority of the spring-spawning herring aggregate out-side the survey area on their spawning grounds during thisperiod (e.g., Aro 1989; Parmanne et al. 1994), making theseobservations unreliable for estimating abundance and distri-bution. Other independent survey information, e.g., the Pol-ish young fish survey, either showed high interannualvariability (ICES 1998) or did not cover comparable areas orsufficient time periods (Sjöstrand 1989). Thus, the availableindependent data on herring abundance appear to be insuffi-cient for validation of the area-disaggregated MSVPA re-sults.
Validation of area-disaggregated MSVPA derived biomassvalues of sprat were performed using above-mentioned hydro-acoustic surveys (Table 2) conducted in May–June 1979–1986 (data compiled by Sjöstrand 1989) as well as Danishand Russian hydroacoustic surveys conducted in May–June1995 (J. Tomkiewicz, Institute of Marine Sciences, Kiel,Germany, personal communication; T.G. Vasilieva, AtlanticScientific Research Institute of Marine Fisheries and Ocean-ography, Kaliningrad, Russia, personal communication). Thecorrelation between area-disaggregated MSVPA output andhydroacoustic survey results was high in all subdivisions
(r2 = 0.83 to 0.91), driven mainly by the increase in stockbiomass from the mid-1980s to 1995.
Population spatial dynamicsIn order to validate the spatial distribution of adult cod in
the Central Baltic, the area-specific relative abundance ofage-group 3+ from bottom trawl surveys in February–March(Sparholt and Tomkiewicz 2000) is plotted against the rela-tive population abundance from the area-disaggregatedMSVPAs (Fig. 6). In Subdivision 26, the population re-mained stable throughout the time period, with the highestabundance observed in both the trawl survey and MSVPAestimates in 1996. In Subdivision 25, the proportions esti-mated by the MSVPA were in general higher than that ob-served in the trawl surveys, whereas in Subdivision 28, theMSVPA estimates were in general lower. Within the latterarea, a clear time trend of decreasing importance of thestock component is indicated by both data sources, with re-cent years being similarly low in the area-disaggregatedMSVPA and trawl survey results.
Cod recruits (age-group 1) showed a different distributionpattern than did adult cod. Highest proportions were encoun-tered by the trawl survey in Subdivision 26, while theMSVPA estimated intermediate proportions (Fig. 6). On thecontrary, in Subdivision 25, the MSVPA-derived recruitmentis in general high and the corresponding fractions in thetrawl surveys are comparatively low, with a time trend of in-creasing importance of the area determined by the formerbut not by the latter. For Subdivision 28, independent of themethod, rather similar low proportions were calculated, es-pecially in recent years. The distribution pattern of age-group 2 by the area-disaggregated MSVPA changed onlyslightly from that of age-group 1. However, in the trawl sur-vey, considerable changes with age were observed, with in-creased proportions in Subdivisions 25 and 28 and decreasedproportions in Subdivision 26.
The higher fraction of the cod stock derived by the trawlsurveys in Subdivision 28 and a lower fraction in Subdivi-sion 25 may be interpreted as a spawning migration from theGotland Basin to the Bornholm Basin taking place after thebottom trawl survey is performed in the first quarter. Thesemigrations have been previously described (Lablaika andLishev 1961).
The distribution pattern from the trawl survey changeswith age, i.e., recruits of age-group 1 concentrate in Subdivi-sion 26. A biological explanation for this dislocation relativeto the area-disaggregated MSVPA results may be a drift oflarvae and pelagic juveniles out of the Bornholm Basin intothe neighbouring subdivision, which has been identifiedthrough the application of hydrodynamic models (Voss et al.1999; Hinrichsen et al. 2001). The change in relative distri-bution of age-group 2 indicates either a higher mortality ofjuveniles in Subdivision 26, not accounted for in theMSVPA, or a movement out of the area. In fact, an analysisof catch rates obtained from Latvian trawl surveys con-ducted at different times of the year in the Gotland Basin(see above) revealed indications of an expansion of juvenilecod into the Gotland Basin from southern areas.
The relative distribution of herring obtained by hydro-acoustic surveys in September–October and that of the area-
© 2001 NRC Canada
1524 Can. J. Fish. Aquat. Sci. Vol. 58, 2001
Year
SD 25 SD 26 SD 28
Survey MSVPA Survey MSVPA Survey MSVPA
1979 161 56 118 104 162 491981 68 73 76 101 41 511982 149 143 70 83 110 401984 159 341 120 319 147 921985 152 285 173 841986 153 295 128 215 165 631995 465 722 560 737 440 448
Note: An empty cell indicates that a reliable survey was not conductedduring that period.
Table 2. Comparison of sprat biomass estimates (age-group 1+)(kt) in different subdivisions (SD) as derived from hydroacousticsurveys in May–June and area-disaggregated MSVPA (secondquarter).
J:\cjfas\cjfas58\cjfas-08\F01-092.vpFriday, July 13, 2001 8:57:24 AM
Color profile: DisabledComposite Default screen

© 2001 NRC Canada
Köster et al. 1525
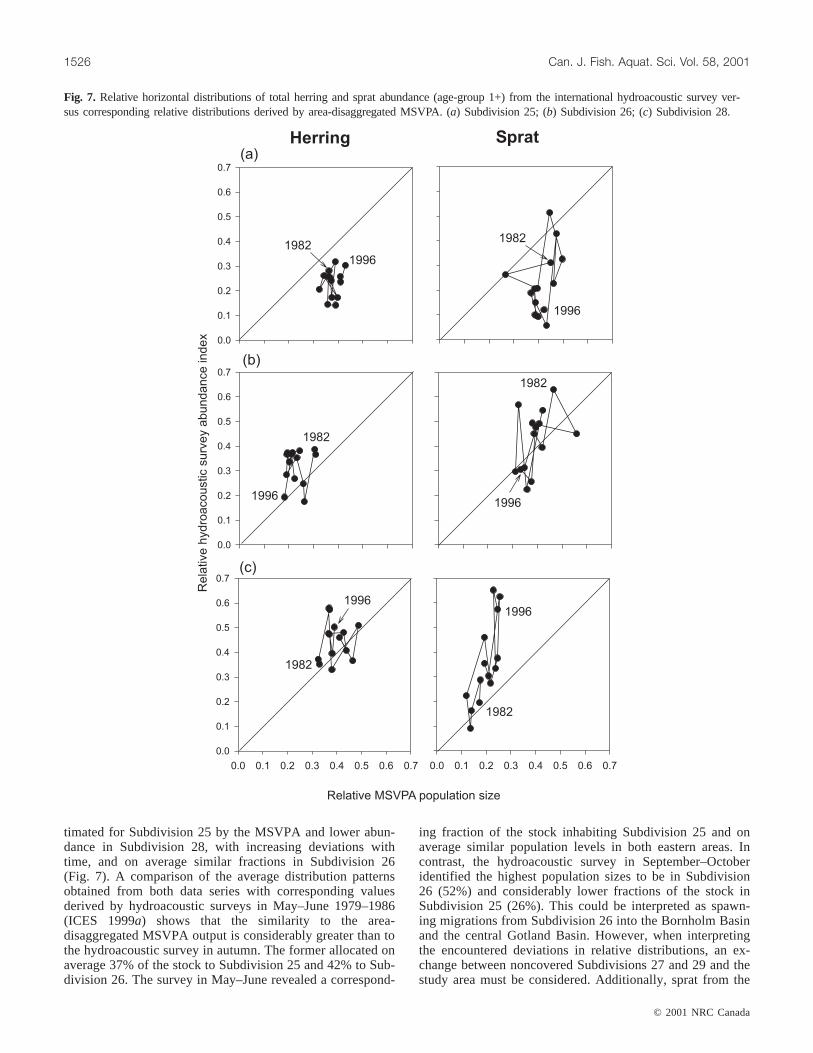
disaggregated MSVPA match on average for Subdivision28, whereas the fraction inhabiting Subdivision 25 estimatedby the MSVPA was slightly higher (Fig. 7). Pronouncedlong-term changes in the relative distribution of the herringpopulations were not obvious in any of the time series. Al-though not commonly agreed, it has been argued (e.g.,Ojaveer 1989) that there exist three distinct herring groupsin the Baltic, the open sea and the coastal spring-spawningherring as well as the autumn-spawning herring, representedby various independent stocks, showing different migration
patterns. Additionally, the intensity of these migrations de-pends on environmental conditions and food supply(Parmanne et al. 1994). Hence, due to this complex stockstructure and the migratory behaviour of herring within andbetween subdivisions (e.g., Aro 1989; Ojaveer 1989), anevaluation of the obtained relative distribution patterns fromthe area-disaggregated MSVPA is extremely difficult.
When repeating the exercise for sprat using the interna-tional hydroacoustic survey of September–October, a picturesimilar to that for cod is obtained. Higher proportions are es-
Fig. 6. Relative horizontal distributions of total cod abundance indices (age-groups 3+, 1, and 2) from the Baltic international trawlsurvey versus corresponding relative distributions estimated by area-disaggregated MSVPA. (a) Subdivision 25; (b) Subdivision 26;(c) Subdivision 28.
J:\cjfas\cjfas58\cjfas-08\F01-092.vpFriday, July 13, 2001 8:57:24 AM
Color profile: DisabledComposite Default screen
© 2001 NRC Canada
1526 Can. J. Fish. Aquat. Sci. Vol. 58, 2001
timated for Subdivision 25 by the MSVPA and lower abun-dance in Subdivision 28, with increasing deviations withtime, and on average similar fractions in Subdivision 26(Fig. 7). A comparison of the average distribution patternsobtained from both data series with corresponding valuesderived by hydroacoustic surveys in May–June 1979–1986(ICES 1999a) shows that the similarity to the area-disaggregated MSVPA output is considerably greater than tothe hydroacoustic survey in autumn. The former allocated onaverage 37% of the stock to Subdivision 25 and 42% to Sub-division 26. The survey in May–June revealed a correspond-
ing fraction of the stock inhabiting Subdivision 25 and onaverage similar population levels in both eastern areas. Incontrast, the hydroacoustic survey in September–Octoberidentified the highest population sizes to be in Subdivision26 (52%) and considerably lower fractions of the stock inSubdivision 25 (26%). This could be interpreted as spawn-ing migrations from Subdivision 26 into the Bornholm Basinand the central Gotland Basin. However, when interpretingthe encountered deviations in relative distributions, an ex-change between noncovered Subdivisions 27 and 29 and thestudy area must be considered. Additionally, sprat from the
Fig. 7. Relative horizontal distributions of total herring and sprat abundance (age-group 1+) from the international hydroacoustic survey ver-sus corresponding relative distributions derived by area-disaggregated MSVPA. (a) Subdivision 25; (b) Subdivision 26; (c) Subdivision 28.
J:\cjfas\cjfas58\cjfas-08\F01-092.vpFriday, July 13, 2001 8:57:25 AM
Color profile: DisabledComposite Default screen

western Baltic migrate to some extent to the Bornholm Ba-sin for spawning (Aro 1989; Parmanne et al. 1994).
Comparison of standard stock assessment and area-disaggregated MSVPA results
Standard assessment results for the Central Baltic cod stock(Subdivisions 25–32), the Central Baltic herring stock (Sub-divisions 25–29 and 32, including the Gulf of Riga), and theBaltic sprat stock (Subdivisions 22–32) (ICES 1998) allowvalidation of the output of the area-disaggregated MSVPA(summed over Subdivisions 25, 26, and 28). The standardassessment utilises area-aggregated MSVPA derived preda-tion mortalities as input and is thus comparable with the in-tegrated results obtained by the area-disaggregated MSVPAs.However, stock units for all three species are not the same,as the regular assessment also includes at least Subdivisions27, 29, and 32. The major part of the cod catch (90–98%) isnevertheless taken in the areas covered by the present study(Sparholt and Tomkiewicz 2000).
Herring population estimates for Subdivisions 25–28 canbe obtained from standard assessment results (ICES 1998)encompassing Subdivisions 25–29 and 32, when subtractingstock estimates for Subdivisions 29 and 32 determined byICES (1998). However, Subdivision 27 is still included as anarea that sustains a substantial herring fishery and for whichthe international hydroacoustic survey on average estimates21% of the entire population in the Central Baltic.
The standard assessment of sprat treats the entire Baltic asone stock unit. To account for sprat in the western Baltic(Subdivisions 22–24), population estimates derived by anearlier MSVPA (ICES 1997a) were subtracted from the esti-mates for the entire Baltic. Subdivisions 25, 26, and 28 cov-ered in the present study sustain the major part of the spratcatch in the Baltic (79–83% in recent years). Nevertheless,the area-disaggregated MSVPA population sizes should to acertain degree underestimate the Central Baltic sprat stockcompared with the standard assessment (excluding Subdivi-sions 22–24), as Subdivisions 27, 29, and 32 are still not in-cluded.
Standard assessment and area-disaggregated MSVPA de-rived estimates of cod SSB show a similar development from1986 to 1995 (Fig. 8). The standard assessment estimates arein general slightly higher, due to the incomplete area cover-age by our disaggregated multispecies assessment. A rela-tively large discrepancy occurred in 1996, with the regularassessment estimate being substantially lower. This resultconfirms the overestimation by the area-disaggregated MSVPAof the population size in Subdivision 25 in recent years (de-scribed above). In the first part of the time series, consider-ably higher SSB values were estimated by the standardassessment. This cannot be explained by the lack of inclu-sion of Subdivisions 27, 29, and 32 in the present area-disaggregated MSVPA runs. Other factors, e.g., differencesin the recompiled catch and especially weight at age data(see below), obviously contribute to this deviation.
For herring, the trends in SSB estimates from standard as-sessment and area-disaggregated MSVPA were rather simi-lar, with a less rapid decline in the stock predicted by thelatter (Fig. 8). The difference between the estimates fromSubdivisions 25–28 and the area-disaggregated MSVPA out-put are higher than expected from the lack of area coverage,
which is caused by deviations in the revised and the stan-dard assessment catch at age database (ICES 1999a).
Standard assessment and area-disaggregated MSVPA esti-mates for sprat SSB are relatively similar throughout the en-tire time series (Fig. 8). Until 1983, the standard assessmentSSBs are higher than the corresponding multispecies esti-mates; this could be expected due to the differences in areacoverage. However, since 1984 the area-disaggregated MSVPAderived spawning stocks are in general slightly higher.
Cod recruitment estimates derived by both assessments(age-group 2) were similar throughout the time series(Fig. 9). This clearly demonstrates that the large deviationsencountered in the SSB early in the time series are generatedto a large extend by deviations in weight at age in the stock.These are set as constant in the regular assessment before1983.
For herring, standard assessments give an impression withrespect to recruitment (age-group 1) development similar toour multispecies assessment until the mid-1980s but showincreasing differences afterwards (Fig. 9). As expected, re-cruitment values generated by the area-disaggregated MSVPAruns were in general lower. However, especially in the be-ginning of the time series, the deviation was less than ex-pected. This indicates that the major changes in SSB duringthis period were to a large extent due to deviations in weightat age.
Sprat recruitment (age-group 1) as determined by bothmethods was rather similar in all years considered. The area-disaggregated MSVPA revealed in general slightly highervalues, with the exception of recent years (Fig. 9).
Discussion
The results of the area-disaggregated MSVPA runs per-formed here revealed distinct trends in population abundance,spawning biomass, recruitment, and predation mortalities ofcod and sprat in different areas of the Central Baltic. Theseresults were in general similar to time trends in populationsizes of cod and sprat as estimated by standard assessments,research surveys utilised for tuning of the MSVPA runs, aswell as independent estimates of stock abundance. The ap-plication of the area-disaggregated MSVPA was inconclu-sive for Baltic herring stocks due to timing and area coverageof surveys, complexity of stock structure, and migratory be-haviour. Hence, due to the limited amount of other suitabledata series on herring abundance, a conclusive validation ofdistribution of the stock appears at present to be impossible.The area-disaggregated MSVPA does, however, capture thetemporal dynamics of the Baltic herring population as esti-mated by the standard assessment.
A number of data-related and methodological problemsimpact upon the utility of the present approach for cod andsprat. For example, the newly compiled catch at age data forcod and sprat (ICES 1997a) showed considerable fluctua-tions in some age-groups, quarters, and years. High variabil-ity in the catch in numbers of the last age-group of codcaused problems in tuning the terminal fishing mortality val-ues. For sprat, tuning of the last year in the time series wasproblematic in Subdivisions 25 and 26 due to trends in fish-ing mortality at age as well as changes in the exploitation
© 2001 NRC Canada
Köster et al. 1527
J:\cjfas\cjfas58\cjfas-08\F01-092.vpFriday, July 13, 2001 8:57:25 AM
Color profile: DisabledComposite Default screen

© 2001 NRC Canada
1528 Can. J. Fish. Aquat. Sci. Vol. 58, 2001
pattern (ICES 1998) caused by the commencement of a large-scale reduction fishery.
The virtual population analysis technique assumes thatcatch at age data are exact input data, which due to severalreasons is seldom the case. The present analysis covers atime period with well-established reporting systems in theBaltic introduced in the mid-1970s. The data compilationprocedure utilising information submitted by the responsiblenational laboratories is described in detail in ICES (1997a,1999a). However, discarding and misreporting take place inBaltic cod and are not accounted for in the present catch atage data. The estimated discards of age-group 1–2 in 1998and 1999 amounted to 17 and 4%, 9 and 2%, and 3 and 2%of the total catch in numbers in Subdivisions 25, 26, and 28,respectively (ICES 2000). These preliminary data indicateconsiderable interannual variability in discards and a poten-
tial bias of recruitment estimates in years of intensive dis-carding. Misreporting in the cod fishery has been identifiedby ICES (1997b) especially for the period 1992–1994 withrestrictive fisheries management measures enforced. Misre-porting is partly accounted for by national catch estimatestreated in the assessment as unallocated catches according tosubdivision. However, for the above period, a considerableunderestimation of the catch may have nevertheless occurred,affecting the spawning stock size estimation in 1991–1994and recruitment of the 1990–1992 year-classes. Anothersource of bias is errors in age reading of Baltic cod otoliths(Bagge et al. 1994), with deviations in estimated age of 1–2years between different countries commonly occurring(ICES 2000). This affects especially the estimation of year-class strength and its interannual variability.
Migration between different areas of the Central Baltic is
Fig. 8. SSB derived by area-disaggregated MSVPA and standardstock assessments (XSA) (both at the beginning of the year) of(a) cod, (b) herring, and (c) sprat (solid circles, MSVPA; opencircles, XSA for standard assessment areas; triangles (Fig. 8b),XSA Subdivisions 25–28). See text for a detailed description ofstandard assessment areas.
Fig. 9. Recruitment derived by area-disaggregated MSVPA andstandard stock assessments (XSA) (beginning of the year) of(a) cod, (b) herring, and (c) sprat (solid circles, MSVPA; opencircles, XSA for standard assessment areas; triangles (Fig. 9b),XSA Subdivisions 25–28). See text for a detailed description ofstandard assessment areas.
J:\cjfas\cjfas58\cjfas-08\F01-092.vpFriday, July 13, 2001 8:57:26 AM
Color profile: DisabledComposite Default screen

expected to have an impact on the area-disaggregatedMSVPA results for all stocks. As stated by ICES (1999a),explicit inclusion of the migration process into the MSVPAcontext is difficult, and at present, no adequate methodologyis available. Reliable migration rates are missing for allstocks under consideration, and databases required for theimplementation of statistically based spatial multispeciesmodels, e.g., BORMICON (Stefánsson and Pálsson 1998),are not readily available. Even with these databases at hand,however, conflicting output trends depending on considereddata sources might also be encountered, as recently demon-strated for the BORMICON application in the Icelandic sys-tem (Stefánsson 1998). At present, the only feasible way ofresolving spatial distribution in the Baltic is to run a suite ofindependent MSVPAs for the different subareas, as per-formed in this study. Following this approach, migration isaccounted for by fluctuations in the catch at age data only.
The validation of the area-disaggregated MSVPA resultsprovided several indications of migratory behaviour by cod.The recruitment of cod determined in Subdivisions 26 and28, in the absence of any reproductive volume, indicates anintroduction of recruits from the neighbouring Subdivision25, the only spawning area at present with hydrographicconditions conducive to egg survival (MacKenzie et al.2000). Migration between basins was also evidenced fromthe comparison of relative distribution pattern of age-groups1 and 2 derived by area-disaggregated MSVPA runs andtrawl surveys. The results suggest that most of the recruit-ment to the eastern spawning areas in the last 10 years hasoriginated in Subdivision 25, as concluded by Bagge andThurow (1993), juvenile pelagic stages originating in Subdi-vision 25 being transported to southeastern areas of the Cen-tral Baltic and expanding northwards into the Gotland Basinduring their second and third years of life. Furthermore,from the comparison of area-disaggregated MSVPA derivedrelative distributions of adult cod and trawl survey results, itis clear that a substantial part of the adult stock returns tospawn in the Bornholm Basin. Such a spawning migration isconfirmed by historical tagging data (Netzel 1974) and catch-per-unit-effort data from commercial fisheries (Lablaika andLishev 1961). Cod tagged in the vicinity of the BornholmBasin behaved rather stationary (Bagge et al. 1974). As aconsequence, stock numbers at age 1 and 2 in Subdivision25 are always overestimated by the area-disaggregatedMSVPA. This is a problem in modelling cannibalism, as re-cruits originating from Subdivision 25 growing up in Subdi-vision 26 are preyed upon in the model by the wrong stockcomponent. However, the adult cod population size was cal-culated to be of the same order of magnitude in Subdivisions25 and 26, and thus, it is not expected that predation mortali-ties are seriously biased.
As a consequence of the observed migration patterns ofcod, the application of area-specific results in stock recruit-ment models depends critically on the behaviour of recruitsgrowing up in Subdivisions 26 and 28 after reaching sexualmaturity. If they return to their original spawning ground, in-dependent of the hydrographic situation, no significant influ-ence on area-specific stock–recruitment relationships is to beexpected. If, however, favourable hydrographic conditions ineastern basins result in a spawning behaviour close to their
nursery areas or if unfavourable spawning conditions forcethe mature stock components originating from Subdivisions26 and 28 to migrate to the Bornholm Basin, biased relation-ships are likely. The first behaviour will result in a gain ofrecruits in Subdivisions 26 and 28 under favourable oxygenconditions, whereas the latter will lead to a correspondinggain of adults in Subdivision 25 during stagnation periods.In the area-disaggregated MSVPA model, these cod enteringthe fishery will increase not only the estimated adult stocksize in the subdivision but also the estimates of recruitmentsome years back in time. Although spawning migrations intothe Bornholm Basin occur regularly, also in years of favour-able environmental spawning conditions in eastern spawningareas (Netzel 1974), the intensity of the spawning migrationhas been related to environmental conditions (Lablaika andLishev 1961). Thus, it is likely that both described scenariosoccur. Consequently, a certain impact of variable spawningmigrations on the population estimates derived by the area-disaggregated MSVPA runs has to be expected. Addi-tionally, separation into subdivisions is not the most appro-priate way to distinguish between different spawningpopulations of cod, as Subdivision 26 contains, in additionto the Gdansk Deep, the southern tip of the Gotland Basinand thus represents to a certain extent a mixture of twospawning stock components.
For sprat, the contribution of Subdivision 25 to the com-bined stock in the Central Baltic was found to be consider-ably greater in the MSVPA output than in the September–October hydroacoustic surveys. However, hydroacoustic sur-veys in May–June showed highest sprat concentrations inthe Bornholm Basin, thus confirming the distribution patternobtained by the area-disaggregated MSVPA runs. This indi-cates a different distribution of sprat during spawning andfeeding periods, potentially caused by migrations betweensubdivisions, a process that is at present not sufficiently re-solved (see Aro 1989; Parmanne et al. 1994). A potential re-distribution of the sprat spawning stock during feeding willhave an effect on the SSB and recruitment estimated by thearea-disaggregated MSVPA runs for the different subdivi-sions. However, a major part of the catch is obtained duringthe first half of the year in a fishery directed to prespawningand spawning concentrations (ICES 1999b). Hence, the rela-tive distributions derived by the area-disaggregated MSVPAruns and hydroacoustic surveys at spawning time are well inline. Consequently, the effect of migratory behaviour on SSBestimates should be of limited importance.
In summary, the area-disaggregated MSVPA approachpresented here has, through comparison with existing datasets, successfully resolved the basin-specific stock dynamicsof cod and sprat in the Central Baltic Sea. This result allowsthe application of the area-disaggregated MSVPA to spa-tially resolve the SSB of the different spawning basins,thereby allowing the utilisation of area-specific reproductivesuccess in recruitment modelling of these stocks (Köster etal. 2001). This is a key issue in the management of Balticfish stocks.
Utilisation of basin-specific spawning stock sizes andstructures as a measure of the stock’s reproductive effort indifferent spawning areas is to a certain degree affected bymigration. However, as the fishery on cod and sprat tradi-
© 2001 NRC Canada
Köster et al. 1529
J:\cjfas\cjfas58\cjfas-08\F01-092.vpFriday, July 13, 2001 8:57:27 AM
Color profile: DisabledComposite Default screen

tionally focuses on prespawning and spawning concentra-tions, the area-disaggregated MSVPA derived results arebelieved to give an improved and extended estimate of thetime series of stock size, structure, and distribution whencompared with available trawl and hydroacoustic survey es-timates. Furthermore, the results obtained during this exer-cise, in conjunction with the available survey information,may be utilised to estimate migration rates between differentsubareas, an issue affecting the ability of the stocks to opti-mise suitable spawning habitats when available.
Acknowledgements
All participants of the ICES Study Group on MultispeciesModel Implementation in the Baltic have contributed theirexperience, knowledge, and results to the present study andthis is gratefully acknowledged. In particular, the support byMorten Vinther with respect to program and data handlingwas of great help. The authors are grateful to Dr. OddNakken and one anonymous referee for their careful, thor-ough, and helpful comments. The present study has beencarried out with financial support from the Commission ofthe European Communities, Agriculture and Fisheries (AIRand FAIR), specific RTD programmes CT94-1226 COREand CT98-3959 STORE. This paper does not necessarily re-flect the views of the Commission and in no way anticipatesthe Commission’s future policy in this area.
References
Aps, R., Falk, U., and Oeberst, R. 1981. Morphological variabilityof otolith growth zones in the Baltic sprat. Fisch.-Forsch.19(2):27–30.
Aro, E. 1989. A review of fish migration patterns in the Baltic.Rapp. P.-v. Réun. Cons. Int. Explor. Mer,190: 72–96.
Bagge, O., and Thurow, F. 1993. The Baltic cod stock: fluctuationsand possible causes. ICES Mar. Sci. Symp.198: 254–268.
Bagge, O., Tiews, K., Lamb, F., and Otterlind, G. 1974. German,Swedish and Danish cod tagging experiments in the Baltic 1968–69. Rapp. P.-v. Réun. Cons. Int. Explor. Mer,166: 22–39.
Bagge, O., Thurow, F., Steffensen, E., and Bay, J. 1994. The Balticcod. Dana,10: 1–28.
Hinrichsen, H.-H., St. John, M.A., Aro, E., Grønkjær, P., and Voss,R. 2001. Testing the larval drift hypothesis in the Baltic Sea: re-tention vs. dispersion due to the influence of wind driven circu-lation. ICES Mar. Sci. Symp.209. In press.
ICES. 1997a. Report of the Study Group on Multispecies ModelImplementation in the Baltic. ICES CM 1997/J:2.
ICES. 1997b. Report of the Baltic Fisheries Assessment WorkingGroup. ICES CM 1997/Assess:12.
ICES. 1998. Report of the Baltic Fisheries Assessment WorkingGroup. ICES CM 1998/ACFM:16.
ICES. 1999a. Report of the Study Group on Multispecies ModelImplementation in the Baltic. ICES CM 1999/H:5.
ICES. 1999b. Report of the Baltic Fisheries Assessment WorkingGroup. ICES CM 1999/ACFM:15.
ICES. 2000. Report of the Baltic Fisheries Assessment WorkingGroup. ICES CM 2000/ACFM:14.
Köster, F.W., and Möllmann, C. 2000. Trophodynamic control byclupeid predators on recruitment success in Baltic cod? ICES J.Mar. Sci. 57: 310–323.
Köster, F.W., Hinrichsen, H.-H., St. John, M.A., Schnack, D., Mac-Kenzie, B.R., Tomkiewicz, J., and Plikshs, M. 2001. DevelopingBaltic cod recruitment models. II. Incorporation of environmen-tal variability and species interaction. Can. J. Fish. Aquat. Sci.58: 1535–1557.
Lablaika, I.N., and Lishev, M.N. 1961. Possibilities of forecastingthe distribution of stock and efficiency of fishing for Baltic codduring pre-spawning and spawning periods. ICES CM 1961/Baltic/Belt Sea Comm. 90.
MacKenzie, B.R., Hinrichsen, H.-H., Plikshs, M., Wieland, K., andZezera, A.S. 2000. Quantifying environmental heterogeneity: habi-tat size necessary for successful development of codGadusmorhuaeggs in the Baltic Sea. Mar. Ecol. Prog. Ser.193: 143–156.
Magnusson, K.G. 1995. An overview of the multispecies VPA —theory and applications. Rev. Fish Biol. Fish.5: 195–212.
Netzel, J. 1974. Polish cod tagging experiments in the Baltic in1969 and 1970. Rapp. P.-v. Réun. Cons. Int. Explor. Mer,166:22–39.
Neuenfeldt, S., and Köster, F.W. 2000. Trophodynamic control onrecruitment success in Baltic cod: the influence of cannibalism.ICES J. Mar Sci.57: 300–309.
Nissling, A., and Westin, L. 1991. Egg buoyancy of Baltic cod(Gadus morhua) and its implication for cod stock fluctuations inthe Baltic. Mar. Biol.111: 33–35.
Ojaveer, E. 1981. Fish fauna of the Baltic.In The Baltic Sea.Editedby A. Voipio. Elsevier Oceanogr. Ser. 30. Elsevier Scientific Pub-lishing Co., Amsterdam, Oxford, New York. pp. 275–292.
Ojaveer, E. 1989. Population structure of pelagic fishes in the Bal-tic. Rapp. P.-v. Réun. Cons. Int. Explor. Mer,190: 17–21.
Ojaveer, E., and Elken, J. 1995. On regional subunits in the ecosys-tem of the Baltic Sea. Proceedings of the 14th Baltic Marine Bi-ologists Symposium, Paernu, Estonia. Eastonian AcademyPublishers, Tallinn. pp. 22–23.
Parmanne, R., Rechlin, O., and Sjöstrand, B. 1994. Status and futureof herring and sprat stocks in the Baltic Sea. Dana,10: 29–59.
Pope, J.G. 1991. The ICES Multispecies Assessment Working Group:evolution, insights, and future problems. ICES Mar. Sci. Symp.193: 22–32.
Shepherd, J.G. 1999. Extended survivors analysis: an improvedmethod for the analysis of catch-at-age data and abundance indi-ces. ICES J. Mar. Sci.56: 584–591.
Sjöstrand, B. 1989. Assessment reviews: exploited pelagic fish stocksin the Baltic. Rapp. P.-v. Réun. Cons. Int. Explor. Mer,190: 235–252.
Sparholt, H. 1991. Multispecies assessment of Baltic fish. ICESMar. Sci. Symp.193: 64–79.
Sparholt, H. 1994. Fish species interactions in the Baltic Sea. Dana,10: 131–162.
Sparholt, H., and Tomkiewicz, J. 2000. A robust method to com-pile trawl survey data applied in assessment of Central Balticcod. Arch. Fish. Mar. Res.48: 125–151.
Sparre, P. 1991. Introduction to multispecies virtual populationanalysis. ICES Mar. Sci. Symp.193: 12–21.
Stefánsson, G. 1998. Comparing different information sources in amultispecies context. Proceedings of the Symposium on FisheryStock Assessment Models. Alaska Sea Grant College ProgramRep. 98-01. University of Alaska, Fairbanks. pp. 741–758.
Stefánsson, G., and Pálsson, O.K. 1998. A framework for multi-species modelling of boreal systems. Rev. Fish Biol. Fish.8:101–104.
Stokes, T.K. 1992. An overview of the North Sea multispeciesmodelling work in ICES. S. Afr. J. Mar. Sci.12: 1051–1060.
© 2001 NRC Canada
1530 Can. J. Fish. Aquat. Sci. Vol. 58, 2001
J:\cjfas\cjfas58\cjfas-08\F01-092.vpFriday, July 13, 2001 8:57:27 AM
Color profile: DisabledComposite Default screen

© 2001 NRC Canada
Köster et al. 1531
Tomkiewicz, J., Eriksson, M., Baranova, T., Feldman, V., andMüller, H. 1997. Maturity ogives and sex ratios for Baltic cod: es-tablishment of a database and time series. ICES CM 1997/CC:20.
Uzars, D., Plikshs, M., Grauman, G., Kalejs, M., and Baranova, T.1991. Cod distribution and spawning in the Gotland Basin in the1980’s. ICES CM 1991/J:5.
Voss, R., Hinrichsen, H.-H., and St. John, M.A. 1999. Variations in
the drift of larval cod (Gadus morhuaL.) in the Baltic Sea:combining field observations and modelling. Fish. Oceanogr.8:199–211.
Wieland, K., Waller, U., and Schnack, D. 1994. Development ofBaltic cod eggs at different levels of temperature and oxygencontent. Dana,10: 163–177.
Appendix
Year
Cod Herring Sprat
SD 25 SD 26 SD 28 SD 25 SD 26 SD 28 SD 25 SD 26 SD 28
SSB (kt)1977 92 96 39 387 290 120 93 196 1481978 96 110 63 384 325 131 82 169 1161979 105 141 86 376 333 173 55 91 631980 110 181 72 343 199 81 26 45 261981 144 158 56 293 200 104 19 30 191982 135 148 65 261 207 63 29 50 341983 163 156 67 339 230 71 69 61 291984 118 131 62 312 183 52 161 195 641985 116 115 54 277 160 83 218 219 661986 87 70 39 273 137 81 223 181 481987 87 73 30 227 141 131 210 164 451988 88 67 21 225 113 159 199 136 631989 76 47 13 206 119 136 164 129 751990 79 47 8 195 100 139 239 178 1211991 54 32 7 159 84 102 330 289 2101992 41 37 3 170 113 103 469 471 2231993 88 53 5 164 117 138 585 363 2361994 116 61 5 198 111 149 569 512 3101995 110 75 6 187 91 131 421 451 2821996 113 118 4 179 75 189 417 413 256
Recruitment (millions)1977 418 486 242 5532 5 416 2934 10 661 20 896 9 3871978 327 375 159 6332 4 801 4162 4 910 8 674 5 9631979 321 316 147 3874 6 860 5955 4 686 21 695 4 5611980 465 611 235 4930 6 980 6991 3 915 9 565 5 2491981 500 491 240 9756 12 341 6485 10 137 27 512 17 7211982 296 281 170 6774 8 166 9928 20 950 14 309 6 1911983 167 173 128 6558 5 730 8156 38 500 82 162 36 2311984 146 123 85 5010 4 385 8797 27 486 16 801 10 1741985 172 128 63 4814 4 086 4953 19 531 14 208 5 9301986 243 127 67 3594 2 502 3036 14 144 6 939 3 1241987 145 75 26 3318 2 015 6245 20 239 15 555 10 5621988 101 40 13 3562 1 757 1616 15 402 3 225 2 9241989 129 50 18 4645 1 687 2436 30 460 15 867 12 3261990 65 38 6 3756 2 023 3734 26 584 25 094 13 7831991 114 53 7 3237 1 921 3458 34 828 36 335 12 5661992 160 70 7 3647 2 259 2479 36 522 36 327 15 4081993 112 89 4 2846 1 631 1812 34 879 34 823 20 9681994 127 170 4 2879 1 567 1776 25 023 20 299 6 3821995 160 87 6 3788 2 171 2442 80 169 68 414 27 5411996 168 28 1 3498 1 532 2004 54 916 38 687 18 811
Table A1. SSB (second quarter), recruitment (age-group 1, first quarter), and stock size (cod: age-group 2+, firstquarter; herring and sprat: age-group 1+, fourth quarter) in different subdivisions (SD) of the Central Baltic deter-mined from area-disaggregated MSVPA.
J:\cjfas\cjfas58\cjfas-08\F01-092.vpFriday, July 13, 2001 8:57:29 AM
Color profile: DisabledComposite Default screen

© 2001 NRC Canada
1532 Can. J. Fish. Aquat. Sci. Vol. 58, 2001
Year
Cod Herring Sprat
SD 25 SD 26 SD 28 SD 25 SD 26 SD 28 SD 25 SD 26 SD 28
Stock size (millions)1977 311 363 174 7698 6 227 4959 8 563 22 937 14 7621978 475 555 289 8049 5 889 5120 5 219 11 290 7 5331979 541 606 295 6214 5 466 5050 3 498 9 434 3 4341980 470 579 244 5556 4 625 5554 2 255 4 182 2 6691981 542 567 232 7415 7 591 5328 4 393 11 982 6 1531982 629 554 259 7483 8 563 6807 10 059 8 490 3 8461983 565 478 231 7145 11 147 6238 19 794 41 654 13 0651984 409 373 185 7064 9 365 7133 25 338 29 829 8 9481985 292 262 143 6979 4 359 6864 24 358 22 926 7 4151986 276 197 107 6044 3 620 5920 20 885 16 295 4 9771987 324 179 90 5685 3 347 8595 24 599 18 540 10 2611988 304 144 62 5122 2 894 6948 17 559 11 545 8 0731989 232 94 33 5895 2 850 6080 25 254 18 855 14 3491990 193 86 26 5840 3 266 7087 32 237 29 792 21 2311991 143 63 15 6062 3 643 7251 46 885 49 694 25 5511992 140 82 10 6871 4 300 6458 56 793 62 174 28 3361993 215 113 12 6617 3 872 5843 61 041 67 892 39 2741994 239 145 11 6210 3 405 5628 52 004 55 477 33 4111995 239 228 10 6454 3 314 6004 81 700 77 071 46 7721996 259 228 10 6391 2 718 5805 76 122 59 937 44 349
Table A1 (concluded).
Year
Cod age-group 2+ Cod age-group 3+ Herring Sprat
SD 25 SD 26 SD 28 SD 26 SD 26 SD 28 SD 28 SD 25 SD 26 SD 28 SD 25 SD 26 SD 28
1977 71 2851978 320 405 4731979 2830 10681980 6631981 1290 1361 908 9081982 855 2575 3080 2142 1169 1479 1195 3980 5 290 6 679 4 651 7 383 2 9251983 891 772 4011 1091 332 2415 1056 4303 6 923 6 652 13 261 22 696 14 5361984 891 786 1053 3383 734 1428 617 4156 2 881 9 429 7 395 22 405 5 8001985 884 658 957 1232 288 154 132 2798 3 988 9 350 12 227 9 394 2 1781986 365 491 539 38 170 83 7696 8 547 7 977 5 647 7 792 3 8781987 771 694 703 454 42 8 3761 5 172 9 283 4 455 6 120 9 0481988 479 590 574 332 117 253 65 4725 6 738 6 609 4 917 3 408 3 1551989 269 226 269 567 72 311 11 3279 6 977 8 745 3 637 36 389 24 1431990 344 358 182 469 25 6168 8 096 9 823 5 447 8 150 22 6561991 140 147 201 426 110 4058 10 451 13 408 19 223 46 071 28 4981992 109 79 27 2977 7 978 9 983 8 084 44 395 28 9231993 458 172 491994 706 293 68 9037 9 399 16 597 13 983 35 297 24 8491995 379 928 99 4759 7 421 7 985 18 155 50 214 128 1701996 489 603 66 7750 4 937 12 821 24 594 62 374 117 462
Note: An empty cell indicates that a reliable survey was not conducted during that period.
Table A2. Indices of stock sizes for different subdivisions (SD): cod age-group 2+ from the Baltic international trawl survey in Febru-ary–March and age-group 3+ from the Latvian bottom trawl survey in January (left column) and November–December (right column,no.·h–1) and herring and sprat age-group 1+ from international hydroacoustic surveys in September–October (millions).
J:\cjfas\cjfas58\cjfas-08\F01-092.vpFriday, July 13, 2001 8:57:31 AM
Color profile: DisabledComposite Default screen

© 2001 NRC Canada
Köster et al. 1533
Year
Cod Herring Sprat
SD 25 SD 26 SD 28 SD 25 SD 26 SD 28 SD 25 SD 26 SD 28
1980 10.31981 309.7 3294.61982 26.5 816.2 187.5 768 1146 991 361 2 832 1 0371983 36.8 52.2 43.8 966 1142 510 7166 15 569 8 6101984 36.8 309.1 15.4 654 466 3315 581 10 979 1 1401985 15.0 129.5 11.6 886 713 743 2036 1 415 4581986 11.9 6.8 5.5 2224 874 261 58 1 127 591987 47.7 163.8 6.5 723 1023 1983 306 4 002 5 9251988 7.7 30.6 9.2 552 510 171 92 44 221989 6.4 202.6 10.6 992 745 1230 1010 23 345 7 8421990 7.9 113.9 8.7 940 1422 1926 339 3 194 4 5761991 6.0 26.1 0.3 918 1762 1018 2665 26 985 9 2541992 15.7 10.7 0.1 633 1998 456 636 16 031 12 2221993 28.7 78.8 2.31994 71.1 227.1 1.7 536 827 277 245 8 955 4731995 18.4 310.2 0.1 781 952 459 8276 31 382 75 1431996 2.3 41.7 0.0 373 506 330 3674 24 698 29 674
Note: An empty cell indicates that a reliable survey was not conducted that year.
Table A3. Recruitment of cod, herring, and sprat (age-group 1) derived from the Baltic international bottomtrawl surveys (no.·h–1) and the international hydroacoustic survey (millions).
J:\cjfas\cjfas58\cjfas-08\F01-092.vpFriday, July 13, 2001 8:57:32 AM
Color profile: DisabledComposite Default screen