
Winter/Spring 2017 Program Guide Winter/Spring 2017 Program ...
Upload
khangminh22Category
view
2download
0
Technical Report 2011-8-DRAFT
IDAHO COOPERATIVE FISH AND WILDLIFE RESEARCH UNIT __________________________________________________________________
MIGRATION BEHAVIOR AND SPAWNING SUCCESS OF SPRING
CHINOOK SALMON IN FALL CREEK AND THE NORTH FORK MIDDLE FORK WILLAMETTE RIVER:
RELATIONSHIPS AMONG FATE, FISH CONDITION, AND ENVIRONMENTAL FACTORS, 2010
By
R. D. Mann, C. C. Caudill, M. L. Keefer, A. G. Roumasset
U.S. Geological Survey, Idaho Cooperative Fish and Wildlife Research Unit University of Idaho, Moscow, ID 83844-1141
C. B. Schreck and M. L. Kent
Oregon Cooperative Fish and Wildlife Research Unit Departments of Fisheries and Wildlife and Microbiology
Oregon State University, Corvallis, Oregon 97331
For U.S. Army Corps of Engineers Portland District, Portland OR
2011
ii
Technical Report 2011-8-DRAFT
IDAHO COOPERATIVE FISH AND WILDLIFE RESEARCH UNIT __________________________________________________________________
MIGRATION BEHAVIOR AND SPAWNING SUCCESS OF SPRING
CHINOOK SALMON IN FALL CREEK AND THE NORTH FORK MIDDLE FORK WILLAMETTE RIVER:
RELATIONSHIPS AMONG FATE, FISH CONDITION, AND ENVIRONMENTAL FACTORS, 2010
By
R. D. Mann, C. C. Caudill, M. L. Keefer, A. G. Roumasset U.S. Geological Survey, Idaho Cooperative Fish and Wildlife Research Unit
University of Idaho, Moscow, ID 83844-1141
C. B. Schreck and M. L. Kent Oregon Cooperative Fish and Wildlife Research Unit
Departments of Fisheries and Wildlife and Microbiology Oregon State University, Corvallis, Oregon 97331
For U.S. Army Corps of Engineers Portland District, Portland OR
2011

iii
Acknowledgements
Many people assisted with work on this report and its successful completion was made possible through their efforts. This project was funded by the U.S. Army Corps of Engineers (USACE). We would like to thank: Christopher Bare for assisting with field work and data collection; Greg Taylor, Doug Garletts, Chad Helms, Todd Pierce, and Greg Gauthier from the USACE Lookout Point office for field help and project coordination; David Griffith from USACE Portland District; Oregon Department of Fish and Wildlife staff, including Tom Friesen, Craig Tinus, Ryan Emig, Dan Peck, Tim Wright, Tony Amandi, Brian Franklin, and Kevin Stertz; Oregon State University personnel for disease screening, especially Susan Benda, Rob Chitwood, Kristin Berkenkamp, Virginia Watral, and Trace Peterson, D.V.M.; and others who contributed their time to this project. Karen Johnson, Rose Poulin, Mark Morasch, Dan Joosten, and Mike Jepson from the U. of Idaho also provided support.
iv
Table of Contents
Acknowledgements ........................................................................................................................ iii Table of Contents ........................................................................................................................... iv Abstract .......................................................................................................................................... vi Introduction ..................................................................................................................................... 1 Methods........................................................................................................................................... 4
Study Sites and Facilities ............................................................................................................ 4 Tagging and Assessment of Condition ....................................................................................... 6 Proximate Analysis ..................................................................................................................... 8 Temperature Monitoring ............................................................................................................. 9 Spawning Ground Surveys and Spawning Success .................................................................. 10 Disease Screening ..................................................................................................................... 10
In-River Parasite Associated Mortality ................................................................................. 10 Parasite Free Holding to Reduce Prespawn Mortality .......................................................... 11
Results ........................................................................................................................................... 13 Tagging ..................................................................................................................................... 13
Fall Creek .............................................................................................................................. 13 Middle Fork Willamette ........................................................................................................ 18
Proximate Analysis ................................................................................................................... 19 River Conditions ....................................................................................................................... 24 Migration................................................................................................................................... 28 Spawning Ground Surveys and Spawning Success .................................................................. 33 Disease Screening ..................................................................................................................... 42
In-River Parasite Associated Mortality ................................................................................. 42 Parasite Free Holding to Reduce Prespawn Mortality .......................................................... 52
Discussion ..................................................................................................................................... 62 Condition and Spawning Success ............................................................................................. 63 Holding and Spawning Success ................................................................................................ 64 Environmental Effects .............................................................................................................. 65 Disease Screening ..................................................................................................................... 66
Pathology .............................................................................................................................. 66 Parasite Free Holding to Reduce Prespawn Mortality .......................................................... 69

v
Management Implications ......................................................................................................... 69 References ..................................................................................................................................... 72
vi
Abstract
In recent years, high percentages (80-90%) of adult Chinook salmon transported above dams in some Willamette River tributaries have died prior to spawning. In 2010, we surveyed the energetic status and survival rates of two populations of Willamette River spring Chinook salmon, monitored river environmental conditions, and investigated the relationships among prespawn mortality and a suite of potential causative factors, including disease. The research occurred in the Middle Fork Willamette River sub-basin and was a continuation of projects completed in 2008 and 2009.
A total of 217 Chinook salmon were sampled at Fall Creek. Fish were collected, assessed for energetic condition, PIT-tagged and/or radio-tagged, and then transported above the dam and allowed to spawn naturally or transported to Oregon State University (n = 17). A total of 62 of the outplanted salmon were recovered during Fall Creek spawning ground surveys, a recapture rate of 31%. Prespawn mortality estimates were 41% for PIT-tagged fish and 63% for radio-tagged fish. River temperatures in 2010 were higher than recorded in 2008, but lower than in 2009. Daily means at the release site only exceeded 20°C on August 16th and 17th. Early-run fish (May) had relatively higher spawning success than later migrants.
Three hundred and two salmon were sampled at Dexter Dam, with 172 immediately
outplanted into the North Fork Middle Fork (NFMF) Willamette River, 100 transported to Willamette Hatchery, and 30 transported to Oregon State University. Overall prespawn mortality of NFMF outplants was estimated to be 45%. This includes immediate outplants (58%) and hatchery-held fish (13-31%). Holding in the hatchery may have reduced prespawn mortality, but hatchery-held salmon were collected early and immediate-release salmon were collected late in the migration, and thus we could not separate seasonal effects from hatchery-holding effects. We observed lower prespawn mortality rates in samples that were held at Oregon State University compared to their outplanted counterparts, for both Fall Creek and Dexter populations.
Water temperatures did not appear to be a strong cause of pre-spawn mortality in 2010.
Temperatures recorded in the NFMF were cooler than in Fall Creek and were in the range preferred by Chinook salmon. Therefore, other factors presumably contributed to prespawn mortality in NFMF fish, including possible transportation effects, overall fish condition effects, and density-dependent factors including disease/parasite loads.
In order to assess disease prevalence, we used standard necropsy methodologies, similar
to those used for adult salmonids in other large river systems such as the Fraser and Yukon, consisting of gross and histological examinations of outplanted fish from the NFMF and Fall Creek. We compared: (1) fish that died prespawning, (2) fish from Willamette Falls that had not experienced the system above Oregon City, (3) fish taken alive at about the same time as prespawned mortalities; (4) fish that spawned in the wild; (5) fish that spawned at Willamette Hatchery; and (6) fish from Dexter and Fall Creek allowed to mature in a cool, pathogen-free facility (Fish Performance and Genetics Laboratory, FPGL). We included fish representing different temporal parts of the run in the above comparisons.
vii
As in 2009, we identified massive infections and severe lesions in fish that died prespawning. It appears that the fish are becoming infected with some of the parasites in the river above Willamette Falls, as judged by lack of presence of parasites in fish from below that area. Examination of fish from the falls that were held in pathogen free water would confirm this. In addition, conditions in the upper river, perhaps elevated temperature, appear responsible for some heavy parasite burdens in fish maturing in the upper river system; this contention is based on the fact that fish that matured in cool, pathogen-free water at the FPGL did not have such infections, and infections increased later in the season. A new finding this year was that, in addition to parasites seen previously, some fish in the river had extreme infections of the hind brain by a myxozoan (Myxobolus sp.). Although not as lethal as M. cerebralis, similar pathogens have been shown to disrupt swimming ability and likely other critical functions. Also, prespawn mortality fish exhibited a significantly greater infection by Nanophyetus metacercariae than survivors. We contend that it is now clear that fish of the upper Willamette system are dying of infections associated with multiple pathogens. Importantly, there appears to be a positive correlation between the parasite burdens and the length of time fish have been in the river. Bacterial infections were also observed in the fish, and it would be insightful to establish the interactive effects of parasites, bacteria and fungi on morbidity. It is important to establish how projects that modify flow and temperature affect the fish, pathogens and other hosts of the pathogens.
Holding adults at Willamette Hatchery prior to outplanting improved survival to
spawning, but this effect could not be isolated from seasonal effects due to logistical constraints on the study design. Nonetheless, this observation and results from adults held at the OSU FPGL suggest that holding fish in cool, pathogen-free water for much of their freshwater maturation period prior to outplanting could enhance survival to spawning.
Results of this study in combination with previous Willamette River Chinook salmon studies suggest that prespawn mortality is caused by an interaction of environmental factors (particularly water temperature), fish condition, and energetic status. Multi-year sampling of adult energetic status, disease and parasite prevalence, and other condition metrics will: (1) provide insights into the factors causing prespawn morality; (2) determine how mean salmon condition varies from year to year in response to environmental factors such as main stem and ocean conditions; and (3) assist in the development of effective management strategies to reduce prespawn mortality in Willamette River spawning tributaries, potentially including regulation of flow and/or temperature and holding of adults under pathogen-free conditions prior to outplanting.
1
Introduction The numbers of adult spring-run Chinook salmon (Oncorhynchus tshawytscha) returning
to the Willamette River, including tributaries managed as part of the USACE Willamette Valley Project (WVP), have fluctuated widely and have been near historic low levels in recent years. Development of the WVP began in 1941 and currently includes 13 dams and reservoirs on the Long Tom, Santiam, McKenzie, Middle Fork Willamette, and Coastal Fork Willamette subbasins. The WVP is managed for flood control, recreation, irrigation, fish and wildlife management, and power generation. Upper Willamette Chinook salmon populations in the WVP have declined for a variety of reasons, including habitat degradation, habitat loss associated with dams, land use practices, overharvest, pollution, changes in hydrologic and thermal regimes, and direct and indirect effects of artificial propagation (NMFS 2008). Due in part to these concerns, the upper Willamette River spring Chinook salmon run was listed as threatened under the U.S. Endangered Species Act in 1999 (NMFS 1999).
Due to impassable dams on tributaries, returning adults in many WVP populations cannot reach much of their historic spawning habitat. Therefore an adult transportation program was initiated in the 1990’s to make use of surplus hatchery broodstock with the objectives of restoring a source of marine-derived nutrients and supplementing the prey base of native resident fish and wildlife, including other threatened species (i.e., bull trout, Salvelinus confluentus) (Beidler and Knapp 2005; Schroeder et al. 2007). Secondary benefits of outplanting include facilitating natural spawning of these populations above the dams and reconnecting habitats, and these secondary objectives have been elevated in recent years. There has been high prespawn mortality observed in adults some years since the start of the adult transportation program. Rates have been widely variable among years and among sub-basin populations (Schroeder et al. 2007; Kenaston et al. 2009; Keefer et al. 2010; Keefer and Caudill 2010) and underlying mechanisms are not fully understood. Factors most likely to contribute to adult prespawn mortality include environmental stressors (especially water temperature), infectious disease, and poor energetic condition.
The migration corridors of many rivers in the WVP have been altered by habitat degradation, hydroelectric installations, and climate change. In addition to the direct effects of passage barriers and lost access to spawning habitat, the operation of dam and reservoir systems for power production, recreation, and flood control can indirectly affect salmon and their migrations. Some important indirect effects are the alteration of river flow and temperature regimes. In many river systems, operating dams for flood control has resulted in more consistent flow regimes during migration. Depending on dam operation, water stored in reservoirs can either warm or cool downstream reaches when it is released (Rounds 2010). In the Columbia and Snake rivers, peak main stem water temperatures occur earlier in the year and warm temperatures persist later in the fall, compared to historic patterns (Quinn and Adams 1996; Quinn et al. 1997). In the Willamette system, tributary dams tend to cool downstream reaches in the spring and early summer and tend to increase water temperatures in the late summer and fall compared to the undammed system (e.g., Rounds 2007). The effect of impoundments in the Willamette basin are dependent on the amount of stream flow derived from high-elevation, snow melt driven projects like Cougar and Hills Creek Dams as compared to lower elevation, rainfall driven systems like Dorena and Fern Ridge Dams. However, the impacts associated with
2
impoundment are greater than changes in shade and point sources (Rounds 2010). The physiological effects of altered water temperatures during Chinook salmon migration, both below dams and in tributaries during holding and spawning, may have negative effects on energy use and gonad development, potentially resulting in lower reproductive fitness for these populations.
Stress from trapping and transport efforts, in combination with disease, may also
contribute to prespawn mortality (Schreck et al. 2001). The role of pathogens in prespawn mortality has frequently been overlooked and underestimated because all salmon and most steelhead die shortly after they spawn and there have been few attempts to document the proportion that die prematurely. Spawning fish are severely immune compromised, and thus even those that survive past spawning often are infected with a variety of pathogens. Therefore, infections and lesions in adult salmon in freshwater are considered normal, and commonly post-spawned fish exhibited a variety of infections and lesions. However, if infections become too severe, fish may succumb days or weeks before spawning, reducing recruitment to the subsequent generation.
It is well recognized that mature salmon are often infected with opportunists, such as saprolegnia fungus (Neitzel et al. 2004). Sockeye salmon in northern British Columbia succumbed to gill infections by Ichthyophthirius multifiliis (Traxler et al. 1998). This was later discovered to be a mixed infection of “Ich” and the microsporidium Loma salmonae, as both caused macroscopic white spots in gills (Higgins and Kent 1997; Shaw et al. 2000). Kent was the first to describe Parvicapsula minibicornis, a myxosporean that causes severe kidney disease and mortality in adult salmon once they return to freshwater (Kent et al. 1997; Jones et al. 2003). Kocan et al. (2004) concluded that chronic infections by protist, Ichthyophonus hoferi, has caused significant prespawn mortality in Chinook salmon for multiple years in the Yukon River, and a non-lethal PCR test was developed to track the prevalence of the infection in Chinook salmon from this river (Whipps et al. 2005). Other pathogens that have been documented to cause prespawn mortality include Dermocystidium, IHN virus, Ceratomyxa shasta (Bartholomew et al. 1989), and the bacterium Aeromonas salmonicida (Jones et al. 2004). Severe infections leading to significant prespawn mortality have consistently been associated with high water temperatures or other poor water quality conditions (Cooke et al. 2004).
Migrating adult Chinook salmon do not feed during their upstream freshwater migration but rely on finite energy reserves accumulated while feeding in the ocean. Adult salmon die within days to weeks of spawning, indicating that energy stores are likely fine-tuned by past selection to maximize reproductive output (spawning and gametes) while also providing adequate energy to fuel upstream migration. The energetic costs of migration and spawning activities in the Willamette basin may have changed as a result of altered flow and temperature regimes, degradation of main stem and tributary habitats, and the effects of climate change. Thus, it is possible that energy stores in returning Chinook salmon may currently be mismatched to present conditions and possibly insufficient to allow successful spawning.
Energy is primarily stored as lipids and energy content tends to be higher in populations
traveling greater distances or that return to higher elevations (e.g., Crossin et al. 2004b). Within populations, there is evidence that energetic condition depends on growth conditions experienced
3
in the ocean prior to return migration. For example, adult sockeye salmon return with lower reserves in years following relatively poor ocean feeding conditions (Crossin et al. 2004a). More generally, poor energetic condition at river entry (Crossin et al. 2004a; Rand et al. 2006) and temperature regime during migration and on spawning grounds (Mann 2007; Crossin et al. 2008; Keefer et al. 2008; Mann et al. 2010) has been associated with higher probability of prespawn mortality.
The primary goal of this study was to evaluate factors potentially associated with
prespawn mortality in adult Chinook salmon, including environmental stressors, maturation status, disease, parasites, and initial energetic condition. Adults were collected at Dexter and Fall Creek dams, assessed and tagged, and released above the dams into spawning habitats. In 2010, a subsample of adults collected at Dexter Dam were held at Willamette Fish Hatchery prior to outplanting to test the hypothesis that holding would decrease prespawn mortality rate. Additionally, subsamples of adults from both populations were transported to Oregon State University to assess holding benefits and disease prevalence. Carcasses were collected from spawning grounds and evaluated for spawning success and potential mortality sources. This included data collected from fish morphometrics, lipid content, and gross signs of disease and injury. Specific objectives were: 1) Use non-lethal methods to estimate adult condition, size, and energy content upon tributary
entry; 2) Analyze lipid and protein contents of the skin, muscle, viscera and gonad tissue to determine
mean population levels; 3) Determine fate of individual fish to investigate the inter-relationships among initial fish
condition, river environment variables, fish transportation, and spawning success; and 4) Analyze the costs/benefits of holding Chinook salmon in hatcheries prior to outplanting as a
management strategy for reducing prespawn mortality. A second component of the study examined parasites and potential disease to: 1) Determine pathogen infection rates in prespawn mortalities; 2) Determine trauma and lesions in prespawn mortalities; 3) Conduct preliminary comparison of pathogen infection rates and lesions in fish that died
before spawning with those that survived to spawn in the wild and at Willamette hatchery;
4) Determine if maturational state could affect the rate of prespawn mortality; 5) Determine if the heavy pathogen loads are acquired during residency in the Willamette River
(i.e. above Willamette Falls); and 6) Determine if fish taken from (1) the Willamette at Willamette Falls and (2) Dexter collection
facilities but held in cool (12-13oC) pathogen free well water have a higher probability of reaching full maturity before death than fish stocked into potential spawning areas soon after capture at Dexter or after holding at Willamette Hatchery.
4
Methods
Study Sites and Facilities
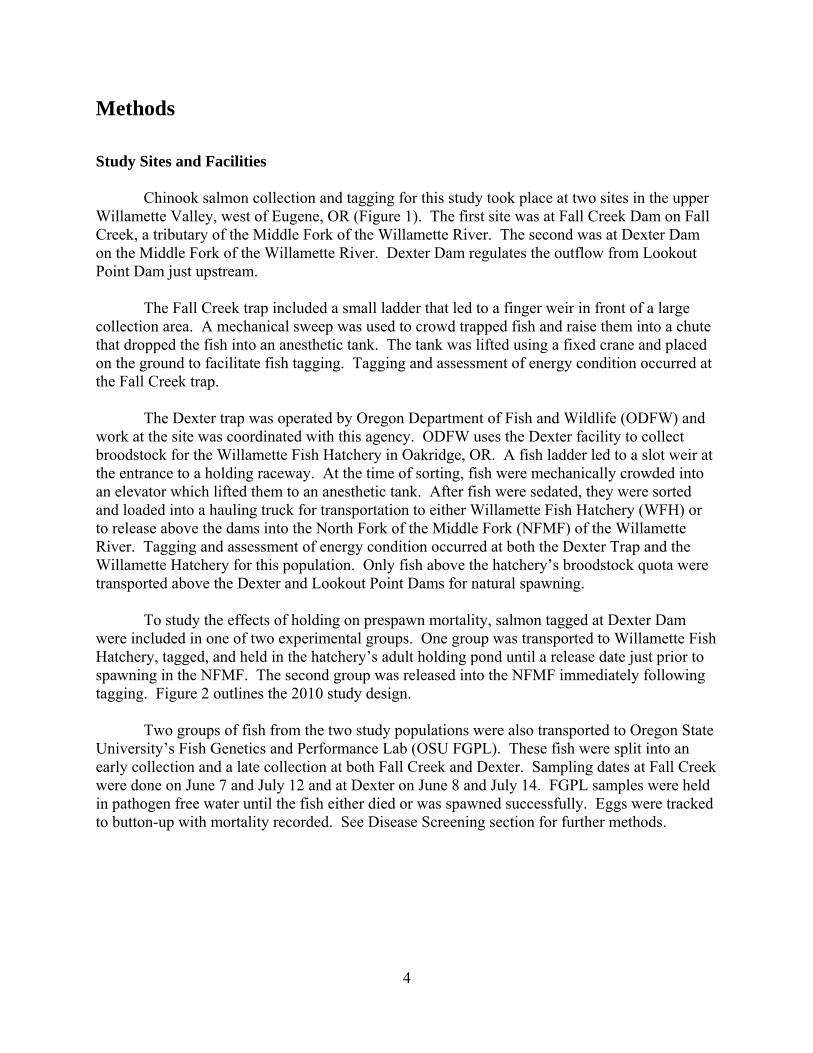
Chinook salmon collection and tagging for this study took place at two sites in the upper Willamette Valley, west of Eugene, OR (Figure 1). The first site was at Fall Creek Dam on Fall Creek, a tributary of the Middle Fork of the Willamette River. The second was at Dexter Dam on the Middle Fork of the Willamette River. Dexter Dam regulates the outflow from Lookout Point Dam just upstream.
The Fall Creek trap included a small ladder that led to a finger weir in front of a large
collection area. A mechanical sweep was used to crowd trapped fish and raise them into a chute that dropped the fish into an anesthetic tank. The tank was lifted using a fixed crane and placed on the ground to facilitate fish tagging. Tagging and assessment of energy condition occurred at the Fall Creek trap.
The Dexter trap was operated by Oregon Department of Fish and Wildlife (ODFW) and
work at the site was coordinated with this agency. ODFW uses the Dexter facility to collect broodstock for the Willamette Fish Hatchery in Oakridge, OR. A fish ladder led to a slot weir at the entrance to a holding raceway. At the time of sorting, fish were mechanically crowded into an elevator which lifted them to an anesthetic tank. After fish were sedated, they were sorted and loaded into a hauling truck for transportation to either Willamette Fish Hatchery (WFH) or to release above the dams into the North Fork of the Middle Fork (NFMF) of the Willamette River. Tagging and assessment of energy condition occurred at both the Dexter Trap and the Willamette Hatchery for this population. Only fish above the hatchery’s broodstock quota were transported above the Dexter and Lookout Point Dams for natural spawning.
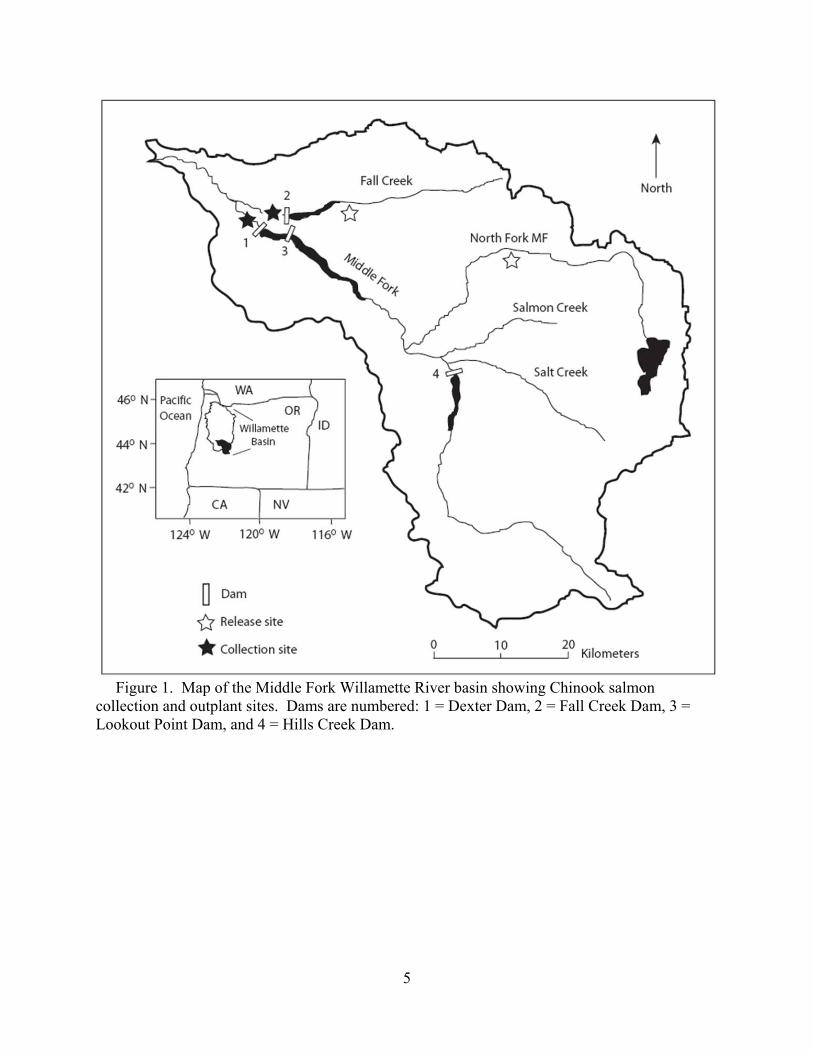
To study the effects of holding on prespawn mortality, salmon tagged at Dexter Dam were included in one of two experimental groups. One group was transported to Willamette Fish Hatchery, tagged, and held in the hatchery’s adult holding pond until a release date just prior to spawning in the NFMF. The second group was released into the NFMF immediately following tagging. Figure 2 outlines the 2010 study design.
Two groups of fish from the two study populations were also transported to Oregon State
University’s Fish Genetics and Performance Lab (OSU FGPL). These fish were split into an early collection and a late collection at both Fall Creek and Dexter. Sampling dates at Fall Creek were done on June 7 and July 12 and at Dexter on June 8 and July 14. FGPL samples were held in pathogen free water until the fish either died or was spawned successfully. Eggs were tracked to button-up with mortality recorded. See Disease Screening section for further methods.
5
Figure 1. Map of the Middle Fork Willamette River basin showing Chinook salmon collection and outplant sites. Dams are numbered: 1 = Dexter Dam, 2 = Fall Creek Dam, 3 = Lookout Point Dam, and 4 = Hills Creek Dam.
Figureoutplanteoutplantesummer iand the N
Tagging A
anesthetithe Willawere loadFish heldtraps. OxTagging reservoir
W
conditiondescaling
e 2. Study ded into Fall Ced or were trin the NFMF
NFMF were
and Assess
At both trap sized in approamette Hatchded into a trud at Willamexygen was mtemperature
r water was u
While anesthen score was rg. A score o
design for 20Creek. Fish ransported toF Willamettesent to Oreg
sment of Co
sites salmon oximately 60hery used Muck filled wi
ette Hatcherymonitored due was recordeused for the
etized, fish wrecorded bas
of three indic
010. All fishcollected an
o Willamettee River. Adgon State Un
ndition
were fully a0 ppm eugenS-222 accorith fresh rivey were taggeuring transpoed and was ganesthetic ta
were sexed ased on injuricated no obv
6
h tagged at Fnd tagged at e Fish Hatchdditionally, aniversity afte
anesthetized nol at Fall Crrding to ODFer water anded on site usiortation withgenerally lesank and haul
and inspecteies, marine m
vious damage
Fall Creek traDexter Damery and held
a sub-sampleer tagging an
prior to hanreek trap. SaFW protocold transporteding the sameh a target conss than 16°Cling truck at
d for clips omammal mare or minimal
ap were immm were eitherd and outplane of fish fromnd assessmen
ndling. Adulampling at Dls. Followin
d to an upstree methods asncentration o
C because botboth sites.
r markings. rks, headburl healed scra
mediately r immediatelnted later in
m both Fall Cnt.
lts were Dexter trap ang tagging, fieam release ss at the dam of 10 ppm. ttom-draw
A compositrn, parasites,apes, two
ly the
Creek
and ish site.
te and
7
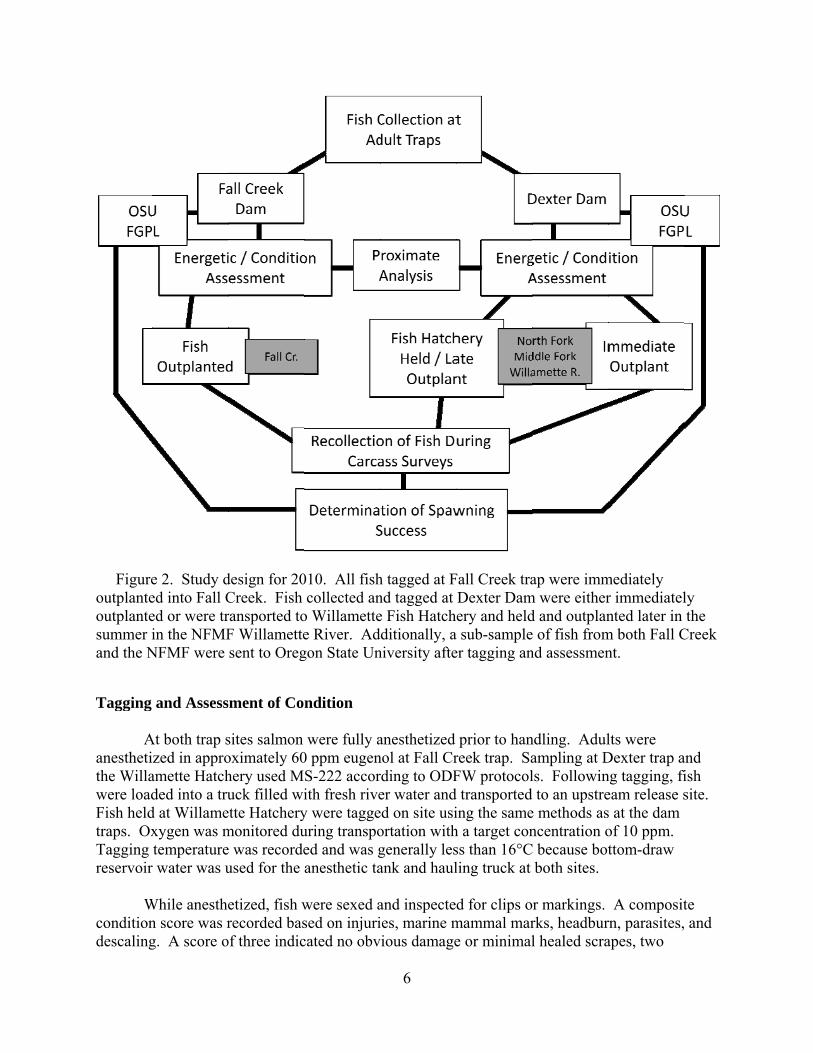
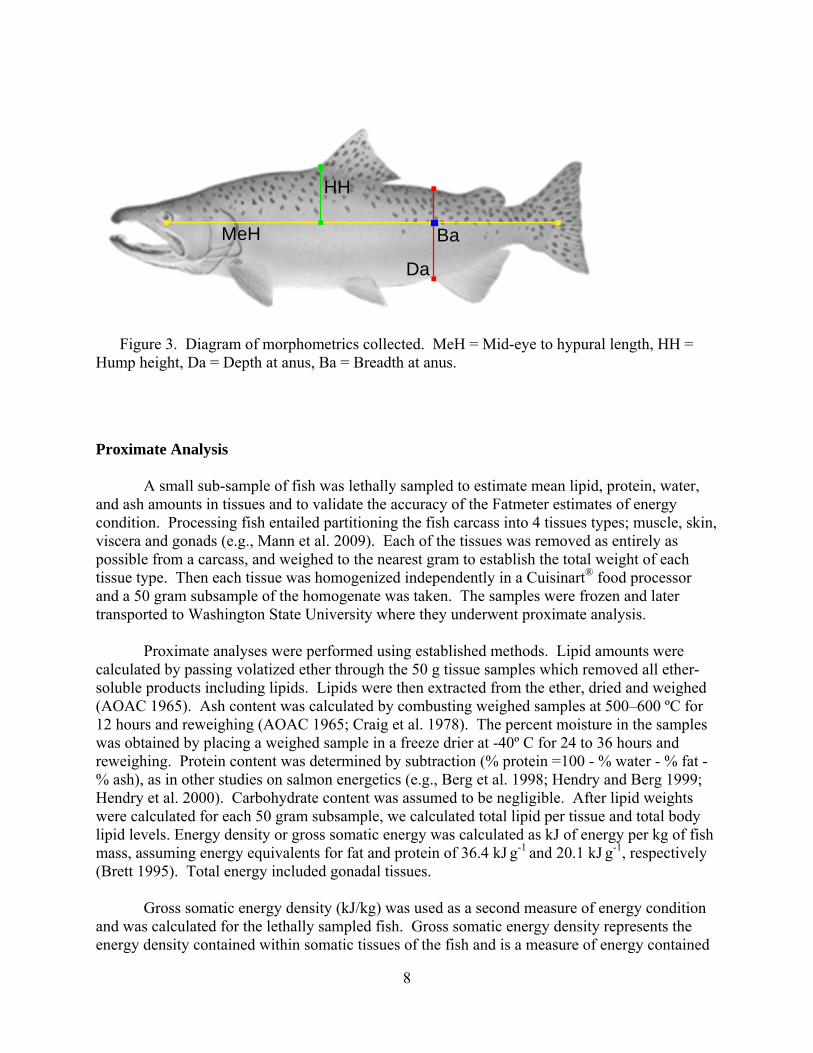
indicated minor or healed injuries with potential scarring, and one indicated open/severe wounds or a large number of minor injuries. Fish were PIT tagged in the dorsal sinus, near the back of the dorsal fin in an effort to increase tag retention on scavenged carcasses. Fork lengths to the nearest half centimeter were taken as well as four morphological measures previously used to estimate energetic status (Mann et al. 2009). These measurements were used to evaluate relationships between fish body size and shape and estimates of energy content (i.e., Fatmeter estimates) as well as possible associations with prespawn mortality. The metrics were: mid-eye to hypural length, hump height, depth at anus, and breadth at anus (Figure 3). Mid-eye to hypural length was defined as the distance along the lateral line from the middle of the eye to the end of the scales on the hypural plate on the caudal peduncle. Hump height was the distance from the anterior origin of the dorsal fin to the lateral line, perpendicular to the lateral line. Depth at anus was the total depth of the fish perpendicular to the lateral line at the anal opening. Breadth at anus was the width of the fish at the intersection of the lateral line and a theoretical line perpendicular to the lateral line at the anus. Morphometric measurements were taken using calipers and recorded to the nearest mm. Fish weights (to the nearest decagram) were collected using a flat table scale (Ohaus washdown bench scale, Ohaus Corp., Pine Brook, NJ).
The percentage of lipids in the muscle tissue was used as the estimation of energy
condition because lipids are the primary energy reserve fish use during migration and spawning (Brett 1995). Lipid levels were estimated using a Distell Fatmeter (Distell Industries Ltd., West Lothian, Scotland). The Fatmeter was developed in the commercial fish industry to estimate the percent of lipids in a trimmed fillet. The meter uses a low energy microwave sensor to estimate water content in the muscle tissue. Based on the inverse relationship between water and lipid levels in fish tissue (Craig et al. 1978; Higgs et al. 1979), the meter estimates the percent lipid in Chinook salmon muscle tissue using a proprietary algorithm. We used proximate analysis of tissues in each study year (see below) to validate estimates and correct for any error in the Fatmeter algorithm. Four readings were taken just above the lateral line, progressing toward the posterior of the fish and the average recorded for each fish.
A sub-sample of fish was radio-tagged in 2010 (Fall Creek: n =75; NFMF: n =60). A 3-
volt transmitter (Lotek Wireless Inc., New Market, Ontario; MCFT-3A, 43 mm × 14 mm diameter, 11 g in air) was inserted gastrically through the mouth. A latex band was placed on each transmitter to reduce regurgitation (Keefer et al. 2004). Fish >76 cm were randomly selected for radio tagging. The purpose of radio tagging a small portion of fish was to verify fish were moving upstream after release and to determine if fish migrated back into the reservoir. In past years, the latter behavior has been linked with prespawn mortality (Keefer et al. 2010). Additionally, the use of radio tags aided in the collection of carcasses for prespawn mortality assessments.
Blood samples from all radio-tagged fish were taken from the sub-vertebral caudal vessel
posterior to the anal fin. The blood sample was centrifuged for a minimum of four minutes until the red blood cells separated from the plasma. Any abnormal hematocrits were recorded. The plasma was transferred to a vial using a pipette, and immediately stored on ice. Samples were frozen as soon as possible. Plasma samples were used in determining sexual maturation based on hormone levels.
8
Figure 3. Diagram of morphometrics collected. MeH = Mid-eye to hypural length, HH =
Hump height, Da = Depth at anus, Ba = Breadth at anus.
Proximate Analysis
A small sub-sample of fish was lethally sampled to estimate mean lipid, protein, water, and ash amounts in tissues and to validate the accuracy of the Fatmeter estimates of energy condition. Processing fish entailed partitioning the fish carcass into 4 tissues types; muscle, skin, viscera and gonads (e.g., Mann et al. 2009). Each of the tissues was removed as entirely as possible from a carcass, and weighed to the nearest gram to establish the total weight of each tissue type. Then each tissue was homogenized independently in a Cuisinart® food processor and a 50 gram subsample of the homogenate was taken. The samples were frozen and later transported to Washington State University where they underwent proximate analysis.
Proximate analyses were performed using established methods. Lipid amounts were
calculated by passing volatized ether through the 50 g tissue samples which removed all ether-soluble products including lipids. Lipids were then extracted from the ether, dried and weighed (AOAC 1965). Ash content was calculated by combusting weighed samples at 500–600 ºC for 12 hours and reweighing (AOAC 1965; Craig et al. 1978). The percent moisture in the samples was obtained by placing a weighed sample in a freeze drier at -40º C for 24 to 36 hours and reweighing. Protein content was determined by subtraction (% protein =100 - % water - % fat - % ash), as in other studies on salmon energetics (e.g., Berg et al. 1998; Hendry and Berg 1999; Hendry et al. 2000). Carbohydrate content was assumed to be negligible. After lipid weights were calculated for each 50 gram subsample, we calculated total lipid per tissue and total body lipid levels. Energy density or gross somatic energy was calculated as kJ of energy per kg of fish mass, assuming energy equivalents for fat and protein of 36.4 kJ g-1 and 20.1 kJ g-1, respectively (Brett 1995). Total energy included gonadal tissues.
Gross somatic energy density (kJ/kg) was used as a second measure of energy condition and was calculated for the lethally sampled fish. Gross somatic energy density represents the energy density contained within somatic tissues of the fish and is a measure of energy contained
MeH
Da
HH
Ba
9
not only in the muscle tissue, but also the viscera and skin (Crossin and Hinch 2005). Because it is standardized by mass, it can be directly compared among individuals. Gross somatic energy density was regressed on lipid percentage (natural log [loge] transformed) estimated by the Fatmeter (non-standardized values, see below) to examine the relationship between Fatmeter estimates and gross somatic energy density (e.g., Colt and Shearer 2001; Crossin and Hinch 2005).
We used linear regression to estimate the relationship between muscle lipid content and
Fatmeter readings. The relationship was then used to estimate muscle lipid content for each outplanted fish by inverse prediction (Sokal and Rohlf 1995) using Fatmeter measurements taken at the time of tagging. Henceforth, we refer to the corrected lipid estimates for outplanted fish as “standardized lipid percentage”. We used regressions without an intercept for standardization to force lines through the origin because neither proximate analysis results nor Fatmeter percentages can have negative values. We also estimated relationships using standard regression (with an intercept) to evaluate the statistical significance and strength of the relationships because statistics from regression without an intercept (e.g., r2) are difficult to interpret (Sokal and Rohlf 1995).
Morphometric measures listed above were also taken on all lethally sampled fish. A suite
of multiple linear regressions were performed between the morphometrics, the standardized Fatmeter results, and gross somatic energy calculated from proximate analysis. We evaluated the association between energy parameters and several ratios estimating aspects of fish shape (e.g., breadth at anus: fork length, a measure of “fat” vs. “skinny”). Multi-model selection (AIC) analysis was used to evaluate which models might be suitable to estimate energy content of non-lethally sampled fish.
Temperature Monitoring
Temperature recorders were installed in 2010 at a total of ten locations in Fall Creek and the NFMF Willamette River. In Fall Creek, loggers were located at the release site (rkm 23.0), the bridge near Johnny Creek (rkm 30.6), near the mouth of Portland Creek (rkm 34.1), the bridge at forest road 1828 (rkm 37.0), and at the unnamed falls that act as a fish barrier (rkm 47.2). In the NFMF Willamette River, loggers were placed at the USACE screw trap site (rkm 2.3), the release site (rkm 30.0), below the bridge near Kiahanie campground (rkm 37.2), at the forest road 1944 bridge (rkm 44.6), and above Skookum Creek (rkm 58.0). Temperatures were logged at 15 minute intervals from early June to mid-October.
We used Weetag lite submersible temperature loggers (Alpha Mach, Inc., Mont-St-
Hilaire, Quebec; 15x11x6.25 mm, 1.1g in air) to record internal temperatures on a subsample of radio-tagged fish. The tags were either slipped on the wire of the radio tags or adhered to the end of the radio tags using inert silicone and inserted gastrically. The temperature recorders were recovered during carcass surveys and were downloaded.
10
Spawning Ground Surveys and Spawning Success After translocation to spawning areas above the dams, salmon were allowed to spawn
naturally and spawning areas were monitored to collect carcasses and assess spawning success. Carcass surveys were conducted by both UI and ODFW on a regular basis from the beginning of releases through the spawning period (June through early October). Fish encountered during spawning ground surveys were inspected by UI and/or ODFW personnel for radio and PIT tags. When the carcass of an individual from this study was located, it was inspected to determine spawning status and its general condition was noted (how recently it died, obvious wounds, fungus levels, or other apparent visual cues that caused mortality). In addition, otoliths and scales were collected from non-marked fish. If a fish had recently died (gills were pink), the fish was transported on ice to Oregon State University, and tissue samples were collected for histology as described below.
Spawning success was assessed by inspecting the gonads of females and estimating the
proportion of gametes remaining to the nearest 25%. A successfully spawned fish was defined as having less than 25% of gametes remaining in the body cavity (Pinson 2005). Survival to the first day of spawning activity was also used in analyses as a metric of reproductive success because the proportion of remaining gametes could not be reliably estimated in most males or in some carcasses that had been scavenged. Multi-model selection, including univariate and multiple logistic regression models with adult fate (spawned, prespawn mortality) as the dependent variable were used to evaluate potential correlates with prespawn mortality.
Mortality observed in the hatchery-held group in the holding pond would represent all of
the prespawn mortality before outplanting and can thus not be compared to mortality observed in the outplanted group which would represent only a fraction of the true mortality. In addition, not all of the 100 fish tagged at the hatchery were subsequently recovered for outplanting. In order to compare the hatchery held group’s spawning success to immediate outplants, confidence intervals were calculated. The best prespawn mortality estimate for hatchery held fish (Ŝ) was calculated as Ŝ = (Mh + (PSMh * no))/(no+Mh), where Mh was the number of mortalities at the hatchery, PSMh was prespawn mortality rate of hatchery held fish after outplanting in the NFMF, and no was the number of outplanted fish. The PSMh represents the lower confidence value, and (U + Mh + (PSMh * no))/(no+Mh+U) represents the upper confidence value accounting for the unknown fish in the ponds (U).
Disease Screening
In-River Parasite Associated Mortality Chinook salmon carcasses from the study areas that had recently died (fresh mortalities,
many still with red gills) prior to spawning were obtained, transported to the laboratory at Oregon State University, and necropsied within a few hours of collection. These individuals spanned the time Chinook salmon were in the study systems, from June into September, 2010. We also assessed fish that survived to spawn in the river as well as some fish still alive in the rivers. In addition, we were able to obtain samples from fish at both Dexter and Fall Creek traps at various times across the run. Details regarding the locations and numbers are provided in

11
Tables 12-14. This design was similar to that of previous years except that nearly an order of magnitude greater number of samples were collected and processed.
We evaluated the health status of fish using histology as our primary diagnostic tool,
coupled with macroscopic changes recorded at necropsy in the field. We conducted a complete necropsy on available fish. Necropsies consisted of close visual examination of each individual for signs of injury and lesions, both on the exterior and interior. All fish and abnormalities were photographed. Tissues were then collected and fixed in buffer formalin for later histological analysis. Heart, brain, gills, liver, spleen, kidney, gonads, pyloric caeca, and lower intestine were collected and fixed in 10% neutral buffered formalin. Additional kidney and spleen samples from each fish were archived at -80°C for potential PCR identification of bacterial and viral pathogens, as well as potential confirmatory identification of parasites.
Fixed tissues were processed using routine microtechniques involving H and E staining in
the laboratory; specialty stains were then employed as appropriate. Resultant microscope slides were read by a trained histopathologist to determine presence of pathogenic organisms and an assessment of infection rate was made. The data allowed assessment of the potential for morbidity associated with these pathogens. Moribund fish were identified as follows: still alive, but listless, lethargic and showing marked ataxia (inability to maintain proper body position in water). Fish not showing ataxia, but were lethargic to the extent that they do not respond to physical stimuli (e.g., poking) by swimming away were considered moribund if needed to meet minimum sample sizes.
Disease relating to parasite infections is usually related to burden (intensity) than
presence or absence (i.e., prevalence). Histology is excellent for interpretations of lesions but is only semi-quantitative for evaluating levels of infections. Hence, we evaluated metacercariae burdens in frozen tissues (i.e., parasite/gram). This was used to evaluate for a predicted threshold for mortality based on truncation of the normal distribution of parasites, which for parasites in normal host populations is almost always a negative binomial (Crofton 1971). Indeed, this “Croftonian” analysis is widely used in parasitology to predict parasite-associated mortality in wild animals.
Maturation status of radio-tagged fish will be determined from blood samples taken at the
time of tagging and the samples currently await analysis. Plasma was separated by centrifugation and stored at -80°C. Sex steroids will be quantified by radioimmunoassay as described by Fitzpatrick et al. (1986). These assays with EPA-level QA/QC criteria are routinely run in Schreck’s laboratory. The OSU laboratory worked out the ability to determine reproductive development of Coho salmon based on sex hormone levels in the blood (Fitzpatrick et al. 1986). We realize that Chinook salmon have a different maturational chronology than Coho salmon, but some of the same principles likely apply.
Parasite Free Holding to Reduce Prespawn Mortality
To ascertain where infection may have occurred and whether or not holding of fish in cool, pathogen free water could reduce prespawn mortality for fish to be outplanted, we
12
attempted to collect hatchery-origin adult spring Chinook passing Willamette Falls for transportation to the Fish Performance and Genetics Laboratory (FPGL) at Oregon State University, Corvallis. We were not granted a collection permit, so instead we collected tissue samples from fish caught in the fishery below Willamette Falls. This tactic was successful in providing five individuals. We attempted on four additional sampling efforts to obtain more fish, but the high flows experienced in the Willamette system at that time made it impossible to obtain more individuals early in the run and then afterwards Chinook were unavailable, having been replaced by shad below the falls.
Fish collected at the Dexter trap, and in lieu of Willamette Falls collections, and also
from the Fall Creek trap were transported to the Fish Performance and Genetics Laboratory in Corvallis and held at about 13oC in pathogen free well water. Our design was to compare survival to spawning in fish that arrived at the traps early in the run versus those that arrive later. We thus created two groups, and in some cases had sufficient fish for replication. Our efforts to obtain fish for some of the replicates and on dates desired was hampered by the flooding that occurred mainly at the Fall Creek Trap. None the less, we were able to meet our objectives of allowing comparisons of early and late fish held in good water quality conditions to each other as well as to those out planted. Fish representing the “early” treatment groups were transported from Fall Creek on June 7, and from Dexter on June 8, 2010. Fish representing the “late” treatment groups were transported from Fall Creek on July 12 and from Dexter on July 14, 2010. Details as to the time of collection and the number of fish involved can be found in Table 15.
Fish from Dexter were transported by the Oregon Department of Fish and Wildlife and from Fall Creek by the USACE to the FPGL in their respective adult salmon transportation trucks using procedures comparable to that employed during outplanting. Upon arrival at the FPGL, to minimize the effects of stocking the fish into our holding tanks, the water in the trucks was lowered to a depth that just covered the fish. An anesthetic dose of tricaine methanesulfonate (MS-222) buffered with sodium bicarbonate was then added to the remaining water. When anesthetized, the fish were netted into a pipe supplied with flowing water and gently slid into their respective tanks. These tanks were 10-foot in diameter and 4-foot deep supplied with flow-through water. Fish were held at a density of 10 fish per tank.
Fish were checked for ripeness approximately every 5 days. Because of the additional netting and handling that this necessitated, we made the decision to treat the fish periodically during this time with a hydrogen peroxide bath to control fungus following the protocol suggested by Fitzpatrick et al. (1995). This was reasonable since outplanted fish would not experience this additional handling and the treatment would affect only a limited number of external, surface parasites, not those that were internal and of interest to us. The hydrogen peroxide treatment was effective in controlling fungal infections. Most fish survived to spawn and were mated with fish from their treatment group. Fertilized eggs were placed in individual Heath Trays so that success of progeny from each female could be monitored through swim-up. This allowed us to compare quality of the progeny between Dexter and Fall Creek collections and between early and late groups. Necropsies were performed on moribund or dead fish following the standard procedures as used for field-collected fish.
13
Three fish died soon after arrival at the FPGL, presumably from collection- and transport-related injury. Analysis was done both including and excluding these fish.
We also collected samples from fish that were taken from the Dexter trap to Willamette Hatchery and did this at various times across the spawning process at the hatchery. Numbers of fish and dates of collection are given in Table 18. We were able to compare fish that survived to spawn with those prior to that time and with those at the FPGL.
Results Tagging
Fall Creek
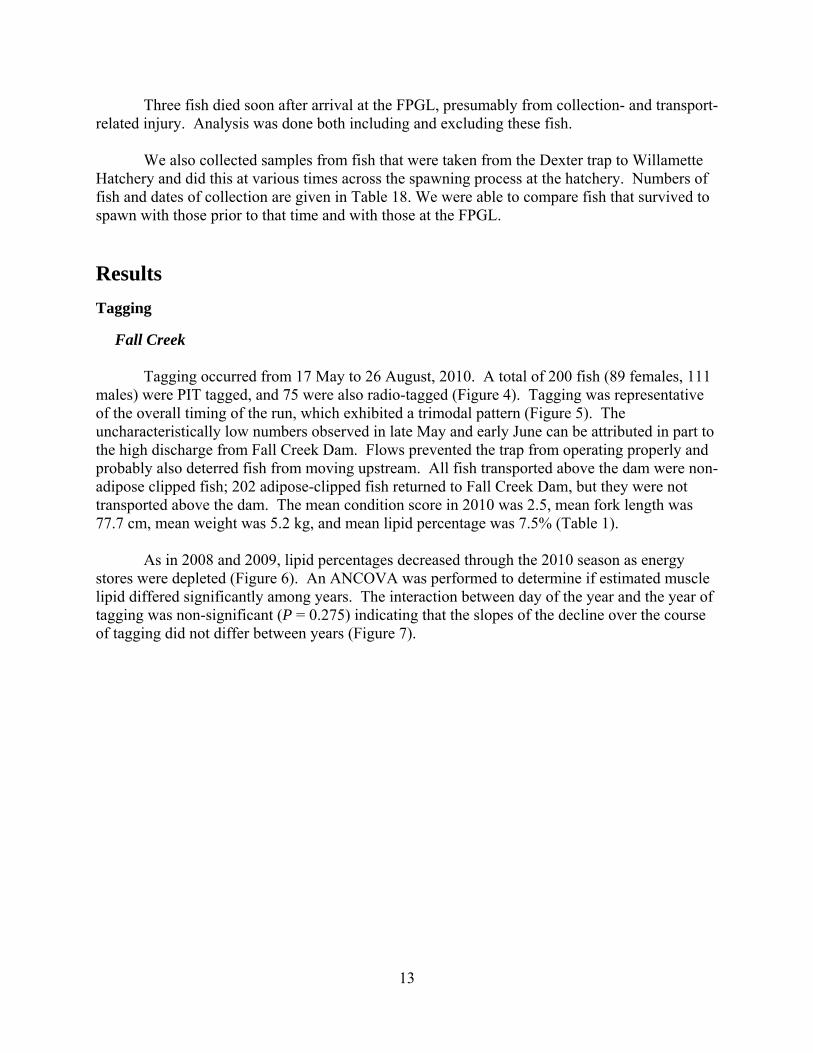
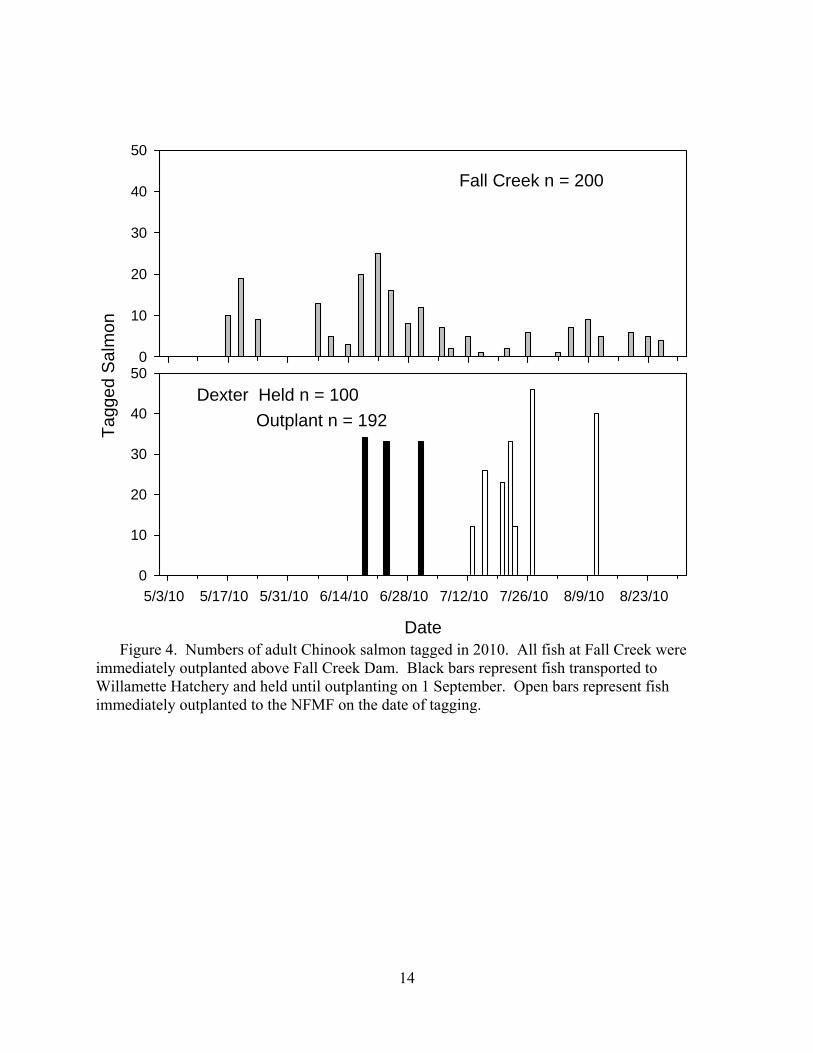
Tagging occurred from 17 May to 26 August, 2010. A total of 200 fish (89 females, 111 males) were PIT tagged, and 75 were also radio-tagged (Figure 4). Tagging was representative of the overall timing of the run, which exhibited a trimodal pattern (Figure 5). The uncharacteristically low numbers observed in late May and early June can be attributed in part to the high discharge from Fall Creek Dam. Flows prevented the trap from operating properly and probably also deterred fish from moving upstream. All fish transported above the dam were non-adipose clipped fish; 202 adipose-clipped fish returned to Fall Creek Dam, but they were not transported above the dam. The mean condition score in 2010 was 2.5, mean fork length was 77.7 cm, mean weight was 5.2 kg, and mean lipid percentage was 7.5% (Table 1).
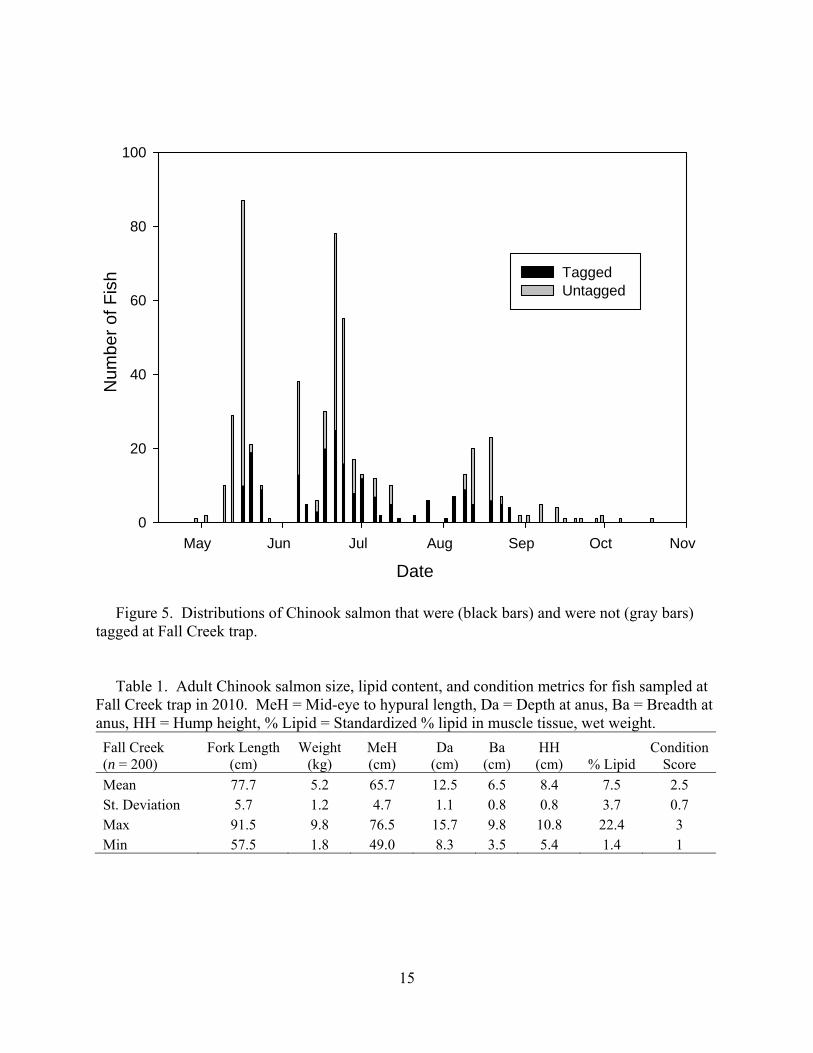
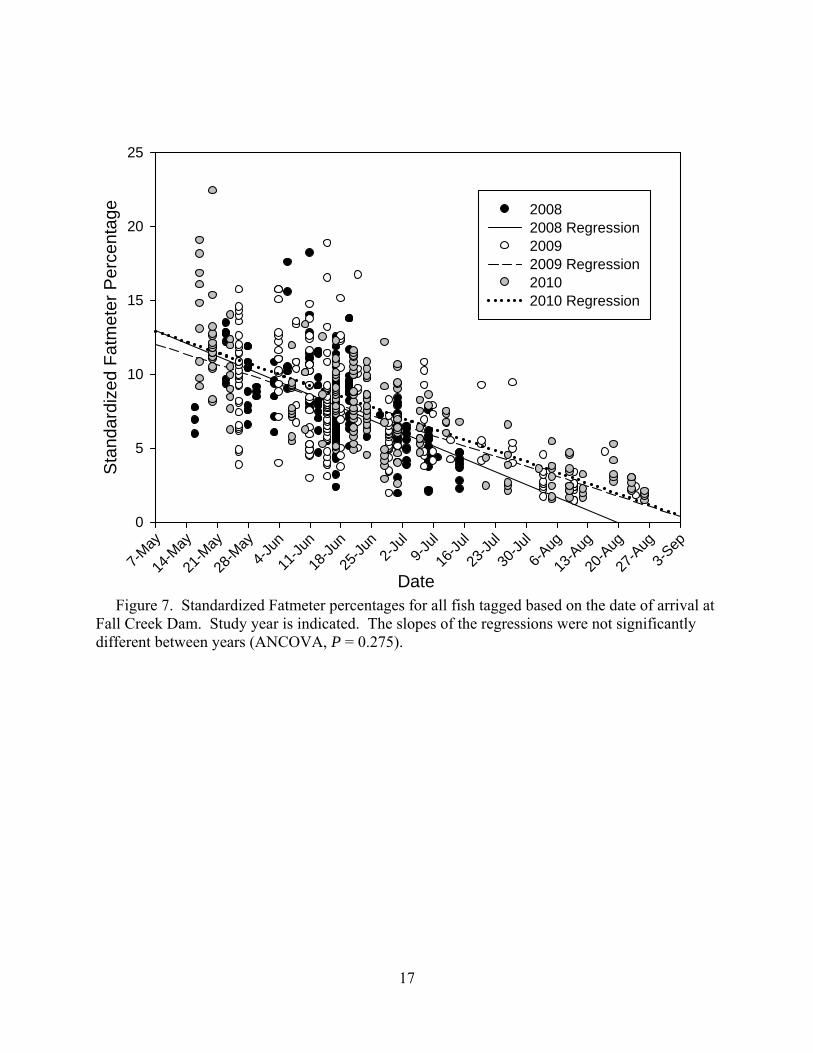
As in 2008 and 2009, lipid percentages decreased through the 2010 season as energy
stores were depleted (Figure 6). An ANCOVA was performed to determine if estimated muscle lipid differed significantly among years. The interaction between day of the year and the year of tagging was non-significant (P = 0.275) indicating that the slopes of the decline over the course of tagging did not differ between years (Figure 7).
14
Date
5/3/10 5/17/10 5/31/10 6/14/10 6/28/10 7/12/10 7/26/10 8/9/10 8/23/10 0
10
20
30
40
50
Tagg
ed S
alm
on
0
10
20
30
40
50
Fall Creek n = 200
Dexter Held n = 100Outplant n = 192
Figure 4. Numbers of adult Chinook salmon tagged in 2010. All fish at Fall Creek were
immediately outplanted above Fall Creek Dam. Black bars represent fish transported to Willamette Hatchery and held until outplanting on 1 September. Open bars represent fish immediately outplanted to the NFMF on the date of tagging.
15
DateMay Jun Jul Aug Sep Oct Nov
Num
ber o
f Fis
h
0
20
40
60
80
100
Tagged Untagged
Figure 5. Distributions of Chinook salmon that were (black bars) and were not (gray bars) tagged at Fall Creek trap. Table 1. Adult Chinook salmon size, lipid content, and condition metrics for fish sampled at Fall Creek trap in 2010. MeH = Mid-eye to hypural length, Da = Depth at anus, Ba = Breadth at anus, HH = Hump height, % Lipid = Standardized % lipid in muscle tissue, wet weight. Fall Creek (n = 200)
Fork Length (cm)
Weight (kg)
MeH (cm)
Da (cm)
Ba (cm)
HH (cm) % Lipid
Condition Score
Mean 77.7 5.2 65.7 12.5 6.5 8.4 7.5 2.5St. Deviation 5.7 1.2 4.7 1.1 0.8 0.8 3.7 0.7Max 91.5 9.8 76.5 15.7 9.8 10.8 22.4 3Min 57.5 1.8 49.0 8.3 3.5 5.4 1.4 1
16
WeekMay
17
May 24
May 31
June
7
June
14
June
21
June
28Ju
ly 5
July
12
Late
July
Augus
t
Sta
ndar
dize
d Fa
tmet
er P
erce
ntag
e
0
5
10
15
20
25
n=27 n=9 n=17 n=40n=22 n=20 n=9 n=6 n=8 n=35
Figure 6. Weekly distributions of standardized Fatmeter results for Chinook salmon tagged at Fall Creek trap in 2010. Box plots represent median (solid line), mean (dashed line), 25th and 75th percentiles (ends of boxes), 10th and 90th percentiles (whiskers), and individual outliers (solid circles).
17
Date7-M
ay
14-M
ay
21-M
ay
28-M
ay4-J
un
11-Ju
n
18-Ju
n
25-Ju
n2-J
ul9-J
ul
16-Ju
l
23-Ju
l
30-Ju
l
6-Aug
13-A
ug
20-A
ug
27-A
ug3-S
ep
Sta
ndar
dize
d Fa
tmet
er P
erce
ntag
e
0
5
10
15
20
25
20082008 Regression20092009 Regression20102010 Regression
Figure 7. Standardized Fatmeter percentages for all fish tagged based on the date of arrival at Fall Creek Dam. Study year is indicated. The slopes of the regressions were not significantly different between years (ANCOVA, P = 0.275).
18
Middle Fork Willamette
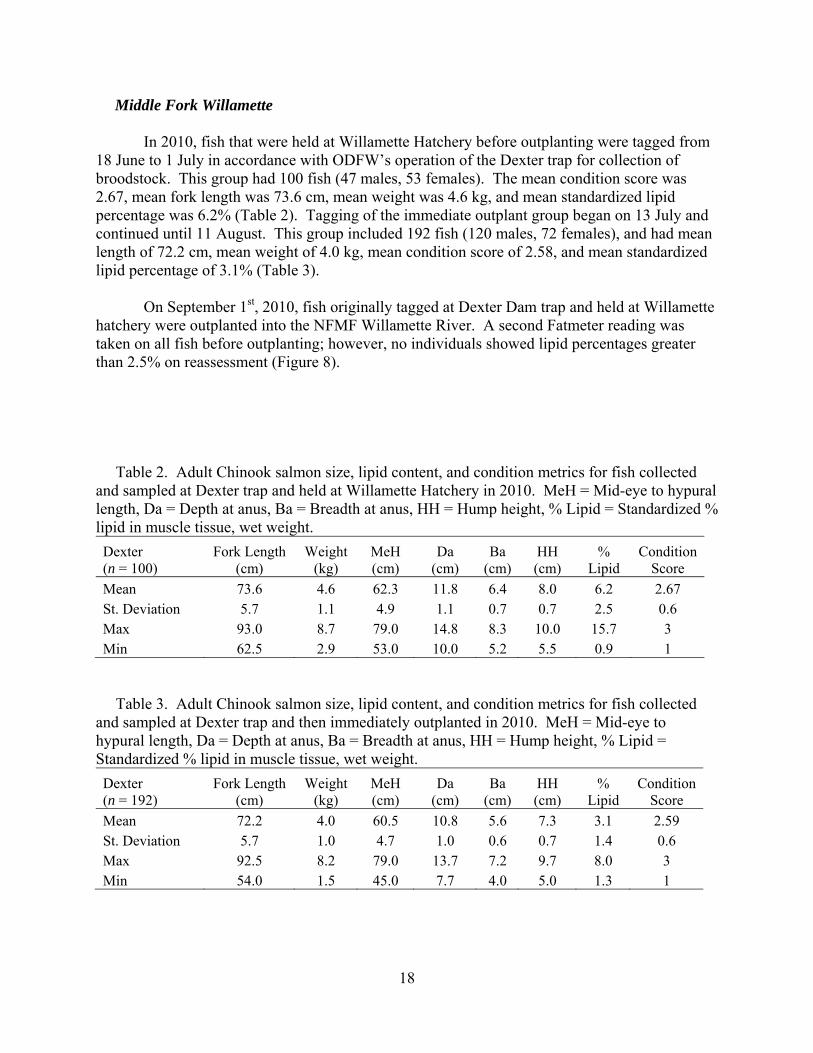
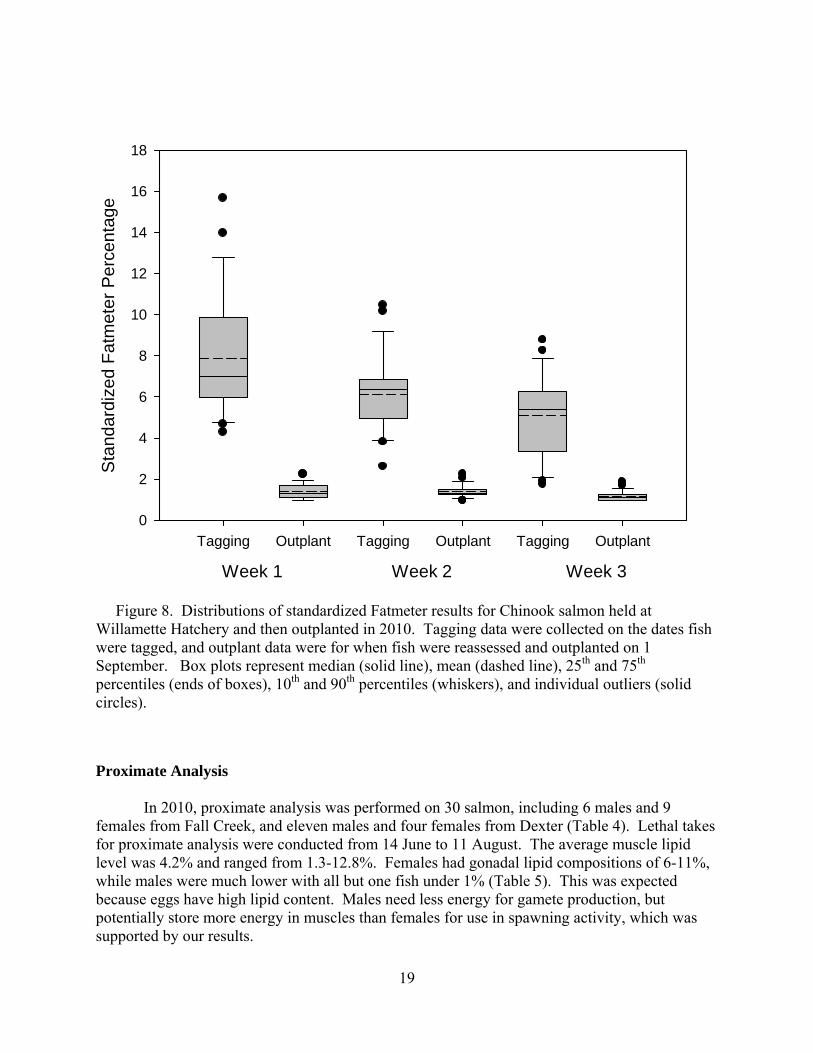
In 2010, fish that were held at Willamette Hatchery before outplanting were tagged from 18 June to 1 July in accordance with ODFW’s operation of the Dexter trap for collection of broodstock. This group had 100 fish (47 males, 53 females). The mean condition score was 2.67, mean fork length was 73.6 cm, mean weight was 4.6 kg, and mean standardized lipid percentage was 6.2% (Table 2). Tagging of the immediate outplant group began on 13 July and continued until 11 August. This group included 192 fish (120 males, 72 females), and had mean length of 72.2 cm, mean weight of 4.0 kg, mean condition score of 2.58, and mean standardized lipid percentage of 3.1% (Table 3). On September 1st, 2010, fish originally tagged at Dexter Dam trap and held at Willamette hatchery were outplanted into the NFMF Willamette River. A second Fatmeter reading was taken on all fish before outplanting; however, no individuals showed lipid percentages greater than 2.5% on reassessment (Figure 8). Table 2. Adult Chinook salmon size, lipid content, and condition metrics for fish collected and sampled at Dexter trap and held at Willamette Hatchery in 2010. MeH = Mid-eye to hypural length, Da = Depth at anus, Ba = Breadth at anus, HH = Hump height, % Lipid = Standardized % lipid in muscle tissue, wet weight. Dexter (n = 100)
Fork Length (cm)
Weight (kg)
MeH (cm)
Da (cm)
Ba (cm)
HH (cm)
% Lipid
Condition Score
Mean 73.6 4.6 62.3 11.8 6.4 8.0 6.2 2.67St. Deviation 5.7 1.1 4.9 1.1 0.7 0.7 2.5 0.6Max 93.0 8.7 79.0 14.8 8.3 10.0 15.7 3Min 62.5 2.9 53.0 10.0 5.2 5.5 0.9 1
Table 3. Adult Chinook salmon size, lipid content, and condition metrics for fish collected and sampled at Dexter trap and then immediately outplanted in 2010. MeH = Mid-eye to hypural length, Da = Depth at anus, Ba = Breadth at anus, HH = Hump height, % Lipid = Standardized % lipid in muscle tissue, wet weight. Dexter (n = 192)
Fork Length (cm)
Weight (kg)
MeH (cm)
Da (cm)
Ba (cm)
HH (cm)
% Lipid
Condition Score
Mean 72.2 4.0 60.5 10.8 5.6 7.3 3.1 2.59St. Deviation 5.7 1.0 4.7 1.0 0.6 0.7 1.4 0.6Max 92.5 8.2 79.0 13.7 7.2 9.7 8.0 3Min 54.0 1.5 45.0 7.7 4.0 5.0 1.3 1
19
Week 1 Week 2 Week 3
Tagging Outplant Tagging Outplant Tagging Outplant
Sta
ndar
dize
d Fa
tmet
er P
erce
ntag
e
0
2
4
6
8
10
12
14
16
18
Figure 8. Distributions of standardized Fatmeter results for Chinook salmon held at Willamette Hatchery and then outplanted in 2010. Tagging data were collected on the dates fish were tagged, and outplant data were for when fish were reassessed and outplanted on 1 September. Box plots represent median (solid line), mean (dashed line), 25th and 75th percentiles (ends of boxes), 10th and 90th percentiles (whiskers), and individual outliers (solid circles).
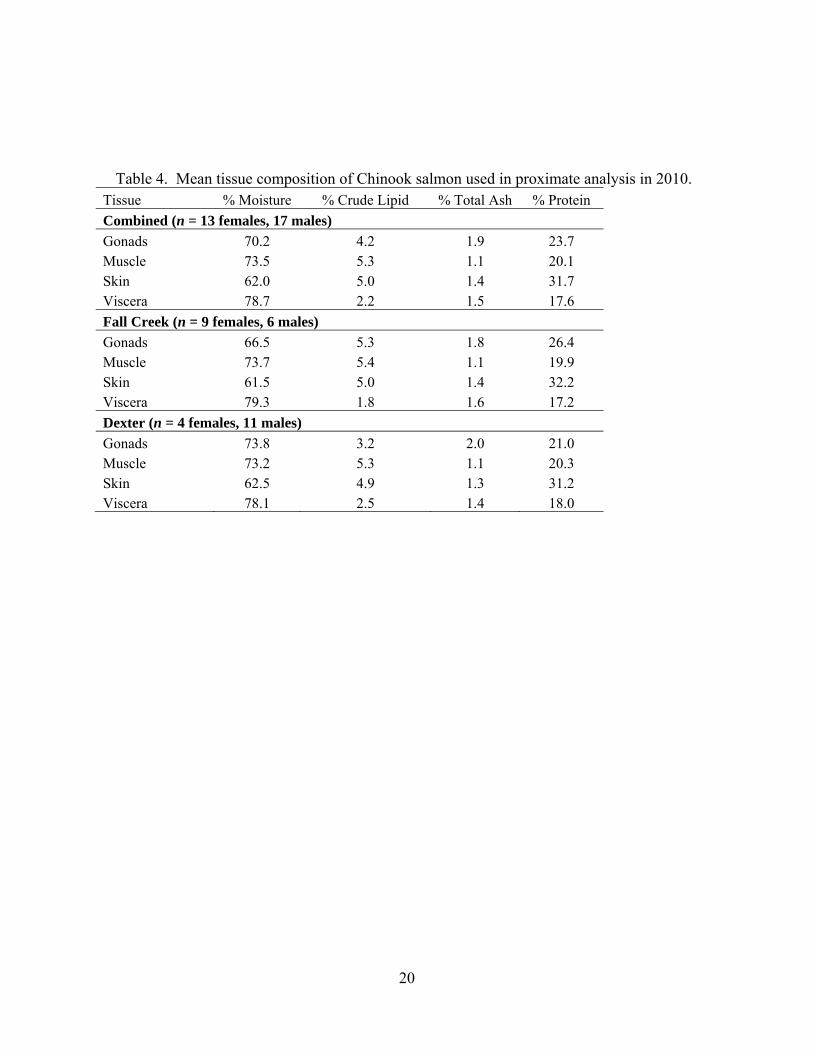
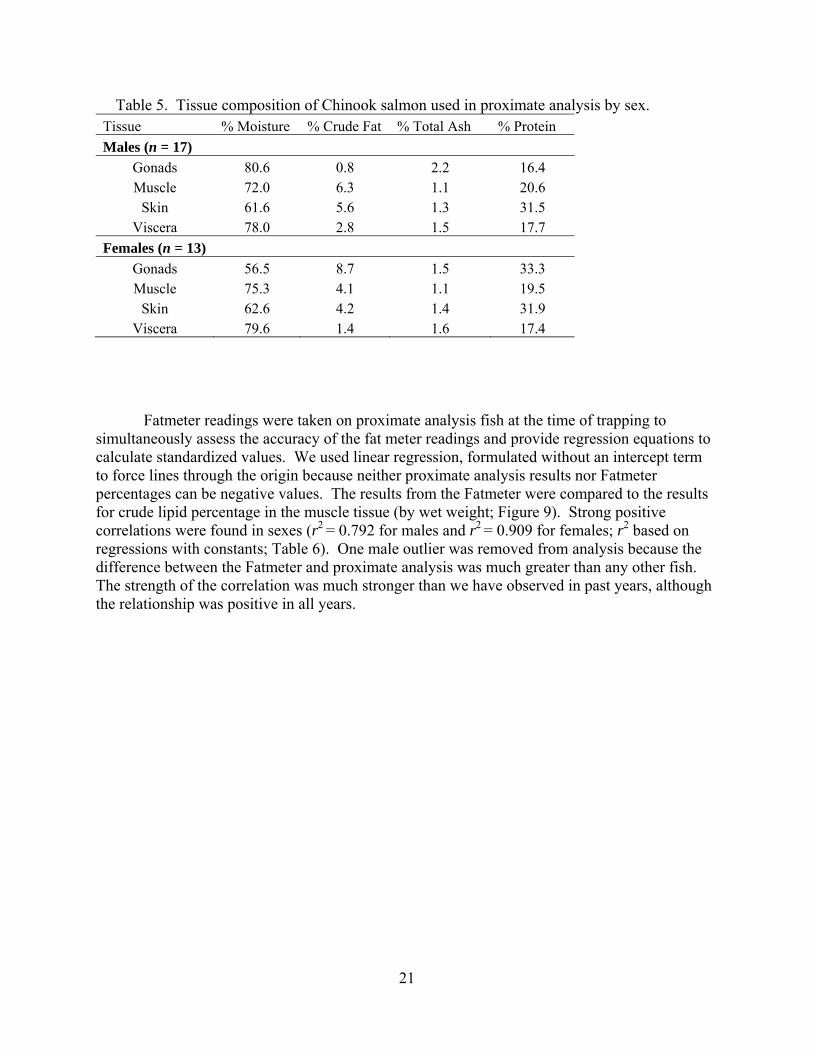
Proximate Analysis In 2010, proximate analysis was performed on 30 salmon, including 6 males and 9 females from Fall Creek, and eleven males and four females from Dexter (Table 4). Lethal takes for proximate analysis were conducted from 14 June to 11 August. The average muscle lipid level was 4.2% and ranged from 1.3-12.8%. Females had gonadal lipid compositions of 6-11%, while males were much lower with all but one fish under 1% (Table 5). This was expected because eggs have high lipid content. Males need less energy for gamete production, but potentially store more energy in muscles than females for use in spawning activity, which was supported by our results.
20
Table 4. Mean tissue composition of Chinook salmon used in proximate analysis in 2010. Tissue % Moisture % Crude Lipid % Total Ash % Protein Combined (n = 13 females, 17 males)Gonads 70.2 4.2 1.9 23.7 Muscle 73.5 5.3 1.1 20.1 Skin 62.0 5.0 1.4 31.7 Viscera 78.7 2.2 1.5 17.6 Fall Creek (n = 9 females, 6 males) Gonads 66.5 5.3 1.8 26.4 Muscle 73.7 5.4 1.1 19.9 Skin 61.5 5.0 1.4 32.2 Viscera 79.3 1.8 1.6 17.2 Dexter (n = 4 females, 11 males) Gonads 73.8 3.2 2.0 21.0 Muscle 73.2 5.3 1.1 20.3 Skin 62.5 4.9 1.3 31.2 Viscera 78.1 2.5 1.4 18.0
21
Table 5. Tissue composition of Chinook salmon used in proximate analysis by sex. Tissue % Moisture % Crude Fat % Total Ash % ProteinMales (n = 17)
Gonads 80.6 0.8 2.2 16.4Muscle 72.0 6.3 1.1 20.6
Skin 61.6 5.6 1.3 31.5Viscera 78.0 2.8 1.5 17.7
Females (n = 13) Gonads 56.5 8.7 1.5 33.3Muscle 75.3 4.1 1.1 19.5
Skin 62.6 4.2 1.4 31.9Viscera 79.6 1.4 1.6 17.4
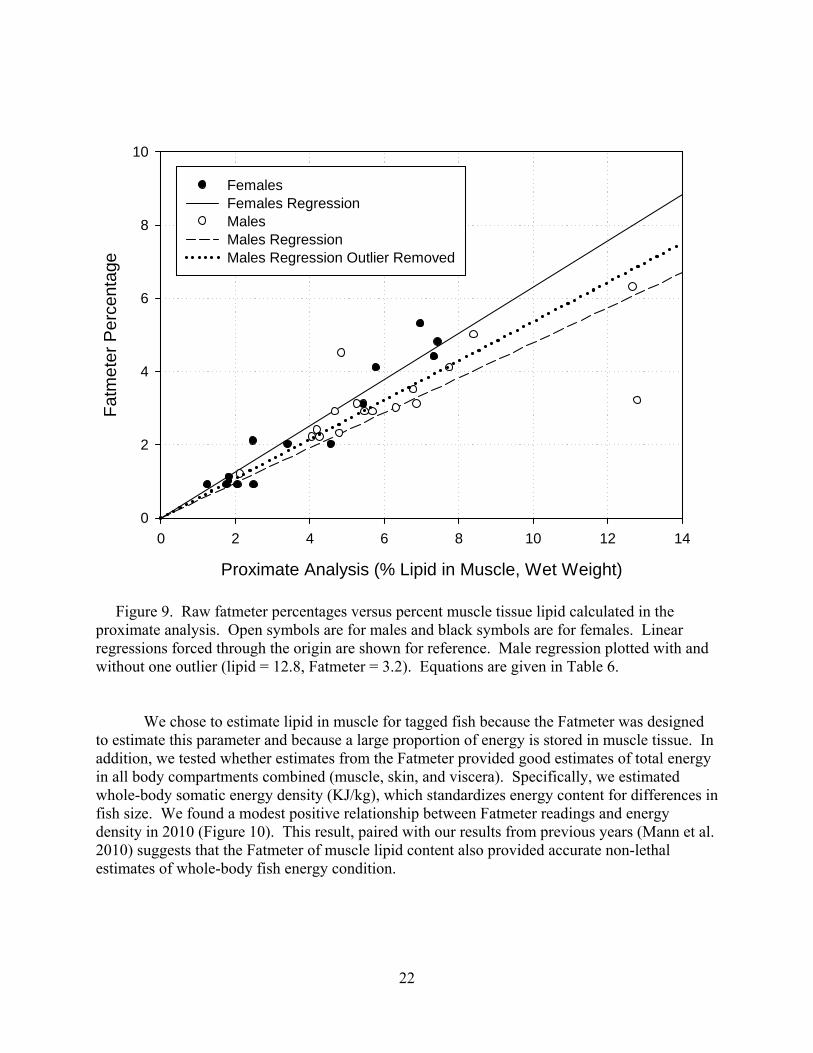
Fatmeter readings were taken on proximate analysis fish at the time of trapping to simultaneously assess the accuracy of the fat meter readings and provide regression equations to calculate standardized values. We used linear regression, formulated without an intercept term to force lines through the origin because neither proximate analysis results nor Fatmeter percentages can be negative values. The results from the Fatmeter were compared to the results for crude lipid percentage in the muscle tissue (by wet weight; Figure 9). Strong positive correlations were found in sexes (r2 = 0.792 for males and r2 = 0.909 for females; r2 based on regressions with constants; Table 6). One male outlier was removed from analysis because the difference between the Fatmeter and proximate analysis was much greater than any other fish. The strength of the correlation was much stronger than we have observed in past years, although the relationship was positive in all years.
22
Proximate Analysis (% Lipid in Muscle, Wet Weight)
0 2 4 6 8 10 12 14
Fatm
eter
Per
cent
age
0
2
4
6
8
10
FemalesFemales RegressionMales Males RegressionMales Regression Outlier Removed
Figure 9. Raw fatmeter percentages versus percent muscle tissue lipid calculated in the proximate analysis. Open symbols are for males and black symbols are for females. Linear regressions forced through the origin are shown for reference. Male regression plotted with and without one outlier (lipid = 12.8, Fatmeter = 3.2). Equations are given in Table 6.
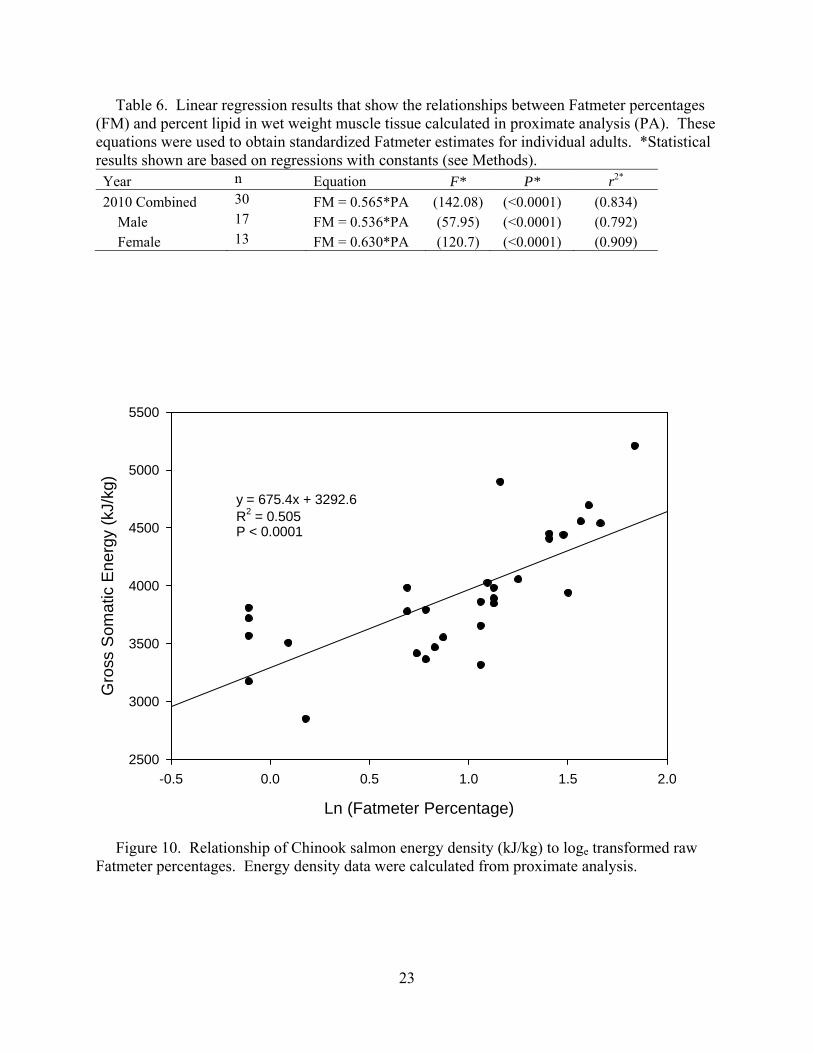
We chose to estimate lipid in muscle for tagged fish because the Fatmeter was designed to estimate this parameter and because a large proportion of energy is stored in muscle tissue. In addition, we tested whether estimates from the Fatmeter provided good estimates of total energy in all body compartments combined (muscle, skin, and viscera). Specifically, we estimated whole-body somatic energy density (KJ/kg), which standardizes energy content for differences in fish size. We found a modest positive relationship between Fatmeter readings and energy density in 2010 (Figure 10). This result, paired with our results from previous years (Mann et al. 2010) suggests that the Fatmeter of muscle lipid content also provided accurate non-lethal estimates of whole-body fish energy condition.
23
Table 6. Linear regression results that show the relationships between Fatmeter percentages (FM) and percent lipid in wet weight muscle tissue calculated in proximate analysis (PA). These equations were used to obtain standardized Fatmeter estimates for individual adults. *Statistical results shown are based on regressions with constants (see Methods). Year n Equation F* P* r2* 2010 Combined 30 FM = 0.565*PA (142.08) (<0.0001) (0.834) Male 17 FM = 0.536*PA (57.95) (<0.0001) (0.792) Female 13 FM = 0.630*PA (120.7) (<0.0001) (0.909)
Ln (Fatmeter Percentage)
-0.5 0.0 0.5 1.0 1.5 2.0
Gro
ss S
omat
ic E
nerg
y (k
J/kg
)
2500
3000
3500
4000
4500
5000
5500
y = 675.4x + 3292.6R2 = 0.505P < 0.0001
Figure 10. Relationship of Chinook salmon energy density (kJ/kg) to loge transformed raw Fatmeter percentages. Energy density data were calculated from proximate analysis.
24
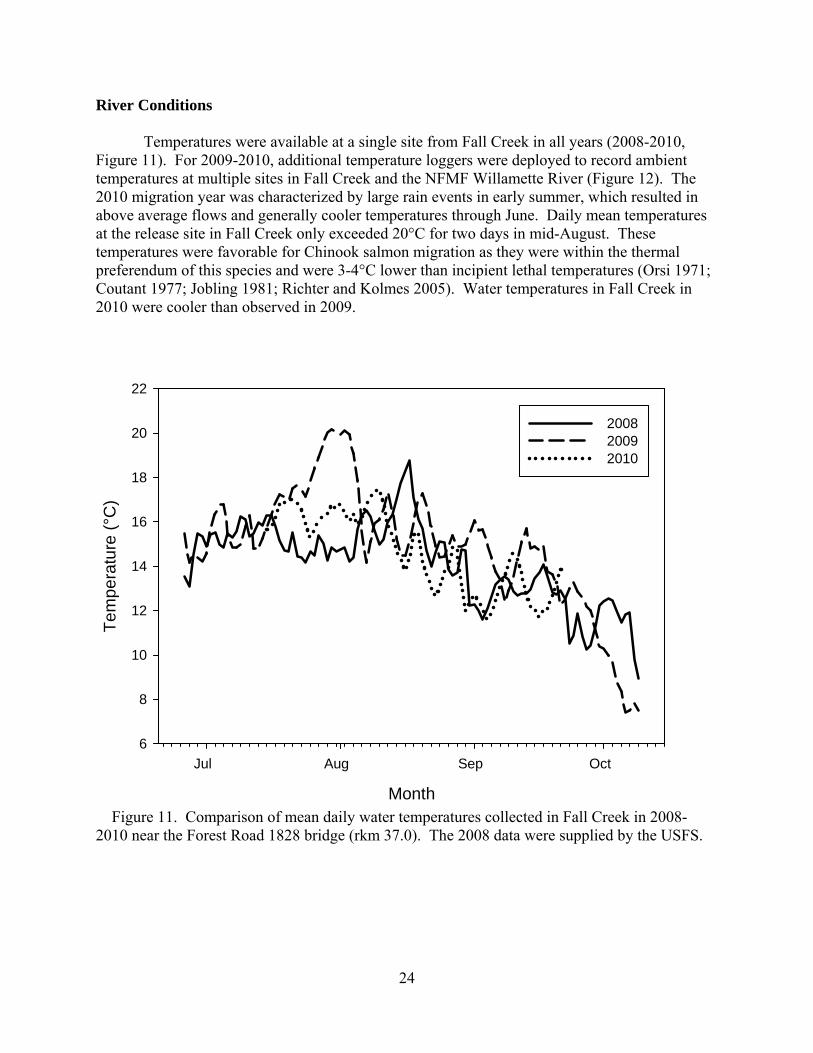
River Conditions Temperatures were available at a single site from Fall Creek in all years (2008-2010, Figure 11). For 2009-2010, additional temperature loggers were deployed to record ambient temperatures at multiple sites in Fall Creek and the NFMF Willamette River (Figure 12). The 2010 migration year was characterized by large rain events in early summer, which resulted in above average flows and generally cooler temperatures through June. Daily mean temperatures at the release site in Fall Creek only exceeded 20°C for two days in mid-August. These temperatures were favorable for Chinook salmon migration as they were within the thermal preferendum of this species and were 3-4°C lower than incipient lethal temperatures (Orsi 1971; Coutant 1977; Jobling 1981; Richter and Kolmes 2005). Water temperatures in Fall Creek in 2010 were cooler than observed in 2009.
Month
Jul Aug Sep Oct
Tem
pera
ture
(°C
)
6
8
10
12
14
16
18
20
22
200820092010
Figure 11. Comparison of mean daily water temperatures collected in Fall Creek in 2008-2010 near the Forest Road 1828 bridge (rkm 37.0). The 2008 data were supplied by the USFS.
25
Date
5/1/10 6/1/10 7/1/10 8/1/10 9/1/10 10/1/10 11/1/10
Tem
pera
ture
(°C
)
4
6
8
10
12
14
16
18
20
22
Release Johnny Cr Portland Cr 1828 Bridge Fish Barrier
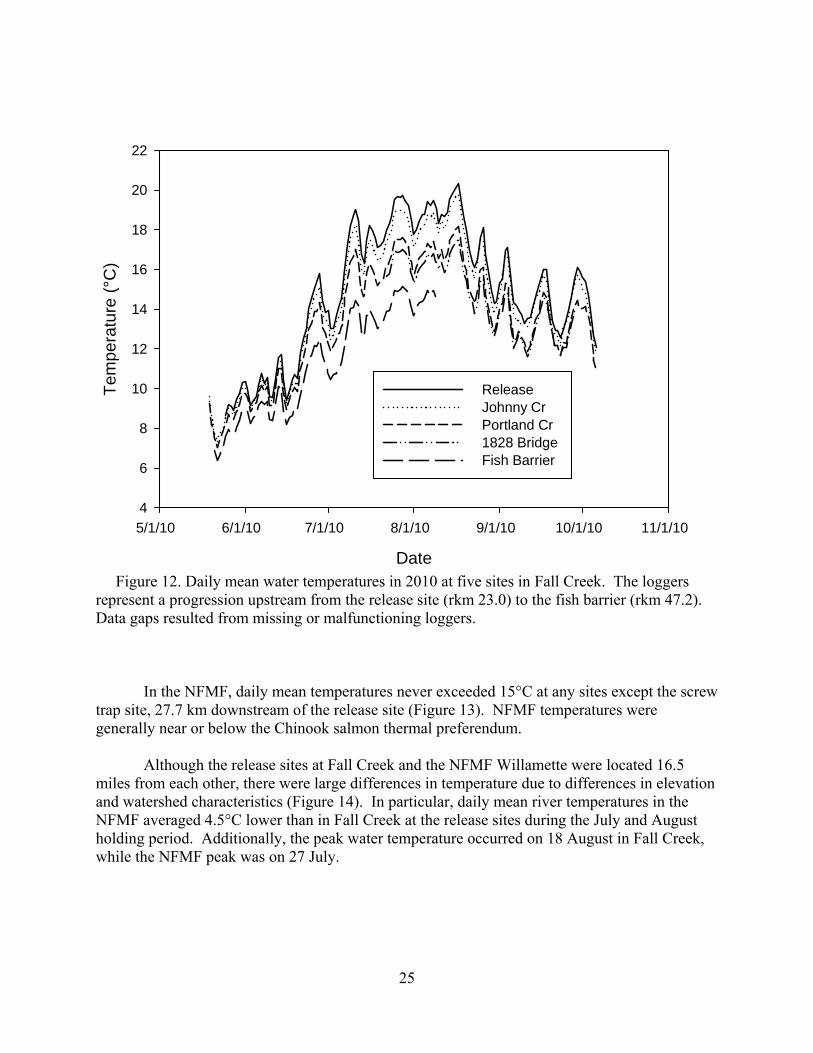
Figure 12. Daily mean water temperatures in 2010 at five sites in Fall Creek. The loggers represent a progression upstream from the release site (rkm 23.0) to the fish barrier (rkm 47.2). Data gaps resulted from missing or malfunctioning loggers.
In the NFMF, daily mean temperatures never exceeded 15°C at any sites except the screw trap site, 27.7 km downstream of the release site (Figure 13). NFMF temperatures were generally near or below the Chinook salmon thermal preferendum.
Although the release sites at Fall Creek and the NFMF Willamette were located 16.5 miles from each other, there were large differences in temperature due to differences in elevation and watershed characteristics (Figure 14). In particular, daily mean river temperatures in the NFMF averaged 4.5°C lower than in Fall Creek at the release sites during the July and August holding period. Additionally, the peak water temperature occurred on 18 August in Fall Creek, while the NFMF peak was on 27 July.
26
Date
6/1/10 7/1/10 8/1/10 9/1/10 10/1/10 11/1/10
Tem
pera
ture
(°C
)
6
8
10
12
14
16
18 Screwtrap Release Site Kiahanie 1944 Bridge Skookum Cr
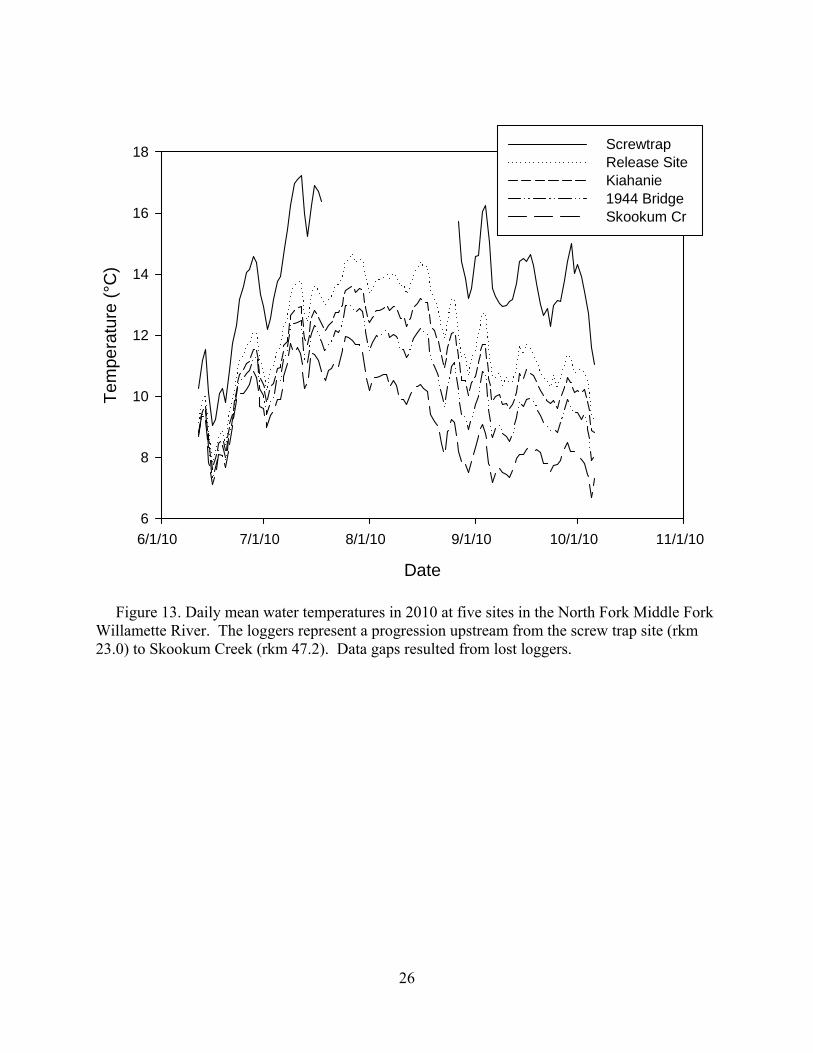
Figure 13. Daily mean water temperatures in 2010 at five sites in the North Fork Middle Fork Willamette River. The loggers represent a progression upstream from the screw trap site (rkm 23.0) to Skookum Creek (rkm 47.2). Data gaps resulted from lost loggers.
27
Date
7/1/10 8/1/10 9/1/10 10/1/10
Tem
pera
ture
(°C
)
4
6
8
10
12
14
16
18
20
22
Fall Cr Release Johnny Cr Portland Cr 1828 Bridge Fish Barrier Screwtrap NFMF ReleaseKiahanie 1944 Bridge Skookum Cr
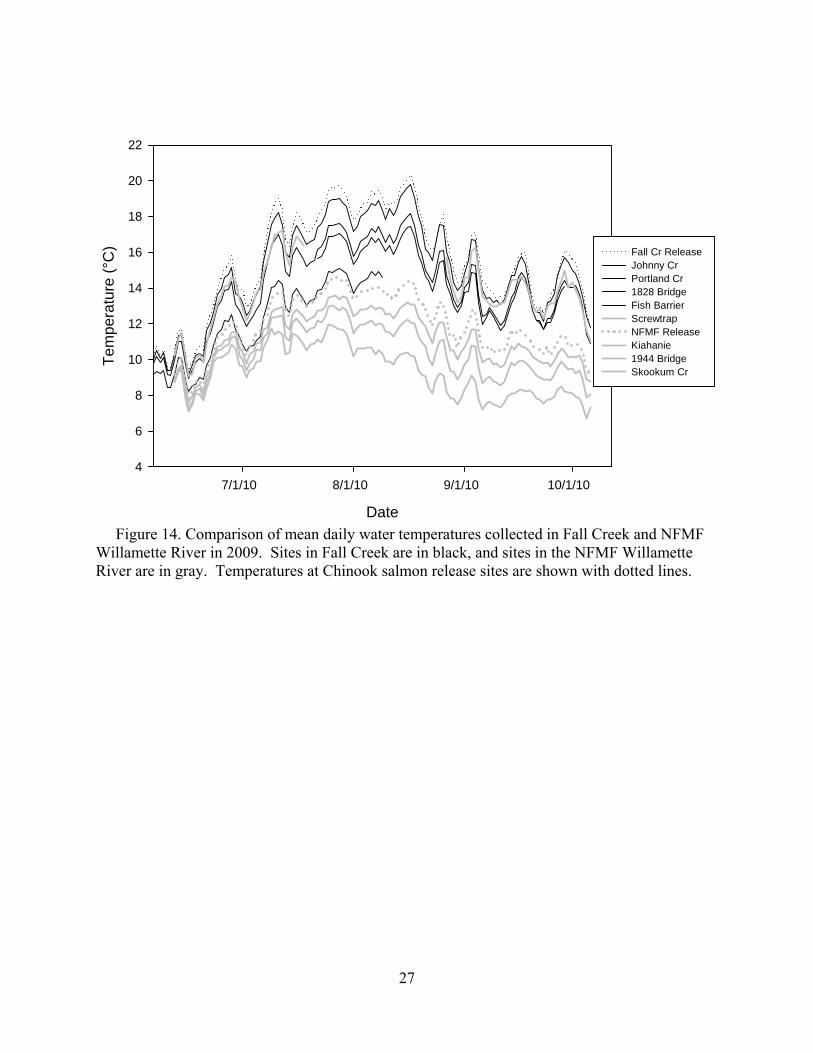
Figure 14. Comparison of mean daily water temperatures collected in Fall Creek and NFMF Willamette River in 2009. Sites in Fall Creek are in black, and sites in the NFMF Willamette River are in gray. Temperatures at Chinook salmon release sites are shown with dotted lines.
28
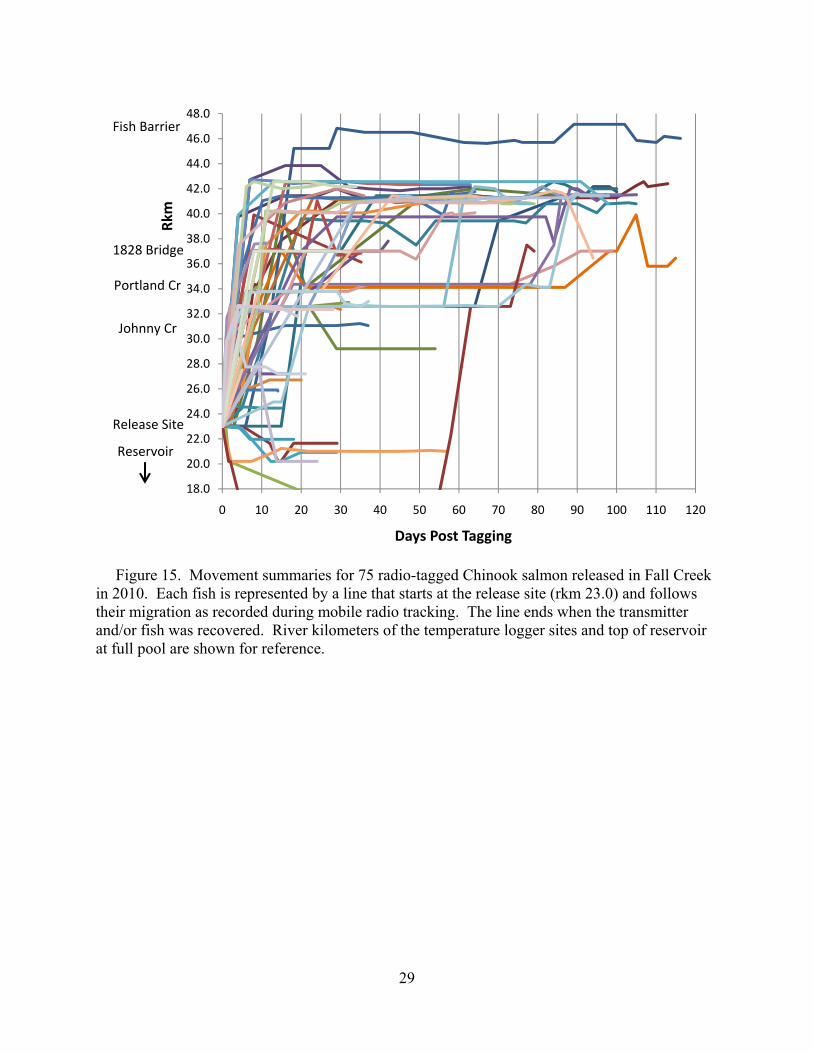
Migration Extensive radio tracking was conducted at least once a week through the 2010 migration season. The majority of fish were observed and much of the fish movement occurred within two weeks of release (Figure 15). Despite this, there was a relative increase in movement during the summer compared to 2009, when fish movement was confined to the first week after release and the week before spawning. Seven fish were detected below the release site, two of which were confirmed to have used the reservoir. All but one of these fish died below the release site. One moved back upstream just before spawning began, but we were unable to confirm whether this fish successfully spawned. Chinook salmon migration behaviors differed in the NFMF Willamette River compared to Fall Creek in that we observed less movement immediately after release in the NFMF (Figure 16). This mirrors what we observed in 2009. Several factors may have contributed to the behavioral difference. The release site for the NFMF was in a reach with ideal spawning habitat, and fish were released much later in the spawning season than they were in Fall Creek due to the broodstock collection protocols at Dexter Dam/Willamette Hatchery. Additionally, there are two large holding pools immediately upstream and downstream of the NFMF release site. The downstream pool, in particular, held ~60 or more fish until spawning started. Finally, temperatures were generally cooler in the NFMF, possibly making it less essential for fish to move upstream to find more favorable temperatures.
29
Figure 15. Movement summaries for 75 radio-tagged Chinook salmon released in Fall Creek in 2010. Each fish is represented by a line that starts at the release site (rkm 23.0) and follows their migration as recorded during mobile radio tracking. The line ends when the transmitter and/or fish was recovered. River kilometers of the temperature logger sites and top of reservoir at full pool are shown for reference.
18.0
20.0
22.0
24.0
26.0
28.0
30.0
32.0
34.0
36.0
38.0
40.0
42.0
44.0
46.0
48.0
0 10 20 30 40 50 60 70 80 90 100 110 120
Rkm
Days Post Tagging
Fish Barrier
1828 Bridge
Portland Cr
Johnny Cr
Release Site
Reservoir
30
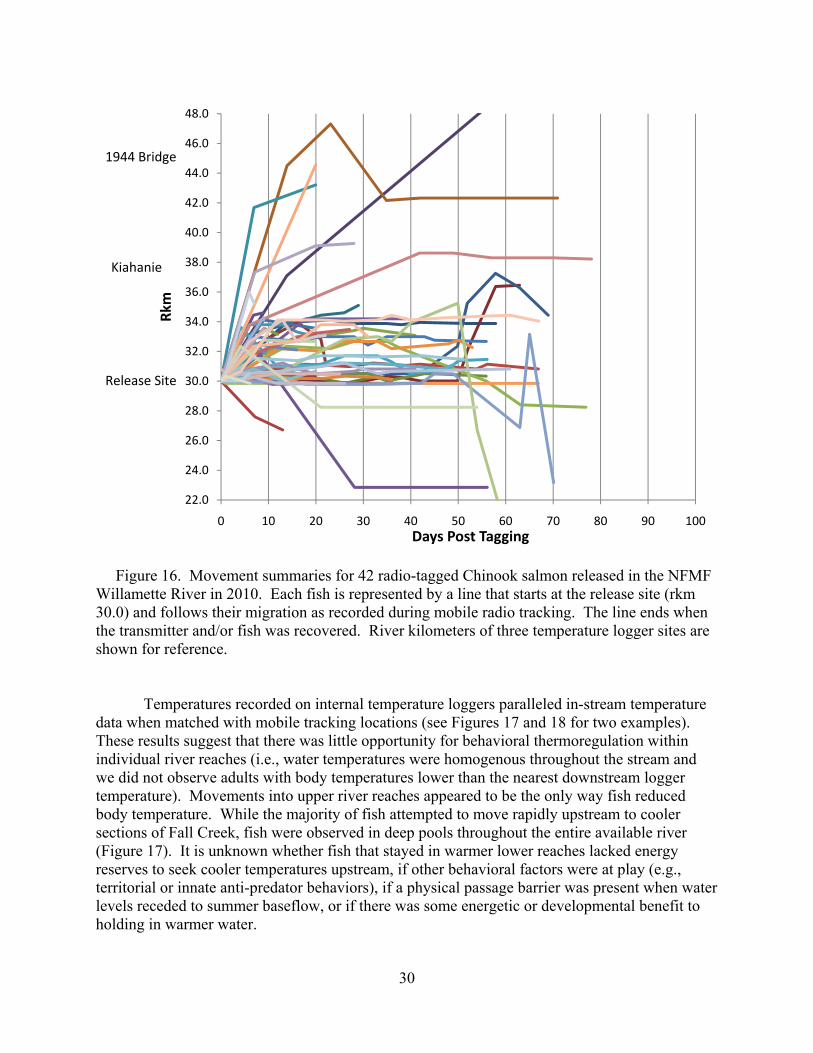
Figure 16. Movement summaries for 42 radio-tagged Chinook salmon released in the NFMF Willamette River in 2010. Each fish is represented by a line that starts at the release site (rkm 30.0) and follows their migration as recorded during mobile radio tracking. The line ends when the transmitter and/or fish was recovered. River kilometers of three temperature logger sites are shown for reference. Temperatures recorded on internal temperature loggers paralleled in-stream temperature data when matched with mobile tracking locations (see Figures 17 and 18 for two examples). These results suggest that there was little opportunity for behavioral thermoregulation within individual river reaches (i.e., water temperatures were homogenous throughout the stream and we did not observe adults with body temperatures lower than the nearest downstream logger temperature). Movements into upper river reaches appeared to be the only way fish reduced body temperature. While the majority of fish attempted to move rapidly upstream to cooler sections of Fall Creek, fish were observed in deep pools throughout the entire available river (Figure 17). It is unknown whether fish that stayed in warmer lower reaches lacked energy reserves to seek cooler temperatures upstream, if other behavioral factors were at play (e.g., territorial or innate anti-predator behaviors), if a physical passage barrier was present when water levels receded to summer baseflow, or if there was some energetic or developmental benefit to holding in warmer water.
22.0
24.0
26.0
28.0
30.0
32.0
34.0
36.0
38.0
40.0
42.0
44.0
46.0
48.0
0 10 20 30 40 50 60 70 80 90 100
Rkm
Days Post Tagging
1944 Bridge
Kiahanie
Release Site
31
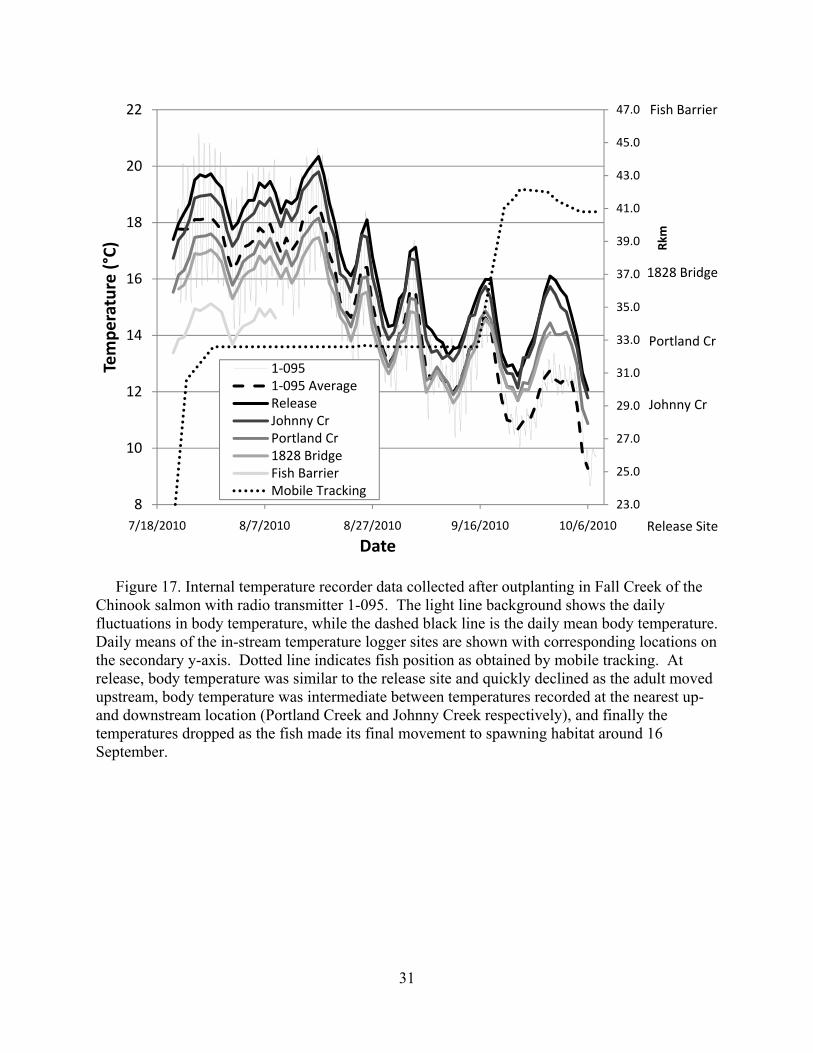
Figure 17. Internal temperature recorder data collected after outplanting in Fall Creek of the Chinook salmon with radio transmitter 1-095. The light line background shows the daily fluctuations in body temperature, while the dashed black line is the daily mean body temperature. Daily means of the in-stream temperature logger sites are shown with corresponding locations on the secondary y-axis. Dotted line indicates fish position as obtained by mobile tracking. At release, body temperature was similar to the release site and quickly declined as the adult moved upstream, body temperature was intermediate between temperatures recorded at the nearest up- and downstream location (Portland Creek and Johnny Creek respectively), and finally the temperatures dropped as the fish made its final movement to spawning habitat around 16 September.
23.0
25.0
27.0
29.0
31.0
33.0
35.0
37.0
39.0
41.0
43.0
45.0
47.0
8
10
12
14
16
18
20
22
7/18/2010 8/7/2010 8/27/2010 9/16/2010 10/6/2010
Rkm
Tempe
rature (°C)
Date
1‐0951‐095 AverageReleaseJohnny CrPortland Cr1828 BridgeFish BarrierMobile Tracking
Fish Barrier
1828 Bridge
Portland Cr
Johnny Cr
Release Site
32
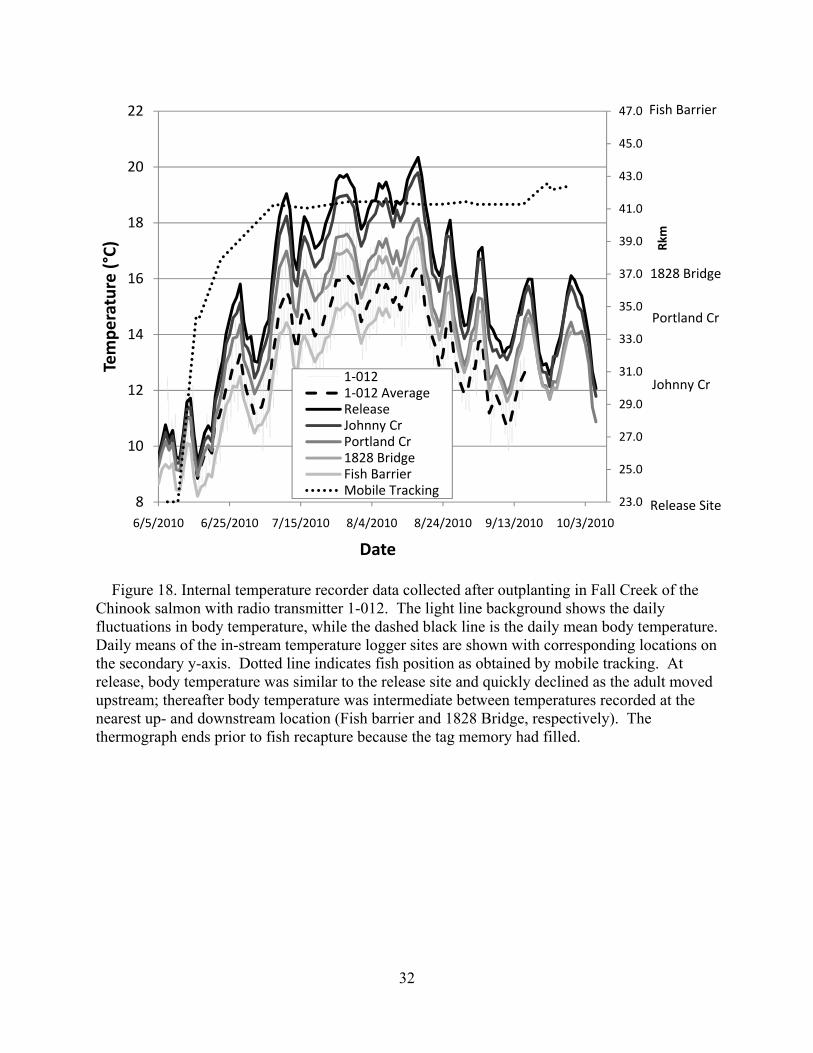
Figure 18. Internal temperature recorder data collected after outplanting in Fall Creek of the Chinook salmon with radio transmitter 1-012. The light line background shows the daily fluctuations in body temperature, while the dashed black line is the daily mean body temperature. Daily means of the in-stream temperature logger sites are shown with corresponding locations on the secondary y-axis. Dotted line indicates fish position as obtained by mobile tracking. At release, body temperature was similar to the release site and quickly declined as the adult moved upstream; thereafter body temperature was intermediate between temperatures recorded at the nearest up- and downstream location (Fish barrier and 1828 Bridge, respectively). The thermograph ends prior to fish recapture because the tag memory had filled.
23.0
25.0
27.0
29.0
31.0
33.0
35.0
37.0
39.0
41.0
43.0
45.0
47.0
8
10
12
14
16
18
20
22
6/5/2010 6/25/2010 7/15/2010 8/4/2010 8/24/2010 9/13/2010 10/3/2010
Rkm
Tempe
rature (°C)
Date
1‐0121‐012 AverageReleaseJohnny CrPortland Cr1828 BridgeFish BarrierMobile Tracking
Fish Barrier
1828 Bridge
Portland Cr
Johnny Cr
Release Site

33
We observed two possible migration barriers based on radiotelemetry tracking in Fall Creek. Both were large log jams, and we hypothesize that when river discharge recedes to low levels in the late summer, the log jams may become obstructive or completely impassable. The first is located at Bedrock Campground (rkm 32.6). Although the structure proved to be passable throughout the migration year, a large number of fish held below this location for extended periods. Alternatively, it is possible that the large pool below the log jam provides a thermal, structural, or solar refuge. However, temperatures likely reached stressful levels based on our fixed temperature sites up- and downstream. The second potential barrier was located at rkm 42.6. Only one radio tagged fish passed this point through the summer, which occurred between 22 June and 28 June when flows were relatively high, but as many as 20 fish collected in the pool below the log jam at one time. Although the majority of spawning habitat occurs downstream of this site, there are gravel sites upstream that seemed to be underutilized. In addition, the shallow pool provides little protection from predators or harassment. This is the same site where two radio-tagged fish and likely more untagged fish were poached in 2009 and multiple fishing lures were observed attached to holding salmon by the ODFW crew in 2010.
Spawning Ground Surveys and Spawning Success
Carcasses were recovered in Fall Creek from 1 July until 12 October. The recovery rate was 31% of the PIT-tagged fish sampled at the Fall Creek trap. As we have observed in previous years, a number of carcasses had been scavenged prior to recovery, and it is possible that PIT tags were lost from fish before they were scanned. This hypothesis was supported by the observation that in 2010 the proportion of released adults with PIT tags (37% of those outplanted) was higher than the proportion of carcasses with PIT-tags (29%). Carcasses were primarily scavenged by turkey vultures and bald eagles during the day (based on observations) and likely by raccoons at night (based on scat).
Prespawn mortality was estimated using several parameters including using PIT-tagged
fish only, double-tagged fish only, and all tagged and untagged carcasses. Some carcasses or double-tagged fish were excluded from the analyses because spawning success could not be determined or because the fish presumably died from unnatural means (i.e., poaching). Twenty-six of the 62 sampled PIT-tagged carcasses were unsuccessful spawners, resulting in an estimated prespawn mortality rate of 41.9% (Table 7). Prespawn mortality estimates were 62.9% for radio tagged fish only (n = 54), and 47.9% for all female carcasses recovered (tagged and untagged combined; n = 73).
34
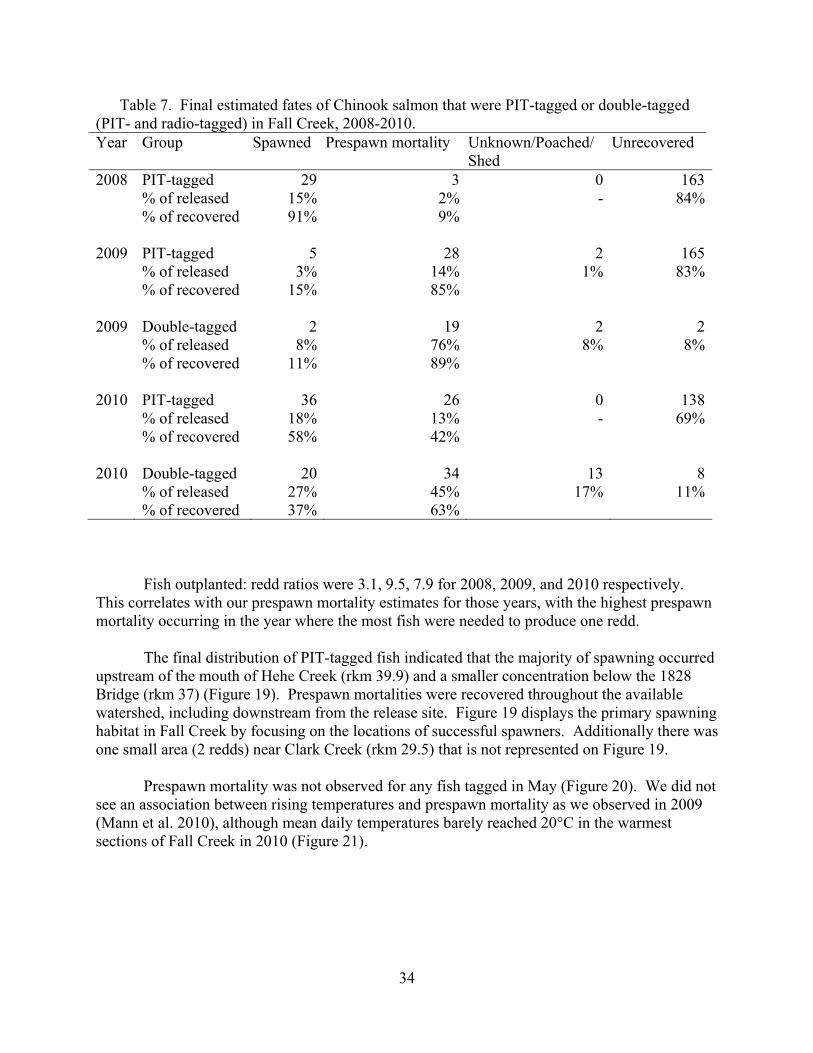
Table 7. Final estimated fates of Chinook salmon that were PIT-tagged or double-tagged (PIT- and radio-tagged) in Fall Creek, 2008-2010. Year Group Spawned Prespawn mortality Unknown/Poached/
Shed Unrecovered
2008 PIT-tagged 29 3 0 163 % of released 15% 2% - 84% % of recovered 91% 9% 2009 PIT-tagged 5 28 2 165 % of released 3% 14% 1% 83% % of recovered 15% 85% 2009 Double-tagged 2 19 2 2 % of released 8% 76% 8% 8% 2010 2010
% of recovered PIT-tagged % of released % of recovered Double-tagged % of released % of recovered
11%
36 18% 58%
20
27% 37%
89%
2613%42%
3445%63%
0 -
13 17%
13869%
811%
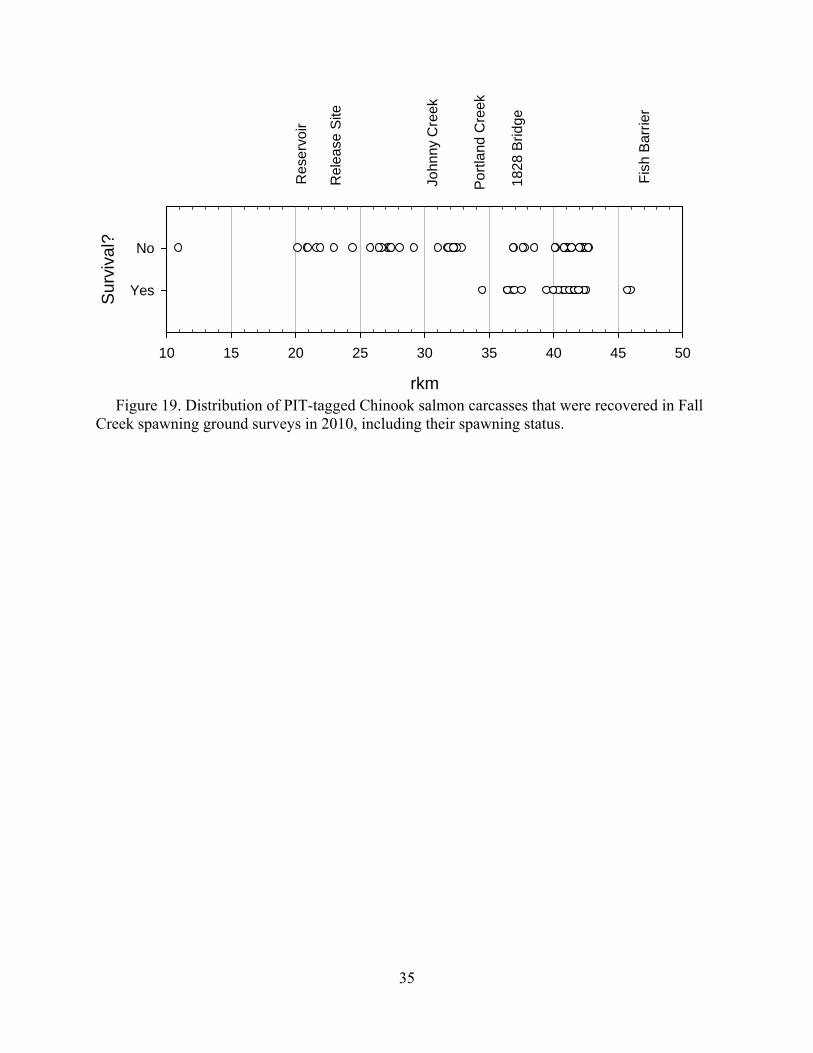
Fish outplanted: redd ratios were 3.1, 9.5, 7.9 for 2008, 2009, and 2010 respectively. This correlates with our prespawn mortality estimates for those years, with the highest prespawn mortality occurring in the year where the most fish were needed to produce one redd. The final distribution of PIT-tagged fish indicated that the majority of spawning occurred upstream of the mouth of Hehe Creek (rkm 39.9) and a smaller concentration below the 1828 Bridge (rkm 37) (Figure 19). Prespawn mortalities were recovered throughout the available watershed, including downstream from the release site. Figure 19 displays the primary spawning habitat in Fall Creek by focusing on the locations of successful spawners. Additionally there was one small area (2 redds) near Clark Creek (rkm 29.5) that is not represented on Figure 19.
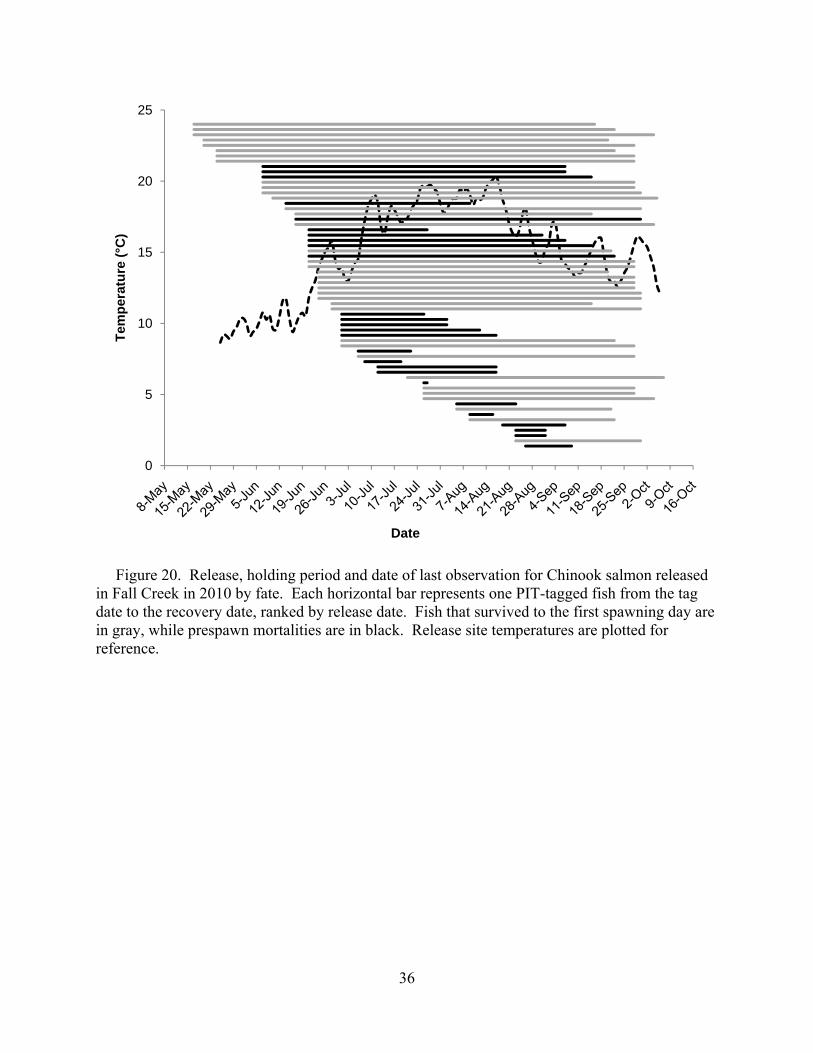
Prespawn mortality was not observed for any fish tagged in May (Figure 20). We did not see an association between rising temperatures and prespawn mortality as we observed in 2009 (Mann et al. 2010), although mean daily temperatures barely reached 20°C in the warmest sections of Fall Creek in 2010 (Figure 21).
35
rkm
10 15 20 25 30 35 40 45 50
Sur
viva
l?
Yes
No
Rel
ease
Site
John
ny C
reek
Portl
and
Cre
e k
1828
Brid
ge
Fish
Bar
rier
Res
ervo
ir
Figure 19. Distribution of PIT-tagged Chinook salmon carcasses that were recovered in Fall Creek spawning ground surveys in 2010, including their spawning status.
36
Figure 20. Release, holding period and date of last observation for Chinook salmon released in Fall Creek in 2010 by fate. Each horizontal bar represents one PIT-tagged fish from the tag date to the recovery date, ranked by release date. Fish that survived to the first spawning day are in gray, while prespawn mortalities are in black. Release site temperatures are plotted for reference.
0
5
10
15
20
25Te
mpe
ratu
re (°
C)
Date
37
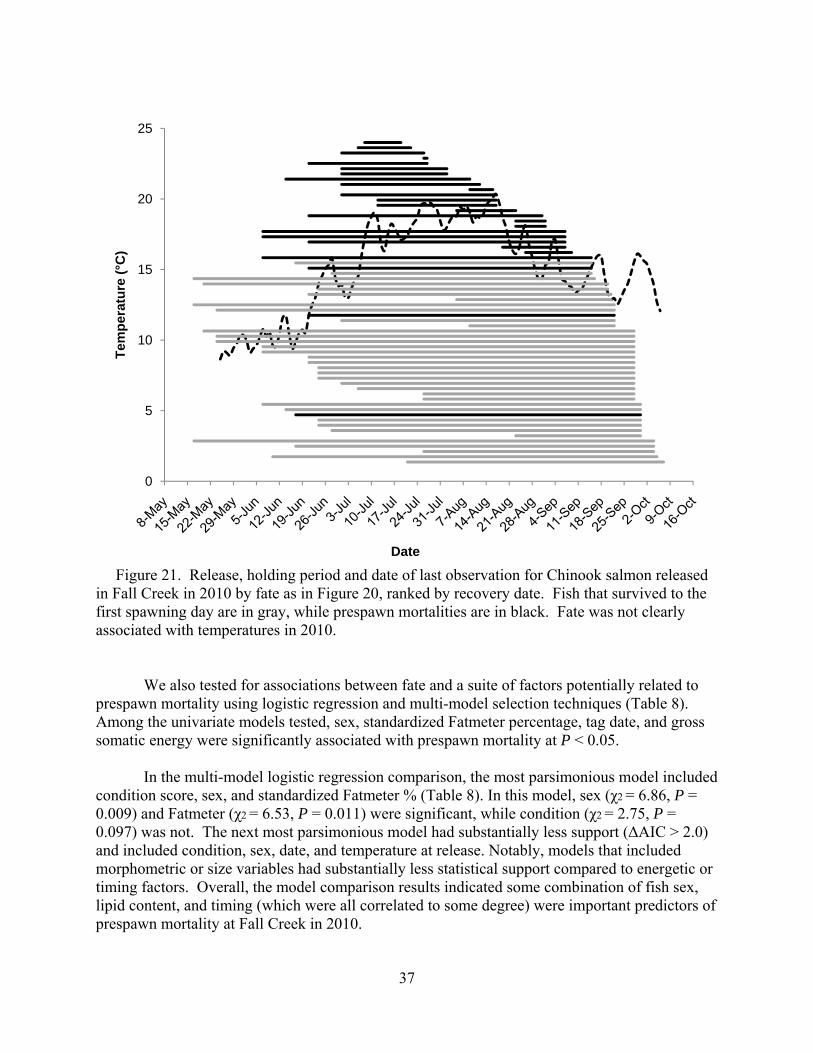
Figure 21. Release, holding period and date of last observation for Chinook salmon released in Fall Creek in 2010 by fate as in Figure 20, ranked by recovery date. Fish that survived to the first spawning day are in gray, while prespawn mortalities are in black. Fate was not clearly associated with temperatures in 2010.
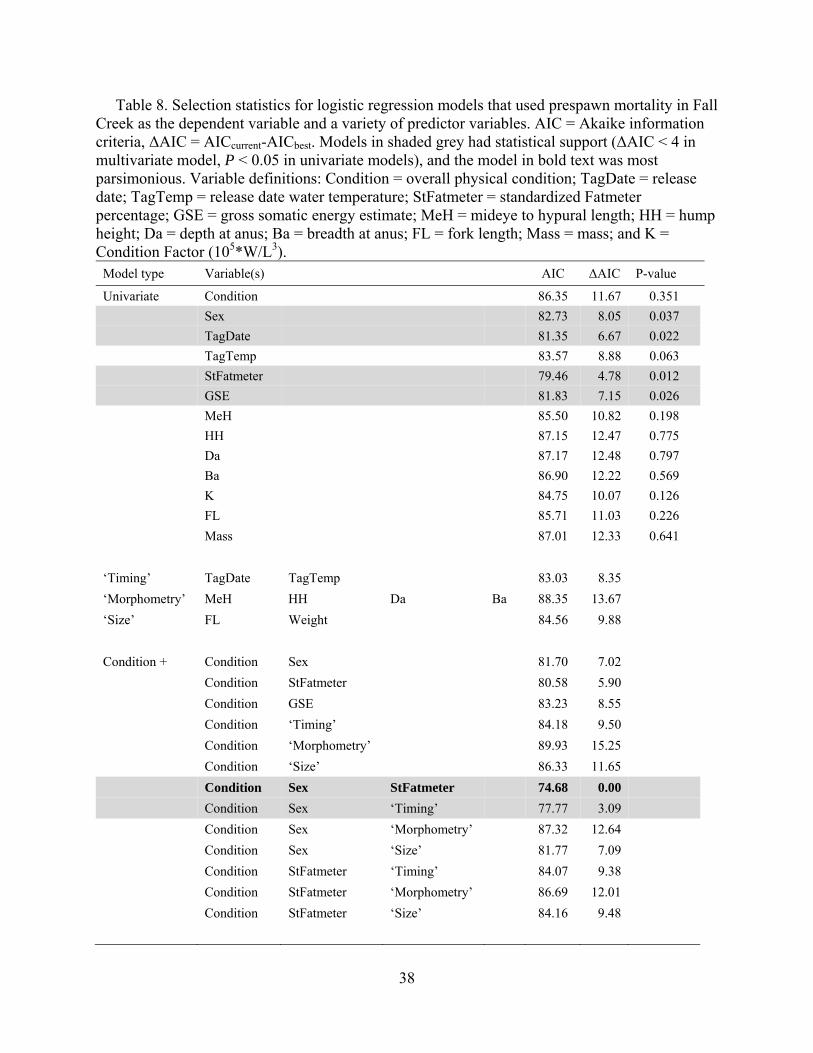
We also tested for associations between fate and a suite of factors potentially related to prespawn mortality using logistic regression and multi-model selection techniques (Table 8). Among the univariate models tested, sex, standardized Fatmeter percentage, tag date, and gross somatic energy were significantly associated with prespawn mortality at P < 0.05.
In the multi-model logistic regression comparison, the most parsimonious model included
condition score, sex, and standardized Fatmeter % (Table 8). In this model, sex (χ2 = 6.86, P = 0.009) and Fatmeter (χ2 = 6.53, P = 0.011) were significant, while condition (χ2 = 2.75, P = 0.097) was not. The next most parsimonious model had substantially less support (ΔAIC > 2.0) and included condition, sex, date, and temperature at release. Notably, models that included morphometric or size variables had substantially less statistical support compared to energetic or timing factors. Overall, the model comparison results indicated some combination of fish sex, lipid content, and timing (which were all correlated to some degree) were important predictors of prespawn mortality at Fall Creek in 2010.
0
5
10
15
20
25Te
mpe
ratu
re (°
C)
Date
38
Table 8. Selection statistics for logistic regression models that used prespawn mortality in Fall Creek as the dependent variable and a variety of predictor variables. AIC = Akaike information criteria, ΔAIC = AICcurrent-AICbest. Models in shaded grey had statistical support (ΔAIC < 4 in multivariate model, P < 0.05 in univariate models), and the model in bold text was most parsimonious. Variable definitions: Condition = overall physical condition; TagDate = release date; TagTemp = release date water temperature; StFatmeter = standardized Fatmeter percentage; GSE = gross somatic energy estimate; MeH = mideye to hypural length; HH = hump height; Da = depth at anus; Ba = breadth at anus; FL = fork length; Mass = mass; and K = Condition Factor (105*W/L3).
Model type Variable(s) AIC ΔAIC P-value
Univariate Condition 86.35 11.67 0.351 Sex 82.73 8.05 0.037 TagDate 81.35 6.67 0.022 TagTemp 83.57 8.88 0.063 StFatmeter 79.46 4.78 0.012 GSE 81.83 7.15 0.026 MeH 85.50 10.82 0.198 HH 87.15 12.47 0.775 Da 87.17 12.48 0.797 Ba 86.90 12.22 0.569 K 84.75 10.07 0.126 FL 85.71 11.03 0.226 Mass 87.01 12.33 0.641 ‘Timing’ TagDate TagTemp 83.03 8.35 ‘Morphometry’ MeH HH Da Ba 88.35 13.67 ‘Size’ FL Weight 84.56 9.88 Condition + Condition Sex 81.70 7.02 Condition StFatmeter 80.58 5.90 Condition GSE 83.23 8.55 Condition ‘Timing’ 84.18 9.50 Condition ‘Morphometry’ 89.93 15.25 Condition ‘Size’ 86.33 11.65 Condition Sex StFatmeter 74.68 0.00 Condition Sex ‘Timing’ 77.77 3.09 Condition Sex ‘Morphometry’ 87.32 12.64 Condition Sex ‘Size’ 81.77 7.09 Condition StFatmeter ‘Timing’ 84.07 9.38 Condition StFatmeter ‘Morphometry’ 86.69 12.01 Condition StFatmeter ‘Size’ 84.16 9.48
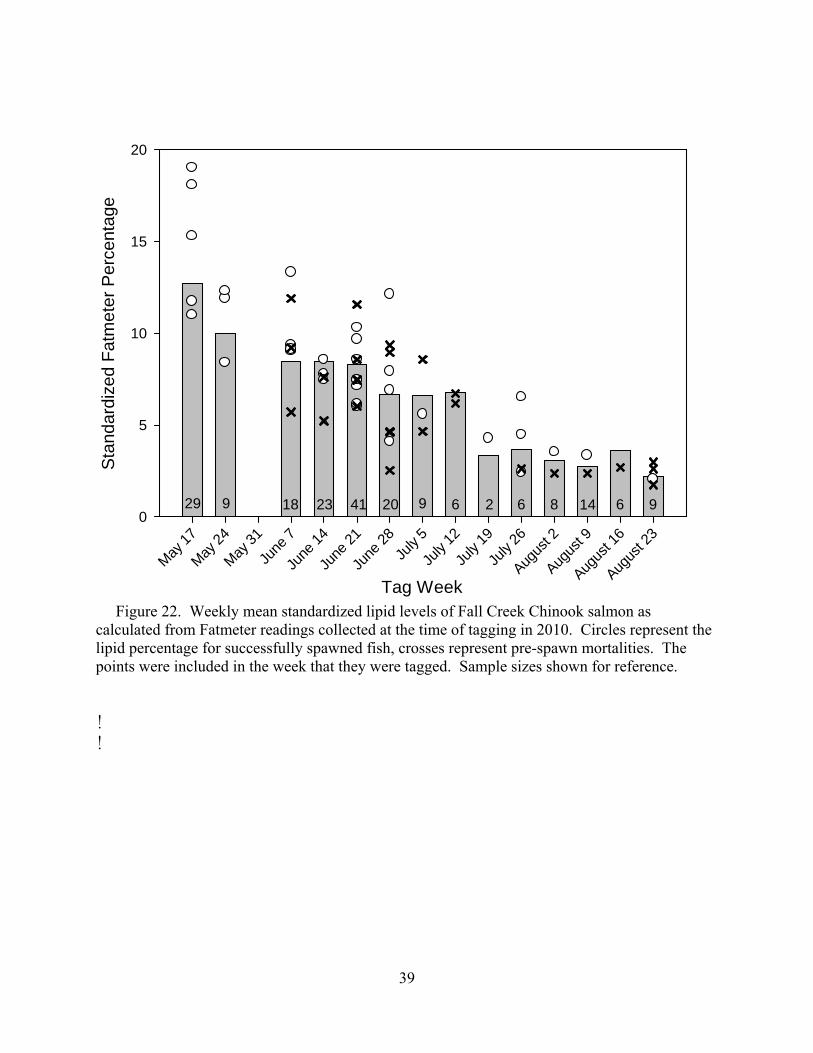
39
Tag WeekMay
17
May 24
May 31
June
7
June
14
June
21
June
28Ju
ly 5
July
12
July
19
July
26
Augus
t 2
Augus
t 9
Augus
t 16
Augus
t 23
Sta
ndar
dize
d Fa
tmet
er P
erce
ntag
e
0
5
10
15
20
29 189 23 2041 9 2 6 14 9686
Figure 22. Weekly mean standardized lipid levels of Fall Creek Chinook salmon as calculated from Fatmeter readings collected at the time of tagging in 2010. Circles represent the lipid percentage for successfully spawned fish, crosses represent pre-spawn mortalities. The points were included in the week that they were tagged. Sample sizes shown for reference. !
!
40
A total of 272 fish were released into the NFMF Willamette River in 2010 including the immediate outplants (n = 192) and fish held at Willamette hatchery and later outplanted (n = 80). Fifty four PIT-tagged carcasses were recovered for a recovery rate of 19.9%. This was a considerable improvement in recapture efficiency over 2009, when 4.9% were recovered. The 2010 recovery rate was lower than at Fall Creek, a difference we attributed to the larger size of the NFMF and other river characteristics such as large woody debris traps that made it difficult to find NFMF carcasses.
Prespawn mortality in the NFMF was estimated to be 45.3% based on PIT-tagged carcasses and 61.0% based on radio transmitter recoveries (Table 11) with immediate outplants and hatchery-held fish combined. The estimate for immediate outplants alone was 57.9%. The estimate for the hatchery-held group was 20.3% (13.3%-30.7%). Confidence intervals are based on the best case and worst case scenarios for collected and transported to the hatchery, but were not recollected at the time of outplanting (and hence may or may not represent prespawn mortality; see Methods). A large number of mortalities, as high as 45 in one instance, were observed directly below the release site in days following a release. Because mortality was assessed immediately following release by the truck drivers, this is evidence of delayed mortality in the NFMF outplants. None of these fish were tagged, however, suggesting minimal tagging effects on study fish.
In the NFMF, spawning activity was much more dispersed than in Fall Creek (Figure 23). There is a large amount of ideal habitat both up- and downstream from the release site. We observed redds as far as 20 km upstream of the release site at ~rkm 50. The largest concentration of redds was near a large log jam section at rkm 35.3, as in 2009. A total of 121 redds were counted in 2010, and all but four were upstream from the release site.
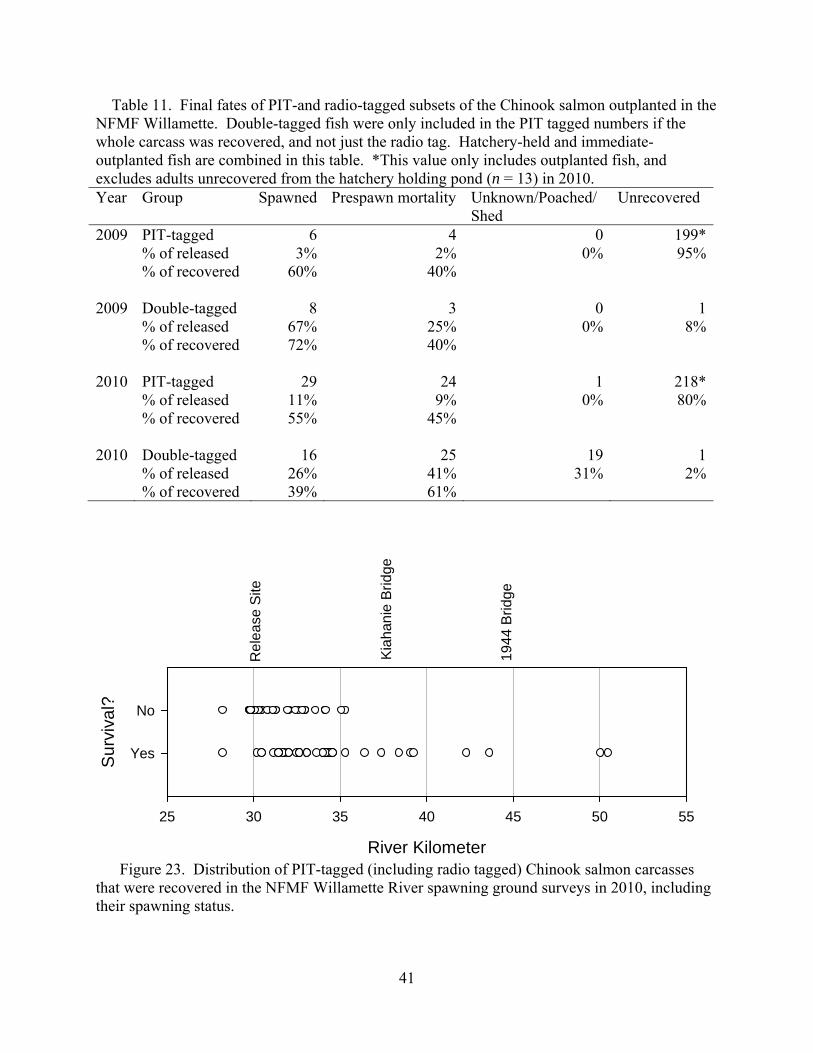
41
Table 11. Final fates of PIT-and radio-tagged subsets of the Chinook salmon outplanted in the NFMF Willamette. Double-tagged fish were only included in the PIT tagged numbers if the whole carcass was recovered, and not just the radio tag. Hatchery-held and immediate-outplanted fish are combined in this table. *This value only includes outplanted fish, and excludes adults unrecovered from the hatchery holding pond (n = 13) in 2010. Year Group Spawned Prespawn mortality Unknown/Poached/
Shed Unrecovered
2009 2009 2010
PIT-tagged % of released % of recovered Double-tagged % of released % of recovered PIT-tagged
6 3%
60%
8 67% 72%
29
42%
40%
325%40%
24
0 0%
0 0%
1
199*95%
18%
218* % of released 11% 9% 0% 80% % of recovered 55% 45% 2010 Double-tagged 16 25 19 1 % of released 26% 41% 31% 2% % of recovered 39% 61%
River Kilometer
25 30 35 40 45 50 55
Sur
viva
l?
Yes
No
Rel
ease
Site
Kiah
anie
Brid
ge
1944
Brid
ge
Figure 23. Distribution of PIT-tagged (including radio tagged) Chinook salmon carcasses
that were recovered in the NFMF Willamette River spawning ground surveys in 2010, including their spawning status.
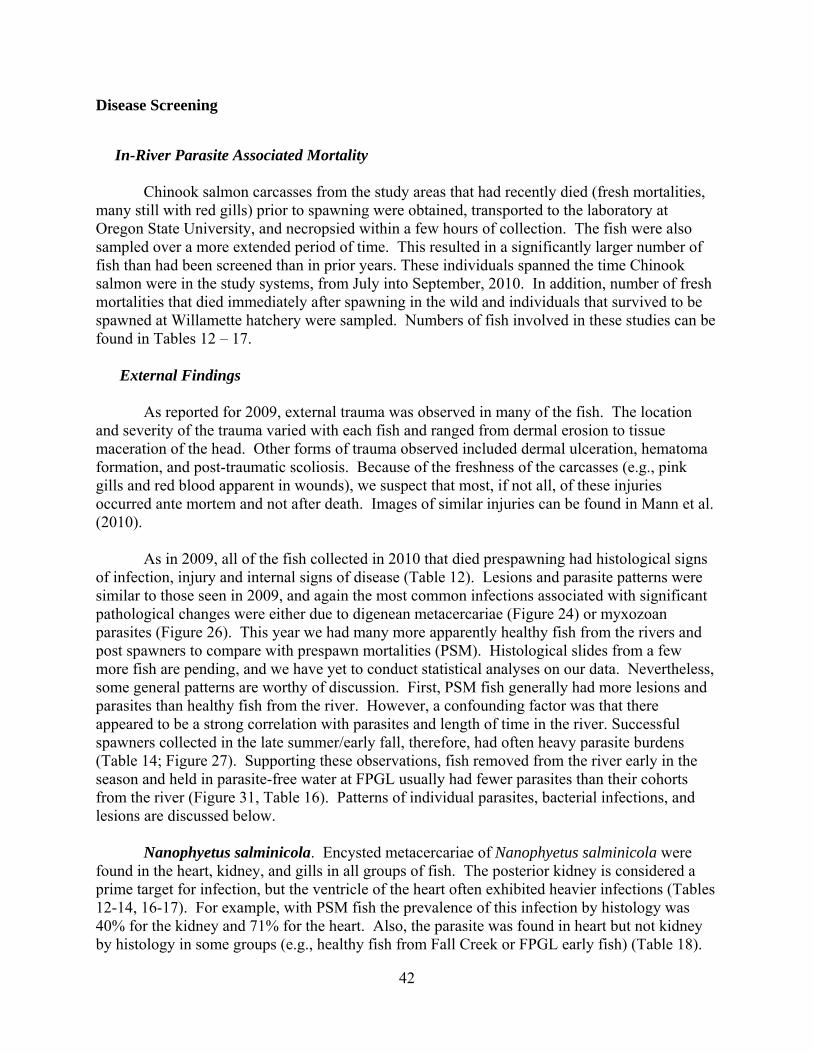
42
Disease Screening
In-River Parasite Associated Mortality
Chinook salmon carcasses from the study areas that had recently died (fresh mortalities, many still with red gills) prior to spawning were obtained, transported to the laboratory at Oregon State University, and necropsied within a few hours of collection. The fish were also sampled over a more extended period of time. This resulted in a significantly larger number of fish than had been screened than in prior years. These individuals spanned the time Chinook salmon were in the study systems, from July into September, 2010. In addition, number of fresh mortalities that died immediately after spawning in the wild and individuals that survived to be spawned at Willamette hatchery were sampled. Numbers of fish involved in these studies can be found in Tables 12 – 17.
External Findings
As reported for 2009, external trauma was observed in many of the fish. The location and severity of the trauma varied with each fish and ranged from dermal erosion to tissue maceration of the head. Other forms of trauma observed included dermal ulceration, hematoma formation, and post-traumatic scoliosis. Because of the freshness of the carcasses (e.g., pink gills and red blood apparent in wounds), we suspect that most, if not all, of these injuries occurred ante mortem and not after death. Images of similar injuries can be found in Mann et al. (2010).
As in 2009, all of the fish collected in 2010 that died prespawning had histological signs of infection, injury and internal signs of disease (Table 12). Lesions and parasite patterns were similar to those seen in 2009, and again the most common infections associated with significant pathological changes were either due to digenean metacercariae (Figure 24) or myxozoan parasites (Figure 26). This year we had many more apparently healthy fish from the rivers and post spawners to compare with prespawn mortalities (PSM). Histological slides from a few more fish are pending, and we have yet to conduct statistical analyses on our data. Nevertheless, some general patterns are worthy of discussion. First, PSM fish generally had more lesions and parasites than healthy fish from the river. However, a confounding factor was that there appeared to be a strong correlation with parasites and length of time in the river. Successful spawners collected in the late summer/early fall, therefore, had often heavy parasite burdens (Table 14; Figure 27). Supporting these observations, fish removed from the river early in the season and held in parasite-free water at FPGL usually had fewer parasites than their cohorts from the river (Figure 31, Table 16). Patterns of individual parasites, bacterial infections, and lesions are discussed below.
Nanophyetus salminicola. Encysted metacercariae of Nanophyetus salminicola were
found in the heart, kidney, and gills in all groups of fish. The posterior kidney is considered a prime target for infection, but the ventricle of the heart often exhibited heavier infections (Tables 12-14, 16-17). For example, with PSM fish the prevalence of this infection by histology was 40% for the kidney and 71% for the heart. Also, the parasite was found in heart but not kidney by histology in some groups (e.g., healthy fish from Fall Creek or FPGL early fish) (Table 18).
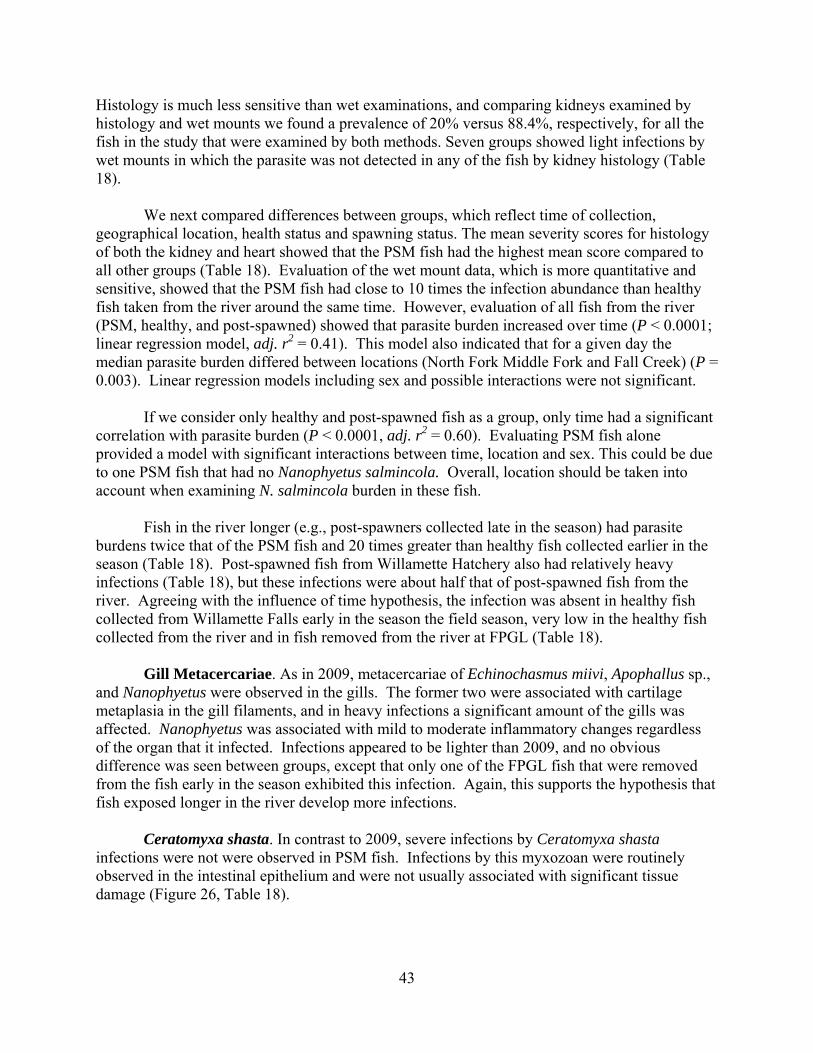
43
Histology is much less sensitive than wet examinations, and comparing kidneys examined by histology and wet mounts we found a prevalence of 20% versus 88.4%, respectively, for all the fish in the study that were examined by both methods. Seven groups showed light infections by wet mounts in which the parasite was not detected in any of the fish by kidney histology (Table 18).
We next compared differences between groups, which reflect time of collection,
geographical location, health status and spawning status. The mean severity scores for histology of both the kidney and heart showed that the PSM fish had the highest mean score compared to all other groups (Table 18). Evaluation of the wet mount data, which is more quantitative and sensitive, showed that the PSM fish had close to 10 times the infection abundance than healthy fish taken from the river around the same time. However, evaluation of all fish from the river (PSM, healthy, and post-spawned) showed that parasite burden increased over time (P < 0.0001; linear regression model, adj. r2 = 0.41). This model also indicated that for a given day the median parasite burden differed between locations (North Fork Middle Fork and Fall Creek) (P = 0.003). Linear regression models including sex and possible interactions were not significant.
If we consider only healthy and post-spawned fish as a group, only time had a significant
correlation with parasite burden (P < 0.0001, adj. r2 = 0.60). Evaluating PSM fish alone provided a model with significant interactions between time, location and sex. This could be due to one PSM fish that had no Nanophyetus salmincola. Overall, location should be taken into account when examining N. salmincola burden in these fish.
Fish in the river longer (e.g., post-spawners collected late in the season) had parasite
burdens twice that of the PSM fish and 20 times greater than healthy fish collected earlier in the season (Table 18). Post-spawned fish from Willamette Hatchery also had relatively heavy infections (Table 18), but these infections were about half that of post-spawned fish from the river. Agreeing with the influence of time hypothesis, the infection was absent in healthy fish collected from Willamette Falls early in the season the field season, very low in the healthy fish collected from the river and in fish removed from the river at FPGL (Table 18).
Gill Metacercariae. As in 2009, metacercariae of Echinochasmus miivi, Apophallus sp.,
and Nanophyetus were observed in the gills. The former two were associated with cartilage metaplasia in the gill filaments, and in heavy infections a significant amount of the gills was affected. Nanophyetus was associated with mild to moderate inflammatory changes regardless of the organ that it infected. Infections appeared to be lighter than 2009, and no obvious difference was seen between groups, except that only one of the FPGL fish that were removed from the fish early in the season exhibited this infection. Again, this supports the hypothesis that fish exposed longer in the river develop more infections.
Ceratomyxa shasta. In contrast to 2009, severe infections by Ceratomyxa shasta infections were not were observed in PSM fish. Infections by this myxozoan were routinely observed in the intestinal epithelium and were not usually associated with significant tissue damage (Figure 26, Table 18).

44
Parvicapsula minibicornis. As in 2009, P. minibicornis was observed in the renal glomeruli and tubules. Almost all of the fish from the river, regardless of healthy, post-spawned, or PSM were infected, and many exhibited prominent glomerular involvement. In contrast, fish removed from the river and held at FPGL had only 30% (early transport) or 27% (late transport) prevalence of infection, and all but two of these fish had light infections. Post-spawned fish from the Willamette Hatchery had 38% prevalence, all with light infections and minimal damage to the glomeruli.
Myxobolus sp. A Myxobolus sp. (possibly M. neurotropus or M. kisutchi) was detected, at times with intense infections, in all groups from the river at about the same severity (Table 18). Interestingly, the PSM fish had the lowest prevalence of this infection (Table 13).
Bacterial Kidney Disease. Inflammatory changes suggestive of bacterial kidney disease (BKD) were seen particularly in fish held at FPGL. Fish were also examined with the ELISA test for antigens for R. salmoninarum, considered to be a more sensitive test than histology. Results between the two tests were comparable (Tables 12-18). Only two of the healthy fish from the river showed BKD related lesions, which were mild and all of these fish showed low ELISA values (Table 12). BKD lesions were detected in only 3 of the 21 kidneys examined from the PSM fish, and 5 fish had high ELISA values (Table 13), including the one fish with the most severe BKD judged by histology. Histological BKD was not detected in the post-spawned river fish, but a few fish showed ELISA positive results, some with a “High” reading. Regarding the Willamette Hatchery, no histological signs of BKD were observed, but ELISA data are not available at this time for these fish.
Gram-negative bacteria. All of the PSM and post spawned fish from the river were dead for some time before submitted for bacterial culture, and various Gram-negative bacteria were isolated all of these fish. Most of these bacteria were saprophytes or considered opportunists, which are common in dead or dying fish. Regarding histology, some fish exhibited bacterial colonies in various organs. However, as all of these fish were dead when they were collected, and it was presumed that this was due to post-mortem colonization of tissues, not anti-mortem infection by pathogenic organisms. Aeromonas salmonicida, the cause of furunculosis, was in cultured from 8 of 27 PSM fish and 1 spawned fish from the river (Tables 13 & 14). Cultures were not done on healthy fish, fish transferred to FPGL, or post-spawners from the Willamette Hatchery. Correlating histological findings between histology with A. salmonicida was difficult histology could not differentiate anti-mortem infections of this bacterium from post-mortem colonization by other Gram-negative bacteria.
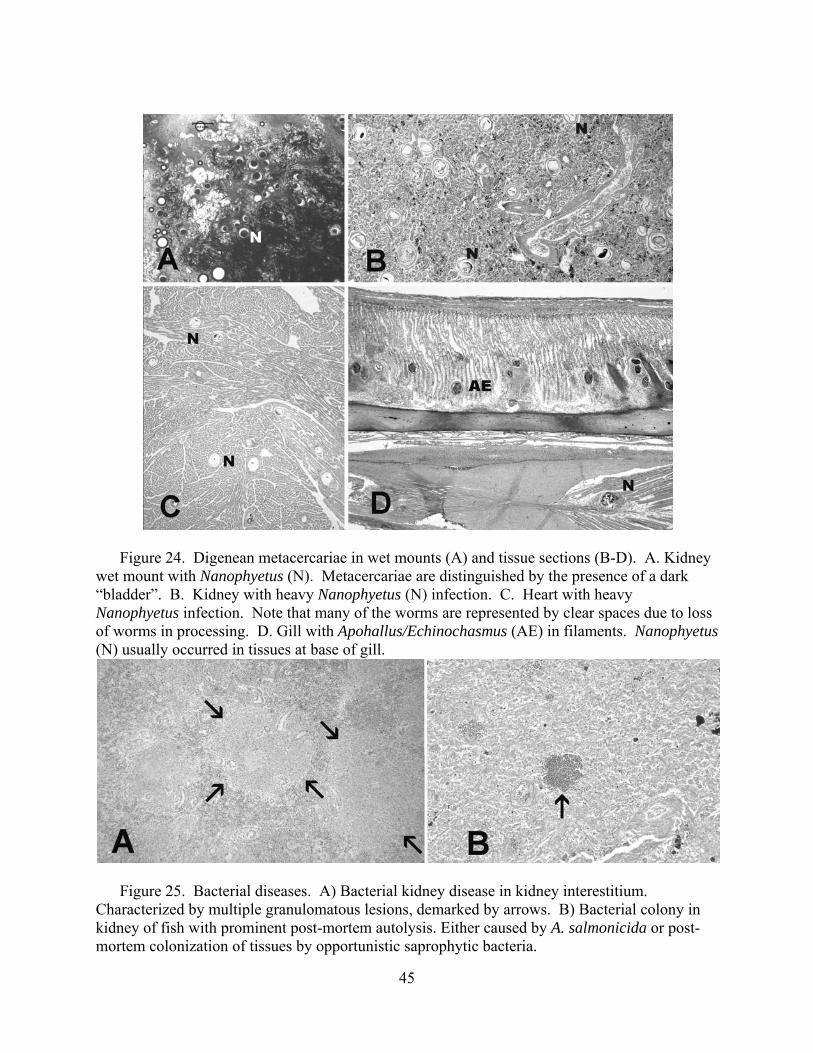
45
Figure 24. Digenean metacercariae in wet mounts (A) and tissue sections (B-D). A. Kidney
wet mount with Nanophyetus (N). Metacercariae are distinguished by the presence of a dark “bladder”. B. Kidney with heavy Nanophyetus (N) infection. C. Heart with heavy Nanophyetus infection. Note that many of the worms are represented by clear spaces due to loss of worms in processing. D. Gill with Apohallus/Echinochasmus (AE) in filaments. Nanophyetus (N) usually occurred in tissues at base of gill.
Figure 25. Bacterial diseases. A) Bacterial kidney disease in kidney interestitium.
Characterized by multiple granulomatous lesions, demarked by arrows. B) Bacterial colony in kidney of fish with prominent post-mortem autolysis. Either caused by A. salmonicida or post-mortem colonization of tissues by opportunistic saprophytic bacteria.
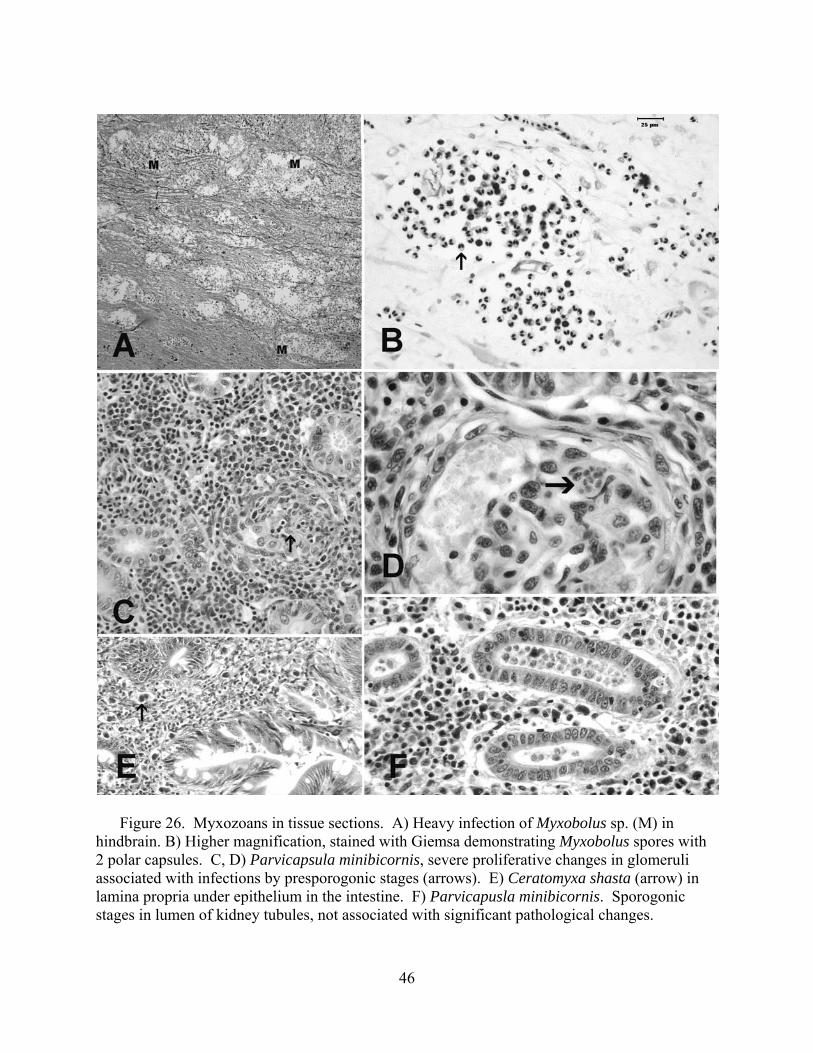
46
Figure 26. Myxozoans in tissue sections. A) Heavy infection of Myxobolus sp. (M) in
hindbrain. B) Higher magnification, stained with Giemsa demonstrating Myxobolus spores with 2 polar capsules. C, D) Parvicapsula minibicornis, severe proliferative changes in glomeruli associated with infections by presporogonic stages (arrows). E) Ceratomyxa shasta (arrow) in lamina propria under epithelium in the intestine. F) Parvicapusla minibicornis. Sporogonic stages in lumen of kidney tubules, not associated with significant pathological changes.
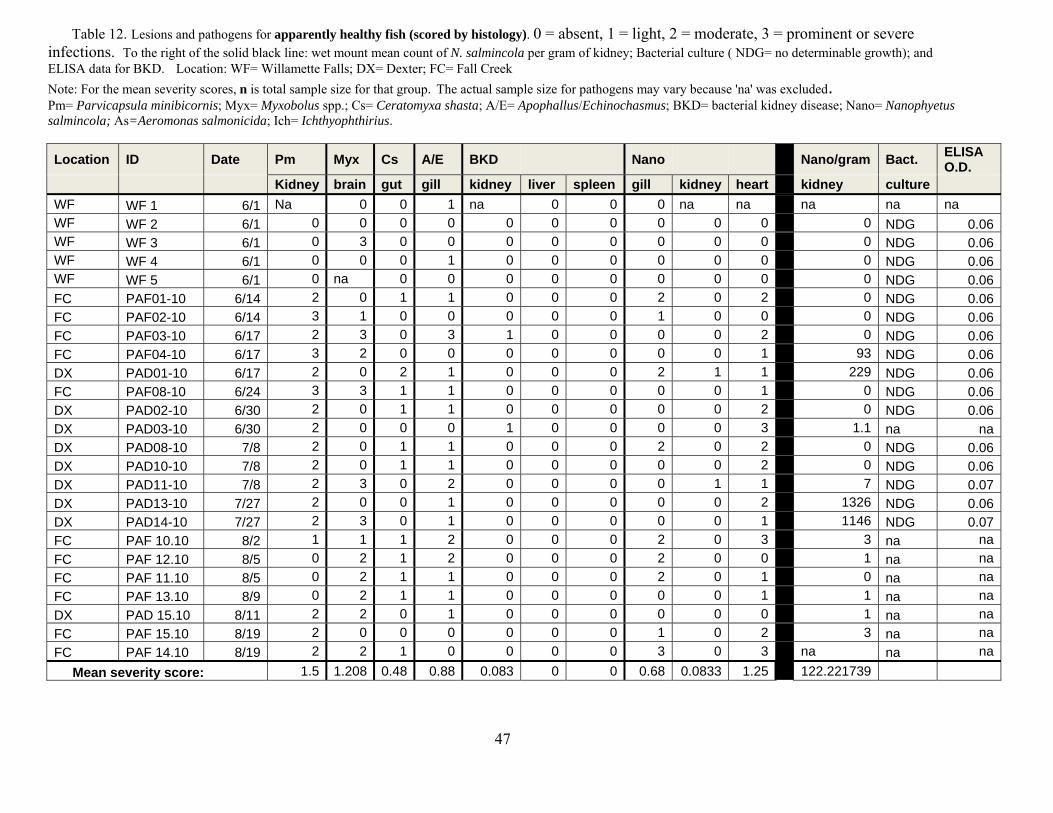
47
Table 12. Lesions and pathogens for apparently healthy fish (scored by histology). 0 = absent, 1 = light, 2 = moderate, 3 = prominent or severe infections. To the right of the solid black line: wet mount mean count of N. salmincola per gram of kidney; Bacterial culture ( NDG= no determinable growth); and ELISA data for BKD. Location: WF= Willamette Falls; DX= Dexter; FC= Fall Creek Note: For the mean severity scores, n is total sample size for that group. The actual sample size for pathogens may vary because 'na' was excluded. Pm= Parvicapsula minibicornis; Myx= Myxobolus spp.; Cs= Ceratomyxa shasta; A/E= Apophallus/Echinochasmus; BKD= bacterial kidney disease; Nano= Nanophyetus salmincola; As=Aeromonas salmonicida; Ich= Ichthyophthirius.
Location ID Date Pm Myx Cs A/E BKD Nano Nano/gram Bact. ELISA O.D.
Kidney brain gut gill kidney liver spleen gill kidney heart kidney cultureWF WF 1 6/1 Na 0 0 1 na 0 0 0 na na na na na WF WF 2 6/1 0 0 0 0 0 0 0 0 0 0 0 NDG 0.06 WF WF 3 6/1 0 3 0 0 0 0 0 0 0 0 0 NDG 0.06 WF WF 4 6/1 0 0 0 1 0 0 0 0 0 0 0 NDG 0.06 WF WF 5 6/1 0 na 0 0 0 0 0 0 0 0 0 NDG 0.06 FC PAF01-10 6/14 2 0 1 1 0 0 0 2 0 2 0 NDG 0.06 FC PAF02-10 6/14 3 1 0 0 0 0 0 1 0 0 0 NDG 0.06 FC PAF03-10 6/17 2 3 0 3 1 0 0 0 0 2 0 NDG 0.06 FC PAF04-10 6/17 3 2 0 0 0 0 0 0 0 1 93 NDG 0.06 DX PAD01-10 6/17 2 0 2 1 0 0 0 2 1 1 229 NDG 0.06 FC PAF08-10 6/24 3 3 1 1 0 0 0 0 0 1 0 NDG 0.06 DX PAD02-10 6/30 2 0 1 1 0 0 0 0 0 2 0 NDG 0.06 DX PAD03-10 6/30 2 0 0 0 1 0 0 0 0 3 1.1 na na DX PAD08-10 7/8 2 0 1 1 0 0 0 2 0 2 0 NDG 0.06 DX PAD10-10 7/8 2 0 1 1 0 0 0 0 0 2 0 NDG 0.06 DX PAD11-10 7/8 2 3 0 2 0 0 0 0 1 1 7 NDG 0.07 DX PAD13-10 7/27 2 0 0 1 0 0 0 0 0 2 1326 NDG 0.06 DX PAD14-10 7/27 2 3 0 1 0 0 0 0 0 1 1146 NDG 0.07 FC PAF 10.10 8/2 1 1 1 2 0 0 0 2 0 3 3 na na FC PAF 12.10 8/5 0 2 1 2 0 0 0 2 0 0 1 na na FC PAF 11.10 8/5 0 2 1 1 0 0 0 2 0 1 0 na na FC PAF 13.10 8/9 0 2 1 1 0 0 0 0 0 1 1 na na DX PAD 15.10 8/11 2 2 0 1 0 0 0 0 0 0 1 na na FC PAF 15.10 8/19 2 0 0 0 0 0 0 1 0 2 3 na na FC PAF 14.10 8/19 2 2 1 0 0 0 0 3 0 3 na na na Mean severity score: 1.5 1.208 0.48 0.88 0.083 0 0 0.68 0.0833 1.25 122.221739
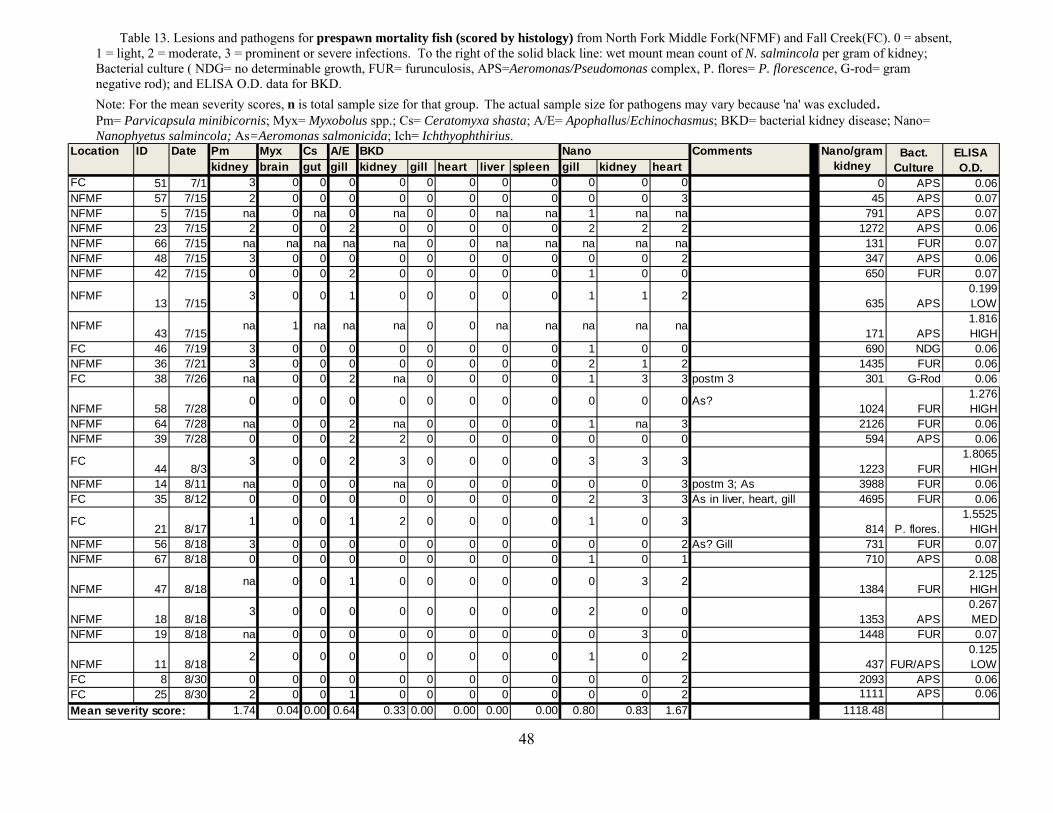
48
Table 13. Lesions and pathogens for prespawn mortality fish (scored by histology) from North Fork Middle Fork(NFMF) and Fall Creek(FC). 0 = absent, 1 = light, 2 = moderate, 3 = prominent or severe infections. To the right of the solid black line: wet mount mean count of N. salmincola per gram of kidney; Bacterial culture ( NDG= no determinable growth, FUR= furunculosis, APS=Aeromonas/Pseudomonas complex, P. flores= P. florescence, G-rod= gram negative rod); and ELISA O.D. data for BKD. Note: For the mean severity scores, n is total sample size for that group. The actual sample size for pathogens may vary because 'na' was excluded. Pm= Parvicapsula minibicornis; Myx= Myxobolus spp.; Cs= Ceratomyxa shasta; A/E= Apophallus/Echinochasmus; BKD= bacterial kidney disease; Nano= Nanophyetus salmincola; As=Aeromonas salmonicida; Ich= Ichthyophthirius.
Location ID Date Pm Myx Cs A/E BKD Nano Commentskidney brain gut gill kidney gill heart liver spleen gill kidney heart
FC 51 7/1 3 0 0 0 0 0 0 0 0 0 0 0 0 APS 0.06NFMF 57 7/15 2 0 0 0 0 0 0 0 0 0 0 3 45 APS 0.07NFMF 5 7/15 na 0 na 0 na 0 0 na na 1 na na 791 APS 0.07NFMF 23 7/15 2 0 0 2 0 0 0 0 0 2 2 2 1272 APS 0.06NFMF 66 7/15 na na na na na 0 0 na na na na na 131 FUR 0.07NFMF 48 7/15 3 0 0 0 0 0 0 0 0 0 0 2 347 APS 0.06NFMF 42 7/15 0 0 0 2 0 0 0 0 0 1 0 0 650 FUR 0.07
NFMF13 7/15
3 0 0 1 0 0 0 0 0 1 1 2635 APS
0.199 LOW
NFMF43 7/15
na 1 na na na 0 0 na na na na na171 APS
1.816 HIGH
FC 46 7/19 3 0 0 0 0 0 0 0 0 1 0 0 690 NDG 0.06NFMF 36 7/21 3 0 0 0 0 0 0 0 0 2 1 2 1435 FUR 0.06FC 38 7/26 na 0 0 2 na 0 0 0 0 1 3 3 postm 3 301 G-Rod 0.06
NFMF 58 7/280 0 0 0 0 0 0 0 0 0 0 0 As?
1024 FUR1.276 HIGH
NFMF 64 7/28 na 0 0 2 na 0 0 0 0 1 na 3 2126 FUR 0.06NFMF 39 7/28 0 0 0 2 2 0 0 0 0 0 0 0 594 APS 0.06
FC44 8/3
3 0 0 2 3 0 0 0 0 3 3 31223 FUR
1.8065 HIGH
NFMF 14 8/11 na 0 0 0 na 0 0 0 0 0 0 3 postm 3; As 3988 FUR 0.06FC 35 8/12 0 0 0 0 0 0 0 0 0 2 3 3 As in liver, heart, gill 4695 FUR 0.06
FC21 8/17
1 0 0 1 2 0 0 0 0 1 0 3814 P. flores.
1.5525 HIGH
NFMF 56 8/18 3 0 0 0 0 0 0 0 0 0 0 2 As? Gill 731 FUR 0.07NFMF 67 8/18 0 0 0 0 0 0 0 0 0 1 0 1 710 APS 0.08
NFMF 47 8/18na 0 0 1 0 0 0 0 0 0 3 2
1384 FUR2.125 HIGH
NFMF 18 8/183 0 0 0 0 0 0 0 0 2 0 0
1353 APS0.267 MED
NFMF 19 8/18 na 0 0 0 0 0 0 0 0 0 3 0 1448 FUR 0.07
NFMF 11 8/182 0 0 0 0 0 0 0 0 1 0 2
437 FUR/APS0.125 LOW
FC 8 8/30 0 0 0 0 0 0 0 0 0 0 0 2 2093 APS 0.06FC 25 8/30 2 0 0 1 0 0 0 0 0 0 0 2 1111 APS 0.06Mean severity score: 1.74 0.04 0.00 0.64 0.33 0.00 0.00 0.00 0.00 0.80 0.83 1.67 1118.48
Bact. Culture
Nano/gram kidney
ELISA O.D.
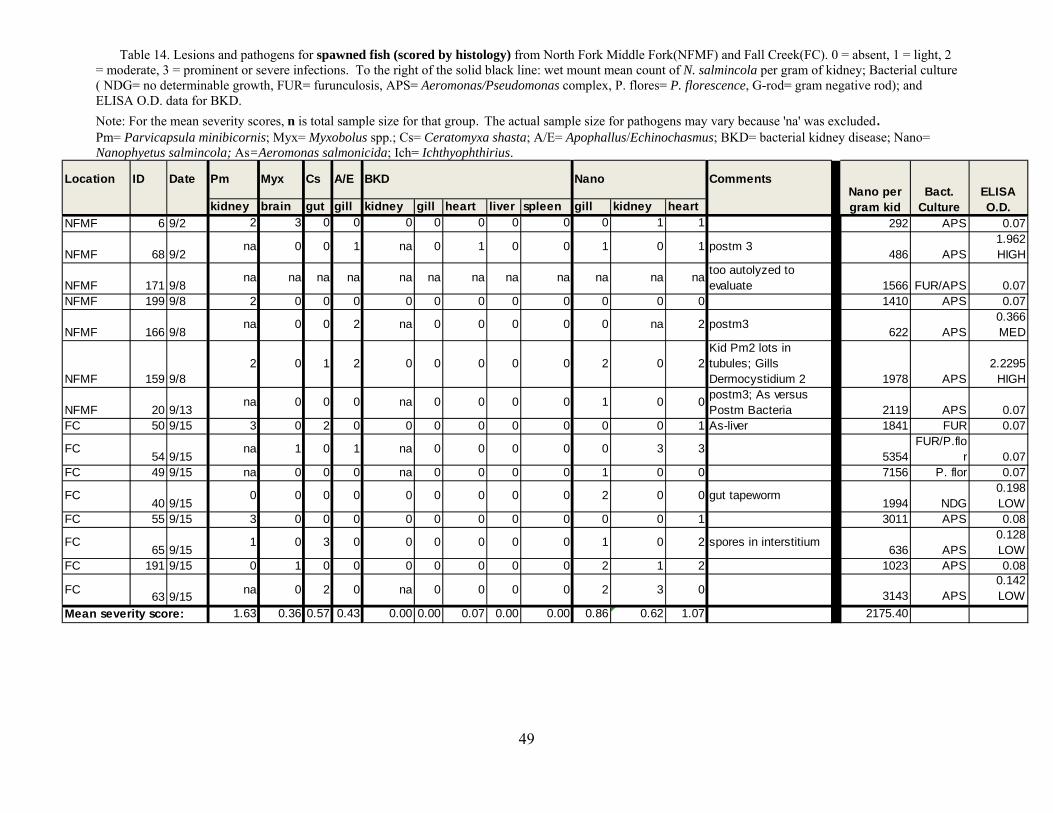
49
Table 14. Lesions and pathogens for spawned fish (scored by histology) from North Fork Middle Fork(NFMF) and Fall Creek(FC). 0 = absent, 1 = light, 2
= moderate, 3 = prominent or severe infections. To the right of the solid black line: wet mount mean count of N. salmincola per gram of kidney; Bacterial culture ( NDG= no determinable growth, FUR= furunculosis, APS= Aeromonas/Pseudomonas complex, P. flores= P. florescence, G-rod= gram negative rod); and ELISA O.D. data for BKD. Note: For the mean severity scores, n is total sample size for that group. The actual sample size for pathogens may vary because 'na' was excluded. Pm= Parvicapsula minibicornis; Myx= Myxobolus spp.; Cs= Ceratomyxa shasta; A/E= Apophallus/Echinochasmus; BKD= bacterial kidney disease; Nano= Nanophyetus salmincola; As=Aeromonas salmonicida; Ich= Ichthyophthirius.
Location ID Date Pm Myx Cs A/E BKD Nano Comments
kidney brain gut gill kidney gill heart liver spleen gill kidney heartNFMF 6 9/2 2 3 0 0 0 0 0 0 0 0 1 1 292 APS 0.07
NFMF 68 9/2na 0 0 1 na 0 1 0 0 1 0 1 postm 3
486 APS1.962 HIGH
NFMF 171 9/8na na na na na na na na na na na na too autolyzed to
evaluate 1566 FUR/APS 0.07NFMF 199 9/8 2 0 0 0 0 0 0 0 0 0 0 0 1410 APS 0.07
NFMF 166 9/8na 0 0 2 na 0 0 0 0 0 na 2 postm3
622 APS0.366 MED
NFMF 159 9/82 0 1 2 0 0 0 0 0 2 0 2
Kid Pm2 lots in tubules; Gills Dermocystidium 2 1978 APS
2.2295 HIGH
NFMF 20 9/13na 0 0 0 na 0 0 0 0 1 0 0 postm3; As versus
Postm Bacteria 2119 APS 0.07FC 50 9/15 3 0 2 0 0 0 0 0 0 0 0 1 As-liver 1841 FUR 0.07
FC54 9/15
na 1 0 1 na 0 0 0 0 0 3 35354
FUR/P.flor 0.07
FC 49 9/15 na 0 0 0 na 0 0 0 0 1 0 0 7156 P. flor 0.07
FC40 9/15
0 0 0 0 0 0 0 0 0 2 0 0 gut tapeworm1994 NDG
0.198 LOW
FC 55 9/15 3 0 0 0 0 0 0 0 0 0 0 1 3011 APS 0.08
FC65 9/15
1 0 3 0 0 0 0 0 0 1 0 2 spores in interstitium636 APS
0.128 LOW
FC 191 9/15 0 1 0 0 0 0 0 0 0 2 1 2 1023 APS 0.08
FC 63 9/15 na 0 2 0 na 0 0 0 0 2 3 0 3143 APS0.142 LOW
Mean severity score: 1.63 0.36 0.57 0.43 0.00 0.00 0.07 0.00 0.00 0.86 0.62 1.07 2175.40
Nano per gram kid
Bact. Culture
ELISA O.D.
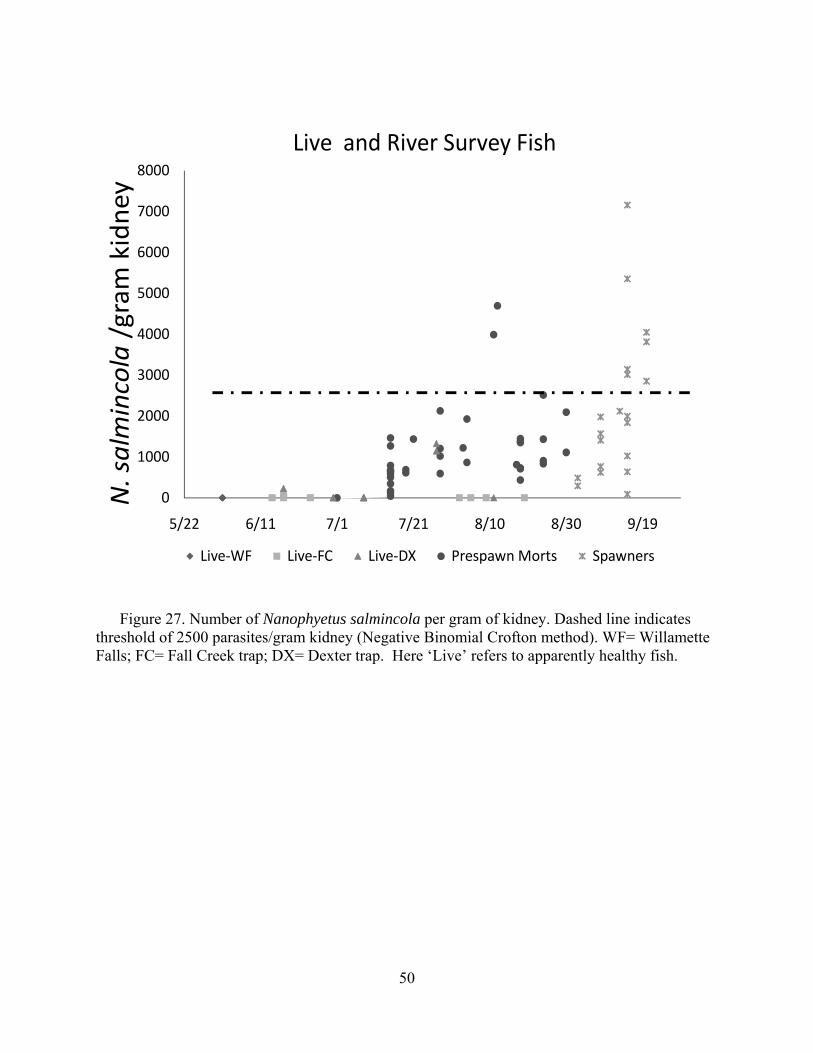
50
0
1000
2000
3000
4000
5000
6000
7000
8000
5/22 6/11 7/1 7/21 8/10 8/30 9/19
Live‐WF Live‐FC Live‐DX Prespawn Morts Spawners
Live and River Survey FishN. salmincola/gram kidne
y
Figure 27. Number of Nanophyetus salmincola per gram of kidney. Dashed line indicates
threshold of 2500 parasites/gram kidney (Negative Binomial Crofton method). WF= Willamette Falls; FC= Fall Creek trap; DX= Dexter trap. Here ‘Live’ refers to apparently healthy fish.
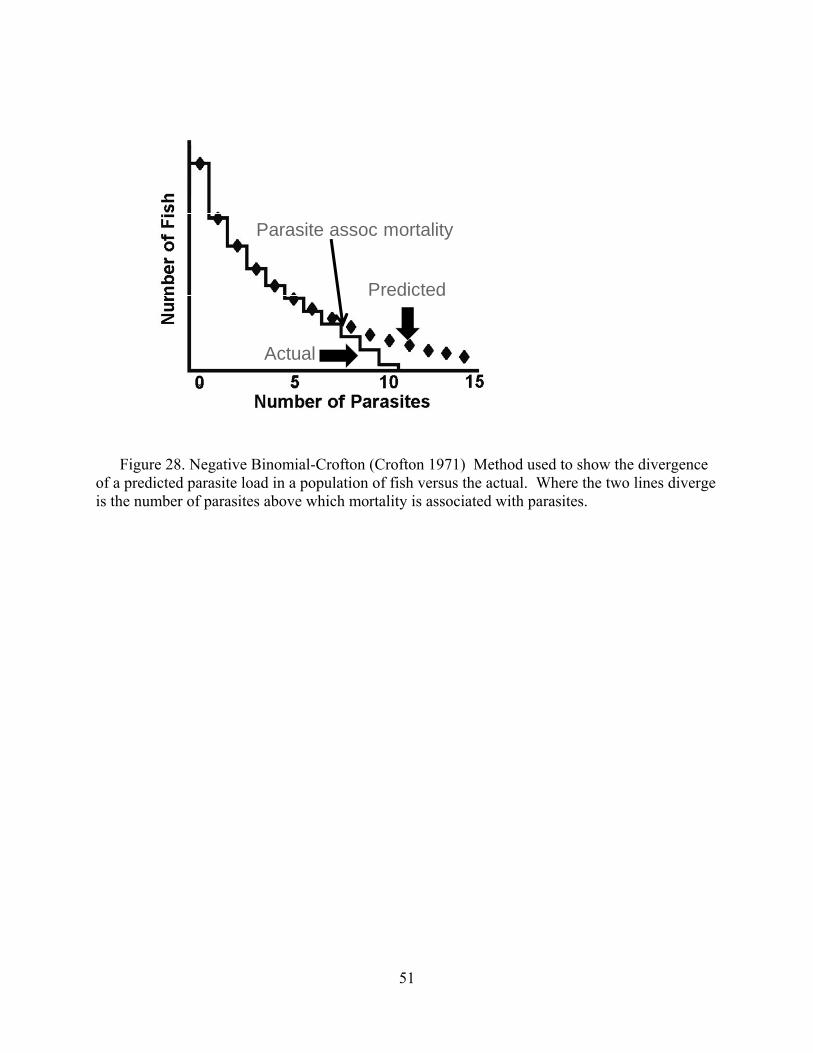
51
Actual
Predicted
Parasite assoc mortality
Figure 28. Negative Binomial-Crofton (Crofton 1971) Method used to show the divergence
of a predicted parasite load in a population of fish versus the actual. Where the two lines diverge is the number of parasites above which mortality is associated with parasites.
52
Parasite Free Holding to Reduce Prespawn Mortality
Both sexes of fish were represented fairly equally overall across the treatment groups assessed at the FPGL, but sex ratios differed between groups due to the random nature of our collections (Table 15). There was no statistical difference in survival to spawning between those fish collected at Fall Creek or Dexter. However, the data are suggestive that fish collected earlier in the run appear to have had greater survival than those collected later in the run (Figure 29). The survival was also not significantly different between the sexes. In addition, the fish held at the FPGL clearly had significantly greater survival to spawning than those outplanted into the wild, by nearly double.
Fertilization and survival to swim-up of the progeny of females allowed to mature at the
FPGL were good, not differing between females from different collection sites or collection dates (Figure 30). The variation between females is typical of what one would expect across a hatchery broodstock.
Fish brought to the FPGL from Dexter and Fall Creek had parasites species lesions
typical for fish collected from the rivers (Table 16). However, the severity of infection and extent of lesions was considerably lower in the fish held at the FPGL, for both those that survived to spawn and those that experience prespawn mortality than comparable groups of fish that had been outplanted. This can be visualized by comparing number of Nanophyetus per gram of kidney in “early” and “late” fish held at the FPGL with those outplanted into Fall Creek or the North Fork Middle Fork (Figure 31).
The parasites in Chinook salmon broodstock that survived to spawn at Willamette Hatchery were also specious (Table 17). While Renebacterium salmoninarum, the causative agent of bacterial kidney disease, was not apparent at the histological level in these fish, the ODFW was able to document their presence via ELISA. The severity of infection in the successful broodstock was similar to that of the fish transported to the FPGL later in the run (Table 16b).
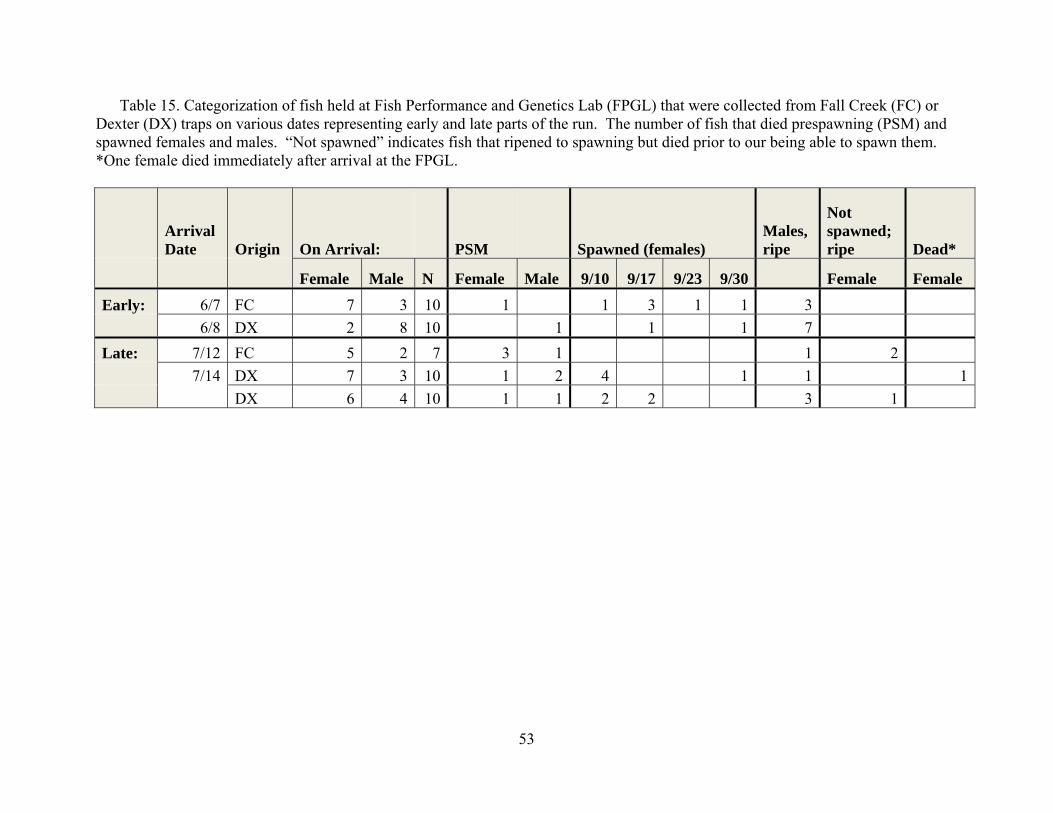
53
Table 15. Categorization of fish held at Fish Performance and Genetics Lab (FPGL) that were collected from Fall Creek (FC) or Dexter (DX) traps on various dates representing early and late parts of the run. The number of fish that died prespawning (PSM) and spawned females and males. “Not spawned” indicates fish that ripened to spawning but died prior to our being able to spawn them. *One female died immediately after arrival at the FPGL.
Arrival Date Origin On Arrival: PSM Spawned (females)
Males, ripe
Not spawned; ripe Dead*
Female Male N Female Male 9/10 9/17 9/23 9/30 Female Female
Early: 6/7 FC 7 3 10 1 1 3 1 1 3 6/8 DX 2 8 10 1 1 1 7 Late: 7/12 FC 5 2 7 3 1 1 2 7/14 DX 7 3 10 1 2 4 1 1 1 DX 6 4 10 1 1 2 2 3 1
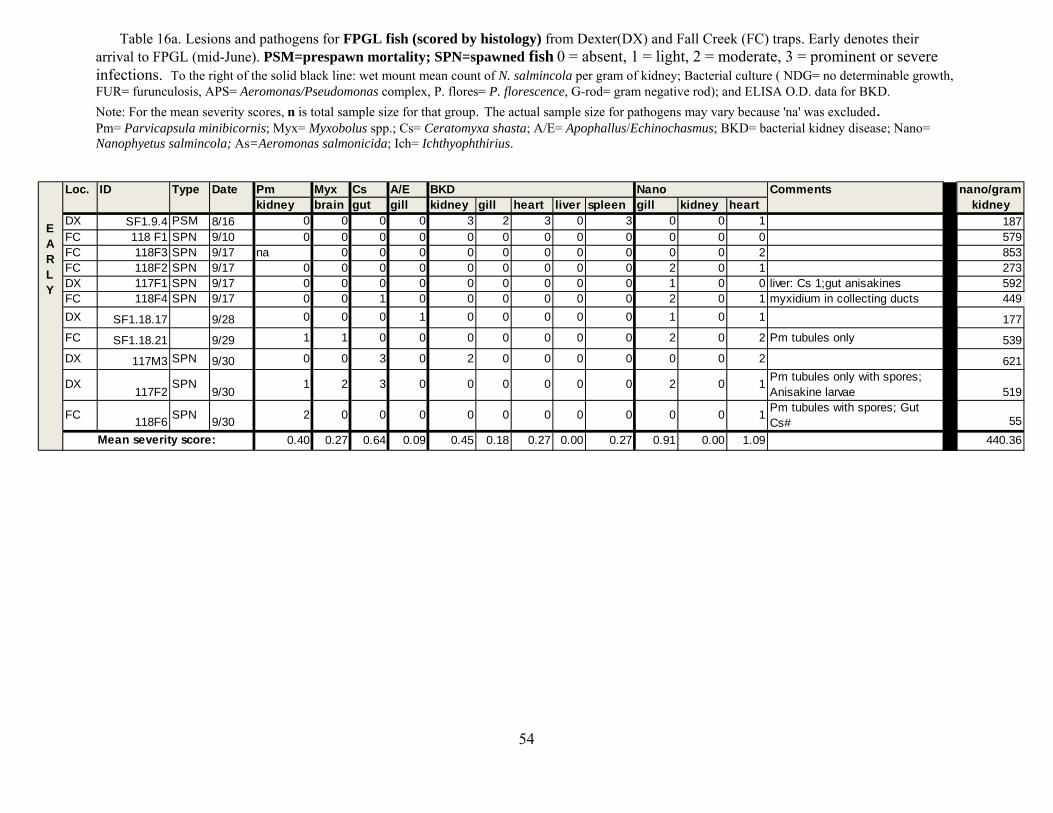
54
Table 16a. Lesions and pathogens for FPGL fish (scored by histology) from Dexter(DX) and Fall Creek (FC) traps. Early denotes their arrival to FPGL (mid-June). PSM=prespawn mortality; SPN=spawned fish 0 = absent, 1 = light, 2 = moderate, 3 = prominent or severe infections. To the right of the solid black line: wet mount mean count of N. salmincola per gram of kidney; Bacterial culture ( NDG= no determinable growth, FUR= furunculosis, APS= Aeromonas/Pseudomonas complex, P. flores= P. florescence, G-rod= gram negative rod); and ELISA O.D. data for BKD. Note: For the mean severity scores, n is total sample size for that group. The actual sample size for pathogens may vary because 'na' was excluded. Pm= Parvicapsula minibicornis; Myx= Myxobolus spp.; Cs= Ceratomyxa shasta; A/E= Apophallus/Echinochasmus; BKD= bacterial kidney disease; Nano= Nanophyetus salmincola; As=Aeromonas salmonicida; Ich= Ichthyophthirius.
Loc. ID Type Date Pm Myx Cs A/E BKD Nano Commentskidney brain gut gill kidney gill heart liver spleen gill kidney heart
DX SF1.9.4 PSM 8/16 0 0 0 0 3 2 3 0 3 0 0 1 187FC 118 F1 SPN 9/10 0 0 0 0 0 0 0 0 0 0 0 0 579FC 118F3 SPN 9/17 na 0 0 0 0 0 0 0 0 0 0 2 853FC 118F2 SPN 9/17 0 0 0 0 0 0 0 0 0 2 0 1 273DX 117F1 SPN 9/17 0 0 0 0 0 0 0 0 0 1 0 0 liver: Cs 1;gut anisakines 592FC 118F4 SPN 9/17 0 0 1 0 0 0 0 0 0 2 0 1 myxidium in collecting ducts 449DX SF1.18.17 9/28 0 0 0 1 0 0 0 0 0 1 0 1 177FC SF1.18.21 9/29 1 1 0 0 0 0 0 0 0 2 0 2 Pm tubules only 539DX 117M3 SPN 9/30 0 0 3 0 2 0 0 0 0 0 0 2 621
DX117F2
SPN9/30
1 2 3 0 0 0 0 0 0 2 0 1 Pm tubules only with spores; Anisakine larvae 519
FC 118F6 SPN 9/30 2 0 0 0 0 0 0 0 0 0 0 1 Pm tubules with spores; Gut Cs# 55
0.40 0.27 0.64 0.09 0.45 0.18 0.27 0.00 0.27 0.91 0.00 1.09 440.36
EARLY
Mean severity score:
nano/gram kidney
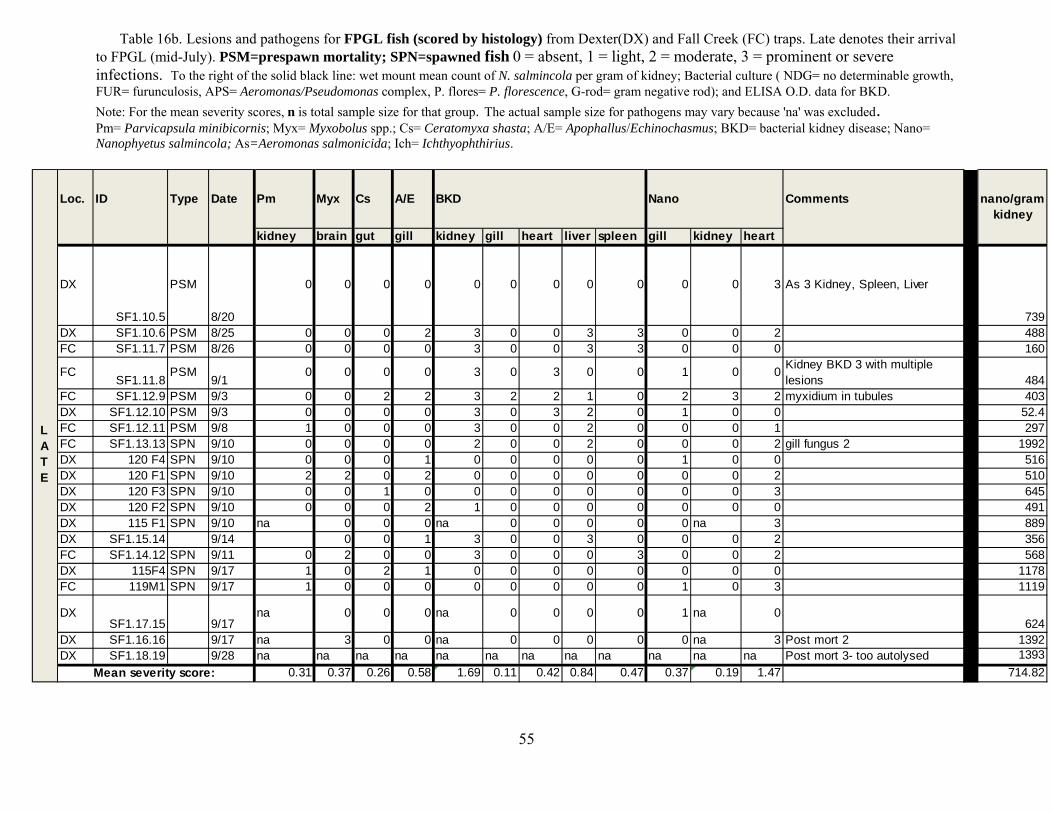
55
Table 16b. Lesions and pathogens for FPGL fish (scored by histology) from Dexter(DX) and Fall Creek (FC) traps. Late denotes their arrival to FPGL (mid-July). PSM=prespawn mortality; SPN=spawned fish 0 = absent, 1 = light, 2 = moderate, 3 = prominent or severe infections. To the right of the solid black line: wet mount mean count of N. salmincola per gram of kidney; Bacterial culture ( NDG= no determinable growth, FUR= furunculosis, APS= Aeromonas/Pseudomonas complex, P. flores= P. florescence, G-rod= gram negative rod); and ELISA O.D. data for BKD. Note: For the mean severity scores, n is total sample size for that group. The actual sample size for pathogens may vary because 'na' was excluded. Pm= Parvicapsula minibicornis; Myx= Myxobolus spp.; Cs= Ceratomyxa shasta; A/E= Apophallus/Echinochasmus; BKD= bacterial kidney disease; Nano= Nanophyetus salmincola; As=Aeromonas salmonicida; Ich= Ichthyophthirius.
Loc. ID Type Date Pm Myx Cs A/E BKD Nano Comments
kidney brain gut gill kidney gill heart liver spleen gill kidney heart
DX
SF1.10.5
PSM
8/20
0 0 0 0 0 0 0 0 0 0 0 3 As 3 Kidney, Spleen, Liver
739DX SF1.10.6 PSM 8/25 0 0 0 2 3 0 0 3 3 0 0 2 488FC SF1.11.7 PSM 8/26 0 0 0 0 3 0 0 3 3 0 0 0 160
FCSF1.11.8
PSM9/1
0 0 0 0 3 0 3 0 0 1 0 0 Kidney BKD 3 with multiple lesions 484
FC SF1.12.9 PSM 9/3 0 0 2 2 3 2 2 1 0 2 3 2 myxidium in tubules 403DX SF1.12.10 PSM 9/3 0 0 0 0 3 0 3 2 0 1 0 0 52.4FC SF1.12.11 PSM 9/8 1 0 0 0 3 0 0 2 0 0 0 1 297FC SF1.13.13 SPN 9/10 0 0 0 0 2 0 0 2 0 0 0 2 gill fungus 2 1992DX 120 F4 SPN 9/10 0 0 0 1 0 0 0 0 0 1 0 0 516DX 120 F1 SPN 9/10 2 2 0 2 0 0 0 0 0 0 0 2 510DX 120 F3 SPN 9/10 0 0 1 0 0 0 0 0 0 0 0 3 645DX 120 F2 SPN 9/10 0 0 0 2 1 0 0 0 0 0 0 0 491DX 115 F1 SPN 9/10 na 0 0 0 na 0 0 0 0 0 na 3 889DX SF1.15.14 9/14 0 0 1 3 0 0 3 0 0 0 2 356FC SF1.14.12 SPN 9/11 0 2 0 0 3 0 0 0 3 0 0 2 568DX 115F4 SPN 9/17 1 0 2 1 0 0 0 0 0 0 0 0 1178FC 119M1 SPN 9/17 1 0 0 0 0 0 0 0 0 1 0 3 1119
DXSF1.17.15 9/17
na 0 0 0 na 0 0 0 0 1 na 0624
DX SF1.16.16 9/17 na 3 0 0 na 0 0 0 0 0 na 3 Post mort 2 1392DX SF1.18.19 9/28 na na na na na na na na na na na na Post mort 3- too autolysed 1393
0.31 0.37 0.26 0.58 1.69 0.11 0.42 0.84 0.47 0.37 0.19 1.47 714.82
LATE
Mean severity score:
nano/gram kidney
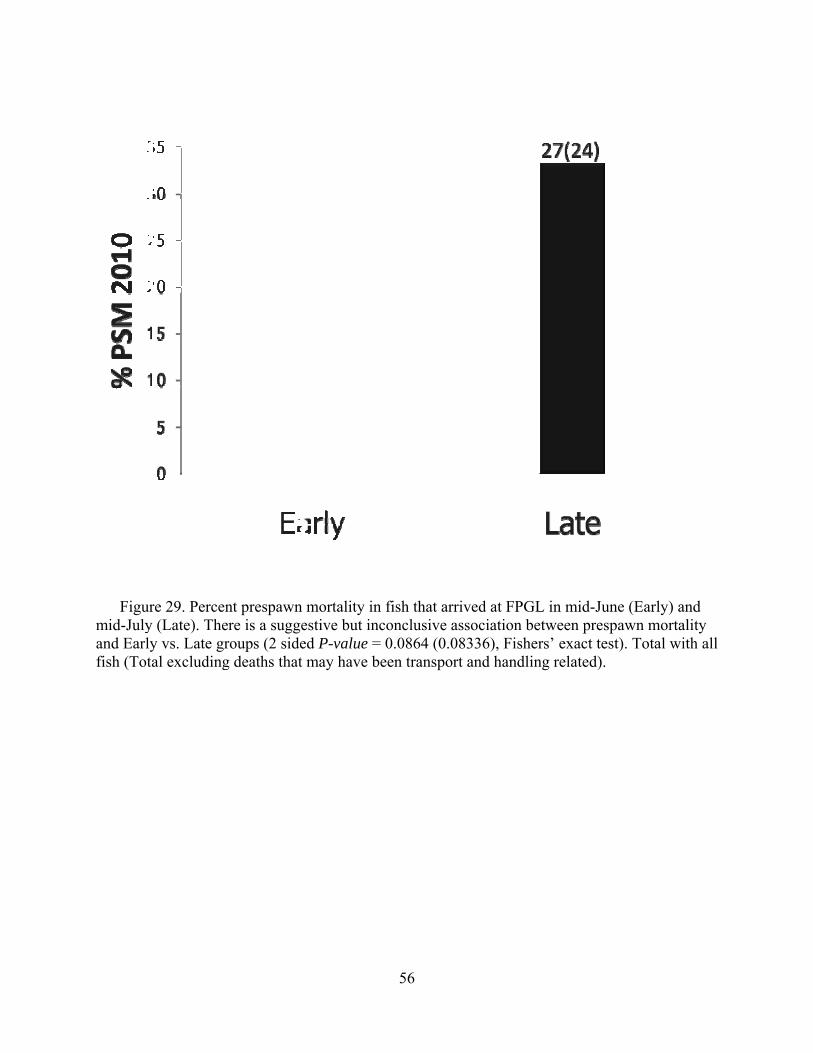
Figur
mid-Julyand Earlyfish (Tota
re 29. Perceny (Late). They vs. Late gral excluding
nt prespawn re is a sugge
roups (2 sideg deaths that
mortality inestive but inced P-value =may have b
56
n fish that arrconclusive a
= 0.0864 (0.0een transpor
rived at FPGassociation b08336), Fishert and handli
GL in mid-Jubetween presers’ exact teing related).
une (Early) aspawn mortast). Total wi
and ality ith all
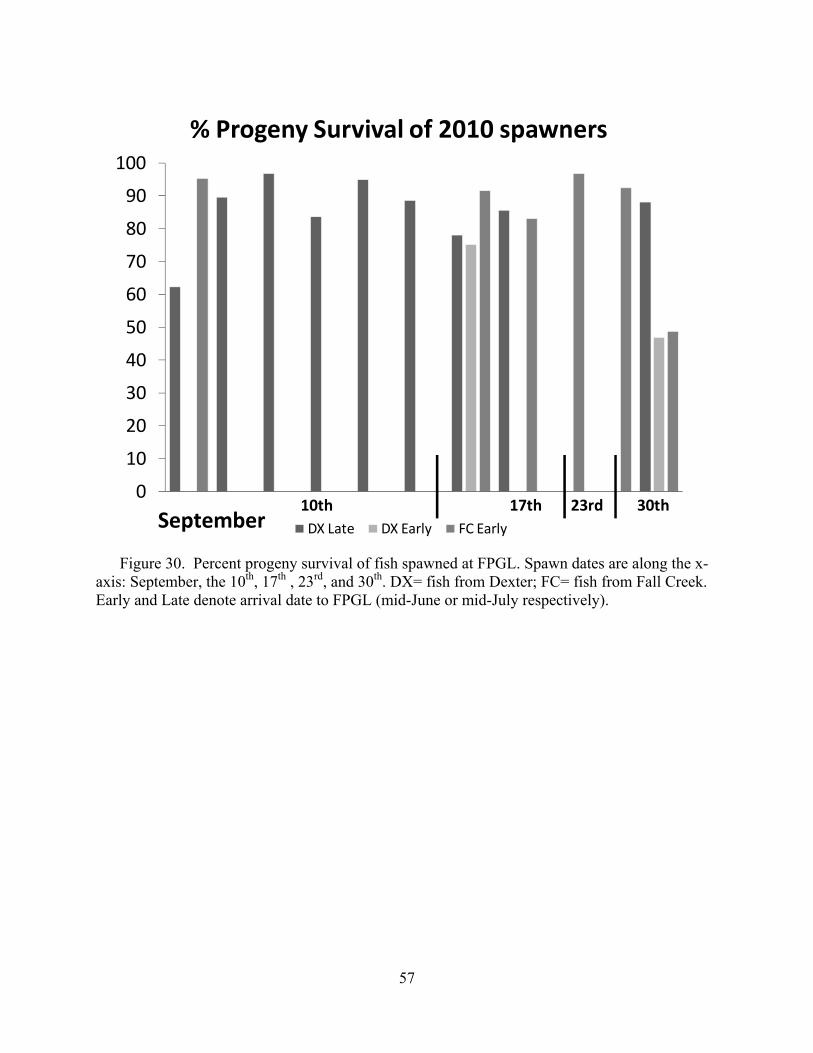
57
0
10
20
30
40
50
60
70
80
90
100
% Progeny Survival of 2010 spawners
DX Late DX Early FC Early
10th 17th 30th23rdSeptember
Fish Performance & Genetics Lab 2010 Figure 30. Percent progeny survival of fish spawned at FPGL. Spawn dates are along the x-
axis: September, the 10th, 17th , 23rd, and 30th. DX= fish from Dexter; FC= fish from Fall Creek. Early and Late denote arrival date to FPGL (mid-June or mid-July respectively).
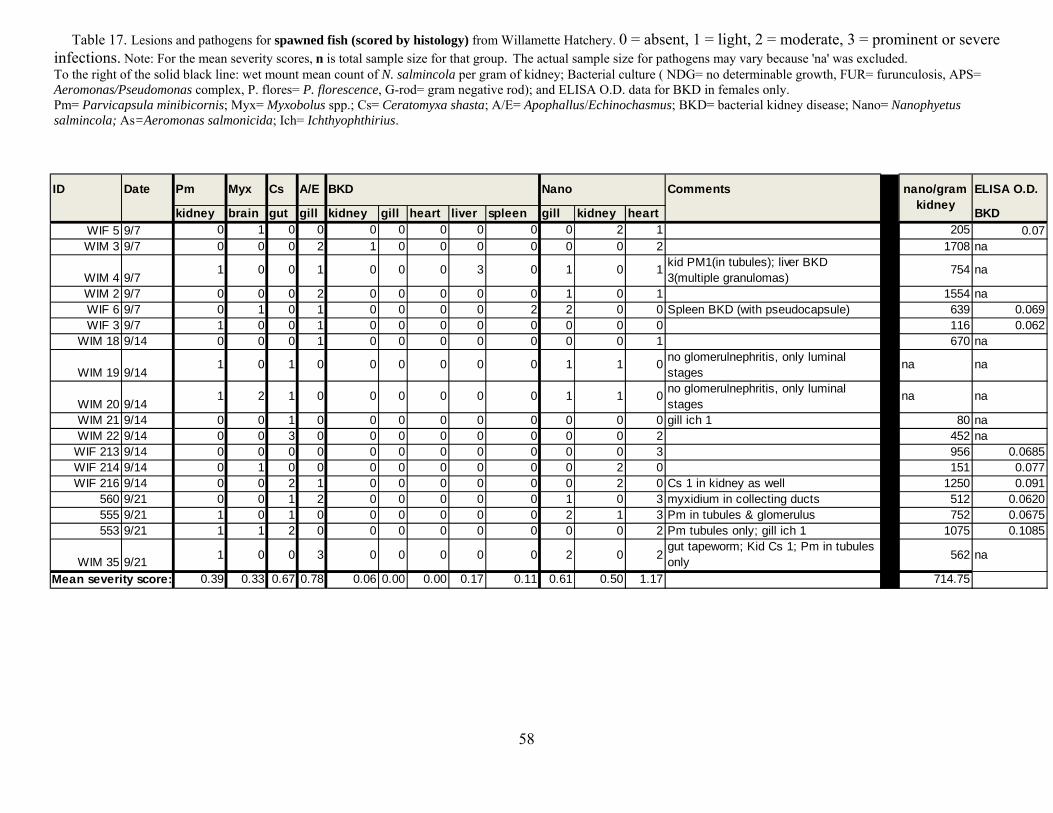
58
Table 17. Lesions and pathogens for spawned fish (scored by histology) from Willamette Hatchery. 0 = absent, 1 = light, 2 = moderate, 3 = prominent or severe infections. Note: For the mean severity scores, n is total sample size for that group. The actual sample size for pathogens may vary because 'na' was excluded. To the right of the solid black line: wet mount mean count of N. salmincola per gram of kidney; Bacterial culture ( NDG= no determinable growth, FUR= furunculosis, APS= Aeromonas/Pseudomonas complex, P. flores= P. florescence, G-rod= gram negative rod); and ELISA O.D. data for BKD in females only. Pm= Parvicapsula minibicornis; Myx= Myxobolus spp.; Cs= Ceratomyxa shasta; A/E= Apophallus/Echinochasmus; BKD= bacterial kidney disease; Nano= Nanophyetus salmincola; As=Aeromonas salmonicida; Ich= Ichthyophthirius.
ID Date Pm Myx Cs A/E BKD Nano Comments ELISA O.D.
kidney brain gut gill kidney gill heart liver spleen gill kidney heart BKDWIF 5 9/7 0 1 0 0 0 0 0 0 0 0 2 1 205 0.07WIM 3 9/7 0 0 0 2 1 0 0 0 0 0 0 2 1708 na
WIM 4 9/71 0 0 1 0 0 0 3 0 1 0 1 kid PM1(in tubules); liver BKD
3(multiple granulomas)754 na
WIM 2 9/7 0 0 0 2 0 0 0 0 0 1 0 1 1554 naWIF 6 9/7 0 1 0 1 0 0 0 0 2 2 0 0 Spleen BKD (with pseudocapsule) 639 0.069WIF 3 9/7 1 0 0 1 0 0 0 0 0 0 0 0 116 0.062
WIM 18 9/14 0 0 0 1 0 0 0 0 0 0 0 1 670 na
WIM 19 9/141 0 1 0 0 0 0 0 0 1 1 0 no glomerulnephritis, only luminal
stagesna na
WIM 20 9/141 2 1 0 0 0 0 0 0 1 1 0 no glomerulnephritis, only luminal
stagesna na
WIM 21 9/14 0 0 1 0 0 0 0 0 0 0 0 0 gill ich 1 80 naWIM 22 9/14 0 0 3 0 0 0 0 0 0 0 0 2 452 na
WIF 213 9/14 0 0 0 0 0 0 0 0 0 0 0 3 956 0.0685WIF 214 9/14 0 1 0 0 0 0 0 0 0 0 2 0 151 0.077WIF 216 9/14 0 0 2 1 0 0 0 0 0 0 2 0 Cs 1 in kidney as well 1250 0.091
560 9/21 0 0 1 2 0 0 0 0 0 1 0 3 myxidium in collecting ducts 512 0.0620555 9/21 1 0 1 0 0 0 0 0 0 2 1 3 Pm in tubules & glomerulus 752 0.0675553 9/21 1 1 2 0 0 0 0 0 0 0 0 2 Pm tubules only; gill ich 1 1075 0.1085
WIM 35 9/21 1 0 0 3 0 0 0 0 0 2 0 2gut tapeworm; Kid Cs 1; Pm in tubules only 562 na
0.39 0.33 0.67 0.78 0.06 0.00 0.00 0.17 0.11 0.61 0.50 1.17 714.75Mean severity score:
nano/gram kidney

59
N. salmincola/gram
kidne
y
0
1000
2000
3000
4000
5000
6000
7000
8000
7/1 7/21 8/10 8/30 9/19 10/9
Prespawn Morts
Spawners
0
1000
2000
3000
4000
5000
6000
7000
8000
6/21 8/10 9/29
RiverFish Performance &
Genetics Lab
Figure 31. Number of Nanophyetus. salmincola per gram of kidney for fish from the river
and the Fish Performance and Genetics Laboratory for both fish that survived (Spawners) and did not survive (Prespawn Morts) assessed over various dates.
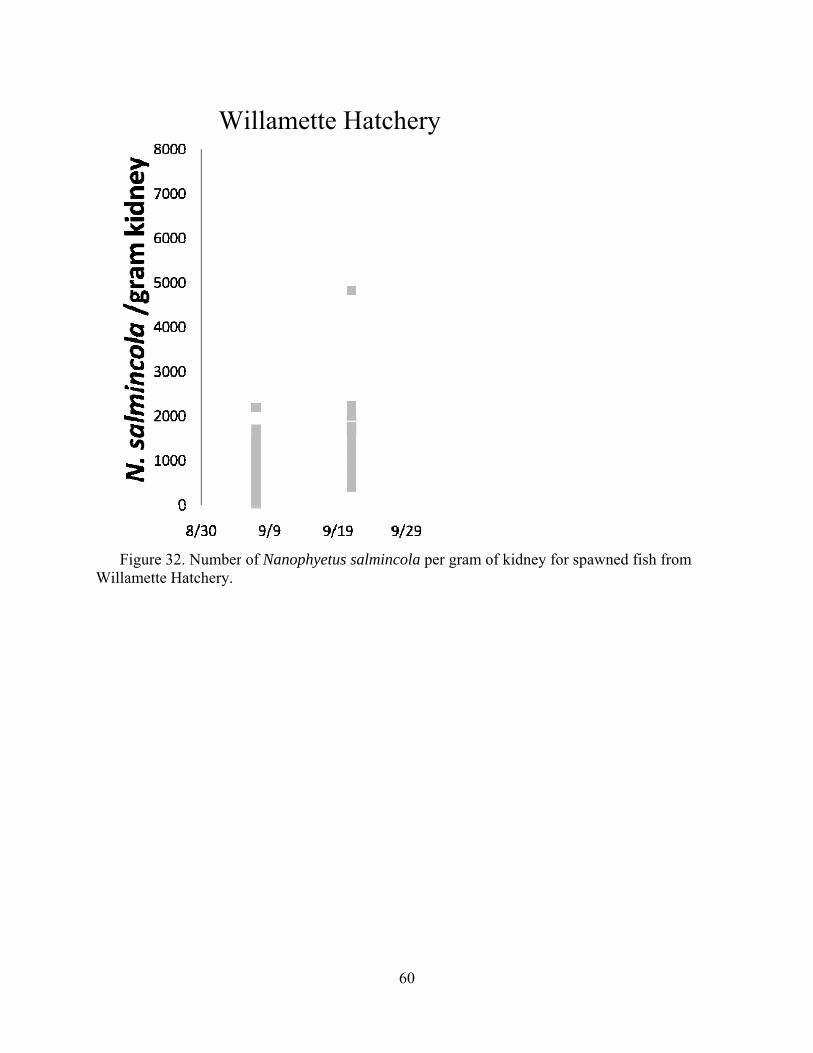
FigurWillamet
re 32. Numbtte Hatchery
W
ber of Nanopy.
Willame
phyetus salm
ette Hat
60
incola per g
tchery
gram of kidneey for spawnned fish fromm
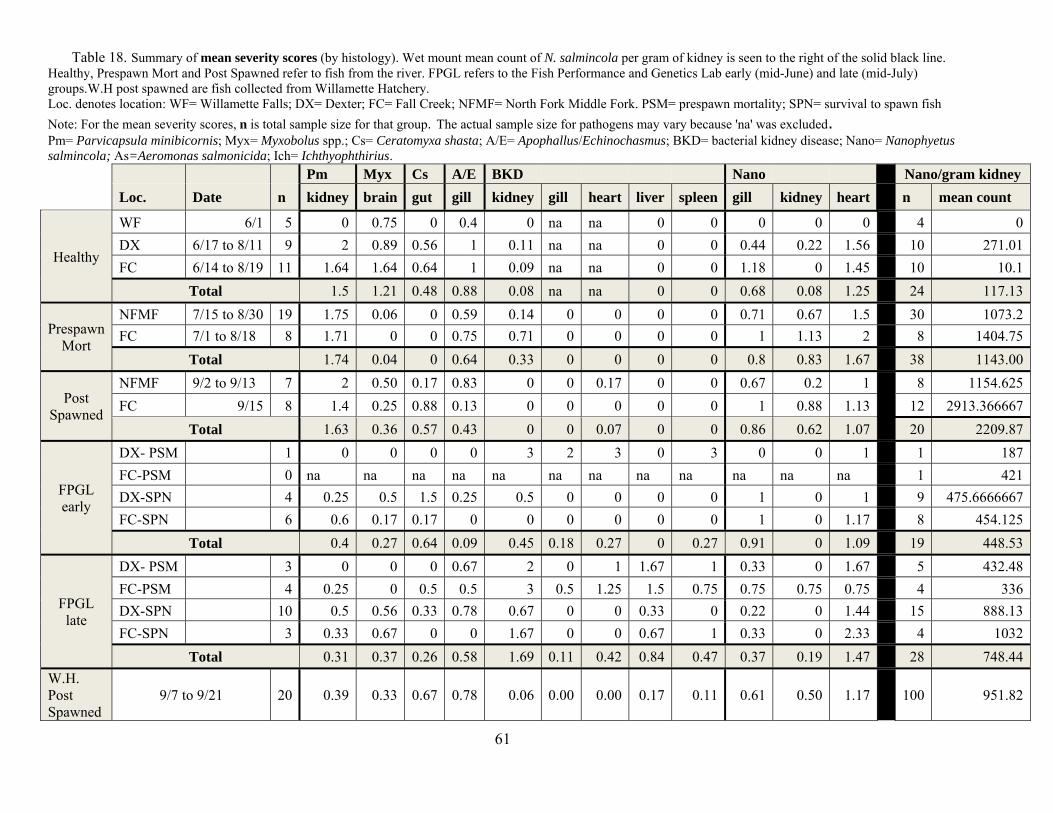
61
Table 18. Summary of mean severity scores (by histology). Wet mount mean count of N. salmincola per gram of kidney is seen to the right of the solid black line. Healthy, Prespawn Mort and Post Spawned refer to fish from the river. FPGL refers to the Fish Performance and Genetics Lab early (mid-June) and late (mid-July) groups.W.H post spawned are fish collected from Willamette Hatchery. Loc. denotes location: WF= Willamette Falls; DX= Dexter; FC= Fall Creek; NFMF= North Fork Middle Fork. PSM= prespawn mortality; SPN= survival to spawn fish Note: For the mean severity scores, n is total sample size for that group. The actual sample size for pathogens may vary because 'na' was excluded. Pm= Parvicapsula minibicornis; Myx= Myxobolus spp.; Cs= Ceratomyxa shasta; A/E= Apophallus/Echinochasmus; BKD= bacterial kidney disease; Nano= Nanophyetus salmincola; As=Aeromonas salmonicida; Ich= Ichthyophthirius.
Pm Myx Cs A/E BKD Nano Nano/gram kidney Loc. Date n kidney brain gut gill kidney gill heart liver spleen gill kidney heart n mean count
Healthy
WF 6/1 5 0 0.75 0 0.4 0 na na 0 0 0 0 0 4 0 DX 6/17 to 8/11 9 2 0.89 0.56 1 0.11 na na 0 0 0.44 0.22 1.56 10 271.01 FC 6/14 to 8/19 11 1.64 1.64 0.64 1 0.09 na na 0 0 1.18 0 1.45 10 10.1
Total 1.5 1.21 0.48 0.88 0.08 na na 0 0 0.68 0.08 1.25 24 117.13
Prespawn Mort
NFMF 7/15 to 8/30 19 1.75 0.06 0 0.59 0.14 0 0 0 0 0.71 0.67 1.5 30 1073.2 FC 7/1 to 8/18 8 1.71 0 0 0.75 0.71 0 0 0 0 1 1.13 2 8 1404.75
Total 1.74 0.04 0 0.64 0.33 0 0 0 0 0.8 0.83 1.67 38 1143.00
Post Spawned
NFMF 9/2 to 9/13 7 2 0.50 0.17 0.83 0 0 0.17 0 0 0.67 0.2 1 8 1154.625 FC 9/15 8 1.4 0.25 0.88 0.13 0 0 0 0 0 1 0.88 1.13 12 2913.366667
Total 1.63 0.36 0.57 0.43 0 0 0.07 0 0 0.86 0.62 1.07 20 2209.87
FPGL early
DX- PSM 1 0 0 0 0 3 2 3 0 3 0 0 1 1 187 FC-PSM 0 na na na na na na na na na na na na 1 421 DX-SPN 4 0.25 0.5 1.5 0.25 0.5 0 0 0 0 1 0 1 9 475.6666667 FC-SPN 6 0.6 0.17 0.17 0 0 0 0 0 0 1 0 1.17 8 454.125
Total 0.4 0.27 0.64 0.09 0.45 0.18 0.27 0 0.27 0.91 0 1.09 19 448.53
FPGL late
DX- PSM 3 0 0 0 0.67 2 0 1 1.67 1 0.33 0 1.67 5 432.48 FC-PSM 4 0.25 0 0.5 0.5 3 0.5 1.25 1.5 0.75 0.75 0.75 0.75 4 336 DX-SPN 10 0.5 0.56 0.33 0.78 0.67 0 0 0.33 0 0.22 0 1.44 15 888.13 FC-SPN 3 0.33 0.67 0 0 1.67 0 0 0.67 1 0.33 0 2.33 4 1032
Total 0.31 0.37 0.26 0.58 1.69 0.11 0.42 0.84 0.47 0.37 0.19 1.47 28 748.44 W.H. Post Spawned
9/7 to 9/21 20 0.39 0.33 0.67 0.78 0.06 0.00 0.00 0.17 0.11 0.61 0.50 1.17 100 951.82
62
Discussion
We successfully addressed the primary study objectives for the 2010 field season. Below, we discuss some general aspects of the study year, and then the relationship between condition and spawning success, the influence of holding on spawning success, evidence of environmental effects, and the results of the disease screenings. We conclude with management implications.
We were able to assess the energetic condition of the two study populations based on
sample sizes of 200 fish at Fall Creek and 292 fish at Dexter Dam. Sampling at Fall Creek was more representative of the timing of the run than at Dexter. This was due to the operations of the trap as part of the broodstock collections for Willamette Hatchery. The ladder at Dexter Dam was not opened until mid-June, when a large aggregation of fish was present below the dam and the early collections are reserved for broodstock. At Fall Creek Dam, three distinct peaks were observed in run timing on 17 May, 21 June, and 19 August. A large peak in mid-June with a smaller peak in the fall is more typical. The lack of fish in late May and early June in 2010 was related to cold water temperature and high volume discharge from Fall Creek Dam, which deterred fish movement upstream. Additionally, water passed through Fall Creek Dam flooded the fish ladder and trap for approximately one week.
Recovery rates for PIT-tagged fish in 2010 were higher on the NFMF than in previous years. Although overall effort was comparable across the years, we focused on areas with the highest concentrations of known fish, as well as increased our coordination with ODFW carcass surveys in order to maximize efficiency. In the NFMF, kayak surveys were used more often to increase the stream area covered. The greater number of radio transmitters in 2010 also allowed fate determination for some fish for which we never recovered a fresh carcass.
Prespawn mortality rates in Fall Creek observed in 2010 were moderate compared to the
low and high estimates in 2008 and 2009, respectively. The NFMF prespawn mortality was slightly higher in 2010 than 2009, although both were relatively low compared to the very high mortality recorded in years past (i.e., mortality as high as 90%, Schroeder et al. 2007; Kenaston et al. 2009; Keefer and Caudill 2010). Across years, prespawn mortality rates have been broadly associated with temperature, as discussed below. Following outplanting, we observed more fish movement in 2010 than in 2009 which may have resulted from among-year differences in water temperatures. In Fall Creek, temperatures can reach lethal levels in some years and the only form of thermoregulation may exist along a longitudinal spectrum, with cooler waters available only in the upper watershed. Relatively cooler temperatures in 2010 may have resulted in less directed initial salmon movements in search of thermal refuge upstream immediately after release and more overall movements during the summer because adults were not constrained to upper reaches by temperature. As in 2009, both ODFW and UI researchers observed several incidences of fish harassment or poaching that may have significantly affected the survival of salmon outplanted above Fall Creek Dam. Apparent poaching and harassment included the removal of roe from

63
carcasses that may or may not have died naturally, targeted salmon fishing in restricted waters, and even reports of fish spearing. The impact these factors have on reproductive success and production of the population is unknown. However, the percentage of fish affected directly (e.g., poaching) or indirectly (e.g., stress or energy consumption through harassment) was likely quite large. Given the current fishing regulations and the high use of Fall Creek by recreationists during salmon migration and spawning, it may be difficult to reduce these human impacts without restricting activity of users during salmon holding and spawning periods. A large number of prespawn mortalities in 2010 were observed 1 to 2 days following a release event of untagged adults at the NFMF. These were presumably delayed mortality associated with transportation to the release site. The mechanism for this mortality is unclear, but due to the timeframe it is likely attributable to stress rather than water quality issues in transportation (which would manifest in minutes to hours) or to disease transmission between individuals (which would manifest over weeks). ODFW has addressed these issues in the past and made many improvements to their transportation protocols.
Condition and Spawning Success
Lipid is the primary source of energy used by migrating salmon and can be non-lethally assessed in bioenergetic studies (Brett 1995; Crossin and Hinch 2005; Pinson 2005). The Distell Fatmeter provided estimates of lipid levels in the muscle tissue, as well as gross somatic energy content. The mean lipid content at the time of tagging in 2010 was 7.5% and 4.2% for Fall Creek and Dexter fish, respectively. As observed in every study year, lipid levels decreased approximately 0.5-1% per week. When these values were standardized using proximate analysis results, we did not detect a significant among-year difference in the energetic condition of fish.
Energy content of fish held at Willamette Hatchery at the time of outplanting was comparable to fish tagged at Fall Creek at the same time. This indicates that the metabolic expenses from holding below the dam versus holding at the hatchery may be negligible, or that the difference was small enough not to be detected in this study. Importantly, holding temperature presumably affects energy content and should be considered in any hatchery holding protocol. For this study, hatchery-held fish were in Salmon Creek water that is diverted into the hatchery compound. Fish holding below WVP dams may be exposed to cooler temperatures in the summer, but warmer temperatures in the fall compared to the Salmon Creek water at the hatchery. This is due to the impacts of the dams on downstream water temperatures (Rounds 2007 and 2010). It may be possible to use cooler well water for holding, which may reduce energy consumption during pre-outplanting holding.
The lipid levels observed in 2010 were comparable to other years, but were lower than
documented in other Columbia River basin Chinook salmon stocks early in their freshwater migration (Pinson 2005; Anderson 2007). Differences in the locations and timing of these sampling events likely explain the among-population differences in lipid levels. Work proposed for 2011 includes sampling spring Chinook salmon at Willamette Falls, and data collected from these fish would be more appropriate for comparison with Columbia River salmon sampled at Bonneville Dam.
64
There was an association between lipid levels and spawning success in 2010. This relationship, however, was intercorrelated with migration timing effects. It was unclear whether salmon with higher lipid levels were successful because they had greater reserves or because there were other advantages to early migration, such as exposure to cooler temperatures. Based on our 2008-2010 results, energy condition upon arrival at Fall Creek may have interacted with environmental conditions to affect spawning success. Although temperatures in Fall Creek did not reach highs observed in 2009, they reached levels shown to have sub-lethal effects on migrating salmon.
In contrast to the 2009 results, we did not observe a significant association between
physical condition and spawning success in 2010. Because salmon were in generally good condition in 2010 (i.e., most fish received a condition score of three), there may not have been enough variability in the data to detect a condition effect. Alternatively, the difference between years may have resulted primarily from an interaction between condition and high temperature whereby adults in poor condition were prone to prespawn mortality at high temperatures in 2009 because they were injured, diseased or otherwise compromised, while mortality was lower in 2010 among the poor condition adults because conditions were more benign. To what degree these patterns result from increased impact of physical injuries, increased pathogenesis, or direct physiological stress at high temperatures is unknown. Regardless, data from both years are consistent with the hypothesis that temperature-induced stress is an important component of the prespawn mortality phenomenon, and that adults arriving in poor condition are impacted to a greater degree. These data also suggest that factors that reduce condition during collection and handling (e.g., injuries incurred at fish traps or during transport) may contribute to prespawn mortality post-outplanting in years with high environmental temperatures.
Holding and Spawning Success In 2010 we successfully tagged and recovered a portion of fish both immediately outplanted into the NFMF and held at Willamette Hatchery before outplanting. Additionally, fish from both trapping sites were held at Oregon State University to assess spawning success for fish held in pathogen-free water. We recovered enough PIT-tagged salmon in 2010 from the NFMF to make a comparison between the two treatment groups collected at Dexter Dam. Our best estimate of prespawn mortality in the hatchery held group was 20.3%, with a high-end estimate of 30.7% assuming all unrecovered fish from the holding pond represented prespawn mortality. Even with a conservative measure, prespawn mortality for hatchery-held fish was approximately half the rate observed in the NFMF for the immediately outplanted group (57.9%).
However, we cannot conclude that this difference in prespawn mortality resulted from holding. Adult fish that were held at Willamette hatchery were all collected earlier than fish that were immediately outplanted, a result of the practice of Willamette Hatchery collecting all broodstock before any outplanting occurs. At Dexter Dam, fish may have waited in a large aggregation for weeks or months prior to the first opening of the ladder in June, unlike at Fall Creek where fish were essentially collected upon reaching the dam. Importantly, we observed a similar seasonal pattern in prespawn mortality at Fall Creek and among adults collected and held at FPGL, where early arriving adults had higher survival than late arriving adults, suggesting at
65
least some portion of the higher survival for the Willamette Hatchery-held group was related to seasonal timing effects rather than a holding effect. A more appropriate design for separating seasonal and holding effects would be to collect throughout the run season and to outplant a constant proportion fish entering the trap throughout the migration season. Clearly, implementation of such a design may be constrained by logistical consideration as it would require modification of the Dexter Trap operations and the outplanting of adults prior to the full collection of broodstock quota. Early outplanting may be reasonable in years with high expected run-size. We did observe evidence in support of holding salmon as a method for reducing prespawn mortality in the OSU-held groups. The prespawn mortality recorded for both Fall Creek (29%) and Dexter (20%) groups held at OSU was lower than estimated mortality in the immediate-outplant populations (42% for Fall Creek and 58% for Dexter fish). This difference was expected because fish at OSU were held in pathogen-free and moderately temperature controlled water, as well as treated with peroxide to minimize fungal infections. Because of these treatment differences, the comparison could not address which mechanisms affected the differential mortality among groups. However, the combined results do suggest that holding adults may be an effective management strategy for reducing prespawn mortality where these practices can be implemented.
Environmental Effects
When combining the results from all three study years, it is almost certain that water temperature affects prespawn mortality rates directly and/or indirectly, particularly in Fall Creek. In 2009, we observed prespawn mortality that directly coincided with increases in temperatures. The 2010 river conditions were cooler, although daily maximums exceeded 22°C, which are still within the range that are considered harmful for adult Chinook salmon (Richter and Kolmes 2005; Mann 2007). We observed lower mortality rates for fish migrating in May in 2010. Lower temperature exposures for these fish likely contributed in part to this result, as these adult migrated through the mainstem system and reached headwaters of Fall Creek after outplanting prior to the onset of stressful temperatures.
It is unlikely that water temperatures in NFMF near areas used by outplanted Chinook
salmon routinely reach levels that would have large impacts on survival. It is then interesting to note the comparable levels of prespawn mortality in 2010 between NFMF and Fall Creek, which averaged 4.5°C higher in July and August. Prespawn mortality in the NFMF is more likely to be affected by factors other than proximate temperature, including transportation stress, long holding times downstream from Dexter Dam and at the facility, and density-dependent issues that were not quantified by this study but were potentially high based on field observations. These factors should be a management concern for salmon released into the NFMF, but may be of less importance at Fall Creek where transportation times are shorter and fish numbers are lower.
66
Disease Screening
Pathology
Results from disease screening revealed common swelling or hemorrhaging of internal organs, external evidence of trauma, and histological evidence of pathogenic infection. This year we were able to increase our sample size, including more healthy fish from the river and post-spawners from the river and Willamette Hatchery. Fish that died prespawning appeared more heavily infected than those that survived to spawn. We saw similar lesion patterns and parasites as 2009, except we did not diagnose severe, extraintestinal infections by Ceratomyxa shasta in the PSM fish. The dominant infections in the fish from the river were Nanophyetus salminicola in various organs, Apophallus sp. or Echinochasmus milvi in the gills, Parvicapsula minibicornis in the kidneys, and Myxobolus in the brains. The latter was not noted in 2009. Severe bacterial kidney disease (BKD) was observed in several fish held at FPGL, but was not in the PSM fish from the river. Conversely, fish held at FPGL generally had lighter parasite infections.
As we concluded in 2009, we still are not able to ascribe a single pathogen to prespawn
mortality. While PSM fish generally had the most severe infections, the influence of time in the river system, including the Willamette Hatchery, had a strong influence on severity of infections.
We had the best data set for Nanophyetus, as we obtained enumerated parasites in the
kidney with wet mounts. The PSM fish had the highest abundance of parasites (Table 18), but it was difficult to separate the effects of time in the river. In other words, the strong statistical correlation of date with Nanophyetus abundance requires that comparisons of healthy with sick/dead fish be conducted on samples collected at very similar dates. We assume that date of collection reflects the time the fish has been in the river, which would be the main influence for Nanophyetus abundance. This is a strictly freshwater parasite, in which the infectious stage (cercariae) emerges from Juga snails, infects fish and the worm then encysts without further replication. Indeed, there were fewer parasites in the salmon held at the FPGL, even late in the season, which reflects the fact that they are held on parasite-free well water. Interestingly, post-spawners examined from the Willamette Hatchery had many worms, but about half as many as the post spawners from the river. This indicates that they continue to become infected there after transfer to hatchery, but to a lesser extent. Therefore, comparisons of PSM fish to healthy salmon for parasite burdens should be conducted only on samples collected at close to the same time date because date influences parasite burden. Also, it should be noted that date is not a direct correlate to time in the river as returning salmon enter the river at different times earlier in the year. Interestingly, our analysis to date shows statistical correlation of worm burden with location.
Assessment of the Nanophyetus abundance results using the Crofton (1971) model
provided some interesting insights on parasite associated mortality in the present study. The method is observation of truncation of the normal negative binomial distribution of pathogen abundance, first described by Crofton (1971) and reviewed by Lester (1984). This is particularly useful with salmon, as unlike many other analytical methods used to assess parasite associated mortality, it requires only one sample time. The normal distribution of parasite abundance in wild animals is a negative binomial, rather than a bell-shaped curve. This pattern emerges because, in a given population of wild animals, most are not or are lightly infected, while only a
67
few have heavy infections. Parasite associated mortality occurs when observed infection severity (abundance or intensity) is less than would be predicted by a curve generated using lightly infected animals (Figure 28). In other words, Crofton and other parasitologists have shown that truncation of the predicted negative binomial curve at the region of high abundance can be used to estimate a threshold for parasite associated mortality. We found that the threshold for parasite induced mortality was about 2,500 worms/g in the kidney, and most of the PSM fish had burdens less than this.
Nevertheless, PSM fish still had about several times the abundance of this worm
compared to healthy fish from the river collected around the same time. Thus, alternate hypothesis may be that fish that have been in the river longer (i.e., those that enter early) are more likely to die before spawning, and the worm burden is merely an indicator of time in the river. In other words, it indicates “parasite-associated” morality, not a direct cause and effect by this single pathogen.
Other metacercariae were consistently detected in the gills. In 2009 we found heavier
infections in the PSM fish, but the 2010 samples showed similar levels of infections in all groups except the early transfers to FPGL. This again demonstrates that that removal of fish and holding in parasite-free water will reduce parasite burdens. Metacercariae of Apophallus sp. and E. milvi. occurred within filaments, and again was associated with proliferative changes directly associated with encysted worms. Most Nanophyetus were detected at the base of the gills. All three of these worms are fairly common in apparently healthy salmon in Oregon, and thus some may discount these as serious pathogens. However, morbidity is associated with heavy gill infections by metacercariae (Olson et al. 1997; Mitchell et al. 2005), and there are reports of Nanophyetus causing both acute and chronic disease in salmonids (Baldwin et al. 1967; Jacobson et al. 2008). Such infections seen here probably compromised the respiratory capabilities of the Chinook salmon as they infected the primary and secondary lamellae and caused remarkable inflammatory and proliferative changes. Severity of infection by the metacercariae was based on subjective observations of histological sections. While histology is appropriate for providing data on pathological changes, a better approach, particularly for comparing groups with statistical rigor, would be to count metacercariae in wet tissues (Ferguson et al. 2011). Examination of wet tissues has not been completed, but preliminary results reflect histological observations, showing little differences between the groups, except for fish transferred to FPGL.
Three myxozoans were commonly observed in the study. The myxozoan Parvicapsula
minibicornis has recently been implicated in prespawn mortality in sockeye salmon (Oncorhynchus nerka) in British Columbia (Bradford et al.2010) and may play a role in mortality in Chinook salmon in the Klamath Basin (Bartholomew 2007). Developmental presporogonic stages proliferate in the glomerulus of the kidney, where it is associated with profound damage to this structure. The infection progresses to the tubules, where it is associated with less histological damage (Kent et al. 1997). Observation of heavy infections in PSM fish prompted us to consider this parasite to be a likely cause of morbidity. However, healthy fish collected from the river showed the same burden of infection. Interestingly, the infection was minimal in fish held at FPGL. Again, an invertebrate host releases a worn-borne infectious stage in freshwater, and thus fish were not exposed following transfer to FPGL. Examination of post-spawners showed fewer infections with the glomerular (presporogonic) stages, but sporogonic
68
stages in the lumen of kidney tubules were frequently observed. This could be explained by two possibilities: the fish with the severe glomerular disease die before spawning, or the pattern of infection in the post spawn fish may merely reflect the natural progression of the infection, with recovery from the glomerular stage. This would be consistent with other similar myxozoans, such as Tetracapsuloides bryosalmonae, which causes severe kidney disease in the summer with the presporogonic stages, and recovered fish show sporogonic forms in the tubules in the fall (Kent et al. 1987). However, the progression of the infection in P. miniicornis has not been investigated.
Ceratamyxa shasta is another myxozoan that has the potential to cause prespawn
mortality. Some of the PSM fish that we examined in 2009 showed severe ceratomyxosis, and it was concluded that this was the primary cause of death in these fish. A different pattern of infection was observed in 2010. The infection was not detected in PSM fish, but the parasite was observed in post-spawned fish in the intestinal epithelium. The myxozoan is particularly deadly when it invades subepithelial tissues and extraintestinal sites, and thus not likely pathogenic to the spawning fish.
A third myxozoan that was common in the study was a Myxobolus sp. in the hind brain.
Species identification was not made, but it was probably either M. kisutchi or M. neurotropus (Ferguson et al. 2008). Many fish exhibited prominent infections in which a large portion of the hind brain was occupied by the parasite. Unlike Myxobolus cerebralis, these infections that are restricted to the nervous tissue are generally considered not to cause acute disease. However, Moles and Heifetz (1998) showed that a similar parasite, M. articus, was associated with reduced swimming performance. Based on the severity of infection in a critical organ it would be considered a candidate for causing significant disease in the PSM fish. However, we observed similar levels of infection in healthy fish collected from the rivers, as well as post-spawned fish. The latter observations, therefore, suggest that this myxozoan is not an important contributed to death in the PSM fish.
Two bacterial infections were observed. Bacterial kidney disease (BKD), caused by Renibacterium salmoninarum, causes severe, chronic inflammatory lesions that are distinctive in histology. This is a very common infection in wild and cultured salmonids, particularly in wild Chinook salmon in the Pacific Northwest. Many asymptomatic fish carry subclinical infections (Arkoosh et al. 2004). However, under certain conditions, infections can translate into disease. It is well-recognized as a cause of severe disease in Chinook salmon at times in both government hatcheries (Evelyn 1993) and seawater netpens (Kent and Poppe 1998). Lesions consistent with this infection were observed in all but the post-spawned fish from the river. It was most common in the fish held at FPGL, consistent with the concept that it is a more important problem in captive fish. Fish held in captivity at the Willamette Hatchery were not affected. However, these fish were treated with injection of erythromycin shortly after capture, and this treatment is efficacious for preventing progression of the disease in infected broodstock salmon.
Aeromonas salmonicida, the cause of furunculosis, was detected by culture in some of
the PSM and post-spawn river fish. This is another well-recognized cause of disease in mainly captive salmonids, but occasionally occurs in wild Pacific salmon (Kent et al. 1998; Arkoosh et al. 2004). It was difficult to diagnosis this infection in fish that were collected dead by histology as differentiating this infection from post-mortem colonization of organs by saprophytic,
69
opportunistic bacteria in these fish was not possible. A specific in situ DNA or immunological stain on the sections could be used if warranted (Grøntvedt et al. 2004).
Parasite Free Holding to Reduce Prespawn Mortality
The fish allowed to mature in cool, pathogen-free water appeared to have been able to “hold” their parasite loads in check, thereby avoiding the severe infections found associated with those individuals that died prior to spawning following outplanting. This is particularly the case for the worm parasites, which do not replicate in the fish host. This again suggested the importance of parasites as population regulatory factors in the wild. This raises a spectra of questions, that if resolved, could lead to tactics to reduce prespawn mortality in nature. What is the relationship between time of infection, length of time in the river before spawning, and time to death in fish that died prespawning? And, what roles do temperature and flow play in affecting this relationship? Mechanistically, effects could be on intermediate or terminal hosts or on the parasites, but it really would not matter if fish survival was improved. Temperature and flow management are clear options available to recovery planning in Oregon’s Conservation Strategy for Willamette Chinook. These are also realistic options for how water is managed at dams.
We recognize that the Dexter adult holding and trapping facility may be renovated in the future. We strongly endorse this activity, as the crowding and physical design (numerous sharp metal edges, protracted holding of fish, etc.) of the present facility could lead to significant trauma and hence lowered resistance to parasite infection. If reconstruction was not to benefit pre-net returns to the facility, then we suggest providing some sort of temporary smooth covering of the walls of the facility and managing the number of fish held to reduce the time that any individual spends in the facility. We suspect that sharply decreasing the density of fish being held would increase the probability of the fish surviving to spawning given the general association we have observed between condition and prespawn mortality (Keefer et al. 2010; Mann et al. 2010).
The parasites in Chinook salmon broodstock that survived to spawn at Willamette Hatchery were also specious (Table 17). While Renebacterium salmoninarum, the causative agent of bacterial kidney disease, was not apparent at the histological level in these fish, the ODFW was able to document their presence via ELISA. Treatment with the antibiotic erythromycin probably held the infection in check. The severity of infection in the successful broodstock was similar to that of the fish transported to the FPGL later in the run (Table 16b).
Management Implications
Prespawn mortality is a concern for management of listed WVP stocks because high prespawn mortality levels have been observed frequently in a number of populations (Beidler and Knapp 2005; Kenaston et al 2009; Keefer and Caudill 2010). Further, demographic modeling suggests that observed levels of prespawn mortality (e.g. > 50-70%) may strongly negatively affect population growth rates and hinder salmon recovery, even if juvenile survival is improved (Keefer et al. 2010). The importance of prespawn mortality to the dynamics and
70
viability of tributary populations may increase if future climate change increases the rate of temperature-related mortality. An improved understanding of the relationship between adult mortality, population growth rate, and temperature is important given current climate predictions and uncertainty about the underlying mechanisms of prespawn mortality.
The apparent impact that water temperatures had on spawning success across study years
suggests that strategies that minimize exposures to high temperatures in years with above average temperatures should be considered to improve survival of outplanted fish. Development of structured management plans for years with different anticipated river conditions or summer climate could be used to ensure minimum impacts to outplanted fish. Without the ability to directly manipulate water temperatures in the river above impoundments, managers may have to manipulate the timing or location of outplanting, or use cool water holding during summer. In 2011 we are planning a pilot study to evaluate the use of reservoir release for outplanted adults as a means to provide a hypolimnetic thermal refugium during warm summer months prior to spawning, which may provide an additional tactic to minimize the adverse effects of temperature exposure post-outplanting.
There was a clear, large benefit to survival to spawning in both males and females that were held at FPGL compared to fish that were outplanted. This finding can be at least applied to stocks of fish from the upper Willamette system as we found equally low prespawn mortality in fish from two different sources, Fall Creek and Dexter. If true, the earlier fish could be sequestered away from freshwater parasites that infect fish in the river and allowed to mature in cool water, the greater the benefit of removing fish from the Willamette system. In addition, the relative fecundity of these fish was not negatively affected by collection and transport , as the survival to swim-up from eggs produced by these fish was good. These findings, if repeated in subsequent years, would provide managers with a clear tactic for reducing prespawn mortality in fish to subsequently be outplanted, particularly in years expected to have high summer temperatures.
If fish that die pre-spawning do so because of conditions in the Willamette River or in tributaries, then holding them in high quality conditions may increase survival, particularly in years with predicted low discharge and/or high temperatures. Upon trapping, the fish could be held in cool water until river temperatures have dropped to a more favorable level. However, we note that there are potentially serious concerns with extended holding that need to be considered before implementation, including transmission of disease, maturation effects, and reduction of condition, as well as logistical issues concerning facility use and personnel demand. The feasibility and efficacy of this management strategy was explored in 2009 and 2010, with further development proposed in future years.
Normally, Pacific salmon die shortly after spawning due to a failure in the ability to
down-regulate stress hormones (Cushing’s syndrome). If Willamette River spring Chinook salmon are prematurely Cushingoid, they could experience premature senescence and death due to pathogens. Immune status would certainly play a key role in controlling pathogens that proliferate after infection, such as myxozoans and bacteria. However, even for metacercariae (that do not multiply in the fish), it has been shown that immune compromised hosts have heavier burdens. For example, frogs exposed to agrochemicals, leading to suppressed immunity,
71
are more heavily infected with Riberoria sp., the metacercaria that causes skeletal deformities (Rohr et al. 2008). Immunosuppression caused by UV radiation was associated with increased survival of metacercariae in exposed fish (Markkula et al. 2007). If Cushingoid condition leads to increased pathogen burden or expression of pathogenesis is the root of the problem, then it could perhaps be mitigated by holding the fish under high quality rearing conditions that would minimize infection until shortly before final maturation. Whereas capture and holding adult Chinook salmon may exacerbate infections that are directly transmissible and proliferate within the host (such as bacterial diseases), these could be controlled with drugs. Indeed, as seen the Willamette Hatchery, injection of antibiotics is an effective approach to keep pre-existing R. salmoninarum infections from expressing clinical BKD in captive brood stock.
As was suggested after the 2009 study, one additional management strategy may be to use different outplant release sites in years with different in-river conditions. As water temperatures increase, release sites located further upstream or in reservoirs could be used to expose fish to cooler waters. This method would also have the effect of distributing fish throughout the system and allow for better use of spawning habitat. Although density dependent effects are less likely in Fall Creek given recent return sizes, there is the potential for negative density dependent effects in larger systems with higher outplant numbers. Prior to implementation, the economic and biological costs of longer transport or multiple release sites need to be evaluated.
Early run fish had high survival rates at Fall Creek in 2010, which was echoed in our results from groups held at OSU. Broodstock collection practices at Dexter limited our ability to determine if a similar pattern existed in the outplanted NFMF fish. It is possible that any survival advantage early run fish had were lost as a result of density dependent factors or fishing pressures below Dexter Dam. There is some evidence that the Dexter population may be at a risk for injuries or stress related to inherent difficulties associated with long transportation times and facility designs. The latter may be amended with the proposed refurbishment to the Dexter Facilities outlined in the Willamette Biological Opinion (NMFS 2008).
We observed additional evidence of poaching or harassment in 2010. It is unknown to
what degree these events affected salmon. Our 2009 and 2010 observations suggest that it may be significant in the study area, and particularly in Fall Creek. The lower impact on the NFMF was likely due to both the increased distance from major metropolitan areas and current fishing regulations, which are flies only with barbless hooks. Balancing spawner protection with the negative effects of open access and multi-use recreation management goals will be challenging.
Demonstrating causal links between prespawn mortality and mechanism(s) (e.g., disease expression or energy) could provide guidance and support for other recovery options proposed for the recovery of the Upper Willamette Chinook ESU. For example, if temperature is a controlling factor for pathogenesis, then proposed measures that would prevent warming or reduce temperatures that are in the proposed “Conservation and Recovery Plan” could be even more strongly endorsed. Successful management of adults within the WVP and on the spawning grounds above projects will require reliable information on disease prevalence, individual-and population-level energetics, abiotic factors in the migration corridor, and effects of current protocols for handling fish. Given the variable effect of each on prespawn mortality from year to
72
year and the interactions between each of these factors, it is particularly important to continue to monitor all in the face of changing ocean conditions and warming regional climate (e.g., Eaton and Scheller 1996; Mote et al. 2003). Continued monitoring allows managers to have a suite of strategies to address prespawn mortality and population fitness in the face of varying river conditions and dam operations in future years.
References A.O.A.C. (1965) Official Methods of Analysis (10th Ed.) Association official Agricultural
Chemists. Washington, D.C. Anderson, C.R. (2007) Migration history and pre-spawning mortality, non-lethal energy
estimations and carcass removals of adult Chinook salmon migrating to the South Fork of the Salmon River in central Idaho. Department of Fish and Wildlife. Master’s Thesis, University of Idaho, Moscow, Idaho.
Arkoosh, M.R., E. Clemons, A.N. Kagley, C. Stafford, A.C. Glass, K. Jacobson, P. Reno, M.S.
Myers, E. Casillas, F. Loge, L.L. Johnson, T.K. Collier (2004) Survey of pathogens in juvenile salmon Oncorhynchus spp. migrating through Pacific Northwest estuaries. Journal of Aquatic Animal Health 16:186-196.
Baldwin N.L., R.E. Millemann, S.E. Knapp (1967) “Salmon poisoning” disease. III. Effect of
experimental Nanophyetus salmincola infection on the fish host. Journal of Parasitology 53:556–564.
Bartholomew, J.L., J.S. Rohovec, and J.L. Fryer (1989) Ceratomyxa shasta, a myosporean
parasite of salmonids. U.S. Fish and Wildlife Service. Fish Disease Leaflet, 80p. Bartholomew, J.L., S.D. Atkinson, S.L. Hallett, C.M. Zielinski, and J.S. Foott (2007)
Distribution and abundance of the salmonid parasite Parvicapsula minibicornis (Myxozoa) in the Klamath River basin (Oregon-California, USA). Diseases of Aquatic Organisms 78: 137-146.
Beidler, W. and S. Knapp (2005) A synopsis of information relating to the success of adult
hatchery Chinook salmon releases above migration barriers in the Willamette River system. Oregon Department of Fish and Wildlife, 51 pp.
Berg, O.K., E. Thron s, and G. Bremset (1998) Energetics and survival of virgin and repeat
spawning brown trout (Salmo trutta). Canadian Journal of Fisheries and Aquatic Sciences 55:47-53.
Bradford, M.J., J. Lovy, D.A. Patterson, D.J. Speare, W.R. Bennett, A.R. Stobbart, C.P. Tovey
(2010) Parvicapsula minibicornis infections in gill and kidney and the premature mortality

73
of adult sockeye salmon (Oncorhynchus nerka) from Cultus Lake, British Columbia. Can. J. Fish. Aquat. Sci. 67: 673-683.
Brett, J.R (1995) Energetics. In C. Groot, L. Margolis, and W.C. Clarke, editors. Physiological
Ecology of Pacific Salmon. University of British Columbia Press, Vancouver. pp 1-66. Colt, J., and K. D. Shearer (2001) Evaluation of the use of the Torry Fish Fatmeter to nonlethally
estimate lipid in adult salmon. Prepared for: U.S. Army Corps of Engineers, Portland District, Contract Report W66QKZ00805700, Seattle.
Cooke, S.J., S.G. Hinch, A.P. Farrell, M.F. Lapointe, S.R.M. Jones, J.S. Macdonald, D.A.
Patterson, M.C. Healey, and G.Van Der Kraak (2004) Abnormal migration timing and high en route mortality of sockeye salmon in the Fraser River, British Columbia. Fisheries 29(2):22-33.
Coutant, C.C. (1977) Compilation of temperature preference data. Journal of the Fisheries
Research Board of Canada 34:739-745. Craig, J.F., M.J. Kenley, and J.F. Talling (1978) Comparative estimations of energy content of
fish tissue from bomb calorimetry, wet oxidation and proximate analysis. Freshwater Biology 8:585-590.
Crofton, H.D. (1971) A model of host parasite relationships. Parasitology 63: 343-361 Crossin, G. T., S. G. Hinch, A. P. Farrell, D. A. Higgs, and M. C. Healey (2004a) Somatic
energy of sockeye salmon Oncorhynchus nerka at the onset of upriver migration: a comparison among ocean climate regimes. Fisheries Oceanography 13(5):345-349.
Crossin, G. T., S. G. Hinch, A. P. Farrell, D. A. Higgs, A. G. Lotto, J. D. Oakes, and M. C.
Healey (2004b) Energetics and morphology of sockeye salmon: effects of upriver migratory distance and elevation. Journal of Fish Biology 65:788-810.
Crossin, G.T. and S.G. Hinch (2005). A non-lethal, rapid method for assessing the somatic
energy content of migrating adult Pacific salmon. Transactions of the American Fisheries Society 134:184-191.
Crossin, G.T., S.G. Hinch, S.J. Cooke, D.W. Welch, D.A. Patterson, S.R.M. Jones, A.G. Lotto,
R.A. Leggatt, M.T. Mathes, J.M. Shrimpton, G. Van Der Kraak, and A.P. Farrell (2008) Exposure to high temperature influences the behaviour, physiology, and survival of sockeye salmon during spawning migration. Canadian Journal of Zoology 86:127-140.
Eaton, J. G., and R.M. Scheller. (1996) Effects of climate warming on fish thermal habitat in
streams of the United States. Limnology and Oceanography 41:1109-1115.
74
Evelyn, T.P.T. (1993) Bacterial kidney disease -- BKD. In V. Inglis, R.J. Roberts, and N.R. Bromage (eds.) Bacterial Diseases of Fish. Blackwell Scientific Publications, Oxford, p. 177-195.
Ferguson, J.A., S.D. Atkinson, C.M. Whipps, and M.L. Kent (2008) Molecular and
morphological analysis of Myxobolus spp. of salmonid fishes with the description of Myxobolus fryeri n. sp. Journal of Parasitology 94: 1322–1334.
Ferguson, J.A., Schreck, C.B. , Chitwood, R., Kent, M.L. (2011) Persistence of infection by
metacercariae of Apophallus sp, neascus, Nanophyetus salminicola and two myxozoans (Myxobolus insidiousus and M. fryeri) in coho salmon Oncorhynchus kistutch Walbaum). Journal of Parasitology (in press).
Fitzpatrick, M.S., C.S. Schreck, R.L. Chitwood, and L.L. Marking (1995) Evaluation of three
candidate fungicides for treatment of adult spring chinook salmon. Progressive Fish-culturist 57: 153-55.
Fitzpatrick, M.S., G. van Der Kraak, and C.B. Schreck (1986) Profiles of plasma sex steroids and
gonadotropin in coho salmon (Oncorhynchus kisutch) during final maturation. General and Comparative Endocrinology 62:437-451.
Grøntvedt, R.N., V. Lund, S. Espelid (2004) Atypical furunculosis in spotted wolffish
(Anarhichas minor O.) juveniles: bath vaccination and challenge. Aquaculture 232: 69-80. Hendry, A.P. and O.K Berg (1999) Secondary sexual characteristics, energy use, senescence, and
the cost of reproduction in sockeye salmon. Canadian Journal of Zoology 77:1663-1675. Hendry, A.P., A.H. Dittman, and R.W. Hardy (2000) Proximate composition, reproductive
development, and a test for trade-offs in captive sockeye salmon. Transactions of the American Fisheries Society 129(5):1082-1095.
Higgins, M.J., and M.L. Kent (1997) Prespawning mortality in sockeye salmon associated with
gill parasites in the Babine Lake systems Annual Report to SEP, Department of Fisheries and Oceans Pacific Biological Station, Nanaimo B.C.
Jobling, M. (1981) Temperature tolerance and the final preferendum – rapid methods for the
assessment of optimum growth temperatures. Journal of Fish Biology 19:439-455. Jacobson, K., D. Teel, D. Van Doornik, E. Casillas (2008) Parasite-associated mortality of
juvenile Pacific salmon caused by the trematode Nanophyetus salmincola during early marine residence. Marine Ecology Progress Series 354:235-244.
Jones, S.R.M., G. Posperi-Porta, S.C. Dawe, and D.P. Barnes (2003) Distribution, prevalence
and severity of Parvicapsula minibicornis infections among anadromous salmonids in the Fraser River, British Columbia, Canada. Diseases of Aquatic Organisms 54:49–54.

75
Jones, S., G. Prosperi-Porta, S. Dawe, J. Blackbourn, K. Taylor, G. Lowe, A. Osborn (2004) Proliferative renal myxosporidiosis in spawning coho salmon (Oncorhynchus kisutch) in British Columbia and Washington. Folia Parasitologica 51:221-227.
Keefer, M. L., C.A. Peery, T.C. Bjornn, M.A. Jepson, and L.C. Stuehrenberg (2004)
Hydrosystem, dam, and reservoir passage rates of adult Chinook salmon and Steelhead in the Columbia and Snake Rivers. Transactions of the American Fisheries Society 133:1413-1439.
Keefer, M.L., C.A. Peery, and M.J. Heinrich (2008) Temperature-mediated en route migration
mortality and travel rates of endangered Snake River sockeye salmon. Ecology of Freshwater Fish 17:136-145.
Keefer, M.L., G.A. Taylor, D.F. Garletts, G.A. Gauthier, T.M. Pierce, and C.C. Caudill (2010)
Prespawn mortality in adult spring Chinook salmon outplanted above barrier dams. Ecology of Freshwater Fish 19:361-372.
Keefer, M.L. and C.C. Caudill (2010) A review of adult salmon and steelhead life history and
behavior in the Willamette River basin: identification of knowledge gaps and research needs. Technical Report 2010-8. University of Idaho, Moscow. Prepared for: U.S. Army Corps of Engineers, Portland District.
Kenaston, K., K. Schroeder, F. Monzyk, and B. Cannon (2009) Interim activities for monitoring
impacts associated with hatchery programs in the Willamette Basin, USACE funding: 2008. ODFW.
Kent ML, Poppe TT (1998) Diseases of seawater netpen-reared salmonid fishes. Pacific
Biological Station, Nanaimo, British Columbia Kent, M.L., G.S. Traxler, D. Kieser, J. Richard, S.C. Dawe, R.W. Shaw, G. Prosperi-Porta, J.
Ketchenson, T.P.T. Evelyn (1998) Survey of salmonid pathogens in ocean-caught fishes in British Columbia, Canada. Journal of Aquatic Animal Health 10:211-219.
Kent, M.L., D.J. Whitaker, and S.C. Dawe (1997) Parvicapsula minibicornis n. sp. (Myxozoa,
Myxosporea) from the kidney of sockeye salmon (Oncorhynchus nerka) from British Columbia. Journal of Parasitology 83:1153-1156.
Kocan, R., P. Hershberger, and J. Winton (2004) Ichthyophoniasis: An emerging disease of
Chinook salmon in the Yukon River. Journal of Aquatic Animal Health 16:58-72. Lester, R. (1984) A review of methods for estimating mortality due to parasites in wild fish
populations. Helgoland Marine Research 37:53-64. Mann, R.D. (2007). The effects of high temperature exposures on migration success and embryo
quality of Snake River adult Chinook salmon and steelhead. Department of Fish and Wildlife. Master’s Thesis, University of Idaho, Moscow, Idaho.
76
Mann, R.D., C.A. Peery, A.M. Pinson, C.R. Anderson (2009) Energy use, migration times, and spawning success of adult spring–summer Chinook salmon returning to spawning areas in the South Fork Salmon River in Central Idaho: 2002–2007. Technical Report 2009-4. Cooperative Fish and Wildlife Research Unit, University of Idaho, Moscow. Prepared for: U.S. Army Corps of Engineers.
Mann, R.D., C.C. Caudill, M.L. Keefer, C.A. Peery, C.B. Schreck, M.L. Kent (2010) Migration
behavior and spawning success of spring Chinook salmon in Fall Creek and the North Fork Middle Fork Willamette River: relationships among fate, fish condition, and environmental factors. Technical Report 2010-7. Cooperative Fish and Wildlife Research Unit, University of Idaho, Moscow. Prepared for: U.S. Army Corps of Engineers.
Markkula, S.E., A. Karvonen, H. Salo, E.T. Valtonen, E.I. Jokinen (2007) Ultraviolet B
irradiation affects resistance of rainbow trout (Oncorhynchus mykiss) against bacterium Yersinia ruckeri and trematode Diplostomum spathaceum. Photochem. Photobiol., 83: 1263–1269.
Mitchell, A.J., R.M. Overstreet, A.E. Goodwin, T.M. Brandt (2005) Spread of an exotic fish-gill
trematode: A far-reaching and complex problem. Fisheries 30:11-16. Moles A. and J. Heifetz (1998) Effects of the brain parasite Myxobolus arcticus on sockeye
salmon. Journal of Fish Biology 52:146-151. Mote, P.W., E.A. Parson, A.F. Hamlet, W.S. Keeton, D. Lettenmaier, N. Mantua, E.L. Miles,
D.W. Peterson, D.L. Peterson, R. Slaughter, and A.K. Snover. (2003) Preparing for climatic change: the water, salmon, and forests of the Pacific Northwest. Climatic Change 61:45-88.
Neitzel, D.A., R.A. Elston, and C.S. Abernethy (2004) Prevention of Prespawning Mortality:
Cause of Salmon Headburns and Cranial Lesions. Final Report Prepared by Battelle, PNNL for the U.S. Army Corps of Engineers, Portland District, Portland, Oregon Under a Related Services Agreement With the U.S. Department of Energy Contract DE-AC06-76RL01830
NMFS (National Marine Fisheries Service) (1999) Endangered and threatened species:
threatened status for three Chinook salmon evolutionarily significant units (ESUs) in Washington and Oregon, and endangered status for one Chinook salmon ESU in Washington. Federal Register 64(56):14308-14328.
NMFS (2008) 2008 Willamette Project Biological Opinion. NMFS. Olson, R.E., J.R. Pierce (1997) A trematode metacercaria causing gill cartilage proliferation in
steelhead trout from Oregon. Journal of Wildlife Diseases 33:886 Orsi, J.J. (1971) Thermal shock and upper lethal temperature tolerances of young king salmon,
Oncorhynchus tshawytscha, from the Sacramento-San Joaquin River system. Report No. 71-11, California Department of Fish and Game, Sacramento, CA

77
Pinson, A.M. (2005) Energy use, migration time and spawning success of adult Chinook salmon returning to the South Fork of the Salmon River in Central Idaho. Department of Fish and Wildlife. Master’s Thesis, University of Idaho, Moscow, Idaho.
Quinn, T.P., and D.J. Adams (1996) Environmental changes affecting the migratory timing of
American shad and sockeye salmon. Ecology 77:1151-1162. Quinn, T.P., S. Hodgson and C. Pevans (1997) Temperature, flow, and the migration of adult
sockeye salmon (Oncorhynchus nerka) in the Columbia River. Canadian Journal of Fisheries and Aquatic Science 54:1349-1360.
Rand, P.S., S.G. Hinch, J. Morrison, M.G.G. Foreman, M.J. MacNutt, J.S. Macdonald, M.C.
Healey, A.P. Farrell, and D.A. Higgs (2006) Effects of river discharge, temperature, and future climates on energetics and mortality of adult migrating Fraser River sockeye salmon. Transactions of the American Fisheries Society 135:655-667.
Richter, A. and S.A. Kolmes (2005) Maximum temperature limits for Chinook, Coho, and chum
salmon, and steelhead trout in the Pacific Northwest. Reviews in Fisheries Science 13:23-49. Rounds, S.A. (2007) Temperature effects of point sources, riparian shading, and dam operations
on the Willamette River, Oregon. U.S. Geological Survey Scientific Investigations Report 2007-5185, 34 p.
Rounds, S.A. (2010) Thermal effects of dams in the Willamette River basin, Oregon. U.S.
Geological Survey Scientific Investigations Report 2010-5153, 64 p. Schreck, C.B., W. Contreras-Sanchez, and M.S. Fitzpatrick (2001) Effects of stress on fish
reproduction, gamete quality, and progeny. Aquaculture 197:3-24. Schroeder, R.K., K.R. Kenaston, and L.K. McLaughlin (2007) Spring Chinook salmon in the
Willamette and Sandy rivers. Oregon Department of Fish and Wildlife, Portland, OR, 62 pp. Sokal, R., and F.J. Rohlf (1995). Biometry. New York, W.H. Freeman and Co. Shaw, R.W., M.L. Kent, A.M.V. Brown, C.M. Whipps, and M.L. Adamson (2000) Experimental
and natural host specificity of Loma salmonae (Microsporidia). Diseases of Aquatic Organisms 40:131-136.
Traxler, G.S., J. Richard, and T. E. McDonald (1998) Ichthyophthirius multifiliis (Ich) Epizootics
in spawning sockeye salmon in British Columbia, Canada. Journal of Aquatic Animal Health 10:143-151.
Whipps, C.M., T. Burton, V.G. Watral, S. St-Hilaire, and M.L. Kent (2005) Assessing the
accuracy of a polymerase chain reaction test for Ichthyophonus hoferi in Yukon River Chinook salmon (Oncorhynchus tshawytscha). Diseases of Aquatic Organisms 68: 141-147.

78
Copyright © 2022 FDOKUMEN