Spatial distribution of N‐cycling microbial communities showed complex patterns in constructed...
12
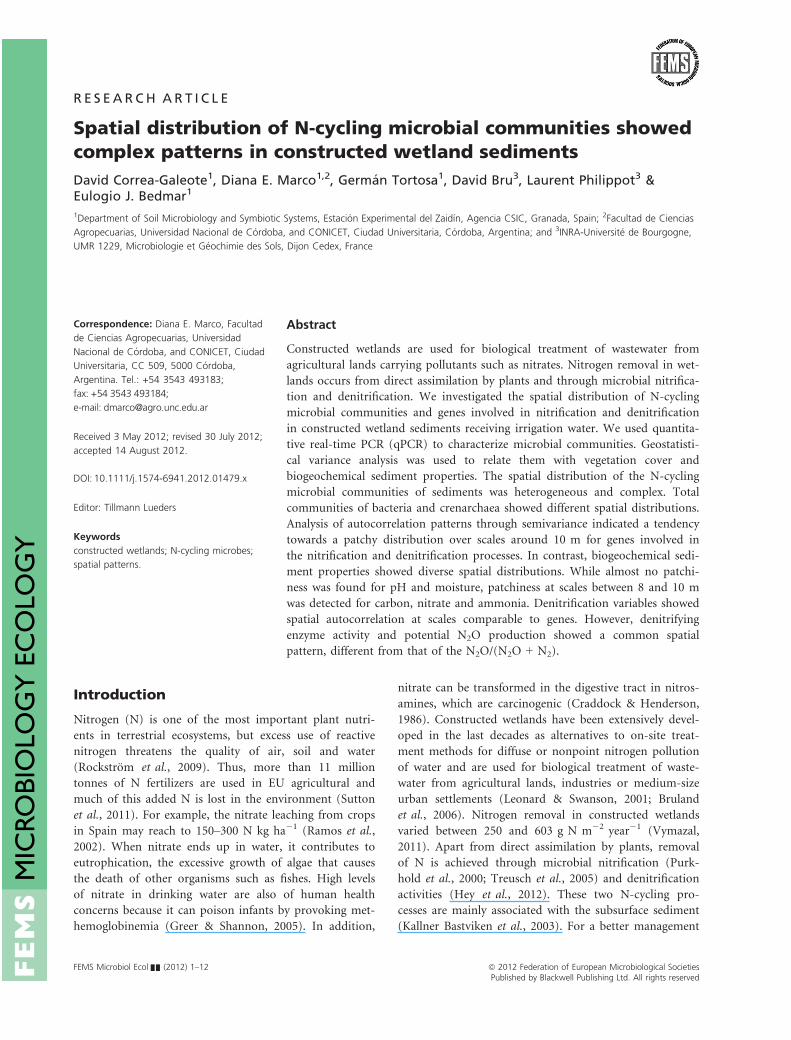
RESEARCH ARTICLE Spatial distribution of N-cycling microbial communities showed complex patterns in constructed wetland sediments David Correa-Galeote 1 , Diana E. Marco 1,2 , Germa ´ n Tortosa 1 , David Bru 3 , Laurent Philippot 3 & Eulogio J. Bedmar 1 1 Department of Soil Microbiology and Symbiotic Systems, Estacio ´n Experimental del Zaidı´n, Agencia CSIC, Granada, Spain; 2 Facultad de Ciencias Agropecuarias, Universidad Nacional de Co ´ rdoba, and CONICET, Ciudad Universitaria, Co ´ rdoba, Argentina; and 3 INRA-Universite ´ de Bourgogne, UMR 1229, Microbiologie et Ge ´ ochimie des Sols, Dijon Cedex, France Correspondence: Diana E. Marco, Facultad de Ciencias Agropecuarias, Universidad Nacional de Co ´ rdoba, and CONICET, Ciudad Universitaria, CC 509, 5000 Co ´ rdoba, Argentina. Tel.: +54 3543 493183; fax: +54 3543 493184; e-mail: [email protected] Received 3 May 2012; revised 30 July 2012; accepted 14 August 2012. DOI: 10.1111/j.1574-6941.2012.01479.x Editor: Tillmann Lueders Keywords constructed wetlands; N-cycling microbes; spatial patterns. Abstract Constructed wetlands are used for biological treatment of wastewater from agricultural lands carrying pollutants such as nitrates. Nitrogen removal in wet- lands occurs from direct assimilation by plants and through microbial nitrifica- tion and denitrification. We investigated the spatial distribution of N-cycling microbial communities and genes involved in nitrification and denitrification in constructed wetland sediments receiving irrigation water. We used quantita- tive real-time PCR (qPCR) to characterize microbial communities. Geostatisti- cal variance analysis was used to relate them with vegetation cover and biogeochemical sediment properties. The spatial distribution of the N-cycling microbial communities of sediments was heterogeneous and complex. Total communities of bacteria and crenarchaea showed different spatial distributions. Analysis of autocorrelation patterns through semivariance indicated a tendency towards a patchy distribution over scales around 10 m for genes involved in the nitrification and denitrification processes. In contrast, biogeochemical sedi- ment properties showed diverse spatial distributions. While almost no patchi- ness was found for pH and moisture, patchiness at scales between 8 and 10 m was detected for carbon, nitrate and ammonia. Denitrification variables showed spatial autocorrelation at scales comparable to genes. However, denitrifying enzyme activity and potential N 2 O production showed a common spatial pattern, different from that of the N 2 O/(N 2 O + N 2 ). Introduction Nitrogen (N) is one of the most important plant nutri- ents in terrestrial ecosystems, but excess use of reactive nitrogen threatens the quality of air, soil and water (Rockstro ¨m et al., 2009). Thus, more than 11 million tonnes of N fertilizers are used in EU agricultural and much of this added N is lost in the environment (Sutton et al., 2011). For example, the nitrate leaching from crops in Spain may reach to 150–300 N kg ha 1 (Ramos et al., 2002). When nitrate ends up in water, it contributes to eutrophication, the excessive growth of algae that causes the death of other organisms such as fishes. High levels of nitrate in drinking water are also of human health concerns because it can poison infants by provoking met- hemoglobinemia (Greer & Shannon, 2005). In addition, nitrate can be transformed in the digestive tract in nitros- amines, which are carcinogenic (Craddock & Henderson, 1986). Constructed wetlands have been extensively devel- oped in the last decades as alternatives to on-site treat- ment methods for diffuse or nonpoint nitrogen pollution of water and are used for biological treatment of waste- water from agricultural lands, industries or medium-size urban settlements (Leonard & Swanson, 2001; Bruland et al., 2006). Nitrogen removal in constructed wetlands varied between 250 and 603 g N m 2 year 1 (Vymazal, 2011). Apart from direct assimilation by plants, removal of N is achieved through microbial nitrification (Purk- hold et al., 2000; Treusch et al., 2005) and denitrification activities (Hey et al., 2012). These two N-cycling pro- cesses are mainly associated with the subsurface sediment (Kallner Bastviken et al., 2003). For a better management FEMS Microbiol Ecol && (2012) 1–12 ª 2012 Federation of European Microbiological Societies Published by Blackwell Publishing Ltd. All rights reserved MICROBIOLOGY ECOLOGY
-
Upload
nationalagriculturalresearchinra -
Category
Documents
-
view
1 -
download
0
Transcript of Spatial distribution of N‐cycling microbial communities showed complex patterns in constructed...
R E S EA RCH AR T I C L E
Spatial distribution of N-cycling microbial communities showedcomplex patterns in constructed wetland sediments
David Correa-Galeote1, Diana E. Marco1,2, German Tortosa1, David Bru3, Laurent Philippot3 &Eulogio J. Bedmar1
1Department of Soil Microbiology and Symbiotic Systems, Estacion Experimental del Zaidın, Agencia CSIC, Granada, Spain; 2Facultad de Ciencias
Agropecuarias, Universidad Nacional de Cordoba, and CONICET, Ciudad Universitaria, Cordoba, Argentina; and 3INRA-Universite de Bourgogne,
UMR 1229, Microbiologie et Geochimie des Sols, Dijon Cedex, France
Correspondence: Diana E. Marco, Facultad
de Ciencias Agropecuarias, Universidad
Nacional de Cordoba, and CONICET, Ciudad
Universitaria, CC 509, 5000 Cordoba,
Argentina. Tel.: +54 3543 493183;
fax: +54 3543 493184;
e-mail: [email protected]
Received 3 May 2012; revised 30 July 2012;
accepted 14 August 2012.
DOI: 10.1111/j.1574-6941.2012.01479.x
Editor: Tillmann Lueders
Keywords
constructed wetlands; N-cycling microbes;
spatial patterns.
Abstract
Constructed wetlands are used for biological treatment of wastewater from
agricultural lands carrying pollutants such as nitrates. Nitrogen removal in wet-
lands occurs from direct assimilation by plants and through microbial nitrifica-
tion and denitrification. We investigated the spatial distribution of N-cycling
microbial communities and genes involved in nitrification and denitrification
in constructed wetland sediments receiving irrigation water. We used quantita-
tive real-time PCR (qPCR) to characterize microbial communities. Geostatisti-
cal variance analysis was used to relate them with vegetation cover and
biogeochemical sediment properties. The spatial distribution of the N-cycling
microbial communities of sediments was heterogeneous and complex. Total
communities of bacteria and crenarchaea showed different spatial distributions.
Analysis of autocorrelation patterns through semivariance indicated a tendency
towards a patchy distribution over scales around 10 m for genes involved in
the nitrification and denitrification processes. In contrast, biogeochemical sedi-
ment properties showed diverse spatial distributions. While almost no patchi-
ness was found for pH and moisture, patchiness at scales between 8 and 10 m
was detected for carbon, nitrate and ammonia. Denitrification variables showed
spatial autocorrelation at scales comparable to genes. However, denitrifying
enzyme activity and potential N2O production showed a common spatial
pattern, different from that of the N2O/(N2O + N2).
Introduction
Nitrogen (N) is one of the most important plant nutri-
ents in terrestrial ecosystems, but excess use of reactive
nitrogen threatens the quality of air, soil and water
(Rockstrom et al., 2009). Thus, more than 11 million
tonnes of N fertilizers are used in EU agricultural and
much of this added N is lost in the environment (Sutton
et al., 2011). For example, the nitrate leaching from crops
in Spain may reach to 150–300 N kg ha�1 (Ramos et al.,
2002). When nitrate ends up in water, it contributes to
eutrophication, the excessive growth of algae that causes
the death of other organisms such as fishes. High levels
of nitrate in drinking water are also of human health
concerns because it can poison infants by provoking met-
hemoglobinemia (Greer & Shannon, 2005). In addition,
nitrate can be transformed in the digestive tract in nitros-
amines, which are carcinogenic (Craddock & Henderson,
1986). Constructed wetlands have been extensively devel-
oped in the last decades as alternatives to on-site treat-
ment methods for diffuse or nonpoint nitrogen pollution
of water and are used for biological treatment of waste-
water from agricultural lands, industries or medium-size
urban settlements (Leonard & Swanson, 2001; Bruland
et al., 2006). Nitrogen removal in constructed wetlands
varied between 250 and 603 g N m�2 year�1 (Vymazal,
2011). Apart from direct assimilation by plants, removal
of N is achieved through microbial nitrification (Purk-
hold et al., 2000; Treusch et al., 2005) and denitrification
activities (Hey et al., 2012). These two N-cycling pro-
cesses are mainly associated with the subsurface sediment
(Kallner Bastviken et al., 2003). For a better management
FEMS Microbiol Ecol && (2012) 1–12 ª 2012 Federation of European Microbiological SocietiesPublished by Blackwell Publishing Ltd. All rights reserved
MIC
ROBI
OLO
GY
EC
OLO
GY
of constructed wetlands, the role of plant species, pH,
nutrient flow and organic carbon availability have mostly
been investigated (Bachand and Horne, 2000; Park et al.,
2008; Peralta et al., 2010).
Despite their crucial role in N-removal, only few stud-
ies have focused on the microorganisms performing the
nitrification and denitrification processes in constructed
wetlands (Song et al., 2010, 2012; Chon et al., 2011).
Analysis of the potential activity and the diversity of nitri-
fying and denitrifying communities in constructed wet-
lands show that plants species influence both the
functioning and structure of these N-cycling guilds (Ruiz-
Rueda et al., 2008). Similarly, the presence and type of
plants was related to the abundances of denitrifiers in the
same wetland (Garcia-Lledo et al., 2011). Differences in
the denitrifier community structure were also reported
between the different areas of the wetland sediment by
Kjellin et al. (2007). The microbial community structure
patterns were related to the water flow showing increased
diversity with decreasing nutrient levels and increasing
water residence times. The water residence times also best
explained spatial variations of potential denitrification in
the wetland (Kjellin et al. 2007). While the spatial distri-
bution of N-cycling communities has been investigated in
arable soil for a better understanding of N-processes in
soil (Philippot et al., 2009a; Enwall et al., 2010), our
knowledge the spatial distribution of the different micro-
bial guilds in constructed wetlands is scarce. However,
understanding the spatial heterogeneity of the nitrifying
and denitrifying communities and of their activities across
these engineered systems in relation to biogeochemical
sediment properties and vegetation cover is of importance
for wetland construction and optimal N-removal.
In this work, we investigated the spatial distribution of
the abundance and the activity of N-cycling microbial
guilds in constructed wetland sediments receiving irriga-
tion water from orchard crops. As the irrigation water
course through the constructed wetland was expected to
cause spatial variation in nitrogenated leachates, we
hypothesized that key environmental variables, potential
denitrification, potential N2 O emissions and communi-
ties of microbial denitrifiers and ammonia oxidizers
would show a defined spatial structure. Microbial com-
munities were quantified by real-time PCR and along
with environmental and denitrification measurements
were analysed using geostatistical methods.
Material and methods
Experimental site
The experimental site was a constructed wetland called
Los Guayules (UTM coordinates 29S 0721735, 4108590)
located near El Rocio marsh within Donana National
Park (south-west Spain). The wetland receives water from
irrigation of nearby fruit orchards. The water regime is
seasonal, flooding in winter and partially drying during
summer. Vegetation is represented by a perennial com-
munity of aquatic and water-associated plants dominated
by Typha spp., Imperata cylindrica, Juncus effusus, Scirpus
holoschoenus and S. maritimus (Supporting information,
Fig. S1a).
Sampling design
To detect the spatial variation of environmental variables,
denitrifying genes and associated activity, a regular design
of 50 sampling points in a 25 9 50 m grid with 5 m sepa-
ration distance was used. The grid was oriented following
the irrigation water course through the constructed wet-
land (Fig. S1b). Sampling was carried out during the dry
season. The dry season was chosen for sampling because it
was the time when a higher abundance of denitrifiers was
found, determined by qPCR in preliminary surveys. The
wetland sediments remain with high moisture content
even during the dry season. Vegetation cover was esti-
mated by recording the percentage of cover using a
25 9 25 cm square placed over each sampling point.
Cover percentage was coded as 0 (no vegetation cover), 1
(1–50% cover), 2 (51–75% cover) and 3 (75–100%) cover.
Soil analyses
Texture of the site sediments was determined in samples
according to the Spanish Official Methods for Soils and
Waters (MAPA, 1974). It was classified as sandy clay
loam sediment and contains 55% sand, 22.5% clay and
22.5% silt.
The top sediment layer (0–20 cm) was collected from
the 50 sampling points. Samples were kept refrigerated
during transport to the laboratory. Samples were appro-
priately fractionated, either immediately treated or stored
under appropriate conditions depending on the analyses
to be performed. Sediment moisture was determined
gravimetrically by over-drying the sample at 105 °C for
24 h. In fresh samples, NHþ4 (after 2 h extraction 1 : 20
w/v with 2N KCl), NO�3 and NO�
2 (water-extracted 1 : 20
w/v) and pH (after water extraction 1 : 5 w/v for 2 h),
total organic carbon (TOC) and total nitrogen (TN) were
determined as indicated earlier (Tortosa et al., 2011).
Denitrification activity measurements
Potential denitrifying enzyme activity (DEA) was deter-
mined in fresh sediment samples using an acetylene inhi-
bition technique as previously described (Ryden &
ª 2012 Federation of European Microbiological Societies FEMS Microbiol Ecol && (2012) 1–12Published by Blackwell Publishing Ltd. All rights reserved
2 D. Correa-Galeote et al.
Dawson, 1982). Briefly, anaerobic slurry was prepared by
mixing 25 g soil and 25 mL of a solution containing
1 mM glucose, 1 mM KNO3 and 1 g L�1 chlorampheni-
col in a 125-mL glass bottle. The headspace was evacu-
ated and flushed four times with He and 10 mL of
acetylene were added. The samples were shaken at 25 °C,and the concentration of N2O was measured in the head-
space after 30 and 60 min of incubation by gas chroma-
tography as previously described (Tortosa et al., 2011).
DEA was calculated from the N2O increase during incu-
bation using the Bunsen coefficient for the N2O dissolved
in water. Potential N2O production was determined by
incubating parallel sediment samples without acetylene.
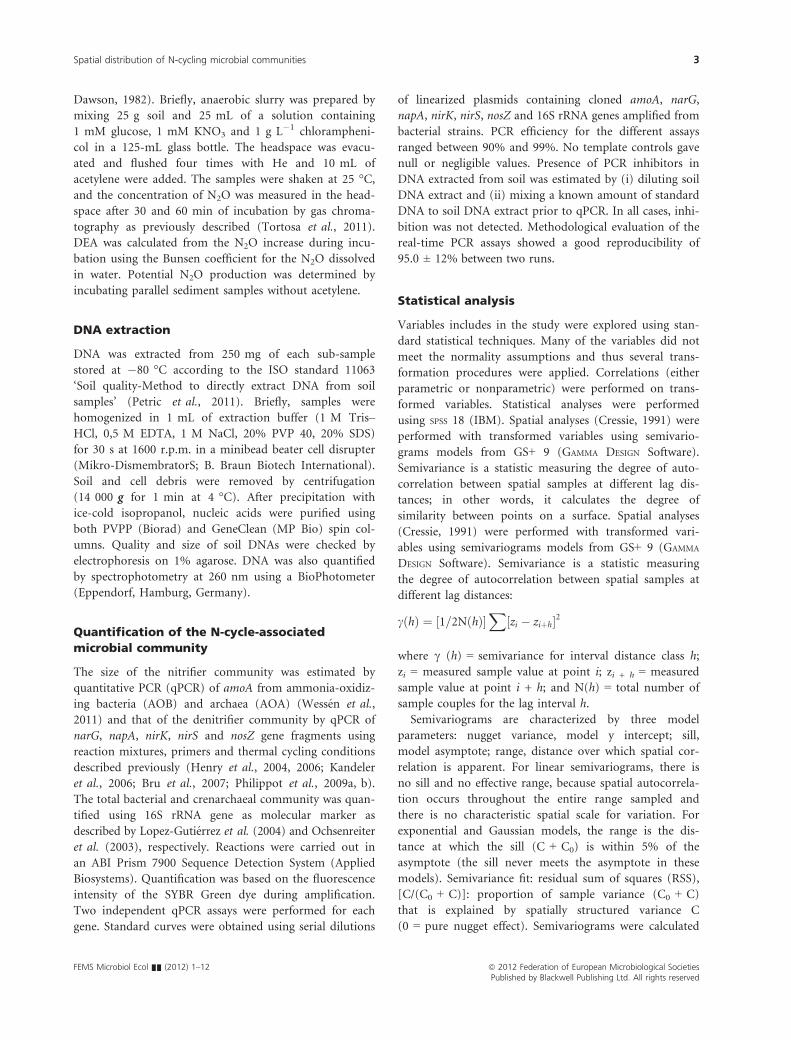
DNA extraction
DNA was extracted from 250 mg of each sub-sample
stored at �80 °C according to the ISO standard 11063
‘Soil quality-Method to directly extract DNA from soil
samples’ (Petric et al., 2011). Briefly, samples were
homogenized in 1 mL of extraction buffer (1 M Tris–HCl, 0,5 M EDTA, 1 M NaCl, 20% PVP 40, 20% SDS)
for 30 s at 1600 r.p.m. in a minibead beater cell disrupter
(Mikro-DismembratorS; B. Braun Biotech International).
Soil and cell debris were removed by centrifugation
(14 000 g for 1 min at 4 °C). After precipitation with
ice-cold isopropanol, nucleic acids were purified using
both PVPP (Biorad) and GeneClean (MP Bio) spin col-
umns. Quality and size of soil DNAs were checked by
electrophoresis on 1% agarose. DNA was also quantified
by spectrophotometry at 260 nm using a BioPhotometer
(Eppendorf, Hamburg, Germany).
Quantification of the N-cycle-associated
microbial community
The size of the nitrifier community was estimated by
quantitative PCR (qPCR) of amoA from ammonia-oxidiz-
ing bacteria (AOB) and archaea (AOA) (Wessen et al.,
2011) and that of the denitrifier community by qPCR of
narG, napA, nirK, nirS and nosZ gene fragments using
reaction mixtures, primers and thermal cycling conditions
described previously (Henry et al., 2004, 2006; Kandeler
et al., 2006; Bru et al., 2007; Philippot et al., 2009a, b).
The total bacterial and crenarchaeal community was quan-
tified using 16S rRNA gene as molecular marker as
described by Lopez-Gutierrez et al. (2004) and Ochsenreiter
et al. (2003), respectively. Reactions were carried out in
an ABI Prism 7900 Sequence Detection System (Applied
Biosystems). Quantification was based on the fluorescence
intensity of the SYBR Green dye during amplification.
Two independent qPCR assays were performed for each
gene. Standard curves were obtained using serial dilutions
of linearized plasmids containing cloned amoA, narG,
napA, nirK, nirS, nosZ and 16S rRNA genes amplified from
bacterial strains. PCR efficiency for the different assays
ranged between 90% and 99%. No template controls gave
null or negligible values. Presence of PCR inhibitors in
DNA extracted from soil was estimated by (i) diluting soil
DNA extract and (ii) mixing a known amount of standard
DNA to soil DNA extract prior to qPCR. In all cases, inhi-
bition was not detected. Methodological evaluation of the
real-time PCR assays showed a good reproducibility of
95.0 ± 12% between two runs.
Statistical analysis
Variables includes in the study were explored using stan-
dard statistical techniques. Many of the variables did not
meet the normality assumptions and thus several trans-
formation procedures were applied. Correlations (either
parametric or nonparametric) were performed on trans-
formed variables. Statistical analyses were performed
using SPSS 18 (IBM). Spatial analyses (Cressie, 1991) were
performed with transformed variables using semivario-
grams models from GS+ 9 (GAMMA DESIGN Software).
Semivariance is a statistic measuring the degree of auto-
correlation between spatial samples at different lag dis-
tances; in other words, it calculates the degree of
similarity between points on a surface. Spatial analyses
(Cressie, 1991) were performed with transformed vari-
ables using semivariograms models from GS+ 9 (GAMMA
DESIGN Software). Semivariance is a statistic measuring
the degree of autocorrelation between spatial samples at
different lag distances:
cðhÞ ¼ ½1=2NðhÞ�X
½zi � ziþh�2
where c (h) = semivariance for interval distance class h;
zi = measured sample value at point i; zi + h = measured
sample value at point i + h; and N(h) = total number of
sample couples for the lag interval h.
Semivariograms are characterized by three model
parameters: nugget variance, model y intercept; sill,
model asymptote; range, distance over which spatial cor-
relation is apparent. For linear semivariograms, there is
no sill and no effective range, because spatial autocorrela-
tion occurs throughout the entire range sampled and
there is no characteristic spatial scale for variation. For
exponential and Gaussian models, the range is the dis-
tance at which the sill (C + C0) is within 5% of the
asymptote (the sill never meets the asymptote in these
models). Semivariance fit: residual sum of squares (RSS),
[C/(C0 + C)]: proportion of sample variance (C0 + C)
that is explained by spatially structured variance C
(0 = pure nugget effect). Semivariograms were calculated
FEMS Microbiol Ecol && (2012) 1–12 ª 2012 Federation of European Microbiological SocietiesPublished by Blackwell Publishing Ltd. All rights reserved
Spatial distribution of N-cycling microbial communities 3

with the field data and fitted to any of the following
models: linear, exponential, spherical or Gaussian, either
isotropic or anisotropic, using the statistics (RSS, the
residual sums of squares and C0/(C0 + C), the proportion
of sample variance (C0 + C) that is explained by spatially
structured variance C) provided by the software. RSS pro-
vides an exact measure of how well the model fits the
data; the lower RSS, the better the model fits. Thus, from
different possible models, the one with lower RSS is cho-
sen. C0/(C0 + C) value will be 1.0 for a variogram with
no nugget variance (where the curve passes through the
origin); conversely, it will be 0 where there is no spatially
dependent variation at the range specified, that is, where
there is a pure nugget effect. This pure nugget effect
should be interpreted with caution because it may be the
result of a lack of resolution at small spatial scales. Fractal
variograms were also calculated to explore if the mea-
sured variables showed fractal or self-similarity properties,
indicated by the Hausdorff-Besicovitch statistic D (Bur-
rough 1981). D is close to 1 for linear dimensions and 2
for plane dimensions.
Interpolation to estimate values in an area for points
not actually sampled was carried out by ordinary kriging
over the whole sampled field. Cross-validation analysis
was used to evaluate kriging fit. In cross-validation analy-
sis, each measured point in the spatial domain is individ-
ually removed from the domain and its value estimated
as though it were never there. Then, the point is replaced,
and the next point is removed and estimated, and so on.
In this way, a regression of estimated vs. actual values for
each sample location in the domain is calculated. The
regression coefficient represents a measure of the good-
ness of fit for the least-squares model describing the lin-
ear regression equation. A perfect 1 : 1 fit would have a
regression coefficient (slope) of 1.00.
For more details on geostatistical methods refer to the
Appendix S1.
Gene abundances were analysed as absolute or relative
abundances (gene copy number/16S rRNA gene Bacteria
copy number). As the number of 16S rRNA gene operon
per cells is variable (Klappenbach et al., 2001), we did not
convert the 16S rRNA gene copy data into cells numbers
and we expressed our results as gene copy numbers per
nanogram of DNA. Calculation of the gene copy number
per nanogram of DNA instead of gram of soil minimized
any bias related to soil DNA extraction efficiency.
Results
Environmental variables
The sampled area was almost totally covered with vegeta-
tion, although with different percentages (Fig. S2). The
surveyed sediment was acid, with pH values ranging from
4.47 to 6.42. Percentage of sediment moisture varied
from 3.53 to 22.46. Total organic carbon (TOC) varied
from 2.91 to 23.35 g kg�1 dry sediment. Ammonium and
NO�3 content varied widely, up to 8.73 and 168 mg kg�1
dry sediment respectively, depending on the vicinity to
the source of suspected contaminated water. Total nitro-
gen (TN) content varied less, ranging from 0.24 to
1.89 g kg�1 dry sediment. Expectedly, several sediment
variables were cross-correlated (Table S1). NO�3 was
correlated with TN content and TOC. TN showed a high
correlation with TOC, a lower one with sediment mois-
ture and an inverse correlation with pH. Sediment mois-
ture was also correlated with TOC and inversely
correlated with pH. Only pH was significantly correlated
(negatively) with vegetation cover and ammonia.
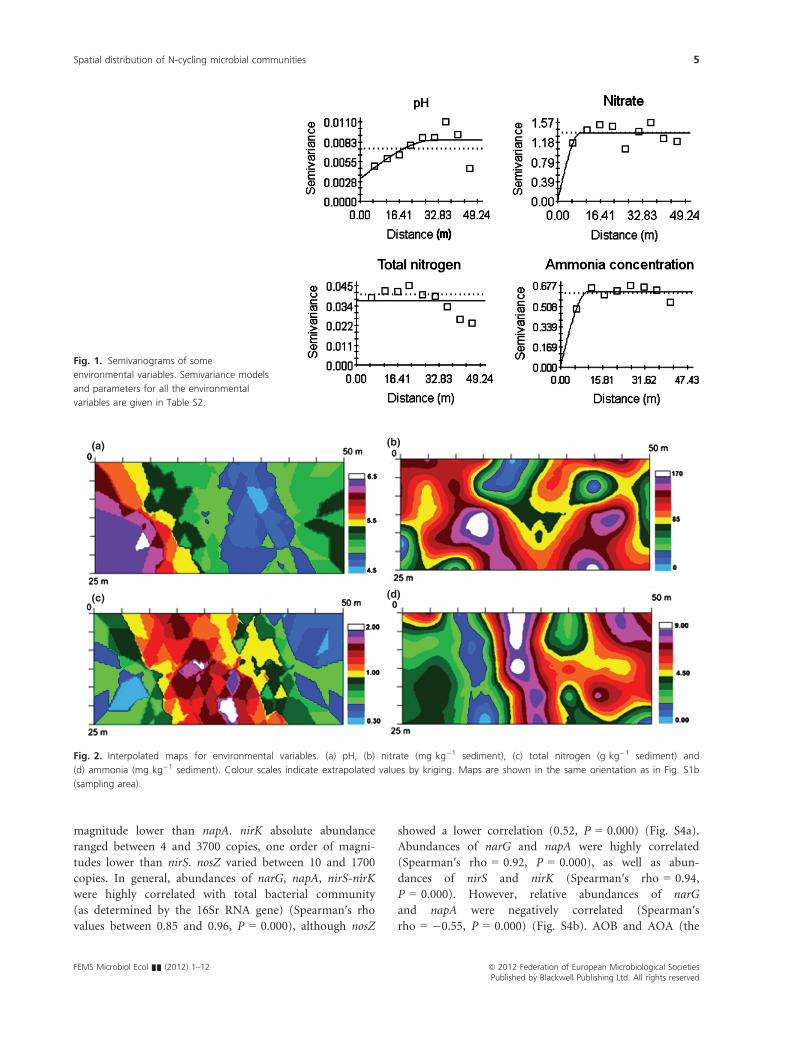
Fitted semivariance models revealed that sediment pH
(Fig. 1, Table S2) and moisture (Table S2) showed spatial
dependence over almost all the range considered (ranges
about 31 m). In contrast, TOC (Table S2), NO�3 and
ammonia (Table S2 and Fig. 1) did not show spatial
dependence over medium and larger scales (ranges
between 8 and 10 m). As TN was fitted by a linear semi-
variance model, no spatial dependence was observed at
the scale considered in the study (pure nugget effect)
(Table S2 and Fig. 1).
Fractal variograms showed values of the Hausdorff-
Besicovitch statistic D close to 2, indicating a plane
distribution of self-similar, repetitive variation of the
environmental variables over the sampled area, but only
sediment moisture and ammonia showed good fit
(R2 = 0.88 and 0.56, respectively, Table S3). In contrast,
nitrate concentration showed a D value closer to 1.5
(R2 = 0.49), indicating a repetitive but more linear distri-
bution (Table S3). Interpolated (kriged) maps of environ-
mental variables showed a good fit, except for nitrate
(Table S3). Spatial distribution of environmental variables
is shown in Fig. 2 and Fig. S3.
Spatial distribution of microbial communities
Gene abundances were analysed as absolute (hereafter
abundance) or relative abundances (gene copy numbers/
16S rRNA gene Bacteria copy numbers, hereafter relative
abundance). Abundances of both total bacterial and cren-
archaeal community (16S rRNA gene of Bacteria and
crenarchaea) and denitrification genes (narG, napA, nirS,
nirK, nosZ) were highly variable, ranging several magni-
tude orders. Absolute abundance of 16S rRNA gene of
Bacteria ranged between 360 and 360 000 copies, one
order of magnitude greater than the number of copies of
16S rRNA gene of crenarchaea. The narG absolute abun-
dance varied between 30 and 5700 copies, one order of
ª 2012 Federation of European Microbiological Societies FEMS Microbiol Ecol && (2012) 1–12Published by Blackwell Publishing Ltd. All rights reserved
4 D. Correa-Galeote et al.
magnitude lower than napA. nirK absolute abundance
ranged between 4 and 3700 copies, one order of magni-
tudes lower than nirS. nosZ varied between 10 and 1700
copies. In general, abundances of narG, napA, nirS-nirK
were highly correlated with total bacterial community
(as determined by the 16Sr RNA gene) (Spearman′s rho
values between 0.85 and 0.96, P = 0.000), although nosZ
showed a lower correlation (0.52, P = 0.000) (Fig. S4a).
Abundances of narG and napA were highly correlated
(Spearman′s rho = 0.92, P = 0.000), as well as abun-
dances of nirS and nirK (Spearman′s rho = 0.94,
P = 0.000). However, relative abundances of narG
and napA were negatively correlated (Spearman′srho = �0.55, P = 0.000) (Fig. S4b). AOB and AOA (the
(a) (b)
(c) (d)
Fig. 2. Interpolated maps for environmental variables. (a) pH, (b) nitrate (mg kg�1 sediment), (c) total nitrogen (g kg�1 sediment) and
(d) ammonia (mg kg�1 sediment). Colour scales indicate extrapolated values by kriging. Maps are shown in the same orientation as in Fig. S1b
(sampling area).
Fig. 1. Semivariograms of some
environmental variables. Semivariance models
and parameters for all the environmental
variables are given in Table S2.
FEMS Microbiol Ecol && (2012) 1–12 ª 2012 Federation of European Microbiological SocietiesPublished by Blackwell Publishing Ltd. All rights reserved
Spatial distribution of N-cycling microbial communities 5
ammonia-oxidizing bacteria and archaea harbouring the
amoA gene) showed very sparse distributions. Although
AOB was a magnitude order more abundant (up to 1700
copies) than AOA, their abundances were moderately cor-
related (Spearman′s rho = 0.50, P = 0.000). Few signifi-
cant relationships involving environmental variables and
genes distribution were found (Table S4). The few signifi-
cant correlations involved complex relationships. For
example, the relative abundance of nosZ was significantly,
although negatively, correlated with pH, and not corre-
lated with TN (Fig. S4c), even when TN which was in
turn negatively correlated with pH (Table S1). Other sig-
nificant correlations showed negative low values, like
those between pH and abundances of 16S rRNA gene
Bacteria and Archaea, narG, napA, nirS and nirK, and the
relative abundance of nirK. pH also showed a significant
and positive correlation with the abundance ratio nosZ/
narG. Nitrate was significantly although low correlated
with the abundance ratio nirS/nirK (Fig. S4d). TN was
correlated with the relative abundance of nirK. Neither
soil moisture nor TOC showed significant correlations
with genes distribution. For ammonia-oxidizing commu-
nities, only amoA from AOA showed a significant correla-
tion with ammonia (Spearman′s rho = 0.41, P = 0.02).
Vegetation cover showed low but significant correlations
with total bacterial and crenarchaeal communities, and
with absolute abundances of denitrifier genes narA, napA,
nirS and nirK, but not with nosZ. However, the ratio
between abundances of nosZ/narG showed a significant
correlation. Only the relative abundance of nirS showed
significant correlations with vegetation cover.
Total bacteria community determined by the 16S rRNA
gene did not show a characteristic spatial dependence
(Table S2 and Fig. S5a). In contrast, the abundance of the
crenarchaeal community showed a characteristic spatial
dependence, although over a scale around 10 m (Table
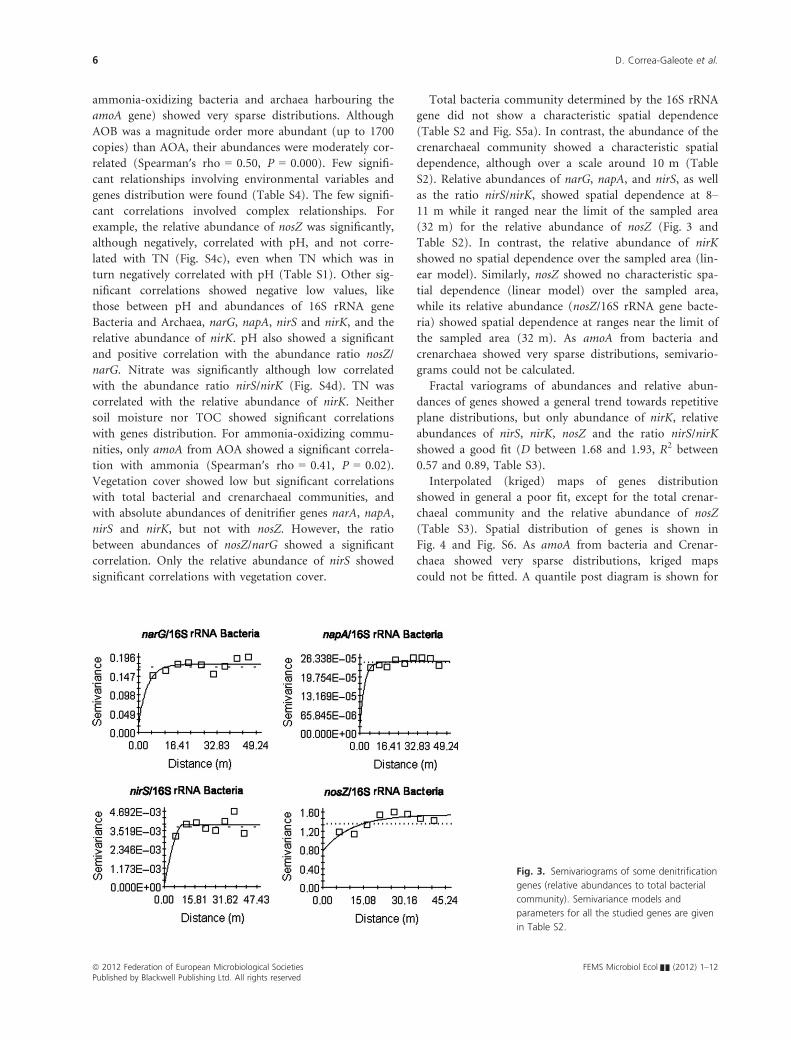
S2). Relative abundances of narG, napA, and nirS, as well
as the ratio nirS/nirK, showed spatial dependence at 8–11 m while it ranged near the limit of the sampled area
(32 m) for the relative abundance of nosZ (Fig. 3 and
Table S2). In contrast, the relative abundance of nirK
showed no spatial dependence over the sampled area (lin-
ear model). Similarly, nosZ showed no characteristic spa-
tial dependence (linear model) over the sampled area,
while its relative abundance (nosZ/16S rRNA gene bacte-
ria) showed spatial dependence at ranges near the limit of
the sampled area (32 m). As amoA from bacteria and
crenarchaea showed very sparse distributions, semivario-
grams could not be calculated.
Fractal variograms of abundances and relative abun-
dances of genes showed a general trend towards repetitive
plane distributions, but only abundance of nirK, relative
abundances of nirS, nirK, nosZ and the ratio nirS/nirK
showed a good fit (D between 1.68 and 1.93, R2 between
0.57 and 0.89, Table S3).
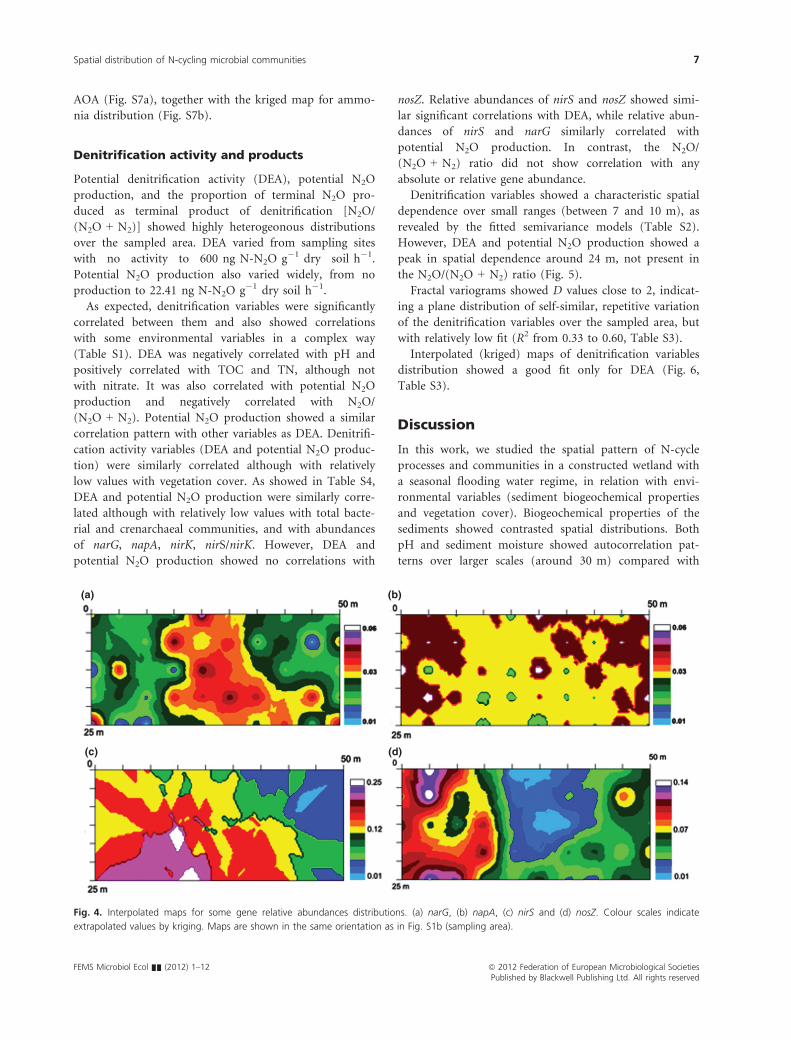
Interpolated (kriged) maps of genes distribution
showed in general a poor fit, except for the total crenar-
chaeal community and the relative abundance of nosZ
(Table S3). Spatial distribution of genes is shown in
Fig. 4 and Fig. S6. As amoA from bacteria and Crenar-
chaea showed very sparse distributions, kriged maps
could not be fitted. A quantile post diagram is shown for
Fig. 3. Semivariograms of some denitrification
genes (relative abundances to total bacterial
community). Semivariance models and
parameters for all the studied genes are given
in Table S2.
ª 2012 Federation of European Microbiological Societies FEMS Microbiol Ecol && (2012) 1–12Published by Blackwell Publishing Ltd. All rights reserved
6 D. Correa-Galeote et al.
AOA (Fig. S7a), together with the kriged map for ammo-
nia distribution (Fig. S7b).
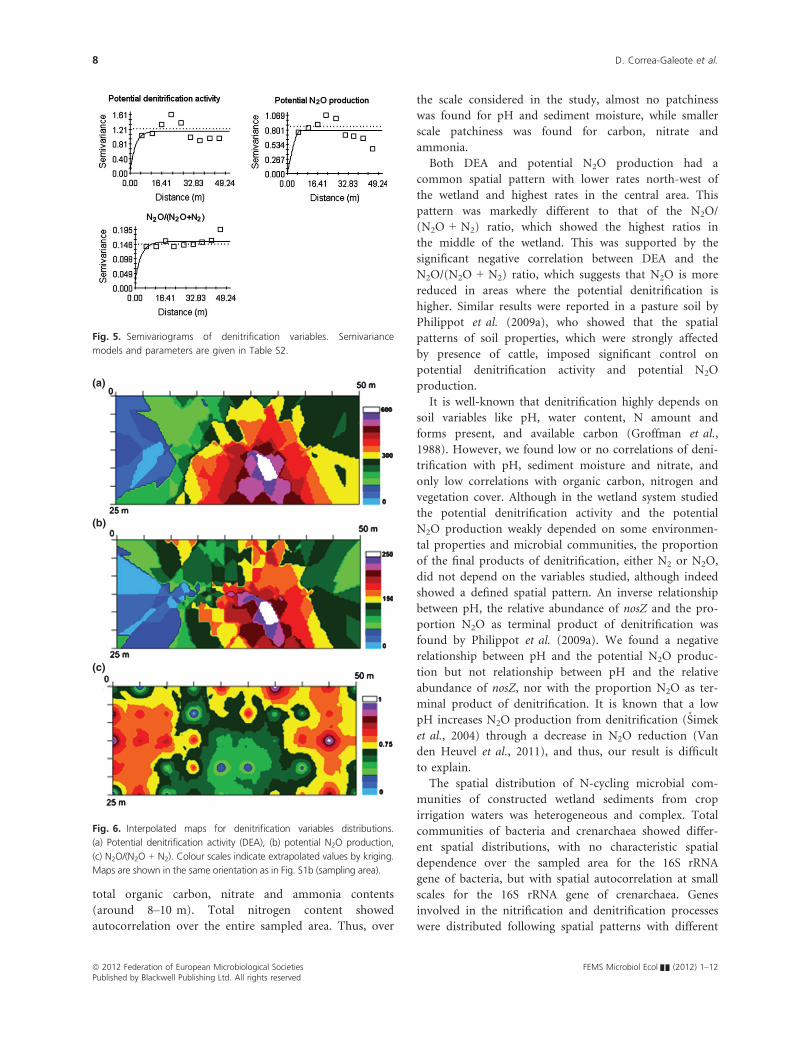
Denitrification activity and products
Potential denitrification activity (DEA), potential N2O
production, and the proportion of terminal N2O pro-
duced as terminal product of denitrification [N2O/
(N2O + N2)] showed highly heterogeonous distributions
over the sampled area. DEA varied from sampling sites
with no activity to 600 ng N-N2O g�1 dry soil h�1.
Potential N2O production also varied widely, from no
production to 22.41 ng N-N2O g�1 dry soil h�1.
As expected, denitrification variables were significantly
correlated between them and also showed correlations
with some environmental variables in a complex way
(Table S1). DEA was negatively correlated with pH and
positively correlated with TOC and TN, although not
with nitrate. It was also correlated with potential N2O
production and negatively correlated with N2O/
(N2O + N2). Potential N2O production showed a similar
correlation pattern with other variables as DEA. Denitrifi-
cation activity variables (DEA and potential N2O produc-
tion) were similarly correlated although with relatively
low values with vegetation cover. As showed in Table S4,
DEA and potential N2O production were similarly corre-
lated although with relatively low values with total bacte-
rial and crenarchaeal communities, and with abundances
of narG, napA, nirK, nirS/nirK. However, DEA and
potential N2O production showed no correlations with
nosZ. Relative abundances of nirS and nosZ showed simi-
lar significant correlations with DEA, while relative abun-
dances of nirS and narG similarly correlated with
potential N2O production. In contrast, the N2O/
(N2O + N2) ratio did not show correlation with any
absolute or relative gene abundance.
Denitrification variables showed a characteristic spatial
dependence over small ranges (between 7 and 10 m), as
revealed by the fitted semivariance models (Table S2).
However, DEA and potential N2O production showed a
peak in spatial dependence around 24 m, not present in
the N2O/(N2O + N2) ratio (Fig. 5).
Fractal variograms showed D values close to 2, indicat-
ing a plane distribution of self-similar, repetitive variation
of the denitrification variables over the sampled area, but
with relatively low fit (R2 from 0.33 to 0.60, Table S3).
Interpolated (kriged) maps of denitrification variables
distribution showed a good fit only for DEA (Fig. 6,
Table S3).
Discussion
In this work, we studied the spatial pattern of N-cycle
processes and communities in a constructed wetland with
a seasonal flooding water regime, in relation with envi-
ronmental variables (sediment biogeochemical properties
and vegetation cover). Biogeochemical properties of the
sediments showed contrasted spatial distributions. Both
pH and sediment moisture showed autocorrelation pat-
terns over larger scales (around 30 m) compared with
(a) (b)
(c) (d)
Fig. 4. Interpolated maps for some gene relative abundances distributions. (a) narG, (b) napA, (c) nirS and (d) nosZ. Colour scales indicate
extrapolated values by kriging. Maps are shown in the same orientation as in Fig. S1b (sampling area).
FEMS Microbiol Ecol && (2012) 1–12 ª 2012 Federation of European Microbiological SocietiesPublished by Blackwell Publishing Ltd. All rights reserved
Spatial distribution of N-cycling microbial communities 7
total organic carbon, nitrate and ammonia contents
(around 8–10 m). Total nitrogen content showed
autocorrelation over the entire sampled area. Thus, over
the scale considered in the study, almost no patchiness
was found for pH and sediment moisture, while smaller
scale patchiness was found for carbon, nitrate and
ammonia.
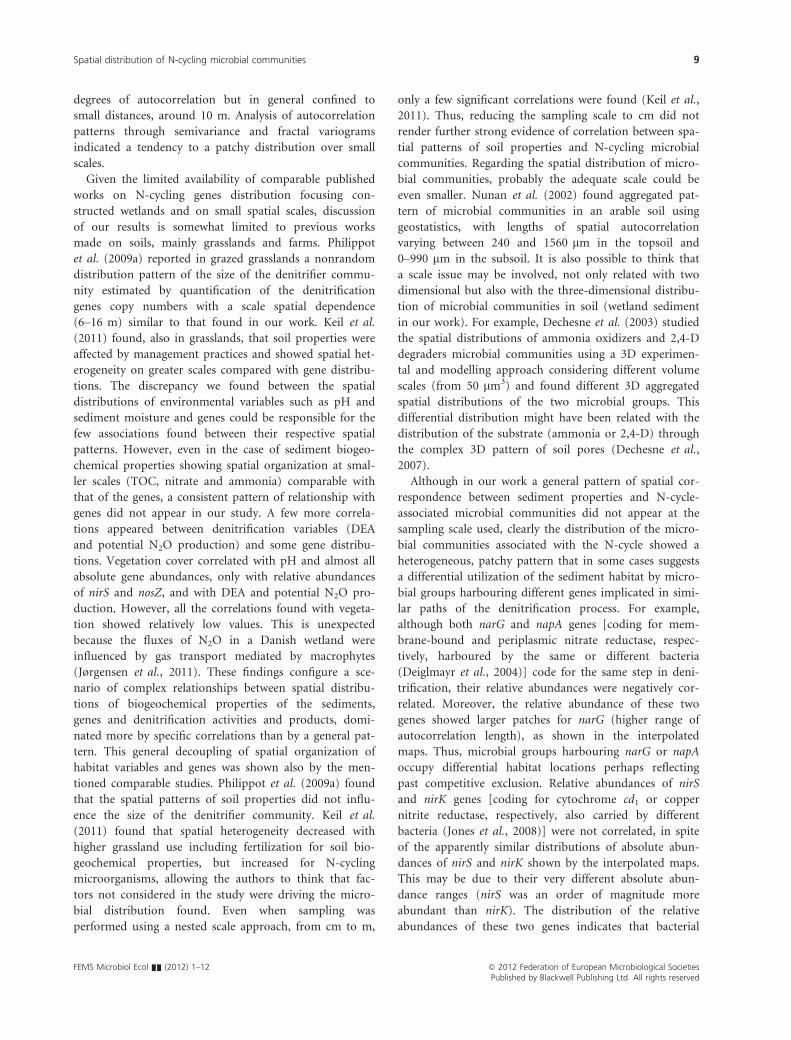
Both DEA and potential N2O production had a
common spatial pattern with lower rates north-west of
the wetland and highest rates in the central area. This
pattern was markedly different to that of the N2O/
(N2O + N2) ratio, which showed the highest ratios in
the middle of the wetland. This was supported by the
significant negative correlation between DEA and the
N2O/(N2O + N2) ratio, which suggests that N2O is more
reduced in areas where the potential denitrification is
higher. Similar results were reported in a pasture soil by
Philippot et al. (2009a), who showed that the spatial
patterns of soil properties, which were strongly affected
by presence of cattle, imposed significant control on
potential denitrification activity and potential N2O
production.
It is well-known that denitrification highly depends on
soil variables like pH, water content, N amount and
forms present, and available carbon (Groffman et al.,
1988). However, we found low or no correlations of deni-
trification with pH, sediment moisture and nitrate, and
only low correlations with organic carbon, nitrogen and
vegetation cover. Although in the wetland system studied
the potential denitrification activity and the potential
N2O production weakly depended on some environmen-
tal properties and microbial communities, the proportion
of the final products of denitrification, either N2 or N2O,
did not depend on the variables studied, although indeed
showed a defined spatial pattern. An inverse relationship
between pH, the relative abundance of nosZ and the pro-
portion N2O as terminal product of denitrification was
found by Philippot et al. (2009a). We found a negative
relationship between pH and the potential N2O produc-
tion but not relationship between pH and the relative
abundance of nosZ, nor with the proportion N2O as ter-
minal product of denitrification. It is known that a low
pH increases N2O production from denitrification (Simek
et al., 2004) through a decrease in N2O reduction (Van
den Heuvel et al., 2011), and thus, our result is difficult
to explain.
The spatial distribution of N-cycling microbial com-
munities of constructed wetland sediments from crop
irrigation waters was heterogeneous and complex. Total
communities of bacteria and crenarchaea showed differ-
ent spatial distributions, with no characteristic spatial
dependence over the sampled area for the 16S rRNA
gene of bacteria, but with spatial autocorrelation at small
scales for the 16S rRNA gene of crenarchaea. Genes
involved in the nitrification and denitrification processes
were distributed following spatial patterns with different
Fig. 5. Semivariograms of denitrification variables. Semivariance
models and parameters are given in Table S2.
(a)
(c)
(b)
Fig. 6. Interpolated maps for denitrification variables distributions.
(a) Potential denitrification activity (DEA), (b) potential N2O production,
(c) N2O/(N2O + N2). Colour scales indicate extrapolated values by kriging.
Maps are shown in the same orientation as in Fig. S1b (sampling area).
ª 2012 Federation of European Microbiological Societies FEMS Microbiol Ecol && (2012) 1–12Published by Blackwell Publishing Ltd. All rights reserved
8 D. Correa-Galeote et al.
degrees of autocorrelation but in general confined to
small distances, around 10 m. Analysis of autocorrelation
patterns through semivariance and fractal variograms
indicated a tendency to a patchy distribution over small
scales.
Given the limited availability of comparable published
works on N-cycling genes distribution focusing con-
structed wetlands and on small spatial scales, discussion
of our results is somewhat limited to previous works
made on soils, mainly grasslands and farms. Philippot
et al. (2009a) reported in grazed grasslands a nonrandom
distribution pattern of the size of the denitrifier commu-
nity estimated by quantification of the denitrification
genes copy numbers with a scale spatial dependence
(6–16 m) similar to that found in our work. Keil et al.
(2011) found, also in grasslands, that soil properties were
affected by management practices and showed spatial het-
erogeneity on greater scales compared with gene distribu-
tions. The discrepancy we found between the spatial
distributions of environmental variables such as pH and
sediment moisture and genes could be responsible for the
few associations found between their respective spatial
patterns. However, even in the case of sediment biogeo-
chemical properties showing spatial organization at smal-
ler scales (TOC, nitrate and ammonia) comparable with
that of the genes, a consistent pattern of relationship with
genes did not appear in our study. A few more correla-
tions appeared between denitrification variables (DEA
and potential N2O production) and some gene distribu-
tions. Vegetation cover correlated with pH and almost all
absolute gene abundances, only with relative abundances
of nirS and nosZ, and with DEA and potential N2O pro-
duction. However, all the correlations found with vegeta-
tion showed relatively low values. This is unexpected
because the fluxes of N2O in a Danish wetland were
influenced by gas transport mediated by macrophytes
(Jørgensen et al., 2011). These findings configure a sce-
nario of complex relationships between spatial distribu-
tions of biogeochemical properties of the sediments,
genes and denitrification activities and products, domi-
nated more by specific correlations than by a general pat-
tern. This general decoupling of spatial organization of
habitat variables and genes was shown also by the men-
tioned comparable studies. Philippot et al. (2009a) found
that the spatial patterns of soil properties did not influ-
ence the size of the denitrifier community. Keil et al.
(2011) found that spatial heterogeneity decreased with
higher grassland use including fertilization for soil bio-
geochemical properties, but increased for N-cycling
microorganisms, allowing the authors to think that fac-
tors not considered in the study were driving the micro-
bial distribution found. Even when sampling was
performed using a nested scale approach, from cm to m,
only a few significant correlations were found (Keil et al.,
2011). Thus, reducing the sampling scale to cm did not
render further strong evidence of correlation between spa-
tial patterns of soil properties and N-cycling microbial
communities. Regarding the spatial distribution of micro-
bial communities, probably the adequate scale could be
even smaller. Nunan et al. (2002) found aggregated pat-
tern of microbial communities in an arable soil using
geostatistics, with lengths of spatial autocorrelation
varying between 240 and 1560 lm in the topsoil and
0–990 lm in the subsoil. It is also possible to think that
a scale issue may be involved, not only related with two
dimensional but also with the three-dimensional distribu-
tion of microbial communities in soil (wetland sediment
in our work). For example, Dechesne et al. (2003) studied
the spatial distributions of ammonia oxidizers and 2,4-D
degraders microbial communities using a 3D experimen-
tal and modelling approach considering different volume
scales (from 50 lm3) and found different 3D aggregated
spatial distributions of the two microbial groups. This
differential distribution might have been related with the
distribution of the substrate (ammonia or 2,4-D) through
the complex 3D pattern of soil pores (Dechesne et al.,
2007).
Although in our work a general pattern of spatial cor-
respondence between sediment properties and N-cycle-
associated microbial communities did not appear at the
sampling scale used, clearly the distribution of the micro-
bial communities associated with the N-cycle showed a
heterogeneous, patchy pattern that in some cases suggests
a differential utilization of the sediment habitat by micro-
bial groups harbouring different genes implicated in simi-
lar paths of the denitrification process. For example,
although both narG and napA genes [coding for mem-
brane-bound and periplasmic nitrate reductase, respec-
tively, harboured by the same or different bacteria
(Deiglmayr et al., 2004)] code for the same step in deni-
trification, their relative abundances were negatively cor-
related. Moreover, the relative abundance of these two
genes showed larger patches for narG (higher range of
autocorrelation length), as shown in the interpolated
maps. Thus, microbial groups harbouring narG or napA
occupy differential habitat locations perhaps reflecting
past competitive exclusion. Relative abundances of nirS
and nirK genes [coding for cytochrome cd1 or copper
nitrite reductase, respectively, also carried by different
bacteria (Jones et al., 2008)] were not correlated, in spite
of the apparently similar distributions of absolute abun-
dances of nirS and nirK shown by the interpolated maps.
This may be due to their very different absolute abun-
dance ranges (nirS was an order of magnitude more
abundant than nirK). The distribution of the relative
abundances of these two genes indicates that bacterial
FEMS Microbiol Ecol && (2012) 1–12 ª 2012 Federation of European Microbiological SocietiesPublished by Blackwell Publishing Ltd. All rights reserved
Spatial distribution of N-cycling microbial communities 9

groups harbouring nirS are much more abundant than
those carrying nirK and that they may use the habitat dif-
ferentially but not exerting competitive exclusion. Our
findings agree in general with results from other works
studying the spatial distribution of narG, napA, nirS and
nirK genes, showing differential habitat use by bacteria
harbouring genes coding for the same denitrification step
(Hallin et al., 2009; Philippot et al., 2009a; Enwall et al.,
2010; Keil et al., 2011). As genes in both functionally
redundant pairs (narG-napA and nirS-nirK) showed the
same correlation pattern with the environmental variables
considered in this study, it is clear that some other
dimension of the ecological niche may be explaining the
different spatial distribution of bacteria carrying these
genes. Among other relevant niche components, spatial
distribution of nutrients and water adsorbed in the three-
dimensional soil micro-structure, as well as interactions
with other bacteria and predators (especially protozoa), is
an important factor in determining the spatial distribu-
tion of soil bacteria (Dechesne et al., 2007).
In contrast to the pairs, narG-napA and nirS-nirK, the
genes encoding the first step of nitrification, amoA, from
bacteria and archaea showed a moderate correlation, indi-
cating that this nitrification step may be performed
simultaneously by bacteria and archaea in the same habi-
tat location. However, as spatial distribution of both
AOA and AOB were highly sparse further interpretations
in terms of possible ecological niche variables involved is
difficult to make. Our results contrast with those found
for the same gene by Wessen et al. (2011) in soils at farm
scale, where spatial distributions of both communities did
not overlap and were related with soil pH and clay con-
tent. In our study, AOB abundance was higher than AOA
abundance, as shown also by Tada et al. (2011) and by
Limpiyakorn et al. (2011) in constructed wetlands for
wastewater treatment. However, we found that only AOA
showed a significant correlation with ammonia in spatial
locations of joint occurrence with ammonia. This may be
explained by the finding of Limpiyakorn et al. (2011) that
AOA can outcompete AOB under low ammonium levels,
comparable to those found in our study.
Coming back to our formulated hypothesis, we found
a mixed support to it, because the spatial distribution of
N-cycle-associated microbial communities and genes, and
their functional activities, showed a complex relationship
with wetland sediment properties and environmental vari-
ables. Microbial genetic background is an important fac-
tor shaping the microbial niche, which may or not allow
a bacterial group to exploit its microhabitat and even
modify it (Marco, 2008). However, further studies involv-
ing a range of spatial scales, other potentially relevant
niche dimensions like O2 soil diffusion and also incorpo-
rating a three-dimensional approach could be useful to
explain the seeming uncoupling between spatial distribu-
tions of environmental properties and those of microbial
communities.
Acknowledgements
This study was supported by ERDF-cofinanced grants
P09-RNM-4746 from Consejerıa de Economıa, Innovac-
ion y Ciencia (Junta de Andalucıa, Spain). D.C. is recipi-
ent of a predoctoral grant from MEC. D.E.M. is a
member of the National Research Council (CONICET,
Argentina) and thanks MEC for a Sabbatical Leave at
Department of Soil Microbiology and Symbiotic Systems
(Agencia CSIC, Granada, Spain).
References
Bachand PAM & Horne AJ (2000b) Denitrification in
constructed free-water surface Wetlands: II. Effects of
vegetation and temperature. Ecol Eng 14: 17–32.Bru D, Sarr A & Philippot L (2007) Relative abundance of the
membrane bound and periplasmic nitrate reductase. Appl
Environ Microbiol 73: 5971–5974.Bruland GL, Richardson CJ & Whalen SC (2006) Spatial
variability of denitrification potential and related soil
properties in created, restored, and paired natural wetlands.
Wetlands 26: 1042–1056.Burrough PA (1981) Fractal dimensions of landscapes and
other environmental variables. Nature 294: 240–242.Chon K, Chang J-S, Lee E, Lee J, Ryu J & Cho J (2011)
Abundance of denitrifying genes coding for nitrate (narG),
nitrite (nirS), and nitrous oxide (nosZ) reductases in
estuarine versus wastewater effluent-fed constructed
wetlands. Ecol Eng 37: 64–69.Craddock VM & Henderson AR (1986) Effect of
N-nitrosamines carcinogenic for oesophagus on
O6-alkyl-guanine-DNA-methyl transferase in rat oesophagus
and liver. J Cancer Res Clin Oncol 111: 229–236.Cressie NAC (1991) Statistics for Spatial Data, John Wiley &
Sons, New York, NY.
Dechesne A, Pallud C, Debouzie D, Flandrois JP, Vogel TM,
Gaudet JP & Grundmann GL (2003) A novel method for
characterizing the microscale 3D spatial distribution of
bacteria in soil. Soil Biol Biochem 35: 1537–1546.Dechesne A, Pallud C & Grundmann GL (2007) Spatial
distribution of bacteria at the microscale soil, In the Spatial
Distribution of Microbes in the Environment (Franklin RB &
Mills AL, eds.), pp. 87–107. Springer, Dordrecht.Deiglmayr K, Philippot L, Hartwig UA & Kandeler E (2004)
Structure and activity of the nitrate-reducing community in
the rhizosphere of Lolium perenne and Trifolium repens
under long-term elevated atmospheric pCO2. FEMS
Microbiol Ecol 49: 445–454.Enwall K, Throback IN, Stenberg M, Soderstrom M & Hallin S
(2010) Soil resources influence spatial patterns of
ª 2012 Federation of European Microbiological Societies FEMS Microbiol Ecol && (2012) 1–12Published by Blackwell Publishing Ltd. All rights reserved
10 D. Correa-Galeote et al.
denitrifying communities at scales compatible with land
management. Appl Environ Microbiol 76: 2243–2250.Garcia-Lledo A, Baneras L, Ruiz-Rueda O, Vilar-Sais A & Sala L
(2011) Plant coverage affects nitrogen removal efficiencies in a
free water surface constructed wetland by microbial
nitrification and denitrification activities. Ecol Eng 37: 678–684.Greer FR & Shannon M (2005) Infant methemoglobinemia:
the role of dietary nitrate in food and water. Pediatrics 116:
784–786.Groffman PM, Tiedje JM, Robertson GP & Christensen S
(1988) Denitrification at different temporal and
geographical scales: proximal and distal controls. Advances
in Nitrogen Cycling in Agriculture Ecosystems. (Wilson JR,
ed.), pp. 174–191. CAB International, Wallingford.
Hallin S, Jones C, Schloter M & Philippot L (2009)
Relationship between N-cycling communities and ecosystem
functioning in a 50-year-old fertilization experiment. ISME J
3: 597–605.Henry S, Baudouin E, Lopez-Gutierrez JC, Martin-Laurent F,
Brauman A & Philippot L (2004) Quantification of
denitrifying bacteria in soils by nirK gene targeted real-time
PCR. J Microbiol Methods 59: 327–335.Henry S, Bru D, Stres B, Hallet S & Philippot L (2006)
Quantitative detection of the nosZ gene, encoding nitrous
oxide reductase, and comparison of the abundances of 16S
rRNA, narG, nirK, and nosZ genes in soils. Appl Environ
Microbiol 72: 5181–5189.Hey DL, Kostel JA, Crumpton WG, Mitschand WJ & Scott B
(2012) The roles and benefits of wetlands in managing
reactive nitrogen. J Soil Water Conserv 67: 47–53.Jones CM, Stres B, Rosenquist M & Hallin S (2008)
Phylogenetic analysis of nitrite, nitric oxide, and nitrous
oxide respiratory enzymes reveal a complex evolutionary
history for denitrification. Mol Biol Evol 25: 1955–1966.Jørgensen CJ, Struwe S & Elberling B (2012) Temporal trends
in N2O flux dynamics in a Danish wetland – effects of
plant-mediated gas transport of N2O and O2 following
changes in water level and soil mineral-N availability. Glob
Change Biol 18: 210–222. In press. doi: 10.1111/j.1365-
2486.2011.02485.x
Kallner Bastviken S, Eriksson PG, Martins I, Neto JM,
Leonardson L & Tonderski K (2003) Potential nitrification
and denitrification on different surfaces in a constructed
treatment wetland. J Environ Qual 32: 2414–2420.Kandeler E, Deiglmayr K, Tscherko D, Bru D & Philippot L
(2006) Abundance of narG, nirS, nirK, and nosZ genes of
denitrifying bacteria during primary successions of a glacier
foreland. Appl Environ Microbiol 72: 5957–5962.Keil D, Meyer A, Berner D et al. (2011) Influence of land-use
intensity on the spatial distribution of N-cycling
microorganisms in grassland soils. FEMS Microbiol Ecol 77:
95–106.Kjellin J, Hallin S & Worman A (2007) Spatial variations in
denitrification activity in wetland sediments explained by
hydrology and denitrifying community structure. Water Res
20: 4710–4720.
Klappenbach JA, Saxman PR, Cole JR & Schmidt TM (2001)
rrndb: the ribosomal RNA operon copy number database.
Nucleic Acid Res 29: 181–184.Leonard M & Swanson GW III (2001) Comparison of operational
design criteria for subsurface flow constructed wetlands for
wastewater treatment.Water Sci Technol 43: 301–307.Limpiyakorn T, Sonthiphand P, Rongsayamanont C &
Polprasert C (2011) Abundance of amoA genes of
ammonia-oxidizing archaea and bacteria in activated sludge
of full-scale wastewater treatment plants. Bioresour Technol
102: 3694–3701.Lopez-Gutierrez JC, Henry S, Hallet S, Martin-Laurent F,
Catroux G & Philippot L (2004) Quantification of a novel
group of nitrate-reducing bacteria in the environment by
real time PCR. J Microbiol Methods 57: 399–407.MAPA (1974) Metodos Oficiales de Analisis de Suelos y
Aguas. Ministerio de Agricultura (Spain).
Marco D (2008) Metagenomics and the niche concept. Theory
Biosci 127: 241–247.Nunan N, Wu K, Young IM, Crawford JW & Ritz K (2002) In
situ spatial patterns of soil bacterial populations, mapped at
multiple scales, in an arable soil. Microbiol Ecol 44: 296–305.Ochsenreiter T, Selesi D, Bonch-Ozmolovskaya L, Quaiser A &
Schleper C (2003) Diversity and abundance of
Crenarchaeota in terrestrial habitats studied by 16S RNA
surveys and real time PCR. Environ Microbiol 5: 787–797.Park N, Kim JH & Cho J (2008) Organic matter, anion, and
metal wastewater treatment in Damyang surface-flow
constructed wetlands in Korea. Ecol Eng 32: 68–71.Peralta AL, Matthews JW & Kent AD (2010) Microbial
community structure and denitrification in a wetland
mitigation bank. Appl Environ Microbiol 76: 4207–4215.Petric I, Philippot L, Abbate C et al. (2011) Inter-laboratory
evaluation of the ISO standard 11063 “soil quality – method
to directly extract DNA from soil samples”. J Microbiol
Methods 84: 454–460.Philippot L, Cuhel J, Saby NPA, Cheneby D, Chronakova A,
Bru D et al. (2009a) Mapping field-scale spatial patterns of
size and activity of the denitrifier community. Environ
Microbiol 11: 1518–1526.Philippot L, Bru D, Saby NPA, Cuhel J, Arrouays D, Simek M
et al. (2009b) Spatial patterns of bacterial taxa in nature
reflect ecological traits of deep branches of the 16S rRNA
bacterial tree. Environ Microbiol 11: 1518–1526.Purkhold U, Pommerening-Roser A, Juretschko S, Schmid
MC, Koops HP & Wagner M (2000) Phylogeny of all
recognized species of ammonia oxidizers based on
comparative 16S rRNA and amoA sequence analysis:
implications for molecular diversity surveys. Appl Environ
Microbiol 66: 5368–5382.Ramos C, Agut A & Lidon AL (2002) Nitrate leaching in
important crops of the Valencian Community region
(Spain). Environ Pollut 118: 215–223.Rockstrom J, Steffen W, Noone K et al. (2009) Planetary
boundaries:exploring the safe operating space for humanity.
Ecol Soc 14: 32.
FEMS Microbiol Ecol && (2012) 1–12 ª 2012 Federation of European Microbiological SocietiesPublished by Blackwell Publishing Ltd. All rights reserved
Spatial distribution of N-cycling microbial communities 11
Ruiz-Rueda O, Hallin S & Baneras L (2008) Structure and
function of denitrifying and nitrifying bacterial communities
in relation to the plant species in a constructed wetland.
FEMS Microbiol Ecol 67: 308–319.Ryden JC & Dawson KP (1982) Evaluation of the acetylene-
inhibition technique for the measurement of denitrification
in grassland soils. J Sci Food Agric 33: 1197–1206.Simek M, Elhottova D, Klimes F & Hopkins DW (2004)
Emissions of N2O and CO2,denitrification measurements
and soil properties in red clover and ryegrass stands. Soil
Biol Biochem 36: 9–21.Song K, Lee S-H, Mitsch WJ & Kang H (2010) Different
responses of denitrification rates and denitrifying bacterial
communities to hydrologic pulsing in created wetlands. Soil
Biol Biochem 42: 1721–1727.Song K, Kang H, Zhang L & Mitsch WJ (2012) Seasonal and
spatial variations of denitrification and denitrifying bacterial
community structure in created riverine wetlands. Ecol Eng
38: 130–134.Sutton MA, Howard C, Erisman JW, Billen G, Bleeker A,
Grenfelt P, van Grinsven H & Grizzetti B (Eds) (2011). The
European Nitrogen Assessment. Cambridge University Press,
Cambridge. 612 pp.
Tada C, Ikeda N, Nakamura S, Oishi R, Chigira J, Yano T,
Nakano K & Nakai Y (2011) Animal wastewater treatment
using constructed wetland. JIFS 8: 41–47.Tortosa G, Correa D, Sanchez-Raya AJ, Delgado A, Sanchez-
Monedero MA & Bedmar EJ (2011) Nitrate contamination,
biogeochemical properties and biological activities in surface
waters and sediments of La Rocina stream (Donana
National Park, SW Spain): Greenhouse gas emissions and
denitrification. Ecol Eng 37: 539–548.Treusch AH, Leininger S, Kletzin A, Schuster SC, Klenk HP &
Schleper C (2005) Novel genes for nitrite reductase and
Amo-related proteins indicate a role of uncultivated
mesophilic crenarchaeota in nitrogen cycling. Environ
Microbiol 7: 1985–1995.Van den Heuvel RN, Bakker SE, Jetten MSM & Hefting MM
(2011) Decreased N2Oreduction by low soil pH causes high
N2O emissions in a riparian ecosystem. Geobiology 9:
294–300.Vymazal J (2011) Constructed wetlands for wastewater
treatment: five decades of experience. Environ Sci Technol
45: 61–69.Wessen E, Soderstrom M, Stenberg M et al. (2011) Spatial
distribution of ammonia-oxidizing bacteria and archaea
across a 44-hectare farm related to ecosystem functioning.
ISME J 5: 1213–1225.
Supporting Information
Additional Supporting Information may be found in the
online version of this article:
Fig. S1. Study site at the constructed wetland (Los Guay-
ules, Donana National Park, South West Spain), showing
the plant community (a) and sampling design (b).
Fig. S2. Vegetation cover of the sampled area. Cover per-
centage on a 25 cm 9 25 cm square on each sample point
was coded as 0 (no vegetation cover), 1 (1-50 % cover), 2
(51-75 % cover) and 3 (75-100 %) cover.
Fig. S3. Spatial distribution (kriged) maps for sediment
moisture (%) and total organic carbon (g kg�1 dry sedi-
ment). Colour scales indicate extrapolated values.
Fig. S4. Some relationships found between genes and envi-
ronmental variables. (a) Gene abundances, (b) gene relative
abundances, (c) pH, Total Nitrogen and relative abundance
of nosZ gene and (d) potential denitrification activity
(DEA), nitrate concentration and abundance ratio nirS/
nirK genes.
Fig. S5. Semivariograms of absolute abundances of total
bacterial and archaeal communities (a) and some denitrifi-
cation genes (a,b). Semivariance models and parameters
for all the studied genes are given in Table S3.
Fig. S6. Spatial distribution (kriged) maps for denitrifica-
tion genes (number of gene copies per ng sediment DNA).
Colour scales indicate extrapolated values.
Fig. S7. Spatial variation of (a) amoA genes from AOA
(number of gene copies per ng sediment DNA, quantiles),
and (b) ammonia concentration (kriged map). Colour
scales indicate extrapolated values.
Table S1. Correlations between biogeochemical properties
of constructed wetland sediments, denitrification activity
and products.
Table S2. Spatial analysis of environmental variables, gene
abundances and activity of denitrifiers.
Table S3. Fractal variograms and interpolation (kriging) of
environmental variables, gene abundances and activity of
denitrifiers.
Table S4. Correlations between biogeochemical properties
of constructed wetland sediments, N-cycling genes and
denitrification activity.
Appendix S1. Statistical analyses.
Please note: Wiley-Blackwell is not responsible for the
content or functionality of any supporting materials sup-
plied by the authors. Any queries (other than missing
material) should be directed to the corresponding author
for the article.
ª 2012 Federation of European Microbiological Societies FEMS Microbiol Ecol && (2012) 1–12Published by Blackwell Publishing Ltd. All rights reserved
12 D. Correa-Galeote et al.