
Power and Energy Sector Road Map: An Update
66
-
Upload
khangminh22 -
Category
Documents
-
view
0 -
download
0
Transcript of Power and Energy Sector Road Map: An Update

Power and Energy Sector Road Map : An Update
June 2011
Finance Division, Ministry of Finance Government of People’s Republic of Bangladesh
website: www.mof.gov.bd| email: [email protected]

Contents
Subject PagePreface v
1.0 Introduction and Background 1 Power Sector 3-33
2.0 Reducing Power Shortage: Achievements In Last One Year 3 2.1 Per Capita Electricity Consumption: The Extent of Increase 3 2.2 Access to Electricity: The Extent of Expansion 3 2.3 Enhancement of Electricity Generation Capacity, Load
Shedding and Supply: The Extent of Change 3
2.4 Power Sector: Updated Comparative Data 4 2.5 Electricity Production Structure: The Evolution 4 2.6 Use of Different Types of Energy: Energy Diversification
and Change in Policy Strategies 6
3.0 Action Plan (2010-2015): Achievement 7 3.1 Initiatives Under Different Tenure: Achievements and
Changed Strategy 7
3.1.1 Immediate: Achievements So Far 8 3.1.2 Short Term: Achievements And Revised Plan 9 3.1.3 Medium Term: Revised Plan 12 3.1.4 Long-term: Electricity for All 19 3.2 Import of Electricity and Regional Co-operation: Latest
Position 23
3.2.1 Import of Electricity from India and Establishing Joint Venture Power Plant
23
3.2.2 Import of Electricity from Myanmar 24 3.3 Power Tariff: Change in Rate and Policy 24
3.4 Transmission and Distribution: Achievement and Workplan 24
3.5 Electricity Conservation Program: Which Way 27
4.0 Year-wise Probable Electricity Demand and Supply: An Update 27
5.0 Challenges of Power Sector Development 31
6.0 Uninterrupted Fuel Supply to Power Stations and Storage of Fuel 31
7.0 Channeling Resources 32
Energy Sector 34-52

Subject Page9.0 Current Status of Energy Sector: The Evolution 34
9.1 Non-Renewable Energy: Revised Policy-Strategy 34 9.2 Renewable Energy: Recent Progress on Policy 35
10.0 Natural Gas: Achievement in Last One Year 35 10.1 Existing Reserve and Production Levels of Natural Gas:
A Comparative Scenario 35
10.2 Consumption and Demand of Natural Gas: An Update 36 10.3 Supply and Shortage of Gas: Overall Situation 38 10.4 Development Plan for Natural Gas Sector: Achievements
and Revised Plan 38
10.5 Achievements in the Gas Sector in Last Year 38 11.0 Medium Term Plan to be Completed by June 2013: Revised
Picture 39
11.1 Actions taken 41 11.1.1 National Gas Companies 41 11.1.2 International Oil Companies 41
12.0 Long Term Plan to be completed by December 2015: Changes So Far
41
12.1 Actions Taken 42 12.1.1 National Gas Company 42
13.0 New Initiatives in Gas Sector in Last One Year 42 14.0 Necessary Steps ot be Taken to Increase Gas Supply 45 15.0 Import of Liquid Natural Gas: A New Endeavour 45 16.0 Coal: Trend of Progress 46
16.1 Coal: Reserve and Consumption 46 16.2 Steps To Be Taken To Tackle The Problems of The Coal
Sector 47
17.0 Liquefied Petroleum Gas (LPG): Trends of Import 47 18.0 Nuclear Energy 48
18.1 Challenges of Nuclear Energy Sector 48 19.0 Production, Usage and Promotion of Renewable Energy and
Energy Saving Actions 48
19.1 Renewable Energy: Plans and Achievements 49 19.2 Government Initiatives: IDCOL (Infrastructure
Development Company Limited) 50
20.0 Immediate Steps to Be Taken For the Development of Energy Sector
50
21.0 Trends of Resource Flow 51 22.0 Conclusion 52
Appendix 1 Electricity Added in the National Grid (from January/09 to May/11)
54
Appendix 2 Summary of Achievements 56

Table
Page 1 Electricity Produced in Public and Private Sector: A Comparison 5
2 Different Fuel Use For Electricity (% share) 6
3 A Comparative Picture of Electricity Production Plan 7
4 The Implementation Action plan of Various Programmes by 2010 8
5 Implementation Plan of Various Programmes by 2011 9
6 Time-bound Plan of Various Programmes to be Implemented By 2012 12
7 List of Different Projects to be Implemented By 2013 16
8 List of Different Projects to be Implemented By 2014 18
9 List of Different Projects to be Implemented By 2015 20
10 List of Different Projects to be Implemented By 2016 21
11 List of Different Projects to be Implemented By 2017 22
12 List of Different Projects to be Implemented By 2018 22
13 List of Different Projects to be Implemented By 2019 22
14 List of Different Projects to be Implemented By 2020 23
15 Comparative Scenario of Power Transmission and Distribution 25
16 Probable Projects for Transmission 26
17 Retirement of Power Plant 28
18 Year-wise Projected Power Demand and Supply 30
19 Allocation of Resources in Power Sector (In crore TK.) 32
20 The Current Comparative Scenario of Natural Gas 35
21 Sectorwise Gas Demand Projection 37
22 Short Term Plan Completed by December 2010 39
23 Medium Term Plan to be Completed by December 2013 40
24 Long Term Plan to be Completed by December 2015 42
25 2-D & 3-D Seismic Survey Plan at a Glance 43
26 Proposed Projects for Implementation by GDF 44
27 Coal Reserves of Five Coal Mines 46
28 LPG Production in Public Sector at a Glance (2008-2011) 48
29 Targets of Electricity Generation by 2015 from Renewable Energy Sources and Achievements till Date
49
30 Resource Allocation in Energy Sector 51

Figures
Page 1 Electricity Demand and Production Trend 2001-2011 1
2 Electricity Production in Private and Public sector, April 2011 5
3 Electricity Production in Private and Public Sector, April 2010 5
4 Projection of Electricity Production in Private and Public Sector in 2016 6
5 Electricity production from Different Fuel Sources 6
6 Progress in Distribution Line April 2010 to April 2011 25
7 Progress in Non-household Connection April 2010 to April 2011 25
8 Progress in Household Connection : April 2010 to April 2011 25
9 Statistics of Year-wise Capacity Retirement 29
10 Probable Power Shortage/Surplus (2011-2016) 30
11 Statistics of Resources Allocation in Power Sector 33
12 Annual Energy Consumption Trend 34
13 Sectoral Use of Gas in Percent, 2009 36
14 Sectoral Use of Gas in Percent, 2010 36
15 Sector- wise Annual Average Growth Rate of Use of Gas in the Country from 2005 to 2010
36
16 Projection of Annual Gas Demand (2009-10 to 2015-16) 37
17 Resource Allocation in Energy Sector 52

v
Preface
The present Government placed the ‘Vision 2021’ along with its Election Manifesto before the nation. Inspired by the dreams inherent in the Vision, we began our journey resolutely towards building a happy, prosperous, and caring Bangladesh. To this end, a number of targets, strategies, and priorities geared towards economic and social development have been brought together in the Perspective Plan (2010-2021) and the Sixth Five Year Plan (2010-11 to 2014-15). The main goal of all these efforts is to achieve 8 percent growth by 2013 and then raising it to 10 percent by 2017 and sustaining it till 2021. However, achieving this high growth requires huge investment. In fact, over the last few years, Investment-GDP ratio remains stagnant at around 25 percent. Underdeveloped infrastructure, in particular, infrastructural deficiencies in power and energy sector, is primarily responsible for this sluggishness.
I presented a roadmap towards revamping power and energy sector in the last annual budget session to apprise the nation of restructuring and development plan for the power and energy sector. In the road-map, immediate, short, medium, and long-term plans on reinvigorating the power and energy sector were outlined. In the meanwhile, the private sector has stepped into electricity generation in a significant way. Hence, the government has also changed its strategy and the targets of electricity generation. A number of innovative steps have also been taken in the energy sector. In this context, I am again presenting the current status of ‘the roadmap of power and energy sector development’ to update the nation about the achievement in the power and energy sector, its revised plan, and the new initiatives.
After assuming office, we adopted a wide range of plans and activities for generating 20,000 MW power in line with the ‘Vision 2021’. By declaring power and energy as a vital sector, we enacted ‘Power and Energy Fast Supply Enhancement (Special Provision) Act 2010’to ease and simplify the approval process of power projects with a view to bringing generated electricity quickly to the national grid.
A wide range of activities are being undertaken in the power sector to generate 17,649 MW by 2016. Strategies have been adopted to facilitate private sector lead in electricity generation. Besides, plans are there to keep the existing power plants operational to ensure uninterrupted power supply. Vigorous efforts are also at hand to augment electricity generation from fossil and renewable energy sources, e.g., solar energy, bio-gas etc. with a view to reducing over-dependence on natural gas.
In the last two years, about 1556 MW have been added to the national grid by implementing a number of initiatives of the present government. When the present government assumed office, the country was reeling from acute shortage of power and energy. To quickly recover from the crisis, we agreed to generate electricity on a rental basis. However, in view of its high-cost involvement, government considers setting up strategic power plants in the private sector as the best and effective option. I don’t have any hesitation in admitting that not all action plans outlined in the previous roadmap were implemented. Therefore, several action plans have been revised and are now being considered for implementation in future.

vi
Power generation is a capital intensive process and a major share of capital investment involves import of capital machinery. Providing electricity at a lower cost while buying at a higher rate from private producers entails huge subsidy and subsequent pressure on the national budget. On the other hand, huge imports exert downward pressure on the balance of payments. Despite all these, we have to proceed maintaining an effective balance.
There is no denying the fact that our power and energy sector still lags behind other least-developed countries. We have a number of limitations: some are natural and others human-made. We also have dearth of natural gas, an important input to electricity generation. We have seen an episode of inefficiency, mismanagement, and disgraceful corruption in the power and energy sector in some years of the last decade. I hope that the strong determination of the present government to develop and revamp this sector will wipe out all the past and lead the nation from darkness to light. This will establish a ‘Golden Bengal’ as dreamed by the ‘Father of the Nation’.
I take the opportunity to extend my sincere thanks to the Ministry of Power, Energy, and Mineral Resources, Power Development Board, and the officers of Finance Division who made substantial contribution in bringing out this booklet. I would like to express my deep gratitude to the Hon’ble Advisor for Power and Energy Dr. Toufique-E-Elahi Chowdhury, Bir Bikram and the Hon’ble State Minister for Power, Energy, and Mineral Resources Brigadier Enamul Huq for their cooperation.
(Abul Maal Abdul Muhith) Minister Ministry of Finance

1
Power and Energy Sector Road Map: An Update
1.0 Introduction and Background
1.1 In the previous year’s budget session, a booklet on ‘Towards Revamping Power and Energy Sector: A Road Map’ was presented. The main objective of publishing the booklet was to inform the nation of Government’s wide ranging initiatives, plans, and pledges to develop and restructure the power and energy sector. It was pledged to generate additional 9,426 MW power by 2015 under immediate, short, medium, and long-term plans. During the last few years, the contribution of investment to GDP became stagnant. The shortage of power and energy supply with respect to its growing demand was the prime cause of the investment-stagnancy, which impeded industrialisation and offered limited opportunity to create new employment. Realising this, the present Government has undertaken extensive measures to develop and revamp the power and energy sector. The Government has been working on a war footing to remove existing bottlenecks. Declaring power and energy as the emergency sector, the Government framed a new law titled ‘Quick Enhancement of Electricty and Energy Supply (Special Provision) Act 2010’ to expedite electricity production and bring electricity quickly to the door steps of the general masses.
1.2 The demand for electricity has been on the rise due to growing population and increasing economic activities. Even though the derated electricity generation capacity stands at 6,208 MW in 2011, there is a short-fall against the demand of 6,500 MW. This shortage was more acute in the past. The following figure shows the demand for electricity, derated capacity, and generation capacity during 2001 and 2011.
Figure 1: Electricity Demand and Production Trend 2001-2011
010002000300040005000600070008000
2001
2002
2003
2004
2005
2006
2007
2008
2009
2010
2011
Year
Meg
aWat
t
Demand Derated Capacity Capacity
Source: Power Division
2⎯

2
1.3 In 2003, nearly a total of 2,428 MW power was supplied against the demand of
3,944 MW. The slow progress of building power infrastructure between 2001 and 2008
has actually given rise to the current power deficit. In 2001, the capacity of electricity
generation was 4,005 MW which was raised only to 5,262 MW in 2008. In other words,
only 1,257 MW power was added to the national grid during 2001-08. Starting from a
poor base, the present Government has undertaken a range of initiatives to generate
20,000 MW by 2020 in line with the pledges made in the ‘Vision 2021’.
1.4 The development of any sector is a continuous, dynamic and multi-dimensional process. It is necessary to change required plans and strategies to adjust with this process. Therefore, a number of addition, revision, and extension have been made in the roadmap outlined last year. Moreover, a range of new initiatives to generate power have been taken up. As many new independent power producers have shown their interest in electricity production, a revised target of additional 12,473 MW (instead of 9,426 MW) by 2015 has been fixed together with adoption of different new programme. Installation of quick rental power plants, repairing and restructuring existing power plants and improvement of electricity demand management aimed at rapid enhancement of electricity generation capacity were several initiatives to add 1,556 MW to the national grid in the meantime (Appendix 1). To reduce production cost and ensure sustainable electricity production, the Government has adopted a policy-strategy of discontinuing the expansion of quick rental power plants and opted for installation of long-term power plants by the private sector. Due to the shortage of natural gas supply, expected electricity production is being hampered. In order to increase the supply of natural gas, steps have been taken under medium and long term plans to increase additional 2600 MMCFD (million cube feet per day) of gas by 2015 through national and international gas companies. In the last one year, additional 114 MMCFD of gas has been added to the national grid. The Government has also undertaken measures to import liquefied petroleum gas (LPG) and liquid natural gas (LNG) to reduce dependence on natural gas for electricity production and to increase diversity in the fuel mix. It has also been planned to generate 500 MW electricity by 2015 using renewable, in particular, solar energy source. Meanwhile, about 55 MW electricity is being produced from renewable energy sources. In order to inform the nation of the achievements, revised plans and policy strategies, this update of the roadmap outlined in the previous year’s budget, has been prepared.

3
Power Sector
2.0 Reducing Power Shortage: Achievements in Last One Year
The Government has taken up immediate, short, medium, and long term plans for overall and balanced development of the power sector and increased electricity production. The implementation period of the immediate plan was over in December 2010. It has been gained significant progress in the power sector as an outcome of this planned intervention (a summary is enclosed in Appendix 2). The progress made in the power sector as well as the issues of bringing related services to the doorsteps of people can be explained in three ways. They are: per capita electricity consumption, electricity coverage, and enhancement of electricity production capacity and the reduction in load-shedding. In addition, higher level of electricity supply in manufacturing and agriculture sectors also indicates the progress in the power sector.
2.1 Per Capita Electricity Consumption: The Extent of Increase
The progress in per capita electricity consumption cannot be significant if population grows faster. The per capita electricity use was 220 KWH in April 2010, which has been raised up to 236 KWH (7.2 percent growth) by now as the present Government took a number of immediate measures.
2.2 Access to Electricity: The Extent of Expansion
The Government has taken up a number of programmes to bring the whole population under electricity coverage by 2021. By implementing various development programmes 49 percent of the total population has been brought under electricity coverage by April 2011. It was 47 percent in April 2010. Electricity production under solar energy and bio-mass has been enhanced by means of individual and collective efforts in rural and sub-urban areas. Thus, overall electricity supply in the rural areas has increased, with the combination of supply from the national grid and the renewable energy sources.
2.3 Enhancement of Electricity Generation Capacity, Load Shedding and Supply: The Extent of Change
The derated production capacity in April 2010 was 5376 MW. During April 2010-April 2011, new power plants of 912 MW capacity have been set up. Of late, the derated generation capacity has reached 6,208 MW as the generation capacity of a few old power plants have declined. As a result, the amount of load-shedding has also been reduced. Average daily load shedding of 1200-1500 MW in April 2010 has been reduced to

4
1000-1200 MW. Besides, the number of electricity connections for manufacturing units and irrigation were 129,218 and 149,581 respectively in April 2010, which has been increased to 133,000 and 2,41,000 respectively in April 2011.
2.4 Power Sector: Updated Comparative Data
Subject April 2010 April 2011 Increase/Decrease
Installed generation capacity 5873 MW 6813 MW 940(+)
Derated generation capacity 5376 MW 6208 MW 832(+)
Highest generation 4406 MW 4699 MW 293 (+)
Electricity Demand (peak demand) 5800 MW 6500 MW 700 (+)
Populaion under electricity coverage 47 percent 49 percent 2 (+)
Per capita electricity use 220 KWH 236 KWH 16 (+)
Load Shedding 1200-1500 MW 1000-1200 MW 200-300 (-)
Source: Power Division
As many power plants are old and retiring, increased electricity production has become challenging. However, electricity production capacity has turned out to be more than the demand created during April 2010-April 2011. Accordingly, the amount of load shedding also decreased. In 2010, daily electric production was 500-800 MW less than the capacity due to shortage of gas supply, which has now come down to 400-800MW. Apart from this, on account of repairs and maintenance another 800-1200MW cannot be produced. However, the process for recruitment of consultants is underway to carry out required maintenance work. Meanwhile, the maintenance work of the projects (4 and 5 unit of Karnafuli Water Development Plant, Khulna 60 MW Thermal Power Plant, Bheramara Power Plant Unit-1, Shahjibajar 20 MW Unit 5 & 6) have been completed.
2.5 Electricity Production Structure: The Evolution
Government power plants used to monopolise electricity production in Bangladesh. In April 2010, about 60 percent of total electricity production used to be generated by the government power plants; of which, BPDB’s share was 76 percent. A competitive market environment has been created in electricity generation by reducing dependence on public sector power plants as well as BPDB. Of late, nearly 56 percent of total electricity production originates from public sector power plants, whereas the

5
private sector provides the rest 44 percent. By 2016, the private sector is expected to take the lead and generate nearly 58 percent of the total electricity produced. The statistics on electricity production under private and public sector are given in Table 1 and shown in Figures 2, 3, and 4.
Table 1: Electricity Produced in Public and Private Sector: A Comparison
Government Private
Year BPDB1 APSCL2 EGCB3 IPP4
SIPP (BPDB)
SIPP (REB)5 Rental
Production Capacity (Derated) (MW)
2010 2452 536 240 1271 99 226 482
2011 2620 606 255 1271 99 226 1131
Aggregate (MW)
2010 3,226 2,150
2011 3,481 2,727
Source: Power Division
Figure 2: Electricity Production in Private and Public sector, April 2011
Figure 3: Electricity Production in Private and Public Sector, April 2010
56%
44%
Public Private
60%
40%
Public Private
1 Bangladesh Power Development Board; 2 Ashuganj Power Station Company Limited 3 Electricity Generation Company of Bangladesh 4 Independent Power Producer 5 Rural Electrification Board

6
Figure 4: Projection of Electricity Production in Private and Public Sector in 2016
42%
58%
Public Private
2.6 Use of Different Types of Energy: Energy Diversification and Change in Policy Strategies
In 2010, due to shortage of gas supply approximately 500-800 MW electricity
could not be produced. In this context, it has been planned to reduce over-dependence on
natural gas and to increase use of diesel, furnace oil and coal for electricity generation.
Besides, importance is also given to generate electricity from renewable energy.
Meanwhile, the Government has planned to generate electricity using nuclear energy and
increase electricity supply through greater regional cooperation. While 89 percent of total
electricity used to be generated by natural gas in 2010, it now stands at 83 percent.
Table2: Different Fuel Use for Electricity (% share)
Figure 5: Electricity production from Different Fuel Sources
5% 7% 4%3%
81%
Furnace Oil Diesel Hydro Coal Gas
Source: Power Division
Year 2010 2011(March)
Furnace Oil 2.81 4.71
Diesel 1.75 6.82
Hydroelectricity 3.39 3.56
Coal 3.77 2.59
Gas 88.29 82.83

7
3.0 Action Plan (2010-2015): Achievement
Plan for power sector for the period from 2010 to 2015 were outlined in the previous roadmap on revamping the power and energy sector. It was planned that additional 9426 MW will be added to the national grid of which 1800-2000 MW will be added in 2010 and 920 MW in 2011. In the meantime, considering the progress of the programme undertaken and their achievements, the Government has decided to amend the previous plans. Besides, positive response from the private sector also bolsters the rationale for change. According to new plan, targets for additional 12473 MW by 2015 and 15273 MW by 2016 have been set up, of which 775 MW was to be added in 2010, while 2194 MW in 2011. Under this plan, imported 500 MW electricity will be added to the national grid by 2013. The comparative scenario of the stated plan is presented in the following table:
Table 3: A Comparative Picture of Electricity Production Plan
Plan outlined in 2010 Revised Plan
Year-wise plan
Public Sector
Private Sector
Total (MW)
Public Sector
Private Sector
Total (MW)
2010 360 432 792 255 520 775
In 2011 920 -- 920 851 1343 2194
In 2012 505 1764 2269 838 1319 2157
In 2013 725 950 1675 1040 1134 2174+500 (import)
In 2014 1170 -- 1170 1270 1053 2323
In 2015 -- 2600 2600 450 1900 2350
Total 3680 5746 9426 4704 7269 12473
In 2016 1500 1300 2800
Additional aggregate
6204 8569 15273
Source: Power Division
3.1 Initiatives Under Different Tenure: Achievements and Changed Strategy
In consideration of the financing mode, demand for electricity and energy-mix, the Government has undertaken immediate, short, medium, and long term plans for power sector development. The response from the private sector, dearth in energy supply, the changed scenario in domestic and international energy market and, achievements already made have compelled us to revise and refine previous plans. Achievements made so far and implementation progresses are outlined as follows:

8
3.1.1 Immediate: Achievements So Far In order meet the shortage of electricity within 6 to 12 months an action plan was
worked out to set rental and quick rental power plants. An additional 1800 MW electricity was planned to be added to the national grid between March 2010 to March 2011. Some of the power plants were scheduled to come into generation in 2010. However, because of the realities at hand, the generation programmes of these plants have been shifted to 2011. According to plans an additional 775 MW electricity has been added to the national grid by April 2010 to December 2010. The details are in the following table:
Table 4: The Implementation Action plan of Various programmes by 2010
No. Name of the power plant
Installed capacity
Ownership Energy type
Time of initiation
Implementation/progress
Government Sector 1. Shikolbaha 150 MW
peaking power plant 150 BPDB Gas 18.08.2010 Commercial
production started
2. Shiddirganj 2X120 MW peaking power plant (2nd Unit)
105 EGCB Gas 14.10.2010 Commercial production
started Total (public sector) 255
Private Sector 1. Shikolbaha 55 MW
rental power plant 55 Rental
(BPDB) Furnace
oil 06.05.2010 Commercial
production started
2. Ashuganj Rental (3 years term)
55 Rental (BPDB)
Gas 07.04.2010 Commercial production
started 3. Thakurgaon Rental
(3 years term) 50 Rental
(BPDB) Diesel 02.08.2010 Commercial
production started
4. Ghorashal quick rental (3 years term)
45 Rental (BPDB)
Diesel 10.08.2010 Commercial production
started 5. Ghorashal quick
rental (3 years term)
100 Rental (BPDB)
Diesel 23.08.2010 Commercial production
started 6. Khulna quick rental
(3 years term) 55 Rental
(BPDB) Diesel 10.08.2010 Commercial
production started
7. Pagla quick rental ( 3 years term)
50 Rental (BPDB)
Diesel 24.11.2010 Commercial production
started 8. Bheramara rental
( 3 years term) 110 Rental
(BPDB) Diesel 31.12.2010 Commercial
production started
Total (private sector) 520 Total 775
Source: Power Division

9
3.1.2 Short Term: Achievements and Revised Plan
During January 2011-December 2011, a total of 920MW power was planned to add to the national grid under the short term plan. Revising the plan, by December 2011 nearly 2194 MW additional electricity is planned to be added by installing 11 public power plants and 16 private power plants. Out of this, 425 MW electricity has been added to the national grid by April, 2011. The plan for power supply and implementation status by December 2011 is outlined in the following table.
Table 5: Implementation Plan of Various Programmes by 2011
No Name of the power plant
Installed capacity
Ownership Energy type
Probable time of
initiation
Implementation/ progress
Government Sector
1. Fenchuganj 90 MW combined cycle power plant
105 BPDB gas June, 2011 GT-1 test run going on, By June, 2011 commissioning can be started
2. Ashujanj 50 MW power plant
53 APSCL gas 30.4.2011 Commercial production started
Total (public sector) (Jan-June/11)
158
3. Shiddirganj 2X120MW peaking power plant (1st Unit)
105 EGCB Gas July, 2011 Since 18.06.2010 1st unit is not functioning due to generator problem
4. Faridpur 50 MW peaking power plant
54 BPDB Furnace oil
July, 2011 Contract signed: 26-04-2010. 83.2 percent work completed
5 Gopalganj 100 MW peaking power plant
109 BPDB Furnace Oil
Aug, 2011 Contract signed: 26-04-2010. 76.5 percent work completed
6. Dohazari 100 MW peaking plant
102 BPDB Gas/ Furnace
Oil
Aug, 2011 Contract signed: 26-04-2010. 60.11 percent work completed
7. Hathazari 100 MW peaking Plant
98 BPDB Gas/ Furnace
Oil
September, 2011
Contract signed: 26-04-2010. 60.0 percent work completed
8. Bera, Pabna 70 MW peaking power plant
71 BPDB Furnace Oil
July, 2011 Contract signed: 26-04-2010. 71.0 percent work completed
3⎯

10
No Name of the power plant
Installed capacity
Ownership Energy type
Probable time of
initiation
Implementation/ progress
9. Daudkandi 50 MW peaking power plant
52 BPDB Gas/ Furnace
oil
July, 2011 Contract signed: 13.05.2011. 75.83 percent work completed
10. Baghabari 50 MW peaking power plant
52 BPDB Furnace Oil
July, 2011 Contract signed: 13.05.2011. 59.4 percent work completed
11. Gazipur 50 RPCL6 Gas/Furnace
oil
Nov, 2011 Contract signed: 24.08.2010. 25.3 percent work completed
(A) Total (government sector)
(July-Dec/12)
693
(B) Sub-total (government sector)
851
Private Sector
1. Siddirganj Sponsor: desh energy
100 Rental (BPDB)
Diesel 17.02.2011 Commercial production started
2. Madanganj Sponsor: Summit power
102 Rental (BPDB)
Furnace Oil
01.04.2011 Contract signed: 23.06.2010. commercial production has started
3. Khulna Sponsor: KPCL
115 Rental (BPDB)
Furnace Oil
15.05.2011 Contract signed: 23.06.2010. 99.0 percent work completed. Run on test
4. Meghnaghat Sponsor: IEL
100 Rental (BPDB)
Furnace Oil
08.05.2011 Contract signed: 30.06.2010. commercial production has started
5. Ghorashal Sponsor: Mask Power
78 Rental (BPDB)
Gas 15.05.2011 Contract signed: 27.10.2010. 82.0 percent work completed.
6. Ashuganj Sponsor: United Ashuganj Power Limited
53 Rental (BPDB)
Gas 20.05.2011 Contract signed: 23.12.2010. 80.0 percent work completed.
6 Rural Power Company Limited

11
No Name of the power plant
Installed capacity
Ownership Energy type
Probable time of
initiation
Implementation/ progress
7. Noapara Sponsor: KhanJahan Ali
40 Rental (BPDB)
Furnace Oil
30.05.2011
Contract signed: 25.07.2010. 93.0 percent work completed.
8. B. Baria Sponsor: Agrico
70 Rental (BPDB)
Gas 06.03.2011
commercial production has started
9. Ashuganj Sponsor: Agrico
80 Rental (BPDB)
Gas 05.06.2011
Contract signed: 23.11.2010. 72.0 percent work completed
10. Keraniganj Sponsor: Power pack
100 Rental (BPDB)
Furnace Oil
June, 2011 Contract signed: 08.07.2010. 72.0 percent work completed
11. Amnura, Chapainawabganj Sponsor: Sinha Power
50 Rental (BPDB)
Furnace Oil
June, 2011 Contract signed: 15.07.2010. 80.0 percent work completed
12. Siddirganj Sponsor: Dutch Bangla Power
100 Rental (BPDB)
Furnace Oil
June, 2011 Contract signed: 01.07.2010. 69.0 percent work completed
Total (private sector) (Jan-June/11)
988
13 Katakhali, Rajshahi Sponsor: NPSL
50 Rental (BPDB)
Furnace Oil
July, 2011 Contract signed: 27.07.2010. 55.0 percent work completed
14. Noapara, Jessore (5 years term)
105 Rental (BPDB)
Furnace Oil
July, 2011 Contract signed: 04.02.2010. 84.0 percent work completed
15. Meghnaghat Sponsor: HPGL
100 Rental (BPDB)
Furnace Oil
July, 2011 Contract signed: 28.06.2010. 47.0 percent work completed
16. Julda, Chittagong Sponsor: Akorn Infra Services Ltd.
100 Rental (BPDB)
Furnace Oil
Aug, 2011 Contract signed: 06.07.2010. 60.0 percent work completed
(A) Total (private sector)
(July-Dec/12)
355
(B) Sub-total (private sector)
1343
Total (2011) 2194
Source: Power Division

12
3.1.3 Medium Term: Revised Plan In the medium term, it was planned to set up power plants generating 2269 MW
in 2012, 1675 MW in 2013, 1170 MW in 2014, in total 5114 MW. The revised plan is targeted to generate 2157 MW in 2012, 2674 MW in 2013 (500MW electricity import), 2323 MW in 2014, in totaling 7154 MW. The medium term plan with implementation progress is given in the following table.
Table 6: Time-bound Plan of Various Programmes to be Implemented By 2012
Serial no
Name of the power station
Installed Capacity
(MW) Ownership
Types of
energy
Expected time for
operation Implementation/Progress
Public sector
1
Sylhet 150 MW Combined
Cycle Power Plant
150 BPDB Gas January,
2012
Contract signed: 08-02-2010. Construction work completed: 50.00%.
2
Chandpur 150 MW Combined
Cycle Power Plant
163 BPDB Gas March ,
2012
Contract signed: 08-02-2010 Construction work completed: 49.50%.
3 Santahar 50 MW Peaking Power
Plant 50 BPDB
Gas /Furnace
oil
March, 2012
Contract signed: 18-10-2010 Construction work completed: 23.00%.
4 Katakhali 50 MW Peaking Power Plant
50 BPDB Gas
/Furnace oil
April, 2012
Contract signed: 18-10-2010. Construction work completed: 22.75% .
(A) Sub-total (public sector)
(January-June/12)
413
5 Sirajgong 150
MW GT 150 NWPGC7
Gas / Diesel
July, 2012 Contract signed: 12-10-2010 Construction work completed: 17.83%.
6 Raojan, Chittagong
20 RPCL Gas
/Furnace oil
July, 2012 Contract signed: 23-03-2011
7 North West Power Generation Company

13
Serial no
Name of the power station
Installed Capacity
(MW) Ownership
Types of
energy
Expected time for
operation Implementation/Progress
7 Chapainawabganj 100 BPDB Furnace
oil November,
2012 Procurement will start soon
8 Kaptai Solar 5 BPDB Solar December,
2012
PDPP8 prepared. Sent to the Ministry for exploring source of financing.
9 Kadda, Gazipur 150 MW power plant
150
BPDB - RPCL Power
generation
Furnace oil
December, 2012
Tender received: 03-05-2011. Tenders undergoing evaluation.
(B) Sub-total (public sector) (July-December/12)
425
(A+B) total (public sector)
838
Private sector
1 Solar 7 IPP9
(BPDB) Solar June, 2012
Re-started the preparation of revised PQ10
2 Tangail 20MW 20 IPP
(REB)
Gas/ Furnace
oil June, 2012
RFP11 evaluation completed.
3 Chandpur 15 MW
15 IPP
(REB)
Furnace oil June, 2012
RFP evaluation completed.
4 Narayangong 30 MW
30 IPP
(REB)
Furnace oil June, 2012
RFP evaluation completed.
(C) Sub-total (private sector) (January-June/12)
72
8 Preliminary Development Project Proposal 9 Independent Power Producer 10 Pre-qualification 11 Request for Proposal

14
Serial no
Name of the power station
Installed Capacity
(MW) Ownership
Types of
energy
Expected time for
operation Implementation/Progress
5 Santahar 50 MW Peaking Power Plant
50 IPP
(BPDB)
Furnace oil
July,
2012 Issued LOI
6 Syedpur Power Plant
100 IPP
(BPDB)
Furnace oil July, 2012 Issued LOI
7 Jamalpur Peaking Power plant
100 IPP
(BPDB)
Gas/ Furnace
oil
September, 2012
Issued LOI on 07/04/2011
8 Comilla Peaking Power plant
50 IPP
(BPDB)
Gas/ Furnace
oil
September, 2012
Financial evaluation completed. Sent to the Ministry for approval.
9 Khulna Peaking Power plant
100 IPP
(BPDB)
Furnace oil
September, 2012
Issued LOI on 06/04/2011
10
Dhaka (Aminbazar) 100 MW Power Plant
100 IPP
(BPDB)
Furnace oil
September, 2012
RFP evaluation completed. Sent to the Ministry for approval.
11
Dhaka (Aminbazar) 50 MW Power Plant
50 IPP
(BPDB)
Furnace oil
September, 2012
RFP evaluation completed. Sent to the Ministry for approval.
12
Chittagong (Patenga) 100 MW Power Plant
100 IPP
(BPDB)
Furnace oil
September, 2012
Issued LOI on 07/04/2011
13
Chittagong (Mohora) 50 MW Power Plant
50 IPP
(BPDB)
Furnace oil
September, 2012
RFP evaluation completed. Sent to the Ministry for approval.
14
Rajshahi (Iswardi) 100 MW Power Plant
100 IPP
(BPDB) Furnace
oil September,
2012 Issued LOI on 07/04/2011

15
Serial no
Name of the power station
Installed Capacity
(MW) Ownership
Types of
energy
Expected time for
operation Implementation/Progress
15 Rajshahi (Natore) 50 MW Power Plant
50 IPP
(BPDB) Furnace
oil September,
2012
RFP evaluation completed. Sent to the Ministry for approval.
16
Khulna (Labanchora) 100 MW Power Plant
100 IPP
(BPDB) Furnace
oil September,
2012 Issued LOI on 07/04/2011
17 Barisal 50 MW Power Plant
50 IPP
(BPDB)
Furnace oil
September, 2012
RFP evaluation completed. Sent to the Ministry for approval.
18 Bhola 150-225 MW CCPP (2nd Unit) SC (GT)
147 IPP
Gas
October, 2012
Issued LOI
19 Kaliakoir Peaking Power plant, Gazipur
100 IPP
Gas/ Furnace
oil
November, 2012
Financial evaluation is underway
(D) Sub-total (private sector) (July-December/12)
1247
(C+D) total (Private sector)
1319
Total (2012) 2157
Source: Bangladesh Power Development Board

16
Table 7: List of Different Projects to be Implemented By 2013
Serial no
Name of the power station
Capacity (MW) Ownership
Types of
energy
Expected time for
operation Implementation/Progress
Public Sector
1
Ghorashal 200-300 MW Peaking Power Plant
290 BPDB Gas/
Diesel March, 2013
Approved by Procurement Committee
2 Khulna 150 MW Power Plant (GT)
150 NWPGC
Gas/Oil
March, 2013
Contract will be signed soon
(A) Sub-total (public sector) (January-June/13)
440
3
Siddhirgonj 450 MW Combined Cycle Power Plant
450
EGCB Gas December, 2013
Tender evaluation report sent to the World Bank
4 Bhola 150 MW CCPP
150 BPDB Gas December,
2013
Final report of feasibility study has been prepared by the Consultants
(B) Sub-total (public sector) (July-December/13)
600
(A+B) total (public sector)
1040
Private sector
1 Electricity from wind mill
100 IPP(BPDB) Wind January
2013
Re-started the preparation of revised PQ
2 Savar Peaking Power Plant, Dhaka
100 IPP
Gas/ Furnace
oil
March, 2013
Preparation of PQ is underway

17
Serial no
Name of the power station
Capacity (MW)
OwnershipTypes
of energy
Expected time for
operation Implementation/Progress
3 Bibiyana 300-450 MW CCPP (1st Unit) (ST)
222 IPP
Gas March, 2013
Issued LOI12
4 Bibiyana 300-450 MW CCPP (2nd Unit) (ST)
222 IPP
Gas April, 2013 Issued LOI
5 Meghnaghat 300-450 MW
(2nd Unit) (ST)
220 IPP
Gas/ Furnace
oil
April, 2013 Issued LOI
6 Keranigonj 150-225 MW CCPP
(ST)
100 IPP
Gas/ Furnace
oil
June, 2013 Re-tender to be advertised soon
7 Modongonj 150-225 MW CCPP (ST)
100 IPP
Gas/ Furnace
oil
June, 2013 RFP evaluation completed. Sent to the Ministry for approval.
(C) Sub-total (private sector) (January-June/13)
1064
8 Bhola 150-225 CCPP (2nd Unit)
(ST)
70 IPP
Gas August, 2013
Issued LOI
(D) Sub-total (private sector) (July-December/13)
70
(C+D) total (Private sector)
1134
(A+B+C+D) total
2174
Electricity Import
500
Total 2674
Source: Bangladesh Power Development Board
12 Letter of Intent
4⎯

18
Table 8: List of Different Projects to be Implemented By 2014
Serial no
Name of the power station
Capacity (MW)
OwnershipTypes
of energy
Expected time for
operation Implementation/Progress
Public Sector
1 Haripur 360 MW CCPP
360 EGCB Gas January,2014 Contract signed:09-02-11
2 Baro Pukuria 250-300 MW (3rd Unit)
250 BPDB Coal June, 2014 Primary survey has been done
3 Ashugonj 150 MW CCPP
150 APSCL Gas June, 2014 Called for tender: 04-04-2011
Tender received :05-06-2011
4 Shikolbaha 150-225 MW CCPP
150 BPDB Gas/Furnace
oil
June, 2014 Primary survey is underway
(A) Sub-total (public sector) (January-June/14)
910
5 Bheramara 360 MW CCPP
360 NWPGC Gas December, 2014
DPP is finalized
(B) Sub-total (public sector) (July-December/14)
360
(A+B) total (public sector)
1270
Private Sector
1 Bibiyana 300-450 MW CCPP (1st Unit) (ST)
119
IPP
Gas March, 2014 Issued LOI
2 Bibiyana 300-450 MW CCPP (2nd Unit) (ST)
119 IPP
Gas April, 2014 Issued LOI
3 Meghnaghat 300-450 MW (2nd Unit) (ST)
115 IPP
Gas/ Furnace
oil April 2014 Issued LOI

19
Serial no
Name of the power station
Capacity (MW)
OwnershipTypes
of energy
Expected time for
operation Implementation/Progress
4 Keranigonj 150-225 MW CCPP (ST)
50 IPP
Gas/ Furnace
oil June, 2014 Re-tender, to be
advertised soon
5 Modongonj 150-225 MW CCPP (ST)
50 IPP
Gas/ Furnace
oil June, 2014
RFP evaluation completed. Sent to the Ministry for approval.
6 Sirajgonj 300-450 MW CCPP
300 IPP
Gas June, 2014
RFP received : 10-04-2011
RFP evaluation is underway
(C) Sub-total (private sector) (January-June/14)
753
7 Chittagong 150-300 MW Coal based projects
150 IPP
Coal (Import)
September, 2014
Evaluation of financial proposal is underway
8 Khulna 150-300 MW Coal based projects
150 IPP
Coal (Import)
September, 2014
Evaluation of financial proposal is underway
(D) Sub-total (private sector) (July-December/14)
300
(C+D) Total (Private sector)
1053
Total (2014) 2323
Source: Bangladesh Power Development Board
3.1.4 Long-term: Electricity for All
The Government has taken steps to install new power plants having generation capacities of 2350 MW in 2015, 2800 MW in 2016 and 12450 MW between 2015 and 2020 to ensure electricity for all by 2021. Tables 9 to 14 depict the long term plans that have been taken by the Government:

20
Table 9: List of Different Projects to be Implemented By 2015
Sl no
Name of the power station
Capacity (MW)
Ownership
Types of energy
Expected time
for operation
Implementation/Progress
Public Sector
1 Ashugonj 450 MW CCPP Power Plant
450 APSCL Gas March, 2015
Preliminary work is underway
Total (Public Sector) (January-June/15)
450
Total (Public Sector)
450
Private Sector
1 Khulna South, PPP (Joint Venture/IPP)
1300 (Joint
venture)/IPP
Coal (Import)
March, 2015
Draft report on feasibility study has been prepared by NTPC
Total (private sector) (January-June/15)
1300
2
Mawa, Munshigonj 300-650 MW Coal based project
300 IPP
Coal (Import) September,
2015 RFP called for: 04-04-2011 RFP received :02-06-2011
3 Chittagong 300-650 MW Coal based project
300 IPP
Coal (Import)
September,
2015
RFP called for: 04-04-2011
RFP received : 02-06-2011
Total (private sector) (July-December/15)
600
Total (Private sector)
1900
Total (2015) 2350
Source: Bangladesh Power Development Board

21
Table 10: List of Different Projects to be Implemented By 2016
Sl no
Name of the power station
Capacity (MW)
OwnershipTypes of energy
Expected time for
operation Implementation/Progress
Public Sector
1 Meghnaghat 750 MW (3rd Unit)
750 BPDB Gas March, 2016 Preliminary work is underway
2 Dhaka North 750 RPCL Gas March, 2016 Preliminary work is underway
Total (Public Sector) (January-June/16)
1500
Total (Public Sector)
1500
Private Sector
1 Chittagong 1300 Joint venture/
IPP
Coal Import June, 2016 Feasibility study will
begin soon
Total (private sector) (January-June/16)
1300
Total (Private sector)
1300
Total (2016) 2800
Source: Bangladesh Power Development Board

22
Table 11: List of Different Projects to be Implemented By 2017
Serial no Name of the power station Installed
Capacity (MW) Ownership Types of energy
1 Meghnaghat 750 MW (4th Unit) 750 BPDB Gas
2 Chittagong South 600 BPDB Coal
3 Karnaphuli Hydo power plant-6,7 100 BPDB Hydro
Total 1450
Source: Bangladesh Power Development Board
Table 12: List of Different Projects to be Implemented By 2018
Serial no Name of the power station Installed
Capacity (MW) Ownership Types of energy
1 Meghnaghat 600 MW 600 BPDB Coal
2 Keranigong 750 MW 750 BPDB Coal
3 Electricity import from Mayanmar 500 BPDB Hydro
4 Ruppur Atomic electricity 1000 BAEC Atomic
Total 2850
Source: Bangladesh Power Development Board
Table 13: List of Different Projects to be Implemented By 2019
Serial no Name of the power station Installed
Capacity (MW) Ownership Types of energy
1 Baro Pukuria Kailash Dighipara1
600 BPDB Coal
2 Baro Pukuria Kailash Dighipara 2
600 BPDB Coal
3 Peaking Plant 200 BPDB Furnace Oil
Total 1400
Source: Bangladesh Power Development Board

23
Table 14: List of Different Projects to be Implemented By 2020
Serial no Name of the power station Installed
Capacity (MW) Ownership Types of energy
1 Baro Pukuria Kailash Dighipara 3
600 BPDB Coal
2 Ruppur Atomic electricity 1000 BAEC Atomic
Total 1600
Source: Bangladesh Power Development Board 3.2 Import of Electricity and Regional Co-operation: Latest Position According to the bilateral decisions taken at the Prime Ministers’ level meeting between India and Bangladesh, the Government has begun implementation of ‘Regional Grid Interconnection’ by installing 400 KV transmission line and HVDC (High Voltage Direct Current) Power sub-station to import 500 MW of electricity from India. In the meantime, the Indian Government has made a commitment to supply 250 MW of low-priced electricity from their ‘Unallocated Resource’ and informed that Bangladesh can import extra 250 MW of electricity from Indian’s ‘Power Pool’. Besides, steps have been taken to import hydro-electricity from Myanmar, Nepal, Bhutan and North-East India. 3.2.1 Import of Electricity from India and Establishing Joint-Venture Power Plant
Bangladesh and India has signed a Memorandum of Understanding (MoU) on January 11, 2010 to enhance cooperation in power sector. The areas emphasised in the MoU are electricity generation, transmission, increase in energy efficiency, development of different sources of renewable energy, installation of regional gridline, delivery of consultant services, human resources development, exchange of electricity and joint venture in power sector. Under this one, another MoU has been signed on August 30, 2010 between Bangladesh Power Development Board (BPDB) and Indian National Thermal Power Company (NTPC) to install power station. An initiative has been taken to install an imported coal-based power station with installation capacity of 1320 MW electricity jointly by BPDB and NTPC. For this purpose, 2300 acres of land are being acquired close to the Mongla Sea Port and a feasibility study has been underway. A ‘Joint Venture Agreement’ is to be finalized to confirm the installation of the proposed power station jointly by BPDB and NTPC. The agreement is expected to be signed soon. The proposed power station will be equally owned by both the BPDB and NTPC. It is expected that this power station would be able to supply electricity to the National Grid by 2013.
24
3.2.2 Import of Electricity from Myanmar
There is a plan to import 500 MW of hydro-electricity from a hydro power plant located at Lemro river of Rakhain state, Myanmar. For this purpose, a MoU has been signed between the governments of Bangladesh and Myanmar. It is expected that by 2018 the proposed 500MW of electricity would be imported through successful regional cooperation.
3.3 Power Tariff: Change in Rate and Policy
3.3.1 BPDB incurs its own cost of production for electricity. It also purchases electricity as a single buyer from IPPs, RPCL, Rental Power Plants, EGCB and Ashugonj Power Station Company Limited. BPDB is selling electricity to the bulk consumers (DPDC, DESCO, OJOPADICO and REB) and retail consumers under it’s distribution area at the tariff rate fixed by the Government. Due to the increasing demand for electricity, BPDB has taken steps to install new power plants and to purchase electricity from Rental and IPP to meet up emergency demand. BPDB’s per unit cost of purchasing electricity during 2009-10 was TK. 2.62, which increased to TK.4.05 in 2010-11.
3.3.2 As the selling price of electricity has not increased over the year compared to the supply cost, the government has provided BPDB with loans of TK.100 crores in every two months during 2006-07, TK. 600 crore in each year during 2007-09 and TK. 394 crore during 2009-10 to purchase rental electricity. Considering the supply cost of electricity based on estimated cost of electricity supply in 2010, a proposal for increasing the rate of bulk tariff has been sent to the Bangladesh Energy Regulatory Commission to reduce the losses of BPDB.
3.3.3 At the moment, electricity deficit is the main obstacle to development in Bangladesh. Though it is expensive, Government is trying to reduce electricity shortage by installing rental power stations. The Government’s subsidy in this sector is increasing with increasing generation of electricity. Government is planning to introduce an acceptable tariff rate by 2015 to bring down subsidy to a reasonable level. In the mean time, the bulk price of per unit electricity has been increased from TK. 2.37 to TK. 2.61 on February 2011.
3.4 Transmission and Distribution: Achievement and Workplan
3.4.1 A huge development plan has been taken up to ensure quality and uninterrupted power supply with production increases to resolve the problems of electricity. At the moment, there is 2,647.3 circuit km 230 KV line and 5,833 circuit km 130KB line in the country. Besides, from April 2010 to April 2011, distribution line has been expanded from 2,66,460 km to 2,70,000 km.

25
Table 15: Comparative Scenario of Power Transmission and Distribution
Subject April 2010 April 2011
230 Kilo Volt (kV) line ( Circuit km) 2,644.5 2,647.3
132 kV line ( Circuit km) 5,715 5,833
Distribution line (km) 266460 270000
Residential connection (number) 10073000 10082000
Irrigation connection (number) 1,49,581 241000
Commercial connection (number) 1355213 1373715
Industrial connection (number) 1,29,218 1,33,000
Other connection (number) 56253 56707
Source: Power Division
264000
266000
268000
270000
Km
2010 (April) 2011 (April)
0
500000
1000000
1500000
Number
Irrigation Commercial Industry Other
2010 (April) 2011 (April)
Figure 8: Progress in Household Connection : April 2010 to April 2011
9000000
10000000
11000000
12000000
number
2010 (April) 2011 (April)
Household Total
Figure 6: Progress in Distribution Line April 2010 to April 2011
Figure 7: Progress in Non-household Connection April 2010 to April 2011
5⎯

26
3.4.2 In order to implement the time-based workplan for electricity generation the Government has taken steps to install PGCB transmission lines and substations so that generated electricity can transmit from the power station to the load centres at different voltage level. Some of important transmission projects are presented below:
Table 16: Probable Projects for Transmission
Transmission line
Voltage level
Length (km)
Probable date to finish
Implementation/progress (April 2010)
Implementation/progress (April 2011)
Bibiyana-Kaliakoir
400 KV
168 2012-13 DPP sent to the Ministry
Tender received
Anowara-Meghnaghat
400 KV
260 2014-2015 Preperation for PDPP will start soon
Called for EOI13 for recruitment of Consultants
Aminbazar-Mawa-Khulna
400 KV
200 2014-2015 Preperation for PDPP will start soon
Called for EOI for recruitment of Consultants
Bibiyana-Comilla 230 KV
165 2011-2012 PDPP sent to the Ministry
Implementation is underway
Bheramarha-Bohorompur (India) Regional Interconnection Transmission line and HVDC sub-Centre (600MVA14)
400 KV
30 2012-2013 Tender evaluation is underway
Implementation is underway
Barisal- Bhola 230 KV
60 2012-2013 Prefeasibility study is underway
Tender received on 02/06/2011
Transmission line for electricity evacuation from Quick rental power plant and Public sector Peaking Power plant
132 KV
30 2010-2011 Implementation is underway
At the final stage of implementation
Source: Bangladesh Power Development Board
13 Expression of Interest 14 Mega-Volt Ampere

27
3.5 Electricity Conservation Programme: Which Way
Increasing electricity supply is not the only solution to the electricity problem. It is also important to put emphasise on electricity demand management in reducing electricity supply cost, protecting environment and controlling unnecessary use of electricity. Incompetitive electricity price increases subsidy and also fail to motivate users to make the optimum utilization of electricity. Considering this, Government has taken power saving initiatives through electricity demand management including electricity production. At the same time, electricity audit is being emphasised to ensure efficient use of electricity. Under load management the following initiatives are taken to conserve electricity and ensure its efficient use:
4.0 Year-wise Probable Electricity Demand and Supply: An Update 4.1 With the pace of economic development, the use of electricity increases in industrial, agricultural and other sectors. Similarly, with an increase in purchasing-power, the domestic demand for electricity and consumption of electricity also increases. The population growth is also an important factor for increasing electricity consumption. In other words, increase in demand for electricity and consumption of electricity are the indication of continuous development. However, it is important to control electricity misuse to ensure electricity savings, efficient use of electricity and effective use of resources that are allocated to the power sector. Unplanned urbanisation and rural housing increase the demand for electricity and reduce the effectiveness of electrification as well.
• Continuing holiday staggering program for industrial units, which reduces about 150 MW of electricity demand
• Shopping malls and markets are shut down after 8 pm reducing electricity demand by 350 MW at the peak hour
• Consumers in the government, semi-government and autonomous offices are being encouraged to maintain air-cooler temperature at and above 25 degree Celsius and to refrain from using air-coolers in the peak hours
• A number of steps have been taken to control electricity demand on the receiving end by using power saving handy equipments. For the first time 45 lakhs consumers received 1 crore 5 lakhs cost free energy saving CFL bulbs from the Government. This has reduced demand by 150-160 MW of electricity. Government is planning to distribute extra 1 crore 75 lakhs free energy saving CFL bulbs to the consumers by September 2011 which will reduce a significant amount of electricity consumption.
• Consumers are being advised to use T-5 tube lights and energy saving electric ballast instead of using magnetic ballast that consumes more electricity. For this, Government has taken steps to provide these quality goods to the consumers at lower prices.

28
4.2 In the absence of proper and timely repair and over-hauling, the productivity of old power plants is diminishing quickly. As well as, like other machinery, all the power plants depreciate over time. Besides, after a certain time-period some of the power plants are put on retirement which reduces the power generation capacity. Therefore, increased power generation would call for addressing the challenge of decreasing production capacity. The following list endorses all the power stations that will retire between 2011 and 2015:
Table 17: Retirement of Power Plant
Serial no
Plant name Commissioning year Retirement year
Power (MW)
01 Khulna Rental (03 years) 15/06/2008 2011 40
02 Kumargaon Rental (03 years) 23/07/2008 2011 48
Total 88
03 Bhola Rental (03 years) 12/07/2009 2012 33
04 Shahjibazar Rental (03 years) 13/11/2008 2012 50
Total 83
05 Ashugonj Rental (03 years) 07/04/2010 2013 55
06 Fenchugonj Rental (03 years) June, 2010 2013 51
07 Shikolbaha Rental (03 years) May, 2010 2013 55
Total 161
08 Ghorashal- Max Power March, 2011 2014 78
09 Ashugonj-B.Baria March, 2011 2014 150
10 Ashugonj (United Ashugonj) April, 2011 2014 53
11 Siddhirgonj Quick Rental March, 2011 2014 100
12 Thakurgaon Rental (03 years) August, 2010 2014 50
13 Khulna Quick Rental August, 2010 2014 55
14 Ghorashal Quick Rental August, 2010 2014 145
15 KPCL BMPP (Khulna) 12/10/1998 2014 106
16 Pagla, Narayongonj (Quick Rental)
November, 2010 2014 50

29
Serial no
Plant name Commissioning year Retirement year
Power (MW)
17 Bheramara Rental (03 years) December, 2010 2014 110
Total 897
18 (A) Ashugonj-B. Baria 15/11/1982 2015 40
(B) Ashugonj-B. Baria 28/03/1984 2015 18
(C) Ashugonj-B. Baria 23/03/1986 2015 40
19 (A) Haripur-Narayongonj 31/10/1987 2015 32
(B) Haripur-Narayongonj 15/11/1987 2015 32
(C) Haripur-Narayongonj 02/12/1987 2015 32
20 Sylhet 13/12/1986 2015 20
21 NEPC (Horipur BMPP) 30/06/1999 2015 110
22 Baghaba MBPP Westman 26/06/1992 2015 70
23 (A) Bheramara (Kushita) 28/07/1976 2015 18
(B) Bheramara (Kushita) 27/04/1976 2015 18
(C) Bheramara (Kushita) 19/01/1980 2015 18
Total 448
Total Retirement by 2015 : 88+83+161+897+448 = 1677
Source: Bangladesh Power Development Board
Graph 9: Statistics of Year-wise Capacity Retirement
0
500
1000
1500
2000
2011 2012 2013 2014 2015
Year
Meg
aWat
t Yearwise Retirement
CummalativeRetirement

30
4.3 In the wake of economic development, the demand for electricity is increasing at a high rate. A 12 percent annual increase of demand for electricity has also been projected in the Power Sector Master Plan. Accordingly, the demand for electricity has been estimated (in terms of demand management) to be 6500 megawatt by 2011. While the demand for electricity is increasing, the production capacity of existing power stations is falling. In spite of the existing gap between the demand for and the supply of electricity, it is projected that Bangladesh will be a power surplus country by 2012. The potential deficit/surplus of electricity during 2011 to 2016 is shown below:
Graph 10: Probable Power Shortage/Surplus (2011-2016)
-20000
2000400060008000
100001200014000
MegaWatt
2011 2012 2013 2014 2015 2016
Year
Deamnd (MegaWatt)Power Addition (MegaWatt)Depandable Capacity (MegaWatt)Shortage / Surplus (MegaWatt)
Source: Power Division
Table 18: Year-wise Projected Power Demand and Supply
2011 2012 2013 2014 2015 2016
Maximum demand for electricity (including DSM) (MW)
6500 7518 8349 9268 10283 11405
Generation Capacity (MW) 8042 10116 12629 13660 15882 17649
Capacity Retired (MW) 88 83 161 1292 128 1033
New Additional Supply (both Govt. & Private sector) (MW)
2194 2157 2674 2323 2350 2800
Reliable Production Capacity (MW) 5945 7575 9578 10491 12197 13554
Deficit/ Surplus (MW) -555 57 1229 1223 1914 2149
Source: Power Division

31
5.0 Challenges of Power Sector Development
According to plan, in order to implement different projects in power sector, multifaceted challenges are being met. To face these challenges, lots of changes have been brought in the existing policies and strategies including enacting new laws and amending existing ones. Despite these steps, to face the remaining challenges, appropriate and transparent steps will have to be taken quickly. Major challenges are mentioned below:
6.0 Uninterrupted Fuel Supply to Power Stations and Storage of Fuel
6.1 It is planned that Bangladesh Petroleum Corporation (BPC) will take necessary steps to refill the fuel of Peeking Power Stations in the government sector in due time on the basis of their storage capacity. Where railway communication is available, BPC will ensure fuel supply through railway. Moreover, where railway communication is not available, Bangladesh Petroleum Corporation (BPC) will supply fuel to the power stations by tankers plying through the rivers under its own arrangement.
6.2 Moreover, it is worth mentioning that plans have already been made that some of IPP power plants can import necessary furnace oil and diesel directly from the overseas markets under own arrangement to produce electricity. Furthermore, in order to ensure
• Supply of Primary Fuel o Exploration and enhancement of production of gas. Supply of 60 percent of
gas produced to power sector o Extraction of coal from domestic sources o Import of coal and construction of related infrastructure o Import of LNG
• Transportation of Fuel o Development of infrastructure relating to water-ways and railways
• Financing Projects o Ensure financing of government and private projects. o Mobilize foreign investment and foreign exchange
• Preparation and Management of Contracts o Train up efficient manpower on preparation and contract management o Reduction of project implementation period.
• Procurement System o Shorten the process of tendering and its approval
• Adjustment/Coordination o Co-ordinate between power savings and efficient use of power

32
supply of fuel to the diesel and furnace oil based power stations to be installed in future, formation of a joint venture company under Public Private Partnership (PPP) to import fuel is under way.
6.3 Petro-bangla and its subsidiaries will take necessary steps to ensure supply of required quantity of domestic gas and coal to produce electricity both in public and private sectors.
7.0 Channeling Resources
7.1 The Government has increased overtime the budget allocation to the power sector by identifying it as the most prioritised sector. With enhancement of budget allocation in this sector, the amount of subsidy has increased as well. Besides budget allocation, the Government has extended all kinds of supports to draw private investment and foreign aid in this sector.
7.2 In the FY 2011-12, the allocation (Tk.7152 crore) for the development of power sector is approximately 209 percent higher than that (Tk.2308 crore) of the FY 2008-09. On the other hand, the amount of subsidy (Tk. 5200 crore) in power sector during FY 2011-12 is 423 percent higher than that (Tk. 994 crore) of FY 2009-10. From FY 2009-2010 to FY 2011-12, the amount of government allocation in this sector has increased at a higher rate as percentage of GDP, total budget and total development budget.
Table 19 : Allocation of Resources in Power Sector (In crore TK.)
2008-09 2009-10 2010-11 2011-12
Development Budget of Power Division 2308.3 2102.2 5981.88 7152.63
Subsidies 1007 994 4200 5200
Total Government Expenditure 3315.3 3096.2 10181.9 12352.6
Percentage of GDP 0.60 0.66 1.17 1.37
Percentage of total Budget 4.2 4.5 7.1 7.6
Percentage of total Development Budget 19.0 17.8 25.7 26.9
Source: Finance Division

33
Graph 11: Statistics of Resources Allocation in Power Sector
02000400060008000
100001200014000
2008-09 2009-10 2010-11 2011-12
FY
Meg
aWat
t
Development Budget Subsidy Total Expenditure
7.3 A major share of the total allocation for power sector is spent for importing materials from abroad. It affects foreign exchange reserve adversely. Along with the enhancement of efficiency and effectiveness of power sector, more emphasis should be given on rational price determination of electricity to control rising trend of government subsidy. It will require a total investment of US$17,000 million to install all the planned power stations by 2016. It has been estimated that at least 59 percent of the required investment or US$ 10,000 million will come from the private sector. On the other hand, to implement the plan successfully, it is projected that a total investment of US$ 23000 million will be required in this sector by 2020.
6⎯

34
Energy Sector
8.0 The 6th five year plan is targeting for high economic development. The energy sector will have a key role in attaining this target. However, our existing energy infrastructure is far from sufficient to meet the increasing demand for power generation. This in turn adversely affects employment generation by impeding development activities. Realising the necessity of meetings the energy demand, the present Government has declared energy as an emergency sector. 9.0 Current Status of Energy Sector: The Evolution At present, Bangladesh receives energy supply both from renewable and non-renewable sources. In 2009, natural gas accounted for 50 percent of total energy supply, which declined to 46 percent in 2010. Contribution of bio-mass to total energy supply increased from 33.3 percent to 34.6 percent during this period. It may be mentioned that, use of oil as energy has increased significantly during this time. In 2009, oil represented 11.1 percent of total energy supply, which increased to 18.3 percent in 2010. The trend of annual energy consumption is presented below:
Figure 12: Annual Energy Consumption Trend
50.0
33.3
11.15.6
46.0
34.6
18.3
1.10.0
10.0
20.0
30.0
40.0
50.0
60.0
Gas Bio-Gas Oil Other
%
2009 2010
Source: Ministry of Power, Energy and Mineral Resources 9.1 Non-Renewable Energy: Revised Policy-Strategy
The proven reserve of natural gas which is the principal source of non-renewable energy of the country is gradually depleting. The supply of natural gas as a primary source of energy will be dried out soon if appropriate steps are not taken for exploration of new gas fields and their development. Considering this, the Government has taken steps to increase the diversification of non-renewable energy sources. As availability of gas is not directly related to the initiatives taken in this field, the Government has taken a range of steps to diversify energy sources. As part of this, the Government has given importance to import of LNG (Liquid Natural Gas) alongside gas, oil, coal, CNG (Compressed Natural Gas) and LPG (Liquefied Petroleum Gas).

35
9.2 Renewable Energy: Recent Progress on Policy
Bangladesh is considered as a country at high risk from the negative impacts of global warming. In order to reduce dependence on fossil fuel and to explore renewable energy sources in addition to generating power from commercial sources, the Government has formulated ‘Renewable Energy Policy 2010’ for the generation of environment-friendly power from renewable energy sources. A plan has been adopted to generate 500 MW power from renewable energy sources by 2015. The main sources of renewable energy in Bangladesh are solar PV (photovoltaic), wind power and biogas.
10. Natural Gas: Achievement in Last One Year
The major source of our primary energy is natural gas. Almost three-fourths of the total commercial energy demand is met from natural gas. It is, therefore, considered as one of the driving forces of the economy. As many as 23 gas fields have been discovered since 1955 when the first gas field was found in Sylhet. 10.1 Existing Reserve and Production Levels of Natural Gas: A Comparative Scenario
The daily production of gas was 1750 MMCF at the time of assumption of office by the present Government. Now, the production has increased to 2035 MMCF. The updated comparative scenario of natural gas during 2010 and 2011 is presented in the following table:
Table 20: The Current Comparative Scenario of Natural Gas Description January 2009 December 2010
Total number of gas fields 23 23
Number of gas fields which are in production 16 17
Total reserve of extractable gas (proven and probable)
20.605 TCF (Trillion Cubic
Feet) 20.605 TCF
Total consumption of gas up to April 8.047 TCF 9.431 TCF
Total reserve remaining 12.558 TCF 11.174 TCF
Daily gas exploration 1750 MCF 2035 MCF
Production by Petrobangla 847 MCF 934 MCF
Production by International Oil Companies 903 MCF 1100 MCF
Daily demand of gas 2050+ MCF 2500+ MCF
Daily shortage of gas supply 300+ MCF 500+ MCF
Increased production of Gas in last one year 170 MCF 114 MCF
Source: Energy and Mineral Resources Division

36
10.2 Consumption and Demand of Natural Gas: An Update
10.2.1 The supply of gas has been scaled up in the generation of electricity. In 2009, 55 percent of total extracted gas used to be consumed for electricity generation, now that has increased to 56 percent. The volume of gas that was supplied to the power sector in 2009, has been increased by 10 percent in 2010. At the same time, the use of gas has increased by 1 percent in each of the industry, CNG and household sector separately, even though it has declined by 3 percent in the fertilizer industry.
Figure 13: Sectoral Use of Gas in Percent, 2009
Figure 14: Sectoral Use of Gas in Percent, 2010
56
16
12
9
17
Power Industry FetilizerHousehold CNG Commercial
Source: Energy and Mineral Resources Division Source: Energy and Mineral Resources Division
10.2.2 In the last six years, the gas use rate has been the highest in the CNG sector. However, over the last two years, it has been increasing at a lower rate. In the power sector, it increased at a higher rate during 2008 to 2010. In recent years, though gas use was increasing at a decelerated rate in the captive electricity generation , the rate is higher than that of the power sector. Sector-wise annual average growth of gas use is shown in the figure below: Figure 15: Sector- wise Annual Average Growth Rate of Use of Gas in the Country
from 2005 to 2010
-40.0
-20.0
0.0
20.0
40.0
60.0
80.0
100.0
Power
Captiv
e
Furtiliz
er
Indu
stry
Tea G
arden
Commerc
ial
Househo
ld
CNG
%
200520062007200820092010
Source: Ministry of Power, Energy and Mineral Resources
55
15
11
12
16
Power Industry FetilizerHousehold CNG Commercial

37
10.2.3. Considering the average rate of consumption of gas in the country for the last 6 years and implementation of the target of producing 17,649 MW new electricity by 2016 in line with the Vision 2021, a projection has been made on the sectorwise annual demand of gas from 2010 to 2016. It may be noted that this projection is identical to the projection included in the booklet which was presented along with the previous year’s budget under the title “Towards Revamping Power and Energy Sector: A Road Map”. The projection for probable demand of gas up to 2016 is shown in the table below:
Table 21: Sectorwise Gas Demand Projection (Billion Cubic Feet)
2010-11 2011-12 2012-13 2013-14 2014-15 2015-16*
Power 300.5 324.5 350.5 378.5 415.8 443.7
Captive Power 142.6 164.0 188.6 216.9 238.6 264.5
Fertilizer 94.0 94.0 94.0 94.0 94.0 94.0
Industry 160.7 184.8 214.4 246.5 271.1 301.0
Household 99.5 111.4 124.8 139.8 153.8 167.8
CNG 44.7 51.4 56.5 113.0 124.3 152.5
Other 30.8 31.9 32.7 33.7 37.4 38.9
total 872.8 962.0 1061.5 1222.4 1335.0 1453.4
Source: Energy and Mineral Resources Division * Information of 2015-16 has been estimated on the basis of average growth during 2010-15
Figure 16: Projection of Annual Gas Demand (2009-10 to 2015-16)
1335
.0
783.1 87
2.8 962.0 10
61.5 12
22.4
0.0200.0400.0600.0800.0
1000.01200.01400.01600.0
2009-10 2010-11 2011-12 2012-13 2013-14 2014-15
Year
Bill
ion
Cub
ic F
eet
Source: Energy and Mineral Resources Division

38
10.3 Supply and Shortage of Gas: Overall Situation
Against an average annual demand for 872 BCF of gas, currently, only 742 BCF is being supplied from 79 wells of the existing 17 gas fields. As a result, there exists a shortage of 130 BCF of gas annually. According to the projections shown in the table, the total annual demand for gas will stand at 1453 BCF in 2016. On the basis of existing reserves, if the daily supply of 2.034 BCF remains unchanged, there may arise a shortage of 1.946 BCF of gas in 2016. Therefore, importance must be given to diversify the sources of fuels in lieu of depending on the existing reserves to meet the projected demand for gas.
10.4 Development Plan for Natural Gas Sector: Achievements and Revised Plan
By settling the existing critical situation prevailing in gas sector, the Government has identified the power and energy sector as the top priority sector in order to ensure the long term energy security and make the supply of natural gas easily available. The salient features of the planned policy strategy of government in overcoming the energy shortage are as follows:
10.5 Achievements in the Gas Sector in Last Year
After assumption of power, the present Government, emphasizing the exploration of new gas fields and extraction and distribution of gas, has drawn up short, medium and long term plans. Under the short term plan, production of 158 MMCFD gas was targeted
Policy Strategy
Adoption of time based action plan for discovering new gas fields to increase the supply of natural gas
Making BAPEX more effective in exploring oil and gas Speedy processing of tenders and signing of contracts for offshore blocks Approval for importing liquefied natural gas by the private sector as an alternative to
natural gas supply and building necessary infrastructure Encouraging the use of alternative energy where possible and thereby reducing the
supply of natural gas Creating opportunity for using energy from multiple sources by finalizing the National
Energy Policy and Coal Policy Forming Gas Development Fund for financial self-reliance of BAPEX in order to
expedite the development programmes of energy sector Reasonable pricing of gas considering its commercial value

39
by December 2010 from 9 gas fields but 63 MMCFD gas from the Sylhet-7, Habiganj-11, Titas-12 and Meghna-1 was produced and supplied to the nationa1grid. Additional 51 MMCFD gas from some other wells, not under this plan, was supplied to the national grid. A total of 114 MMCFD gas was added to the national grid by December 2010. The description of completed programmes up to December 2010 is given in the table below:
Table 22: Short Term Plan Completed by December 2010
Under Implementation by National Gas Companies
Time Schedule
Sl. No. Programme Start Completion
Increase in Production
(MMCFD)15
Agency Activity
1 Sylhet 7 December 09
January 10 8 SGFL16 Workover
2 Mehna 1 April 10 June 10 15 Workover 3 Habiganj 11 April 10 June 10 20 Workover 4 Titas 12 May 10 June 10 20
BGFCL17 Workover
Total 63
Source: Energy and Mineral Resources Division
11.0 Medium Term Plan (to be Completed by June 2013): Revised picture
An addition of 1085 MMCFD gas to the national grid under medium term plan was declared in the last year booklet. Out of nine, under short term plan, four projects were implemented within the stipulated time (Table 22). The remaining projects have been planned to implement in the medium term. In last year’s roadmap, it was decided that under medium term additional 300 MMCFD of gas would be supplied to the national grid by the international oil companies. In the medium term, supply of additional 1000 MMCFD of gas to the national grid by the international oil companies has been targeted in the revised plan. It is worth-mentioning that enhancing the production capacity of the national gas companies under Fast Track Programme and increasing gas by importing supply LNG have remained unchanged. Under the revised medium term plan, an addition of 1920 MMCF gas to the national grid is possible as shown in Table 23 below:
15 Million Cubic Feet Per Day 16 Sylhet Gas Field Limited 17 Bangladesh Gas Field Company Limited

40
Table: 23 Medium Term Plan to be Completed by June 2013 Sl. No.
Programme Completion Date
Increase in Production (MMCFD)
Implementing Agency
Activity Remarks
a. Under Implementation by National Gas Companies (2011-13) 1 Semutang 1, 5 20 Workover 2 Sundalpur 1 15 Exploration 3 Fenchuganj 4 20 Appraisal/Development 4 Shalda 3
June 2012
15 Appraisal/Development 5 Kapashia 1 June 2011 20 Exploration 6 Shrikail 2 December
2011 20 Exploration
7 Sunetra 1 Jan 2012 25 Exploration 8 Mobarakpur 1 December
2011 15 Exploration
9 Shalda 4 June 2012 15 Development 10 Shahbazpur 3,
4 March 2012 50
BAPEX
Development
11 Titas 17 October 2011 25 Development
12 Titas 18 March 2012 25 Development 13 Bakhrabad 9 August
2012 20
BGFCL Development
Sub-total: 285
b. Under Implementation by International Gas Companies (2011-13) 1 Moulavibazar 540 9 Development
wells Subject to appraisal
2 Bibiyana 360 6 Development wells
3 Jalalabad
December 2013
100
Chevron
3 Development wells
Exploration well digging
Sub-total: 1000
c. Implementation by National Gas Companies under Fast Track Programme (2010-12) 1 Titas 19, 20, 21 100 BGFCL Development wells
2 Rashidpur 8 20 Development wells
3 Rashidpur 5
June 2012
15
SGFCL Workover
Sub-total: 135
d. LNG Import (2010-12) 1 LNG Dec.-2012 500
Sub-total: 500 Grand-total (a+b+c+d) 1920
Source: Energy and Mineral Resources Division

41
11.1 Actions taken 11.1.1 National Gas Companies
Actions have been taken to supply 190 MMCFD of gas to the national grid by drilling 10 development/workover wells at Semutang, Fenchugonj, Salda, Shabazpur, Titas, and Bakhrabad gas fields. Sites have been selected for drilling exploration wells by seismic survey and data analysis at Sundalpur, Srikail, Kapasia, Sunetra and Mobarakpur. Exploring 95 MMCF gas daily from these wells has been targeted. Considering the increasing demand for gas, a Fast Track Programme has been initiated on an emergency basis to augment gas production. Under this programme, actions have been taken to drill four development wells in Titas and one in Rashidpur Gas fields and workover of one existing well to add 135 MMCF gas to the national grid. Under the same programme, identification of drilling sites has been initiated for collection, processing and analyzing of data by 2-D18 seismic survey of PSC-excluded 3100 line kilometer. If successful, these programmes are expected to increase gas reserves and augment the production of gas as well.
11.1.2 International Oil Companies
Target has been set to supply 1000 MMCFD of gas to the national grid by Chevron under PSC through drilling of 9 development wells in Moulvibazar, 3 in Jalalabad and 6 in Bibiyana gas field.
12.0 Long Term Plan (to be completed by December 2015): Changes So Far
According to the long term plan as envisaged in the document titled “Towards Revamping Power and Energy Sector: A Road Map”, it was planned to add 1080 MMCFD of gas to the national grid. Of which, additional 180 MMCFD was to be produced by national companies through drilling and development of exploration wells and another 900 MMCFD to be added by international oil companies by December 2015. However, under the revised long term plan, through drilling and development of exploration wells additional 180 MMCFD of gas is planned to be produced by national companies and 500 MMCFD by international oil companies totaling 680 MMCFD which will be added to the national grid by December 2015. It may be mentioned here that the two Bibiyana and Jalalabad gas development programs included in the last year’s road map being implemented by the international companies have been shifted to the medium term plan. Details of the changed long term plan are furnished below:
18 Two Dimensional
7⎯

42
Table 24: Long Term Plan to be Completed by December 2015
Sl. No.
Programme Completion
Period
Increase in Production (MMCFD)
Agency Activity Remarks
i) Under Implementation by the National Gas Companies
1 Titas Well 23, 24, 25 and 26
Dec’2015 100 BGFCL Appraisal well
Subject to successful 3-D Seismic Survey
2 Excavation of 5 Wells in
Sylhet, Kailashtilla and
Rashidpur
Dec’2015 80 SGFL Appraisal well
Subject to successful 3-D Seismic Survey
Sub Total (i) 180
ii) Under Implementation by the international Gas Companies
3 Onshore and offshore drilling
Dec’2015 500
Total (i+ii) 680
Source: Energy and Mineral Resources Division
12.1 Actions Taken
12.1.1 National Gas Company
Steps have been taken to supply 180 MMCFD of gas to the national grid through drilling of 9 development wells of which 5 are in Sylhet, Kailashtila and Rashidpur gas fields, and the rest 4 are in Titas gas field.
13.0 New Initiatives in Gas Sector in Last One Year
The Government has taken several key steps towards development of gas sector, which are as follows:
• Installation of Compressor : In order to ensure necessary supply of gas as well as stabilize the high pressures in the gas pipes, steps have been taken to install three compressor stations at Muchai, Ashuganj and Elenga. Installation of compressor at Muchai will be completed by November, 2011. Installation of other two compressors will be completed by December, 2012.

43
• International Cooperation :
In a bid to install two compressor stations at two places of Bangladesh and for the sustainable development of gas sector with a view to increase gas supply of the country, a Memorandum of Understanding (MOU) with Russia will be signed soon.
• 2-D and 3-D Seismic Survey:
Programmes have been undertaken to assess and re-evaluate gas reserve in prospective/potential areas of the country through 2-D and 3-D seismic surveys.
a) 3-D Seismic Survey:
3-D seismic survey of 3 (three) gas fields i.e, Rashidpur, Kailashtilla and Sylhet gas field covering an area of 705 sq.km has already been completed. On the other hand, 3-D seismic survey in Bakhrabad and Titas gas field covering 545 sq.km area will be completed by June 2012.
b) 2-D Seismic Survey:
2-D seismic survey has already been completed in the prospective areas of Sunetra and Rupganj covering 542 Line kilometers. On the other hand, 210 Line Kilometers of 2-D seismic survey will be completed in Bajitpur. Further, about 80 Line Kilometers of 2-D seismic survey in Modon and Salda will be completed by 2015.
Table 25: 2-D & 3-D Seismic Survey Plan at a Glance
Nature of Survey
Survey Completed Ongoing Survey Future Plan 2015
Rashidpur 325 sq. km Titas 335 sq. km
Kailashtilla 190 sq. km Bakhrabad 210 sq. km
3-D Seismic Survey
Sylhet 190 sq. km
Sunetra 392 L km Bajitpur 210 Lkm Modan 40 Lkm
Rupgonj 150 L km Titas, Bakhrabad, Rashidpur, Kailastila & Sylhet 3100 L km
Salda 40 Lkm
2-D Seismic Survey
Source: Energy and Mineral Resources Division

44
• Exploring New Gas Structure:
In recent months, BAPEX has identified a potential gas structure at Sunetra region spreading over Sunamganj and Netrokona districts by conducting 2-D seismic survey. The data indicates evidence of significant gas reserve in the said structure. In order to start exploration activities by October 2011, BAPEX is carrying out land acquisition, development of infrastructure and other relevant activities.
• Gas Development Fund
The Government has formed a Gas Development Fund (GDF) to finance the development projects of gas sector. The aim of forming this fund is to minimize foreign investment in gas sector and to maximize the financial capacity of domestic gas companies. So far, Finance Division has allocated an amount of Tk.255 crore to this fund.
Table 26: Proposed Projects for Implementation by GDF
Sl NO
Name of the Project Implementation Period
Total Cost (in crore Tk.)
1 Workover of wells in the Seepage area of Titas Gas Field
Mar11 – Dec13 346.50
2 Sunamgonj and Netrakona (Sunetra) Oil/Gas Exploration Well Drilling Project
Jul10 – Jun.14 279.00
3 Procurement of Gas Process Plant for Shahbazpur Field Jan11 – Dec12 92.57
4 1500 HP Rig Procurement Project Jan11 – Dec12 162.96
Source: Energy and Mineral Resources Division
• Installation of Pre-paid Meter
In order to rationalize the use of gas in the domestic sector, installation of Pre-paid Metering System has been completed at the cost of Tk. 6.71 crore by Titas Gas Transmission and Distribution Company. The production and installation of those prepaid meters are being completed under the technical assistance of BUET.

45
14.0 Necessary Steps ot be Taken to Increase Gas Supply
Though by implementing the above mentioned plans, projected additional gas could be added to the national grid it would by no means meet the full demand for gas. In this context, apart from implementing short, medium and long term plans taken by the Government, the following steps need to be taken to increase gas supply:
• Ensuring finance according to plans. • Expediting offshore bidding process. • Quick settlement of the process of delineation of maritime boundary with India
and Myanmar for bidding in the deep sea blocks • Strengthening BAPEX by procuring more advanced equipment and technology
in the short run and creating skilled manpower • Ensuring implementation of development programme in time • Ensuring planned excavation of wells and development of gas fields through
regular and effective monitoring of the activities of international oil companies
15.0 Import of Liquefied Natural Gas: A New Endeavour 15.1 To reduce the intensity of gas crisis as well as to meet the increasing energy demand, the Government has taken steps to import 500 MMCFD LNG. An MOU has already been signed with Qatar to Import LNG. A site has been selected for installation of a floating LNG storage station at Moheshkhali of Cox’s Bazar. The recruitment of consultant is underway.
15.2 The construction of about 95 km long pipeline from Moheshkhali to Anwara for LNG transmission is under way. The process of land acquisition for the proposed pipeline is duly progressing. Both the LNG terminal and pipeline are expected to be completed by March 2013. Following actions will be taken to mitigate the intensity of gas shortage by LNG import:
Steps to be taken
• Allow private sector opportunities to import LNG
• Construction of at least two terminals with auxiliary infrastructure and the capacity of receiving 500 MMCFD liquid gas from ships
• Involving private sector in the plan for importing and installation of LNG terminals.

46
16.0 Coal: Trend of Progress
Our coal resource has unlimited potential for the diversification of energy sources in the country. The proper utilization of extracted coal can be ensured by establishing coal-based power plants as well as using coal as a source of energy in the manufacturing industries. It should be noted here that the coal available in Bangladesh is considered to be of high quality for its high level heat generation capacity. 16.1 Coal: Reserve and Consumption
16.1.1 High quality bituminous coal mines have been discovered at Khalashpir of Rangpur, Boropukuria, Fhulbari and Jamalganj of Joypurhat in the north-western zone of the country. The total reserve is around 2797 million tonnes and the heat generation capacity is equivalent to about 37 TCF of gas. There is ample scope of discovering additional coal mines if extensive exploration initiatives are undertaken all over the country. The existing coal reserves of the 5 coal mines of the country are shown below:
Table 27: Coal Reserves of Five Coal Mines
Sl. Location/Exploration Year Depth
(Meter) Magnitude of mine
area (Sq. km.) Actual Reserve (Million Ton)
1 Boropukuria, Dinajpur (1985) 119-506 6.88 390
2 Khalashpir , Rangpur (1995) 257-483 12.0 143 (GSB)19, 685 (Hosaf)
3 Fhulbari, Dinajpur (1997) 150-240 30.0 572
4 Jamalganj, Bogura (1965) 648-1158 16.0 1050
5 Dighipara, Dinajpur(1995) 327 200 (Partial Evaluation)
Source: Energy and Mineral Resources Division
16.1.2 Of the 5 coal mines, Boropukuria in Dinajpur has begun commercial production from September, 2005 by using underground mining method with an annual extraction target of 10 lakh metric tones. A 250 MW power plant operates by using the coal of Boropukuria and produces electricity which is supplied to the National Grid. This plant utilizes 2500 metric tonnes of coal per day extracted from Boropukuria coal mine.
19 Geological Survey of Bangladesh

47
16.2 Steps To Be Taken To Tackle The Problems of The Coal Sector
16.2.1 Although Bangladesh has substantial deposit of quality coal, there is a concern about the method of extraction as well as the technological security. Experts recommend that the quick resolution of energy problems lies on coal import. In order to solve the problems, the Government needs to do the following:
16.2.2 The plan outlined in the last year’s Roadmap still remains unchanged. Substantial progress could not be made in the formulation of coal import policy and coal policy. However, the formulation of coal policy is at final stage now. 17.0 Liquefied Petroleum Gas (LPG): Trends of Import
Currently, the Government- owned companies are importing about 17,000 MT of
LPG per year while the private companies are importing about 60,000 MT against the
demand for about 3,00,000 MT of LPG. Demand for LPG is on the rise. The Government
is also pledge-bound to promote the use of LPG in view of the deposit of natural gas and
the inadequacy of gas supply for domestic use. It is important to meet the demand for fuel
wood and kerosene oil by using LPG. The Government has therefore, taken a range of
steps to reduce the price of LPG cylinder, and planned to establish 2 LPG bottling plants
- one at Mongla, Bagerhat and the other at Kumira, Chittagong under public- private
partnership. Each plant will produce about 1,00,000 MT of LPG per annum. Steps are
being taken to reduce customs duties, VAT, etc on LPG Cylinder and accessories. Side
by side, there is an initiative to formulate a policy for fixing price of LPG.
• Finalise coal policy immediately
• Formulate coal extraction plan consistent with social and environmental safeguards
• Build up mass awareness regarding the method of extraction, especially, for the open pit coal mines
• Obtain public opinion of the locality and ensure rehabilitation of the affected people of the area where open pit mining is found to be economically profitable
• Clarify government’s policy stance on import of coal.

48
Table 28: LPG Production in Public Sector at a Glance (2008-2011)
FY ERL RPGCL Total
2008-09 6,278 5,130 11,408
2009-10 12,291 4,450 16,741
2010-11 (up to Feb 11) 8,294 5,236 13,530
Source: Energy and Mineral Resources Division
18.0 Nuclear Energy
Attaching highest priority to the development of energy and power sector, the Government has taken an initiative to implement the Rooppur Nuclear Power Project, as a project of national importance. At present, actions are underway on assessing the design parameter of nuclear power plant site and carrying out geophysical, geological, geotechnical and morphological study to install nuclear establishments under the project titled ‘Accomplishment of Essential Activities to Implement Rooppur Nuclear Power Plant’.
18.1 Challenges of Nuclear Energy Sector
There are several challenges in addressing the issues of meeting energy deficit and ensuring energy security in the country which include interalia, the following:
19.0 Production, Usage and Promotion of Renewable Energy and Energy Saving Actions
In order to scale down the level of reliance on natural gas and import-dependent oil, the Government has taken a number of steps to increase and develop environment-friendly renewable energy. Prioritized actions to be carried out to implement energy saving activities are as follows:
Making necessary provision for financing. Ensuring safety and security. Building up trained and efficient manpower to run and maintain the nuclear plant. Building up awareness among general people regarding the risk and prevention of
nuclear power plants.

49
It is necessary to encourage the production and use of such energy from a source which is not harmful to environment.
19.1 Renewable Energy: Plans and Achievements
A target has been fixed in the Government declared energy policy to produce 500 MW electricity from renewable energy by 2015. Targets of power generation from renewable energy sources as fixed by the Government are presented in the table below:
Table 29: Targets of Electricity Generation by 2015 from Renewable Energy Sources and Achievements till Date
Classification Production (MW)- 2015
Achievement (MW)- 2011
Solar PV 200 50
Wind Power 200 2
Biomass 45 < 1
Biogas 45 < 1
Others 15 < 1
Total 500 55
Source: Ministry of Power, Energy and Mineral Resources
Finalize the draft law to create Sustainable Energy Development Authority(SEDA)
Promote and develop renewable energy
Implement cost effective energy activities
Ensure efficient use of energy
Standardize energy saving electronic machinery and technologies.
8⎯

50
19.2 Government Initiatives: IDCOL (Infrastructure Development Company Limited)
In order to encourage people to use renewable energy, IDCOL has taken a number of remarkable steps that includes:
20.0 Immediate Steps to Be Taken For the Development of Energy Sector
21.0 Trends of Resource Flow
Determining appropriate policies and strategies and providing financial support to generate wind-mill power.
Providing incentives for setting up of Bio-digester Plant Providing incentives for establishing solar panel producing industry Ensuring adequate investment in the energy sector Fixing maritime boundary with India and Myanmar Reducing the tendency of international oil Companies for quick withdrawal of
invested money under Production Sharing Contract (PSC) Determining rational price for ensuring sustainable development of energy
sector Developing and sustaining skilled professionals with knowledge on various
sources of energy Finalise Coal Policy Expediting import of LNG Expediting onshore bidding process
• By installing more than 9 lakhs solar home systems in the rural off-grid areas. A total of about 45 MW electricity is being generated.
• IDCOL has implemented other solar energy projects including solar irrigation pumps, solar mini-grids especially in offshore islands, solar panel assembling plants and solar powered telecommunication towers.
• More than 20,000 domestic biogas plants have been constructed by April 2011 under the ‘National Domestic Biogas and Manure Program’ implemented by IDCOL.
• IDCOL plans to install 2.5 million SHSs by 2014 with generation capacity of 125 MW.
• IDCOL has a target to install 150,000 biogas plants by 2016. • IDCOL has taken initiatives to implement commercial biogas and bio-electricity
plants in the poultry and dairy farms.

51
21.0 Trends of Resource Flow
21.1 One of the key resources for dealing to deal with the existing and projected
shortage of gas supply is to explore new gas fields and to re-evaluate the stock of existing
gas fields in order to determine the actual reserve and to take initiatives to increase
supply by excavating well in large number. This calls for huge investment and highly
technological, technical and professional skills to implement this initiative. Exploration
of gas and oil is a capital intensive venture and also a risky investment. According to a
survey report, it requires around Tk. 700 crore to explore a gas field having a level of
deposit that is commonly found. However, the success rate in this case could be only 20-
25 percent. The developing countries cannot afford to make this kind of huge investment
for exploration and extraction of gas even though there is a possibility of obtaining this
energy resource. In this case, the possible alternative is to take initiative for the
development of energy sector with the help of private sector especially under the
production sharing contract with financially, technically and technologically strong
International Oil Companies (IOC) while safeguarding the national interest.
21.2 Considering the importance of energy sector, the Government has scaled up allocation in this sector gradually. The amount of subsidy in this sector has also increased along with the increase in development allocation in energy sector.
21.3 In FY 2011-12, the allocation in development budget of Energy Division is around 362
(Tk. 1114 Crore) percent higher than that of FY 2008-09 (Tk. 241 Crore). On the other hand, the
amount of subsidy given in energy sector (Tk. 4000 Crore) in FY 2010-11 is about 344 percent
higher than that of the FY 2009-10 (Tk. 900 Crore).
Table 30: Resource Allocation in Energy Sector 2008-09 2009-10 2010-11 2011-12
Development Budget of Energy and Mineral Resources Division
241 1367.5 1054.9 1114
Subsidy 1500 900 4000 3000
Total Government Expenditure 1741 2268 5055 4114
Source: Finance Division

52
Figure 17: Resource Allocation in Energy Sector
0
1000
2000
3000
4000
5000
6000
2008-09 2009-10 2010-11 2011-12
A_©eQi
Cro
re T
aka
Development Budget Subsidy Total Expenditure
21.4 As the emphasis has been given on the diversification of energy sources for electricity generation, the use and import of oil is increasing. On the other hand, the fuel price is increasing in the international market. As a result, the amount of subsidy support keeps on rising. However, as energy is the main driver of economic growth, the Government is continuing with the programme for providing subsidy to this sector. The subsidy programme should be operated in a way so that the macroeconomic stability will remain unhindered. There is a plan to make the fuel price in domestic market compatible with the neighboring country in order to reduce the amount of subsidy to a reasonable level by 2015. 22.0 Conclusion
22.1 On assumption of office, the present Government worked out a Power Sector Master Plan and took up a wide range of programmes consistent with its Vision 2021. It is heartening to note that our people have started reaping the benefit of these programmes. In the meanwhile, a total of 1556 MW of electricity has been added to the national grid. However, the progress in energy sector does not match with progress made in the power sector. Like power sector, the energy sector should also work on a war footing.
22.2 It is really very difficult for the Government alone to make available the amount of resources required for the development of power and energy sector. For this purpose, private sector participation and the flow of foreign investments are required. The participation of private sector is satisfactory in this sector but the flow of foreign investment is inadequate and the participation of development partners is also not sufficient. Continued efforts should therefore be made to ensure more participation of development partners and the flow of foreign investment.
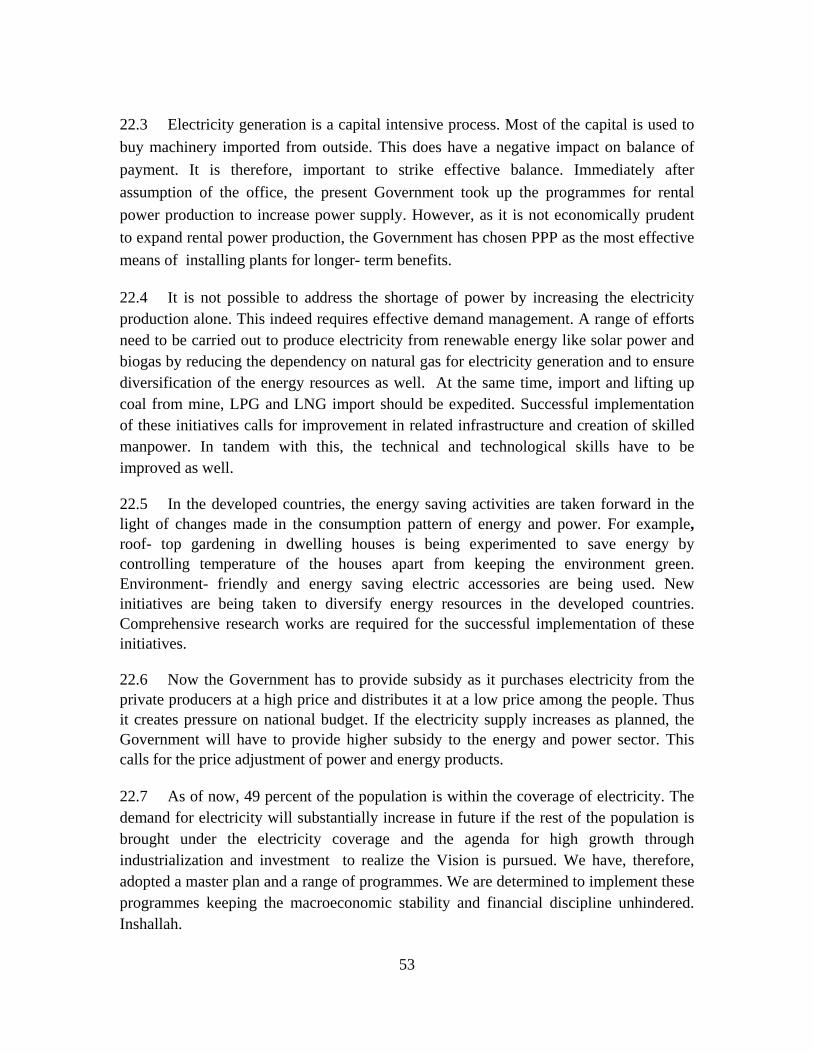
53
22.3 Electricity generation is a capital intensive process. Most of the capital is used to buy machinery imported from outside. This does have a negative impact on balance of payment. It is therefore, important to strike effective balance. Immediately after assumption of the office, the present Government took up the programmes for rental power production to increase power supply. However, as it is not economically prudent to expand rental power production, the Government has chosen PPP as the most effective means of installing plants for longer- term benefits.
22.4 It is not possible to address the shortage of power by increasing the electricity production alone. This indeed requires effective demand management. A range of efforts need to be carried out to produce electricity from renewable energy like solar power and biogas by reducing the dependency on natural gas for electricity generation and to ensure diversification of the energy resources as well. At the same time, import and lifting up coal from mine, LPG and LNG import should be expedited. Successful implementation of these initiatives calls for improvement in related infrastructure and creation of skilled manpower. In tandem with this, the technical and technological skills have to be improved as well.
22.5 In the developed countries, the energy saving activities are taken forward in the light of changes made in the consumption pattern of energy and power. For example, roof- top gardening in dwelling houses is being experimented to save energy by controlling temperature of the houses apart from keeping the environment green. Environment- friendly and energy saving electric accessories are being used. New initiatives are being taken to diversify energy resources in the developed countries. Comprehensive research works are required for the successful implementation of these initiatives.
22.6 Now the Government has to provide subsidy as it purchases electricity from the private producers at a high price and distributes it at a low price among the people. Thus it creates pressure on national budget. If the electricity supply increases as planned, the Government will have to provide higher subsidy to the energy and power sector. This calls for the price adjustment of power and energy products.
22.7 As of now, 49 percent of the population is within the coverage of electricity. The demand for electricity will substantially increase in future if the rest of the population is brought under the electricity coverage and the agenda for high growth through industrialization and investment to realize the Vision is pursued. We have, therefore, adopted a master plan and a range of programmes. We are determined to implement these programmes keeping the macroeconomic stability and financial discipline unhindered. Inshallah.

54
Appendix 1
Electricity Added in the National Grid (from January/09 to May/11) 1556 MW
From January /09 to December /09 the Following Power Stations have been Added to the National Grid
SL
No Name of the Power
Station Capacity
(MW) Type of
Fuel Ownership Date of commission/
present state
01 Habiganj SIPP 11 Gas Private (REB) 10 January, 2009
02 Shahjibazar ( for 15 year) 86 Gas Private (BPDB)
10 February, 2009
03 Feni SIPP 22 Gas Private (BPDB
16 February, 2009
04 Ullapara SIPP (Summit) 11 Gas Private (REB) 02 March, 2009
05 Kumar Gaon Rental (for 15 year)
10 Gas Private (BPDB
15 March, 2009
06 Mohipal, Feni SIPP 11 Gas Private (REB) 22 April, 2009
07 Maona, Gazipur SIPP (Summit)
33 Gas Private (REB) 12 May, 2009
08 Barabkundu SIPP 22 Gas Private (BPDB
23 May, 2009
09 Rupganj, Narayanganj SIPP (Summit)
33 Gas Private (REB) 9 June, 2009
10 Jangalia, Comilla, SIPP 33 Gas Private (BPDB
25 June, 2009
11 Bhola Rental ( for 3 years) 33 Gas Private (BPDB
12 July, 2009
12 Fenchuganj Rental ( for 15 year)
51 Gas Private (BPDB
18 October, 2009
Total 356
Source: Power Division

55
From January /10 to December /10 the Following Power Stations have been Added to the National Grid:
SL No
Name of the Power Station
Capacity (MW)
Type of Fuel
Ownership Date of commission/ present state
01 Ashuganj Quick Rental ( for 3 Years)
55 Gas Private (BPDB)
7 April, 2010
02 Shikalbaha Rental ( for 3 Years)
55 HFO Private (BPDB)
6 May, 2010
03 Thakurgaon Rental ( for 3 Years)
50 Diesel Private (BPDB)
02 August, 2010
04 Khulna Quick Rental ( for 3 Years)
55 Diesel Private (BPDB)
10 August,2010
05 Ghorashal Quick Rental ( for 3 Years)
145 Diesel Private (BPDB)
10 August,, 2010 23 August,, 2010
06 Shikalbaha 150 MW Peeking Power Station
150 Gas Private (BPDB)
18 August,2010
07 Shidhdhirganj 120 MW (2nd Unit) Power Station
105 Gas EGCB 14 October, 2010
08 Pugla, Narayanganj (DPAPGL)
50 HSD Private (BPDB)
24 November, 2010
09 Veramara Rental ( for 5 Years)
110 HSD Private (BPDB)s
31 December, 2010
Total t 775
From January /11 to May/11 the Following Power Stations have been Added to the National Grid
SL No
Name of the Power Station Capacity (MW)
Type of Fuel
Ownership Date of commission/ present state
01 Shidhdhirganj Quick Rental ( for 3 Years) Desh Energy
100 Diesel Private (BPDB
17 February, 2011
02 B-Baria Quick Rental ( for 3 Years)
70 Gas Private (BPDB
3 March, 2011
03 Modanganj Quick Rental ( for 5 Years), Summit Power
102 HFO Private (BPDB
1 April, 2011
04 Ashuganj 50 MW 53 Gas APSCS 30 April, 2011 05 Meghnaghat Quick Rental
( for 5 Years), (IL) 100 HFO Private
(BPDB 8 May, 2011
Total 425
Source: Power Division

56
Appendix 2
Summary of Achievements
As mentioned in the Road Map of Power and Energy Sector in April 2010
Status Goal Issue Limitation Potentiality
Achievement up to May 2011
• Inadequate supply of electricity compared to demand
• Deficiency in transmission and distribution including production deficiency of electricity
• Ensuring fuel security
• Ensuring uninterrupted supply and quality of electricity
• Enhancing efficiency of power sector
• Introducing new corparate culture in the organisations under power sector
• Balancing demand and supply (supply and demand adjustment)
• Ensuring electricity for all
• Saving electrity/fuel
• Enhancing efficiency of power sector
• Reducing system loss
• Deficit in fuel supply
• Contract for mid-term import of LNG and take steps to import
• Possibility of off-shore and on-shore gas exploitation
• About 1556 MW electricity has been added to the national grid
• Production of gas has been increased
• Dependency on unique fuel (gas) in producing electricity
• Increasing the use of natural gas (including liquefied natural gas), coal and fuel as primary fuel for electricity production
• Finalizing coal policy
• Establishing coal based power stations and reducing usage of gas
• Rationalize the price of gas, coal and electricity at the consumer level.
• Ensuring fuel diversification in power section
• Taking steps to import liquefied Natural gas (LNG)
• Prices of electricity and fuel are not be determined on commercial basis
• Production of electricity using coal domestically extracted and imported
• Production of electricity by Rupoor nuclear power from satiation
• The dependency rate of electricity production on gas has been reduced from 89 percent to 82 percent
• Bulk price of electricity has been increased by 11%
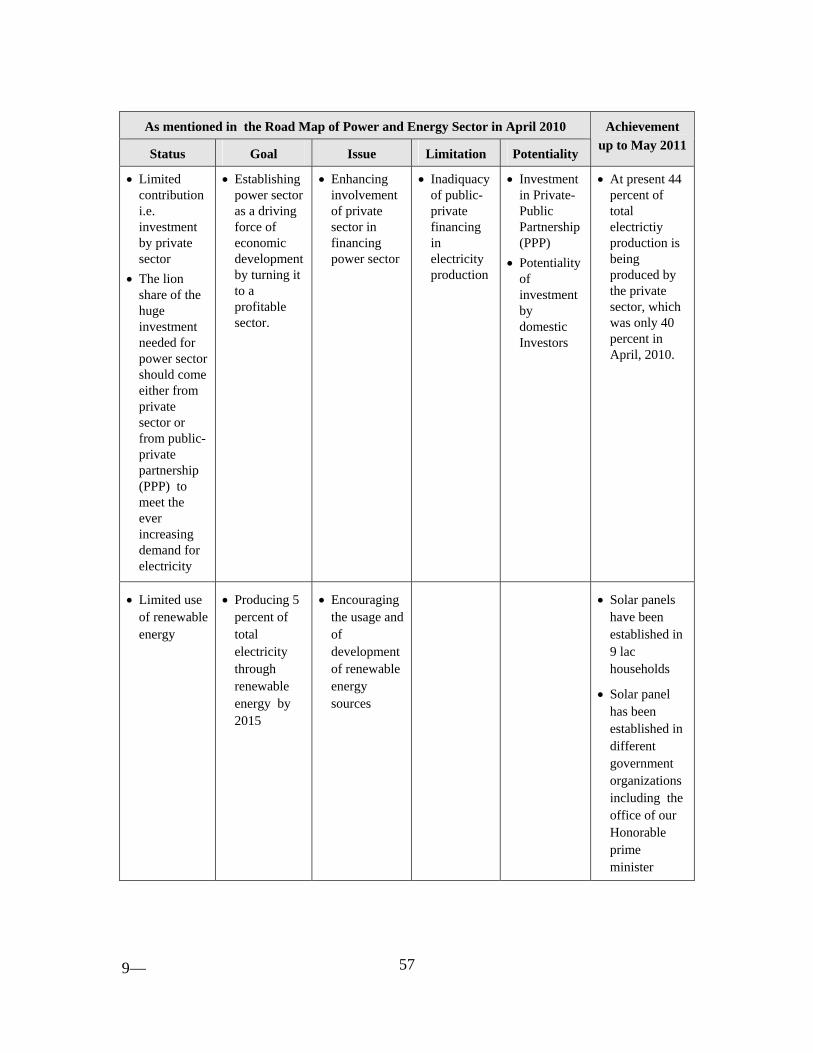
57
As mentioned in the Road Map of Power and Energy Sector in April 2010
Status Goal Issue Limitation Potentiality
Achievement up to May 2011
• Limited contribution i.e. investment by private sector
• The lion share of the huge investment needed for power sector should come either from private sector or from public-private partnership (PPP) to meet the ever increasing demand for electricity
• Establishing power sector as a driving force of economic development by turning it to a profitable sector.
• Enhancing involvement of private sector in financing power sector
• Inadiquacy of public-private financing in electricity production
• Investment in Private-Public Partnership (PPP)
• Potentiality of investment by domestic Investors
• At present 44 percent of total electrictiy production is being produced by the private sector, which was only 40 percent in April, 2010.
• Limited use of renewable energy
• Producing 5 percent of total electricity through renewable energy by 2015
• Encouraging the usage and of development of renewable energy sources
• Solar panels have been established in 9 lac households
• Solar panel has been established in different government organizations including the office of our Honorable prime minister
9⎯

58
A Comparative status of Power Sector between 2010 and 2011
Performance Indicators 2010 2011
1 Per head electricity consumption (Kilo Wat hour)
220 236
2 Coverage of electricity facilities (%) 47 49
3 Installed Capacity (Mega Watt) 5873 6813
4 Derated Capacity 5376 6208
5 Production (Mega Watt) 3900-4300 4000-4600
6 Maximum Production (Mega Watt) 4606 4699
7 Contribution of Private Sector (%) 40 44
8 Contribution of BPDB to total Production (%)
46 42
9 Dependency on gas in producing electricity (%)
89 82
10 Additional electricity added to the Grid (Mega Watt)
1556
11 Tariff Adjustment Bulk price of electricity has been increased by 11%
12 Rural Electrification Transmission Line (KM) Residential Connection Connection for Irrigation Commercial Connection Industrial Connection Other type of Connection
266460
10073000 149581
1355213 129218 56253
270000
10082000 241000 1373716 133000 56707
B.G.P:-2010-11/5731Com-A/4,000 Books, 2011.