JMP Domestic Water Pressure Booster Sizing A Road Map for ...
8
WHITE PAPER WHITE PAPER By JMP Equipment Company Domesc Water Pressure Booster Sizing: A Road Map for Success
-
Upload
khangminh22 -
Category
Documents
-
view
0 -
download
0
Transcript of JMP Domestic Water Pressure Booster Sizing A Road Map for ...

WHITE PAPERWHITE PAPER
By JMP Equipment Company
Domestic Water Pressure Booster Sizing: A Road Map for Success
WHITE PAPERWHITE PAPER
Designing a pressure booster system for a multi-unit building like an apartment building or hotel can be a little intimidating. However, JMP has developed the following worksheet that not only helps guide engineers through the selection process but also provides excellent documentation. So let’s start filling in those blanks!
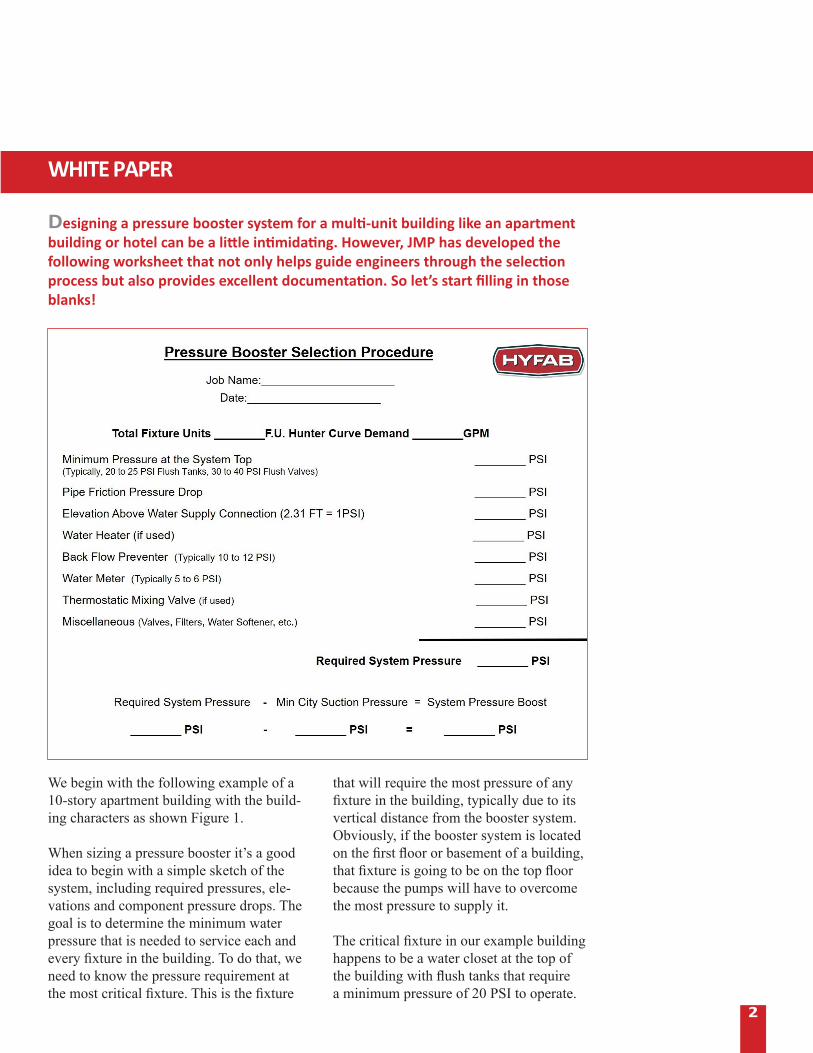
We begin with the following example of a 10-story apartment building with the build-ing characters as shown Figure 1. When sizing a pressure booster it’s a good idea to begin with a simple sketch of the system, including required pressures, ele-vations and component pressure drops. The goal is to determine the minimum water pressure that is needed to service each and every fixture in the building. To do that, we need to know the pressure requirement at the most critical fixture. This is the fixture
that will require the most pressure of any fixture in the building, typically due to its vertical distance from the booster system. Obviously, if the booster system is located on the first floor or basement of a building, that fixture is going to be on the top floor because the pumps will have to overcome the most pressure to supply it.
The critical fixture in our example building happens to be a water closet at the top of the building with flush tanks that require a minimum pressure of 20 PSI to operate.
2
3
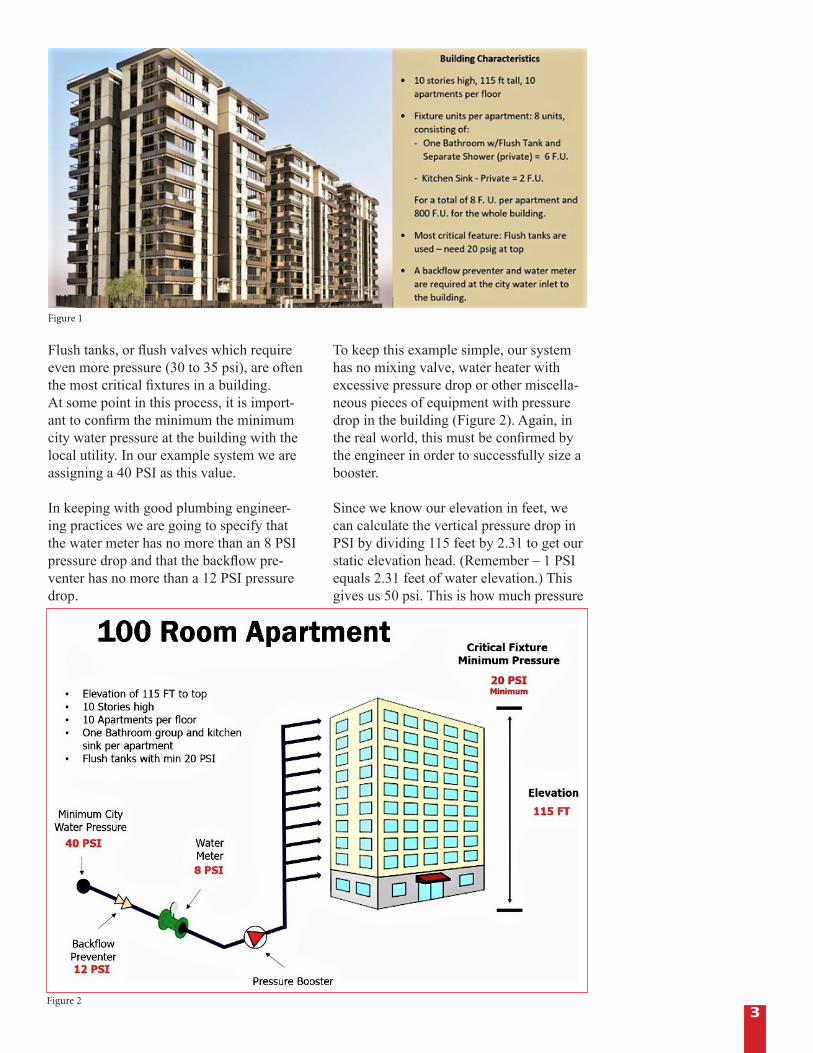
Flush tanks, or flush valves which require even more pressure (30 to 35 psi), are often the most critical fixtures in a building.At some point in this process, it is import-ant to confirm the minimum the minimum city water pressure at the building with the local utility. In our example system we are assigning a 40 PSI as this value.
In keeping with good plumbing engineer-ing practices we are going to specify that the water meter has no more than an 8 PSI pressure drop and that the backflow pre-venter has no more than a 12 PSI pressure drop.
To keep this example simple, our system has no mixing valve, water heater with excessive pressure drop or other miscella-neous pieces of equipment with pressure drop in the building (Figure 2). Again, in the real world, this must be confirmed by the engineer in order to successfully size a booster.
Since we know our elevation in feet, we can calculate the vertical pressure drop in PSI by dividing 115 feet by 2.31 to get our static elevation head. (Remember – 1 PSI equals 2.31 feet of water elevation.) This gives us 50 psi. This is how much pressure
Figure 1
Figure 2

4
we need to get the water from the bottom of the building to the top of the building. We can now start filling in some blanks on our worksheet (See right).
Estimating Fixture Demand LoadsThe next step in this process involves estimating the demand load of all of the fixtures in our building. Going back to the same simple example (Figure 1), we know that each apartment in our 100 Room apartment building has one bathroom group with flush tanks and one kitchen sink. (Clearly in a real apartment building you would have more fixtures, but we’re going to keep it simple. The steps for a more complex system are still the same.) Given this information we must now go to the fixture chart to calculate our total weight in fixture units.
A “fixture unit” is simply a unit of measure for how much water demand a fixture will require. Plumbing engineers can access detailed fixture charts in the plumbing code for the state where the building is locat-ed. All fixture charts in individual state plumbing codes are based on some edition of the International Plumbing Code (IPC). However, variations do exist, depending on what version the state has adopted, so be sure to go directly to your state’s published Code. There, you’ll find a chart that looks something like Table 1. Highlighted in red are the fixture units that correspond with our example. There are 6 fixture units for each bathroom group and 2 fixture units for the kitchen sink. That’s a total of 8 fixture units in each of the 100 apartments, or 800 fixture units for the entire building.
How much GPM is required for to satis-fy an 800 fixture unit (FU) demand? To find out we must consult Hunters Curve shown in Figure 3. This curve, which can be found in the IPC, is named for Dr. R. B. Hunter, an acclaimed researcher at the National Bureau of Standards from 1921 to 1943. Dr. Hunter invested decades of study to the sizing of pipe and the probability of fixture use. His theories resulted in this
demand estimating tool that continues to be used today. The Hunters Curve can be found in the IPC.
To use the Hunters Curve for our example, we simply locate 800 on the horizontal axis
Table 1

5
and draw a vertical line up to the curve to see where it intersects. As you can see, the Demand GPM for 800 fixture units is approximately 180 GPM. The double lines in the lower left reflect systems with flush valves (upper line) and flush tanks (lower line). Systems with less than 1000 fixture units will typically use less water if flush tanks are specified.
With these values filled in, our worksheet is almost complete.
Determining Pipe Friction LossThe next step in sizing a pressure booster is to determine the friction loss for our piping. Before that, here’s a quick review of the relevant design characteristics of our example building:
To calculate the total pipe friction loss, we first need to size the pipe using the chart shown in Figure 4. This chart, created by Bell & Gossett, is based on Hunter’s data and can be used for domestic water pipe sizing. It gives us the friction loss rates for copper piping at various sizes, along with corresponding GPM demand. When sizing copper pipe you want to re-main under 5 PSI per 100 ft pressure drop and 8 ft per second velocity (see the red
line on the chart). Compared to pressure drops for hydronic HVAC systems, 5 PSI per 100 ft might seem excessive but keep in mind that in a booster application you are sizing for a peak demand which will not often occur. The reason for limiting the velocity to 8 ft. per second is because of noise.
With all this in mind, we find our 180 GPM at the bottom of the chart and draw a line up vertically to where it intersects with either the 5 PSI per 100 ft horizontal
Figure 3
Building Characteristics
• 10 stories high, 115 ft tall, 10 apartments per floor
• Fixture units per apartment: 8 units, consist-ing of, - One Bathroom w/Flush Tank and Separate Shower (private) = 6 F.U. - Kitchen Sink - 2 F.U. for a total of 8 F.U. per apartment and 800 F.U. for whole building.
• Based on the Hunters Curve we have a maxi-mum demand of 180 GPM
• Most critical feature: Flush tanks that require 20 psig at top
• In this application a backflow preventer and water meter are required at the city water inlet to the building.

6
red line or the 8 ft per second diagonal red line that runs from the upper left to the bottom of the chart.
In this example we would go with 4-inch pipe which has a pressure drop around 0.8 PSI per 100 ft. We don’t choose the 3-inch pipe because if we continue to draw the line vertically from 180 GPM to the point where it intersects with the 3-inch pipe curve, then the velocity is above the 8 ft per second threshold. (Note that while some of us like our charts, most of you will be using one of the many pipe sizing applications that are available for free, such as the Bell & Gossett System Syzer. These apps include a wide range of pipe sizes, along with options for various types of pipe, including PVC, and fluids other than water.)
A conservative approach is to size the pipe according to the above criteria then apply
a 5 PSI pressure drop to the longest run of pipe. For simplicity sake, let’s say our longest pipe run is 100, giving us exactly 5 PSI of friction loss. As a general rule of thumb, we add 20% to that for tees, elbows and fittings, giving us a horizontal pipe friction loss of 6 PSI.
Finally, we have a backflow preventer and a water meter on our system. Backflow preventers are typically 10 to 12 PSI, so we plug in 12 PSI on our worksheet to be on the safe side. Water meters typically have 5 to 8 PSI of loss, so we plug in 8 PSI for that.
Now we have all we have all the infor-mation that is needed to determine our re-quired pressure boost. We simply subtract the minimum city water pressure (40 PSI) from our total pressure loss value of 96 PSI, giving us a required pressure boost of 56 PSI.
Figure 4

7
Selecting The Pressure BoosterDomestic water pressure boosters typical-ly have one to four pumps. The number of pumps specified for a given system depends on the demand (required gpm) and whether or not the application requires any redundancy. A “simplex” system with just a single pump is sufficient to handle most small demands assuming redundancy isn’t required. However, if the application is for a hospital or other critical operation, a duplex is often specified for inherent back-up.
Multiple pump systems (duplex, triplex or quadplex) are used for larger flow systems with duty split evenly between the pumps (i.e. 50%/50% for a duplex, 33%/33%/33% for a triplex, etc.) In these cases a single standby pump can be added if there is a need for redundancy.
It is usually more efficient to operate a booster with multiple smaller pumps than one or two large pumps. Demand profiles only spike once or twice a day so the abil-ity to stage smaller pumps on and off can be very advantageous. In a properly sized duplex system, a single pump will be able to meet demand most of the time.Finally, most pressure boosters have
centrifugal pumps that are either single stage (low pressure applications) or multi-stage (high pressure applications). Single stage pumps are generally better suited for applications with high demand (flow) and lower pressure boost requirement (100 PSI or less). Multistage pumps are ideal for higher pressure boost applications or if you are pumping out of a tank due to the low suction inlet.
For high pressure applications it is im-portant to make sure the pump casing can withstand the highest possible discharge pressure. It is also a good idea to specify that a redundant high pressure safety cut-off switch be included with the booster if over-pressuring the system is a concern. This should be set for the maximum pres-sure that the system can handle.
Picking the Pump(s)Back to our example application, the first thing we need to do is convert our 56 PSI pressure boost requirement to feet of head. To do that we simply multiply by 2.31:
2.31 FT/PSI x 56 PSI = 129 FT HD
We need to select the pressure booster based on 180 GPM at 129 FT HD booster.

8
We have determined that a duplex pump-ing arrangement with a 50%/50% duty split is good for this application. In this particular example we are going to con-sult a booster curve to make our model selection. HYFAB makes this easy with the Model Identification Curve shown in Figure 5.
180 GPM at 129 FT HD puts us in the yellow zone, the operating range for the MVP-850 model. The last three digits of the model number (noted as “XXX” in the image above) refer to the voltage in our system. In this example, we have 460/3/60 voltage, therefore we will choose an MVP-850-460 variable speed booster system.Since booster systems almost always oper-ate at part load, this duplex selection with two identical 5HP pumps, each operating at 50% of the total flow demand, will save operating cost and gives us some redun-dancy if one pump goes down or needs servicing.
Our selection is complete!
ConclusionIn summary, it isn’t difficult to properly size a booster system. It is simply a matter of gathering the information required to calculate the head loss and pressure re-quirements, determining if and how much redundancy the application requires, and then selecting the appropriate pump(s).
As always, JMP is here to help!
Figure 5