
Building a National Virtual Observatory: the Case of the Spanish Virtual Observatory
Upload
khangminh22Category
view
3download
0
Synthesis title:
Category: Roads
Keywords:
Speed limit, Signing, Safe speeds,
Compliance, Credibility,
Variable, Advisory
Other Relevant Topics:
Speed (Drivers, Roads) Safety Cameras (Drivers, Riders, Compliance
and the Law) Signing and Marking (Drivers, Riders, Roads) Convictions and Violations (Drivers, Riders,
Compliance and the Law) Traffic Calming (Drivers, Riders,
Pedestrians, Roads) Rural Roads (Drivers, Riders, Roads) Urban Roads (Drivers, Riders, Roads) Advanced Vehicle Systems (Vehicles)
Speed Limits

About the Road Safety ObservatoryThe Road Safety Observatory aims to provide free and easy access to independent road safety research and information for anyone working in road safety and for members of the public. It provides summaries and reviews of research on a wide range of road safety issues, along with links to original road safety research reports.
The Road Safety Observatory was created as consultations with relevant parties uncovered a strong demand for easier access to road safety research and information in a format that can be understood by both the public and professionals. This is important for identifying the casualty reduction benefits of different interventions, covering engineering programmes on infrastructure and vehicles, educational material, enforcement and the development of new policy measures.
The Road Safety Observatory was designed and developed by an Independent Programme Board consisting of key road safety organisations, including:
Department for Transport
The Royal Society for the Prevention of Accidents (RoSPA)
Road Safety GB
Parliamentary Advisory Council for Transport Safety (PACTS)
RoadSafe
RAC Foundation
By bringing together many of the key road safety governmental and non-governmental organisations, the Observatory hopes to provide one coherent view of key road safety evidence.
The Observatory originally existed as a standalone website, but is now an information hub on the RoSPA website which we hope makes it easy for anyone to access comprehensive reviews of road safety topics.
All of the research reviews produced for the original Road Safety Observatory were submitted to an Evidence Review Panel (which was independent of the programme Board), which reviewed and approved all the research material before it was published to ensure that the Key Facts, Summaries and Research Findings truly reflected the messages in underlying research, including where there may have been contradictions. The Panel also ensured that the papers were free from bias and independent of Government policies or the policies of the individual organisations on the Programme Board.
The Programme Board is not liable for the content of these reviews. The reviews are intended to be free from bias and independent of Government policies and the policies of the individual organisations on the Programme Board. Therefore, they may not always represent the views of all the individual organisations that comprise the Programme Board.
Please be aware that the Road Safety Observatory is not currently being updated; the research and information you will read throughout this paper has not been updated since 2017. If you have any enquiries about the Road Safety Observatory or road safety in general, please contact [email protected] or call 0121 248 2000.
How do I use this paper?This paper consists of an extensive evidence review of key research and information around a key road safety topic. The paper is split into sections to make it easy to find the level of detail you require. The sections are as follows:
Key Facts A small number of bullet points providing the key facts about the topic, extracted from the findings of the full research review.
Summary A short discussion of the key aspects of the topic to be aware of, research findings from the review, and how any pertinent issues can be tackled.
Methodology A description of how the review was put together, including the dates during which the research was compiled, the search terms used to find relevant research papers, and the selection criteria used.
Key Statistics A range of the most important figures surrounding the topic.
Research Findings
A large number of summaries of key research findings, split into relevant subtopics.
References A list of all the research reports on which the review has been based. It includes the title, author(s), date, methodology, objectives and key findings of each report, plus a hyperlink to the report itself on its external website.
The programme board would like to extend its warm thanks and appreciation to the many people who contributed to the development of the project, including the individuals and organisations who participated in the initial consultations in 2010.

2
Key facts
Effective speed management comprises a series of interventions that can have great benefits for road safety; one intervention is the setting and signing of speed limits.
Historically, speed limits have been set in accordance with the prevailing speed of traffic. OECD (2006) suggests that this approach is no longer viewed as appropriate; in response, new principles are emerging:
o Setting speed limits based on an assessment of the combined risk relating to the infrastructure, travel speeds, volume and mix of traffic by type (including vulnerable road users).
o Setting speed limits based on the safe system principles, meaning that speed limits are set to ensure that when crashes do occur, the resultant crash forces are survivable by most people.
In addition, there is a recent emphasis of the notion that speed limits should be credible or self-explaining to encourage self-compliance (DfT, 2013; Van Schagen, Wegman and Roszbach, 2004, as cited in SWOV, 2012; Goldenbeld, Van Schagen and Drupsteen, 2006, as cited in SWOV, 2012; Houtenbos et al., 2011; Lee et al., 2016) and applied consistently across the road network reflecting the function of the road to which they are applied.
Even small changes to the speed travelled by the driving population lead to large and measurable changes in risk. A 5% increase in mean speeds typically leads to an increase in injury crashes of 10% and an increase in fatal crashes of 20% (Nilsson, 2004).
Meta-analyses show that lowering the speed limit alone by 10km/h leads to a decrease in mean speeds of 3-4km/h (OECD, 2006).
To maximize their impact, any changes in speed limits should be accompanied by appropriate enforcement, engineering and educational measures (OECD, 2006; DfT, 2013).
Variable mandatory speed limits applied on motorways reduce speed differential and smooth traffic to reduce congestion. Upon introduction to a section of the M25 in 1995 a 15% drop in injury crashes was observed (DfT, 2010). Similar results have been observed across the world. If speed limit compliance is poor, there are several options available that might be used to improve compliance:
o Clarify speed limit signing and introduce additional measures such as gateway treatments.
o Introduce engineering measures that have a psychological impact on driver speed choice.
o Physical engineering treatments that restrict vehicle speeds through vertical or horizontal deflections.
o Enhance enforcement. o Ensure that the road features are safe at travelled vehicle
speeds. o Educate the public on the importance of reducing their speed.

3
Summary
Effective speed management comprises a series of interventions that can have great benefits for road safety; one intervention is the setting and signing of speed limits.
According to OECD (2006) most countries have general speed limits within the following ranges:
o Urban roads: 18-31 mph (30-50 km/h).
o Main highways or rural roads: 43-62 mph (70-100 km/h).
o Motorways: 56-81 mph (90-130 km/h).
World Health Organization (2017) provides guidance for safe speeds:
o Roads with possible conflicts between cars and unprotected users – 30 km/h.
o Intersections with possible side-on conflicts between cars – 50 km/h.
o Roads with possible frontal conflicts between cars – 70 km/h.
o Roads with no likelihood of frontal or side-on conflicts between road users - ≥100 km/h.
Historically, speed limits have been set in accordance with the prevailing speed of traffic. OECD (2006) suggests that this approach is no longer viewed as appropriate; in response new principles are emerging:
o Setting speed limits based on an assessment of the combined risk relating to the infrastructure, travel speeds, volume and mix of traffic by type (including vulnerable road users).
o Setting speed limits based on the safe system approach.
In addition, there is a recent emphasis of the notion that speed limits should be credible or self-explaining to encourage self-compliance (DfT, 2013; Van Schagen, Wegman and Roszbach, 2004, as cited in SWOV, 2012; Goldenbeld, Van Schagen and Drupsteen, 2006, as cited in SWOV, 2012; Houtenbos et al., 2011; Lee et al., 2016) and applied consistently across the road network reflecting the function of the road to which they are applied.
Even small changes to the speed travelled by the driving population lead to large and measurable changes in risk. A 5% increase in mean speeds leads to an increase in injury crashes of 10% and an increase in fatal crashes of 20% (Nilsson, 2004).
Meta-analyses show that lowering the speed limit alone by 10km/h leads to a decrease in mean speeds of 3-4km/h (OECD, 2006).
A 10 km/h reduction, from 110 km/h to 100 km/h on roads sections in Australia was found to result in a 27.4% reduction in the number of casualties when matched with the control roads (Mackenzie, Kloeden and Hutchinson, 2015).

4
Reducing speed from 90 km/h to 70 km/h on a considerable number of highways was found to result in a 5% decrease in crash rates, after taking trend into account (De Pauw, Daniels, Thierie and Brijs, 2014)
Reducing speed limit from 50 km/h to 40 km/h was found to produce significant reductions in mean free-flow speed and speed variance (Islam, El-Basyouny and Ibrahim, 2014)
On the other hand, a study from Israel suggest that increasing speed limits on highways by 10 or 20 km/h could result in increases in safety of 18 to 21% (Harari, Musicant, Bar-Gera and Schechtman, 2017)
To maximize their impact, any changes in speed limits should be accompanied by appropriate enforcement, engineering and educational measures (OECD, 2006; DfT, 2013).
In most countries, national speed limits are communicated to drivers through driver training and licensing, through a highway code, and reinforced through signs on the road.
Signs are the primary way of communicating the speed limit of a road to drivers, especially where this changes from one location to the next. Principles of effective speed limits signing are: uniformity, consistency, simplicity, relevance and legibility.
Clear signing where a speed limit changes, coupled with repeater signs, helps the effective communication of speed limits to drivers (OECD, 2006).
Without clear speed limit signs that are in accordance with national legislation, speed limits cannot normally be enforced.
Gateway treatments are useful where a speed limit reduces by a large amount (Kennedy et al., 2005).
If speed limit compliance is poor, there are several options available that might be used to improve compliance:
o Clarify speed limit signing and introduce additional measures such as gateway treatments where there is a large variation in speed limits between two sections.
o Introduce engineering measures that have a psychological impact on driver speed choice.
o Physical engineering treatments that reduce vehicle speeds. o Enhance enforcement. o Ensure that the road features are safe at travelled vehicle
speeds. o Educate the public on the importance of reducing their speed.
Traffic calming measures that physically restrict the speed at which it is possible (or comfortable) to drive the road can be highly effective, resulting in speed reductions of around 7mph, from 36.5mph to 29.5mph, and accident reductions of up to 97%, from 13.0 to 0.4 accidents per year (DfT, 2007).

5
Various remedial treatments have been found to be effective in lowering speed choice through psychological mechanisms; these measures can reduce vehicle speeds by up to 12mph.
Effective enforcement at a single location introduces a localised deterrent to drivers. Safety cameras can be highly effective in reducing vehicle speeds and the number and severity of injury collisions. The RAC Foundation has undertaken a comprehensive review of the effectiveness of safety cameras finding that deployment of speed cameras leads to reductions in speed in the vicinity of cameras and substantial reductions in crashes and casualties at those locations in addition to that which is attributable to regression-to-the-mean (Allsop, 2010). Allsop estimates that, in the year ending 2004, safety camera operations at more than 4,000 sites across Great Britain prevented 3,600 personal injury collisions and saved around 1,000 people from being killed or seriously injured. In a later comprehensive review of the effectiveness of average speed cameras, undertaken by RAC and RSA, the finding suggests a 36% reduction in the mean rate of fatal and serious crashes, after accounting for trend, RTM and site selection periods (Owen, Ursachi and Allsop, 2016). On the A14 in the UK, average speed safety cameras achieved a 20% reduction in crashes. When safety cameras were introduced on rural roads in Norway there was a 20% reduction in injury crashes (Elvik, 1997, as cited in Elvik, Hoye, Vaa and Sorensen, 2009); at high risk locations where safety cameras have been introduced, fatal crashes have been reduced by nearly 90% in Australia (ARRB, 2005). Average speed cameras can reduce vehicle speeds by 10km/h, from around 85km/h to around 75km/h (Stefan and Winkelbauer, 2006) and violations to below 1% (RWS, 2003, as cited in OECD, 2006). On road sections between 100 m upstream and 1 km downstream of the speed cameras a statistically significant reduction of the number of injury crashes by 22% was found (Hoye, 2015). Automated speed camera programme introduced in France between 2002 and 2006 saw a drop in death among young people by 40% (Atchinson, 2016).
Variable mandatory speed limits applied on motorways reduce speed differential and smooth traffic to reduce congestion. Upon introduction to a section of the M25 in 1995 a 15% drop in injury crashes was observed (DfT, 2010). Similar results have been observed across the world.
Vehicle Activated Signs (VAS), Dynamic Speed Monitoring Displays (DSMD), Dynamic Speed Display Signs (DSDS) and Speed Indicator Devices (SIDs) all have a positive impact on vehicle speeds (reduction in mean speeds of between 2 and 7 mph. Whether the impact of such devices is long-term remains an issue of contention.
Intelligent Speed Assistance (ISA) can help improve drivers’ compliance with speed limits by alerting them when they are travelling above the posted speed limits (WHO, 2017). ETSC recommends that all European countries should adopt legislation for fitting all new vehicles with an overridable Intelligent Speed Assistance system (ETSC, 2016).

6
Methodology
A detailed description of the methodology used to produce this review is provided in the Methodology section of the Observatory website at http://www.roadsafetyobservatory.com/Introduction/Methods .
This synthesis was compiled during December 2013 and January 2014 and updated during April and May 2017
Literature search
Searches were carried out on the pre-defined sources identified in the link above, and included the Transport Research International Documentation (TRID) database, and Pub Med. Together these databases provide access to over 24 million records in transportation and medical research.
Search terms used to identify relevant papers are included in the table below (Table 1). Asterisks denominate the use of special characters to include all forms of the word (e.g. evaluat* would capture evaluate, evaluation, evaluated). Research articles, reviews, statistical reports and policy documents have been included in this review.
The search yielded 817 results.
The updated search yielded 482 results.
Table 1
AND
Speed limit Principle
Setting
Speed limit Change
Raise
Lower
Casualt*
Speed limit Informing
Signing
Gateway
Zones
Vehicle activated sign
Repeater sign
Speed limit Compl*
Enforcement
Credib*
Adhere*
Exceed*

7
Road design
Vehicle system
Technology
Intelligent Speed Adaptation
Speed camera
Self explaining
Self-explaining
Self enforcing
Psychological traffic calming
Road readability
Road legibility
Speed limit Variable
Advisory
Selection criteria
Research articles were assessed for relevance and quality, and combined with other sources already known by the author. A total of 36 references were reviewed in detail in the production of this synthesis, many of these referring to others amongst the full list. During the update process, 37 additional references were reviewed in detail.
8
Key statistics
An increase in mean speeds of 5% typically leads to an increase in injury crashes of 10%, and a 20% increase in fatal crashes. Similarly, if mean speeds were to decrease by 5%, then a reduction in all injury crashes of 10% and a reduction in fatal crashes of 20% should be expected.
(Nilsson, 2004; OECD, 2008)
In urban areas a 1 km/h increase in average speed can lead to a 10-15% increase in crash frequencies.
(Taylor, Lynam and Baruya, 2000)
Kloeden et al. estimated that, if speed limits were to be reduced from 60km/h to 50km/h, there would be a reduction in casualty crashes of 21-28%.
(Kloeden et al., 2002)
A 5 mph increase in a State’s maximum speed limit was associated with an 8% increase in fatality rates on interstates and freeways and a 4% increase on other roads.
(Farmer, 2016)
A speed limit reduction from 110 km/h to 100 km/h, resulted in a 27.4% reduction in the number of casualty crashes.
(Mackenzie, Kloeden and Hutchinson, 2015)
A reduction from 90 km/h to 70 km/h on a considerable number of highways showed a 5% decrease in the crash rates.
(De Pauw, Daniels, Thierie and Brijs, 2014)
Meta-analyses show that lowering the speed limit by 10 km/h leads to a decrease in speed of 3-4km/h (OECD, 2006). Furthermore:
o In Hungary the speed limit in force within built up areas was reduced from 60 to 50 km/h in 1993 and resulted in a reduction of fatalities by 18.2% the following year.
(OECD, 2006)
o A reduced speed limit from 80 to 70 km/h, without changing the road infrastructure, led to a decrease in speed of some 5% (3-4 km/h).
(Ragnøy, 2004; as cited in OECD, 2006)
o In New South Wales in Australia, the speed limit on a 40km stretch of the Great Western Highway was lowered to 100km/h from 110km/h. Travel speeds were reduced (by nearly 5km/s) following the speed limit change and there was a reduction in the number of casualty crashes of 26.7%.
(Bhatnagar, Saffron, de Roos and Graham, 2010)

9
o In 1987, the speed limit on the Victorian rural and outer metropolitan Melbourne (Australia) freeways and highways was raised from 100km/h to 110km/h. Following this, there was an increase in casualty crashes per kilometre of 24.6%. When the speed limit was lowered back to 100km/h casualty crashes reduced by 19.3%.
(Sliogeris, 1992)
Physical measures that restrict the speed at which a road can be travelled (or comfortably travelled) can be highly effective in reducing vehicle speeds and accidents:
o The introduction of road humps can result in large accident reductions:
71% reduction in accidents at 34 sites with the introduction of road humps.
(Webster, 1993, as cited in DfT, 2007)
60% reduction in accidents with the introduction of road humps in 20mph zones.
(Webster and Mackie, 1996, as cited in DfT, 2007)
89% reduction in accidents for an average speed reduction of 13 mph upon the introduction of road humps.
(Hampshire County Council, 1996, as cited in DfT, 2007)
86% reduction in accidents upon introduction of speed cushions.
(CSS et al., 1994; Northamptonshire County Council, 1998, as cited in DfT, 2007)
97% reduction in accidents at sites where ‘thumps’ (thermoplastic humps) were introduced.
(Webster, 1994, as cited in DfT, 2007)
o Narrowings and chicanes can reduce vehicle speeds and reduce accidents:
Overall by around 7mph (though individual schemes achieved between 1 and 19mph).
(Hass-Klau and Nold, 1994, as cited in DfT, 2007)
Road space reallocation achieved a reduction in mean speed of 7-8mph
(Kennedy et al., 2005, as cited in DfT, 2007)
Traffic islands and pedestrian refuges provide modest speed reductions of 1-5mph though extra care should be taken to ensure risk for pedal cyclists is not increased through their implementation.
(Thompson et al., 1990; Cloke et al., 1999; Boulter, 2000, all as cited in DfT, 2007)

10
Chicanes reduce vehicle speeds to 20mph where the deflection angle is greater than 15 degrees and to 25mph where the deflection angle is greater than 10 degrees. A 54% reduction in injury accident frequency was observed.
(Sayer et al., 1998, as cited in DfT, 2007)
Various remedial treatments have been found to be effective in lowering speed choice through psychological mechanisms:
o 2-7mph reduction in speeds from vehicle activated signs.
(Winnett and Wheeler, 2003, as cited in DfT, 2007)
o 6-7% reduction in speed where advance curve warning markings (SLOW) accompanied by a bend warning curve and transverse markings were used.
(McGee and Hanscom, 2006)
o 3mph reduction in speed (measured at the apex of a bend) where transverse rumble strips were used on the approach.
(Barker, 1997)
o Optical bars/ transverse markings
0-5mph reduction in speed.
(McGee and Hanscom, 2006)
57% reduction in speed related crashes as a result of transverse yellow bar markings being introduced on the approach to roundabouts.
(Helliar-Symons, 1981)
o 12mph reduction in vehicle speeds where converging chevron bars on an exit ramp of a motorway were introduced.
(Drakopoulos and Vergou, 2003)
o Gateways
1-2mph further reduction in speed for basic gateway treatment when compared with just the introduction of a speed limit sign.
5-7mph reduction with high visual impact measures (e.g. dragons teeth/coloured road surfacing).
Up to a 10mph reduction where physical measures are used (e.g. narrowings etc.).
(Wheeler and Taylor, 1999, as cited in DfT, 2007)

11
Safety cameras have a clear and positive impact on vehicle speeds and safety (see also the ‘Safety Cameras Synthesis):
o The RAC has undertaken a comprehensive review of the effectiveness of safety cameras finding that deployment of speed cameras leads to appreciable reductions in speed in the vicinity of cameras and substantial reductions in crashes and casualties at those locations in addition to that which is attributable to regression-to-the-mean. It is estimated that, in the year ending 2004, safety camera operations at more than 4,000 sites across Great Britain prevented 3,600 personal injury collisions and saved around 1,000 people from being killed or seriously injured.
(Allsop, 2010)
o In a later comprehensive review of the effectiveness of average speed cameras, undertaken by RAC and RSA, the findings suggest a 36% reduction in the mean rate of fatal and serious crashes, after accounting for trend, RTM and site selection periods. The average speed cameras seem to be even more effective for low-speed sites, with 42% reductions compared to 32% for high speed sites. All the reductions are highly statistically significant. For less severe crashes the reductions are lower but still significant, 16% for the total sample, 25% for low speed sites and 8% for high-speed sites. The results show that ASC systems are effective in reducing collisions, especially those of a high severity. Even after allowing for the effects of trend and regression to the mean, highly significant reductions are noted.
(Owen, Ursachi and Allsop, 2016) o Accounting for both confounding factors and the selection of
proper reference groups, an extensive analysis of 771 camera sites and 4,748 sites for treatment, study results suggest that there are significant reductions in the number of accidents of all severities at speed camera sites. Speed cameras were found to be most effective in reducing accidents up to 200 meters from camera sites and no evidence of accident migration was found.
(Li, Graham and Majumdar, 2013) o On road sections between 100 m upstream and 1 km
downstream of the speed cameras a statistically significant reduction of the number of injury crashes by 22% was found. Larger effects were found for KSI than for injury crashes and the effects decrease with increasing distance from the speed cameras.
(Hoye, 2015) o 20% reduction in injury crashes in Norway upon introduction of
safety cameras on rural roads. (Elvik, 1997)
o In Australia where fixed speed cameras were introduced at high risk sites, crashes fell by almost 20%; casualty crashes fell by 23%, injury crashes by 20%, and fatal crashes by nearly 90%.
(ARRB, 2005)

12
o 33% reduction in injury crashes for rural safety camera installations.
(Gains, Heydecker, Shrewsbury and Robertson, 2004, as cited in OECD, 2006)
o Hidden safety cameras on a motorway in New Zealand yielded a further 11% reduction in ‘open road’ crashes and 19% reduction in casualty rate when compared with visible cameras.
(Keall, Povey and Frith, 2001)
o Average speed cameras were installed on the A14 between Huntington and Cambridge in 2007. Analysis of the accident rates after installation has shown that a reduction of accidents of 20% can be attributed to the implementation of these cameras.
(DfT, 2011)
o 10km/h speed reduction on an Australian motorway with the introduction of average speed cameras.
(Stefan and Winkelbauer, 2006)
o Reduction of violations to below 1% on a Dutch stretch of freeway with the introduction of average speed cameras.
(RWS, 2003)
Variable (mandatory) speed limits reduce vehicle speeds and can improve safety:
o The introduction of variable mandatory speed limits on M25 in 1996 achieved a 15% drop in injury crashes.
(DfT, 2010)
o In St Louis, US: 4.5-8% crash reduction.
(Bham et al., 2010)
o In France on the A7 road:
o 48% reduction in crashes.
(Serti, 2006, as cited in Traffix Group, 2009)
o 77% reduction in serious crashes.
(ASF, 2007, as cited in as cited in Traffix Group, 2009)
o In Germany (autobahns): 20-30% reduction in crashes.
(Robinson, 2000, as cited in Traffix Group, 2009)
o In Finland: 13% reduction in risk of injury. (Rama and Schirokoff, 2004, as cited in Traffix Group, 2009)
o In Netherlands: 35% reduction in serious crashes.
(FHA, 2003, as cited in Traffix Group, 2009)

13
o An optimal Variable Speed Limits control successfully decreased the collision risks by 22.62% and reduced the severity of crashes by 14.67%.
(Li et al., 2016)
o A Variable Speed Limit approach outperforms an uncontrol scenario, resulting in up to 20% of total time travel reductions, 6 – 11% safety improvements and 5 – 16% reduction in fuel consumption.
(Khondaker and Kattan, 2015)
Signs that are activated by vehicles according to their speed (Vehicle Activated Signs (VAS)) and signs that display to drivers their speeds (Dynamic Speed Monitoring Displays (DSMD), Dynamic Speed Display Signs (DSDS) and Speed Indicator Devices (SIDs)) all have a positive impact on vehicle speeds (reduction in mean speeds of between 2 and 7 mph).
o In the UK the effect of VAS that display a curve/bend warning sign when a vehicle is travelling above a certain threshold speed (set at the 50th percentile speed) was investigated at three rural curves. A reduction in mean speed of between 2 and 7mph (3 to 11 km/h) after one month was observed.
(Winnett and Wheeler, 2003, as cited in DfT, 2007)
o A 1.4mph speed reduction was observed at sites where SIDs were operational in the Royal Borough of Kingston-Upon-Thames. The speed reduction observed varied from 0.6 mph to 2.6 mph. The proportions of drivers exceeding 30 and 36 mph were significantly reduced at 10 out of the 11 sites. There was evidence of a novelty effect, with SIDs being most effective in the first week of operation.
(Walter and Knowles, 2008)
o 6-8mph reduction in vehicle speeds was found when DSMD were used at transitions to an urban area; this effect was still present after one year.
(Sandberg, Schoenecker, Sebastian and Soler, 2006)
o DSDS effectiveness decreases with time and are only effective over a short distance.
(Ardeshiri and Jeihani, 2013)
o The impact of different types of DSDS have been compared (numeric, numeric coloured and text based signs that say ‘slow’, ‘slow down’ or ‘thank you’). All DSDS led to a reduction in vehicle speeds: average speeds reduced by between 0.7 and 3.1km/h, typically from 31mph, and 85th percentile speeds by 1-3km/h, typically from 37mph. Verbal coloured signs were the most effective. The impact reduced as time elapsed.
(Gehlert, Schultze and Schalg, 2012)

14
Intelligent speed assistance (ISA) can help improve drivers’ compliance with speed limits by alerting them when they are travelling above the posted speed limits.
(WHO, 2017)
Intelligent Speed Assistance (ISA) is the term given to a range of devices that assist drivers in choosing appropriate speeds and complying with speed limits. Intelligent Speed Assistance technologies bring speed limit information into the vehicle. Drivers receive the same information that they see (or sometimes miss seeing) on traffic signs through an on-board communication system, helping them to keep track of the legal speed limit all along their journey. Information regarding the speed limit for a given location is usually identified from an on-board digital map in the vehicle. Other systems use speed sign reading and recognition. The information is then communicated to the driver in any of the following three ways:
o informing the driver of the limit (advisory ISA),
o warning them when they are driving faster than the limit (warning ISA) or
o actively aiding the driver to abide by the limit (assisting ISA).
All ISA systems that are currently being used in trials or deployment can be overridden if wished by the driver.
(ETSC, 2013)
ETSC recommends in their position paper that all European countries should adopt legislation for fitting all new vehicles with an overridable Intelligent Speed Assistance system.
(ETSC, 2016)
15
Research findings
Background
Effective speed management comprises a series of interventions that can have great benefits for road safety.
Addressing speed management policies and programmes plays a critical role in improving road safety.
(GRSP, 2008)
There are a number of factors that drivers will take into account when choosing the speed to travel; the posted speed limit is only one of them.
Speed management includes the following activities:
Setting and signing speed limits: Speed limits need to be appropriate and safe for the road to which they apply and should reflect the road function, traffic composition, frontage development and road design characteristics. The driver should always know what the speed limit is. The conventional way to achieve this is to use traffic signs and road markings.
Road engineering measures: The road infrastructure can be designed such that roads are forgiving (the road and vehicle in combination protect the road user from serious or fatal injury), self-enforcing (using physical treatments that reduce vehicle speeds such as road humps and chicanes) and self-explaining (road designs that are intuitive and clear and in accordance with the speed limit).
Police enforcement: Police enforcement is necessary to deter speeding. Traffic Law enforcement influences driving behaviour through the following processes: general, specific and localized deterrence.
Education: The provision of information and education for drivers is also a very important activity. If drivers understand the importance of speed limits, it is more likely that they will comply with them. Education can occur at schools, during driver training, on-road signage and through campaigns and awareness events.
Use of vehicle-based technologies: In-vehicle technologies such as Road Speed Limiters (normally in trucks and buses), and Intelligent Speed Adaptation (ISA) (some of these are advisory systems, others are intervening systems).
(GRSP, 2008; OECD, 2006)
This review covers just the first of these activities, setting and signing speed limits.
For further information on the impact of speed on safety please refer to the ‘Speed’ topic area.

16
What are the principles for setting speed limits?
Setting appropriate speed limits remains at the core of any speed management strategy and needs to take into account safety, mobility and environmental impact.
A number of criteria are normally used in different countries for defining general speed limits, these include:
o Type (category) of road/street/environment.
o Type of vehicle or type of loads (specific speed limits for heavy vehicles, public transport vehicles, farm vehicles, transport of dangerous goods, etc.).
o Type of tyres (specific speed limits for studded tires).
o Type of drivers (specific speed limits for young or novice drivers).
o Weather conditions (specific speed limits in case of rain, fog, etc.).
Most countries have general speed limits within the following ranges:
o Urban roads: 18-31 mph (30-50 km/h).
o Main highways or rural roads: 43-62 mph (70-100 km/h).
o Motorways: 56-81 mph (90-130 km/h).
(OECD, 2006)
Effective speed limits should be applied consistently across a road network. Some countries do this by adopting clear speed limit hierarchies based on road function. The concept is that higher speed limits are expected on principal roads (motorways and other interurban roads) for long distance movements; mid-range speed limits are expected on distributor roads; low speed limits are expected on residential streets or local access roads where there is a greater likelihood of interaction with vulnerable road users.
(Wegman, Dijkstra, Schermers and van Vliet, 2006, as cited in OECD, 2006)
Historically, speed limits have been set in accordance with the prevailing speed of traffic, typically the 85th percentile speed (or V85) (the speed at which 85% of drivers do not exceed in free flow conditions).
This approach is no longer considered appropriate for setting speed limits.

17
There are two main emerging approaches taken to setting speed limits:
o Assessing the combined risk relating to the infrastructure, travel speeds, volume and mix of traffic by type (including vulnerable road users). In this approach collision data are analysed. The aim is to adopt a speed limit to achieve “a combined risk at least below average risk levels for comparable sections of the network”.
o Utilising a safe system approach, requiring targeted infrastructure safety investments and speed limits which, in combination, will avoid fatal energy transfers in accidents.
(OECD, 2006)
Europe and Australasia have recently pioneered innovation in speed limit setting. Two key concepts are:
Safe System and ‘Safe Speeds’
Self-explaining roads/credibility of speed limits
Safe System
In the late 1990s a large majority in the Swedish Parliament passed the Road Traffic Safety Bill which was based on “Vision Zero”. Historically, road users have taken most of the ‘blame’ for road crashes, since it is their errors that cause the majority of crashes. The Safe System view is that responsibility for road safety and a safe system is shared by those responsible for the road and vehicle, and the road user.
The concept of a ‘safe road transport system’ is central to the Vision Zero approach. The approach recognizes that crashes are inevitable and so does not focus on eliminating crashes; rather, the approach aims to ensure that crashes are not fatal or serious. The safe system approach means that the system must be designed to compensate for the frailty of the human in the system (their limited tolerance of impact forces and the expectation that humans will make mistakes).
In terms of speed management, the speed at which crashes are survivable for most people has been calculated by crash type using in-depth crash investigation data. This has resulted in several simple rules as illustrated in Figure 1:
o Where conflicts between pedestrians and cars are possible (unrestricted roads), a safe speed would be 30km/h (approximately 20mph) – this is represented by the red line
o Where side impacts are possible at junctions (e.g. cross roads and T-junctions), a safe speed would be 50km/h (approximately 30mph) – this is represented by the green line
o Where head-on crashes are possible (e.g. where there is no median separation), a safe speed would be 70km/h (approximately 40mph) – this is represented by the blue line

18
50 30 10 110 90 70
Collision speed (km/ h)
Fatality
risk
Zero
100%
Pedestrian
Side impact
Head-on
Figure 1: Crash types and indicative fatality risk at speeds (source: Wramborg, 2005)
(Wramborg, 2005)
In order to implement a ‘safe system’ approach to speed limit setting, the graph could be used to derive rules with which to set safe speed limits. Therefore where pedestrians can be present (normally everywhere apart from motorways/expressways), and where they do not have fully segregated facilities, vehicle speeds must be 30km/h or less in order for most people to survive a crash. According to the safe system philosophy it would be necessary to reduce speed limits to 30km/h where pedestrians are not restricted from using a road; otherwise, completely segregated facilities (e.g. footpaths separated from the road properly, underpasses, footbridges) must be provided.
If there are junctions that are at-grade where side impacts may occur (e.g. cross roads or T-junctions) then speed limits must be 50km/h or less, or speed calming devices must be introduced, or junctions re-engineered such that side impacts are not possible (e.g. grade separated junctions or roundabouts with adequate deflection).
Finally, if head-on crashes are possible (i.e. there is no physical median separation) then speed limits must not be greater than 70km/h, or a physical separation must be introduced.
Similar ‘safe speeds’ are provided by the World Health Organization (WHO) in their guidance document:
o Roads with possible conflicts between cars and unprotected users – 30 km/h;
o Intersections with possible side-on conflicts between cars – 50
km/h;
o Roads with possible frontal conflicts between cars – 70 km/h;
o Roads with no likelihood of frontal or side-on conflicts between road users - ≥100 km/h.
(WHO, 2017)
19
Self-Explaining Roads and Credible Speed Limits
Roads are self-explaining when they are in line with the expectations of the road user, eliciting safe behaviour simply by design. In reference to speed limits, a road is self-explaining if driving above the speed limit is uncomfortable (either physically or psychologically) and obvious to the road user.
(Theeuwes and Godthelp, 1995)
A credible speed limit is defined as a speed limit that matches the image that is evoked by the road and the traffic situation.
For example, if a road has a 60 km/h limit, it must not look like a road that would normally have a limit of 80 km/h; that would not be credible. It is equally implausible if a road looks like a 60 km/h road, but is actually an 80 km/h road. Both the road and its environment must make it logical and credible that the one road has a lower limit than the other. If a limit is not credible, drivers will be more inclined to choose their own speed. If limits are experienced as lacking credibility too often, it will also damage the trust in the speed limit system as a whole, leading drivers to select the limit they think is appropriate. Credibility or perceived legitimacy of a limit is not an absolute measure; it is a sliding scale that varies from 'very credible' to 'very in-credible'. Credibility will also vary between different drivers.
(Van Schagen, Wegman and Roszbach, 2004, as cited in SWOV, 2012)
A speed limit can lack credibility either because the limit is considered to be too high or too low.
(SWOV, 2012)
In a study on credible speed limits, the following factors were determined as influencing driver perception of the credibility of 80km/h speed limits:
o The road width
o The presence or absence of a bend
o The view ahead
o The view to the right (driving on the right)
o The clarity of the situation
o The presence or absence of buildings
o The presence or absence of trees on the right hand side (driving on the right)
(Goldenbeld, Van Schagen and Drupsteen, 2006, as cited in SWOV, 2012)

20
In a study on the effect of speed limit credibility on drivers’ speed choice, the following conclusions were reached:
o Drivers’ judgments were more affected by characteristics of the road than road side
o Posted speed limits affected drivers’ judgments of appropriate speed
o Drivers choose speeds consistent with credible posted speed limits.
(Lee et al., 2016)
The ERASER project identified several factors that can be considered ‘accelerators’ i.e. road features that result in people opting to drive at a higher speed:
o High number of lanes in the forward direction o Presence of a physical median barrier o Wider lanes o Open road environment
If a road has these characteristics, this provides the road user with a feeling that the road should be driven at a relatively high speed. If the road has these characteristics but the posted speed limit is low (perhaps because of the presence of pedestrians), it is relatively unlikely that the speed limit will be observed due to perceived low credibility. In the latter circumstances, the road itself provides a message to a driver that is in conflict with the posted speed limit.
(Houtenbos et al., 2011)
Similar research in the UK has been used to underpin the approach recommended in Manual for Streets:
o Psychology and perception have an impact on driver speed choice; for example features such as edge markings that visually narrow the road, close proximity of buildings to the road, reduced carriageway width, obstructions in the carriageway, pedestrian activity (potential or observed), on-street parking and land use.
(Kennedy et al., 2005)
o Road width and forward visibility have an impact on speed choice.
(York et al., 2007)
On street parking, the absence of lateral shoulder, or higher traffic activity are the type of restrictions that make drivers more likely to comply with speed limits. The more restricted drivers become, particularly on arterials, the more likely they are to comply with speed limits.
(Gargoum, El-Basyouny and Kim, 2016)

21
Approaches to setting and reviewing speed limits
Four different approaches to setting and reviewing speed limits are presented in the sections that follow.
UK
Speed limits should be evidence-led and self-explaining to encourage self-compliance. Roads need to be designed so that crash outcomes are not fatal or serious.
The importance of consistent speed limits is emphasised.
Default speed limits are known as ‘national speed limits’. These are:
o 30mph speed limit on street lit roads
o 60mph on single carriageway roads
o 70mph on dual carriageways and motorways
(Lower default limits apply for buses, goods vehicles and cars that are towing trailers or caravans on some road types.)
These national limits are not, however, appropriate to all roads. The speed limit regime enables highways authorities to set local speed limits where the national speed limit is not appropriate. Each highway authority has its own approach to setting speed limits though guidance is provided by the Department for Transport.
There is a significant drive to reduce speed limits to 20 mph in urban areas and built-up village streets that are primarily residential to improve safety for vulnerable road users.
Relevant considerations in the setting of speed limits are:
o History of collisions
o Road geometry and engineering
o Road function
o Composition of road users (including existing and potential levels of vulnerable road users)
o Existing traffic speeds
o Road environment
Speed limits should not be applied for stretches less than 600 metres in length to avoid too many changes, and should not be applied as a solution to specific point hazards.
A speed limit appraisal toolkit has been developed to assist in the assessment of full costs and benefits of speed limit choices.
(DfT, 2013)

22
Although the transition to 20 mph is highly supported by national and international organisations, lack of compliance with the new speed limit among drivers in GB and in Europe (for 30 kph) is an important cause of concern. Self-enhancement bias, social contagion and habitual/inattentive driving are important factors in explaining non-compliance. Pro-active behaviour change strategies are required to create higher compliance levels.
(Tapp, Nancarrow and Davis, 2015)
A survey on 2,947 British adults, looking at attitudes and behaviours with regards to the 20 mph limit, reached the following findings:
o 65% of respondents’ support 20mph limits in residential areas (72% on busy streets/shopping areas)
o Road safety and children’s safety are the most common reasons for supporting the 20 mph limit
o Longer journey times and increased congestion are the most common reasons for opposing the 20 mph limit
o Supporter profile - female, aged 35 or over, white, Lab/Lib-Dem/Green voters, and low-mileage drivers
o Opponent profile - high mileage driving males, drivers of commercial vehicles, and from the 16-34 age band
o A fifth (20%) of the GB sample say they live on a road that has a 20mph speed limit
o 64%, agree that they ‘will be careful to observe new 20 mph limits wherever they are
o 57%, of respondents hope the police will enforce 20mph limits but there is little belief that this will happen
o 71%, agree that people will ignore 20mph limits because they don’t see themselves getting caught by the police
o 73% agree that breaking speed limits is not acceptable in most circumstances
o The majority of the public agree that encouraging walking (82%) and cycling (55%) for short journeys is a good idea.
(Tapp and Nancarrow, 2013)
X-Limits Software Suite: New Zealand, Australia and USA
The computer program X-Limits was originally developed by Australian Road Research Board (ARRB) as a decision aid tool to assist speed limit reviews undertaken by various road authorities. The aim of the tool is to ensure that speed limits are consistent and appropriate to local conditions. Various versions of the software have been used in Australia (Victoria, South Australia, Queensland, New South Wales, Western Australia, and Tasmania), New Zealand and USA.

23
The programme takes into account the road and its environment, adjacent development, nature and level of road user activity (including presence of vulnerable road users), collision record and speed limit on adjacent road sections.
(OECD, 2006)
Application in New Zealand
In New Zealand, the two national default speed limits are:
o 50km/h in urban areas
o 100km/h in rural areas
In addition 60, 70 and 80km/h speed limits can also be used. The rules for setting speed limits in New Zealand are detailed in “Speed Limits New Zealand” (SLNZ)
The decision support tool, NZLIMITS (part of the X-Limits suite) uses various factors that describe the road environment, crash data and speed survey data to guide a review of the posted speed limit. Factors that are included in the rating are:
o The frequency and nature of side roads
o Roadway characteristics (e.g. median divided, lane width and number of lanes, road geometry, street lighting, footpaths, cycle lanes, parking, setback of fence lines from carriageway)
o Vehicle, cycle and pedestrian activity
The rating is then combined with surrounding land environment (e.g. rural, fringe of city, fully developed, residential, school, commercial, industrial) and road type (function) to give a recommended speed limit through the use of a flow chart. A separate recommended speed limit is identified based on mean and 85th percentile observed speeds. Each of the recommended speed limits (based on roadway characteristics and observed speeds) along with crash data are considered by engineers in order to make a final recommendation. This is then subject to consultation with stakeholders, which is a legal requirement.
(Land Transport New Zealand, 2003)
In US, a comprehensive framework for a speed-zone manual is proposed, comprising six phases:
o speed-zone identification
o speed-limit determination
o transition-zone detailed design
o speed-zone approval
o speed-limit enforcement
o follow-up study (Shrestha and Shrestha, 2016)

24
Safe System: Sweden
In Sweden, the concept of a ‘safe speed’ has been adopted as a basis for considering appropriate speed limits. The Road Authority aims to ensure that the ‘safe system rules’ are not violated in order to ensure that crashes that do occur are survivable.
(Tingvall and Haworth, 1999, as cited in GRSP, 2008 and OECD, 2006)
Basic speed limits in Sweden are:
o 110km/h on Freeways (expressways)
o 90km/h on other rural roads
o 50km/h in urban areas
o 30km/h around schools and day care centres
Safe and Credible Speeds: Netherlands
The main approach to road safety in the Netherlands is ‘Sustainable Safety’. Sustainable safety has the following key principles:
o Functionality of roads: Mono-functionality of roads as either through roads, distributor roads, or access roads in a hierarchically structured road network.
o Homogeneity of mass and/or speed and direction: Equality of speed, direction, and mass at moderate and high speeds.
o Forgivingness of the environment and of road users: Injury limitation through a forgiving road environment and anticipation of road user behaviour.
o Predictability of road course and road user behaviour by a recognizable road design: Road environment and road user behaviour that support road user expectations through consistency and continuity of road design.
o State awareness by the road user: Ability to assess one's capacity to handle the driving task.
(SWOV, 2006)
The road hierarchy in the Netherlands is relatively clear cut and so it is possible to ensure that different road types are distinctive in their design such that road users can correctly categorize roads. The ambition is that, through categorization, road users can know the speed limit.In the Netherlands recent work has been undertaken by SWOV for the Directorate-General for Public Works and Water Management to develop a tool to aid decisions on reviewing speed limits such that they are both safe and credible.
(Aarts and Van Nes, 2007, as cited in SWOV, 2012)

25
This methodology allows the input of road characteristics. Based on these data, simple rules have been devised to determine if the speed limit violates ‘safe speed rules’ and if the speed limit is credible. The decision support tool recommends making changes to the posted speed limit, adapting the road layout and elements of the road environment and/or police enforcement activities. The method has been applied in two provinces.
(Aarts et al., 2010, as cited in SWOV, 2012)
Additional to the four cases, later findings suggest that Continuous Speed Data can be successfully used for setting rational speed limits and improve safety. New methodologies based on applications which continuously capture speed and location data can be utilised to improve the process by which engineers determine speed limits and
advisory speed zones.
(Fitzpatrick et al., 2016)
Special Cases
Speed Limit by Vehicle Class
There is a general consensus internationally that lower speed limits should be in place for large vehicles on high speed roads. However these speed limits are not signed on the highway to reduce overload and confusion for drivers.
The majority of countries apply an overall maximum speed limit for trucks (often 50mph) and buses (varying between 50 and 62mph). Some countries have, however, taken further steps to apply lower truck and bus speed limits for different road types, e.g. Denmark, Ireland and the United Kingdom. In North America (Canada and the United States), there are rarely differentiated speed limits for trucks. Some countries have differentiated speed limits for caravans and/or other vehicles which are towing something.
(OECD, 2006)
In April 2015, new national speed limits came into force for heavy goods vehicles (HGVs) over 7.5 tonnes on single carriageway and dual carriageway roads in England and Wales. The new limits are:
o 50 mph (up from 40 mph) on single carriageway roads
o 60 mph (up from 50 mph) on dual carriageway roads.
(Department for transport, 2016)

26
Unrestricted Speed Limits
In Germany 45% of Autobahn roads (nationally coordinated motorways of a very high standard) do not have a mandatory speed limit; instead they have an advisory speed limit (of 130km/h). Although exceeding the advisory speed limit is not an offence, the driver may have increased liability in the event of a crash.
Many studies have shown the negative impact of having no mandatory speed limit on these roads. For instance:
o There was improved safety with the introduction of a 100 km/h speed limit on German Autobahns during the oil crisis (November 1973 – March 1974) which led to a 50% reduction in the number of people who were killed or seriously injured.
(Gohlisch and Malow, 1999)
o Similar reductions in road crashes were observed on Autobahns in one of the federal states, Hessen, where a temporary speed restriction of 100 km/h was introduced. On restricted speed sections on the Autobahns, KSI rates per billion driven kilometres were reduced by 25%-50%.
(Durth et al., 1989, as cited in Gohlisch and Malow, 1999)
o The federal office for transport estimated that the safety benefits associated with the introduction of a speed limit of 130km/h across all Autobahns in Germany would be a 20% reduction in fatalities and, for a speed limit of 100km/h, reductions would be even greater at 37%.
(BASt, 1984, as cited in ETSC, 2008)
Variations to Speed Limits
Most countries allow variations to speed limits to take account of local conditions, although there are differences in how this is achieved, for example:
o The simplest method for allowing speed variations is used in UK where only the existing vehicle speeds, and in specific cases crash records, are taken into account.
o In New Zealand variations are mainly allowed in urban and transition areas between urban and rural environments. In these locations, surveys are undertaken to evaluate how busy a section of road is and what its particular characteristics are.

27
Other Special Cases
A school zone is an area on a road near a school that is likely to have a particularly high number of younger pedestrians. Speed limits in these areas may be set very low (normally between 15 and 25mph). In some cases, school zone speed limits are only in force when children are outside or crossing the street (e.g. California), during specific periods of weekdays when children are likely to be present, or only when schools are in session (during term times). Flashing amber lights can be used to make it clear when school zone speed limit reductions are applicable.
In some jurisdictions (e.g. New South Wales, Australia and in many states of the United States of America), fines and demerit points are higher during school zone times.
Speed limits can also be reduced for a short section of road around intersections with a particularly poor crash history, though this alone is unlikely to be effective.
Often work zones/road works have reduced speed limits in place. In UK these are often set to 50mph on motorways.
What will the impact of changing the speed limit be?
The likelihood of being involved in a serious or fatal crash increases significantly with even small increases in vehicle speed as shown in Figure 2.
Reading across the x-axis (bottom) of the graph in Figure 2, it can be seen that an increase in mean speeds of 5% leads to an increase in injury crashes of 10% (purple line), and a 20% increase in fatal crashes (red line). Similarly if mean speeds were to decrease by 5%, then a reduction in all injury crashes of 10% and a reduction in fatal crashes of 20% should be expected.
(Nilsson, 2004; OECD, 2008)
Figure 2: Impact of change in mean speed on change in number of fatal, serious and injury crashes (source: Nilsson, 2004, p90)

28
In urban areas a 1km/h increase in average speed can lead to a 10-15% increase in crash frequencies.
(Taylor, Lynam and Baruya, 2000)
Even small changes to the speed travelled by the driving population lead to large and measurable changes in risk.
If speed limits were to be reduced from 60km/h to 50km/h, Kloeden et al. estimated that there would be a reduction in casualty crashes of 21-28%. The overall message was that significant numbers of casualties can be saved through achieving even small reductions in travelled speed.
(Kloeden et al., 2002).
Over a period of 18 years, in US, a 5 mph increase in a State’s maximum speed limit was associated with an 8% increase in fatality rates on interstates and freeways and a 4% increase on other roads.
(Farmer, 2016)
A considerable amount of research has been undertaken to assess the effect of changes in speed limits. Meta-analyses show that lowering the limit by 10km/h leads to a decrease in speed of 3-4km/h. This has been confirmed by research carried out on changes in speed limits in the United States, Switzerland, Hungary and Norway.
(Le Breton, 2005; Hollo 1999; 2005; Cohen, Duval, Lassarre and Orfeuil, 1998, all as cited in OECD, 2006)
Some examples are:
o In Hungary the speed limit in force within built up areas was reduced from 60 to 50km/h in 1993 and resulted in a reduction of fatalities by 18.2% the following year.
(OECD, 2006)
o A reduced speed limit from 80 to 70km/h, without changing the road infrastructure, led to a decrease in speed of some 5% (3-4km/h).
(Ragnøy, 2004; as cited in OECD, 2006)
o In New South Wales in Australia, the speed limit on a 40km stretch of the Great Western Highway was lowered to 100km/h from 110km/h. Travel speeds were reduced following the speed limit change (by nearly 5km/h) and there was a reduction in the number of casualty crashes of 26.7%.
(Bhatnagar, Saffron, de Roos and Graham, 2010)
o In 1987, the speed limit on the Victorian rural and outer metropolitan Melbourne (Australia) freeways and highways was raised from 100km/h to 110km/h. Following this, there was an increase in casualty crashes per kilometre of 24.6%. When the speed limit was lowered back to 100km/h casualty crashes reduced by 19.3%.
(Sliogeris, 1992)

29
A study on posted speed limit changes in urban areas showed that:
o A decrease from 50 km/h to 40 km/h caused a significant 1.6 km/h reduction in the mean free-flow speed, which might lead to a 10% reduction of severe injury accidents
o An increase from 50 km/h to 60 km/h resulted in an increase of 2.6 km/h with possible negative effects on safety.
(Silvano and Bang, 2016)
A follow up investigation of the effect of the speed limit reductions on the road segments where the speed limit was reduced from 110 km/h to 100 km/h, in South Australia, found that the number of casualty crashes on the subject roads since the speed limit was lowered was found to be 27.4% lower than would have been expected if the subject roads had simply matched the reductions on the control roads,
statistically significant with 95% confidence limits of ±12.4%.
(Mackenzie, Kloeden and Hutchinson, 2015)
A study investigating the safety effects of reducing the speed limit from 90 km/h to 70 km/h on a considerable number of highways, and taking trend into account, showed a 5% decrease [0.88; 1.03] in the crash rates after the speed limit restriction. A greater effect was identified in the case of crashes involving serious injuries and fatalities, which showed a decrease of 33% [0.57; 0.79].
(De Pauw, Daniels, Thierie and Brijs, 2014)
A survey evaluating the new speed limits in Sweden indicated that:
o The mean car speed increased by 3.5 km/h when the speed limit increased by 10 km/h on motorways and 2 + 1 roads
o Reducing the speed limit by 10 km/h on 2 + 1 roads and rural roads with a speed limit of 110 km/h resulted in a 2 km/h decrease in mean speed
o On rural roads where the speed limit was lowered from 90 to 80 km/h, the mean speed decreased by 3.3 km/h
(Vadeby and Forsman, 2014)
A study in Pennsylvania found that mean and 85th-percentile operating speeds increased after increasing the posted speed limit from 65 to 70 mph; however, the increases were less than 5 mph.
(Donnell, Hamadeh, Li and Wood, 2016)
Although reducing the speed limit does have a considerable safety benefit due to reduction in average speed, in places where speed limits have been changed and no other action has been taken, the change in average speed is only about one quarter of the change of the speed limit.
(DETR, 2000, as cited in OECD, 2006)

30
When examining the impacts of increasing speed limit on speed distribution, a study found that:
o Mean and 85th percentile speeds increased after raising the speed limit, but by less than the 5 mph increase in the speed limit
o The 85th percentile speed increased from 74.7 in the before period to 77.0 mph in the after period
o The results indicate that the 75 mph speed limit is a better representation of the 85th percentile speed than the 70 mph speed limit. The results also indicate that, when the speed limit on a high-speed road is increased, there may not a similar magnitude of increase in the 85th percentile speed.
(Alemazkoor and Hawkins, 2014)
In a residential environment, when speed was reduced from 50 to 40 km/h, a study found statistically significant reduction in mean free-flow speed and speed variances for all combinations of time-of-day and day-of-week classifications and a significantly high compliance to a 15 km/h threshold above the posted speed limit.
(Islam, El-Basyouny and Ibrahim, 2014)
In another study on speed limit reduction from 50 to 40 km/h in urban areas, the authors concluded that, although the treatment was effective with respect to speed references of 40 km/h and 50 km/h, its effectiveness was not significant with respect to excessive speeding-which carries a great risk to pedestrians and cyclists in urban areas. Therefore, caution must be taken in drawing conclusions about the effectiveness of speed limit reduction.
(Heydari, Miranda-Moreno and Liping, 2014)
To maximize the impact, any changes in speed limits should be accompanied by appropriate enforcement, engineering and educational measures.
(OECD, 2006; DfT, 2013)
New speed limits need to be carefully chosen. A study on the safety impact of setting posted speed limits lower than engineering recommended values, found a statistically significant reduction in total and fatal and injury crashes at sites with engineering speed limits set 5 mph lower than engineering recommendations. At locations with posted speed limits set 10 mph lower than engineering recommendations, there was a decrease in total crash frequency, but an increase in fatal and injury crash frequency.
(Donnel et al., 2016)
Moreover, recent studies suggest that increasing speed limits can result in safety benefits in some cases. A case study from Israel, examining the effects of increasing freeway speed limits on crashes reached results that contradicts prior knowledge about the effect of raising the speed limit, suggesting that increasing the speed limits by 10 or 20 km/h triggered an increase in safety of 18% by one method and 21% by another method.
(Harari, Musicant, Bar-Gera and Schechtman, 2017)

31
What is the best method for informing road users about speed limits?
National speed limits are communicated to drivers through driver training and licensing, through a highway code and then these are reinforced through signs on the road.
Signs are the primary way of communicating the speed limit of a road to drivers, especially where this changes from one location to the next.
Principles for signing speed limits are uniformity, consistency, simplicity, relevance and legibility.
Clear signing where a speed limit changes, together with repeater signs placed at appropriate intervals and after major junctions to remind drivers, are important means of controlling traffic speeds.
(OECD, 2006)
In the UK, without clear signing in accordance with the Traffic Signs Regulations and General Directions it is not possible to enforce speed limits. Chapter 3 of the Traffic Signs Manual (DfT, 2008) expands the contents of these Regulations and relates to regulatory signs including speed limit signing.
(DfT, 2008)
The size of signs should be determined by the type of road on which they are placed, with larger signs on higher speed roads. Signs on motorways are typically twice the size of those on local single carriageway roads.
Gateways are useful at transitions where there are large variations in speed limit.
In addition to post-mounted speed limit signs next to the road, markings on the road can also be used to show the current speed limit.
(OECD, 2006)
In the UK, these markings, including their dimensions, are specified in Chapter 5 of the Traffic Signs Manual.
(DfT, 2003)
Figure 3: Gateways at a speed limit transition

32
Simple signing and marking measures at gateways may reduce mean speeds by about 1-2mph (2 km/h to 3 km/h) in excess of a speed limit sign alone, whilst more comprehensive gateway measures with high visual impact (e.g. coloured road surfacing and dragons teeth) may reduce mean speeds by 5-7mph.
(Wheeler and Taylor, 1999, as cited in DfT, 2007)
When physical measures have been used at gateways (e.g. narrowings using build-outs), even greater reductions in mean speeds have been found of up to 10mph, from 49mph to 39mph. In general, combinations of measures were found to be most effective.
One scheme in Wiltshire included stone gateways, build-outs with planting to create new parking bays, removal of the centre white line, enhancements of the main junction, buff surfacing near bus stops, a new bus bay and height reduction of lighting columns to benefit a minor road. This led to mean traffic speed reductions at the gateways of 4-8 mph. Mean speeds through the village reduced by 7-8 mph and 85th percentile speeds reduced by 8-10 mph.
This research noted that measures need to be continued beyond the gateway in order to maintain speed reductions through the village itself.
(Kennedy et al., 2005)
Figure 4 and Figure 5 show examples of gateways.
Figure 4: Gateway with speed limit change, dragons teeth marking, yellow backing boards for speed limit sign and speed roundels enhanced by coloured surfacing
Figure 5: Transition with coloured road surface
Evaluating the impact of school zone sign density on reducing driver speed and increasing driver compliance in school zones, an US study found out that:
o There is no evidence of a negative impact of sign saturation. School zone signs should be placed as needed

33
o Road type (number of lanes) has an impact on driver compliance in a school zone. A school zone located on a 4-lane road is more effective than a school zone located on a 2-lane road
o There is evidence to suggest that drivers are more compliant to school zone signage in an urban setting. Place school zone signs in urban settings as needed.
(Strawderman and Zhang, 2013)
What can be done if speed limit compliance is poor?
If speed compliance is poor, there are several options available to improve it:
o Clarify speed limit signing and introduce additional measures such as gateway treatments where there is a large variation in speed limits between two sections.
o Introduce engineering measures that have a psychological impact on driver speed choice.
o Physical engineering treatments that reduce vehicle speeds.
o Enhance enforcement.
o Ensure that the road features are safe at travelled vehicle speeds.
o Educate the public on the importance of reducing their speed.
It is possible to introduce engineering measures designed to have an impact on vehicle speeds. These include treatments that cause drivers to reduce their speeds due to:
o Physically restricting the speed at which it is possible or comfortable to drive along a road
o Psychological impacts upon speed choice.
Traffic calming should be applied in urban, low speed environments only. Use of traffic calming measures is covered by Local Transport Note 1/07.
Whilst many traffic calming measures have a positive impact on safety due to reduced speeds, environmental and social impacts should be assessed along with potential safety impacts for some road users:
o Buses – journey times can increase and there are concerns over passenger comfort and safety (especially where humps or cushions are placed near bus stops).
o Emergency services – physical speed reducing measures can adversely impact upon response times and may impact on patient care en-route to hospital.
o Cyclists and motorcyclists – some traffic calming measures can be difficult for these users to negotiate safely.

34
o Equestrians – particularly in relation to pinch points.
o Disabled or older occupants of vehicles – particularly those with back problems report discomfort.
In addition residents living in proximity to some measures report increased noise and vibration.
(DfT, 2007)
Measures that physically restrict the speed at which it is possible or comfortable to travel along a road include:
o Road humps (round-top and flat-top, sinusoidal profile, ‘H’, ‘S’, Thermoplastic humps or thumps, speed cushions, mechanical hump) are estimated to reduce vehicle speeds by up to 16mph depending on the original mean speed of traffic and the spacings used. Accident reductions achieved through the introduction of humps are:
71% reduction in accidents at 34 sites with the introduction of road humps.
(Webster, 1993, as cited in DfT, 2007)
60% reduction in accidents with the introduction of road humps in 20mph zones.
(Webster and Mackie, 1996, as cited in DfT, 2007)
89% reduction in accidents for an average speed reduction of 13mph upon the introduction of road humps.
(Hampshire County Council, 1996, as cited in DfT, 2007)
86% reduction in accidents upon introduction of speed cushions.
(CSS et al., 1994; Northamptonshire County Council, 1998, as cited in DfT, 2007)
97% reduction in accidents at sites where ‘thumps’ (thermoplastic humps) were introduced.
(Webster, 1994, as cited in DfT, 2007)
o Narrowings and chicanes can reduce vehicle speeds and reduce accidents:
Overall by around 7mph (though individual schemes achieved between 1 and 19mph).
(Hass-Klau and Nold, 1994, as cited in DfT, 2007)
Road space reallocation achieved a reduction in mean speed of 7-8mph
(Kennedy et al., 2005, as cited in DfT, 2007)
Traffic islands and pedestrian refuges provide modest speed reductions of 1-5mph.

35
(Thompson et al., 1990; Cloke et al., 1999; Boulter, 2000, as cited in DfT, 2007)
Chicanes reduce vehicle speeds to 20mph where the deflection angle is greater than 15 degrees and to 25mph where the deflection angle is greater than 10 degrees. A 54% reduction in injury accident frequency was observed.
(Sayer et al., 1998, as cited in DfT, 2007)
Various remedial treatments have been found to be effective in lowering speed choice through psychological mechanisms:
o 2-7mph reduction in speeds from vehicle activated signs (from 34.5mph to 30mph).
(Winnett and Wheeler, 2003, as cited in DfT, 2007)
o 6-7% reduction in speed where advance curve warning markings (SLOW) accompanied by a bend warning sign and transverse markings were used.
(McGee and Hanscom, 2006)
o 3mph reduction in speed (measured at the apex of a bend) where transverse rumble strips were used on the approach.
(Barker, 1997)
o Optical bars
0-5mph reduction in speed
(McGee and Hanscom, 2006)
57% reduction in speed related crashes as a result of transverse yellow bar markings being introduced on the approach to roundabouts
(Helliar-Symons, 1981)
o 12mph reduction in vehicle speeds, from 70mph, where converging chevron bars on an exit ramp of a motorway were introduced.
(Drakopoulos and Vergou, 2003)
o Gateways
1-2mph further reduction in speed for basic gateway treatment when compared to just the introduction of a speed limit sign
5-7mph reduction with high visual impact measures (e.g. dragons teeth/coloured road surfacing).
Up to a 10mph reduction where physical measures are used (e.g. narrowings etc.).
(Wheeler and Taylor, 1999, as cited in DfT, 2007)

36
Arguably the best way to improve compliance with speed limits is through introduction of an effective deterrent via enforcement activity.
It is generally accepted that traffic law enforcement influences driving behaviour through three processes:
o Generalized deterrence: The impact of the threat of legal punishment on the public at large.
o Specific deterrence: The impact of actual legal punishment on those who are apprehended.
o Localized deterrence: The impact at a particular location which may be a high risk area.
Localised deterrence can be achieved through the active enforcement of speed limits at a particular location, using fixed or mobile safety camera devices.
Safety cameras have a clear and positive impact on vehicle speeds and safety:
o The RAC has undertaken a comprehensive review of the effectiveness of safety cameras finding that deployment of speed cameras leads to appreciable reductions in speed in the vicinity of cameras and substantial reductions in crashes and casualties at those locations in addition to that which is attributable to regression-to-the-mean. Allsop estimates that, in the year ending 2004, safety camera operations at more than 4,000 sites across Great Britain prevented 3,600 personal injury collisions and saved around 1,000 people from being killed or seriously injured.
(Allsop, 2010)
o In a later comprehensive review of the effectiveness of average speed cameras, undertaken by RAC and RSA, the findings suggest a 36% reduction in the mean rate of fatal and serious crashes, after accounting for trend, RTM and site selection periods. The average speed cameras seem to be even more effective for low-speed sites, with 42% reductions compared to 32% for high speed sites. All the reductions are highly statistically significant. For less severe crashes the reductions are lower but still significant, 16% for the total sample, 25% for low speed sites and 8% for high-speed sites. The results show that ASC systems are effective in reducing collisions, especially those of a high severity. Even after allowing for the effects of trend and regression to the mean, highly significant reductions are noted.
(Owen, Ursachi and Allsop, 2016)

37
o Accounting for both confounding factors and the selection of proper reference groups, an extensive analysis of 771 camera sites and 4,748 sites for treatment, study results suggest that there are significant reductions in the number of accidents of all severities at speed camera sites. Speed cameras were found to be most effective in reducing accidents up to 200 meters from camera sites and no evidence of accident migration was found.
(Li, Graham and Majumdar, 2013)
o On road sections between 100 m upstream and 1 km downstream of the speed cameras a statistically significant reduction of the number of injury crashes by 22% was found. Larger effects were found for KSI than for injury crashes and the effects decrease with increasing distance from the speed cameras.
(Hoye, 2015)
o 20% reduction in injury crashes in Norway upon introduction of safety cameras on rural roads.
(Elvik, 1997)
o 21% reduction in injury accidents and serious casualties achieved through a targeted speed enforcement programme in the Friesland province in the Netherlands.
(Goldenbeld and van Schagen, 2005)
o In Australia where fixed speed cameras were introduced at high risk sites, crashes fell by almost 20%; casualty crashes fell by 23% injury crashes by 20% and fatal crashes by nearly 90%.
(ARRB, 2005)
o 33% reductions in injury crashes for rural safety camera installations.
(Gains, Heydecker, Shrewsbury and Robertson, 2004)
o Hidden safety cameras on a motorway in New Zealand yielded a further 11% reduction in ‘open road’ crashes and 19% reduction in casualty rate when compared to visible cameras.
(Keall, Povey and Frith, 2001)
o Average speed cameras were installed on the A14 between Huntington and Cambridge in 2007. Analysis of the accident rates after installation has shown that a reduction of accidents of 20% can be attributed to the implementation of these cameras. (DfT, 2011)
o In France, between 2002 and 2006, the introduction of a fully automated speed camera programme to enforce the speed management system saw a drop in deaths among young people by 40%.

38
(Atchinson, 2016)
o 10km/h speed reduction on an Australian motorway with the introduction of average speed cameras.
(Stefan and Winkelbauer, 2006)
o Reduction of violations to below 1% on a Dutch stretch of freeway with the introduction of average speed cameras.
(RWS, 2003)
o A Cochrane review found that “the consistency of reported reductions in speed and crash outcomes across all studies show that speed cameras are a worthwhile intervention for reducing the number of road traffic injuries and deaths.”
(Wilson et al., 2010)
Intelligent speed assistance (ISA) can help improve drivers’ compliance with speed limits by alerting them when they are travelling above the posted speed limits.
(WHO, 2017)
Intelligent Speed Assistance (ISA) is the term given to a range of devices that assist drivers in choosing appropriate speeds and complying with speed limits. Intelligent Speed Assistance technologies bring speed limit information into the vehicle. Drivers receive the same information that they see (or sometimes miss seeing) on traffic signs through an on-board communication system, helping them to keep track of the legal speed limit all along their journey. Information regarding the speed limit for a given location is usually identified from an on-board digital map in the vehicle. Other systems use speed sign reading and recognition. The information is then communicated to the driver in any of the following three ways:
o informing the driver of the limit (advisory ISA),
o warning them when they are driving faster than the limit (warning ISA) or
o actively aiding the driver to abide by the limit (assisting ISA).
All ISA systems that are currently being used in trials or deployment can be overridden if wished by the driver.
(ETSC, 2013)
ETSC recommends in their position paper that all European countries should adopt legislation for fitting all new vehicles with an overridable Intelligent Speed Assistance system.
(ETSC, 2016)

39
How do road users react to variable (mandatory) speed limits?
Variable mandatory speed limit signs are mostly used on motorways.
The greatest benefit of variable mandatory speed limits is that the speed differential (variance in speed) between different vehicles and different lanes can be reduced, allowing the smoothing of traffic flow, reduced congestion, and reduced accident risk.
The earliest experiments with variable mandatory speed limits took place in 1960s in Germany between Munich and Salzburg, Austria. The signed speed limits could be manually changed between 60, 80 and 100km/h according to conditions. Since then, technology has allowed the remote control of speed limit signing, for instance on overhead gantries.
Mandatory variable speed limits have been used in a number of locations in the UK as part of the ‘controlled motorways’ initiative. The first use in UK was on part of the M25 (London orbital) motorway in 1995 (see Error! Reference source not found.).
The scheme achieved savings in journey times, smoother journeys and a reduction in crashes; the Department for Transport (DfT) reports that a drop in injury crashes of 15% was observed, along with a drop in the ratio of damage only to injury crashes.
(DfT, 2010)
Similar variable speed limit schemes have been evaluated with the following results:
o In St Louis, US: 4.5-8% crash reduction.
(Bham et al., 2010)
o In France on the A7 road:
o 48% reduction in crashes.
(Serti, 2006, as cited in Traffix Group, 2009)
o 77% reduction in serious crashes.
(ASF, 2007, as cited in as cited in Traffix Group, 2009)
o In Germany (autobahns): 20-30% reduction in crashes.
(Robinson, 2000, as cited in Traffix Group, 2009)
o In Finland: 13% reduction in risk of injury.
(Rama and Schirokoff, 2004, as cited in Traffix Group, 2009)
o In Netherlands: 35% reduction in serious crashes.
(FHA, 2003, as cited in Traffix Group, 2009)
o In Netherlands: 35% reduction in serious crashes.
(FHA, 2003, as cited in Traffix Group, 2009)

40
Optimised variable speed limits systems can effectively achieve smooth flow and reduce the environmental impact of freeway traffic.
(Liu et al., 2015)
Harmonization with variable speed limits on motorways has increased the average speed during rush hours with 2.5 kph and the accidents have been reduced by half.
(Stromgren and Lind, 2016)
At a point location, an advisory variable speed limit system was found to generally reduce mean speed and speed variability within the same lane and between the median and shoulder lanes.
(Siddiqui and Al-Kaisy, 2017)
The use of Variable Advisory Speed Limits (VASL):
o Is recommended for uncongested work zones to achieve better speed compliance and lower speeds
o To complement the static speed limits in rural work zones is beneficial even if the VASL is only used to display the static speed limits. It leads to safer traffic conditions by encouraging traffic to slow down gradually and by reminding traffic of the reduced speed limit.
(Edara, Sun and Hou, 2013)
An optimal Variable Speed Limits control successfully decreased the collision risks by 22.62% and reduced the severity of crashes by 14.67%.
(Li et al., 2016)
A Variable Speed Limit approach outperforms an uncontrol scenario, resulting in up to 20% of total time travel reductions, 6 – 11% safety improvements and 5 – 16% reduction in fuel consumption.
(Khondaker and Kattan, 2015)
Different Variable Speed Limit values can effectively decrease the mean speed, the speed difference, and the percentage of small space headways when compared to No Variable Speed Limit control conditions.
(Xu et al., 2017)
Variable speed limit strategies effectively reduce the risks of secondary collisions in various weather types.
(Li et al., 2014)
On the other hand, enforcement of the speed limits plays a very important role. On freeways, drivers’ compliance with dynamic speed limits is very limited, unless speed enforcement devices are present.
(Soriguera, Martinez-Josemaria and Menendez, 2015)

41
How do road users react to vehicle activated signs?
Ideally speed limits should be used only for significant lengths of road (sections no shorter than 600 metres) in order to avoid overloading drivers. Where a specific hazard exists (e.g. a curve or a junction), an advisory speed sign can be used.
Vehicle Activated Signs (VAS) (see Figure 6) are signs that automatically light up when a vehicle approaches the sign or when an approaching driver exceeds a pre-set speed threshold. These often repeat a fixed warning and can display a message such as ‘Slow Down’ or may present other negative feedback such as a negative emoticon (e.g. an unhappy face).
In the UK the effect of VAS that display a curve/bend warning sign when a vehicle is travelling above a certain threshold speed (set at the 50th percentile speed) was investigated at three rural curves. A reduction in mean speed of between 2 and 7mph (3 to 11 km/h) after one month was observed.
(Winnett and Wheeler, 2003, as cited in DfT, 2007)
Figure 6: Vehicle activated curve/bend warning sign (driving on the left)
Signs that display to drivers their speeds (Dynamic Speed Monitoring Displays (DSMD), Dynamic Speed Display Signs (DSDS) and Speed Indicator Devices (SIDs)) can have a positive impact on driver speeds, though the long-term impact remains an issue of contention:
o A 1.4mph speed reduction was observed at sites where SIDs were operational in the Royal Borough of Kingston-Upon-Thames. The speed reduction observed varied from 0.6mph to 2.6mph. The proportions of drivers exceeding 30 and 36mph were significantly reduced at 10 out of the 11 sites. There was evidence of a novelty effect, with SIDs being most effective in the first week of operation.
(Walter and Knowles, 2008)

42
o 6-8mph reduction in vehicle speeds was found when DSMD were used at transitions to an urban area; this effect was still present after one year.
(Sandberg et al., 2006)
o DSDS effectiveness decreases with time and are only effective over a short distance.
(Ardeshiri and Jeihani, 2013)
o The impact of different types of DSDS have been compared (numeric, numeric coloured and verbal – slow, slow down or thank you). All DSDS led to a reduction in vehicle speeds: average speeds reduced by between 0.7 and 3.1km/h, typically from 31mph, and 85th percentile speeds by 1-3km/h, typically from 37mph. Verbal coloured signs were the most effective. The impact reduced as time elapsed.
(Gehlert, Schultze and Schalg, 2012)

43
How effective?
Meta-analyses show that lowering the speed limit by 10 km/h leads to a decrease in speed of 3-4km/h (OECD, 2006).
Physical measures that restrict the speed at which a road can be travelled (or comfortably travelled) can be highly effective in reducing vehicle speeds and accidents:
o The introduction of road humps can result in large accident reductions:
71% reduction in accidents at 34 sites with the introduction of road humps.
(Webster, 1993, as cited in DfT, 2007)
60% reduction in accidents with the introduction of road humps in 20mph zones.
(Webster and Mackie, 1996, as cited in DfT, 2007)
89% reduction in accidents for an average speed reduction of 13 mph upon the introduction of road humps.
(Hampshire County Council, 1996, as cited in DfT, 2007)
86% reduction in accidents upon introduction of speed cushions.
(CSS et al., 1994; Northamptonshire County Council, 1998, as cited in DfT, 2007)
97% reduction in accidents at sites where ‘thumps’ (thermoplastic humps) were introduced.
(Webster, 1994, as cited in DfT, 2007)
o Narrowings and chicanes can reduce vehicle speeds and reduce accidents:
Overall by around 7mph (though individual schemes achieved between 1 and 19mph).
(Hass-Klau and Nold, 1994, as cited in DfT, 2007)
Road space reallocation achieved a reduction in mean speed of 7-8mph
(Kennedy et al., 2005, as cited in DfT, 2007)
Traffic islands and pedestrian refuges provide modest speed reductions of 1-5mph though extra care should be taken to ensure risk for pedal cyclists is not increased through their implementation.
(Thompson et al., 1990; Cloke et al., 1999; Boulter, 2000, all as cited in DfT, 2007)
Chicanes reduce vehicle speeds to 20mph where the deflection angle is greater than 15 degrees and to 25mph where the deflection angle is greater than 10 degrees. A 54% reduction in injury accident frequency was observed.
(Sayer et al., 1998, as cited in DfT, 2007)

44
Various remedial treatments have been found to be effective in lowering speed choice through psychological mechanisms:
o 2-7mph reduction in speeds from vehicle activated signs.
(Winnett and Wheeler, 2003, as cited in DfT, 2007)
o 6-7% reduction in speed where advance curve warning markings (SLOW) accompanied by a bend warning curve and transverse markings were used.
(McGee and Hanscom, 2006)
o 3mph reduction in speed (measured at the apex of a bend) where transverse rumble strips were used on the approach.
(Barker, 1997)
o Optical bars/ transverse markings
0-5mph reduction in speed. (McGee and Hanscom, 2006)
57% reduction in speed related crashes as a result of transverse yellow bar markings being introduced on the approach to roundabouts.
(Helliar-Symons, 1981)
o 12mph reduction in vehicle speeds where converging chevron bars on an exit ramp of a motorway were introduced.
(Drakopoulos and Vergou, 2003)
o Gateways
1-2mph further reduction in speed for basic gateway treatment when compared with just the introduction of a speed limit sign.
5-7mph reduction with high visual impact measures (e.g. dragons teeth/coloured road surfacing).
Up to a 10mph reduction where physical measures are used (e.g. narrowings etc.).
(Wheeler and Taylor, 1999, as cited in DfT, 2007)
Safety cameras have a clear and positive impact on vehicle speeds and safety (see also the ‘Safety Cameras Synthesis):
o The RAC has undertaken a comprehensive review of the effectiveness of safety cameras finding that deployment of speed cameras leads to appreciable reductions in speed in the vicinity of cameras and substantial reductions in crashes and casualties at those locations in addition to that which is attributable to regression-to-the-mean. It is estimated that, in the year ending 2004, safety camera operations at more than 4,000 sites across Great Britain prevented 3,600 personal injury collisions and saved around 1,000 people from being killed or seriously injured.
(Allsop, 2010)

45
o 20% reduction in injury crashes in Norway upon introduction of safety cameras on rural roads.
(Elvik, 1997) o In Australia where fixed speed cameras were introduced at high
risk sites, crashes fell by almost 20%; casualty crashes fell by 23%, injury crashes by 20%, and fatal crashes by nearly 90%.
(ARRB, 2005)
o 33% reduction in injury crashes for rural safety camera installations.
(Gains, Heydecker, Shrewsbury and Robertson, 2004, as cited in OECD, 2006)
o Hidden safety cameras on a motorway in New Zealand yielded a further 11% reduction in ‘open road’ crashes and 19% reduction in casualty rate when compared with visible cameras.
(Keall, Povey and Frith, 2001)
o Average speed cameras were installed on the A14 between Huntington and Cambridge in 2007. Analysis of the accident rates after installation has shown that a reduction of accidents of 20% can be attributed to the implementation of these cameras.
(DfT, 2011) o 10km/h speed reduction on an Australian motorway with the
introduction of average speed cameras. (Stefan and Winkelbauer, 2006)
o Reduction of violations to below 1% on a Dutch stretch of freeway with the introduction of average speed cameras.
(RWS, 2003)
Variable (mandatory) speed limits reduce vehicle speeds and can improve safety:
o The introduction of variable mandatory speed limits on M25 in 1996 achieved a 15% drop in injury crashes.
(DfT, 2010) o In St Louis, US: 4.5-8% crash reduction.
(Bham et al., 2010) o In France on the A7 road:
o 48% reduction in crashes. (Serti, 2006, as cited in Traffix Group, 2009)
o 77% reduction in serious crashes. (ASF, 2007, as cited in as cited in Traffix Group, 2009)
o In Germany (autobahns): 20-30% reduction in crashes. (Robinson, 2000, as cited in Traffix Group, 2009)
o In Finland: 13% reduction in risk of injury. (Rama and Schirokoff, 2004, as cited in Traffix Group, 2009)
o In Netherlands: 35% reduction in serious crashes. (FHA, 2003, as cited in Traffix Group, 2009)

46
Signs that are activated by vehicles according to their speed (Vehicle Activated Signs (VAS)) and signs that display to drivers their speeds (Dynamic Speed Monitoring Displays (DSMD), Dynamic Speed Display Signs (DSDS) and Speed Indicator Devices (SIDs)) all have a positive impact on vehicle speeds (reduction in mean speeds of between 2 and 7 mph).
o In the UK the effect of VAS that display a curve/bend warning sign when a vehicle is travelling above a certain threshold speed (set at the 50th percentile speed) was investigated at three rural curves. A reduction in mean speed of between 2 and 7mph (3 to 11 km/h) after one month was observed.
(Winnett and Wheeler, 2003, as cited in DfT, 2007)
o A 1.4mph speed reduction was observed at sites where SIDs were operational in the Royal Borough of Kingston-Upon-Thames. The speed reduction observed varied from 0.6 mph to 2.6 mph. The proportions of drivers exceeding 30 and 36 mph were significantly reduced at 10 out of the 11 sites. There was evidence of a novelty effect, with SIDs being most effective in the first week of operation.
(Walter and Knowles, 2008)
o 6-8mph reduction in vehicle speeds was found when DSMD were used at transitions to an urban area; this effect was still present after one year.
(Sandberg, Schoenecker, Sebastian and Soler, 2006)
o DSDS effectiveness decreases with time and are only effective over a short distance.
(Ardeshiri and Jeihani, 2013)
o The impact of different types of DSDS have been compared (numeric, numeric coloured and text based signs that say ‘slow’, ‘slow down’ or ‘thank you’). All DSDS led to a reduction in vehicle speeds: average speeds reduced by between 0.7 and 3.1km/h, typically from 31mph, and 85th percentile speeds by 1-3km/h, typically from 37mph. Verbal coloured signs were the most effective. The impact reduced as time elapsed.
(Gehlert, Schultze and Schalg, 2012)
Road geometry can have a significant impact on vehicle speeds, particularly:
o Parking was found to reduce speeds on links and at junctions by 2-5mph.
o The largest effect on speeds was found to be associated with reducing lines of sight. A reduction from 120 to 20m reduced approach speeds by approximately 20mph on links and 11mph at junctions.
(York et al., 2007)

47
o An interruption to a journey, caused by stopping at a red traffic light, can result in failure to resume the speed of travel prior to the interruption. The addition of a reminder cue could offset this interruption.
(Gregory et al., 2014)
o The more restricted drivers become the more likely they are to comply with speed limits; potential restrictions include street parking, bike lanes, pedestrian crossing, or the absence of shoulder lanes.
(Gargoum and El-Bayouny, 2015)

48
References
Title: The effectiveness of speed cameras – a review of evidence
Published: Allsop, R.
RAC Foundation
Link:
Free/priced:
http://www.racfoundation.org/assets/rac_foundation/content/downloadables/efficacy_of_speed_cameras_allsop_181110.pdf
Free
Objectives: To assess the effectiveness of speed cameras based on existing evidence.
Methodology: This report pulls together a range of analyses of the effectiveness of speed cameras, and some more recent data, to provide a considered and comprehensive assessment of their contribution to road safety.
Key Findings: Deployment of speed cameras leads to appreciable reductions in speed in the vicinity of the cameras, and substantial reductions in RTIs and casualties at those locations over and above that which is attributable to regression-to-mean effects.
Percentage reductions in RTIs and casualties differ between fixed and mobile, and between urban and rural camera sites. Judging from the evidence, the operation of cameras at over 4,000 sites of all types resulted in around 1,000 fewer people being killed or seriously injured in the vicinity of cameras in the year ending March 2004.
National surveys indicate clear and sustained falls in the average speeds of cars on 30 mph roads, and in the proportion of cars exceeding the limit
The evidence from a study in West London is that speed cameras led to a reduction in casualties not only at camera sites, but across the wider road network also.
Majority public acceptance of cameras was widespread at the height of the national camera safety programme. Subsequent annual surveys by the AA indicate that it has remained so.
Increases in speeds and speeding at various sites where cameras were visibly out of action have been recorded over the years since 2004.
Data for 2007–2009 supplied by a number of road safety partnerships, while not covering the whole country, suggest that big falls in fatal or serious casualties at camera sites have persisted over time.

49
National decommissioning of cameras could result in about 800 extra people across Great Britain being killed or seriously injured each year.
Data for 2006–07 show that the cost of camera enforcement was being covered by penalties paid by detected offenders, with only a modest surplus to the Exchequer of less than £4 out of each £60 penalty paid
Keywords: Safety camera, Speed limits, safety camera effectiveness, casualty reduction.
Comments:
Title: Dynamic Speed Display Sign Impact on Speed Limit Compliance on Multiple Roadway Classes.
Published: Ardeshiri, A. and Jeihani, M. (2013)
Paper submitted for 92nd Annual Meeting of Transportation Research Board.
TRB Washington.
Link:
Free/priced:
http://assets.conferencespot.org/fileserver/file/46200/filename/2vekjv.pdf
Free
Objectives: Evaluate the impact of dynamic speed display signs (DSDSs) on driver behaviour.
Methodology: Survey data were collected upstream and downstream from DSDS devices installed on different road types. The data were collected at different distances from the devices and also over different time periods.
This was also supplemented with a driver attitude questionnaire.
Conventional statistical analysis, regression model, and Bayesian network were applied to assess the DSDS’s effectiveness with reducing speed and to develop a speed compliance model.
Key Findings: Nearly 70% of respondents said they would reduce their speed to the speed limit as a result of DSDS on a 25mph road.
The impact of DSDS was greatest for short distances and in the short term and is recommended as a short term temporary measure.
Keywords: Speed, advisory speed limit, vehicle activated signs.
Comments:

50
Title: Evaluation of the Fixed Digital Speed Camera Program in NSW
Published: ARRB Group (2005).
RC2416.
New South Wales: Roads & Traffic Authority, NSW.
Link:
Free/priced:
http://www.rms.nsw.gov.au/roadsafety/downloads/2005_05_speedcamera_evaluation.pdf
Free
Objectives: Evaluation of introduction of introduction of fixed speed cameras in New South Wales (Australia).
Methodology: A sample of 28 sites was evaluated. Effectiveness of speed cameras was measured in terms of:
Changes in driver speed behaviour (85th percentile and mean speeds) at the upstream (before the camera) and downstream sections
Changes in incidence and severity of crashes at locations
Economic value of the cameras to the community
Community attitudes, beliefs and reported behaviours
Key Findings: Significant reductions in vehicle speeds, speeding rates and crashes were achieved upon introduction of fixed speed cameras.
At the camera sites mean speeds fell by approximately 6 km/h at 12 and 24 months after introduction.
The numbers of vehicles exceeding the speed limit by 10, 20 and 30 km/h were reduced. Reductions achieved were in the order of 70% to almost 90%.
For all locations included in the study combined, there was a 7.6% reduction in all reported crashes, a 7.8% reduction in casualty crashes and a 57.6% reduction in fatal crashes.
The net present value over a project horizon of 18 years was calculated to be $109.1 million and $113.4 million for all road sections and the camera sections respectively. A benefit cost ratio was calculated to be 3.4 over a project life of 6 years.
The community had a positive attitude to the initiative.
Keywords: Speed cameras, fixed speed cameras, speed.
Comments:

51
Title: Trials of rural road safety engineering measures
Published: Barker, J. (1997).
TRL Report 202.
Crowthorne: Transport Research Laboratory.
Link:
Free/priced:
https://trl.co.uk/reports/TRL202
Free
Objectives: A research study to set up and trial rural road safety engineering measures.
Methodology: Several engineering measures were investigated. Monitoring and evaluation were undertaken for all trials before and after scheme installation. The type of evaluation depended on the scheme; however, the majority focused on changes in vehicle speeds and injury accident frequencies.
Key Findings: All measures investigated led to a reduction of mean vehicle speeds (up to 6 mph) and accident frequency reduction (up to 60% reduction) with the exception of a 30 mph roundel markings. Successful treatments included:
Motorways: Chevrons and 3rd lane coach ban
Junctions: Yellow bar markings on motorway off-slips and bar markings on minor road approaches
Bends: Rumble areas, bar markings and channelization
Villages: Riblines, speed limit countdown signs, vehicle activated speed warning signs, traffic calming.
Keywords: Speed, traffic calming, rural engineering treatments.
Comments:

52
Title: Evaluation of variable speed limits on I-270/I255 in St Louis
Published: Bham, G.H., Long, S., Baik, H., Ryan, T., Gentry, L., Lall, K., Arezoumandi, M., Liu, D., Li, T. and Schaeffer, B. (2010).
RI08-025.
Missouri, USA: Missouri Department of Transportation.
Link:
Free/priced:
http://library.modot.mo.gov/RDT/reports../Ri08025/or11014rpt.pdf
Free
Objectives: Evaluate the installation of variable speed limits in Missouri. Investigate the impact on mobility and safety.
Methodology: The impact of the variable speed limits on safety was investigated based on crash numbers and rates (crashes over traffic volume). Two analysis techniques were used (naïve and empirical Bayesian.
Key Findings: The level of crash reduction varied slightly between the two statistical techniques. Both consistently indicated that the variable speed limits had a positive impact on crash reduction, ranging from 4.5-8% with a standard deviation of 3-4%.
Keywords: Variable speed limit, traffic congestion and delay, highway safety, active traffic management systems, driver behaviour, traffic control devices (TCD)
Comments:

53
Title: Changes to speed limits and crash outcome – Great Western Highway case study
Published: Bhatnagar, Y., Saffron, D., de Roos, M., and Graham, A. (2010).
2010 Australasian Road Safety Research, Policing and Education Conference, Canberra.
Link:
Free/priced:
http://casr.adelaide.edu.au/rsr/RSR2010/BhatnagarY.pdf
Free
Objectives: To study the relationship between changes in the posted speed limit and crash history for the Great Western Highway. The aim of the paper was to illustrate how recent research can be applied to assist decision-making about changes in speed limits to obtain safety benefits.
Methodology: The speed limit for the Great Western Highway was changed from 110 km/h to 100 km/h in February 2000. This study examined speed survey data from before the speed limit change to that after, and the number of casualties before and after the speed limit change.
Key Findings: A mean speed reduction of 5 km/h was observed along with a 26.7% reduction in casualty numbers following the reduction in the posted speed limit.
Keywords: Speed limit reduction, mean speed, crash history, casualty crashes, power model, road safety
Comments:
Title: Traffic Signs Manual, Chapter 5: Road Markings
Published: DfT (2003).
London: The Stationary Office.
Link:
Free/priced:
http://assets.dft.gov.uk/publications/traffic-signs-manual/traffic-signs-manual-chapter-05.pdf
Free (pdf) / £40 (hardcopy)
Objectives: The Traffic Signs Manual is intended to give advice to traffic authorities and their agents on the correct use of signs and road markings. Chapter 5 deals with road markings.
Methodology: N/A: Guidance document
Key Findings: N/A: Guidance document
Keywords: Signs, speed limit.
Comments:

54
Title: Traffic Calming
Published: DfT (2007).
Local Transport Note 01/2007.
Link:
Free/priced:
http://assets.dft.gov.uk/publications/local-transport-notes/ltn-1-07.pdf
Free (pdf) / £18.50 (hardcopy)
Objectives: The Local Transport Note 01/2007 provides guidance on traffic calming.
Methodology: N/A: Guidance document
Key Findings: N/A: Guidance document
Keywords: Speed, traffic calming.
Comments:
Title: Traffic Signs Manual, Chapter 3: Regulatory Signs
Published: DfT (2008).
London: The Stationary Office.
Link:
Free/priced:
https://www.gov.uk/government/uploads/system/uploads/attachment_data/file/223943/traffic-signs-manual-chapter-03.pdf
Free (pdf) / £40 (hardcopy)
Objectives: The Traffic Signs Manual is intended to give advice to traffic authorities and their agents on the correct use of signs and road markings. Chapter 3 deals with regulatory signs, which indicate requirements, restrictions and prohibitions.
Methodology: N/A: Guidance document
Key findings: N/A: Guidance document
Keywords: Signs, speed limit.
Comments:

55
Title: Understanding the benefits and costs of intelligent transport systems: A toolkit approach
Published: DfT (2010).
Link:
Free/priced:
http://www.dft.gov.uk/itstoolkit/Tools/T4.php
Free
Objectives: The toolkit provides case studies, advice and guidance in the area of monitoring, evaluation and reporting of ITS related schemes.
Methodology: N/A: Guidance document
Key Findings: Variable mandatory speed limits reduce speed differential and smooth traffic to reduce congestion. Upon introduction to a section of the M25 in 1995 a 15% drop in injury crashes was observed.
Keywords: Speed, variable speed limits.
Comments:
Title: A14 study output 1
Published: DfT (2011).
Link:
Free/priced:
https://www.gov.uk/government/uploads/system/uploads/attachment_data/file/2649/a14-study.pdf
Free
Objectives: Study to develop proposals to resolve the prioritised challenges on the Cambridge to Huntingdon section of the A14. Review of existing evidence to identify the key transport issues and wider challenges that should form the basis for subsequent option development and assessment.
Methodology: N/A: Guidance document
Key Findings: Average speed cameras were installed on the A14 between Huntington and Cambridge in 2007. Analysis of the accident rates after installation has shown that a reduction of accidents of 20% can be attributed to the implementation of these cameras.
Keywords: Speed, average speed cameras.
Comments:

56
Title: Setting local speed limits
Published: DfT (2013).
Department for Transport Circular 01/2013.
Link:
Free/priced:
https://www.gov.uk/government/uploads/system/uploads/attachment_data/file/63975/circular-01-2013.pdf
Free
Objectives: To provide ‘up-to-date’ guidance on setting speed limits.
Methodology: N/A: Guidance document
Key Findings: Speed limits should be evidence-led and self-explaining to encourage self-compliance. Roads need to be designed so that crash outcomes are not fatal or serious.
Keywords: Speed limits.
Comments:
Title: Evaluation of the Converging Chevron Pavement Marking Pattern at One Wisconsin Location
Published: Drakopoulos, A. and Vergou, G. (2003).
Washington DC: American Automobile Association Foundation for Traffic Safety.
Link:
Free/priced:
https://www.aaafoundation.org/sites/default/files/chevrons%20%281%29.pdf
Free
Objectives: Evaluation of an experimental converging chevron pattern on a motorway off-ramp.
Methodology: The experimental converging chevron road markings were installed on the off-ramp of a motorway in Wisconsin in 1999.
The number of crashes before and after installation was recorded for both the test and comparison ramps; however the number of crashes was too small for statistical analysis.
Four speed detectors were installed at the test ramp and speeds were measured before and after the test markings were installed.
Key Findings: 12 mph reduction in vehicle speeds following installation of the converging chevron markings.
Keywords: Speed reduction, road safety, engineering, road markings, converging chevrons.
Comments:

57
Title: The handbook of road safety measures (2nd Edition)
Published: Elvik, R., Hoye, A., Vaa., T. and Sorensen, M. (2009).
Bingley: Emerald Group Publishing.
Link:
Free/priced:
http://www.amazon.co.uk/Handbook-Measures-Advances-Accounting-Educati/dp/1848552505/ref=dp_ob_title_bk
£110.57
Objectives: A summary of the impact of different road safety measures.
Methodology: N/A: Guidance document
Key Findings: N/A: Guidance document
Keywords: Road safety measures, impact, casualty reduction, speed.
Comments:
Title: Speed Fact Sheet
Published: European Transport Safety Council (ETSC) (2008).
Link:
Free/priced:
http://www.etsc.eu/documents/Speed_Fact_Sheet_1.pdf
Free
Objectives: Fact sheet on the German Autobahn speed limit debate.
Methodology: N/A: Fact sheet
Key Findings: Evidence presented regarding the argument for and against the introduction of speed limits on the German Autobahn.
Keywords: Speed limit, autobahn, unrestricted.
Comments:

58
Title: Evaluation of different types of dynamic speed display signs
Published: Gehlert, T., Schultze, C. and Schalg, B. (2012).
Transportation Research Part F 15, 667-675
Link:
Free/priced:
http://ac.els-cdn.com/S136984781200071X/1-s2.0-S136984781200071X-main.pdf?_tid=c773b4ba-7474-11e3-be85-00000aacb361&acdnat=1388753246_bcf0d856219b1030f09cc9ba2726e0ff
Requires subscription to ScienceDirect
Objectives: Investigation of the effectiveness of three different types of Dynamic Speed Display Sign (DSDS).
Methodology: The three DSDS (standard numerical, numerical with different colours depending on compliance, verbal coloured) were installed at the same location one after the other. Speed was measured using a radar device continuously 1 month before installation, 2-3 months during operation and 1-6 months after removal.
Key Findings: All DSDS reduce average speed, 85th percentile speed and percentage of vehicles exceeding the speed limit. The verbal coloured message reduced speed by the most and exhibited no habituation effect.
Keywords: Speed, dynamic speed display signs, evaluation, semantic priming, field study.
Comments:
Title: Umweltauswirkungen von Geschwindigkeitsbeschraenkungen
Published: Gohlisch G. and Malow M. (1999).
Texte 40/99.
Link:
Free/priced:
http://www.umweltbundesamt.de/sites/default/files/medien/publikation/long/3136.pdf
Free
Objectives: Review of the evidence (largely from an environmental perspective) regarding environmental impact of speed.
Methodology: Review of evidence.
Key Findings: There was improved safety with the introduction of a 100 km/h speed limit on German Autobahns during the oil crisis (November 1973 – March 1974) which led to a 50% reduction in “Killed or Serious Injuries” (KSIs).
Keywords: Environmental impact, autobahns, speed, safety.

59
Title: The Effects of Speed Enforcement with Mobile Radar on Speed and Accidents: An Evaluation Study on Rural Roads in the Dutch Province Friesland.
Published: Goldenbeld, C. and I. van Schagen (2005).
Accident Analysis and Prevention, 37, (6), 1135-1144.
Link:
Free/priced:
http://www.sciencedirect.com/science/article/pii/S0001457505001089
$41.95
Objectives: This was an evaluation study to determine the effects of targeted speed enforcement on speed and road accidents and the evaluated speed enforcement project was conducted in the Friesland province, located in the northern part of the Netherlands.
Methodology: The evaluation study covered a five year period of intensified speed enforcement along 28 above-average dangerous road stretches of the rural network with mainly unobtrusive mobile radar equipment. The evaluation study covered a period of five years of enforcement.
Key Findings: Researchers found similar decreases in speeding at both the enforced roads and at the nearby comparison roads that were not subjected to the targeted speed enforcement project. The best estimate for the safety effect of the enforcement project is a reduction of 21% in both the number of injury accidents and the number of serious casualties.
Keywords: Speed, enforcement, camera.
Comments: The enforcement was unobtrusive rather than high-profile or overt. Reductions in speeds at the nearby control sites is attributed to ‘spillover effects’, although it could reflect a more general trend.
Title: Speed Management: A road safety manual for decision makers and practitioners
Published: GRSP (2008) Geneva: Global Road Safety Partnership.
Link:
Free/priced:
http://whqlibdoc.who.int/publications/2008/9782940395040_eng.pdf
Free
Objectives: To provide a manual for decision makers and practitioners so that they can develop best practice strategies for the management of speed.
Methodology: N/A: Guidance document
Key Findings: N/A: Guidance document
Keywords: Speed management, speed limits, speed enforcement, changing behaviour, engineering treatments.

60
Title: Yellow bar experimental carriageway markings - accident study
Published: Helliar-Symons, R.D. (1981). TRL Laboratory Report LR1010. Crowthorne: Transport Research Laboratory.
Link: Free/priced:
https://trl.co.uk/reports/LR1010 Free
Objectives: Evaluate the impact of yellow bar markings on the approach to roundabouts.
Methodology: Analysis of accidents at 42 roundabouts at which Yellow Bar experimental carriageway markings had been laid on an approach road.
Key Findings: 57% reduction in speed related accidents on the approach roads. Most effective for fatal and serious injury accident reduction. Most effective in the daylight and when the road surface was wet. Accident reduction was maintained for 4 years after installation.
Keywords: Carriageway marking, yellow, colour, accident prevention, roundabout, approach road, decrease, speed, accident, daylight, wet road.
Title: Road User Pilot: Testing the self-explaining nature of roads: the effects of combinations of road features in different European countries
Published: Houtenbos, M., Weller, G., Aarts, L., Laureshyn, A., Ardo, H., Svensson, A, Dietze, M. (2011). Austria: ERA-NET Road.
Link: Free/priced:
http://www.eranetroad.org/index.php?option=com_content&view=article&id=74&Itemid=74 Free
Objectives: Examine the impact of different road features on driver speed choice and ‘self-explainingness’.
Methodology: An on-line questionnaire study was developed to assess the impact of different road features on reported speed choice. The survey was completed by participants in Austria, Germany, the Netherlands, Great Britain, Ireland and Sweden. Road features of interest were road width, separation of driving direction, number of lanes, and closed versus open feel of the road from vegetation near to the road side.
Key Findings: Road width and closed/open feel were found to be critical in influencing driver speed choice for all countries. Variable results were observed for number of lanes and type of separation.
Keywords: Self-explaining roads, speed choice.

61
Title: The relative effectiveness of a hidden versus a visible speed camera programme
Published: Keall, M.D., Povey, L.J., and Frith, W.J. (2001). Accident Analysis and Prevention, 33, 277-284.
Link: Free/priced:
http://www.sciencedirect.com/science/article/pii/S0001457500000427 Requires subscription to ScienceDirect
Objectives: Review the results of a trial of hidden versus visible speed cameras.
Methodology: Analysis of speed and crash data before and during a hidden speed camera programme.
Key Findings: During the first year of the hidden speed camera trial, mean speeds fell by 2.3 km/h in speed camera areas and 1.6 km/h elsewhere compared with the rest of the country. There were net falls of 11% in the open-road crash data, 19% in the casualty rate and 8% in the number of injured vehicle occupants per crash associated with the hidden camera programme.
Keywords: Speed camera, crash rates, speed survey, public attitude survey, interrupted time-series design.
Title: ‘Psychological’ traffic calming
Published: Kennedy, J., Gorell, R., Crinson, L., Wheeler, A. and Elliott, M. (2005). TRL Report 641. Crowthorne: Transport Research Laboratory.
Link: Free/priced:
https://trl.co.uk/reports/TRL641 Free
Objectives: To investigate the potential impact of psychological (as opposed to physical) measures for traffic calming.
Methodology: A review of psychological measures was undertaken in order to understand the cognitive mechanisms underlying driver responses. From this review, measures were selected for further investigation. Focus group discussions and interviews were held to determine the impact of different measures on driver speed choice. Those measures that showed promise were then tested in the driving simulator. Finally, on road trials of gateways, build outs, removal of centre line, coloured surfacing etc. were implemented in 2004 in Latton.
Key Findings: In-bound speeds at the Latton site fell by 8mph and 4mph at the gateways. In the village, two-way mean speeds fell by 7-8 mph; 85th percentile speeds fell by 8-10 mph. Although over half of the vehicles still exceeded the 30 mph speed limit, the proportion of drivers exceeding 40 mph dropped from 50% to around 10%.
Keywords: Traffic restraint, psychology, speed, driving, highway design, simulation, interview, test method, simulator (driving)

62
Title: Reanalysis of travelling speed and the risk of crash involvement in Adelaide, South Australia
Published: Kloeden, C.N., McLean, A.J. and Glonek, G. (2002).
Canberra, Australia: Australian Transport Safety Bureau.
Link:
Free/priced:
http://casr.adelaide.edu.au/speed/RESPEED.PDF
Free
Objectives: Model speed data in a 60 km/h urban environment.
Methodology: Modified logistic regression modelling was used to reanalyse free travelling speed case control data in an urban (60 km/h) speed environment.
Key Findings: Relative risk was found to be double for each 5 km/h increase in free travelling speed.
Keywords: Speed, modelling.
Title: Speed Limits New Zealand.
Published: Land Transport New Zealand. (2003).
New Zealand: Land Transport New Zealand.
Link:
Free/priced:
http://www.nzta.govt.nz/resources/speed-limits/speed-limits-nz/docs/speed-limits-nz.pdf
Free
Objectives: Guidance document for setting of speed limits in New Zealand.
Methodology: N/A: Guidance document
Key Findings: N/A: Guidance document
Keywords: Speed limits, New Zealand.
Title: Low-Cost Treatments for Horizontal Curve Safety
Published: McGee, H.W. and Hanscom, F.R. (2006).
Washington DC: FHWA.
Link:
Free/priced:
http://safety.fhwa.dot.gov/roadway_dept/horicurves/fhwasa07002/index.cfm#toc
Free
Objectives: Provision of a review of the treatments that can be used to improve safety at horizontal curves.
Methodology: N/A: Review/guidance document
Key Findings: N/A: Review/guidance document
Keywords: Horizontal curve, road safety, speed.

63
Title: Traffic safety dimensions and the power model to describe the effect of speed on safety
Published: Nilsson, G. (2004).
Lund, Sweden: University of Lund.
Link:
Free/priced:
http://lup.lub.lu.se/luur/download?func=downloadFile&recordOId=21612&fileOId=1693353
Free
Objectives: Doctoral thesis undertaken to examine the impact of speed on safety.
Methodology: Modelling and validation using Swedish and international data.
Key Findings: Even small changes to the speed travelled by the driving population lead to large and measurable changes in risk. A 5% increase in mean speeds leads to an increase in injury crashes of 10% and an increase in fatal crashes of 20%.
Keywords: Traffic safety, accidents, exposure, risk, consequence, dimension, accident rate, injury rate, speed limit, cross-sectional.
Comments:
Title: Speed management
Published: Organisation for Economic Cooperation and Development (OECD) (2006).
Paris: OECD Publishing.
Link:
Free/priced:
http://www.internationaltransportforum.org/Pub/pdf/06Speed.pdf
Free
Objectives: Provide best practice information on speed management for policy makers and practitioners.
Methodology: N/A: Guidance document
Key Findings: N/A: Guidance document
Keywords: Speed management.
Comments:

64
Title: Long-Term Effectiveness of Dynamic Speed Monitoring Displays (DSMD) for Speed Management at Speed Limit Transitions.
Published: Sandberg, W., Schoenecker, T., Sebastian, K., and Soler, D. (2006).
15th World Congress on ITS.
Link:
Free/priced:
http://www.informationdisplay.com/httpdocs/docs/MinnesotaStudy.pdf
Free
Objectives: An evaluation of the long-term impact of DSMD devices.
Methodology: The study was a before and after study with control site design. The DSMDs were installed at locations where speed limits had reduced as an urban area was entered. Vehicle speeds were measured before installation, 1 week after, 2 months after, seven months after and 1 year after installation.
Key Findings: Installation of DSMDs was effective in reducing vehicle speeds (by 6-8 mph) at transitions in the short and long term.
Keywords: Speed, dynamic speed monitoring displays.
Title: One hundred and ten kilometer per hour speed limit – evaluation of road safety effects
Published: Sliogeris, J. (1992).
Vicroads report GR 92-8.
Victoria: Australia.
Link:
Free/priced:
http://catalogue.nla.gov.au/Record/1078598
Fee unknown.
Objectives: To evaluate the impact of changes in speed limit.
Methodology: In 1987 the speed limit on rural and outer freeways in Melbourne, Australia was raised from 100 km/h to 110 km/h. Then, in 1989, the speed limit was lowered back to 100 km/h. This study examines the impact of these changes through an analysis of casualty data. Data for approximately 2.5 years of before, during and after the speed limit changes were analysed. A before and after study design was used with controls, the main reporting variable being casualty accident rate per kilometre travelled. Available speed data and literature were also reviewed.
Key Findings: There was an increase in the injury accident rate per kilometre of 24.6% when the speed limit was raised from 100 to 110 km/h, then a decrease of 19.3% when the speed limit was lowered back to 100 km/h.
Keywords: Speed limit change, road safety, injury accident, traffic accidents, traffic engineering.

65
Title: Rosebud WP4 – Case B report: Section control automatic speed enforcement in the Kaisermuhien tunnel (Vienna, A22 Motorway)
Published: Stefan, C. and Winkelbauer, M. (2006).
Vienna: Austria RSB.
Link:
Free/priced:
http://partnet.vtt.fi/rosebud/3rd_conf/06_ROSEBUD_WP4_Case%20B_Report_Section_Control.pdf
Free
Objectives: To evaluate the impact of the introduction of average speed cameras in a motorway tunnel in Vienna.
Methodology: Analyse vehicle speeds before and after the installation of the average speed cameras. Undertake cost-benefit analysis taking into account environmental impact, safety impact, revenue generation due to violations and operating costs.
Key Findings: More than 10 km/h reduction in vehicle speeds during the first year following introduction (average speeds reduced from 85 km/h before installation to 70 km/h shortly after installation and then 75 km/h after six months).
The Cost/Benefit ratio was calculated as being 1:10.3.
Keywords: Average speed cameras, speed, road safety, tunnel.
Comments:
Title: Advancing sustainable safety: National road safety outlook for 2005-2020
Published: SWOV (2006).
Leidschendam, The Netherlands: SWOV Institute for Road Safety Research.
Link:
Free/priced:
http://www.swov.nl/rapport/DMDV/Advancing_Sustainable_Safety.pdf
Free
Objectives: Outlining the principles of the Sustainable Safety initiative and providing the model for improvements in road safety in Netherlands from 2005 until 2020.
Methodology: N/A: Guidance document
Key Findings: N/A: Guidance document
Keywords: Sustainable safety.
Comments:

66
Title: Towards credible speed limits
Published: SWOV (2012).
Leidenschendam, the Netherlands: SWOV.
Link:
Free/priced:
http://www.swov.nl/rapport/Factsheets/UK/FS_Credible_limits.pdf
Free
Objectives: Provide information about the concept of credible speed limits.
Methodology: N/A: Fact sheet
Key Findings: N/A: Fact sheet
Keywords: Credible speed limits.
Comments:
Title: The effect of drivers’ speed on the frequency of accidents
Published: Taylor, M., Lynam, D. A. and Baruya, A. (2000).
Crowthorne: Transport Research Laboratory.
Link:
Free/priced:
https://trl.co.uk/reports/TRL421
Free
Objectives: A study to determine the impact of traffic speed on the frequency of accidents.
Methodology: This study used extensive road-based and driver-based studies to understand the relationship between speed and accidents more fully. Statistical modelling was used to develop relationships between speed and accident frequency on urban and rural roads, and how the relationship depends on speed of traffic, traffic volume, road layout characteristics and driver speed choice and how often they have accidents.
Key Findings: Evidence from the study suggested a 5% increase in injury accidents per 1 mph increase in average speed.
Keywords: Speed, accident, road safety.
Comments:

67
Title: Self-explaining roads
Published: Theeuwes, J. and Godthelp, H. (1995).
Safety Science, 19, 217-225.
Link:
Free/priced:
http://www.cs.vu.nl/~cogsci/cogpsy/theeuwes/safety_science_1995.pdf
Free
Objectives: A discussion of the concept of self-explaining roads.
Methodology: N/A: Discussion paper
Key Findings: Roads are self-explaining when they are in line with the expectations of the road user, eliciting safe behaviour simply by design. This has an impact on speed since in reference to speed limits, a road is self-explaining if driving above the speed limit is uncomfortable (either physically or psychologically) and obvious to the road user
Keywords: Self-explaining roads, speed.
Title: Use of variable electronic speed signs to improve safety on metropolitan freeways
Published: Traffix Group (2009).
Victoria, Australia: Vicroads.
Link:
Free/priced:
http://www.ipwea.com/SLAG14July09.pdf
Free
Objectives: Collation of evidence on the use of variable electronic speed signs to improve safety on metropolitan freeways.
Methodology: Review of studies and literature on the effectiveness of variable speed limits. An evaluation of variable speed limits in place in Victoria, Australia.
Key Findings: Variable speed limits have been found to reduce crashes in many countries:
In France on the A7: 48% reduction in crashes, 77% reduction in serious crashes (Serti, 2006).
In Germany on Autobahns: 20-30% reduction in crashes (Robinson, 2000)
In Finland: 13% reduction in risk of injury (Rama and Schirokoff, 2004)
In Netherlands: 35% reduction in serious crashes (FHA, 2003)
In Victoria the crash rate (all crashes and rear end crashes) halved, however other improvements will have contributed to this crash reduction.
Keywords: Variable speed limits, variable electronic speed signs, road safety.

68
Title: Effectiveness of Speed Indicator Devices on reducing vehicle speeds in London
Published: Walter, L.K. and Knowles, J. (2008).
TRL PPR 314
Crowthorne: TRL.
Link:
Free/priced:
https://trl.co.uk/reports/PPR314
Free
Objectives: To evaluate the impact of Speed Indicator Devices (SIDs). Specifically to explore the impact of SIDS on vehicle speeds in free flowing conditions, understand the duration of any impact, to determine if the SID remains effective when in place but not in operation, how far beyond the SID does the speed reduction last etc.
Methodology: Effects were calculated by measuring the difference between the mean speeds of vehicles at the SID before and during the SID operation. Any underlying vehicle speed changes were controlled for by collecting data 200m before the SID position.
Key Findings: The SID installations reduced vehicle speeds overall by 1.4 mph while the SIDs were operational. This varied from 0.6 to 2.6 mph between sites.
The proportions of drivers exceeding 30mph and 36mph were significantly reduced at all sites apart from one.
There was a novelty effect at some sites, with a drop in effectiveness observed during week 2.
Speed reduction identified 200m from the SID.
SIDs were most effective in residential areas, less so in sites where there was a combination of residential and commercial land use.
It was estimated that the speed reduction observed would convert to a 5.6% reduction in collisions while the SIDs were operational.
Keywords: Speed indicator devices, speed management, speed.
Comments:

69
Title: Speed cameras for the prevention of road traffic injuries and deaths
Published: Wilson, C., Willis, C., Hendrikz, J.K., Le Brocque R., Bellamy N. (2010)
Cochrane Database of Systematic Reviews
Link:
Free/priced:
http://www.ncbi.nlm.nih.gov/pubmed/20927736
Objectives: To assess whether the use of speed cameras reduces the incidence of speeding, road traffic crashes, injuries and deaths
Methodology: Independent screening studies for inclusion, extraction of data, assessment of methodological quality, reported study authors' outcomes and where possible, calculating of standardised results based on the information available in each study.
Key Findings: Despite the methodological limitations and the variability in degree of signal to noise effect, the consistency of reported reductions in speed and crash outcomes across all studies show that speed cameras are a worthwhile intervention for reducing the number of road traffic injuries and deaths. However, whilst the evidence base clearly demonstrates a positive direction in the effect, an overall magnitude of this effect is currently not deducible due to heterogeneity and lack of methodological rigour. More studies of a scientifically rigorous and homogenous nature are necessary, to provide the answer to the magnitude of effect.
Title: New Approach to a Safe and Sustainable Traffic Planning and Street Design for Urban Areas
Published: Wramborg, P.A. (2005)
Road Safety on Four Continents Conference, Warsaw, 2005.
Link:
Free/priced:
http://www.vti.se/en/road-safety-on-four-continents/history-of-rs4-conference-/
50 Euros (approximately £40)
Objectives: Analysis of the survivability of different crash types.
Methodology: Analysis of the survivability of different crash types using in-depth accident investigation data.
Key Findings: Survivability of crashes varies with speed. Most people survive a crash as a pedestrian at impact speeds below 30 km/h, and as a car occupant involved in a head on crash and side impact crash at 70 km/h and 50 km/h respectively. After these impact speeds survivability reduces very sharply.
Keywords: Accident survivability, speed.

70
Title: The Manual for Streets: Redefining Residential Street Design.
Published: York, I., Bradbury, A., Reid, S., Ewings, T. and Paradise, R. TRL PPR 661 Crowthorne: TRL.
Link:
Free/priced:
https://trl.co.uk/reports/TRL661
Free
Objectives: This research report underpins some of the geometric design principles in Manual for Streets.
Methodology: In order to obtain primary data for examining relationships between geometry, the environment, speed and casualties, twenty survey sites were selected throughout the UK comprising a mixture of roads. Various measurements were taken.
Key Findings: Lower vehicle speeds are associated with reduced road width and reduced visibility both on links and at junctions.
Site type (historic/ new build/ DB32 compliant etc.) is not a significant determinant of speed; junction and link geometries are important variables.
Speed is known to be a key factor for road safety. The findings of this research are consistent with this indicating that higher speeds on links increase the likelihood of injury and its severity.
Conflicting movements at junctions result in a higher number of accidents, but geometry can lower speeds which reduce both the likelihood and severity of accidents.
Stopping distances on links and at junctions have a margin of safety down to a visibility of around 20m in the environments studied unless other speed reduction features are incorporated.
The sites included roads with a range of surface types varying use of speed restriction measures, different levels of on-street parking and a range of forward visibilities. The results are consequently applicable to a wide range of developments throughout the UK.
Parking was found to reduce speeds on links and at junctions by 2-5mph.
The largest effect on speeds was found to be associated with reducing lines of sight. A reduction from 120 to 20m reduced approach speeds by approximately 20mph on links and 11mph at junctions.
Keywords: Streets, road design, geometry.

71
Title: Managing speed
Published: World Health Organization (WHO) (2017)
Link:
Free/priced:
http://www.who.int/violence_injury_prevention/publications/road_traffic/managing-speed/en/
Free
Objectives: N/A: Guidance document
Methodology: N/A: Guidance document
Key Findings: (Relevant)
Safe speeds for a number of road types and their potential
conflicts:
• Roads with possible conflicts between cars and
unprotected users – 30 km/h;
• Intersections with possible side-on conflicts between
cars – 50 km/h;
• Roads with possible frontal conflicts between cars –
70 km/h;
• Roads with no likelihood of frontal or side-on conflicts
between road users - ≥100 km/h.
Vehicle safety technologies can greatly help improve safety
on the road.
• Intelligent speed assistance (ISA) can help improve
drivers’ compliance with speed limits by alerting them when
they are travelling above the posted speed limit. The
standard ISA system uses an in-vehicle digital road map onto
which speed limits have been coded, combined with a
satellite positioning system. There are different versions of
ISA (advisory only, supportive and limiting) and the level at
which the system intervenes to control the speed of the
vehicle varies.
• Autonomous emergency braking (AEB) can help drivers avoid or mitigate collisions with other vehicles or vulnerable road users. The three versions of AEB (city, inter-urban and pedestrian) help provide constant monitoring of the road ahead and can assist the driver by automatically applying the brakes if they do not respond immediately to a potential crash situation.
Keywords: N/A: Guidance document

72
Title: The Application of Continuous Speed Data for Setting Rational Speed Limits and Improving Roadway Safety
Published: Fitzpatrick, C. D., McKinnon, I. A., Tainter, F. T., Knodler Jr., M. A. (2016)
Link:
Free/priced:
http://www.sciencedirect.com/science/article/pii/S092575351
6000345
Priced: $39.95
Objectives: The specific objective of this research effort was to compare a continuous data collection method with existing methods and develop a methodology for integrating them to improve roadway safety.
Methodology: A group of drivers were equipped with a smartphone application which continuously captured video, vehicle speeds, and location data. The continuous speeds were then compared to speeds captured at eight fixed points
Key Findings: The results identified similarities in the 85th percentile speeds observed using the various data collection methods and a case study was conducted using FHWA’s expert system, USLimits2. The results provide evidence for a successful proof of concept for mapping continuous speed data to traditional speed data collection points that may help in the speed limit setting process as well as the establishment of appropriate advisory speed zones. This research endeavour outlined a methodology which may be utilized to improve the process by which engineers determine speed limits and advisory speed zones.
Keywords: Rational speed limits; USLimits2; Continuous speed; Road safety.
Title: The Effect of Speed Limit Credibility on Drivers' Speed Choice
Published: Lee, Y. M., Chong, S. Y., Goonting, K., Sheppard, E. (2016)
Link:
Free/priced:
http://www.sciencedirect.com/science/article/pii/S136984781
6305630
Priced: $27.95
Objectives: Credibility of speed limits is a key factor affecting drivers’ compliance with speed limits. Malaysian drivers' judgments of appropriate speed were investigated.
Methodology: Two experiments were conducted to investigate how credibility of speed limits affects judgments of appropriate speed. The first experiment aimed to establish speeds deemed appropriate by investigating Malaysian drivers’ judgments of the appropriate speed to drive based on
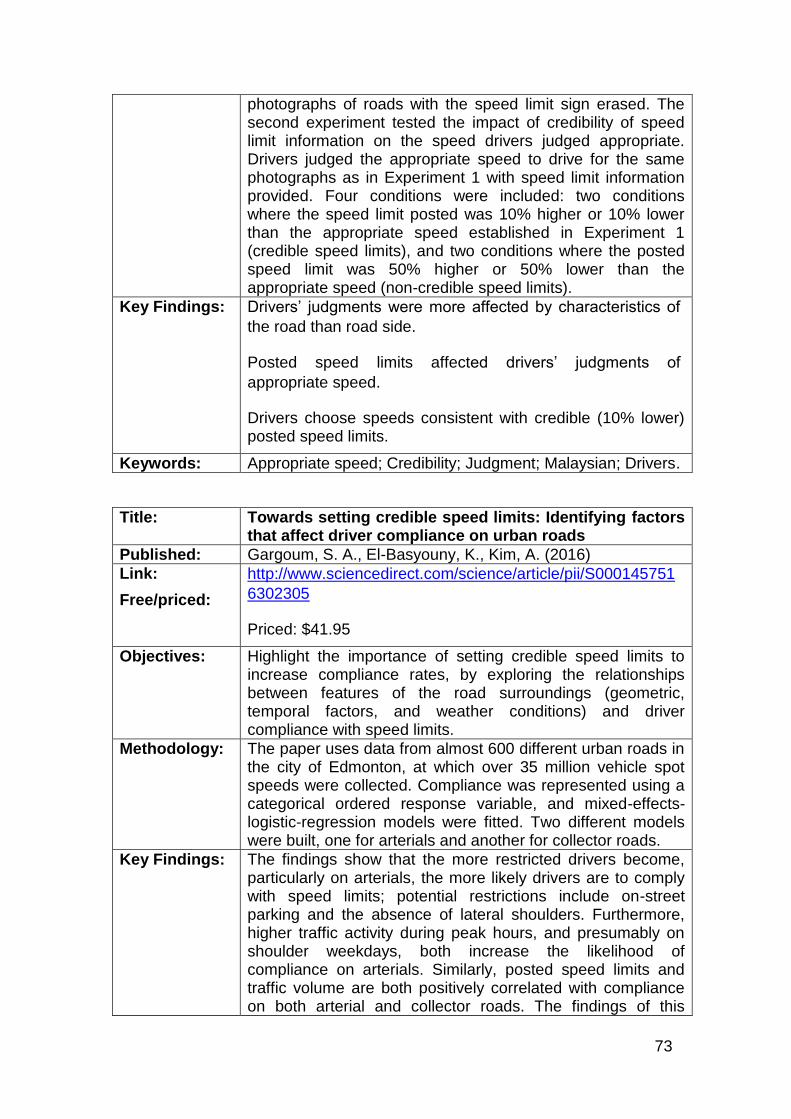
73
photographs of roads with the speed limit sign erased. The second experiment tested the impact of credibility of speed limit information on the speed drivers judged appropriate. Drivers judged the appropriate speed to drive for the same photographs as in Experiment 1 with speed limit information provided. Four conditions were included: two conditions where the speed limit posted was 10% higher or 10% lower than the appropriate speed established in Experiment 1 (credible speed limits), and two conditions where the posted speed limit was 50% higher or 50% lower than the appropriate speed (non-credible speed limits).
Key Findings: Drivers’ judgments were more affected by characteristics of
the road than road side.
Posted speed limits affected drivers’ judgments of
appropriate speed.
Drivers choose speeds consistent with credible (10% lower) posted speed limits.
Keywords: Appropriate speed; Credibility; Judgment; Malaysian; Drivers.
Title: Towards setting credible speed limits: Identifying factors that affect driver compliance on urban roads
Published: Gargoum, S. A., El-Basyouny, K., Kim, A. (2016)
Link:
Free/priced:
http://www.sciencedirect.com/science/article/pii/S000145751
6302305
Priced: $41.95
Objectives: Highlight the importance of setting credible speed limits to increase compliance rates, by exploring the relationships between features of the road surroundings (geometric, temporal factors, and weather conditions) and driver compliance with speed limits.
Methodology: The paper uses data from almost 600 different urban roads in the city of Edmonton, at which over 35 million vehicle spot speeds were collected. Compliance was represented using a categorical ordered response variable, and mixed-effects-logistic-regression models were fitted. Two different models were built, one for arterials and another for collector roads.
Key Findings: The findings show that the more restricted drivers become, particularly on arterials, the more likely drivers are to comply with speed limits; potential restrictions include on-street parking and the absence of lateral shoulders. Furthermore, higher traffic activity during peak hours, and presumably on shoulder weekdays, both increase the likelihood of compliance on arterials. Similarly, posted speed limits and traffic volume are both positively correlated with compliance on both arterial and collector roads. The findings of this

74
research provide evidence of the existence of an empirical relationship between road features and compliance, highlighting the importance of setting credible speed limits on roads and the possibility of achieving higher compliance rates through modifications to the road environment.
Keywords: Compliance; Speed limit credibility; Roadway design factors; Mixed models logistic regression; Generalized linear mixed models; Credible speed limits.
Title: Evaluation of the national HGV speed limit increase in England and Wales: year 1 interim summary
Published: Department for Transport, UK (2016)
Link:
Free/priced:
https://www.gov.uk/government/publications/increased-
speed-limit-for-heavy-goods-vehicles-over-75-tonnes-initial-
summary-report/evaluation-of-the-national-hgv-speed-limit-
increase-in-england-and-wales-year-1-interim-summary-
september-2016
Free
Objectives: In April 2015, new national speed limits came into force for
heavy goods vehicles (HGVs) over 7.5 tonnes on single
carriageway and dual carriageway roads in England and
Wales. The new limits are:
• 50 mph (up from 40 mph) on single carriageway roads;
• 60 mph (up from 50 mph) on dual carriageway roads.
The primary aim is to determine and understand the impacts of the speed limit changes. A secondary aim is to generate evidence to support future policy decisions.
Methodology: Traffic speeds and flows. Data from April to December 2014
were used for understanding the baseline situation (before
the speed limit changes). Data from April to December 2015
were used for the analysis of the initial impact of the speed
limit changes.
Safety. Collision data (STATS19) for the period from January 2005 to September 2015 were used. There was therefore approximately 10 years of pre-change data and only 6 months of post-change data available. The 2016 analyses are therefore initial findings and should not be interpreted as robust evidence of change.
Key Findings: The initial analysis of traffic speeds and flows found that:
• speeds for HGVs over 7.5 tonnes on single
carriageway roads had increased between 2014 and 2015 by

75
more than 1 mph, on average, across a range of flow
conditions;
• the equivalent figure for dual carriageways was an
increase of less than 0.5 mph.
The initial analysis of safety data between 2005 and 2015
identified that:
• historically, up to 17% of all reported collisions in
England and Wales have taken place on single (50 mph and
60 mph speed limit) and dual carriageway (60 mph and 70
mph speed limit) roads - 7.6% of the total collisions on these
roads were reported to involve HGVs;
• prior to the introduction of the new speed limits there
had already been a trend of collisions reducing on these
roads, though the rate of reduction had slowed in recent
years;
• in the period following the introduction of the new speed limits there is preliminary evidence of a reduction in HGV collisions estimated to be between 10% and 36%, however, it is not possible to attribute this directly to the speed limit changes.
Keywords: New national speed limits, Speed limit changes, Heavy goods vehicles.
Comments: Initial findings (6 months)
Title: Impact of Speed Limits and Road Characteristics on Free-Flow Speed in Urban Areas
Published: Silvano, A. P, Bang, K. L. (2016)
Link:
Free/priced:
http://ascelibrary.org/doi/10.1061/%28ASCE%29TE.1943-
5436.0000800
Priced: $30.00
Objectives: The paper documents studies of posted speed limit (PSL) changes on the free-flow speed on urban roads.
Methodology: Before and after field measurements were conducted, changing the existing PSL from 50 to 40 or 60 km/h. The analysis was conducted on the mean free-flow speed difference and speed variability. The data collected were also used for multiple regression analysis, including PSL changes and selected self-explaining road characteristics.
Key Findings: The results showed that a decreased PSL caused a small
(1.6 km/h) but significant reduction in the mean free-flow
speed and speed variance, which might lead to a 10%

76
reduction of severe injury accidents. Furthermore, the PSL
reduction had a larger impact on faster drivers and higher
road network classes.
Conversely, an increased PSL resulted in a 2.6 km/h increase in the mean free-flow speed but no change on speed variability. The regression results indicated that the free-flow speed was heavily influenced by road characteristics, such as carriageway width, road environments, and the presence of on-street parking and sidewalks. Arterial roads presented the largest impact. The PSL had a relatively small impact.
Keywords: Arterial highways; Before and after studies; Crash severity; Free flow speeds; Regression analysis; Speed limits; Traffic safety; Urban areas.
Title: Relationship of Traffic Fatality Rates to Maximum State Speed Limits
Published: Farmer, C. M. (2016) Insurance Institute for Highway Safety
Link:
Free/priced:
https://trid.trb.org/View/1417605
Priced: $20.00 via http://amonline.trb.org
Objectives: By the end of 2015, the maximum speed limit in 17 States was 75 mph or higher. This study looks at the impact of speed limit increases on fatalities in States from 1993 to 2013.
Methodology: Poisson regression was used to examine accident factors including unemployment rate, driver age, alcohol consumption, and maximum speed level. The number of fatalities expected each year if there had been no change in the maximum speed limit was modelled and compared to actual fatality rates.
Key Findings: It is determined that an estimated 33,000 traffic fatalities during the years 1995-2013 is attributable to speed limit increases. A 5 mph increase in a State's maximum speed limit was associated with an 8% increase in fatality rates on interstates and freeways and a 4% increase on other roads.
Keywords: Crash rates; Fatalities; Regression analysis; Speed limits; States; Trend (Statistics).
Title: Reduction of speed limit from 110 km/h to 100 km/h on certain roads in South Australia: a follow up evaluation
Published: Mackenzie, J., Kloeden, C., Hutchinson, T. (2015)
Link:
Free/priced:
http://acrs.org.au/files/papers/arsc/2015/MackenzieJ%20003%20Reduction%20of%20speed%20limit%20from%20110km%20to%20100%20km%20on%20certain%20roads%20in%20South%20Australia.pdf

77
Free
Objectives: The analysis presented below details a follow up investigation of the effect of the speed limit reductions on the road segments where the speed limit was reduced from 110 km/h to 100 km/h.
Methodology: The investigation presented here consists of a before and after analysis of casualty crashes on the road segments where the speed limit was reduced from 110 km/h to 100 km/h. The before period spans 10 years, from July 1993 to June 2003. The after period also spans 10 years, from July 2003 (during which the speed limit was reduced) to July 2013.
Key Findings: The number of casualty crashes on the subject roads since the speed limit was lowered was found to be 27.4 per cent lower than would have been expected if the subject roads had simply matched the reductions on the control roads (that remained at 110 km/h). This reduction was found to be statistically significant with 95% confidence limits of ±12.4%.
Keywords: Before and after studies; Crash rates; Highway traffic control; Injuries; Injury rates; Rural highways; Speed limits.
Title: Evaluation of New Speed Limits in Sweden: A Sample Survey
Published: Vadeby, A., Forsman, A. (2014)
Link:
Free/priced:
http://www.tandfonline.com/doi/abs/10.1080/15389588.2014.885650
Priced: £33.00
Objectives: The study sought to estimate changes in actual driving speed occurring after new speed limits were introduced in Sweden's rural road network.
Methodology: The effects of speed limit changes were estimated for 7 groups of roads of different types and initial speed limits. To study the effects on the entire road network and not only at specific road sites, a sampling survey was conducted in which speed was measured at randomly selected sites before and after the speed limit changes. Systematic sampling was used to select sites that were widely distributed geographically, though the analysis treats the data as if the sites were selected by simple random sampling. The speed of passing vehicles was generally measured using pneumatic tubes stretched across the road.
Key Findings: The survey results indicate that the mean car speed increased by 3.5 km/h when the speed limit increased by 10 km/h on motorways and 2 + 1 roads. Reducing the speed limit by 10 km/h on 2 + 1 roads and rural roads with a speed limit of 110 km/h resulted in a 2 km/h decrease in mean speed. On rural roads where the speed limit was lowered from 90 to 80 km/h, the mean speed decreased by 3.3 km/h.

78
These changes are statistically significant.
Keywords: Sample survey, New speed limits, Mean speed, Speed compliance, Traffic safety
Title: Examining Impacts of Increasing Speed Limit on Speed Distribution: Case Study
Published: Alemazkoor, N., Hawkins, H.G. (2014) Transportation Research Board
Link:
Free/priced:
https://trid.trb.org/View/1288782
Priced: $20.00 via http://amonline.trb.org
Objectives: In January 2013, the Texas Department of Transportation increased the speed limit on a freeway through College Station, Texas from 70 mph to 75 mph. This stretch of freeway includes a data collection facility that records the speed of every vehicle. The authors accessed this data to evaluate vehicle speed distributions before and after the speed limit change.
Methodology: The speed data was recorded continuously and there was over 160,000 speed points in each period. Speed data were divided into groups by type of day (weekday or weekend), light condition (daylight or dark), type of vehicle (car or truck), lane position, and volume level for analysis.
Key Findings: It was found that mean and 85th percentile speeds increased after raising the speed limit, but by less than the 5 mph increase in the speed limit. For the entire set of data, the 85th percentile speed increased from 74.7 in the before period (November 2012) to 77.0 mph in the after period (March 2013). The results indicate that the 75 mph speed limit is a better representation of the 85th percentile speed than the 70 mph speed limit. The results also indicate that, when the speed limit on a high-speed road is increased, there may not a similar magnitude of increase in the 85th percentile speed.
Keywords: Freeways; High speed vehicles; Highway safety; Running speed; Speed distribution; Speed limits; Traffic control devices; Traffic volume.
Title: Safety effects of reducing the speed limit from 90 km/h to 70 km/h
Published: De Pauw, E., Daniels, S., Thierie, M., Brijs, T. (2014)
Link:
Free/priced:
http://www.sciencedirect.com/science/article/pii/S0001457513001930
Priced: $41.95
Objectives: In 2001, the Flemish government decided to lower speed limits from 90 km/h to 70 km/h on a considerable number of highways. The present study examines the effectiveness of

79
this measure using a comparison group before- and after study to account for general trend effects in road safety.
Methodology: Sixty-one road sections with a total length of 116 km were included. The speed limits for those locations were restricted in 2001 and 2002. The comparison group consisted of 19 road sections with a total length of 53 km and an unchanged speed limit of 90 km/h throughout the research period.
Key Findings: Taking trend into account, the analyses showed a 5% decrease [0.88; 1.03] in the crash rates after the speed limit restriction. A greater effect was identified in the case of crashes involving serious injuries and fatalities, which showed a decrease of 33% [0.57; 0.79]. Separate analyses between crashes at intersections and at road sections showed a higher effectiveness at road sections. It can be concluded from this study that speed limit restrictions do have a favourable effect on traffic safety, especially on severe crashes.
Keywords: Before and after studies; Crash rates; Crash severity; Speed limits; Speeding; Traffic safety.
Title: 70mph Study
Published: Donnell, E. T., Hamadeh, B., Li, L., Wood, J., (2016) Pennsylvania State University
Link:
Free/priced:
http://www.dot7.state.pa.us/BPR_PDF_FILES/Documents/Research/Complete%20Projects/Operations/70mph_study.pdf
Free
Objectives: In July and August 2014, the Pennsylvania Department of Transportation (PennDOT) and Pennsylvania Turnpike Commission (PTC) raised the posted speed limit on rural sections of Interstates 80, 380, and 76 from 65 to 70 mph. The purpose of this study was to assess the speed and safety performance of these “pilot” sections
Methodology: Comparing the operating speeds and crash frequencies before and after the posted speed limit increase. Additionally, operating speed data in several work zones were collected to assess how drivers comply with posted speed limits in work zones on the pilot sections. An inferred design speed method and pavement friction degradation method are proposed as methodologies to assess site conditions on rural Interstate roadways with 65 mph posted speed limits. Collectively, the operating speed, safety, inferred design speed, and friction information can be used by PennDOT and the PTC to identify candidate locations for 70 mph posted speed limits.
Key Findings: The findings suggest that mean and 85th-percentile operating speeds increased after increasing the posted speed limit from 65 to 70 mph; however, the increases were less than 5 mph.
Keywords: Before and after studies; Crash rates; Friction; Highway safety; Interstate highways; Operating speed; Pilot studies;

80
Rural areas; Speed limits; Work zones.
Title: The Impact of Lowered Residential Speed Limits on Vehicle Speed Behaviour
Published: Islam, T., El-Basyouny, K., Ibrahim, S. (2014)
Link:
Free/priced:
http://www.sciencedirect.com/science/article/pii/S0925753513002312
Priced: $39.95
Objectives: In 2010, the City of Edmonton reduced the posted speed limit (PSL) in six residential communities from 50 to 40 km/h. This study investigates the impact of the reduced PSL on vehicle speeds using a before-and-after experimental design with a control group adjustment.
Methodology: Continuous speed and traffic flow data was collected at 65 locations over a period of 7 months, with the first month representing the before period and the following 6 months representing the after period. Speed evaluation was performed on several levels, ranging from individual speed survey locations to an overall aggregate analysis. Several performance indicators, such as mean free-flow speed, speed variance, level of compliance, and percentile speed profile, were considered.
Key Findings: The results revealed a statistically significant reduction in mean free-flow speed and speed variances for all combinations of time-of-day and day-of-week classifications. Though absolute compliance to the reduced PSL was low, compliance to a 15 km/h threshold above the PSL was significantly high. Moreover, the analysis showed that the effectiveness of the reduced PSL improved with time.
Keywords: Behaviour; Highway safety; Periods of the day; Residential areas; Speed limits; Traffic flow; Traffic speed; Weekdays.
Title: Speed limit reduction in urban areas: A before–after study using Bayesian generalized mixed linear models
Published: Heydari, S., Miranda-Moreno, L. F., Liping, F. (2014)
Link:
Free/priced:
http://www.sciencedirect.com/science/article/pii/S0001457514002693
Priced: $41.95
Objectives: In fall 2009, a new speed limit of 40 km/h was introduced on local streets in Montreal (previous speed limit: 50 km/h). The paper proposes a methodology to efficiently estimate the effect of such reduction on speeding behaviours.
Methodology: A full Bayes before–after approach, which overcomes the limitations of the empirical Bayes method. The proposed methodology allows for the analysis of speed data using hourly observations. Therefore, the entire daily profile of

81
speed is considered. Furthermore, it accounts for the entire distribution of speed in contrast to the traditional approach of considering only a point estimate such as 85th percentile speed. Different reference speeds were used to examine variations in the treatment effectiveness in terms of speeding rate and frequency. In addition to comparing rates of vehicles exceeding reference speeds of 40 km/h and 50 km/h (speeding), the study verified how the implemented treatment affected “excessive speeding” behaviours (exceeding 80 km/h). To model operating speeds, two Bayesian generalized mixed linear models were utilized. These models have the advantage of addressing the heterogeneity problem in observations and efficiently capturing potential intra-site correlations. A variety of site characteristics, temporal variables, and environmental factors were considered.
Key Findings: The analyses indicated that variables such as lane width and night hour had an increasing effect on speeding. Conversely, roadside parking had a decreasing effect on speeding. One-way and lane width had an increasing effect on excessive speeding, whereas evening hour had a decreasing effect. The study concluded that although the treatment was effective with respect to speed references of 40 km/h and 50 km/h, its effectiveness was not significant with respect to excessive speeding-which carries a great risk to pedestrians and cyclists in urban areas. Therefore, caution must be taken in drawing conclusions about the effectiveness of speed limit reduction. This study also points out the importance of using a comparison group to capture underlying trends caused by unknown factors.
Keywords: Before–after studies; Speed limit reduction; Speeding; Excessive speeding; Bayesian generalized mixed linear models.
Title: Effects of Increasing Freeway Speed Limits on Crashes: Case Study from Israel
Published: Harari, A., Musicant, O., Bar-Gera, H., Schechtman, E. (2017) Transportation Research Board
Link:
Free/priced:
https://trid.trb.org/View/1438268
Priced: $20.00 via http://amonline.trb.org
Objectives: The speed limits in Israel were updated twice in recent years: in January 2011 and again in January 2013. The updates were by 10 to 20 km/h in twenty-six segments in seven different highways, with total length of 148 km. This study explores the change in safety that resulted from this action.
Methodology: The authors use three different approaches: (1) a simple before-and-after approach (2) before-and-after study with a comparison group (3) before-and-after study with traffic flow correction, using the empirical Bayes method. All the methods
82
showed decreases in the number of crashes after the speed limit change.
Key Findings: Relative to one of the comparison groups the decreases were statistically significant, 18% (CI= [9%,28%]) by method (2) and 21% (CI= [12%,30%]) by method (3). This finding, which suggests an increase in safety, contradicts prior knowledge about the effect of raising the speed limit, an issue that may deserve additional exploration in additional studies.
Keywords: Crash causes; Freeways; Speed limits; Traffic flow.
Title: The Effectiveness of Average Speed Cameras in Great Britain
Published: Owen, R., Ursachi, G., Allsop, R. (2016) RAC Foundation & Road Safety analysis
Link:
Free/priced:
http://www.racfoundation.org/assets/rac_foundation/content/downloadables/Average_speed_camera_effectiveness_Owen_Ursachi_Allsop_September_2016.pdf
Free
Objectives: The research objective of the study was to establish levels of occurrence of collisions before and after ASC installation (with consideration given to site-selection period, pre-installation and post-installation periods).
Methodology: The research introduced an independent methodology for reviewing site boundaries and the collisions that have taken place within them since 1990. Using the official Department for Transport collision records, it has been possible to create, on a month-by-month basis, the collision history for each site. These outputs have been used to review the effectiveness of ASCs in reducing collisions at the combined sites, applying a statistical model adopted by Professor Richard Allsop, in a form adapted from that used in the study of spot speed camera data.
Key Findings: A 36.4% (95% confidence interval: 25-46%) reduction in the mean rate of FSCs was estimated in the post-installation period. The change in PICs was lower, with a 16% (95% confidence interval: 9-22%) reduction; both results classified as highly statistically significant according to the model. These results allow in part for any RTM through the removal of SSP data from the pre-installation period. They also take into account the ‘trend’ data from the comparison sites. The other effect estimated in the model is the level of collisions in the SSP relative to the level in the rest of the pre-installation period. The results here show an increase in FSCs of 24.9%, and 16.7% for PICs. This supports the view that the SSP typically exhibits higher-than-normal collision numbers; again, both results were highly significant when tested in the model. It should be borne in mind that the SSP effect has already been taken into account for in the

83
installation effect analysis.
For FSCs the ASC installation effects at low- and high-speed sites were estimated reductions of 42.2% and 32.3% respectively, both being highly significant. The difference in the two results in itself was not significant, and could well have arisen from random variation. The PIC installation effect at low-speed sites was strong, with a 25% reduction at a high level of significance. The results for high-speed sites was lower at 7.9%, but this was statistically significant only at the 20% level and thus may have arisen through random variation.
For the low-speed sites both the FSC and PIC results were statistically insignificant. The estimated increase of 9% (for FSCs) and 5% (for PICs) compared to the rest of the pre-installation months could therefore have happened through chance. The results at highspeed sites were significant, and display increases of 30.2% for FSCs and 21.8% for PICs in the SSP compared to other pre-installation periods.
For sites installed for non-collision-reduction reasons, the estimated FSC reduction of 20% was not statistically significant because of the wide difference between reductions at the two sites, although the 24.2% PIC reduction was highly significant when tested in the model. However, comparison of the 95% confidence intervals for these two estimated reductions with those for the corresponding reductions for the sites installed for collision-reduction reasons provides no evidence that the reductions in collisions at these two sites differ from the reductions at the other 25 ASC sites that were selected based on a high collision record.
Conclusions: The results show that ASC systems are effective in reducing collisions, especially those of a high severity. Even after allowing for the effects of trend and regression to the mean, highly significant reductions are noted. There is no evidence for the existence of any optimum speed limit that leads to the installations achieving greater collision reduction – they appear to be as suitable for deployment in higher speed limits as in lower ones.
Keywords: Speed-limit enforcement, Average speed cameras, Regression to the mean, Site-selection period.
Title: Reducing casualties involving young drivers and riders in Europe
Published: Atchinson, L. (2016) European Transport Safety Council (ETSC)
Link: http://etsc.eu/wp-

84
Free/priced: content/uploads/2017_01_26_young_drivers_report.pdf
Free
Objectives: N/A: Guidance document
Methodology: N/A: Guidance document
Key Findings: (Speed related)
In free-flowing traffic, between 20 and 50% of drivers exceed speed limits on motorways, between 15 and 17% on rural roads and between 20 and 80% on urban roads. A 2013 survey by Ford of 9,500 people found that a majority of young drivers admit to breaking the speed limit.
Better enforcement of existing speed limits and lower limits effectively enforced would therefore help reduce deaths amongst young people, who are over-represented in speeding behaviour, collisions and deaths. This is especially true for young males who tend to drive faster than females and for moped riders who have been reported as more likely to speed and having a stronger intention to disobey speed limits.
Enforcement is best carried out in conjunction with high-profile public information campaigns, targeted at young people. Norway has recently used speed campaigns to target young drivers, and young male drivers in particular. This saw deaths for 16-24 year olds killed on the roads decrease from 49 in 2010 to 32 in 2015. These campaigns have simultaneously targeted the general population, fatal accidents in which excessive speed was a contributing factor fell from 41% in 2010 to 23% in 2014. Speed limits can be enforced via improved technology. In France, between 2002 and 2006, the introduction of a fully automated speed camera programme to enforce the speed management system saw a drop in deaths among young people by 40%.
Intelligent Speed Assistance (ISA) helps drivers to keep their speed within the permitted limit by allowing the vehicle to recognise the speed limit and respond accordingly if it is exceeded. Although the most likely forms of ISA can be overridden by a driver, it would encourage young people to abide by speed limits as well as educating them about the limits used in differed road environments. Evidence shows that the widespread use of ISA systems could lead to a 20% reduction in road deaths and 30% in injury collisions.
Keywords: N/A: Guidance document
Title: The impacts of speed cameras on road accidents: An application of propensity score matching methods
Published: Li, H., Graham, D. J., Majumdar, A. (2013)

85
Link:
Free/priced:
http://www.sciencedirect.com/science/article/pii/S000145751300314X
Priced: $41.95
Objectives: The paper aims to evaluate the impacts of speed limit enforcement cameras on reducing road accidents in the UK by accounting for both confounding factors and the selection of proper reference groups.
Methodology: The propensity score matching (PSM) method is employed to do this. A naïve before and after approach and the empirical Bayes (EB) method are compared with the PSM method. A total of 771 sites and 4787 sites for the treatment and the potential reference groups respectively are observed for a period of 9 years in England.
Key Findings: Both the PSM and the EB methods show similar results that there are significant reductions in the number of accidents of all severities at speed camera sites. It is suggested that the propensity score can be used as the criteria for selecting the reference group in before-after control studies. Speed cameras were found to be most effective in reducing accidents up to 200 meters from camera sites and no evidence of accident migration was found.
Keywords: Speed limit enforcement cameras; Causal analysis; Propensity score matching.
Title: Optimize the Settings of Variable Speed Limit System to Improve the Performance of Freeway Traffic
Published: Liu, H., Zhang, L., Sun, D., Wang, D. (2015)
Link:
Free/priced:
http://ieeexplore.ieee.org/document/7128696/
Priced: $33.00
Objectives: The paper investigates variable speed limit (VSL) systems, trying to optimize the system designs when the variable message signs (VMSs) are movable. Two objectives are considered, one is to smooth the flow propagation, and the other is to minimize the environmental impact of freeway traffic.
Methodology: The optimization problem is formulated as a large mixed-integer nonlinear programming problem, whose decision variables include the number of VMSs to be deployed, the locations of the VMSs, and the speed limits posted on the VMSs. Moreover, a genetic algorithm is proposed to solve the complex problem.
Key Findings: Numerical examples performed on a real freeway segment show that VSL can effectively achieve smooth flow and reduce the environmental impact of freeway traffic.
Keywords: Traffic control, Genetic algorithms, Computational modelling, Algorithm design and analysis, Mathematical model,

86
Acceleration.
Title: Harmonization with Variable Speed Limits on Motorways
Published: Stromgren, P., Lind, G. (2016)
Link:
Free/priced:
http://www.sciencedirect.com/science/article/pii/S2352146516305889?via%3Dihub
Free
Objectives: An investigation and a state-of-the-art description of traffic effects of harmonization with variable speed limits
Methodology: The study consisted of evaluation of extended number of lanes, variable speed limits and harmonization. The calibration of the implemented harmonization algorithm was iterative performed during an eighteen-month long period.
Key Findings: The average speed during rush hour on weekdays has increased by 2.5 kph after the installation of the traffic control system, of which 25% is assumed to be attributable to the traffic management system
The harmonization has delayed the onset of collapse. During the periods in which harmonization has not been activated but there has been a breakdown, it is considered that harmonisation would have passed the half period and then collapse would occurred.
The accidents have been reduced by half, of which 25% is assumed to depend on traffic management (harmonization, queue warning and VMS)
Keywords: Harmonization; Variable Speed Limits; Motorway; Capacity.
Title: Assessing Potential Safety Benefits of an Advisory Variable Speed Limit System along an Urban Freeway Corridor
Published: Siddiqui, S., Al-Kaisy, A. (2017) Transportation Research Board
Link:
Free/priced:
https://trid.trb.org/View/1438622
Priced: $20.00 via http://amonline.trb.org
Objectives: The paper presents an investigation into the safety effects of an advisory variable speed limit system deployed along OR-217 freeway in Portland, Oregon. This system is part of OR-217 active traffic management project which is intended to address the numerous safety and mobility challenges along the corridor.
Methodology: Due to the limited available crash data after system deployment, the study utilized surrogate safety measures besides crash data in assessing the safety impacts of the system. These surrogate measures included speed and speed variability at a point location, across the two directional
87
lanes of travel, and between locations along the corridor. Analysis of crash data showed a decrease in total crash frequency and rate including rear-end crashes.
Key Findings: At a point location, the system was found to generally reduce mean speed and speed variability within the same lane and between the median and shoulder lanes.
Further, study results suggest that the system could significantly reduce speed variation between locations along the corridor which should contribute to more gradual change in speeds and its associated acceleration and deceleration.
Lastly, the study found that intermittent activation of the advisory VSL system for brief periods of time (a minute or two) could bring negative impacts on speed variation.
Keywords: Crash rates; Highway traffic control; Transportation corridors; Urban highways; Variable speed limits.
Title: Evaluation of Variable Advisory Speed Limits in Work Zones
Published: Edara, P., Sun, C., Hou, Y. (2013) University of Missouri
Link:
Free/priced:
http://publications.iowa.gov/14932/1/IA_DOT_TPF-5-081_InTrans_variable_advisory_speeds.pdf
Free
Objectives: Effectiveness of Variable advisory speed limit (VASL) at both urban and rural work zones, at both uncongested and congested sites.
Methodology: Case studies
Key Findings: 1. The use of VASL is recommended for uncongested work zones to achieve better speed compliance and lower speeds. Greater enforcement of regulatory speed limits could help to decrease the standard deviation in speeds.
2. The use of VASL to complement the static speed limits in rural work zones is beneficial even if the VASL is only used to display the static speed limits. It leads to safer traffic conditions by encouraging traffic to slow down gradually and by reminding traffic of the reduced speed limit.
Keywords: Algorithms; Compliance; Speed limits; Variable message signs; Variable speed limits; Work zone safety; Work zone traffic control.
Title: Experimenting with Dynamic Speed Limits on Freeways
Published: Soriguera, F., Martinez-Josemaria, I., Menendez, M. (2015) Transportation Research Board
Link: https://trid.trb.org/View/1337754

88
Free/priced: Priced: $20.00 via http://amonline.trb.org
Objectives: The objective of the experiment was to construct a comprehensive database of traffic engineering variables on a freeway site when different speed limits apply.
Methodology: This paper presents the design and first results of the Dynamic Speed Limit (DSL) experiment that took place on the last 13 km stretch of the B-23 freeway accessing the city of Barcelona (Spain). The DSL system installed, in addition to the high density of surveillance equipment available, makes this stretch a suitable highway lab. Detailed measurements of vehicle count, speeds, occupancies, lane changing manoeuvres and travel times were taken.
Key Findings: Preliminary analysis empirically proves that drivers’ compliance with dynamic speed limits is very limited, unless speed enforcement devices are present. In addition, in controlled sections with high compliance rates, it is observed that lowering the speed limit extends the range for critical occupancies beyond the typical values without changing the freeway capacity. This might be due to the observed reduction in the lane changing activity at these occupancy levels and for low speed limits. A direct consequence of this fact is that, even with a high compliance to very low speed limits (e.g. 40 km/h), the flow restriction imposed is insignificant. Stable flows near capacity are maintained together with very low speeds and very high densities. In practice, this means that the mainline metering capabilities of DSL are limited.
Keywords: Data analysis; Freeway management systems; Freeway operations; Lane changing; Speed control; Traffic data; Variable speed limits.
Title: Variable speed limit: A microscopic analysis in a connected vehicle environment
Published: Khondaker, B., Kattan, L. (2015)
Link:
Free/priced:
http://www.sciencedirect.com/science/article/pii/S0968090X15002648
Free
Objectives: The paper presents a Variable Speed Limit (VSL) control algorithm for simultaneously maximizing the mobility, safety and environmental benefit in a Connected Vehicle environment.
Methodology: The paper investigated a VSL control algorithm using a microscopic approach by focusing on individual driver’s behaviour (e.g., acceleration and deceleration) through the use of Model Predictive Control (MPC) approach. A multi-objective optimization function was formulated with the aim of finding a balanced trade-off among mobility, safety and

89
sustainability. A microscopic traffic flow prediction model was used to calculate Total Travel Time (TTT); a surrogate safety measure Time To Collision (TTC) was used to measure instantaneous safety; and, a microscopic fuel consumption model (VT-Micro) was used to measure the environmental impact. Real-time driver’s compliance to the posted speed limit was used to adjust the optimal speed limit values. A sensitivity analysis was conducted to compare the performance of the developed approach for different weights in the objective function and for two different percentages of CV.
Key Findings: The results showed that with 100% penetration rate, the developed VSL approach outperformed the uncontrolled scenario consistently, resulting in up to 20% of total travel time reductions, 6–11% of safety improvements and 5–16% reduction in fuel consumptions. Our findings revealed that the scenario which optimized for safety alone, resulted in more optimum improvements as compared to the multi-criteria optimization. Thus, one can argue that in case of 100% penetration rates of CVs, optimizing for safety alone is enough to achieve simultaneous and optimum improvements in all measures. However, mixed results were obtained in case of lower % penetration rate which showed higher collision risk when optimizing for only mobility or fuel consumption. This indicates that with such % penetration rate, multi-criteria optimization is crucial to realize optimum and balanced benefits for the examined measures.
Keywords: Variable speed limit; Connected vehicle; Sustainability; Macroscopic; Microscopic; Optimization.
Title: Optimal Mainline Variable Speed Limit Control to Improve
Safety on Large‐Scale Freeway Segments
Published: Li, Z., Liu, P., Xu, C., Wang, W. (2016)
Link:
Free/priced:
http://www.ingentaconnect.com/search/article?option1=title&value1=Speed+limit+AND+Variable&freetype=unlimited&sortDescending=true&sortField=prism_publicationDate&pageSize=10&index=1
Priced: $51.00
Objectives: The primary objective of this study was to develop a procedure for determining the optimal variable speed limit (VSL) control strategy that aims at reducing both collision
risks and injury severity on large‐scale freeway segments.
Methodology: The achieved reduction in collision risks and injury severity
were evaluated using real‐time crash risk and severity prediction models. A modified cell transmission model (CTM) that took into consideration the capacity drop and the
stop‐and‐go traffic was used to simulate the traffic operations
90
with the VSL control. A computational procedure that incorporated the genetic algorithm and the CTM was proposed for the optimization of critical VSL control factors. Three scenarios with various placements of VSL signs on freeway mainlines were evaluated.
Key Findings: The results showed that the optimal VSL control successfully decreased the collision risks by 22.62% and reduced the injury severity of crashes by 14.67%. We also evaluated how drivers’ compliance to speed limits affected the effectiveness of VSL control. The safety effects decreased as drivers’ compliance rate to the VSL control decreased. The finding suggests the use of speed enforcement techniques together with the VSL control to achieve the optimum control effects.
Keywords: Variable speed limit (VSL), Control strategy, Cell transmission model (CTM), Optimal VSL control.
Title: Development of a variable speed limit strategy to reduce secondary collision risks during inclement weathers
Published: Li, Z., Li, Y., Liu, P., Wang, W., Xu, C. (2014)
Link:
Free/priced:
http://www.sciencedirect.com/science/article/pii/S0001457514001912
Priced: $41.95
Objectives: The primary objective of this study is to develop a control strategy of variable speed limits (VSL) to reduce the risks of secondary collisions during inclement weathers.
Methodology: By analysing the occurrence condition of secondary collision, the VSL strategy is proposed to dynamically adjust the speed limits according to the current traffic and weather conditions. A car-following model is modified to simulate the vehicle manoeuvres with the VSL control. Two surrogate safety measures, based on the time-to-collision notion, are used to evaluate the control effects of VSL. Five weather scenarios are evaluated in simulation.
Key Findings: The results show that the VSL strategy effectively reduces the risks of secondary collisions in various weather types. The time exposed time-to-collision (TET) is reduced by 41.45%-50.74%, and the time integrated time-to-collision (TIT) is reduced by 38.19%-41.19%. The safety effects are compared to those with a previous VSL strategy. The results show that in most cases our strategy outperforms the previous one. We also evaluate how driver's compliance to speed limit affects the effectiveness of VSL control.
Keywords: Inclement weather; Safety; Secondary collision; Strategy; Variable speed limit.

91
Title: Quantitative Analysis of the Impact of Variable Speed Limits on Motorway Safety
Published: Qu, X., Wang, W., Ran, B., Dai, Y. (2017) Transportation Research Board
Link:
Free/priced:
https://trid.trb.org/View/1439532
Priced: $20.00 via http://amonline.trb.org
Objectives: Many researchers have examined the impacts of VSL control on driving behaviour and have concluded that VSL systems can introduce some safety benefits. However, most of these existing studies were mainly using qualitative methods with insufficient efforts devoted to quantitative analysis. This study aims to quantify the impacts of different speed limits on the aggregated driving behaviour.
Methodology: The study performs s statistical analysis on empirical traffic data collected from a European motorway under VSL control.
Key Findings: The results show that different VSL values can effectively decrease the mean speed, the speed difference, and the percentage of small space headways when compared to No VSL control conditions. These observations are consistent with qualitative analysis results of previous studies. However, this study also shows that the changes in driving behaviour variables follow a trend of first decreasing then increasing with the continuous decreasing in VSL values. This new observation implies that continue decreasing the VSL values after a certain threshold cannot lead to better safety benefits, while the greatest traffic safety benefits can probably be achieved by adopting the suitable VSL values that match with the prevailing traffic conditions.
Keywords: Behaviour; Drivers; Traffic congestion; Traffic control; Variable speed limits.

92
Title: Safety effects of fixed speed cameras—An empirical Bayes evaluation
Published: Hoye, A. (2015)
Link:
Free/priced:
http://www.sciencedirect.com/science/article/pii/S0001457515002225
Priced: $41.95
Objectives: Assess the safety effects of 223 fixed speed cameras that were installed between 2000 and 2010 in Norway
Methodology: Before–after empirical Bayes study with control for regression to the mean (RTM). Effects of trend, volumes, and speed limit changes are controlled for as well.
Key Findings: On road sections between 100 m upstream and 1 km downstream of the speed cameras a statistically significant reduction of the number of injury crashes by 22% was found. For killed and severely injured (KSI) and on longer road sections none of the results are statistically significant. However, speed cameras that were installed in 2004 or later were found to reduce injury crashes and the number of KSI on road sections from 100 m upstream to both 1 km and 3 km downstream of the speed cameras. Larger effects were found for KSI than for injury crashes and the effects decrease with increasing distance from the speed cameras. At the camera sites (100 m up- and down-stream) crash reductions are smaller and non-significant, but highly uncertain and possibly underestimated.
Keywords: Speed camera; Road safety; Crash; Empirical Bayes; Regression to the mean.

93
Title: Speeding in school zones: violation or lapse in prospective memory?
Published: Gregory, B., Irwin, J.D., Faulks I. J., Chekaluk, E. (2014)
Link:
Free/priced:
https://www.ncbi.nlm.nih.gov/pubmed/24884545
Priced: $11.95
Objectives: Inappropriate speed is a causal factor in around one third of fatal accidents (OECD/ECMT, 2006). But are drivers always consciously responsible for their speeding behaviour?
Methodology: Two studies are reported which show that an interruption to a journey, caused by stopping at a red traffic light, can result in failure to resume the speed of travel prior to the interruption (Study 1). In Study 2 we showed that the addition of a reminder cue could offset this interruption. These studies were conducted in a number of Australian school zone sites subject to a 40 km/h speed limit, requiring a reduction of between 20 km/h and 40 km/h.
Key Findings: Motorists who had stopped at a red traffic signal sped on average, 8.27 km/h over the speed limit compared with only 1.76 km/h over the limit for those who had not been required to stop. In the second study a flashing "check speed" reminder cue, placed 70 m after the traffic lights, in the same school zones as those in Study 1 eliminated the interruptive effect of stopping with drivers resuming their journey at the legal speed. These findings have practical implications for the design of road environments, enforcement of speed limits, and the safety of pedestrians.
Keywords: Inappropriate speed, Traffic light, School zones, Interruption.

94
Title: Analyzing Driver Compliance to Speed Limits Using Logistic Regression
Published: Gargoum, S., El-Bayouny, K. (2015) Transportation Research Board
Link:
Free/priced:
https://trid.trb.org/View/1338001
Priced: $20.00 via http://amonline.trb.org
Objectives: The study examines the effects of such factors on driver compliance in the City of Edmonton, using logistic regression. Unlike previous studies, this study examines the effects of different variables on compliance, rather than collision counts or driver speed choice.
Methodology: The dataset used includes vehicle spot speeds recorded at almost 700 different locations in the city. The compliance for each vehicle was used as the response variable for the regression model, which was built using data from more than 35 million cases.
Key Findings: The findings show that, generally, the more restricted drivers become the more likely they are to comply with speed limits; potential restrictions include street parking, bike lanes, pedestrian crossing, or the absence of shoulder lanes. Furthermore, higher traffic activity during peak hours, and presumably on shoulder weekdays (Monday and Friday), both increase the likelihood of compliance. In contrast, as the vehicle class (length) increases, the probability of compliance decreases. Not much can be inferred about the effects of weather on compliance to speed limits, although an interesting finding is that odds of compliance seem to drop in winter months. Another important observation about non-compliance that is somewhat concerning is that speed limit violations are higher in residential areas relative to most of the other land uses considered.
Keywords: Climate; Highway design; Land use; Logistic regression analysis; Speed limits; Spot speed; Vehicle length.

95
Title: Driver Speed Limit Compliance in School Zones: Assessing the Impact of Sign Saturation
Published: Strawderman, L., Zhang, L. (2013) Mississippi State University
Link:
Free/priced:
http://mdot.ms.gov/documents/research/Reports/Interim%20and%20Final%20Reports/State%20Study%20253%20-%20Driver%20Speed%20Limit%20Compliance%20In%20School%20Zones%20-%20Assessing%20The%20Impact%20Of%20Sign%20Saturation.pdf
Free
Objectives: To evaluate the impact of school zone sign density on reducing driver speed and increasing driver compliance in school zones.
Methodology: Four school zones were selected for data collection. Each school zone requires a 10mph speed reduction (45mph to 35mph) and contains a static school zone speed limit sign with no flashers. The school zones represent high and low saturation areas. They also include both two-lane and four-lane roadways. Data were collected for one week (7 days) at each of the four selected sites. Data were collected using QTT NC-200™ Portable Traffic Analyzers™.
Key Findings: The initial findings can be used to inform sign placement as follows:
• There is no evidence of a negative impact of sign saturation. Place school zone signs as needed.
• Road type (number of lanes) has an impact on driver compliance in a school zone. A school zone located on a 4-lane road is more effective than a school zone located on a 2-lane road.
• There is evidence to suggest that drivers are more compliant to school zone signage in an urban setting. Place school zone signs in urban settings as needed.
Keywords: School zone sign density, Driver compliance in school zones, School zone speed limit sign.
96
Title: Comprehensive Framework for Speed-Zone Guidelines
Published: Shrestha, K. J., Shrestha, P. P. (2016)
Link:
Free/priced:
http://www.sciencedirect.com/science/article/pii/S209575641530619X
Free
Objectives: Propose a comprehensive framework for a speed-zone manual
Methodology: The paper reviewed the literature on speed, crashes, enforcement techniques, and speed-zone manuals. A nationwide survey was conducted to identify various factors affecting the decisions of speed zones establishing. The paper identified best practices based on the literature review and expert opinions, and proposed a comprehensive framework for a speed-zone manual.
Key Findings: The framework provided in this paper has six phases:
1) speed-zone identification;
2) speed-limit determination;
3) transition-zone detailed design;
4) speed-zone approval;
5) speed-limit enforcement; and
6) follow-up study.
Keywords: Speed zone guideline; Speed limit guideline; Realistic speed limit; Traffic safety; Nevada Department of Transportation.

97
Title: Speed Limits Set Lower than Engineering Recommendations
Published: Donnell, E. T., Gayah, V. V., Yu, Z., Li, L., DePrator, A. (2016) Pennsylvania State University
Link:
Free/priced:
http://www.mdt.mt.gov/other/webdata/external/research/docs/research_proj/speed_limit_lower/Final_Report.pdf
Free
Objectives: The purpose of this project is to provide the Montana Department of Transportation (MDT) with objective information concerning the operational and safety impacts of setting posted speed limits lower than engineering recommended values. This practice has been used on Montana roadways for a variety of reasons, but the safety and operational impacts are largely unknown. The project involved four unique components: a comprehensive literature review, a survey of other state transportation agencies, collection of speed and safety data from a variety of Montana roadways, and an analysis of these data.
Methodology: An Empirical Bayes observational before-after study.
Key Findings: There is a statistically significant reduction in total and fatal and injury crashes at sites with engineering speed limits set 5 mph lower than engineering recommendations. At locations with posted speed limits set 10 mph lower than engineering recommendations, there was a decrease in total crash frequency, but an increase in fatal and injury crash frequency. The safety effects of setting posted speed limits 15 or 25 mph lower than engineering recommendations is less clear, because the results were not statistically significant, due to the small sample size of sites available for inclusion in the analysis.
When the posted speed limit was set only 5 mph lower than the engineering posted speed limit, drivers tend to more closely comply with the posted speed limit. Compliance tends to lessen as the difference between the engineering recommended posted speed limit and the posted speed limit increases. The practice of light enforcement, which was defined as highway patrol vehicles making frequent passes through locations with posted speed limits set lower than engineering recommendations, appeared to have only a nominal effect on vehicle operating speeds. Known heavy enforcement, defined as a stationary highway patrol vehicle present within the speed zone, reduced mean and 85th-percentile vehicle operating speeds by approximately 4 mph.
Keywords: Before and after studies; Compliance; Crash injuries; Crash rates; Fatalities; Operating speed; Speed limits; Traffic law enforcement; Traffic safety.

98
Title: Position Paper: a strategy to reduce the number of people seriously injured on EU roads
Published: European Transport Safety Council (ETSC) (2016)
Link:
Free/priced:
http://etsc.eu/position-paper-a-strategy-to-reduce-the-number-of-people-seriously-injured-on-eu-roads/
Free
Objectives: N/A: Guidance document
Methodology: N/A: Guidance document
Key Findings: (Relevant recommendations)
Adopt legislation for fitting all new vehicles with an overridable Intelligent Speed Assistance system. Curbing illegal and inappropriate speed will reduce injury severity in all kinds of collisions.
Encourage Member States to adopt zones with speed limits of maximum 30km/h (or 20mph) in residential areas and areas with large numbers of pedestrians and cyclists and maximum 80km/h on undivided rural roads.
Keywords: N/A: Guidance document
Title: Intelligent Speed Assistance (ISA)
Published: European Transport Safety Council (ETSC) (2013)
Link:
Free/priced:
http://etsc.eu/wp-content/uploads/2014/03/Intelligent_Speed_Assistance_FAQs_2013.pdf
Free
Objectives: Define ISA
Methodology: N/A: Guidance document
Key Findings: Intelligent Speed Assistance (ISA) is the term given to a range of devices that assist drivers in choosing appropriate speeds and complying with speed limits. Intelligent Speed Assistance technologies bring speed limit information into the vehicle. Drivers receive the same information that they see (or sometimes miss seeing) on traffic signs through an on-board communication system, helping them to keep track of the legal speed limit all along their journey. Information regarding the speed limit for a given location is usually identified from an on-board digital map in the vehicle. Other systems use speed sign reading and recognition.
The information is then communicated to the driver in any of the following three ways:
• informing the driver of the limit (advisory ISA),
• warning them when they are driving faster than the
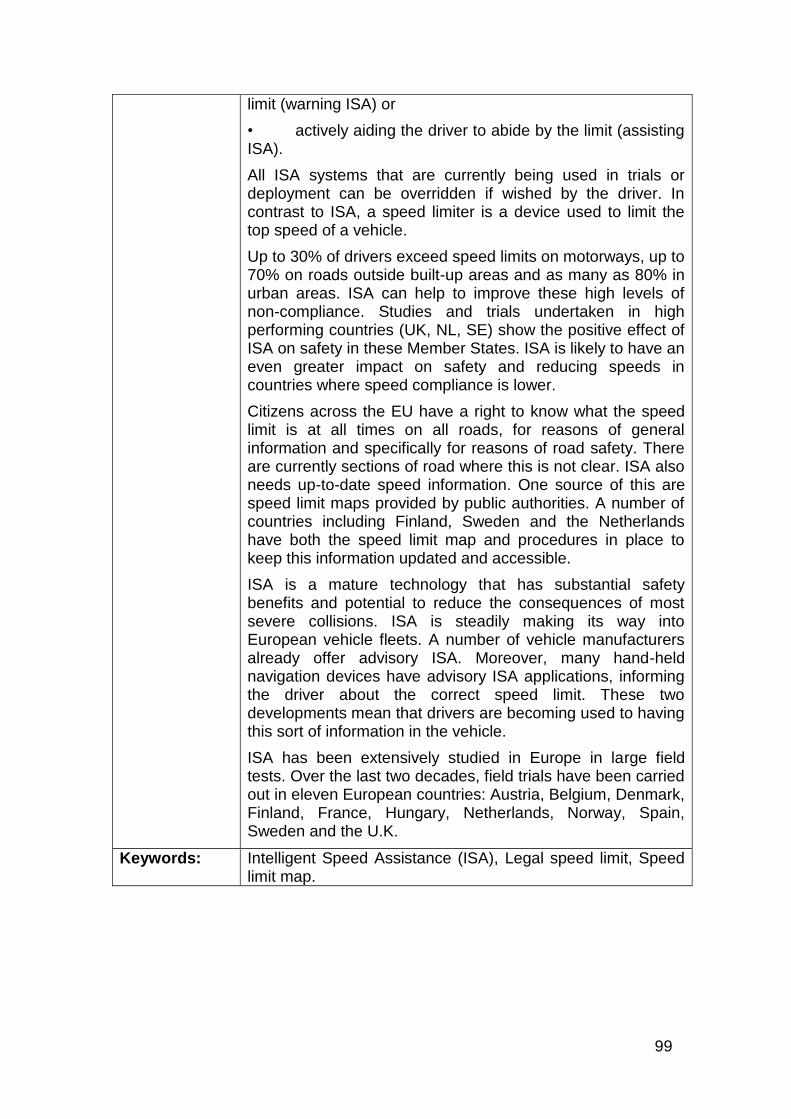
99
limit (warning ISA) or
• actively aiding the driver to abide by the limit (assisting ISA).
All ISA systems that are currently being used in trials or deployment can be overridden if wished by the driver. In contrast to ISA, a speed limiter is a device used to limit the top speed of a vehicle.
Up to 30% of drivers exceed speed limits on motorways, up to 70% on roads outside built-up areas and as many as 80% in urban areas. ISA can help to improve these high levels of non-compliance. Studies and trials undertaken in high performing countries (UK, NL, SE) show the positive effect of ISA on safety in these Member States. ISA is likely to have an even greater impact on safety and reducing speeds in countries where speed compliance is lower.
Citizens across the EU have a right to know what the speed limit is at all times on all roads, for reasons of general information and specifically for reasons of road safety. There are currently sections of road where this is not clear. ISA also needs up-to-date speed information. One source of this are speed limit maps provided by public authorities. A number of countries including Finland, Sweden and the Netherlands have both the speed limit map and procedures in place to keep this information updated and accessible.
ISA is a mature technology that has substantial safety benefits and potential to reduce the consequences of most severe collisions. ISA is steadily making its way into European vehicle fleets. A number of vehicle manufacturers already offer advisory ISA. Moreover, many hand-held navigation devices have advisory ISA applications, informing the driver about the correct speed limit. These two developments mean that drivers are becoming used to having this sort of information in the vehicle.
ISA has been extensively studied in Europe in large field tests. Over the last two decades, field trials have been carried out in eleven European countries: Austria, Belgium, Denmark, Finland, France, Hungary, Netherlands, Norway, Spain, Sweden and the U.K.
Keywords: Intelligent Speed Assistance (ISA), Legal speed limit, Speed limit map.

100
Title: Support and compliance with 20 mph speed limits in Great Britain
Published: Tapp, A., Nancarrow, C., Davis, A. (2015) Bristol Business School, UWE
Link: Free/priced:
http://www.sciencedirect.com/science/article/pii/S136984781500042X Priced: $27.95
Objectives: The prevalence of 20 mph speed limits across Great Britain (and 30 kph limits across much of Europe) is increasing. In Great Britain, by 2014 approximately 20% of the country’s residential streets already had signed 20 mph limits, and many more schemes are planned. However, while public support for speed limits generally is typically very high, lack of compliance with the limits by drivers is often a cause for concern. In general, there are a number of challenges to the support of, and compliance with, speed limits. These include awareness and appreciation of the benefits of low speeds; the contested risks posed by speeding; the tendency of drivers to over-estimate their own driving skill compared to other drivers; and the tendency for driving to become an automatic, habitual practice with low attention levels placed upon it, with the consequent ‘accidental’ breaking of speed limits. The paper explores the incidence of these effects and their implications in detail.
Methodology: The survey was administered by YouGov, a reputable and well established polling and research company that is regularly used by government, charity and university sectors. The sample of 3074 respondents were randomly chosen from a large online panel, with the sample profiled to fit the Census derived demographics of the GB population. A probability (stratified random) technique of sampling was used to permit statistical inference. The sample further yielded 2297 respondents who responded as drivers of some form of motor vehicle. The effective sample size, i.e. the sample size that is permissible for statistical tests after weighting procedures was 2219.
Key Findings: • Lack of compliance with 20 mph limits in GB and 30 kph limits across Europe by drivers is a cause for concern. Data was collected to examine support–opposition and compliance–non-compliance amongst the GB population.
• Four categories of driver according to support/opposition and compliance/non-compliance were examined in detail.
• Results indicated that self-enhancement bias, social contagion and habitual/inattentive driving were important factors in explaining non-compliance.
• Pro-active behaviour change strategies are required to create higher compliance levels.
Keywords: 20 mph limits, Driver compliance, Reasons, Behaviour changes.

101
Title: 20 mph: A survey of GB attitudes and behaviours
Published: Tapp, A., Nancarrow, C. (2013) Bristol Social Marketing Centre & University of West England
Link: Free/priced:
http://www.roadsafetyknowledgecentre.org.uk/knowledge/1277.html Free
Objectives: The survey had the following objectives. The authors needed to understand: • levels of support and opposition to 20mph speed limits. • the reasons for support or opposition. • the extent to which drivers will or will not comply with 20mph limits. • the effect of other motorists on respondents’ own behaviour. • attitudes to driving and speed limits, and how these might affect behaviour. • behaviour change: identifying influencers, levels of active citizenship.
Methodology: Fieldwork was contracted to YouGov, a large UK provider of social and market research. The total sample size was 3,074 GB adults. The effective sample size, i.e. the sample size that is permissible for statistical tests after weighting procedures, was 2947. There were also boosters in some cities and towns with 20mph and a control set of equivalent cities and towns, reported separately. Fieldwork was undertaken between 09/07/2013 - 22/07/2013. The survey was carried out online. One reason for opting for an online access panel was that the absence of an interviewer is thought to reduce socially desirable responding. In other words, elicit a more honest answer.
Key Findings: Levels of support for 20mph. 65% of respondents’ support 20mph limits in residential areas, and 31% oppose. There is slightly more net support, at 72%, for 20mph limits on busy streets/shopping areas than the 65% for residential streets.
Reasons for support or opposition. When asked for reasons to support 20mph limits, perhaps not surprisingly road safety and children’s safety are where the public’s collective priority currently lies. Other reasons - such as encouraging a healthier way of life, improving traffic flows, reducing congestion - achieved much lower support. When asked for their agreement with reasons to oppose 20mph limits, a cluster of around half the population agreed that 20mph limits will be ignored, not enforced or are pointless. In summary, there seems to be a widespread feeling amongst many that 20mph limits, worthwhile in theory, would not work in practice. 39% of people also believe that 20mph limits will make journey times longer and 36% thought they would increase congestion.
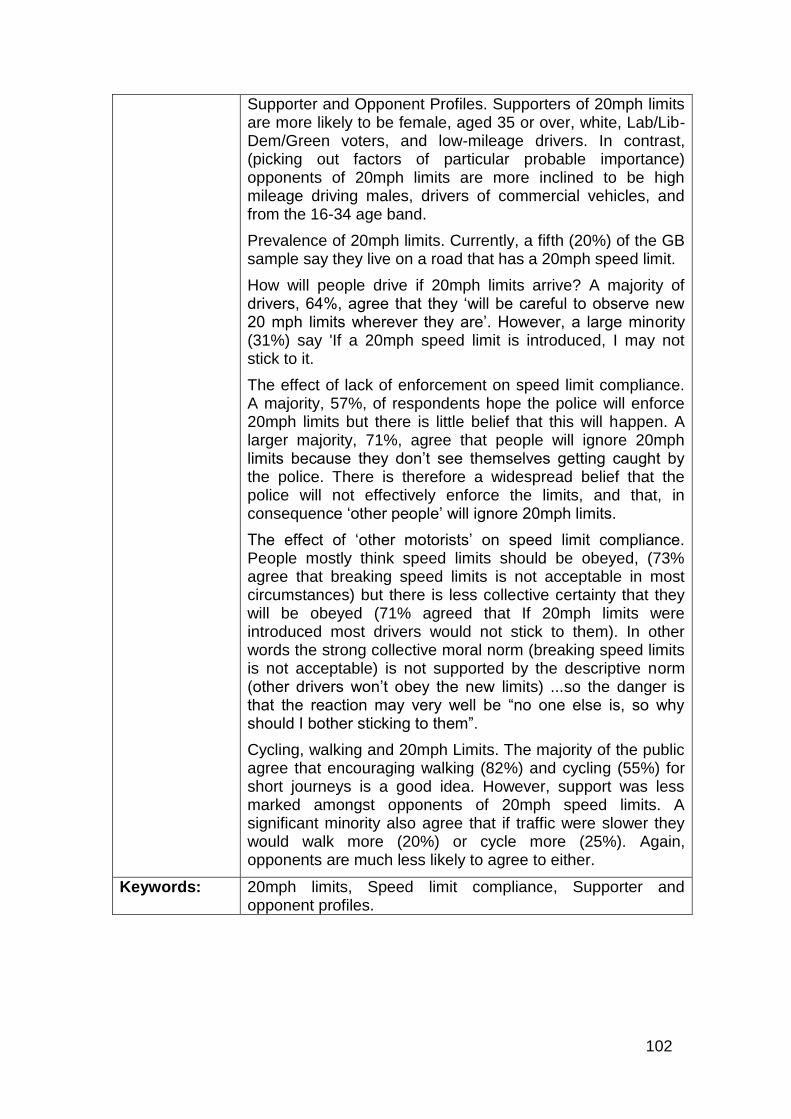
102
Supporter and Opponent Profiles. Supporters of 20mph limits are more likely to be female, aged 35 or over, white, Lab/Lib-Dem/Green voters, and low-mileage drivers. In contrast, (picking out factors of particular probable importance) opponents of 20mph limits are more inclined to be high mileage driving males, drivers of commercial vehicles, and from the 16-34 age band.
Prevalence of 20mph limits. Currently, a fifth (20%) of the GB sample say they live on a road that has a 20mph speed limit.
How will people drive if 20mph limits arrive? A majority of drivers, 64%, agree that they ‘will be careful to observe new 20 mph limits wherever they are’. However, a large minority (31%) say 'If a 20mph speed limit is introduced, I may not stick to it.
The effect of lack of enforcement on speed limit compliance. A majority, 57%, of respondents hope the police will enforce 20mph limits but there is little belief that this will happen. A larger majority, 71%, agree that people will ignore 20mph limits because they don’t see themselves getting caught by the police. There is therefore a widespread belief that the police will not effectively enforce the limits, and that, in consequence ‘other people’ will ignore 20mph limits.
The effect of ‘other motorists’ on speed limit compliance. People mostly think speed limits should be obeyed, (73% agree that breaking speed limits is not acceptable in most circumstances) but there is less collective certainty that they will be obeyed (71% agreed that If 20mph limits were introduced most drivers would not stick to them). In other words the strong collective moral norm (breaking speed limits is not acceptable) is not supported by the descriptive norm (other drivers won’t obey the new limits) ...so the danger is that the reaction may very well be “no one else is, so why should I bother sticking to them”.
Cycling, walking and 20mph Limits. The majority of the public agree that encouraging walking (82%) and cycling (55%) for short journeys is a good idea. However, support was less marked amongst opponents of 20mph speed limits. A significant minority also agree that if traffic were slower they would walk more (20%) or cycle more (25%). Again, opponents are much less likely to agree to either.
Keywords: 20mph limits, Speed limit compliance, Supporter and opponent profiles.

28 Calthorpe Road, Edgbaston, Birmingham, B15 1RPTelephone: 0121 248 2000 Registered Charity No: 207823
www.rospa.com
Copyright © 2022 FDOKUMEN