THE ENVIRONMENTAL EFFECTS OF CHANGING SPEED LIMITS ...
32
DOCUMENT DE TREBALL XREAP2014-09 THE ENVIRONMENTAL EFFECTS OF CHANGING SPEED LIMITS: A QUANTILE REGRESSION APPROACH Germà Bel (GiM-IREA, XREAP) Catalina Bolancé (Riskcenter-IREA, XREAP) Montserrat Guillén (Riskcenter-IREA, XREAP) Jordi Rosell (GiM-IREA, XREAP)
-
Upload
khangminh22 -
Category
Documents
-
view
6 -
download
0
Transcript of THE ENVIRONMENTAL EFFECTS OF CHANGING SPEED LIMITS ...
DOCUMENT DE TREBALL
XREAP2014-09
THE ENVIRONMENTAL EFFECTS OF CHANGING SPEED LIMITS: A QUANTILE
REGRESSION APPROACH
Germà Bel (GiM-IREA, XREAP) Catalina Bolancé (Riskcenter-IREA, XREAP)
Montserrat Guillén (Riskcenter-IREA, XREAP) Jordi Rosell (GiM-IREA, XREAP)

1
THE ENVIRONMENTAL EFFECTS OF CHANGING SPEED LIMITS: A QUANTILE REGRESSION APPROACH
Germà Bel, a Catalina Bolancé, b Montserrat Guillén b and Jordi Rosell a
aUniversitat de Barcelona, GiM-IREA bUniversitat de Barcelona, Riskcenter-IREA
Abstract
Two speed management policies were implemented in the metropolitan area of Barcelona aimed at reducing air pollution concentration levels. In 2008, the maximum speed limit was reduced to 80 km/h and, in 2009, a variable speed system was introduced on some metropolitan motorways. This paper evaluates whether such policies have been successful in promoting cleaner air, not only in terms of mean pollutant levels but also during high and low pollution episodes. We use a quantile regression approach for fixed effect panel data. We find that the variable speed system improves air quality with regard to the two pollutants considered here, being most effective when nitrogen oxide levels are not too low and when particulate matter concentrations are below extremely high levels. However, reducing the maximum speed limit from 120/100 km/h to 80 km/h has no effect – or even a slightly increasing effect –on the two pollutants, depending on the pollution scenario.
______________
Germà Bel. GiM-IREA, Department of Economic Policy. University of Barcelona, Barcelona (08034), Spain. [email protected] Av. Diagonal, 690. 08034 Barcelona (Spain) Tel: (+34)-934021946. Fax: (+34)-934024573 http://www.ub.edu/graap/beling.htm
Catalina Bolancé. Riskcenter-IREA, Department of Econometrics. University of Barcelona, Barcelona (08034), Spain. [email protected] Av. Diagonal, 690. 08034 Barcelona (Spain) Tel: +34 934 024 320. Fax: +34 934 021 821 http://www.ub.edu/riskcenter/cbl.html
Montserrat Guillén. Riskcenter-IREA, Department of Econometrics. University of Barcelona, Barcelona (08034), Spain. [email protected] Av. Diagonal, 690. 08034 Barcelona (Spain) Tel: +34 934 037 039. Fax: +34 934 021 821 http://www.ub.edu/riskcenter/mge.html
Jordi Rosell. GiM-IREA, Department of Economic Policy. University of Barcelona. Barcelona (08034), Spain. [email protected] Av. Diagonal, 690. 08034 Barcelona (Spain). Tel: (+34)-934024330. Fax: (+34)-934024573

2
Highlights
Two speed management policies – a variable speed system and an 80 km/h speed limit – have been implemented on Barcelona’s urban motorways to mitigate NOx and PM10 air pollution.
We use a quantile regression approach that enables us to identify the policy impact in terms of mean concentrations, as well as its effects during low and high pollution episodes.
The variable speed system reduces NOx and PM10 levels in most scenarios, although the impact varies according to the initial pollution level and the type of pollutant.
We confirm that reducing the maximum speed from 120 or 100 km/h to 80 km/h has no impact on pollution levels and can even increase some pollution levels slightly.

3
1. Introduction
Improving air quality is a major objective in most urban areas, but in metropolitan residential zones located near motorways, poor air quality is a particular concern. With pollution limits often being exceeded, a number of transboundary policies – including, the reduction in vehicle unit emissions and the introduction of new technologies and alternative fuels – have been adopted in an attempt to mitigate this situation. At the same time, various measures have been implemented at the local level – including, congestion tolling (Percoco, 2013) and traffic signal alignment (Madireddy et al., 2011). In the city of Barcelona, for example, the decision was taken to reduce the maximum speed limit from 120/100 km/h to 80 km/h on metropolitan motorways. Also, a variable speed system was implemented in specific zones of the metropolitan area.
Studies examining the impact of a change in the speed limit in metropolitan areas have failed to find a clear pattern; yet, a reduction in pollutants would appear to be the principal outcome. Here, our prime concern is in detecting whether the effects of Barcelona’s speed limit policy (i.e., a fixed 80 km/h limit and a variable speed system) vary depending on the atmospheric pollution state. To do so, we generalize Bel and Rosell’s (2013) findings when taking into account various pollution scenarios and combine them with a new econometric approach.
All previous econometric approaches have been conducted using average values, and so overlook the fact that policy impacts might vary with levels of pollution. Here, the quantile regression approach allows us to analyse the effects of speed limit policies at different pollution concentrations. As such, the main contribution of this paper is determining whether different atmospheric scenarios have a differentiated impact on a given speed limit policy. To the best of our knowledge, this is the first time that this methodology has been applied to such an analysis.
The rest of this paper is organized in five sections. In the first section, we briefly describe the two speed limit policies and, in the second, we review the empirical evidence reported to date on the impact of such policies on air pollution. Third, we explain the quantile regression methodology and, in the fourth, we report our empirical results. Finally, we highlight the conclusions to be drawn from our analysis and discuss the main policy implications.
2. Speed management policies
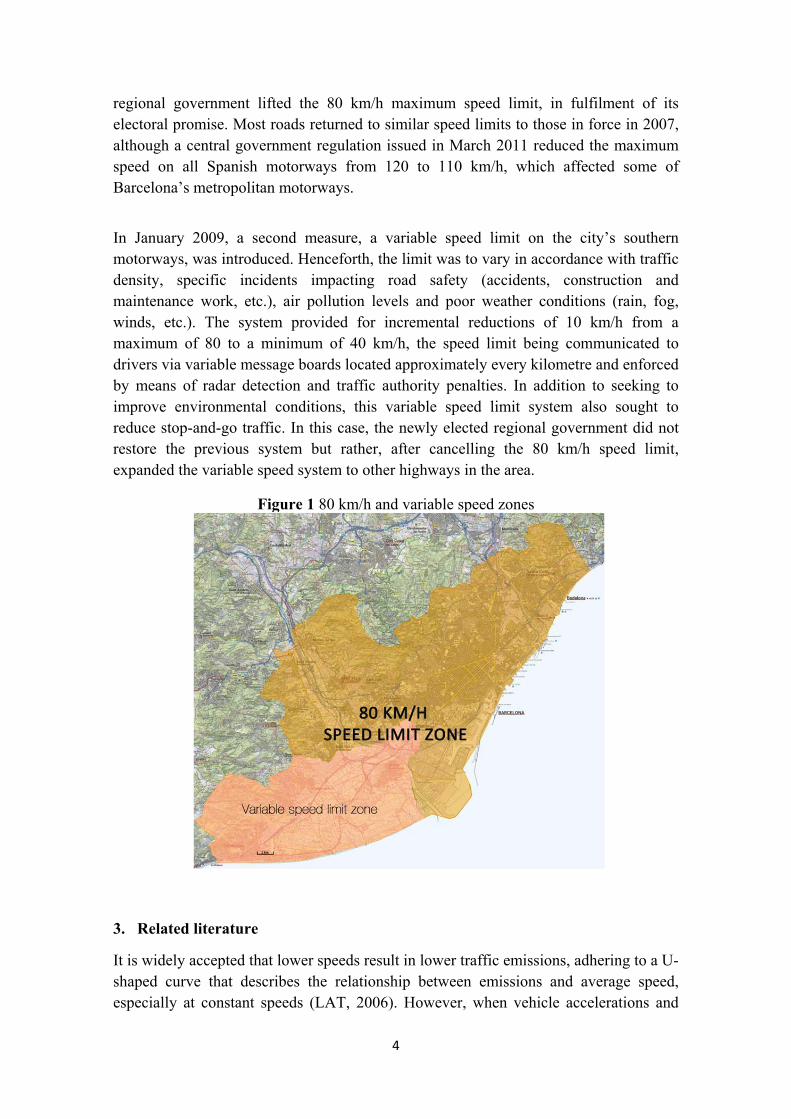
The regional government of Catalonia introduced regulations to reduce the maximum speed limit from 120 or 100 km/h to 80 km/h on motorways in the Barcelona metropolitan area, with the aim of attenuating pollution and the number of traffic accidents and reducing congestion (Figure 1). Before the new limit was introduced, a speed limit of 100 km/h operated on 63.2% of the roads, while a limit of 120 km/h operated on 20.4% of them (the remaining roads correspond to the Barcelona ring roads which already had an upper limit of 80 km/h). The new measure came into force on the first day of 2008 and remained in place until December 2010 when the newly elected
4
regional government lifted the 80 km/h maximum speed limit, in fulfilment of its electoral promise. Most roads returned to similar speed limits to those in force in 2007, although a central government regulation issued in March 2011 reduced the maximum speed on all Spanish motorways from 120 to 110 km/h, which affected some of Barcelona’s metropolitan motorways.
In January 2009, a second measure, a variable speed limit on the city’s southern motorways, was introduced. Henceforth, the limit was to vary in accordance with traffic density, specific incidents impacting road safety (accidents, construction and maintenance work, etc.), air pollution levels and poor weather conditions (rain, fog, winds, etc.). The system provided for incremental reductions of 10 km/h from a maximum of 80 to a minimum of 40 km/h, the speed limit being communicated to drivers via variable message boards located approximately every kilometre and enforced by means of radar detection and traffic authority penalties. In addition to seeking to improve environmental conditions, this variable speed limit system also sought to reduce stop-and-go traffic. In this case, the newly elected regional government did not restore the previous system but rather, after cancelling the 80 km/h speed limit, expanded the variable speed system to other highways in the area.
Figure 1 80 km/h and variable speed zones
3. Related literature
It is widely accepted that lower speeds result in lower traffic emissions, adhering to a U-shaped curve that describes the relationship between emissions and average speed, especially at constant speeds (LAT, 2006). However, when vehicle accelerations and
5
decelerations (stop-and-go traffic) are included in the model, the reduction in emissions attributable to the reduction in speed is much lower (Int Panis et al., 2006). As such, reducing the speed limit might eventually be counterproductive in terms of environmental controls, though these are not the only reasons for implementing these policies (Int Panis et al., 2011). Additionally, inconsistent results are reported for trucks, when their maximum speeds are reduced from 90 to 80 km/h, on levels of nitrogen oxides (NOx) and on particulate matter less than 10 μm in diameter (PM10). Their results illustrate the scientific uncertainties that policy makers face when considering the implementation of speed management policies.
Most previous studies of the environmental impact of reductions in speed limits involve computations based on theoretically established parameters, as shown in table 1 below. For example, Keller et al. (2008) examine modelled effects according to changing scenarios (a reference scenario with a maximum speed limit of 120 km/h on motorways and a limited scenario with a maximum of 80 km/h). They conduct a simulation for Switzerland, in which they analyse the impact on ozone levels of such a reduction in speed. The authors employ an air quality model package and examine different emission factors depending on speed. The modelled effects imply a 1% reduction in ozone concentrations, which translates into an equivalent decrease of about 4% in NOx emissions.
In one of the first metropolitan studies, Keuken et al. (2010) study the effect of speed management in Amsterdam and Rotterdam. They adopt two different approaches: (a) one based on air quality monitoring in combination with dispersion modelling, and (b) one based on applying relevant emission factors relating to the change in traffic dynamics. The authors conduct a linear regression of the measured and modelled contributions of NOx and PM10 during periods with and without the 80 km/h restriction. The study found no significant change in PM10 emissions and a reduction in NOx of between 30 and 32%, depending on the city. However, when reducing traffic dynamics (i.e., decreasing congestion), pollutant levels fell in both cities between 16 and 24%. Overall they find that reducing traffic dynamics is more important than reducing the average speed. Moreover, they report that the impact of the measure is more significant if a high proportion of heavy vehicles use the highway.
Computations based on simulations also exist for the metropolitan area of Barcelona, where our own analysis is conducted. Gonçalves et al. (2008), for example, compare emissions from vehicles moving at different speeds, and the impact on air quality. The authors employ an emission model and examine a photochemical pollution episode (17-18 June 2004). The model controls for meteorological variables, as well as for emissions from a variety of industrial and energy facilities, domestic and commercial fossil fuels and solvent uses, road transport, ports and airports. When simulating an 80 km/h limit, the 24-hour average NO2 concentration over the Barcelona area fell by between 0.7 and 0.8% on the selected day. The greatest reductions were observed in areas directly affected by the speed management, while results were more modest for the centre of Barcelona, with reductions of 0.1 to 0.3% for NO2 and of 0.1 to 0.2% for
6
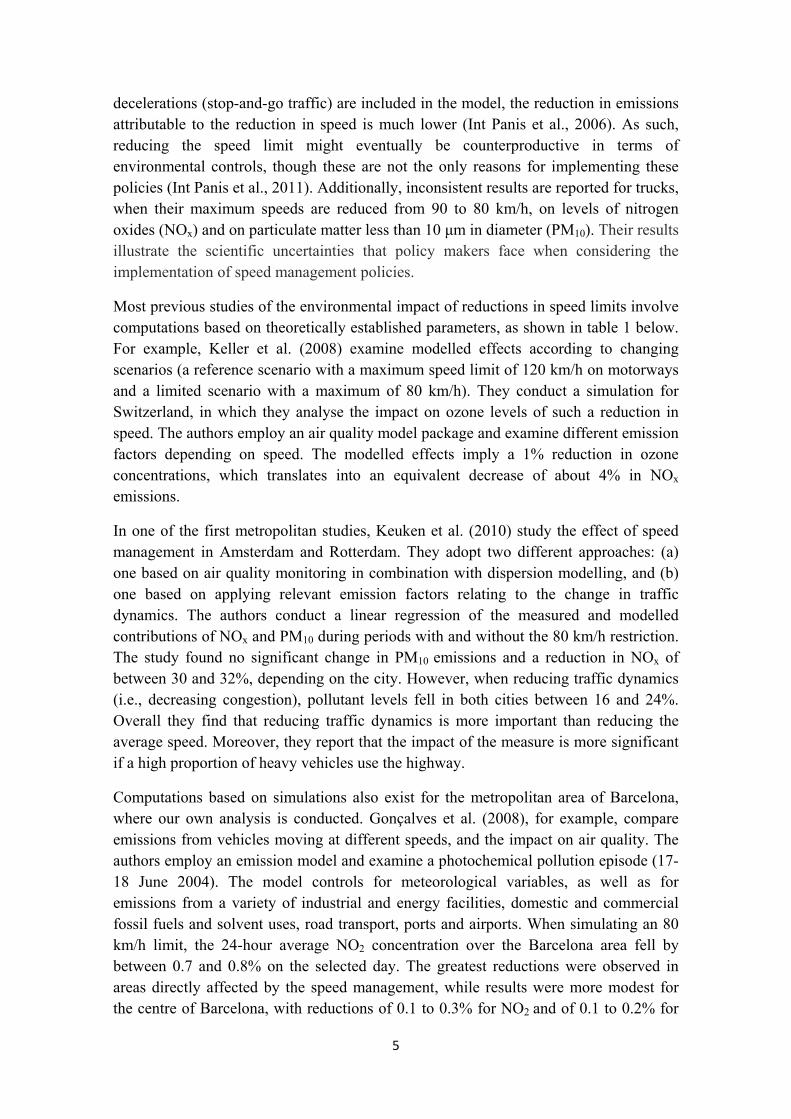
PM10. Staying in Barcelona, Baldasano et al. (2010) conducted an evaluation using data on vehicle speed and daily traffic for 2007 and 2008 (the 80 km/h limit being introduced in the second of these years). The authors modelled emissions to detect changes in air quality. NOx emissions fell by 10.98% and PM10 emissions by 10.99% in those areas in which the 80 km/h speed limit had been enforced, while the levels of both pollutants fell by 4% over the entire metropolitan area. As for air quality levels, they reported a reduction of between 5 and 8% in NOx concentrations and of 3% for PM10 in the most heavily affected areas.
Although econometric analyses have gained ground in recent years, very few studies draw on actual emissions data before and after changes in speed limits. One exception is the study conducted by Dijkema et al. (2008) in Amsterdam to determine whether lowering the maximum speed limit on the city’s ring motorway (A10) from 100 to 80 km/h reduced traffic-related air pollution in the neighbourhood of apartment buildings located near the highway. The authors collected emission data (daily mean concentrations of NOx and PM10) together with information on traffic volumes, traffic congestion and wind direction from the year before and after the limit was introduced. The results of their linear multivariate regressions pointed to no significant changes in NOx air quality, while PM10 concentrations fell by 2.20 ppm (3.6%).
Table 1: Performance of speed limit policies on metropolitan environments
Authors Place and Year Speed limit
change Pollutants impact Method
Dijkema et al. (2008)
Amsterdam (November 2004
to November 2006)
from 100 km/h to 80 km/h (with
strict enforcement)
No NOx air quality improvement and 7.4%
PM10 air quality improvement
Econometric
Gonçalves et al (2008)
Barcelona metropolitan area
(June 2004)
from 120 and 100 km/h to 80 km/h
0.7-0.8% decrease in NO2 background levels
Modeling System
Baldasano et al. (2010)
Barcelona metropolitan area
(2007-2008)
from 120 and 100 km/h to 80 km/h
NOx emissions decreased by 10.98%
and PM10 emissions by 10.99%. Both
pollutants immission levels decreased by 4%
Modeling System
Keuken et al. (2010)
Amsterdam and Rotterdam
metropolitan areas (2005-2006)
from 100 or 80 km/h to 80 km/h
30-32% decrease in NOx emission and no
relevant change in PM10
Modeling System and Econometric
Bel and Rosell (2013)
Barcelona metropolitan area
(2006-2010)
1) from 120 and 100 km/h to 80
km/h 2) variable speed
system
1) Air quality deterioration, 1.7%-
3.2% for NOx and 5.3-5.9% for PM10
2) variable speed reduces NOx and PM10 air pollution by a 5.2-
11.7% and 11.3-13.5%, respectively
Econometric

7
Bel and Rosell (2013) conduct an econometric (differences-in-differences) analysis of a speed management program in the Barcelona metropolitan area (combining a fixed speed limit of 80 km/h and a variable speed policy). Interestingly, the 80 km/h speed limit policy failed to improve air quality (1.7-3.2% increase in NOx air levels and 5.3-5.9% increase in PM10), while the variable speed policy had a positive impact (7.7-17.1% fall in NOx levels and 14.5-17.3% fall in PM10).
The study reported here, therefore, seeks to contribute to those that in recent years have undertaken evaluations of the impact of a variable speed limit by employing real motorway data (Papageorgiou et al., 2008). The positive impact of a variable speed policy on traffic safety is due to speed reduction and speed homogenisation. . The variable speed limits system generally improves the uniformity of traffic flows, reducing the creation of shock waves, decreasing average speeds and variability, and hence the number of lane change manoeuvres (Hegyi et al., 2005). Moreover, the homogenisation of speeds reduces the amount of stop-and-go traffic. All the studies discussed above are concerned with the way in which a policy shift might impact mean pollution levels. However, it is debateable that the effectiveness of a policy is ever homogeneous across all levels of the pollution concentration distribution and that the policy is equally effective for all pollutants. If the shape of the distribution of pollution indicators changes after introducing a speed policy, the change in the mean pollution concentration is not representative of all pollution levels and, as such, cannot be generalized. Using the mean to characterize highly skewed distributions is obviously dangerous; yet, pollutants present an asymmetric statistical distribution (many days present only small to moderate concentrations and only a few present large to extreme levels) as we show in the data section. In this regard, the quantile regression methodology allows us to model policy impacts at all pollution levels.
4. Data
This study draws on the database created by the authors using information supplied by various entities of the regional government of Catalonia, as used previously in Bel and Rosell (2013)1. Ambient pollutant levels are reported by 15 air quality surface stations in the Barcelona metropolitan area for the period 2006 to 2010, and include 1,826 daily observations. Traffic stations and meteorological measurement stations were selected as close as possible to the pollutant monitoring stations.
Our dependent variables are nitrogen oxide (nitric oxide and nitrogen dioxide) and particulate matter 10 μm or less in aerodynamic diameter. NOx and PM10 are designated as priorities and we focus specifically on these.
1 An extended description of the data can be found in Bel and Rosell (2013).

8
NOx: originating from transport emissions, power plants, cement factories, ceramic factories, glass factories, incinerators, natural gas, liquid and solid combustion and refineries. The origin is almost completely anthropogenic.
PM10: the fraction that penetrates most deeply into the lungs. Querol et al. (2001) report the chemical determination of 83% of the PM10 mass in the Barcelona metropolitan area and quantify anthropogenic sources as accounting for 54% of the load. Crustal and marine sources account for 26 and 4%, respectively; although, Saharan air mass intrusions can raise the crustal contribution up to 44%. The main anthropogenic sources are transport emissions, as well as emissions from power plants, cement factories, agricultural burning, mining and aggregate extraction, and incinerators, among others.
Our two policy dummy variables are the 80 km/h speed limit and the variable speed indicator. The 80 km/h dummy takes a value of one between 2008 and 2010 if the maximum speed limit was reduced to this new limit (note the Barcelona ring road stations take a value of one for the entire period as no change was made to the maximum speed). However, some stations never receive a one as they lay outside the 80 km/h restriction area. The variable speed dummy takes a value of one between 2009 and 2010 if the stations lay inside the variable speed area, and 0 otherwise. Note that all the variable speed limit traffic stations are inside the 80 km/h restriction area, so they take a value of one for the 80 km/h dummy while the measure was in force.
The covariates can be classified into three groups: the pollutant lag, and the traffic and atmospheric variables. Table 2 shows the main descriptive statistics.
Pollutant lag: the atmosphere is not a watertight compartment, which means pollutant concentrations are related to the levels recorded on the previous day.
Traffic: the number of vehicles is expected to be related to the concentration of the two pollutants, given that traffic emissions are their main source. We include the log number of all vehicles in both models.
The atmosphere is characterized by multiple interactions, all of which we try to capture:
o Atmospheric pressure: this is a continuous variable with air mass movements being related to pressure.
o Wind speed: we include the average daily speed since pollutants are likely to be transported by the wind.
o Rainfall: this is a continuous variable with pollutants interacting with water or forming sediments.
o Relative humidity: even when it does not rain, atmospheric humidity can increase contaminant sedimentation and impact the reaction balance.
o Temperature: a continuous variable included because pollutants react according to the level of solar irradiance.
o Sahara desert dust: a dummy variable taking a value of 1 if the Ministry of the Environment reports dust from the Sahara in the zone, 0 otherwise.
o Fire: a dummy variable taking a value of 1 if the Ministry of the Environment reports a large fire affecting the zone, 0 otherwise.

9
Table 2: Main descriptive statistics
5. Methodology
We work with unbalanced panel data. The goal is to analyse a dependent variable , representing cross-sectional data related to pollution monitoring at n stations, where
1, . . . , refers to station i and 1, . . . , is the point in time when pollution measures are available for each station i, and is the total number of days for which measures are available for station i. The classical linear model with individual fixed effects is:
(1)
where, for each station i and time t, is a vector with control covariates and is a vector with the dummy policy variables to be evaluated. The individual effects are represented by , the vector of individual effects by and, finally, is a random error. The classical linear model evaluates the influence of the covariates, the policies and the individual effect on the mean of the dependent variable and supposes that the influence is constant in the domain of the distribution of the dependent variable. However, there are models where a constant influence will not necessarily be true. For example, policies are unlikely to be equally effective when pollution levels are high or when they are low. In a classical approach (differences-in-differences), a policy is effective if it reduces significantly; thus, testing whether is negative and
Variables Description Mean Standard deviation
Average observations per pollutant station
NOx Nitrogen oxide daily average
concentration (µg·m-3) 84.46 59.95 1743
PM10 Particulate matter daily average
concentration with less than 10 µm (µg·m-3)
40.7 19.11 626
NOx(-1) and PM10(-1)
One period lag variables (1 day)
80km/h speed limit zone
Binary variable: 1 if 80km/h speed limit is implemented. 0 otherwise
0.47 0.50 2191
Variable speed Binary variable: 1 if variable speed
is implemented. 0 otherwise 0.07 0.25 2191
Traffic Daily vehicles on both ways (taken
in logarithms) 11.352 0.43 1500
Temperature Daily average temperature (ºC) 16.51 6.32 1472 Relative humidity Daily average relative humidity (%) 66.85 11.65 1472
Precipitation Daily rainfall (mm) 1.56 5.86 1473 Wind speed Daily average wind speed (m·s-1) 3.298 2.74 1020 Atmospheric
pressure Daily average atmospheric pressure
(hPa) 1014.8 25.42 1035
Sahara desert dust
Binary variable: 1 if there was a Sahara dust event. 0 otherwise
0.156 0.363 2191
Fire Binary variable: 1 if there was a fire
in the area. 0 otherwise 0.013 0.114 2191
10
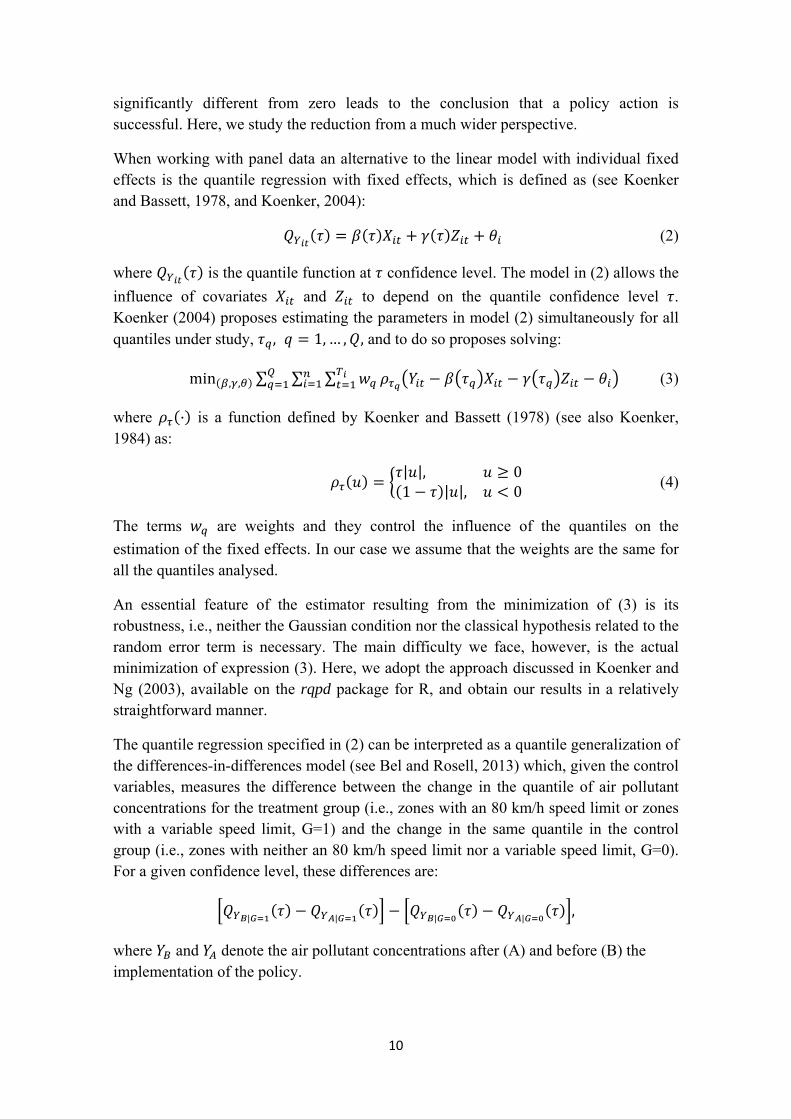
significantly different from zero leads to the conclusion that a policy action is successful. Here, we study the reduction from a much wider perspective.
When working with panel data an alternative to the linear model with individual fixed effects is the quantile regression with fixed effects, which is defined as (see Koenker and Bassett, 1978, and Koenker, 2004):
(2)
where is the quantile function at confidence level. The model in (2) allows the
influence of covariates and to depend on the quantile confidence level . Koenker (2004) proposes estimating the parameters in model (2) simultaneously for all quantiles under study, , 1, … , , and to do so proposes solving:
min , , ∑ ∑ ∑ (3)
where is a function defined by Koenker and Bassett (1978) (see also Koenker, 1984) as:
| |, 01 | |, 0
(4)
The terms are weights and they control the influence of the quantiles on the
estimation of the fixed effects. In our case we assume that the weights are the same for all the quantiles analysed.
An essential feature of the estimator resulting from the minimization of (3) is its robustness, i.e., neither the Gaussian condition nor the classical hypothesis related to the random error term is necessary. The main difficulty we face, however, is the actual minimization of expression (3). Here, we adopt the approach discussed in Koenker and Ng (2003), available on the rqpd package for R, and obtain our results in a relatively straightforward manner.
The quantile regression specified in (2) can be interpreted as a quantile generalization of the differences-in-differences model (see Bel and Rosell, 2013) which, given the control variables, measures the difference between the change in the quantile of air pollutant concentrations for the treatment group (i.e., zones with an 80 km/h speed limit or zones with a variable speed limit, G=1) and the change in the same quantile in the control group (i.e., zones with neither an 80 km/h speed limit nor a variable speed limit, G=0). For a given confidence level, these differences are:
| | | |,
where and denote the air pollutant concentrations after (A) and before (B) the implementation of the policy.

11
6. Results
Figure 2 shows the transformed kernel density estimations2 (see Alemany et al., 2013; Bolancé et al., 2008; Bolancé, 2010) associated with the NOx and PM10 variables. We compared the probability distribution functions for three scenarios: (i) without the 80 km/h and without the variable speed limits, (ii) with the 80 km/h and without the variable speed limits and (iii) with the 80 km/h and with the variable speed limits. From Figure 2, it can be concluded that when the policies are in force they not only shift the mean of the distribution, they also affect the shape of the distributions, especially when the impact of speed is included; in other words, the effect of the speed policy is not only reflected in a shift in distribution.
Figure 2: Density estimations for pollution data under different policies.
Table 3 shows the estimated quantiles with confidence levels ranging from 0.05 to 0.95 for the two pollutant concentrations (i.e., NOx and PM10). The first column in each case shows the behaviour of the observations when neither policy is implemented; the second column shows the observations when the 80 km/h speed limit is in place but the variable speed limit is not; the third column shows the observations when both policies are implemented; and, the fourth column is a composite for all the observations. Interestingly, the risk of high pollution levels falls more steeply when variable speed management is incorporated. However, the values in Table 3 are crude, there being no controls for such exogenous conditions as temperature, traffic, relative humidity and so on.
2 Transformed kernel density estimation is a nonparametric method that outperforms the classical kernel density estimation when the statistical distribution of the variable is right skewed.
12
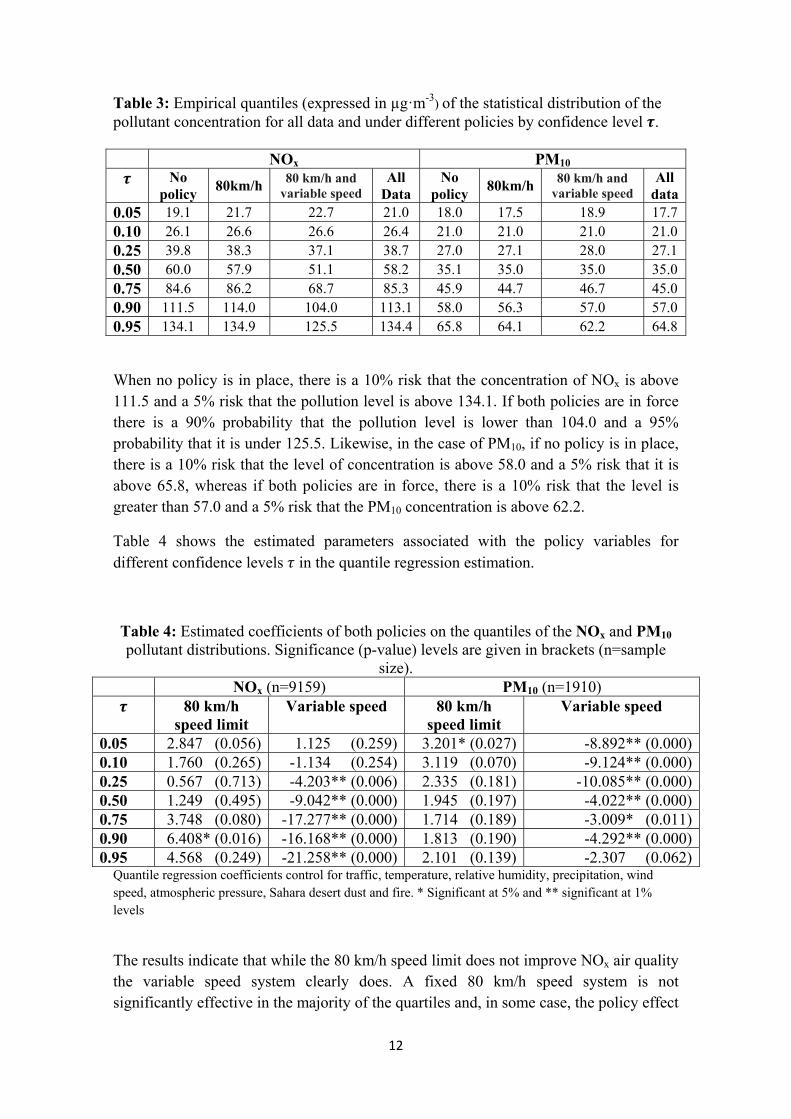
Table 3: Empirical quantiles (expressed in µg·m-3) of the statistical distribution of the pollutant concentration for all data and under different policies by confidence level . NOx PM10
No policy 80km/h 80 km/h and
variable speed All
DataNo
policy80km/h 80 km/h and
variable speed All
data0.05 19.1 21.7 22.7 21.0 18.0 17.5 18.9 17.70.10 26.1 26.6 26.6 26.4 21.0 21.0 21.0 21.00.25 39.8 38.3 37.1 38.7 27.0 27.1 28.0 27.10.50 60.0 57.9 51.1 58.2 35.1 35.0 35.0 35.00.75 84.6 86.2 68.7 85.3 45.9 44.7 46.7 45.00.90 111.5 114.0 104.0 113.1 58.0 56.3 57.0 57.00.95 134.1 134.9 125.5 134.4 65.8 64.1 62.2 64.8
When no policy is in place, there is a 10% risk that the concentration of NOx is above 111.5 and a 5% risk that the pollution level is above 134.1. If both policies are in force there is a 90% probability that the pollution level is lower than 104.0 and a 95% probability that it is under 125.5. Likewise, in the case of PM10, if no policy is in place, there is a 10% risk that the level of concentration is above 58.0 and a 5% risk that it is above 65.8, whereas if both policies are in force, there is a 10% risk that the level is greater than 57.0 and a 5% risk that the PM10 concentration is above 62.2.
Table 4 shows the estimated parameters associated with the policy variables for different confidence levels in the quantile regression estimation.
Table 4: Estimated coefficients of both policies on the quantiles of the NOx and PM10 pollutant distributions. Significance (p-value) levels are given in brackets (n=sample
size). NOx (n=9159) PM10 (n=1910) 80 km/h
speed limit Variable speed 80 km/h
speed limit Variable speed
0.05 2.847 (0.056) 1.125 (0.259) 3.201* (0.027) -8.892** (0.000)0.10 1.760 (0.265) -1.134 (0.254) 3.119 (0.070) -9.124** (0.000)0.25 0.567 (0.713) -4.203** (0.006) 2.335 (0.181) -10.085** (0.000)0.50 1.249 (0.495) -9.042** (0.000) 1.945 (0.197) -4.022** (0.000)0.75 3.748 (0.080) -17.277** (0.000) 1.714 (0.189) -3.009* (0.011)0.90 6.408* (0.016) -16.168** (0.000) 1.813 (0.190) -4.292** (0.000)0.95 4.568 (0.249) -21.258** (0.000) 2.101 (0.139) -2.307 (0.062)
Quantile regression coefficients control for traffic, temperature, relative humidity, precipitation, wind speed, atmospheric pressure, Sahara desert dust and fire. * Significant at 5% and ** significant at 1% levels
The results indicate that while the 80 km/h speed limit does not improve NOx air quality the variable speed system clearly does. A fixed 80 km/h speed system is not significantly effective in the majority of the quartiles and, in some case, the policy effect
13
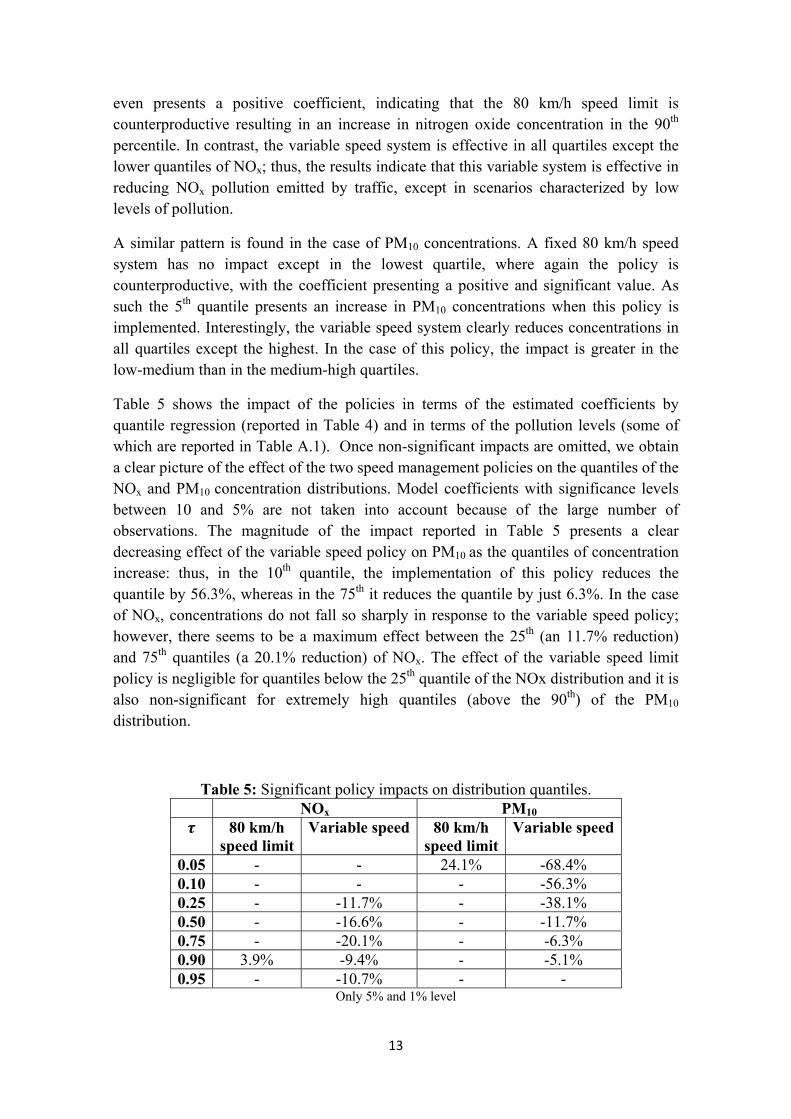
even presents a positive coefficient, indicating that the 80 km/h speed limit is counterproductive resulting in an increase in nitrogen oxide concentration in the 90th percentile. In contrast, the variable speed system is effective in all quartiles except the lower quantiles of NOx; thus, the results indicate that this variable system is effective in reducing NOx pollution emitted by traffic, except in scenarios characterized by low levels of pollution.
A similar pattern is found in the case of PM10 concentrations. A fixed 80 km/h speed system has no impact except in the lowest quartile, where again the policy is counterproductive, with the coefficient presenting a positive and significant value. As such the 5th quantile presents an increase in PM10 concentrations when this policy is implemented. Interestingly, the variable speed system clearly reduces concentrations in all quartiles except the highest. In the case of this policy, the impact is greater in the low-medium than in the medium-high quartiles.
Table 5 shows the impact of the policies in terms of the estimated coefficients by quantile regression (reported in Table 4) and in terms of the pollution levels (some of which are reported in Table A.1). Once non-significant impacts are omitted, we obtain a clear picture of the effect of the two speed management policies on the quantiles of the NOx and PM10 concentration distributions. Model coefficients with significance levels between 10 and 5% are not taken into account because of the large number of observations. The magnitude of the impact reported in Table 5 presents a clear decreasing effect of the variable speed policy on PM10 as the quantiles of concentration increase: thus, in the 10th quantile, the implementation of this policy reduces the quantile by 56.3%, whereas in the 75th it reduces the quantile by just 6.3%. In the case of NOx, concentrations do not fall so sharply in response to the variable speed policy; however, there seems to be a maximum effect between the 25th (an 11.7% reduction)
and 75th quantiles (a 20.1% reduction) of NOx. The effect of the variable speed limit policy is negligible for quantiles below the 25th quantile of the NOx distribution and it is also non-significant for extremely high quantiles (above the 90th) of the PM10 distribution.
Table 5: Significant policy impacts on distribution quantiles. NOx PM10
80 km/h speed limit
Variable speed 80 km/h speed limit
Variable speed
0.05 - - 24.1% -68.4% 0.10 - - - -56.3% 0.25 - -11.7% - -38.1% 0.50 - -16.6% - -11.7% 0.75 - -20.1% - -6.3% 0.90 3.9% -9.4% - -5.1% 0.95 - -10.7% - -
Only 5% and 1% level
14
This abatement of pollutant levels as concentrations increase can be attributed to two possible causes: the origin of the pollutants and limitations on the impact of the policies. The origin of NOx is primarily anthropogenic, with vehicle emissions constituting the main source. However, in the case of PM10, there is a non-negligible natural origin, with concentrations being heavily influenced by Sahara desert dust and coastal salt episodes that increase the presence of particulate matter in the urban air.
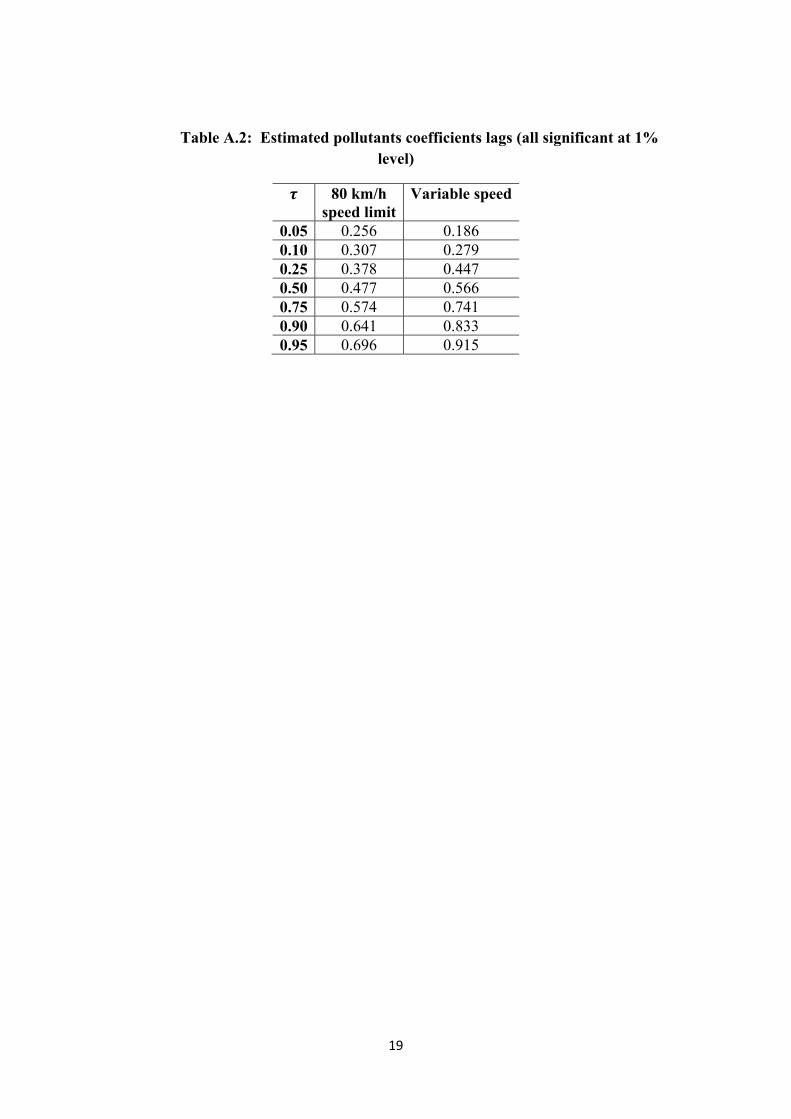
The pollutant lag coefficients for all regressions are significant at the 1% level (Table A.2). Thus, in the 1st quantile, 25.6% of NOx concentration can be explained by the previous day’s concentration, while in the case of PM10 this figure is 18.6%. As concentrations increase so does the pollutant lag effect, reaching 69.6% in the last NOx quantile and 91.5% in the last PM10 quantile. This underscores the fact that in highly polluted environments, the next day’s pollutant concentrations are always heavily influenced by the presents day’s levels, leaving little margin for other factors, such as active policies, to have any influence. Thus, while speed management policies may or may not have an impact, their effect will always be limited to some extent by conditions on the previous day.
Given the possible interaction of the two policies, we opted to analyse their effects separately. However, in practice, it is only possible to examine those attributed to the fixed speed limit in isolation, because the variable speed limit policy coincides with this earlier policy in both time and space. To identify the separate impact of the fixed speed limit, we undertook the same analysis but limited to the period 2006 to 2008 (i.e., before the introduction of the variable speed limit policy). We found that for the seven quantiles analysed and for both pollutants, a positive and significant effect was only recorded in the 90th NOx quantile (at the 5% significance level). This confirms our previous finding that the 80 km/h speed limit has no significant effect on the quantiles of the distribution of pollutants. As a result, the distribution does not change its shape significantly.
Our results have a number of interesting implications for policymakers. First and foremost, they indicate that policy impact will not necessarily be greater during high pollution episodes, which is important, as politicians might be tempted to implement certain policies only during such episodes. Moreover, our results show that policy impacts on pollution concentrations do not always decrease as pollution levels rise. Second, we present convincing empirical evidence in favour of implementing a variable speed limit, regardless of the severity of the pollution scenario (be it high or low) and of the type of pollutant. The only situation in which the policy fails to have a substantial effect is during very extreme PM10 pollution episodes. Finally, reducing the maximum speed limit of 80 km/h does not result in improved air quality in any scenario or for either of the pollutants considered here. More strikingly, in some cases, increased pollution concentrations are found. For example, in the case of highly contaminated NOx environments and slightly polluted PM10 environments, the fixed speed limit is detrimental.

15
7. Conclusion
This paper has analysed the effects of reducing a maximum speed limit to a fixed threshold (from 120 or 100 km/h to 80 km/h) on roads accessing the city of Barcelona and the impact of a smart speed system (of variable speeds) on some of the motorways in the metropolitan area. We have specifically examined the impact on mean levels of NOx and PM10 in the air. In contrast to most previous studies, we have also studied pollutant abatement during different pollution scenarios, specifically during low and high pollution episodes.
We show that the shape of the pollution concentration distribution changes depending on the speed management policy implemented. Furthermore, we find that the risk of extreme NOx pollution is considerably reduced when a variable speed policy is in force. We have used a fixed effect quantile regression model for an unbalanced data panel that allows us to isolate the policy effects in the different quantiles and we conclude that these effects depend on the pollution level and on the type of pollutant.
Our results confirm that a variable speed system, rather than a policy that reduces the maximum speed limit to 80 km/h, abates NOx and PM10 concentrations. This abatement is recorded in most scenarios, but the impact of the policy is heavily dependent on the initial pollution level. A variable speed limit is particularly recommended when nitrogen oxide concentrations are high and when particulate matter concentrations are low (that is, when the pollution is attributable to non weather-related sources). By way of a general rule, a variable speed limit has a substantial effect in reducing the risk of nitrogen oxide pollution above the pollutant’s first quartile and that of particulate matter pollution below the pollutant’s third quartile.
Acknowledgments: This work was supported by the Spanish Government under the projects ECO2012-38004 and ECO2013-48326-C2-1-P; the Catalan Government under project SGR2014-325 and the ICREA-Academia program of the Catalan Government.

16
References
Alemany, R., Bolancé, M., Guillén, M., 2013. A nonparametric approach to calculating value-at-risk, Insurance: Mathematics and Economics, 52, 255-262.
Baldasano, J., Gonçalves, M., Soret, A., Jimenez-Guerrero, P., 2010. Air pollution impacts of speed limitation measures in large cities: The need for improving traffic data in a metropolitan area. Atmospheric Environment, 44, 2997-3006.
Bel, G., Rosell, J., 2013. Effects of the 80 km/h and variable speed limit on air pollution in the metropolitan area of Barcelona. Transportation Research Part D: Transport and Environment, 23, 90-97.
Bolancé, C., 2010. Optimal inverse Beta (3,3) Transformation in kernel density estimation, SORT - Statistics and Operations Research Transactions, 34, 223-238.
Bolancé, C. Guillén, M., Nielsen, J.P., 2008. Inverse Beta transformation in kernel density estimation, Statistics & Probability Letters, 78, 1757-1764.
Dijkema, M., van der Zee, S., Brunekreef, B., van Strien, R., 2008. Air quality effects of an urban highway speed limit reduction. Atmospheric Environment, 42, 9098-9105.
Gonçalves, M., Jiménez-Guerrero, P., López, E., Baldasano, J., 2008. Air quality models sensitivity to on-road traffic speed representation: Effects on air quality of 80 km/h speed limit in the Barcelona Metropolitan area. Atmospheric Environment, 36, 8389-8402.
Hegyi, A., De Schutter, B., Hellendoorn, J., 2005. Optimal Coordination of Variable Speed Limits to Supress Shock Waves. IEEE Transactions on Intelligent Transportation Systems, 6, 102-112.
Int Panis, L., Beckx, C., Broekx, S., De Vlieger, I., Schrooten, L., Degraeuwe, B., Pelkmans, L., 2011. PM, NOx and CO2 emission reductions from speed management policies in Europe. Transport Policy, 18, 32-37.
Int Panis, L., Broekx, S., Liu, R., 2006. Modelling instantaneous traffic emission and the influence of traffic speed limits, Science of the Total Environment, 371, 270-285.
Keller, J., Andreani-Aksoyoglu, S., Tinguely, M., Flemming, J., Heldstab, J., Keller, M., Zbinden, R., Prevot, A., 2008. The impact of reducing the maximum speed límit on motorways in Switzerland to 80 km/h on emissions and peak ozone. Environmental Modelling & Software, 23, 322-332.
Keuken, M.P., Jonkers, S., Wilmink, I.R., Wesseling, J., 2010. Reduced NOx and PM10 emissions on urban motorways in The Netherlands by 80 km/h speed management. Science of the Total Environment, 408, 2517–2526.
Koenker, R., 1984. A note on L-estimators for linear models, Statistics & Probability Letters, 2, 323-325.
Koenker, R., 2004. Quantile regression for longitudinal data, Journal of Multivariate Analysis, 91, 74-89.
Koenker, R., Bassett, G., 1978. Regression quantiles, Econometrica, 46, 33-50.
Koenker, R., Ng, P., 2003. SparseM: A sparse linear algebra Package for R, Journal of Statistical Software, 8.

17
LAT, 2006. Emissions Inventory Guidebook. Laboratory of Applied Thermodynamics (LAT), 2006. Report B710-1, Thessaloniki, Greece.
Madireddy, M. De Coensel, B., Can, A., Degraeuwe, B., Beusen, B., De Vlieger, I., Botteldooren, D., 2011. Assessment of the impact of speed limit reduction and traffic signal coordination on vehicle emissions using an integrated approach. Transportation Research Part D: Transport and Environment, 16, 504-508.
Papageorgiou, M., Kosmatopoulos, E., Papamichail, I., 2008. Effects of Variable Speed Limits on Motorway Traffic Flow. Transportation Research Record: Journal of the Transportation Research Board, 2047, 37-48.
Percoco, M., 2013. Is road pricing effective in abating pollution? Evidence from Milan. Transportation Research Part D: Transport and Environment, 25, 112-118.
Querol, X., Alastuey, A., Rodríguez, S., Plana, F., Ruiz, C.,Cots, N., Massagué, G., Puig, O., 2001. PM10 and PM2.5 source apportionment in the Barcelona Metropolitan area, Catalonia, Spain. Atmospheric Environment, 35, 6407-6419.

18
Appendix
Table A.1: Pollutants average concentration per years and areas for 10th, 50th and 90th percentiles.
80 km/h speed limit zone
NOx (µg/m3) PM10 (µg/m3) 80 zone Outside 80 zone 80 zone Outside 80 zone
10th 50th 90th 10th 50th 90th 10th 50th 90th 10th 50th 90th
2006 17.0 53.8 171.3 18.9 54.4 165.9 21.8 34.6 74.5 16.2 34.3 81.9
2007 18.9 54.0 164.9 18.7 54.4 174.3 18.9 34.6 78.6 17.5 34.6 80.6
2008 18.7 54.4 160.9 16.8 54.4 165.2 16.2 34.3 80.4 16.2 34.4 77.2
2009 15.4 54.2 162.5 16.6 54.3 165.2 15.8 34.5 73.5 15.2 34.5 70.1
2010 16.5 54.1 155.1 18.3 54.2 161.4 16.0 34.3 75.8 16.0 34.2 75.7
Variable speed limit zone
NOx (µg/m3) PM10 (µg/m3) 10th 50th 90th 10th 50th 90th
2006 14.9 54.3 169.5 16.2 34.4 85.2
2007 14.8 54.3 170.5 16.2 34.4 84.8
2008 14.8 54.4 171.4 16.3 34.3 84.9
2009 14.9 54.2 170.8 16.0 34.4 85.4
2010 14.8 54.3 170.8 16.2 34.4 85.4
19
Table A.2: Estimated pollutants coefficients lags (all significant at 1% level)
80 km/h speed limit
Variable speed
0.05 0.256 0.186 0.10 0.307 0.279 0.25 0.378 0.447 0.50 0.477 0.566 0.75 0.574 0.741 0.90 0.641 0.833 0.95 0.696 0.915
SÈRIE DE DOCUMENTS DE TREBALL DE LA XREAP
2006 CREAP2006-01 Matas, A. (GEAP); Raymond, J.Ll. (GEAP) "Economic development and changes in car ownership patterns" (Juny 2006) CREAP2006-02 Trillas, F. (IEB); Montolio, D. (IEB); Duch, N. (IEB) "Productive efficiency and regulatory reform: The case of Vehicle Inspection Services" (Setembre 2006) CREAP2006-03 Bel, G. (PPRE-IREA); Fageda, X. (PPRE-IREA) "Factors explaining local privatization: A meta-regression analysis" (Octubre 2006) CREAP2006-04 Fernàndez-Villadangos, L. (PPRE-IREA) "Are two-part tariffs efficient when consumers plan ahead?: An empirical study" (Octubre 2006) CREAP2006-05 Artís, M. (AQR-IREA); Ramos, R. (AQR-IREA); Suriñach, J. (AQR-IREA) "Job losses, outsourcing and relocation: Empirical evidence using microdata" (Octubre 2006) CREAP2006-06 Alcañiz, M. (RISC-IREA); Costa, A.; Guillén, M. (RISC-IREA); Luna, C.; Rovira, C. "Calculation of the variance in surveys of the economic climate” (Novembre 2006) CREAP2006-07 Albalate, D. (PPRE-IREA) "Lowering blood alcohol content levels to save lives: The European Experience” (Desembre 2006) CREAP2006-08 Garrido, A. (IEB); Arqué, P. (IEB) “The choice of banking firm: Are the interest rate a significant criteria?” (Desembre 2006) CREAP2006-09 Segarra, A. (GRIT); Teruel-Carrizosa, M. (GRIT) "Productivity growth and competition in spanish manufacturing firms: What has happened in recent years?” (Desembre 2006) CREAP2006-10 Andonova, V.; Díaz-Serrano, Luis. (CREB) "Political institutions and the development of telecommunications” (Desembre 2006) CREAP2006-11 Raymond, J.L.(GEAP); Roig, J.L.. (GEAP) "Capital humano: un análisis comparativo Catalunya-España” (Desembre 2006) CREAP2006-12 Rodríguez, M.(CREB); Stoyanova, A. (CREB) "Changes in the demand for private medical insurance following a shift in tax incentives” (Desembre 2006) CREAP2006-13 Royuela, V. (AQR-IREA); Lambiri, D.; Biagi, B. "Economía urbana y calidad de vida. Una revisión del estado del conocimiento en España” (Desembre 2006)

SÈRIE DE DOCUMENTS DE TREBALL DE LA XREAP
CREAP2006-14 Camarero, M.; Carrion-i-Silvestre, J.LL. (AQR-IREA).;Tamarit, C. "New evidence of the real interest rate parity for OECD countries using panel unit root tests with breaks” (Desembre 2006) CREAP2006-15 Karanassou, M.; Sala, H. (GEAP).;Snower , D. J. "The macroeconomics of the labor market: Three fundamental views” (Desembre 2006) 2007 XREAP2007-01 Castany, L (AQR-IREA); López-Bazo, E. (AQR-IREA).;Moreno , R. (AQR-IREA) "Decomposing differences in total factor productivity across firm size” (Març 2007) XREAP2007-02 Raymond, J. Ll. (GEAP); Roig, J. Ll. (GEAP) “Una propuesta de evaluación de las externalidades de capital humano en la empresa" (Abril 2007) XREAP2007-03 Durán, J. M. (IEB); Esteller, A. (IEB) “An empirical analysis of wealth taxation: Equity vs. Tax compliance” (Juny 2007) XREAP2007-04 Matas, A. (GEAP); Raymond, J.Ll. (GEAP) “Cross-section data, disequilibrium situations and estimated coefficients: evidence from car ownership demand” (Juny 2007) XREAP2007-05 Jofre-Montseny, J. (IEB); Solé-Ollé, A. (IEB) “Tax differentials and agglomeration economies in intraregional firm location” (Juny 2007) XREAP2007-06 Álvarez-Albelo, C. (CREB); Hernández-Martín, R. “Explaining high economic growth in small tourism countries with a dynamic general equilibrium model” (Juliol 2007) XREAP2007-07 Duch, N. (IEB); Montolio, D. (IEB); Mediavilla, M. “Evaluating the impact of public subsidies on a firm’s performance: a quasi-experimental approach” (Juliol 2007) XREAP2007-08 Segarra-Blasco, A. (GRIT) “Innovation sources and productivity: a quantile regression analysis” (Octubre 2007) XREAP2007-09 Albalate, D. (PPRE-IREA) “Shifting death to their Alternatives: The case of Toll Motorways” (Octubre 2007) XREAP2007-10 Segarra-Blasco, A. (GRIT); Garcia-Quevedo, J. (IEB); Teruel-Carrizosa, M. (GRIT) “Barriers to innovation and public policy in catalonia” (Novembre 2007) XREAP2007-11 Bel, G. (PPRE-IREA); Foote, J. “Comparison of recent toll road concession transactions in the United States and France” (Novembre 2007)
SÈRIE DE DOCUMENTS DE TREBALL DE LA XREAP
XREAP2007-12 Segarra-Blasco, A. (GRIT); “Innovation, R&D spillovers and productivity: the role of knowledge-intensive services” (Novembre 2007) XREAP2007-13 Bermúdez Morata, Ll. (RFA-IREA); Guillén Estany, M. (RFA-IREA), Solé Auró, A. (RFA-IREA) “Impacto de la inmigración sobre la esperanza de vida en salud y en discapacidad de la población española” (Novembre 2007) XREAP2007-14 Calaeys, P. (AQR-IREA); Ramos, R. (AQR-IREA), Suriñach, J. (AQR-IREA) “Fiscal sustainability across government tiers” (Desembre 2007) XREAP2007-15 Sánchez Hugalbe, A. (IEB) “Influencia de la inmigración en la elección escolar” (Desembre 2007) 2008 XREAP2008-01 Durán Weitkamp, C. (GRIT); Martín Bofarull, M. (GRIT) ; Pablo Martí, F. “Economic effects of road accessibility in the Pyrenees: User perspective” (Gener 2008) XREAP2008-02 Díaz-Serrano, L.; Stoyanova, A. P. (CREB) “The Causal Relationship between Individual’s Choice Behavior and Self-Reported Satisfaction: the Case of Residential Mobility in the EU” (Març 2008) XREAP2008-03 Matas, A. (GEAP); Raymond, J. L. (GEAP); Roig, J. L. (GEAP) “Car ownership and access to jobs in Spain” (Abril 2008) XREAP2008-04 Bel, G. (PPRE-IREA) ; Fageda, X. (PPRE-IREA) “Privatization and competition in the delivery of local services: An empirical examination of the dual market hypothesis” (Abril 2008) XREAP2008-05 Matas, A. (GEAP); Raymond, J. L. (GEAP); Roig, J. L. (GEAP) “Job accessibility and employment probability” (Maig 2008) XREAP2008-06 Basher, S. A.; Carrión, J. Ll. (AQR-IREA) Deconstructing Shocks and Persistence in OECD Real Exchange Rates (Juny 2008) XREAP2008-07 Sanromá, E. (IEB); Ramos, R. (AQR-IREA); Simón, H. Portabilidad del capital humano y asimilación de los inmigrantes. Evidencia para España (Juliol 2008) XREAP2008-08 Basher, S. A.; Carrión, J. Ll. (AQR-IREA) Price level convergence, purchasing power parity and multiple structural breaks: An application to US cities (Juliol 2008) XREAP2008-09 Bermúdez, Ll. (RFA-IREA) A priori ratemaking using bivariate poisson regression models (Juliol 2008)

SÈRIE DE DOCUMENTS DE TREBALL DE LA XREAP
XREAP2008-10 Solé-Ollé, A. (IEB), Hortas Rico, M. (IEB) Does urban sprawl increase the costs of providing local public services? Evidence from Spanish municipalities (Novembre 2008) XREAP2008-11 Teruel-Carrizosa, M. (GRIT), Segarra-Blasco, A. (GRIT) Immigration and Firm Growth: Evidence from Spanish cities (Novembre 2008) XREAP2008-12 Duch-Brown, N. (IEB), García-Quevedo, J. (IEB), Montolio, D. (IEB) Assessing the assignation of public subsidies: Do the experts choose the most efficient R&D projects? (Novembre 2008) XREAP2008-13 Bilotkach, V., Fageda, X. (PPRE-IREA), Flores-Fillol, R. Scheduled service versus personal transportation: the role of distance (Desembre 2008) XREAP2008-14 Albalate, D. (PPRE-IREA), Gel, G. (PPRE-IREA) Tourism and urban transport: Holding demand pressure under supply constraints (Desembre 2008) 2009 XREAP2009-01 Calonge, S. (CREB); Tejada, O. “A theoretical and practical study on linear reforms of dual taxes” (Febrer 2009) XREAP2009-02 Albalate, D. (PPRE-IREA); Fernández-Villadangos, L. (PPRE-IREA) “Exploring Determinants of Urban Motorcycle Accident Severity: The Case of Barcelona” (Març 2009) XREAP2009-03 Borrell, J. R. (PPRE-IREA); Fernández-Villadangos, L. (PPRE-IREA) “Assessing excess profits from different entry regulations” (Abril 2009) XREAP2009-04 Sanromá, E. (IEB); Ramos, R. (AQR-IREA), Simon, H. “Los salarios de los inmigrantes en el mercado de trabajo español. ¿Importa el origen del capital humano?” (Abril 2009) XREAP2009-05 Jiménez, J. L.; Perdiguero, J. (PPRE-IREA) “(No)competition in the Spanish retailing gasoline market: a variance filter approach” (Maig 2009) XREAP2009-06 Álvarez-Albelo,C. D. (CREB), Manresa, A. (CREB), Pigem-Vigo, M. (CREB) “International trade as the sole engine of growth for an economy” (Juny 2009) XREAP2009-07 Callejón, M. (PPRE-IREA), Ortún V, M. “The Black Box of Business Dynamics” (Setembre 2009) XREAP2009-08 Lucena, A. (CREB) “The antecedents and innovation consequences of organizational search: empirical evidence for Spain” (Octubre 2009)
SÈRIE DE DOCUMENTS DE TREBALL DE LA XREAP
XREAP2009-09 Domènech Campmajó, L. (PPRE-IREA) “Competition between TV Platforms” (Octubre 2009) XREAP2009-10 Solé-Auró, A. (RFA-IREA),Guillén, M. (RFA-IREA), Crimmins, E. M. “Health care utilization among immigrants and native-born populations in 11 European countries. Results from the Survey of Health, Ageing and Retirement in Europe” (Octubre 2009) XREAP2009-11 Segarra, A. (GRIT), Teruel, M. (GRIT) “Small firms, growth and financial constraints” (Octubre 2009) XREAP2009-12 Matas, A. (GEAP), Raymond, J.Ll. (GEAP), Ruiz, A. (GEAP) “Traffic forecasts under uncertainty and capacity constraints” (Novembre 2009) XREAP2009-13 Sole-Ollé, A. (IEB) “Inter-regional redistribution through infrastructure investment: tactical or programmatic?” (Novembre 2009) XREAP2009-14 Del Barrio-Castro, T., García-Quevedo, J. (IEB) “The determinants of university patenting: Do incentives matter?” (Novembre 2009) XREAP2009-15 Ramos, R. (AQR-IREA), Suriñach, J. (AQR-IREA), Artís, M. (AQR-IREA) “Human capital spillovers, productivity and regional convergence in Spain” (Novembre 2009) XREAP2009-16 Álvarez-Albelo, C. D. (CREB), Hernández-Martín, R. “The commons and anti-commons problems in the tourism economy” (Desembre 2009) 2010 XREAP2010-01 García-López, M. A. (GEAP) “The Accessibility City. When Transport Infrastructure Matters in Urban Spatial Structure” (Febrer 2010) XREAP2010-02 García-Quevedo, J. (IEB), Mas-Verdú, F. (IEB), Polo-Otero, J. (IEB) “Which firms want PhDs? The effect of the university-industry relationship on the PhD labour market” (Març 2010) XREAP2010-03 Pitt, D., Guillén, M. (RFA-IREA) “An introduction to parametric and non-parametric models for bivariate positive insurance claim severity distributions” (Març 2010) XREAP2010-04 Bermúdez, Ll. (RFA-IREA), Karlis, D. “Modelling dependence in a ratemaking procedure with multivariate Poisson regression models” (Abril 2010) XREAP2010-05 Di Paolo, A. (IEB) “Parental education and family characteristics: educational opportunities across cohorts in Italy and Spain” (Maig 2010)
SÈRIE DE DOCUMENTS DE TREBALL DE LA XREAP
XREAP2010-06 Simón, H. (IEB), Ramos, R. (AQR-IREA), Sanromá, E. (IEB) “Movilidad ocupacional de los inmigrantes en una economía de bajas cualificaciones. El caso de España” (Juny 2010) XREAP2010-07 Di Paolo, A. (GEAP & IEB), Raymond, J. Ll. (GEAP & IEB) “Language knowledge and earnings in Catalonia” (Juliol 2010) XREAP2010-08 Bolancé, C. (RFA-IREA), Alemany, R. (RFA-IREA), Guillén, M. (RFA-IREA) “Prediction of the economic cost of individual long-term care in the Spanish population” (Setembre 2010) XREAP2010-09 Di Paolo, A. (GEAP & IEB) “Knowledge of catalan, public/private sector choice and earnings: Evidence from a double sample selection model” (Setembre 2010) XREAP2010-10 Coad, A., Segarra, A. (GRIT), Teruel, M. (GRIT) “Like milk or wine: Does firm performance improve with age?” (Setembre 2010) XREAP2010-11 Di Paolo, A. (GEAP & IEB), Raymond, J. Ll. (GEAP & IEB), Calero, J. (IEB) “Exploring educational mobility in Europe” (Octubre 2010) XREAP2010-12 Borrell, A. (GiM-IREA), Fernández-Villadangos, L. (GiM-IREA) “Clustering or scattering: the underlying reason for regulating distance among retail outlets” (Desembre 2010) XREAP2010-13 Di Paolo, A. (GEAP & IEB) “School composition effects in Spain” (Desembre 2010) XREAP2010-14 Fageda, X. (GiM-IREA), Flores-Fillol, R. “Technology, Business Models and Network Structure in the Airline Industry” (Desembre 2010) XREAP2010-15 Albalate, D. (GiM-IREA), Bel, G. (GiM-IREA), Fageda, X. (GiM-IREA) “Is it Redistribution or Centralization? On the Determinants of Government Investment in Infrastructure” (Desembre 2010) XREAP2010-16 Oppedisano, V., Turati, G. “What are the causes of educational inequalities and of their evolution over time in Europe? Evidence from PISA” (Desembre 2010) XREAP2010-17 Canova, L., Vaglio, A. “Why do educated mothers matter? A model of parental help” (Desembre 2010) 2011 XREAP2011-01 Fageda, X. (GiM-IREA), Perdiguero, J. (GiM-IREA) “An empirical analysis of a merger between a network and low-cost airlines” (Maig 2011)

SÈRIE DE DOCUMENTS DE TREBALL DE LA XREAP
XREAP2011-02 Moreno-Torres, I. (ACCO, CRES & GiM-IREA) “What if there was a stronger pharmaceutical price competition in Spain? When regulation has a similar effect to collusion” (Maig 2011) XREAP2011-03 Miguélez, E. (AQR-IREA); Gómez-Miguélez, I. “Singling out individual inventors from patent data” (Maig 2011) XREAP2011-04 Moreno-Torres, I. (ACCO, CRES & GiM-IREA) “Generic drugs in Spain: price competition vs. moral hazard” (Maig 2011) XREAP2011-05 Nieto, S. (AQR-IREA), Ramos, R. (AQR-IREA) “¿Afecta la sobreeducación de los padres al rendimiento académico de sus hijos?” (Maig 2011) XREAP2011-06 Pitt, D., Guillén, M. (RFA-IREA), Bolancé, C. (RFA-IREA) “Estimation of Parametric and Nonparametric Models for Univariate Claim Severity Distributions - an approach using R” (Juny 2011) XREAP2011-07 Guillén, M. (RFA-IREA), Comas-Herrera, A. “How much risk is mitigated by LTC Insurance? A case study of the public system in Spain” (Juny 2011) XREAP2011-08 Ayuso, M. (RFA-IREA), Guillén, M. (RFA-IREA), Bolancé, C. (RFA-IREA) “Loss risk through fraud in car insurance” (Juny 2011) XREAP2011-09 Duch-Brown, N. (IEB), García-Quevedo, J. (IEB), Montolio, D. (IEB) “The link between public support and private R&D effort: What is the optimal subsidy?” (Juny 2011) XREAP2011-10 Bermúdez, Ll. (RFA-IREA), Karlis, D. “Mixture of bivariate Poisson regression models with an application to insurance” (Juliol 2011) XREAP2011-11 Varela-Irimia, X-L. (GRIT) “Age effects, unobserved characteristics and hedonic price indexes: The Spanish car market in the 1990s” (Agost 2011) XREAP2011-12 Bermúdez, Ll. (RFA-IREA), Ferri, A. (RFA-IREA), Guillén, M. (RFA-IREA) “A correlation sensitivity analysis of non-life underwriting risk in solvency capital requirement estimation” (Setembre 2011) XREAP2011-13 Guillén, M. (RFA-IREA), Pérez-Marín, A. (RFA-IREA), Alcañiz, M. (RFA-IREA) “A logistic regression approach to estimating customer profit loss due to lapses in insurance” (Octubre 2011) XREAP2011-14 Jiménez, J. L., Perdiguero, J. (GiM-IREA), García, C. “Evaluation of subsidies programs to sell green cars: Impact on prices, quantities and efficiency” (Octubre 2011)
SÈRIE DE DOCUMENTS DE TREBALL DE LA XREAP
XREAP2011-15 Arespa, M. (CREB) “A New Open Economy Macroeconomic Model with Endogenous Portfolio Diversification and Firms Entry” (Octubre 2011) XREAP2011-16 Matas, A. (GEAP), Raymond, J. L. (GEAP), Roig, J.L. (GEAP) “The impact of agglomeration effects and accessibility on wages” (Novembre 2011) XREAP2011-17 Segarra, A. (GRIT) “R&D cooperation between Spanish firms and scientific partners: what is the role of tertiary education?” (Novembre 2011) XREAP2011-18 García-Pérez, J. I.; Hidalgo-Hidalgo, M.; Robles-Zurita, J. A. “Does grade retention affect achievement? Some evidence from PISA” (Novembre 2011) XREAP2011-19 Arespa, M. (CREB) “Macroeconomics of extensive margins: a simple model” (Novembre 2011) XREAP2011-20 García-Quevedo, J. (IEB), Pellegrino, G. (IEB), Vivarelli, M. “The determinants of YICs’ R&D activity” (Desembre 2011) XREAP2011-21 González-Val, R. (IEB), Olmo, J. “Growth in a Cross-Section of Cities: Location, Increasing Returns or Random Growth?” (Desembre 2011) XREAP2011-22 Gombau, V. (GRIT), Segarra, A. (GRIT) “The Innovation and Imitation Dichotomy in Spanish firms: do absorptive capacity and the technological frontier matter?” (Desembre 2011) 2012 XREAP2012-01 Borrell, J. R. (GiM-IREA), Jiménez, J. L., García, C. “Evaluating Antitrust Leniency Programs” (Gener 2012) XREAP2012-02 Ferri, A. (RFA-IREA), Guillén, M. (RFA-IREA), Bermúdez, Ll. (RFA-IREA) “Solvency capital estimation and risk measures” (Gener 2012) XREAP2012-03 Ferri, A. (RFA-IREA), Bermúdez, Ll. (RFA-IREA), Guillén, M. (RFA-IREA) “How to use the standard model with own data” (Febrer 2012) XREAP2012-04 Perdiguero, J. (GiM-IREA), Borrell, J.R. (GiM-IREA) “Driving competition in local gasoline markets” (Març 2012) XREAP2012-05 D’Amico, G., Guillen, M. (RFA-IREA), Manca, R. “Discrete time Non-homogeneous Semi-Markov Processes applied to Models for Disability Insurance” (Març 2012)
SÈRIE DE DOCUMENTS DE TREBALL DE LA XREAP
XREAP2012-06 Bové-Sans, M. A. (GRIT), Laguado-Ramírez, R. “Quantitative analysis of image factors in a cultural heritage tourist destination” (Abril 2012) XREAP2012-07 Tello, C. (AQR-IREA), Ramos, R. (AQR-IREA), Artís, M. (AQR-IREA) “Changes in wage structure in Mexico going beyond the mean: An analysis of differences in distribution, 1987-2008” (Maig 2012) XREAP2012-08 Jofre-Monseny, J. (IEB), Marín-López, R. (IEB), Viladecans-Marsal, E. (IEB) “What underlies localization and urbanization economies? Evidence from the location of new firms” (Maig 2012) XREAP2012-09 Muñiz, I. (GEAP), Calatayud, D., Dobaño, R. “Los límites de la compacidad urbana como instrumento a favor de la sostenibilidad. La hipótesis de la compensación en Barcelona medida a través de la huella ecológica de la movilidad y la vivienda” (Maig 2012) XREAP2012-10 Arqué-Castells, P. (GEAP), Mohnen, P. “Sunk costs, extensive R&D subsidies and permanent inducement effects” (Maig 2012) XREAP2012-11 Boj, E. (CREB), Delicado, P., Fortiana, J., Esteve, A., Caballé, A. “Local Distance-Based Generalized Linear Models using the dbstats package for R” (Maig 2012) XREAP2012-12 Royuela, V. (AQR-IREA) “What about people in European Regional Science?” (Maig 2012) XREAP2012-13 Osorio A. M. (RFA-IREA), Bolancé, C. (RFA-IREA), Madise, N. “Intermediary and structural determinants of early childhood health in Colombia: exploring the role of communities” (Juny 2012) XREAP2012-14 Miguelez. E. (AQR-IREA), Moreno, R. (AQR-IREA) “Do labour mobility and networks foster geographical knowledge diffusion? The case of European regions” (Juliol 2012) XREAP2012-15 Teixidó-Figueras, J. (GRIT), Duró, J. A. (GRIT) “Ecological Footprint Inequality: A methodological review and some results” (Setembre 2012) XREAP2012-16 Varela-Irimia, X-L. (GRIT) “Profitability, uncertainty and multi-product firm product proliferation: The Spanish car industry” (Setembre 2012) XREAP2012-17 Duró, J. A. (GRIT), Teixidó-Figueras, J. (GRIT) “Ecological Footprint Inequality across countries: the role of environment intensity, income and interaction effects” (Octubre 2012) XREAP2012-18 Manresa, A. (CREB), Sancho, F. “Leontief versus Ghosh: two faces of the same coin” (Octubre 2012)
SÈRIE DE DOCUMENTS DE TREBALL DE LA XREAP
XREAP2012-19 Alemany, R. (RFA-IREA), Bolancé, C. (RFA-IREA), Guillén, M. (RFA-IREA) “Nonparametric estimation of Value-at-Risk” (Octubre 2012) XREAP2012-20 Herrera-Idárraga, P. (AQR-IREA), López-Bazo, E. (AQR-IREA), Motellón, E. (AQR-IREA) “Informality and overeducation in the labor market of a developing country” (Novembre 2012) XREAP2012-21 Di Paolo, A. (AQR-IREA) “(Endogenous) occupational choices and job satisfaction among recent PhD recipients: evidence from Catalonia” (Desembre 2012) 2013 XREAP2013-01 Segarra, A. (GRIT), García-Quevedo, J. (IEB), Teruel, M. (GRIT) “Financial constraints and the failure of innovation projects” (Març 2013) XREAP2013-02 Osorio, A. M. (RFA-IREA), Bolancé, C. (RFA-IREA), Madise, N., Rathmann, K. “Social Determinants of Child Health in Colombia: Can Community Education Moderate the Effect of Family Characteristics?” (Març 2013) XREAP2013-03 Teixidó-Figueras, J. (GRIT), Duró, J. A. (GRIT) “The building blocks of international ecological footprint inequality: a regression-based decomposition” (Abril 2013) XREAP2013-04 Salcedo-Sanz, S., Carro-Calvo, L., Claramunt, M. (CREB), Castañer, A. (CREB), Marmol, M. (CREB) “An Analysis of Black-box Optimization Problems in Reinsurance: Evolutionary-based Approaches” (Maig 2013) XREAP2013-05 Alcañiz, M. (RFA), Guillén, M. (RFA), Sánchez-Moscona, D. (RFA), Santolino, M. (RFA), Llatje, O., Ramon, Ll. “Prevalence of alcohol-impaired drivers based on random breath tests in a roadside survey” (Juliol 2013) XREAP2013-06 Matas, A. (GEAP & IEB), Raymond, J. Ll. (GEAP & IEB), Roig, J. L. (GEAP) “How market access shapes human capital investment in a peripheral country” (Octubre 2013) XREAP2013-07 Di Paolo, A. (AQR-IREA), Tansel, A. “Returns to Foreign Language Skills in a Developing Country: The Case of Turkey” (Novembre 2013) XREAP2013-08 Fernández Gual, V. (GRIT), Segarra, A. (GRIT) “The Impact of Cooperation on R&D, Innovation andProductivity: an Analysis of Spanish Manufacturing and Services Firms” (Novembre 2013) XREAP2013-09 Bahraoui, Z. (RFA); Bolancé, C. (RFA); Pérez-Marín. A. M. (RFA) “Testing extreme value copulas to estimate the quantile” (Novembre 2013) 2014 XREAP2014-01 Solé-Auró, A. (RFA), Alcañiz, M. (RFA) “Are we living longer but less healthy? Trends in mortality and morbidity in Catalonia (Spain), 1994-2011” (Gener 2014)
SÈRIE DE DOCUMENTS DE TREBALL DE LA XREAP
XREAP2014-02 Teixidó-Figueres, J. (GRIT), Duro, J. A. (GRIT) “Spatial Polarization of the Ecological Footprint distribution” (Febrer 2014) XREAP2014-03 Cristobal-Cebolla, A.; Gil Lafuente, A. M. (RFA), Merigó Lindhal, J. M. (RFA) “La importancia del control de los costes de la no-calidad en la empresa” (Febrer 2014) XREAP2014-04 Castañer, A. (CREB); Claramunt, M.M. (CREB) “Optimal stop-loss reinsurance: a dependence analysis” (Abril 2014) XREAP2014-05 Di Paolo, A. (AQR-IREA); Matas, A. (GEAP); Raymond, J. Ll. (GEAP) “Job accessibility, employment and job-education mismatch in the metropolitan area of Barcelona” (Maig 2014) XREAP2014-06 Di Paolo, A. (AQR-IREA); Mañé, F. “Are we wasting our talent? Overqualification and overskilling among PhD graduates” (Juny 2014) XREAP2014-07 Segarra, A. (GRIT); Teruel, M. (GRIT); Bové, M. A. (GRIT) “A territorial approach to R&D subsidies: Empirical evidence for Catalonian firms” (Setembre 2014) XREAP2014-08 Ramos, R. (AQR-IREA); Sanromá, E. (IEB); Simón, H. “Public-private sector wage differentials by type of contract: evidence from Spain” (Octubre 2014) XREAP2014-09 Bel, G. (GiM-IREA); Bolancé, C. (Riskcenter-IREA); Guillén, M. (Riskcenter-IREA); Rosell, J. (GiM-IREA) “The environmental effects of changing speed limits: a quantile regression approach” (Desembre 2014)