Poverty Mapping in Rural Syria for Enhanced Targeting
16
Poverty Mapping in Rural Syria for Enhanced Targeting Judit A. Szonyi Eddy De Pauw Roberto La Rovere Aden Aw-Hassan Poster paper prepared for presentation at the International Association of Agricultural Economists Conference, Gold Coast, Australia, August 12-18, 2006 Copyright 2006 by: Judit Szonyi, Eddy De Pauw,Roberto La Roberto, Aden Aw-Hassan. All rights reserved. Readers may make verbatim copies of this document for non-commercial purposes by any means, provided that this copyright notice appears on all such copies.
-
Upload
independent -
Category
Documents
-
view
4 -
download
0
Transcript of Poverty Mapping in Rural Syria for Enhanced Targeting
Poverty Mapping in Rural Syria for Enhanced Targeting
Judit A. Szonyi Eddy De Pauw
Roberto La Rovere Aden Aw-Hassan
Poster paper prepared for presentation at the International Association of Agricultural Economists Conference,
Gold Coast, Australia, August 12-18, 2006
Copyright 2006 by: Judit Szonyi, Eddy De Pauw,Roberto La Roberto, Aden Aw-Hassan. All rights reserved. Readers may make verbatim copies of this
document for non-commercial purposes by any means, provided that this copyright notice appears on all such copies.
1
POVERTY MAPPING IN RURAL SYRIA FOR ENHANCED TARGETING
Szonyi Judit A.1, De Pauw Eddy
1, La Rovere Roberto
2, Aw-Hassan Aden
1 1Environmental Economist, International Centre for Agricultural Research in the Dry Areas
(ICARDA); [email protected]
2 International Centre for Maize and Wheat Improvement (CIMMYT), Mexico; previously at ICARDA
1. INTRODUCTION
Poverty mapping is becoming an increasingly important tool for identifying and targeting
the poor. Major international organizations involved in global efforts for poverty reduction,
and various CGIAR centers have been developing different approaches to poverty mapping in
recent years1. Some countries use poverty mapping, developed by using extensive household
surveys, to design policies aimed at reducing income disparities. Yet poverty mapping is a
costly exercise and many low-income countries lack the resources to carry out large surveys.
Poverty maps help in capturing the heterogeneity due to the presence of different economic
conditions and agro-ecologies within a country, identifying the geographic factors that
influence poverty, targeting interventions, and improving communication about poverty.
They can integrate biophysical data with socio-economic indicators to present a more
systematic and analytical picture of human welfare (Henninger and Snel, 2002). Policy-
making in various countries has been influenced by the use of poverty maps in the areas of
food security, health, education, and infrastructure planning, early warning and mitigation of
natural disasters, economic vulnerability, livelihood security, environment, and conflicts.
1.1 Mapping approaches to link rural poverty and natural resources
Sub-national poverty mapping approaches are diverse, ranging from participatory poverty
profiles to sophisticated econometric approaches, and are under continuous development.
Each approach has different data requirements, implementation costs, advantages and
1 Examples of different approaches and applications are: poverty maps for Mexico by CIMMYT, for Ecuador by
CIAT, for Malawi by IFPRI, for Kenya by ILRI, for Bangladesh by IRRI, etc. See: www.povertymap.net/
2
disadvantages. Various studies have been linking well-being, geographic and environmental
variables, and visual spatial analysis at the sub-national level. A number of rural poverty
studies have indicated correlation between rural poverty and access to physical resources
(owned land, water, animals, machinery) and agro-ecological variables (climate, soil, water
for irrigation) (Szonyi et al., 2005 for a full review). For instance, geographic location and
climate have large effects on income levels and growth through their effect on agricultural
productivity (Gallup and Sachs 1999); physical variables of water availability linked with
socio-economic variables can produce regional water poverty indexes that can be used in
poverty maps (Sullivan, 2002). As soil degradation is a determinant of poverty, GIS-based
environmental datasets can be integrated with socio-economic information to analyze the
interactions between poverty and environmental degradation (Osgood and Lipper, 2003).
Agro-ecological factors are thus likely to have a strong impact on income distribution and
poverty in rural areas, hence agro-ecological variables can be incorporated in the mapping of
the distribution of agricultural income. Since such variables can be mapped by using GIS and
spatial databases, and household surveys are available only in few and small geographic
areas, household income data can be extrapolated by using agro-ecological information.
1.2 The situation of poverty in Syria
Syria is a mid-size country with total land area of about 18.5 million hectares of which 13.7
are for agricultural purposes. Syria ranks relatively low in human development indicators
(UNDP, 2005), behind most of its neighboring countries. National-level indicators of human
welfare hide a complex picture of poverty and food insecurity at the local level, particularly
in rural areas. Poverty in Syria is poorly documented and statistical data is not readily
available, yet there is much circumstantial evidence corroborating a link between poverty and
the access to quality land and water resources. The country is mainly an agrarian economy
with limited industries and services. The total population is about 17 million, with a 3.2%
3
annual growth rate. The rural population is about 50% of total population (AOAD, 2001).
Most people living in rural areas depend directly or indirectly on agriculture. Their
livelihoods and food security depend on the natural resource base and on the highly variable
weather conditions. Although many find additional income by temporary or permanent off-
farm labor in other rural areas or often in urban areas, most rural people have limited access
to incomes from industrial production or services. Rural households who depend only on
livestock production have been identified to be among the most vulnerable (La Rovere et al.,
forthcoming); these face serious food insecurity and poverty as they depend on degraded
rangelands (steppe) and unreliable precipitation. A recent drought (1998-2000) had a severe
impact on many pastoralists living in steppe areas who had to sell off all their livestock.
Many of those have now joined the unemployed in the major cities. About 60% of
agricultural land is permanent pasture, mostly located in steppe areas that provide about 20%
of the total livestock feed. Poverty, however, is not confined to the drought-prone steppe
areas. In the more densely settled higher-potential areas of west and northwest Syria, land
shortage, as a result of population increase, also leads to migration to cities and higher
pressure on marginal lands. For instance, grazing puts pressure on communal areas, while
hillsides are cleared for olive trees, usually without proper soil conservation measures. Such
land uses deplete the natural resource capital and widen the welfare gap between the better
off, with enough capital for land development, and the poor, who are squeezed off the land.
1.3 Objectives of the study
Within the context of the social and ecological conditions described in the previous section,
the objective of the present study was to develop a poverty map of Syria. The aim of this
map, based on the spatial representation of income distribution from agricultural activities, is
to identify where the poor are located and define the hot-spots where poverty is determined
by the endowment in, and quality of, natural resources, and by population pressure.
4
2. MATERIALS AND METHODS
Natural resource poverty is one of the fundamental poverty issues in Syria. At the national
planning level it concerns the availability of quality land, water, soil, and topographic
resources in parts of the country, while at the household level it concerns the individual
household’s access to resources. The two levels are linked, since in areas with poor resource
basis, such as arid or rocky parts of the country, there are not many households with access to
quality land. On the other hand, in areas with a good natural resource base, many households
will not benefit of it either because of limiting property rights or because many people
depend on them. Additionally, in Syria natural resource poverty is strongly linked with the
need of parts of the rural population to use marginal lands, i.e. lands that are too dry for high
agricultural productivity or that have severe topographic (e.g. steep slopes) or soil limitations
(e.g. shallow soils). The total land unfit for agriculture is an indicator of agricultural resource
poverty. By defining an agricultural resource index (ARI) we quantified this kind of
agricultural resource poverty (see Annex 1). This index-based method considers all relevant
biophysical factors and allows consistent comparisons between different locations. The
method assesses the contribution of individual environmental factors towards agricultural
resource poverty, is scale-independent, and can be applied using currently available datasets.
While most CGIAR centers use ‘bottom-up’ approaches that extrapolated survey data at
larger spatial levels to develop poverty maps, this study uses a ‘top-down’ method to
disaggregate income from census sources to the pixel level based on agro-ecological data.
2.1 Assessing agricultural resource endowment
Agricultural resource poverty is a component of environmental poverty. Three components of
resource potential are assessed separately through thematic indices, by using a common scale:
(1) Climate Resource Index (CRI), for the climatic potential to produce biomass
(2) Soil Resource Index (SRI), for the proportion of the pixel without problematic soil types
5
(3) Topographic Resource Index (TRI), for the proportion of pixel without topographic limits
These thematic indices are combined as raster themes in GIS, with the same spatial scope and
resolution, into the ARI index (details in Szonyi et al. 2005). This is calculated as the lowest
of the indices CRI, SRI, and TRI. The ARI pattern in Syria is due to two main sources of
resource potential: the rainfall gradient from north to south and west to east, and the presence
of irrigated areas associated with the Orontes and Euphrates rivers and the presence of
groundwater aquifers. Areas with low ARI are associated with low rainfall (especially steppe
areas), the absence of sources of irrigation water, and the presence of mountain ranges.
2.2 Income distribution based on agricultural resource endowment
In order to match resource poverty indices with sub-national statistics, poverty index values
were aggregated to the lowest level of administrative units for which statistical information
was available (CBS, various years). These are the intersections of provinces with Agricultural
Stability Zones based on rainfall (MAAR, various years). These spatial units are named
‘Agricultural Sub-zones’. NAPC (2003) provided sub-regional production data for crops,
fruits, vegetables, and animal products at the level of agricultural sub-zones. Prices for
different agricultural products was obtained from different sources; for year 2000 they were
collected from the Agricultural Production Database of Syria (NAPC, 2003), FAOSTAT
(2000) and local market surveys. The NAPC price database provided prices for agricultural
commodities by province. FAOSTAT provided farm gate price based on national averages.
Farm gate prices are national average prices of individual commodities for all grades, kinds,
and varieties received by farmers, available at the provincial level. Prices for products not
included in the NAPC and FAO databases were collected from local surveys and a regional
wholesale market in Aleppo based on year 2000 data. The sum of all agricultural products
was multiplied by their wholesale value; this was consistent with the share of agriculture in
the national account, equivalent to about 25% of the GDP in year 2000 (NAPC, 2003).
6
Agricultural income is a function of prices and agricultural production, which itself
depends on resource endowment. Aggregate census data of agricultural sub-zones was
spatially disaggregated by the ARI index. Within each sub-zone the distribution of the
income coefficient followed the same pattern as the distribution of the ARI. In the allocation
of income to individual pixels from rainfed or irrigated agriculture, the ARI values were
weighted in accordance with the proportions of either rainfed or irrigated land in each pixel.
The income distribution of rainfed and irrigated agriculture, disaggregated according to
resource endowment, is calculated per pixel within each Sub-zone (Equations 1-3).
Differences in rainfed production are determined by diverse water availability, soil quality
and topography, accounted for by the ARI (rainfed Equation 3). The presence of irrigated
agriculture shows that there is no significant soil or topographic limitation. The ARI accounts
for production differences determined by climate limitations (irrigated Equation 3).
Equations 4, 5 show the disaggregated livestock income. MAAR provides the value of total
livestock production by provinces, very large spatial units that may contain much diversity in
terms of grazing value. For obtaining reasonable allocation coefficients of the total value per
pixel, a livestock distribution coefficient is introduced (Equation 5), based on estimates of
livestock proportionality by land use/land cover type as obtained from the land use/land cover
map of Syria (De Pauw et al., 2004). Income from sheep, goat and cattle includes sale of live
animals, meat, wool, milk and other dairy product. Income from chicken includes sales of
meat and eggs. In calculating livestock income, the primary income of live animal and milk
sale was taken into account with the added value of the fattening and dairy industry.
2.3 Per-capita income distribution from agriculture
Since the income from agricultural activities was introduced above on a pixel basis, the
representation of per-capita income distribution also requires that population density is
disaggregated from the lowest administrative level (nahia) to the pixel level. Population data
7
for nahia obtained from the latest census survey (CBS, 1994) was updated with annual
growth rates for rural areas in the different administrative regions (CBS, several years). The
adjustment of population density to the pixel level has been done by using estimated
population density coefficients (Equation 6) obtained from a mapping procedure based on
identified ‘agricultural regions’ (Szonyi et. al, 2005). The characterization of agricultural
regions based on settlement patterns provided the population density figures. The population
density in the nahia was corrected by an adjustment factor based on the agricultural regions.
3. RESULTS
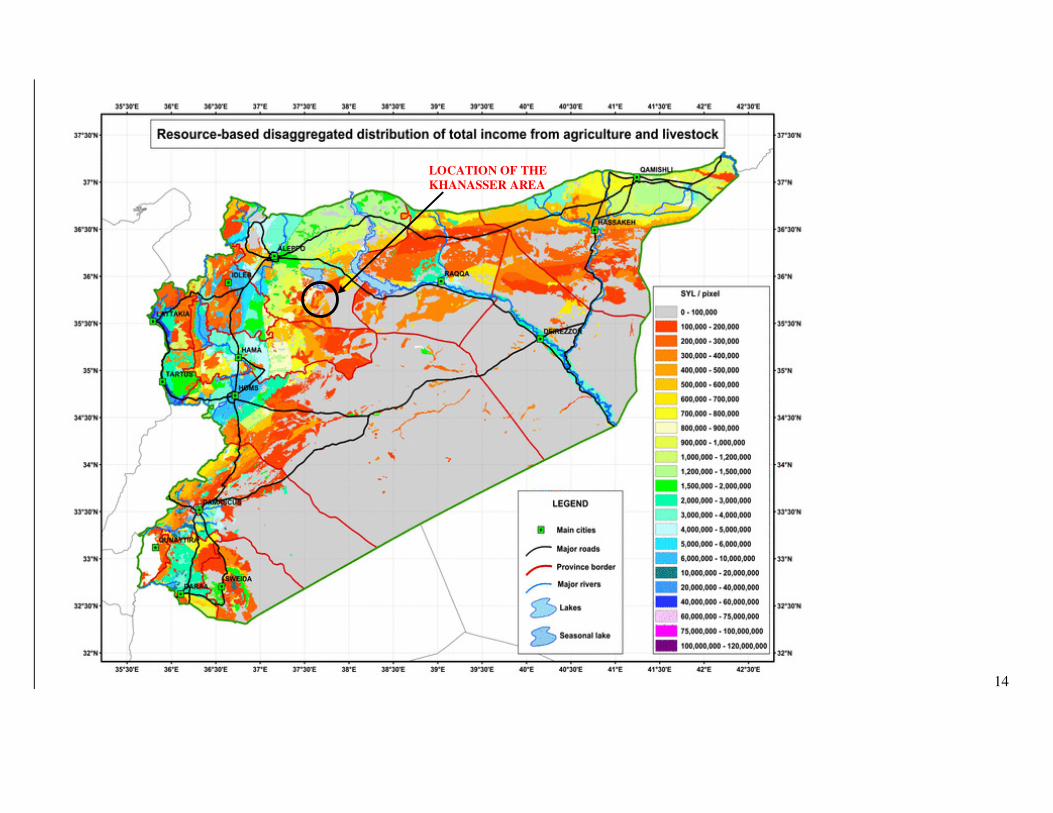
Map 1 in Annex 2 shows the resource based distribution of total income from agriculture
and livestock in rural areas of Syria. This suggests the influence of resource endowment, as
better income areas are located in irrigated or higher-rainfall areas. However, within these
areas pockets with poor soils or unfavorable topography appear as lower-income spots. One
exception seems to be the coastal mountains, where income appears better than would have
been expected from resource endowment only. It is likely that large-scale investments by the
government and the private sector in land improvement, principally through terracing, have
significantly improved the earning capacity of the agricultural resource base.
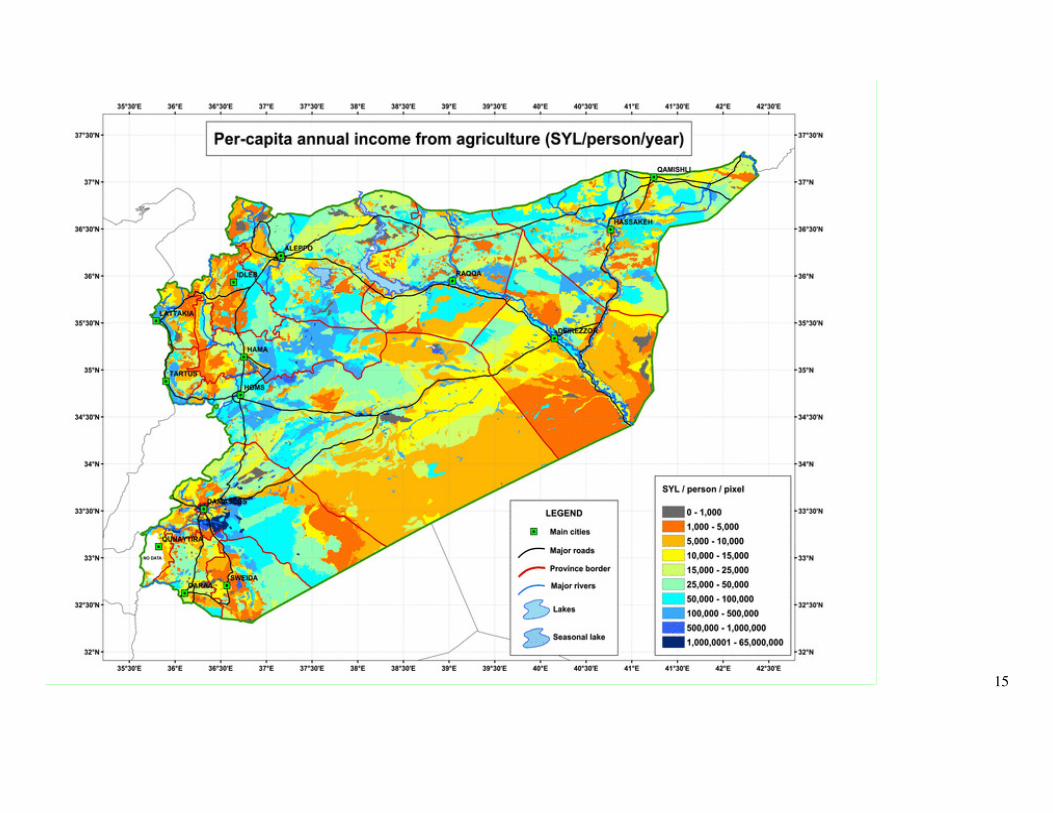
The overall pattern of total per-capita income from agriculture (Map 2 in Annex 1) is quite
compatible with the pattern of total income from agriculture (cfr. with Map 1): where total
income is high, so is per-capita income, and vice-versa. In fact, areas with higher per-capita
incomes (SYL 100,000-500,000/pixel) extend quite deep inside the steppe, into areas in
which the total income is fairly low (SYL 20,000-100,000/person/pixel). This indicates that
in some areas the total income is shared among fewer people, increasing accordingly the per-
capita incomes. There are various exceptions though, which seem to point to poverty
hotspots: e.g. the southern Euphrates plains despite high total incomes (SYL 5,000,000/pixel)
8
have fairly low per-capita incomes (SYL 10,000-20,000/person/pixel). It appears that in such
areas the higher population densities may compensate for the higher total incomes.
3.1 Comparison of the results with case studies in Syria
The results of this study were compared with those of two studies referring to areas situated
in northern Syria. The first is the Khanasser valley, a marginal area with 200-250 mm annual
rainfall situated between the cropped and steppe rainfed systems (see circle in Map 1, Annex
2). The total area is 630 km2 with a population of 27,000 and density of 93 persons / km
2.
La Rovere et al. (2005) quantified the total income of the area at 0.5 billion SYL/year,
including off-farm earnings. The total income quantified by the present study for the same
area is 0.33 billion SYL/year, not including income from off-farm-labor. When we add the
percentage share of off-farm income (42% of total income, La Rovere et al.), the total income
of the area becomes 0.47 billion SP/year. This matches with the total income found by La
Rovere et al., hence providing a form of validation for our results at the sub-regional level.
The second case is a study on child nutrition in 3 villages (Ghosh et al., 2004) of northwest
Syria, one of which situated in the same Khanasser area where barley and livestock are main
livelihood sources. The other 2 villages are located in irrigated and olive growing areas. In
Syria 13% of children aged below 5 is underweight (MDG-Syria, 2003). This is likely higher
in the rural than in the urban population. Though Ghosh et al. do not quantify income we
found a correlation between the natural resource endowments and child nutritional status.
4. DISCUSSION
Our income maps and their supporting databases provide information on the resources for
agricultural production, on the actual capacity of production, on prices, and on population on
a fine spatial scale for use by researchers, international organizations, and decision-makers.
One main reason for the choice of the top-down approach for this study is that it can be a
fairly reliable tool for downscaling poverty-related statistics to sub-national levels for other
9
countries, and it provides a fine resolution regional mapping. The resolution of GIS data has
been improving dramatically and continues improving, increasing the value of such top-down
approaches, and converting these into tools for conducting more accurate poverty mapping.
Poverty maps can improve poverty alleviation, food security and development efforts by
making the spatial allocation of national or international funds for agricultural research and
development more effective. They can highlight areas or communities marginalized by
resource constraints and help in setting priorities for developing technologies and transferring
them where they are most needed and likely to have an impact. In essence, by identifying
who and where the poor are, they help to better target research. In some cases they can also
reveal why communities or people are poor, based on their natural resource endowments.
Poverty maps, however, are often unable to demonstrate quantitatively a high degree of
inequality within individual communities. There is thus a case for establishing at the local
level relationships between resource-based variables and geo-referenced income data.
Despite these potential benefits, the use of the results of poverty maps that use aggregated
data requires caution since they tend to exaggerate differences between poor and less poor
areas (Minot and Baulch, 2002). Socio-economic analysis based on GIS data can also pose
problems since GIS data is often not readily available at the farm level, and since information
might be lost in the process of integrating different databases (Osgood and Lipper, 2003).
4.1 Opportunities for improvement
Opportunities exist for improving the present approach (see more in Szonyi et al., 2005) by:
- Strengthening the link of the top-down approach with micro-level analysis by accounting
for local income distribution inequalities based on the existence of different livelihood
groups, productive assets, and net production value by livelihood activity. The availability of
additional case study sites could strengthen this link and improve poverty measurement.
10
- Estimating the value of the rural non-farm economy in different areas by linking the results
to household surveys as our study does not estimate off-farm incomes and remittances2.
- Monitoring poverty dynamics with repeated poverty mapping (with updated geophysical
and socio-economic databases), and by including the feedbacks of human induced impacts
(e.g. land degradation, exploitation of resources) on agricultural productivity.
- Linking with macroeconomic decision support systems used for policy simulations (CGE,
input-output models, national Social Accounting Matrixes) to enclose a spatial dimension and
provide regional coefficients of production. This can also help in extending the poverty
analysis to urban areas, as it is possible to estimate incomes from industry and services.
- Integrating other and more comprehensive determinants of poverty, e.g. accessibility to
markets, access to clean water, nutritional indicators, other off-farm income generation
opportunities, as well as other dimensions of poverty such as health, education, vulnerability
that support the assessment of national Millennium Development Goals (MDG-Syria, 2003).
5. CONCLUSIONS
This study shows that the better income areas of Syria are located in the irrigated or higher-
rainfall areas. Within these areas, however, there are lower-income pockets mainly due to the
presence of poor soils or harsh topography. Better off areas, however, are present for example
in the coastal mountains, while poverty hotspots exist in the southern Euphrates plains.
By revealing such results, and by critically suggesting practical ways of improvement, this
study represents an important advancement on the methodology to link micro and macro
economic analysis for successfully mapping poverty. Poverty mapping can indeed become
more effective and cost-efficient if it combines the classical bottom-up approach, based on
2 These can be sizeable as off-farm earnings may account for half of total income (La Rovere et al., 2005).
11
household surveys, with the top-down methodology that we have outlined. The present study
also represents the first poverty mapping approach done at the national level for Syria.
6. REFERENCES
AOAD – Arab Agricultural Statistics Yearbook (2001) Volume 21. Arab Organization for
Agricultural Development, URL: http://www.aoad.org/
Central Statistics Bureau (CBS), Statistical Abstract (several years), Syrian Arab Republic
De Pauw, E., Oberle, A. and Zoebisch, M. (2004) Land cover and land use in Syria: An
overview. Jointly published by AIT, ICARDA, and WASWC. 47 pp. + Map and CD.
FAOSTAT (several years) FAO statistical database, URL: http://faostat.fao.org
Gallup, J.L., Sachs, J.D. (1999) Geography and economic development, CAER II Discussion
Paper No. 39, Harvard Institute for International Development URL:
Ghosh, S., Aw-Hassan, A., Pellett P.L. (2004) Growth status of children in northwest Syria:
A comparison of three rural livelihood groups, Ecology of Food and Nutrition, 43:107-148
Henninger, N., Snel M. (2002) Where are the poor? Experiences with the development and
use of poverty maps, World Resources Institute
La Rovere R., Aw-Hassan A., Turkelboom F., Thomas R. (2006) Characterizing Livelihoods
for enhanced targeting of Agricultural Research in the Dry Marginal Areas of Syria,
Development and Change, Volume 37, Number 3, Blackwell Publishing
MAAR - Agricultural Statistical Abstract (several years) Ministry of Agriculture and
Agrarian Reform Statistics Department, Syrian Arab Republic
MDG-Syria (2003) National Millennium Development Goals Report of the Syrian Arab
Republic, State Planning Commission, UNDP-Syria, Syrian Arab Republic.
Minot, M., Baulch B. (2002) Poverty mapping with aggregate census data: what is the loss in
precision? MSSD Discussion Paper No. 49, IFPRI, Washington D.C.
NAPC – Syrian Agricultural Database (2003) FAO Project GCP/SYR/006/ITA - Phase 2,
Assistance in Agricultural Planning, Policy Analysis and Statistics, National Agricultural
Policy Center, Syrian Arab Republic.
Osgood, D., Lipper, L. (2003) Two Essays on Socio-Economic Aspect of Soil Degradation,
Economic and Social Development Paper No.149. URL: http://www.fao.org/documents/
Sullivan, C. (2002) Calculating a water poverty index, World Development Vol. 30, No.7,
pp. 1195-1210
12
Szonyi, J., De Pauw E., Aw-Hassan A, Nseir, B., La Rovere R. (2005) Mapping agricultural
income distribution in rural Syria: A case study in linking poverty to resource endowment.
Integrated Natural Resources Management Series N.7, ICARDA, Syria pp. 45 + CD-ROM
UNDP (2005) Human Development Report 2005: http://hdr.undp.org/reports/global/2005
13
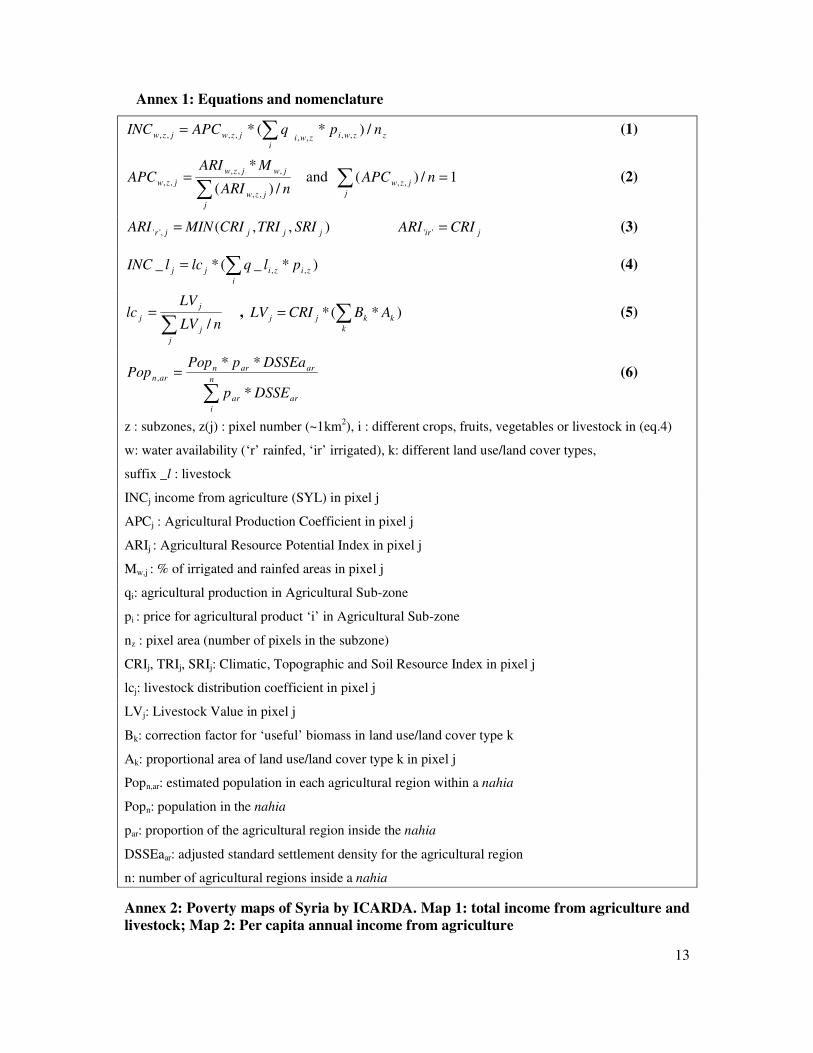
Annex 1: Equations and nomenclature
zzwi
izwijzwjzw npqAPCINC /)*(* ,,,,,,,, ∑= (1)
nARI
MARIAPC
j
jzw
jwjzw
jzw/)(
*
,,
,,,
,,
∑= and 1/)( ,, =∑ nAPC
j
jzw (2)
),,(,'' jjjjr SRITRICRIMINARI = jir CRIARI ='' (3)
)*_(*_ ,, zi
i
zijj plqlclINC ∑= (4)
∑=
j
j
j
jnLV
LVlc
/ , )*(* k
k
kjj ABCRILV ∑= (5)
∑
=n
i
arar
ararn
arn
DSSEp
DSSEapPopPop
*
**, (6)
z : subzones, z(j) : pixel number (~1km2), i : different crops, fruits, vegetables or livestock in (eq.4)
w: water availability (‘r’ rainfed, ‘ir’ irrigated), k: different land use/land cover types,
suffix _l : livestock
INCj income from agriculture (SYL) in pixel j
APCj : Agricultural Production Coefficient in pixel j
ARIj : Agricultural Resource Potential Index in pixel j
Mw,j : % of irrigated and rainfed areas in pixel j
qi: agricultural production in Agricultural Sub-zone
pi : price for agricultural product ‘i’ in Agricultural Sub-zone
nz : pixel area (number of pixels in the subzone)
CRIj, TRIj, SRIj: Climatic, Topographic and Soil Resource Index in pixel j
lcj: livestock distribution coefficient in pixel j
LVj: Livestock Value in pixel j
Bk: correction factor for ‘useful’ biomass in land use/land cover type k
Ak: proportional area of land use/land cover type k in pixel j
Popn,ar: estimated population in each agricultural region within a nahia
Popn: population in the nahia
par: proportion of the agricultural region inside the nahia
DSSEaar: adjusted standard settlement density for the agricultural region
n: number of agricultural regions inside a nahia
Annex 2: Poverty maps of Syria by ICARDA. Map 1: total income from agriculture and
livestock; Map 2: Per capita annual income from agriculture
14
LOCATION OF THE
KHANASSER AREA
15