Targeting agricultural research to benefit poor farmers: Relating poverty mapping to maize...
17
Targeting agricultural research to benefit poor farmers: Relating poverty mapping to maize environments in Mexico Mauricio R. Bellon * , David Hodson 1 , David Bergvinson 1 , David Beck 1 , Eduardo Martinez-Romero 1 , Yinha Montoya 1 International Maize and Wheat Improvement Center, Apartado Postal 6-641, 06600 Mexico, D.F., Mexico Abstract We explore approaches for targeting agricultural research to benefit poor farmers. Using small area estimation methods and spatial analysis, we generated high-resolution poverty maps and com- bined them with geo-referenced biophysical data relevant to maize-based agriculture in Mexico. We used multivariate classification and cluster analysis to synthesize biophysical data relevant for crop performance with rural poverty data. Results show that the rural poor are concentrated in particular regions and under particular circumstances. Formal maize germplasm improvement trials were lar- gely outside the core areas of rural poverty and there was little evidence for direct spillover of improved germplasm. Agro-climatic classification used for targeting breeding is useful but often ignores some important factors identified as relevant for the poor. Combining this method with pov- erty mapping improves stratifying and targeting crop breeding efforts to meet the demands of resource-poor farmers. We believe this integrated approach will help increase benefits from agricul- tural research to poor rural communities. Ó 2005 Elsevier Ltd. All rights reserved. Keywords: Poverty mapping; Maize mega-environments; Targeting crop breeding; Biophysical data; Rural poor; Mexico 0306-9192/$ - see front matter Ó 2005 Elsevier Ltd. All rights reserved. doi:10.1016/j.foodpol.2005.09.003 * Corresponding author. Present address: International Plant Genetic Resources Institute, Via dei Tre Denari 472/a, 00057 Maccarese, Rome, Italy. Tel.: +39 066118336; fax: +39 066197661. E-mail addresses: [email protected] (M.R. Bellon), [email protected] (D. Hodson), d.bergvinson@ cgiar.org (D. Bergvinson), [email protected] (D. Beck), [email protected] (E. Martinez-Romero), [email protected] (Y. Montoya). 1 Tel.: +52 55 5804 2004; fax: +52 55 5804 7558. Food Policy 30 (2005) 476–492 www.elsevier.com/locate/foodpol
-
Upload
independent -
Category
Documents
-
view
0 -
download
0
Transcript of Targeting agricultural research to benefit poor farmers: Relating poverty mapping to maize...

Food Policy 30 (2005) 476–492
www.elsevier.com/locate/foodpol
Targeting agricultural research to benefitpoor farmers: Relating poverty mapping to
maize environments in Mexico
Mauricio R. Bellon *, David Hodson 1, David Bergvinson 1,David Beck 1, Eduardo Martinez-Romero 1, Yinha Montoya 1
International Maize and Wheat Improvement Center, Apartado Postal 6-641, 06600 Mexico, D.F., Mexico
Abstract
We explore approaches for targeting agricultural research to benefit poor farmers. Using smallarea estimation methods and spatial analysis, we generated high-resolution poverty maps and com-bined them with geo-referenced biophysical data relevant to maize-based agriculture in Mexico. Weused multivariate classification and cluster analysis to synthesize biophysical data relevant for cropperformance with rural poverty data. Results show that the rural poor are concentrated in particularregions and under particular circumstances. Formal maize germplasm improvement trials were lar-gely outside the core areas of rural poverty and there was little evidence for direct spillover ofimproved germplasm. Agro-climatic classification used for targeting breeding is useful but oftenignores some important factors identified as relevant for the poor. Combining this method with pov-erty mapping improves stratifying and targeting crop breeding efforts to meet the demands ofresource-poor farmers. We believe this integrated approach will help increase benefits from agricul-tural research to poor rural communities.� 2005 Elsevier Ltd. All rights reserved.
Keywords: Poverty mapping; Maize mega-environments; Targeting crop breeding; Biophysical data; Rural poor;Mexico
0306-9192/$ - see front matter � 2005 Elsevier Ltd. All rights reserved.
doi:10.1016/j.foodpol.2005.09.003
* Corresponding author. Present address: International Plant Genetic Resources Institute, Via dei Tre Denari472/a, 00057 Maccarese, Rome, Italy. Tel.: +39 066118336; fax: +39 066197661.
E-mail addresses: [email protected] (M.R. Bellon), [email protected] (D. Hodson), [email protected] (D. Bergvinson), [email protected] (D. Beck), [email protected] (E. Martinez-Romero),[email protected] (Y. Montoya).1 Tel.: +52 55 5804 2004; fax: +52 55 5804 7558.

M.R. Bellon et al. / Food Policy 30 (2005) 476–492 477
Introduction
Poverty alleviation is an important goal in the global development agenda. A high pro-portion of the poor in developing countries live in rural areas, even in middle-incomecountries where agriculture remains an important component of their livelihoods. Agricul-tural research has made a contribution to poverty alleviation but many poor farmers arestill not beneficiaries and reaching them should be an important goal to further increasethe impact of agricultural research. However, reliance on spillover effects of new technol-ogies is unlikely to solve the problem. A pro-active approach needs to be taken to developrelevant agricultural technology for poor farmers that responds to their needs, performswell in the environments in which they farm and under the management they can apply.This suggests the need for better targeting of agricultural research to reach the poor.
Agricultural research can contribute to poverty alleviation both directly and indirectly(Byerlee, 2000; Hazell, 2003). Direct effects include increasing on-farm production andhousehold food security and reducing market and production risks. Indirect effects includegreater agricultural employment, growth in the local non-farm economy and lower foodprices. Targeting has become an important component of poverty alleviation programmesused to enhance their efficacy and efficiency. Poverty mapping is an increasingly used toolfor targeting these programmes, which usually consist of cash transfers to the poor as wellas providing improved access to education and health services (Skoufias et al., 2001; Henn-inger and Snel, 2002).
Advances in geographical information systems (GIS) and availability of spatial datamake feasible the mapping of a combination of agro-ecological and socio-economic vari-ables, such as poverty incidence (Byerlee, 2000). These geographical targeting efforts maybe particularly effective if regional disparities are large (Bigman and Loevinsohn, 2003).Therefore, making poverty mapping relevant for the targeting and development of agricul-tural technology may increase the impact of agricultural research on the poor. Not surpris-ingly, one conclusion of the 1999 international workshop, ‘‘Assessing the impact ofagricultural research on poverty alleviation’’, was the need for more comprehensive map-ping, ‘‘. . .if the direct impacts of agricultural research on poverty, the linkages betweenthose direct effects and the well-being of the rural non-farm population, and the poverty-resource degradation linkages are to be clarified in the future’’ (Pachico et al., 2000, p. 383).
Improved crop germplasm is a key output of agricultural research. Whether or notimproved crop varieties benefit poor farmers has been debated (e.g. Lipton and Longhurst,1989). In theory, improved varieties are scale neutral and should benefit both large- andsmall-scale farmers (Hazell, 2003). However, the possibility for these spillovers may bemorelimited if the environments in which better-off and poorer farmers raise crops vary consid-erably or if themanagement regimes they use are different. The need for targeting germplasmis well recognized among breeders, and tools have been developed to assist this process. Forexample, over time, the International Maize and Wheat Improvement Center (CIMMYT)and its partners have developed and refined the concept of global maize mega-environments(MEs). TheMEs (homogenous production environments defined on an agro-climatic basis)help crop breeders manage genotype-by-environment interactions and extrapolate withinsimilar agro-climatic zones (Hartkamp et al., 2000). However, these MEs do not includesocio-economic variables that make them more relevant for targeting poor farmers. In par-ticular, poor farmers are generally subsistence farmers, farming in the most challengingedaphic conditions in the ME (e.g. steepest slopes, poorest soils and lowest inputs due to

478 M.R. Bellon et al. / Food Policy 30 (2005) 476–492
poor access to markets). In addition, poor farmers in Latin America (and Africa) are oftenindigenous peoples for whom traditions and culture are key determinants of their behaviour.
Mexico as a case study for poverty mapping
Although Mexico is a middle-income country, it has an enormous diversity of environ-ments and socio-economic conditions. Despite its large developed economy, poverty (par-ticularly in rural areas) is still present and remains a national concern. In 2000, 57% of allhouseholds were considered poor, while in rural areas this number increased to 70%(CTMP, 2002). Furthermore, the Comite Tecnico para la Medicion de la Pobreza (CTMP)estimated that, nationwide, 19% of households are under the food poverty line2 and areconsidered to be under extreme poverty, rising to 34% in rural areas. According to the lat-est National Nutrition Survey (Rivera Dommarco et al., 2001), estimates of child malnu-trition (stunting) in 1999 were 18% nationwide but with considerable variation amongregions and types of communities – 32% in rural communities and 11% in urban areas.
In Mexico, members of the relatively large rural population still depend on farming fortheir livelihoods. Maize is their main staple crop and can be considered the crop of thepoor. Mexico is also the centre of diversity and origin for maize. For decades, a majoreffort has been made to produce improved agricultural technologies, particularly maizegermplasm, both in the public sector (including national agricultural research programmesand CIMMYT, which has its headquarters in the country) and more recently from the pri-vate sector. Mexico also has available quality data on socio-economic conditions, infra-structure and other common indicators of food security and human welfare. Giventhese factors, the overall goal was to explore approaches for making poverty mapping rel-evant for better targeting crop breeding.
Methods
We developed a map of rural poverty in Mexico using the small-area estimation methoddescribed by Bigman et al. (2000). We estimated a Multiplicative Heteroskedasticityregression model3 with data from the 2000 National Survey of Household Incomes and
2 The CTMP (2002) developed three poverty lines for both rural and urban areas of Mexico (Mexican pesos of2000, given here in US$ for rural areas). First, the food poverty line (Poverty Line 1 = US$51.60/capita/month)refers to the impossibility of obtaining a food basket needed for adequate nutrition, given the consumptionpatterns of Mexicans, using all available resources. Second, the capabilities poverty line (Poverty Line2 = US$89.57/capita/month) refers to the failure to reach the level of expenditure needed to obtain a referencefood basket plus the expenditure needed for health, clothing, housing, transportation and education. Lastly, theassets poverty line (Poverty Line 3 = US$111.25/capita/month) refers to the inability to obtain the value of thereference food basket plus an estimate of non-food expenditure considered as necessary in general.3 We used this regression model, as suggested by Bigman et al. (2000), estimated with LIMDEP (Greene, 1998).
The model estimated the log of the ratio of total current expenditure per capita per household per month to thefood poverty line (US$51.60) as a function of household size, education and housing characteristics at householdlevel plus an index of accessibility, fraction of indigenous language speakers, percentage of the rural population,population density and climatic data at municipal level and state location. We estimated one national modelinstead of several sub-national ones that in theory could have addressed the high social and spatial heterogeneityin the country. The latter, however, would have implied dividing the country into sub-national units, which can beseen as arbitrary and would have decreased the number of observations per model. Our single model includeddummy variables for all Mexican states, well-recognized political units, with distinct histories, policies andinstitutions, but allowed use of all available data.

M.R. Bellon et al. / Food Policy 30 (2005) 476–492 479
Expenditures (ENIGH 2000) (INEGI, 2001), and using the food poverty line defined bythe CTMP (2002).4 We chose model variables for their potential relation to human welfareand the fact that they could be directly linked to the national census data. Input dataincluded 3299 households in 184 municipalities across all Mexican states plus the FederalDistrict. We used the developed model to predict the expenditure of the average ruralhousehold, as well as its variance, by municipality using data from the XII General Pop-ulation and Housing National Census 2000 (INEGI, 2002).5 Based on these results, weestimated (from communities <2500) the proportion of rural households under the foodpoverty line by municipality.
We also applied the predictive model for expenditure to community-level data to mapmonthly per capita expenditure of the average household by community. We estimatedthese data for 103,635 rural communities (<2500 people) from the National Census of2000 (INEGI, 2002). We applied non-parametric interpolation, using indicator krigingtechniques, to the community-level data to generate rural food poverty probability sur-faces, with the food poverty line (US$51.60 per capita monthly expenditure) used as athreshold limit. We classed selected areas with probabilities equal to, or greater than,80% as high probability rural poverty zones.
While we fully recognize that additional errors will be generated at the community level,given that we estimated the model with data that can only be linked to the municipal (notthe community) level, we think exploring the results is worthwhile because they provided ameans to link the poverty data to environmental and agro-ecological data relevant forcrop breeding. The local nature of biophysical data (e.g. soils, climate and slope) relevantto breeding activities was a major factor in exploring this line of investigation. Recogniz-ing the potential uncertainty in locality-level data, they are used in an illustrative way andonly predominant general trends are reported.
To examine the relationship between environmental factors of relevance for crop breed-ing and rural poverty, we used a modified version of existing CIMMYT maize MEs(Hartkamp et al., 2000). We used six environments, defined on the basis of growing seasonmaximum temperature and rainfall (Table 1). Additionally, we determined information onthe major soil types from 1:250,000 soil maps (INIFAP, 1999, unpublished data) and anindication of terrain derived from a slope surface (generated from the digital elevationmodel of Hijmans et al., 2004).
To explore the relevance and implications of the poverty mapping results to agriculturalresearch organizations, we compared several databases to the occurrence of rural poverty.The databases included the distribution of important crops (maize, wheat and beans) andthe locations of formal CIMMYT maize trials. The latter were derived from CIMMYT�sInternational Maize Trial database and mainly represent testing locations of CIMMYTmaterials requested by collaborators. We also compared commercial agriculture zonesfor maize, calculated on the basis of high production surplus for the agricultural popula-tion per capita, to the poverty results. Municipalities with greater than 1 ton per capita
4 The CTMP applied the poverty lines to the whole country, without adjustments for regional disparities inprices. While ideally one may want to adjust for these disparities, in our study no adjustments were made.5 Ideally, one would apply the estimated regression parameters to individual households to predict their
consumption or income (e.g. Hentschel et al., 2000). However, we could not do this because we lacked access tohousehold disaggregated data at the national level for Mexico. We chose the method developed by Bigman et al.(2000) because it allowed us to work with available data. Other studies (e.g. Minot and Baulch, 2002) haveconfirmed the validity of such an approach when use of aggregated data is unavoidable.

Table 1Definitions of maize mega-environments based on climatic parameters for a 5-month optimum season (i.e. 5consecutive months with highest precipitation/potential evapotranspiration ratio)
Maize mega-environment Precipitation (mm) Maximum temperature (�C)
Wet upper mid-altitude >600 P24 < 28Wet lower mid-altitude >600 P28 < 30Dry mid-altitude >350 to 6600 P24 < 30Wet lowland >800 P30Dry lowland >350 to 6800 P30Highland >350 <24 to P18
480 M.R. Bellon et al. / Food Policy 30 (2005) 476–492
surplus production for the agricultural population were considered commercial, andexpert evaluation by CIMMYT scientists supported these designated areas. Additionally,predictive models (climate-based, regression models based on actual measured farmerstorage losses) were used to develop maize grain storage loss surfaces under different stor-age conditions and durations, and so appraise the potential importance of storage losses tothe poor.
Finally, to rigorously synthesize the biophysical data relevant for crop performancewith the data from poverty mapping, we used a combination of multivariate classificationmethods for allocating individuals, in this case communities, into homogenous but distinctgroups. Biophysical data relevant for crop performance used to form the groups included:(1) average minimum and maximum temperatures during the main cropping season (�C),(2) elevation above sea level (m), (3) ratio of precipitation to potential evapotranspirationduring the main cropping season (P/PE) and (4) percentage of slope. For poverty, we usedthe predicted expenditure of the average household in the community.
We used a sequential classification strategy (after Franco et al., 1997) to form the initialgroups by the geometric technique using the Ward (1963) hierarchical method, with anoptimal number of clusters determined using the upper tail rule (Wishart, 1987). Next,we used discriminant analysis to reclassify communities among groups using a linear dis-criminant function together with changes in likelihood as a criterion to obtain the finalnumber of clusters; this was done with the statistical analysis system (SAS), WARD-DIS-CRIM (SAS, 1996). Once we had established the clusters, we performed canonical discrim-inant analysis using PROC CAN DISC (SAS, 1996) to evaluate the pattern of diversitywithin the clusters.
Mapping rural poverty in Mexico
Results from the regression model used to develop the poverty map (Tables 2–4) showthe statistically significant variables.6 The results also demonstrated that multiplicativeheteroskedasticity cannot be rejected; hence it was important to model the variance ofper capita expenditure. These results showed that increased education in the municipality
6 The overall estimation of the regression model yielded the following results: Breusch–Pagan LM statistic [13df] = 78.5274. Significance level = 0.00001. Log likelihood function = �2620.979. Restricted log likeli-hood = �2656.292. v-Squared = 70.62644, df = 13, significance level = 0.000001. No simple R2 can be reportedbecause maximum likelihood estimation was used to jointly determine the coefficients in the model and theheteroskedasticity structure.

Table 2Regression results: Log of the ratio of household per capita expenditure/month to the food poverty line ENIGH2000,a household-level factors
Variable Coefficient t-Valueb
Constant 1.0510 5.01**Household size �0.1560 �28.44**
Dwelling with (dummy variable)Only earth floor �0.1819 �6.74**Only one room �0.1214 �5.13**Potable water 0.0280 1.08Sewage 0.2330 10.12**Electricity 0.1905 4.83**Telephone 0.3425 10.34**
No. of household members older than 15 thatDo not know how to read and write �0.0322 �2.36*Have some years of elementary education but incomplete �0.0231 �1.98*Completed elementary education 0.0306 2.27*Have some years of secondary education but incomplete 0.0446 1.79�Completed secondary education 0.0546 3.69**Have post-secondary education 0.1723 5.67**
a Source: INEGI (2001).b � significant at p = 0.10, * at p = 0.05 and ** at p = 0.01 for a 2-tailed t-test.
M.R. Bellon et al. / Food Policy 30 (2005) 476–492 481
decreases the variance; the proportion of households with poor housing and lack of pota-ble water also has a similar effect. Only the proportion of households with telephoneincreases the variance.
To test the model�s performance, we compared the proportion of rural households inextreme poverty by municipality estimated from the model with the actual fractions mea-sured from the ENIGH 2000 survey data (184 municipalities); we found a highly signifi-cant correlation (r = 0.799, p < 0.01). Additionally, to assess whether there was acorrespondence between the observed ranking of municipalities in terms of poverty withthe ranking derived from the model predictions, we calculated the Spearman-rank corre-lation between both, which also shows a strong and highly significant correlation (Spear-man�s q = 0.762, p < 0.01). Furthermore, we calculated the average fraction of householdsbelow the food poverty line for the observed ENIGH 2000 data and from the model pre-dictions. We found that the national average observed rate was 0.324 compared to 0.415for the model, which suggests that the model tends to overestimate the fraction of house-holds under the food poverty line. Given the significant correlations between observed andpredicted rates, the results suggest that the model provides a reasonable estimate of thetrend but has a tendency to overestimate actual rates. Our estimates thus may be an upperbound for the incidence of food poverty. Errors of this type are not unexpected, given datarestrictions and the unavoidable use of aggregated census data. Access to household-levelcensus data would almost certainly have improved the estimates. However, given the rel-atively low aggregation level of the census data (municipality level), the spatial patternsand ranking by poverty rates are likely to be valid (e.g. Minot and Baulch, 2002).
The spatial distribution of the predicted per capita total expenditures for the averagerural household per municipality, classified according to the three poverty lines (Fig. 1),shows a non-uniform distribution of extreme rural poverty within Mexico concentrated

Table 3Regression results: Log of the ratio of household per capita expenditure/month to the food poverty line ENIGH2000,a municipal-level factors
Variable Coefficient t-Valueb
Fraction of population older than 5 that speaks an indigenous language �0.2530 �4.40**Accessibility indexc 0.0002 2.12*Minimum temperature 0.0182 1.84�Maximum temperature �0.0117 �1.03Yearly rainfall �0.0002 �3.01**Percentage of rural population �0.0003 �0.80Population density 0.0002 3.53**
State location (dummy variable)Aguascalientes 0.1710 1.35Baja California 0.2469 1.81�Baja California Sur 0.3999 2.80**Campeche �0.2499 �1.82�Coahuila �0.0475 �0.37Colima �0.0341 �0.25Chiapas �0.3971 �3.09**Chihuahua 0.1278 0.94Durango 0.0367 0.29Guanajuato �0.1436 �1.21Guerrero 0.1859 1.48Hidalgo �0.0663 �0.57Jalisco 0.0006 0.01Mexico �0.0173 �0.15Michoacan �0.1503 �1.28Morelos 0.1152 0.90Nayarit �0.0417 �0.31Nuevo Leon 0.1790 1.42Oaxaca �0.3520 �2.73**Puebla �0.3159 �2.56*Queretaro �0.0532 �0.44Quintana Roo �0.0095 �0.07San Luis Potosi �0.1299 �1.06Sinaloa 0.2308 1.67�Sonoroa �0.0027 �0.02Tabasco �0.2726 �2.09*Tamaulipas �0.0139 �0.11Tlaxcala �0.0315 �0.28Veracruz �0.1439 �1.23Yucatan �0.5150 �3.69**Zacatecas 0.1334 1.05
a Source: INEGI (2001).b � significant at p = 0.10, * at p = 0.05 and ** at p = 0.01 level for a 2-tailed t-test.c Average travel time in minutes to the nearest urban centres (>2500 persons) for a municipality. A large
number indicates inaccessibility and vice versa.
482 M.R. Bellon et al. / Food Policy 30 (2005) 476–492
in southern areas and the Sierra Madre Occidental. The non-poor are predominantly innorthern areas, irrigated coastal plains and close to large urban centres or tourist resorts.
We also applied the model estimates to the rural community-level data from the 2000National Census, with the caveats of this approach noted earlier. Results show a similar

Table 4Regression results: Log of the ratio of household per capita expenditure/month to the food poverty line ENIGH2000,a variance function factors
Variables Coefficient t-Valueb
Sigma 0.9701 6.82**Household size (municipality mean) 0.0595 1.29
Dwelling with (fraction for the municipality)Only earth floor �0.0879 �0.62Only one room �0.3270 �2.02*Potable water �0.2324 �2.05*Sewage 0.1777 1.55Electricity �0.3496 �1.57Telephone 0.3769 1.73�
No. of household members older than 15 thatDo not know how to read and write (municipality mean) 0.1929 2.00*Have some years of elementary education but incomplete �0.3929 �4.05**Completed elementary education �0.4929 �4.09**Have some years of secondary education but incomplete 0.1470 0.58Completed secondary education �0.2966 �2.30*Have post-secondary education �1.5759 �5.00**
a Source: INEGI (2001).b � significant at p = 0.10, * at p = 0.05 and ** at p = 0.01 level for a 2-tailed t-test.
M.R. Bellon et al. / Food Policy 30 (2005) 476–492 483
distribution to that obtained at the municipality level, with strong concentrations ofextremely poor rural communities in the southern half of Mexico and pockets withinthe Sierra Madre Occidental (Fig. 2). The model predicted 40,879 rural communitiesas below the food poverty line.
We found a strong correlation between our predicted model results with priorityregions defined by the Mexican Department for Social Development (SEDESOL) onthe basis of marginality (Skoufias et al., 2001; Davis, 2003). Close to 33,752 (83%) ofthe predicted extremely poor rural communities occurred within the priority zones definedby SEDESOL – virtually all within either ‘‘high’’ or ‘‘very high’’ marginality municipali-ties. At the municipality level, the model predicted 1020 municipalities below the food pov-erty line. In comparison, SEDESOL classified 1314 municipalities as either ‘‘high’’ or‘‘very high’’ marginality. Of the 1020 predicted food poverty municipalities, 909 (89%)coincided with the highest marginality rankings of SEDESOL.
In addition, an independent CIMMYT socio-economic study from 12 rural communi-ties in the southern states of Oaxaca and Chiapas in 2001 provided access to very detailedhousehold-level expenditure data. The Oaxaca/Chiapas study permitted a comparisonbetween observed and predicted poverty status at the community level, albeit on a verysmall sample. There was a statistically significant correlation between the observed totalper capita expenditure and the predicted one (r = 0.63, p < 0.01), and with respect to theirrankings (Spearman�s q = 0.63, p < 0.01).
Rural poverty and maize production
Unsurprisingly, the distribution of maize production was largely coincident with areasof rural poverty. However, commercial maize production areas were largely outside the

Fig. 1. Poverty status, based on predicted total expenditure per capita for municipalities, in relation to povertylines defined by the Mexican Technical Committee for the Study of Poverty (CTMP, 2002).
484 M.R. Bellon et al. / Food Policy 30 (2005) 476–492
predicted areas of extreme rural poverty. Commercial wheat areas showed no coincidence.These results were consistent with the working hypothesis that rural poverty would occurpredominately outside commercial farming areas.
In terms of CIMMYT maize MEs, 30,161 (74%) of the predicted food poverty rurallocalities occurred in just three MEs – wet lowlands, wet upper mid-altitude and highland.The two wet environments have more than adequate growing season rainfall (more than600 mm for wet mid-altitude and more than 800 mm for wet lowlands for a 5-month sea-son). Highland environments have more variable rainfall; however, comparison of all foodpoverty rural communities with growing season precipitation revealed that 35,814 (88%)were in areas with over 600 mm. The indication is that most of the predicted extreme ruralpoor communities are located within relatively high rainfall areas.
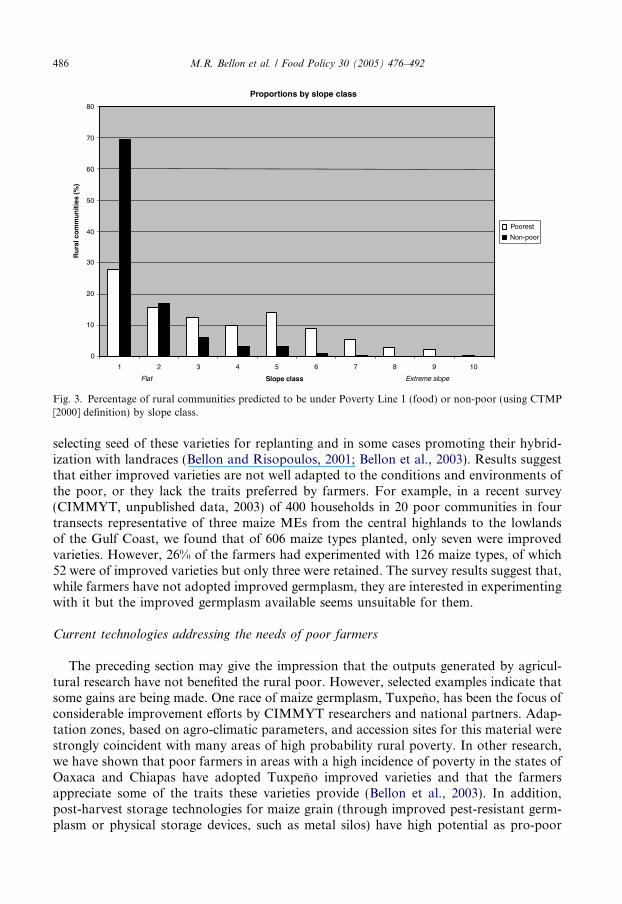
In terms of soil types, approximately 18,989 (50%) of the extremely poor rural commu-nities that had available soils data occurred on just three major Food and AgricultureOrganization (FAO) soil groups; Phaeozems (usually fertile but can be limited by windand water erosion), and Regosols and Lithosols (poor, underdeveloped soils). Therewas a clear tendency for the poorer rural communities to be located on sloping lands(Fig. 3).

Fig. 2. Rural communities under Poverty Line 1 (food) defined by the Mexican Technical Committee for theStudy of Poverty (CTMP, 2002).
M.R. Bellon et al. / Food Policy 30 (2005) 476–492 485
Poverty and maize trials
In terms of locations where formal CIMMYT maize trials had been carried out, only 7of the 158 sites used were actually in high probability rural poverty areas and only 16 ofthe 158 were within extremely poor municipalities (Fig. 4). In terms of MEs, the three keyenvironments (see previous section) were reasonably well represented as 93 of the 158 siteswere within them; however, MEs by definition only take into account climatic variablesand not factors such as slope and soils. The disparity in the locations of the trials andwhere the poor live suggests that the potential for spillovers from germplasm tested inthose sites to poor farmers may be limited, unless trials were carried out under managedstress designed to replicate farmer conditions and management practices. The finding isconsistent with other studies that have found that while improved maize varieties havebeen available in Mexico for more than 40 years, diffusion has been limited and only about20% of the total maize area (mostly commercial) is planted to improved varieties (Morrisand Lopez-Pereira, 1999).
Other research has shown that the poor tend to benefit indirectly from improved germ-plasm rather than by its direct adoption by a process known as creolization. This consistsof exposing improved varieties to local farmer conditions and management, continually
Proportions by slope class
0
10
20
30
40
50
60
70
80
1 2 3 4 5 6 7 8 9 10
Flat Slope class Extreme slope
uR
rac lom
mun
tiie
s(%
)
Poorest
Non-poor
Fig. 3. Percentage of rural communities predicted to be under Poverty Line 1 (food) or non-poor (using CTMP[2000] definition) by slope class.
486 M.R. Bellon et al. / Food Policy 30 (2005) 476–492
selecting seed of these varieties for replanting and in some cases promoting their hybrid-ization with landraces (Bellon and Risopoulos, 2001; Bellon et al., 2003). Results suggestthat either improved varieties are not well adapted to the conditions and environments ofthe poor, or they lack the traits preferred by farmers. For example, in a recent survey(CIMMYT, unpublished data, 2003) of 400 households in 20 poor communities in fourtransects representative of three maize MEs from the central highlands to the lowlandsof the Gulf Coast, we found that of 606 maize types planted, only seven were improvedvarieties. However, 26% of the farmers had experimented with 126 maize types, of which52 were of improved varieties but only three were retained. The survey results suggest that,while farmers have not adopted improved germplasm, they are interested in experimentingwith it but the improved germplasm available seems unsuitable for them.
Current technologies addressing the needs of poor farmers
The preceding section may give the impression that the outputs generated by agricul-tural research have not benefited the rural poor. However, selected examples indicate thatsome gains are being made. One race of maize germplasm, Tuxpeno, has been the focus ofconsiderable improvement efforts by CIMMYT researchers and national partners. Adap-tation zones, based on agro-climatic parameters, and accession sites for this material werestrongly coincident with many areas of high probability rural poverty. In other research,we have shown that poor farmers in areas with a high incidence of poverty in the states ofOaxaca and Chiapas have adopted Tuxpeno improved varieties and that the farmersappreciate some of the traits these varieties provide (Bellon et al., 2003). In addition,post-harvest storage technologies for maize grain (through improved pest-resistant germ-plasm or physical storage devices, such as metal silos) have high potential as pro-poor

Fig. 4. International Maize and Wheat Improvement Center maize trial sites, derived from international testingtrials database, in relation to rural poverty areas.
M.R. Bellon et al. / Food Policy 30 (2005) 476–492 487
technology. Existing farmer experimental sites, used for measuring storage losses, werefound to occur in or adjacent to high-probability poverty areas. Based on the results mea-sured at these farmer sites, we used predictive models (climate based) to develop storageloss surfaces for Mexico. A combination of these model surfaces with high-probabilitypoverty areas now forms the basis for priority setting exercises (Fig. 5).
Linking poverty mapping to agro-ecological factors relevant for maize performance
The multivariate classification methods grouped 99,6657 communities into 15 distinctgroups. Canonical discriminant analysis resulted in the first two canonical axes explaining98% of the total variation. The x-axis is correlated with elevation (r = �0.09921) and min-imum (r = 0.3468) and maximum (r = 0.2641) temperatures. The y-axis is correlated withthe expenditure of the average household in the community (r = 0.9361) and P/PE ratioduring the main agricultural season (r = �0.3406). Results indicate that for a given eleva-tion (and hence maize environment) there are communities classified as poor and non-poor. Although intuitive, the classification exercise allows us to identify and map themspecifically. Fig. 6 maps two contrasting cluster groups (G4 and G12) in terms of poverty
7 Mexico has 103,635 communities but some had insufficient data to be included in the analysis.

Fig. 5. Predicted maize grain storage damage (after 150 days under small-scale farmer storage conditions) inrelation to rural food poverty.
488 M.R. Bellon et al. / Food Policy 30 (2005) 476–492
in Central Mexico. These two cluster groups, however, share relatively homogenousbiophysical environments (cool, high elevation) and the degree of coincidence with theindependently defined highland ME is apparent. This refinement beyond simple biophys-ical characterization is likely to add value to technology targeting efforts. Furthermore,with these data, the importance of each group can be assessed by the percentage of com-munities included as well as the population in them. The classification provides an efficientsampling framework to select representative communities for further study, e.g. for liveli-hoods or risk management surveys.
A surprising finding is the correlation between P/PE (a measure of water availability)and the second canonical axis, which indicates that non-poor communities are locatedin areas with low water availability. One possible explanation is that non-poor communi-ties are found in areas equipped for irrigation, supporting the previous finding that com-mercial farms are outside the poverty areas.
Discussion and implications
Targeting agricultural research to produce and deliver appropriate technologies to poorfarmers can enable them to have a better life and escape poverty. Poverty mapping is one

Fig. 6. Example of two contrasting cluster groups (G4 and G12) in terms of poverty, occurring within a relativelyhomogenous environment, Central Mexico, shown in relation to the independently derived highland maize mega-environment.
M.R. Bellon et al. / Food Policy 30 (2005) 476–492 489
potential tool to accomplish this goal; however, it requires modifications to make it rele-vant for targeting agricultural research. As our results in Mexico demonstrate, the ruralpoor are not homogenously located across the country but rather are concentrated in par-ticular regions and under particular circumstances. Poverty is concentrated in mountain-ous and indigenous areas, mainly in central and southern Mexico but also themountainous regions of north-west Mexico. These ‘‘islands’’ of poverty exhibit specific cir-cumstances such as the presence of indigenous populations, higher rainfall, steep slopes,erodable soils and lack of access to services.
While the concept of agro-climatic classification (e.g. maize MEs) is a useful tool fortargeting breeding in terms of climatic variables, it ignores some of the important factorsidentified as relevant for the poor, such as land slope and soil classification. Clearly, interms of targeting research for the poor, these factors must be taken into consideration.It should be pointed out that the spatial patterns identified above may reflect a historicalprocess that led to what Mexican anthropologist Aguirre Beltran (1987) called ‘‘regions ofrefuge,’’ i.e. isolated and difficult-to-access areas into which the expansion of more pow-erful mestizo and European-descent Mexicans has pushed indigenous peoples since colo-nial times. Besides these historical patterns, it is clearly more expensive and difficult to

490 M.R. Bellon et al. / Food Policy 30 (2005) 476–492
bring both private and public goods and services to the inhabitants of these areas becauseof low population densities and difficult access due to the topography.
Another factor that may exacerbate this pattern is that indigenous peoples have histor-ically suffered from social exclusion and discrimination, having low social status, andhence society in general and governments in particular have easily ignored their voicesin the past. This means that the political clout needed to mobilize public investment(and hence the provision of public goods and services, which may also facilitate the supplyof private ones to these areas) may have been low, perpetuating a historical pattern ofneglect and probably making it even worse. Clearly, this suggests a poverty trap, rootedin a history of social exclusion, which goes beyond the current circumstances faced bythe poor in these regions.
A key result of our study is the lack of coincidence between the location of the formalmaize trials that CIMMYT and its partners carry out in the country and the locationswhere the rural poor live. The disparity cast doubts on the potential for spillovers ofthe germplasm tested in these environments to the locations and conditions of the poor.This disparity is not surprising and should be interpreted carefully. First, most of thesetrials are conducted in collaboration with national partners for whom alleviating povertyhas not necessarily been a primary mandate. The partners largely determine where trialsare planted, and favourable accessible flat lands are often preferred sites.
Second, many of these trials are conducted on experimental stations that allow breedersbetter control of environmental variation and of selection factors, such as abiotic and bio-tic stresses, which the germplasm in development will face in the target environments.Methodologies for stress breeding on experimental stations have been developed andtested successfully (e.g. Banziger et al., 2000; Banziger and Cooper, 2001). In contrast,conducting breeding work in farmers� fields is often less efficient because researchers� abil-ity to manage selection factors and control environmental variance are often limited.Building new stations in the regions where the poor live may be feasible but will requireadditional investments that may not be the best use of scarce resources for agriculturalresearch.
Third, the most effective approach may be a combination of breeding for conditionsmore relevant to the poor by using researcher-managed, controlled stress environmentson experimental stations (which could also include the direct input of farmers in specificstages of the breeding process) plus a network of trial sites in the areas where the poor live,largely handled by farmers using their common management practices. This model, knownas ‘‘Mother and Baby’’ trials, continues to be used by CIMMYT and its partners in south-ern Africa and has proven highly successful (Banziger and De Meyer, 2002; De Grooteet al., 2002), although the targeting of these efforts has not been based on poverty mappingper se.
A poverty mapping effort that combines factors that are relevant for the developmentand performance of agricultural technology, in this case breeding, should be effective insystematically identifying the important biotic and abiotic stresses faced by the poor, giventhe biophysical conditions in which they farm and their relative importance. These includethe management practices and inputs that the poor use, the traits they value and the pri-orities they place on these traits, as well as the trade-offs they face. Biophysical conditionsencountered by the poor can be identified directly from maps and secondary data (e.g.rainfall and temperature). But identifying, characterizing and prioritizing managementpractices, level of inputs and crop traits requires direct interaction with poor farmers.
M.R. Bellon et al. / Food Policy 30 (2005) 476–492 491
A poverty map is a useful tool for identifying the areas where the poor farm and as aframework for designing and carrying out representative studies to more systematicallycharacterize the management practices, input levels and crop traits in these areas, whichbased on their importance and distribution should lead to their prioritization. This in turnshould allow tailoring the conditions under which formal plant breeding takes place tobetter reflect the conditions of the target environments, both from an agro-ecologicaland a management perspective. By quantifying how widespread those conditions are interms of number of farmers and area planted, one could prioritize the breeding effortacross environments, management practices and traits. Clearly, the larger the number ofdifferent environments and the smaller each environment may be in terms of number offarmers or area, the more expensive targeting may be, and vice versa. But this is somethingthat cannot be done until a poverty map with relevant crop performance information isdeveloped.
The exercise presented here, linking a poverty map with relevant biophysical data, pre-sents a first approach to developing an improved targeting and priority-setting framework.This should be followed by a systematic characterization of the different environmentsfaced by the poor in terms of required crop traits demanded, management and inputs used,constraints faced and opportunities to access improved technologies if made available. Thefinal characterization should use direct contact with farmers and other participants in thetargeted regions. CIMMYT maize scientists are now implementing such an approach inrelation to post-harvest storage technologies and demand-driven, targeted traitintrogression.8
We used Mexico as a case study to explore the relevance of poverty mapping to agri-cultural research but believe the findings and approaches are more widely applicable. Sim-ilar datasets relating to poverty, crop performance and agricultural research are nowavailable in many developing countries, providing opportunities to undertake comparativestudies in other regions. The integrated approach outlined in our study is believed to beone way in which to increase the benefits from agricultural research to poor ruralcommunities.
References
Aguirre Beltran, G., 1987. Regiones de refugio. Instituto Nacional Indigenista, Mexico.Banziger, M., Cooper, M., 2001. Breeding for low input conditions and consequences for participatory plant
breeding examples from tropical maize and wheat. Euphytica 122, 503–519.Banziger, M., De Meyer, J., 2002. Collaborative maize variety development for stress-prone environments in
southern Africa. In: Cleveland, D.A., Soleri, D. (Eds.), Farmers, Scientists and Plant Breeding: IntegratingKnowledge and Practice. CABI Publishing, Wallingford.
Banziger, M., Edmeades, G.O., Beck, D., Bellon, M., 2000. Breeding for drought and nitrogen stress tolerance inmaize: from theory to practice. Centro Internacional de Mejoramiento de Maız y Trigo, Mexico.
Bellon, M.R., Risopoulos, J., 2001. Small-scale farmers expand the benefits of improved maize germplasm: a casestudy from Chiapas, Mexico. World Development 29, 799–811.
Bellon, M.R., Adato, M., Becerril, J., Mindek, D., 2003. The impact of improved maize germplasm on povertyalleviation: the case of Tuxpeno-derived material in Mexico. Food Consumption and Nutrition DivisionDiscussion Paper no. 162, International Food Policy Research Institute, Washington DC.
8 ‘‘Targeted allele introgression’’ is a methodology, currently under evaluation, which allows the incorporationof valuable traits (such as drought tolerance and storage pest resistance) from elite germplasm into local maizepopulations and builds on farmers� seed management practices (Bergvinson and Garcıa-Lara, 2004).
492 M.R. Bellon et al. / Food Policy 30 (2005) 476–492
Bergvinson, D., Garcıa-Lara, S., 2004. Genetic approaches to reducing losses of stored grain to insects anddiseases. Current Opinion in Plant Biology 7, 480–485.
Bigman, D., Loevinsohn, M., 2003. Targeting agricultural research and development for poverty reduction:general principles and an illustration for sub-Saharan Africa. In: Mathur, S., Pachico, D. (Eds.), AgriculturalResearch and Poverty Reduction: Some Issues and Evidence. Centro Internacional de Agricultura TropicalPublication no. 335, Economics and Impact Series no. 2, Cali, Colombia.
Bigman, D., Dercon, S., Guillaume, D., Lambotte, M., 2000. Community targeting for poverty reduction inBurkina Faso. World Bank Economic Review 14, 167–194.
Byerlee, D., 2000. Targeting poverty alleviation in priority setting for agricultural research. Food Policy 25 (4),429–445.
CTMP (Comite Tecnico para la Medicion de la Pobreza), 2002. Medicion de la pobreza: variantes metodologicasy estimacion preliminar. Secretarıa de Desarrollo Social, Mexico.
Davis, B., 2003. Choosing a method for poverty mapping. Agriculture and Economic Development AnalysisDivision, Food and Agriculture Organization of the United Nations, Rome.
De Groote, H., Siambi, M., Friesen, D., Diallo, A., 2002. Eliciting farmers� preferences for new maize varieties ineastern Africa. In: Bellon, M.R., Reeves, J. (Eds.), Quantitative Analysis of Data from Participatory Methodsin Plant Breeding. Centro Internacional de Mejoramiento de Maız y Trigo, Mexico.
Franco, J., Crossa, J., Diaz, J., Taba, S., Villasenor, J., Eberhart, S.A., 1997. A sequential clustering strategy forclassifying gene bank accessions. Crop Science 37, 1656–1662.
Greene, W.H., 1998. LIMDEP, version 7.0. Econometric Software, Inc., Bellport, New York.Hartkamp, A.D., White, J.W., Rodrıguez Aguilar, A., Banziger, M., Srinivasan, G., Granados, G., Crossa, J.,
2000. Maize production environments revisited: a GIS based approach. Centro Internacional de Mejoram-iento de Maız y Trigo, Mexico, D.F.
Hazell, P., 2003. The impact of agricultural research on the poor: a review of the state of knowledge. In: Mathur,S., Pachico, D. (Eds.), Agricultural Research and Poverty Reduction: Some Issues and Evidence. CentroInternacional de Agricultura Tropical Publication no. 335, Economics and Impact Series no. 2, Cali,Colombia.
Henninger, N., Snel, M., 2002. Where are the poor? Experiences with the development and use of poverty maps.World Resources Institute, Washington DC and United Nations Environment Programme/Global ResourcesInformation Database (UNEP-GRID) Arendal, Norway.
Hentschel, J., Lanjouw, J., Lanjouw, P., Poggi, J., 2000. Combining census and survey data to trace spatialdimensions of poverty: a case study of Ecuador. World Bank Economic Review 14 (1), 147–165.
Hijmans, R.J., Cameron, S.E., Parra, J.L., Jones, P.G., Jarvis, A., 2004. The WorldClim interpolated globalterrestrial climate surfaces. Version 1.3. Available at: http://biogeo.berkeley.edu/.
INEGI (Instituto Nacional De Estadıstica Geografıa e Informatica), 2001. Encuesta Nacional de Ingresos yGastos de los Hogares (ENIGH) 2000. INEGI, Aguascalientes, Mexico.
INEGI (Instituto Nacional De Estadıstica Geografıa e Informatica), 2002. XII Censo general de poblacion yvivienda. INEGI, Aguascalientes, Mexico.
Lipton, M., Longhurst, R., 1989. New Seeds and Poor People. Johns Hopkins University Press, Baltimore, MD.Minot, N., Baulch, B., 2002. Poverty mapping with aggregate census data: what is the loss in precision? Markets
and Structural Studies Division Discussion Paper no. 49, International Food Policy Research Institute,Washington DC.
Morris, M., Lopez-Pereira, M.A., 1999. Impacts of maize breeding research in Latin America 1966–1997. CentroInternacional de Mejoramiento de Maız y Trigo, Mexico.
Pachico, D., Hertford, R., de Janvry, A., 2000. Food Policy 25 (4), 379–388.Rivera Dommarco, J., Shamah Levy, T., Villalpando Hernandez, S., Gonzalez de Cossıo T., Hernandez Prado,
B., Sepulveda J., 2001. Encuesta nacional de nutricion 1999. Estado nutricio de ninos y mujeres en Mexico.Instituto Nacional de Salud Publica, Cuernavaca, Morelos, Mexico.
SAS Institute Inc., 1996. SAS/STAT� software: changes and enhancements through Release 6.11., Cary, NC.Skoufias, E., Davis, B., De La Vega, S., 2001. Targeting the poor in Mexico: an evaluation of the selection of
households into PROGRESA. World Development 29, 1769–1784.Ward, J.H., 1963. Hierarchical grouping to optimize an objective function. Journal of the American Statistical
Association 58, 236–244.Wishart, D., 1987. CLUSTAN user manual, fourth ed. Computing Laboratory University of St. Andrews,
Edinburgh.


![[Miscellaneous papers relating to American Indian languages]](https://static.fdokumen.com/doc/165x107/6326a2475c2c3bbfa803c960/miscellaneous-papers-relating-to-american-indian-languages.jpg)
![[Presentation Title] - United Benefit Advisors](https://static.fdokumen.com/doc/165x107/631fddf59353b08ff5016551/presentation-title-united-benefit-advisors.jpg)