Potentially neuroprotective gene modulation in an in vitro model of mild traumatic brain injury
16
1 23 Molecular and Cellular Biochemistry An International Journal for Chemical Biology in Health and Disease ISSN 0300-8177 Mol Cell Biochem DOI 10.1007/s11010-012-1541-2 Potentially neuroprotective gene modulation in an in vitro model of mild traumatic brain injury Valentina Di Pietro, Angela M. Amorini, Barbara Tavazzi, David A. Hovda, Stefano Signoretti, Christopher C. Giza, Giacomo Lazzarino, et al.
-
Upload
independent -
Category
Documents
-
view
3 -
download
0
Transcript of Potentially neuroprotective gene modulation in an in vitro model of mild traumatic brain injury

1 23
Molecular and Cellular BiochemistryAn International Journal for ChemicalBiology in Health and Disease ISSN 0300-8177 Mol Cell BiochemDOI 10.1007/s11010-012-1541-2
Potentially neuroprotective genemodulation in an in vitro model of mildtraumatic brain injury
Valentina Di Pietro, Angela M. Amorini,Barbara Tavazzi, David A. Hovda,Stefano Signoretti, Christopher C. Giza,Giacomo Lazzarino, et al.

1 23
Your article is protected by copyright and all
rights are held exclusively by Springer Science
+Business Media New York. This e-offprint is
for personal use only and shall not be self-
archived in electronic repositories. If you
wish to self-archive your work, please use the
accepted author’s version for posting to your
own website or your institution’s repository.
You may further deposit the accepted author’s
version on a funder’s repository at a funder’s
request, provided it is not made publicly
available until 12 months after publication.
Potentially neuroprotective gene modulation in an in vitromodel of mild traumatic brain injury
Valentina Di Pietro • Angela M. Amorini • Barbara Tavazzi • David A. Hovda •
Stefano Signoretti • Christopher C. Giza • Giacomo Lazzarino • Roberto Vagnozzi •
Giuseppe Lazzarino • Antonio Belli
Received: 10 September 2012 / Accepted: 6 December 2012
� Springer Science+Business Media New York 2012
Abstract In this study, we investigated the hypothesis
that mild traumatic brain injury (mTBI) triggers a con-
trolled gene program as an adaptive response finalized to
neuroprotection, similar to that found in hibernators and in
ischemic preconditioning. A stretch injury device was used
to produce an equi-biaxial strain field in rat organotypic
hippocampal slice cultures at a specified Lagrangian strain
of 10 % and a constant strain rate of 20 s-1. After 24 h
from injury, propidium iodide staining, HPLC analysis of
metabolites and microarray analysis of cDNA were per-
formed to evaluate cell viability, cell energy state and gene
expression, respectively. Compared to control cultures,
10 % stretch injured cultures showed no change in viabil-
ity, but demonstrated a hypometabolic state (decreased
ATP, ATP/ADP, and nicotinic coenzymes) and a peculiar
pattern of gene modulation. The latter was characterized by
downregulation of genes encoding for proteins of com-
plexes I, III, and IV of the mitochondrial electron transport
chain and of ATP synthase; downregulation of transcrip-
tional and translational genes; downregulation and upreg-
ulation of genes controlling the synthesis of glutamate and
GABA receptors, upregulation of calmodulin and cal-
modulin-binding proteins; proper modulation of genes
encoding for proapoptotic and antiapoptotic proteins.
These results support the hypothesis that, following mTBI,
a hibernation-type response is activated in non-hibernating
species. Unlike in hibernators and ischemic precondition-
ing, this adaptive gene programme, aimed at achieving
maximal neuroprotection, is not triggered by decrease in
oxygen availability. It seems rather activated to avoid
V. Di Pietro � A. Belli
Neuropharmacology and Neurobiology Section, School of
Clinical and Experimental Medicine, College of Medical and
Dental Sciences, University of Birmingham, Birmingham, UK
V. Di Pietro
Division of Clinical Neurosciences, School of Medicine,
University of Southampton, Southampton, UK
A. M. Amorini � B. Tavazzi � G. Lazzarino
Institute of Biochemistry and Clinical Biochemistry, Catholic
University of Rome, Rome, Italy
D. A. Hovda
Department of Neurosurgery, Department of Molecular and
Medical Pharmacology, David Geffen School of Medicine at
UCLA, UCLA Brain Injury Research Center,
Los Angeles, CA, USA
S. Signoretti
Division of Neurosurgery, Department of Neurosciences
Head and Neck Surgery, S. Camillo Hospital, Rome, Italy
C. C. Giza
Division of Pediatric Neurology, Department of Neurosurgery,
David Geffen School of Medicine at UCLA, Mattel Children’s
Hospital UCLA, UCLA Brain Injury Research Center,
Los Angeles, CA, USA
R. Vagnozzi
Division of Neurotraumatology and Neuroradiology, Department
of Biomedicine and Prevention, University of Rome Tor
Vergata, Rome, Italy
G. Lazzarino (&)
Division of Biochemistry and Molecular Biology, Department
of Biology, Geology and Environmental Sciences, University
of Catania, Viale A. Doria 6, 95125 Catania, Italy
e-mail: [email protected]
123
Mol Cell Biochem
DOI 10.1007/s11010-012-1541-2
Author's personal copy

increase in oxidative/nitrosative stress and apoptosis during
a transient period of mitochondrial malfunctioning.
Keywords Mild traumatic brain injury �Gene expression � Mitochondrial dysfunction �Hypometabolism � Hibernation � Neuroprotection
Introduction
Traumatic brain injury (TBI) is the leading cause of death
and disability under 45 years of age [1] accounting for
34 % of all deaths from trauma [2]. Advances in the
understanding of the mechanisms of TBI-induced neuronal
cell death underpin modern critical care management of the
severely injured brain [3]. However, mild TBI (mTBI) has
received far less attention and remains poorly understood
[4, 5], and it has been named the silent epidemic [6, 7].
It has been shown that mTBI leads to a transient state of
‘‘metabolic vulnerability’’ [8, 9] characterized by sudden
changes in ionic fluxes [10], release of excitatory amino
acids [11], altered rate of glucose metabolism [12], mito-
chondrial dysfunction [13–15], imbalance in energy
metabolism [16–18], and N-acetylaspartate (NAA) homeo-
stasis [19–21]. During this window of brain vulnerability, a
second mTBI may have the same dramatic consequences
observed after a severe TBI [9, 18]. Differential gene
expression following graded TBI has been demonstrated in a
rat model of lateral fluid percussion [22, 23] and in a model of
organotypic hippocampal slice cultures (OHSC) [24],
strongly suggesting that changes in gene expression are
strictly related to injury severity. In mTBI, characterized by
minimal or absent permanent histopathological damage, this
gene modulation may be interpreted as an adaptive strategy
to achieve neuroprotection. This strategy would require an
optimization of the metabolic rate during the transient met-
abolic depression following mTBI. If this was the case, it
should be possible to evidence clear molecular signs of
controlled hypometabolism in post-injured cerebral cells.
An example of hypometabolism in nature is hibernation, a
behavioral, physiological, and molecular adaptation to with-
stand protracted periods or seasons of insufficient or unpre-
dictable food availability, during which gene modulation
aimed to obtain neuroprotection has been demonstrated [25].
Similar to hibernation, ischemic preconditioning is another
example of adaptive hypometabolism. Through selective
changes in the gene expression [26] it increases tolerance to
sustained, long-term ischemia in the myocardium [27–29] and
it decreases ischemic brain damage caused by prolonged
middle cerebral artery occlusion, if preceded by brief, tran-
sient ischemic period [30].
Using a microarray approach, we hypothesized that a
stretch injury equivalent to mTBI would modulate gene
expression of specific metabolic pathways and cell func-
tions to achieve transitory hypometabolism and consequent
energy conservation. Similarities and differences between
mTBI and hibernation, aimed at evaluating the existence of
a cell program of neuroprotection based on gene modula-
tion, are presented.
Materials and methods
Preparation of OHSC and stretch induction
The OHSC were prepared using a method initially descri-
bed by Morrison et al. [31] and all procedures used were in
accordance with UK regulations under the Animals (Sci-
entific Procedures) Act of 1986.
Briefly, hippocampi from 8- to 10-day-old male Wistar
rats were isolated and sliced at a thickness of 400 lm,
using a McIlwain tissue chopper (Harvard Apparatus,
Edenbridge, UK). The slices were then placed on a silicone
membrane (0.25 mm; Specialty Manufacturing, Saginaw,
MI) attached to a custom-made stainless steel well, which
was previously treated with a coating solution of 320 lg/
mL of poly-D-lysine (Sigma) and 80 lg/mL of laminin
(Sigma) in sterile distilled water. The cultures were fed
initially in 1,200-lL NeuroBasal-A medium (Invitrogen,
UK), containing B27 supplement (Invitrogen) (1-mL/100-
mL medium), 5-mg/mL glucose (Sigma), 1-mM glutamine
(Sigma) and incubated at 37 �C in 95 % O2 ? 5 % CO2.
After 2 days in vitro, the NeuroBasal-A medium was
replaced with full serum-containing medium, consisting of
25 % heat-inactivated horse serum, 25 % Hanks’-balanced
salt solution, 50 % minimum essential medium (all Invit-
rogen), 1-mM glutamine (Sigma), and 5-mg/mL D-glucose
(Sigma). After approximately 10 days, when cultures
adhered to the membrane and showed clear definition of
the neuronal regions-CA1, CA3 and dentate gyrus [31], the
medium was removed from the healthy cultures and the
wells were clamped to the stretch injury device. The
stainless steel well and silicone membrane were then dis-
placed over a fixed, hollow indenter to generate an equi-
biaxial strain field, subjecting the cultures to a single
stretch injury at a specified Lagrangian strain of 10 % and a
constant strain rate of 20 s-1, known to induce cell injury
with no decrease in viability, thus being comparable to
mTBI. The strain was controlled by a linear actuator (BEI
Kimco), and maintained under feedback control through a
linear encoder (Renishaw, UK) and motion control board
(Precision Motion Dynamics, Canada). Forty-five OHSC
were prepared. Fifteen of them were incubated for 24 h at
37 �C in 95 % O2 ? 5 % CO2 and used as controls. Of the
30 OHSC receiving a 10 % stretch injury, half were
incubated for 24 h and half for 72 h, under the same
Mol Cell Biochem
123
Author's personal copy

conditions of controls. At the end of incubations, both five
controls and ten 10 % stretched OHSC (of these, five
incubated for 24 and five for 72 h) were used to measure
viability. The remaining 10 OHSC of each group (controls,
10 % stretched at 24 and 72 h) were pooled and divided
into two aliquots: one was used to carry out the gene
expression analysis and the other was used to carry out the
HPLC assay of metabolites. The above reported experi-
ment was repeated three times for a total of 45 control
OHSC and 90 10 % stretched OHSC.
Propidium iodide (PI) fluorescence and cDNA
microarray
At the desired time point, 5 lg/mL of PI (Molecular
Probes, Paisley, UK) was added to the medium for 2 h; the
cultures were then examined under a Leica DM-IRBE
epifluorescence microscope (Leica Microsystems Ltd.,
UK) to assess the percentage of cell death. Images were
acquired using a 5XNA 0.12 lens and a cooled Hamamatsu
camera, and analyzed with Volocity (Improvision, UK)
3-D imaging software. The mean percentage area of PI
fluorescence for controls and the two 10 % stretched
OHSC were analyzed and compared.
Total RNA was extracted from tissue cultures in a mon-
ophasic solution of phenol and guanidine isothiocyanate
(Trizol; Invitrogen) as previously described [18]. The
integrity and concentration of the total RNA were deter-
mined using the RNA 6000 Nano Assay Kit and a Bioana-
lyzer 2100 according to the manufacturer’s protocols
(Agilent, UK). The labelling of complementary RNA
(cRNA) with the fluorophores cyanine-3 (cy-3) and cyanine-
5 (cy-5) (PerkinElmer/NEN Life Sciences, UK) and its
subsequent amplification was completed using the Low
RNA Input Linear Amplification Kit (Agilent) according to
the manufacturer’s protocol. The cRNA was assessed using a
NanoDrop ND-3300 Fluorospectrometer (Agilent) to ensure
that sufficient cRNA of appropriate quality had been pre-
pared. Once labelling was completed, equal amounts of cy-3-
and cy-5-labeled probes were simultaneously applied to a
4X44 K whole rat genome microarray (Design 14879; Ag-
ilent) for a competitive hybridization reaction using a gene
expression hybridization kit (Agilent), according to the
manufacturer’s protocol. Following hybridization, the array
was washed using the gene expression wash buffer kit (Ag-
ilent), dried and then scanned using a DNA microarray
scanner (Agilent). The microarray datasets, preprocessed by
Agilent Feature Extraction software, were analyzed by
Genespring GX 10.0.2. Automatic flags applied by the
Feature Extraction software were used to localize and
excluded from the analysis if any probe that was non-uni-
form, population outliers, saturated, absent, not positive, and
significant, or not above background. The signal from each
spot was calculated as the average intensity minus the
average local background. Expression ratios of cy-5:cy-3
were normalized using LOESS, a method that takes into
account and corrects for intensity-dependent artefacts in the
measurements. The mean log2 ratios for each probe were
found across the two replicates, and the probes that revealed a
[1.5-fold difference in expression (higher or lower) com-
pared to the control sample were identified. Genes of interest
were divided into six categories (Tables 1, 2, 3, 4, 5, 6).
Real-time-quantitative polymerase chain reaction
(RT-qPCR)
Also with the aim to confirm the microarray data, all genes
presented in Table 1 (Ndufa11, ND1, ND2, ND5, CYTB,
COX2, COX3, ATP5J) have been analyzed in RT-qPCR
either in control or in 10 % stretched cells at 24- and 72-h
post-injury. Initially, the reverse transcription of total RNA
was performed for all samples. Subsequently, 1 lg of total
RNA, 500 ng of oligo dT primers (Roche Molecular Bio-
chemicals, UK), and 200 U of Superscript II Reverse
Table 1 ETC genes
Gene
symbol
Gene name Transcript ID Gene
regulation
Fold
change
Ndufa11 NADH dehydrogenase (ubiquinone) 1 alpha subcomplex 11 NM_212517 Down -2.09
ND1 NADH dehydrogenase subunit 1 TC615875 Down -2.42
ND2 NADH dehydrogenase subunit 2 ENSRNOT00000040993 Down -2.18
ND5 NADH dehydrogenase subunit 5 ENSRNOT00000048767 Down -2.09
CYTB Cytochrome B, complex III ENSRNOT00000042098 Down -2.11
COX2 Cytochrome oxidase C, subunit 2 ENSRNOT00000043693 Down -2.14
COX3 Cytochrome oxidase, subunit 3 ENSRNOT00000049683 Down -2.12
ATP5J ATP synthase, H? transporting, mitochondrial F0 complex, subunit
F6
NM_053602 Down -2.11
Gene expression analysis of ETC genes (complexes I, III, IV, and V), 24 h after mTBI. Genespring GX 10.0.2 was set to cut-off the changes in
the range ±1.5-fold
Mol Cell Biochem
123
Author's personal copy
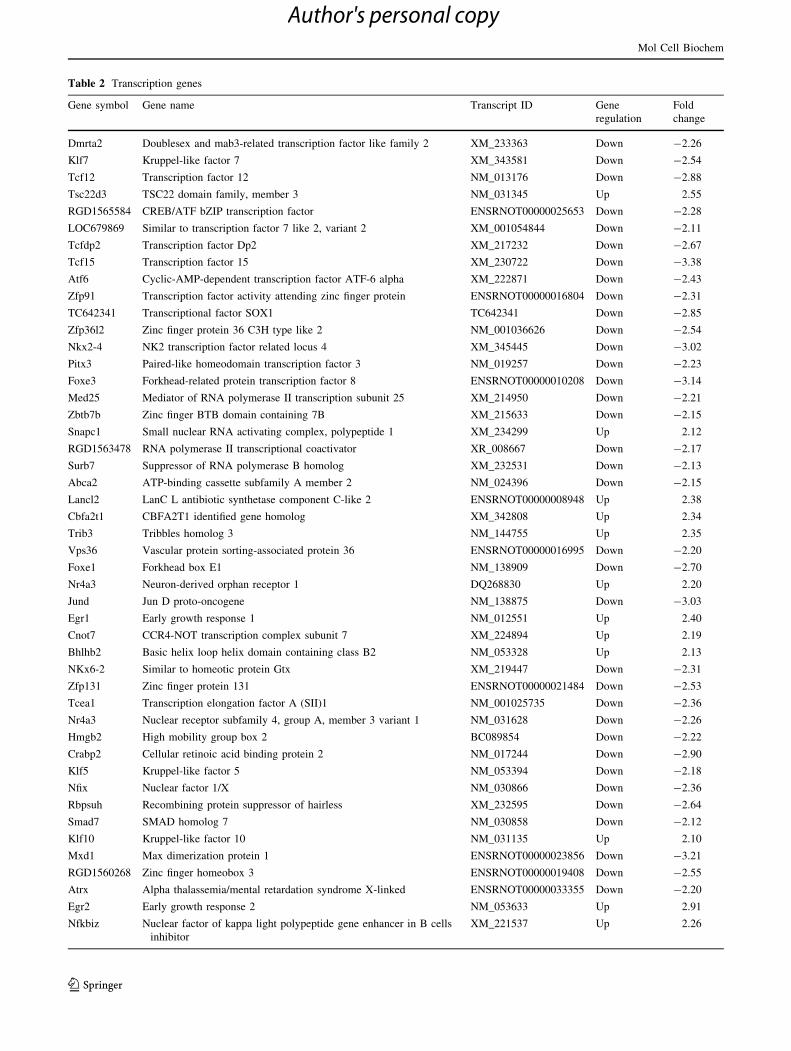
Table 2 Transcription genes
Gene symbol Gene name Transcript ID Gene
regulation
Fold
change
Dmrta2 Doublesex and mab3-related transcription factor like family 2 XM_233363 Down -2.26
Klf7 Kruppel-like factor 7 XM_343581 Down -2.54
Tcf12 Transcription factor 12 NM_013176 Down -2.88
Tsc22d3 TSC22 domain family, member 3 NM_031345 Up 2.55
RGD1565584 CREB/ATF bZIP transcription factor ENSRNOT00000025653 Down -2.28
LOC679869 Similar to transcription factor 7 like 2, variant 2 XM_001054844 Down -2.11
Tcfdp2 Transcription factor Dp2 XM_217232 Down -2.67
Tcf15 Transcription factor 15 XM_230722 Down -3.38
Atf6 Cyclic-AMP-dependent transcription factor ATF-6 alpha XM_222871 Down -2.43
Zfp91 Transcription factor activity attending zinc finger protein ENSRNOT00000016804 Down -2.31
TC642341 Transcriptional factor SOX1 TC642341 Down -2.85
Zfp36l2 Zinc finger protein 36 C3H type like 2 NM_001036626 Down -2.54
Nkx2-4 NK2 transcription factor related locus 4 XM_345445 Down -3.02
Pitx3 Paired-like homeodomain transcription factor 3 NM_019257 Down -2.23
Foxe3 Forkhead-related protein transcription factor 8 ENSRNOT00000010208 Down -3.14
Med25 Mediator of RNA polymerase II transcription subunit 25 XM_214950 Down -2.21
Zbtb7b Zinc finger BTB domain containing 7B XM_215633 Down -2.15
Snapc1 Small nuclear RNA activating complex, polypeptide 1 XM_234299 Up 2.12
RGD1563478 RNA polymerase II transcriptional coactivator XR_008667 Down -2.17
Surb7 Suppressor of RNA polymerase B homolog XM_232531 Down -2.13
Abca2 ATP-binding cassette subfamily A member 2 NM_024396 Down -2.15
Lancl2 LanC L antibiotic synthetase component C-like 2 ENSRNOT00000008948 Up 2.38
Cbfa2t1 CBFA2T1 identified gene homolog XM_342808 Up 2.34
Trib3 Tribbles homolog 3 NM_144755 Up 2.35
Vps36 Vascular protein sorting-associated protein 36 ENSRNOT00000016995 Down -2.20
Foxe1 Forkhead box E1 NM_138909 Down -2.70
Nr4a3 Neuron-derived orphan receptor 1 DQ268830 Up 2.20
Jund Jun D proto-oncogene NM_138875 Down -3.03
Egr1 Early growth response 1 NM_012551 Up 2.40
Cnot7 CCR4-NOT transcription complex subunit 7 XM_224894 Up 2.19
Bhlhb2 Basic helix loop helix domain containing class B2 NM_053328 Up 2.13
NKx6-2 Similar to homeotic protein Gtx XM_219447 Down -2.31
Zfp131 Zinc finger protein 131 ENSRNOT00000021484 Down -2.53
Tcea1 Transcription elongation factor A (SII)1 NM_001025735 Down -2.36
Nr4a3 Nuclear receptor subfamily 4, group A, member 3 variant 1 NM_031628 Down -2.26
Hmgb2 High mobility group box 2 BC089854 Down -2.22
Crabp2 Cellular retinoic acid binding protein 2 NM_017244 Down -2.90
Klf5 Kruppel-like factor 5 NM_053394 Down -2.18
Nfix Nuclear factor 1/X NM_030866 Down -2.36
Rbpsuh Recombining protein suppressor of hairless XM_232595 Down -2.64
Smad7 SMAD homolog 7 NM_030858 Down -2.12
Klf10 Kruppel-like factor 10 NM_031135 Up 2.10
Mxd1 Max dimerization protein 1 ENSRNOT00000023856 Down -3.21
RGD1560268 Zinc finger homeobox 3 ENSRNOT00000019408 Down -2.55
Atrx Alpha thalassemia/mental retardation syndrome X-linked ENSRNOT00000033355 Down -2.20
Egr2 Early growth response 2 NM_053633 Up 2.91
Nfkbiz Nuclear factor of kappa light polypeptide gene enhancer in B cells
inhibitor
XM_221537 Up 2.26
Mol Cell Biochem
123
Author's personal copy

Transcriptase in a total volume of 20 lL of 1 9 first-strand
buffer (Invitrogen) were incubated at 42 �C for 60 min.
The concentration and purity of the resulting cDNA was
determined with a ND-1000 UV–Vis Spectrophotometer
(NanoDrop). RT-qPCR was carried out on the single-
stranded cDNA yielded from the reverse transcription
using a one-step PCR kit, Rat Custom RT-qPCR assay for
use with SYBR green chemistry (PrimerDesign Ltd.,
Southampton, UK), and a Bio-Rad iCycler iQ5 PCR
Thermal Cycler (Bio-Rad, Hercules, CA, USA) according
to the manufacturer’s protocol, for 40 cycles. The primers
for the genes selected for RT-qPCR were designed using
Primer 3 Input software (primer3_www.cgi v.0.2). For
accurate gene expression measurements with RTqPCR, the
constitutively expressed housekeeping gene hypoxanthine
phosphoribosyltransferase 1 (HPRT 1, Rattus norvegicus,
NM_012583.2) was selected after verifying that there was
no relevant differences between control and treated sam-
ples. At the end of reactions, melting curves were gener-
ated to check the specificity of PCR reactions. The relative
levels of mRNA expression for each gene in each sample
were calculated according to the 2-DDCt method.
OHSC processing and HPLC analysis of metabolites
Cultures (controls and 10 % stretched after 24 or 72 h) were
deproteinized using an organic solvent deproteinization pro-
cedure previously reported [32]. Each protein-free sample was
filtered through a 0.45-lm HV Millipore filter (Millipore
Corp., Billerica, MA) and loaded (20 lL) onto a Hypersil
C-18, 250 9 4.6 mm, 5-lm particle size column, provided
with its own guard column (Thermo Fisher Scientific, Milan,
Italy) and connected to a high-performance liquid chroma-
tography (HPLC) apparatus consisting of a SpectraSystem
Table 2 continued
Gene symbol Gene name Transcript ID Gene
regulation
Fold
change
Foxc2 Forkhead box C2 XM_001079064 Down -3.38
Pou3f4 Pou domain, class 3, transcription factor 4 NM_017252 Down -2.20
Scand1 SCAN domain containing 1 XM_342558 Down -2.19
Mnt Max-binding protein XM_220698 Down -2.39
Brd1 Bromodomain containing 1 XM_235552 Down -2.77
Prrx2 Paired-related homeobox 2 XM_238327 Down -3.19
Nr4a1 Nuclear receptor subfamily 4, group A, member 1 NM_024388 Up 2.47
Trak2 Trafficking protein, kinesin binding 2 NM_133560 Down -2.18
Fos FBJ murine osteosarcoma viral oncogene homolog NM_022197 Up 2.17
Hand1 Heart and neural crest derivatives expressed transcript 1 BC097327 Down -2.12
Egr4 Early growth response 4 NM_019137 Up 2.87
Zfhx1b Zinc finger E-box-binding homeobox 2 NM_001033701 Down -2.47
Cdkn1c Cyclin-dependent kinase inhibitor 1C(P57), variant 1 NM_001033757 Down -2.12
Cdkn1c Cyclin-dependent kinase inhibitor 1C(P57), variant 3 NM_182735 Down -2.50
LOC257642 rRNA promoter-binding protein transcription factor binding NM_147136 Down -2.64
Hist3h2a Histone cluster 3, H2a NM_021840 Down -2.34
H2a Histone H2A type 1-F ENSRNOT00000059342 Down -2.65
Hist3h2ba Histone cluster 3, H2ba XM_220506 Down -2.14
Hist1h2af Histone cluster 1, H2af NM_001024282 Down -2.34
Myst3 Histone acetyltransferase 3 ENSRNOT00000037389 Down -2.42
RGD1562724 Similar to H3 family XM_225322 Down -2.14
H3f3b Histone H3 family 3B BC086580 Down -2.12
Hbxap Histone binding XM_218939 Down -2.50
Hist1H2aa Histone cluster 1, H2aa NM_021839 Down -2.16
Hist1h2bm Histone cluster 1, H2bm XM_341530 Down -2.28
Hist2h2be Histone cluster 2, H2be XM_227459 Down -2.13
Hist1h4b Histone cluster 1, H4b NM_022686 Down -2.61
Gene expression analysis of genes involved in the transcription process (transcription factors and cofactors, activators of the RNA polymerase,
negative and positive regulator of transcription, rRNA promoter binding proteins and histone proteins), 24 h after mTBI. Genespring GX 10.0.2
was set to cut-off the changes in the range ±1.5-fold
Mol Cell Biochem
123
Author's personal copy

P2000 pump system (Thermo Fisher Scientific) and a highly
sensitive UV6000LP diode array detector (Thermo Fisher
Scientific) equipped with a 5-cm light path flow cell and setup
between 200- and 300-nm wavelength. Data acquisition and
analysis were performed using a personal computer and the
ChromQuest software package provided by the HPLC man-
ufacturer (Thermo Fisher Scientific).
Metabolites related to cell energy state and mitochon-
drial function (ATP, ADP, AMP, oxypurines, nucleosides,
nicotinic coenzymes) were separated, in a single chro-
matographic run, according to a gradient modification of an
existing ion-pairing HPLC method [33]. Assignment and
calculation of the compounds of interest in chromato-
graphic runs of cell extracts were carried out at 260-nm
wavelength by comparing retention times, absorption
spectra, and areas of peaks with those of peaks of chro-
matographic runs of freshly prepared ultrapure standard
mixtures with known concentrations.
Statistical analysis
In microarray analysis, a two-sample t test, corrected by
Benjamini–Yekutieli for multiple testing was used to
evaluate significant differences among groups. Differences
were considered to be statistically significant if p \ 0.05.
Comparison of metabolite concentrations in control and
10 % stretched cultures was carried out using two-tailed
t tests with Bonferroni correction for multiple comparisons.
Differences were considered to be statistically significant if
p \ 0.05.
Table 3 Translation genes
Gene symbol Gene name Transcript ID Gene regulation Fold change
Eif4g3 Eukaryotic translation initiation factor 4 gamma, 3 XM_216563 Down -3.61
Eif4g1 Eukaryotic translation initiation factor 4 gamma, 1 XM_213569 Down -2.24
Eif3s10 Eukaryotic translation initiation factor 3, subunit 10 NM_001047087 Down -2.65
Eif4g2 Eukaryotic translation initiation factor 4 gamma, 2 ENSRNOT00000023040 Down -2.78
Tcea1 Translation elongation factor A (SII) 1 NM_001025735 Down -2.36
LOC288019 Similar to eukaryotic translation elongation factor 1a1 XM_006893 Up 2.14
LOC315661 Eukaryotic translation elongation factor 1a2 XR_006926 Up 2.31
Rpl15 Ribosomal protein L15 M83679 Down -2.13
RGD1565566 Similar to 60S ribosomal protein L18a XM_574336 Down -2.82
Mrpl51 Mitochondrial ribosomal protein L51 XM_216269 Down -2.22
LOC682368 Ribosomal protein L28 XM_001061225 Down -2.16
RGD1565258 Similar to 40S ribosomal protein S17 XM_344408 Down -2.45
Rps20 Ribosomal protein S20 NM_001007603 Down -2.21
Mrpl11 Mitochondrial ribosomal protein L11 NM_001006973 Down -2.16
Fau Finkel-Biskis-Reilly murine sarcoma virus NM_001012739 Down -2.10
Gspt1 G1 to S phase transition 1 NM_001003978 Down -2.15
Gene expression analysis of genes involved in the translation process (initiation and elongation factors, structural constituents of ribosome), 24 h
after mTBI. Genespring GX 10.0.2 was set to cut-off the changes in the range ±1.5-fold
Table 4 Calcium-related (A) neuromodulation and (B) calmodulin and calmodulin-binding proteins
Gene symbol Gene name Transcript ID Gene regulation Fold change
(A)
Gria2 Glutamate receptor, ionotropic, AMPA 2 NM_017261 Up 2.12
Gabra1 Gamma-aminobutyric acid (GABA) A receptor, alpha 1 NM_183326 Up 2.15
Grin2d Glutamate receptor, ionotropic, N-methyl D-aspartate 2D NM_022797 Down -3.29
(B)
Calm3 Calmodulin3-phosphorylase kinase, delta NM_012518 Up 2.16
Rgs4 Calmodulin binding- regulator of G protein signalling 4 NM_017214 Up 2.16
Gap43 Calmodulin binding- grow associated protein 43-axonal regeneration NM_017195 Up 2.09
(A) Gene expression analysis of genes involved in the neuromodulation process, 24 h after mTBI. Genespring GX 10.0.2 was set to cut-off the
changes in the range ±1.5-fold. (B) Gene expression analysis of calmodulin and calmodulin-binding genes, 24 h after mTBI. Genespring GX
10.0.2 was set to cut-off the changes in the range ±1.5-fold
Mol Cell Biochem
123
Author's personal copy
Results
Evaluation of cell viability following 10 % stretch
injury by PI fluorescence
Viability of the slice cultures was observed at 24 and 72 h
after 10 % stretch or 24-h incubation in the case of con-
trols. The percentage area of red fluorescence compared to
the total area of the hippocampal slice of each image was
later analyzed. Comparing the stretch groups with controls,
the 10 % stretched slices either at 24- or 72-h post-injury
did not show significant differences in cell death (mean cell
death 2.56 ± 0.38 % in controls; 3.07 ± 1.01 % in 10 %
stretched at 24 h, 4.22 ± 1.88 % in 10 % stretched at
72 h), as expected for this model and severity of mTBI.
Analysis of the cell energy state and mitochondrial-
related metabolism
As representative parameters to evaluate the cell energy
state, ATP and ADP were measured in controls and 10 %
stretched OHSC at 24- or 72-h post-injury (Fig. 1a). Sig-
nificant depletion in ATP and concomitant increase in ADP
were observed in injured cells at 24 h after stretch
(p \ 0.01 in comparison to control), while normalization of
both energy metabolism-related parameters were recorded
72 h after stretch (not significant respect to controls;
p \ 0.001 respect to 24 h). At 24-h post-injury, this change
in both metabolites was responsible for a 44 % decrease in
the ATP/ADP ratio, an index of mitochondrial phosphor-
ylating capacity, which was viceversa not different from
control OHSC after 72 h from stretch induction (Fig. 1b).
As a consequence of an imbalance in ATP production and
consumption, the 10 % stretched OHSC at 24 h showed a
significant increase in the concentrations of the dephos-
phorylated ATP catabolites oxypurines (hypoxanthine,
xanthine, and uric acid) and nucleosides (inosine and
adenosine), with respect either to the corresponding values
recorded in control OHSC or to the values observed after
72 h of recovery from injury (Fig. 2a). The same Fig. 2b
illustrates the effect of the stretch injury on the sum of
reduced and oxidized nicotinic coenzymes NADH ? -
NAD? and NADPH ? NADP?. A general decrease in the
concentration of the nicotinic coenzyme pool was observed
in 10 % stretch OHSC 24 h after stretch with respect to
either controls or OHSC after 72 h of recovery (p \ 0.01).
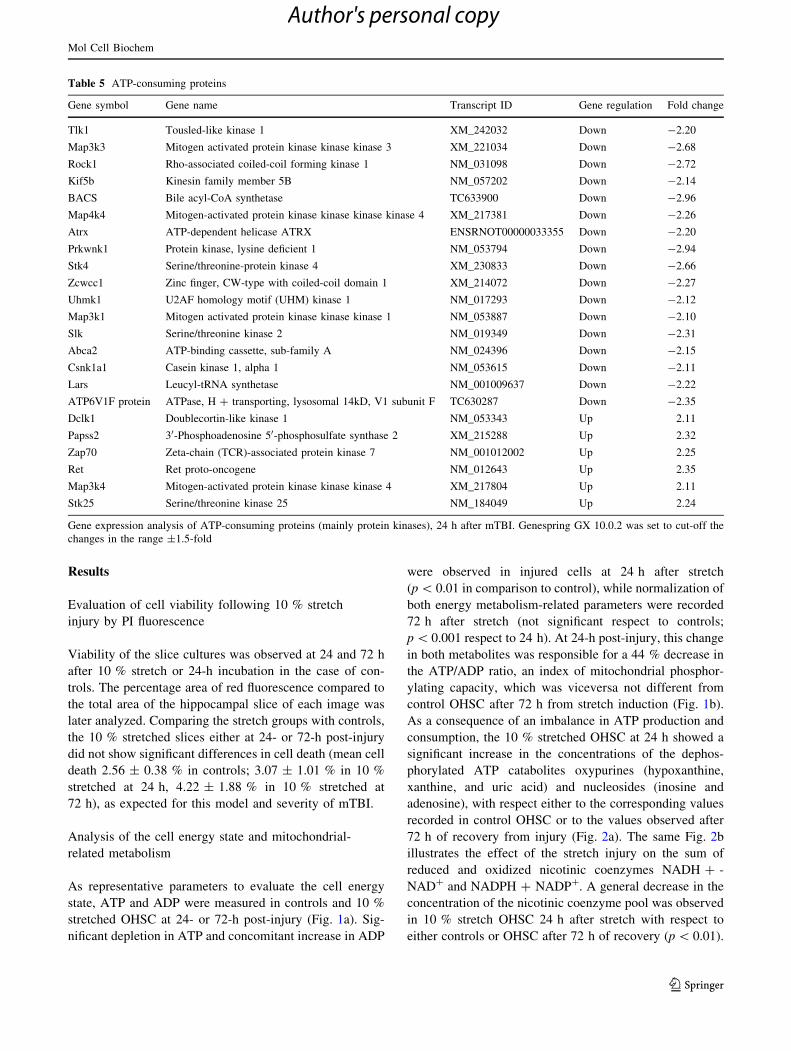
Table 5 ATP-consuming proteins
Gene symbol Gene name Transcript ID Gene regulation Fold change
Tlk1 Tousled-like kinase 1 XM_242032 Down -2.20
Map3k3 Mitogen activated protein kinase kinase kinase 3 XM_221034 Down -2.68
Rock1 Rho-associated coiled-coil forming kinase 1 NM_031098 Down -2.72
Kif5b Kinesin family member 5B NM_057202 Down -2.14
BACS Bile acyl-CoA synthetase TC633900 Down -2.96
Map4k4 Mitogen-activated protein kinase kinase kinase kinase 4 XM_217381 Down -2.26
Atrx ATP-dependent helicase ATRX ENSRNOT00000033355 Down -2.20
Prkwnk1 Protein kinase, lysine deficient 1 NM_053794 Down -2.94
Stk4 Serine/threonine-protein kinase 4 XM_230833 Down -2.66
Zcwcc1 Zinc finger, CW-type with coiled-coil domain 1 XM_214072 Down -2.27
Uhmk1 U2AF homology motif (UHM) kinase 1 NM_017293 Down -2.12
Map3k1 Mitogen activated protein kinase kinase kinase 1 NM_053887 Down -2.10
Slk Serine/threonine kinase 2 NM_019349 Down -2.31
Abca2 ATP-binding cassette, sub-family A NM_024396 Down -2.15
Csnk1a1 Casein kinase 1, alpha 1 NM_053615 Down -2.11
Lars Leucyl-tRNA synthetase NM_001009637 Down -2.22
ATP6V1F protein ATPase, H ? transporting, lysosomal 14kD, V1 subunit F TC630287 Down -2.35
Dclk1 Doublecortin-like kinase 1 NM_053343 Up 2.11
Papss2 30-Phosphoadenosine 50-phosphosulfate synthase 2 XM_215288 Up 2.32
Zap70 Zeta-chain (TCR)-associated protein kinase 7 NM_001012002 Up 2.25
Ret Ret proto-oncogene NM_012643 Up 2.35
Map3k4 Mitogen-activated protein kinase kinase kinase 4 XM_217804 Up 2.11
Stk25 Serine/threonine kinase 25 NM_184049 Up 2.24
Gene expression analysis of ATP-consuming proteins (mainly protein kinases), 24 h after mTBI. Genespring GX 10.0.2 was set to cut-off the
changes in the range ±1.5-fold
Mol Cell Biochem
123
Author's personal copy

In summary, biochemical parameters related to the cell
energy metabolism and mitochondrial functions clearly
indicate a transient state of hypometabolism induced by a
stretch injury consistent with mTBI.
Changes in gene expression following stretch injury
Data of cDNA microarray of selected groups of genes are
given in Tables 1, 2, 3, 4, 5, 6. The expression profile of
genes encoding for protein subunits of the complexes I, III,
and IV of the electron transport chain (ETC) and of ATP
synthase (complex V) that were affected by stretch injury
at 24-h post-damage, are reported in Table 1. These results
show that the genes responsible for the synthesis of com-
plex I subunits (specifically, Ndufa11 synthesizing NADH
dehydrogenase-ubiquinone 1 alpha subcomplex 11, ND1
synthesizing NADH dehydrogenase subunit 1, ND2 syn-
thesizing NADH dehydrogenase subunit 2 and ND5 syn-
thesizing NADH dehydrogenase subunit 5), of complex III
subunits (specifically, CYTB synthesizing cytochrome B,
complex III), and of complex IV subunits (specifically,
COX2 synthesizing cytochrome oxidase C, subunit 2 and
COX3 synthesizing cytochrome oxidase C, subunit 3) were
downregulated in this model of mTBI. Additionally, the
gene ATP5J encoding for ATP synthase, H? transporting,
mitochondrial F0 complex, subunit F6, exhibited a similar
two-fold decrease in expression, thereby indicating not
only a reduction in the overall capacity to transfer electrons
in the ETC but also a decrease in the proton pumping
through complex V necessary for ATP biosynthesis.
Microarray data of genes involved in the regulation of
the transcriptional machinery that were affected by 10 %
stretch injury (comparable in damage to a mTBI) are
illustrated in Table 2. Results indicate that the expression
of 74 genes encoding for transcriptional factors and
cofactors, activators of RNA polymerase, rRNA promoter-
binding proteins and histone proteins, was differently
influenced by the 10 % stretch injury with respect to con-
trols. Among these 74 genes, 59 were downregulated and
only 15 were upregulated. It is worth noting that 4 of the
upregulated genes (Lancl2, Cbfa2t1, Trib3, Bhlhb2) are
negative regulators of transcription. Hence, the final result
is that 10 % stretched OHSC exhibited an overall inhibi-
tion of transcription processes.
The effect of the 10 % stretch injury on genes involved in
the translational process, encoding for initiation and elon-
gation factors and structural constituents of ribosome, are
summarized in Table 3. These results showed significant
Table 6 Apoptosis-related (A) proapoptotic genes and (B) antiapoptotic genes
Gene symbol Gene name Transcript ID Gene regulation Fold change
(A)
Sh3glb1 SH3-domain GRB2-like B1 NM_001011929 Down -2.23
Rock1 Rho-associated coiled-coil forming kinase 1 NM_031098 Down -2.72
Stk4 Serine/threonine-protein kinase 4 XM_230833 Down -2.66
Tnfsf12 Tumor necrosis factor ligand superfamily member 12 NM_001001513 Down -2.21
Phlda1 Pleckstrin homology-like domain, family A, member 1 NM_017180 Down -2.17
Map3k1 Mitogen-activated protein kinase kinase kinase 1 NM_053887 Down -2.10
Klf10 Kruppel-like factor 10 NM_031135 Up 2.10
Ddit4 DNA-damage-inducible transcript 4 NM_080906 Up 2.18
Trib3 Tribbles homolog 3 NM_144755 Up 2.35
Nr4a1 Nuclear receptor subfamily 4, group A, member 1 NM_024388 Up 2.47
Vdac1 Voltage-dependent anion channel 1 NM_031353 Up 2.53
(B)
Ccl2 Chemokine (C–C motif) ligand 2 NM_031530 Up 2.48
Vegfa Vascular endothelial growth factor A NM_031836 Up 2.18
Birc3 Baculoviral IAP repeat-containing 3 NM_023987 Up 2.16
Tsc22d3 TSC22 domain family 3 NM_031345 Up 2.55
Bnip3 BCL2/adenovirus E1B 19-kDa interacting protein 3 NM_053420 Up 2.22
Son Son DNA binding protein ENSRNOT00000002769 Down -2.13
Gstp1 Glutathione-S-transferase, pi 1 NM_012577 Down -2.11
Gdnf Glial cell line derived neurotrophic factor NM_019139 Down -3.51
(A) Gene expression analysis of proapoptotic genes, 24 h after mTBI. Genespring GX 10.0.2 was set to cut-off the changes in the range ±1.5-
fold. (B) Gene expression analysis of antiapoptotic genes, 24 h after mTBI. Genespring GX 10.0.2 was set to cut-off the changes in the
range ±1.5-fold
Mol Cell Biochem
123
Author's personal copy

changes in the expression of 16 differentially regulated
genes, among which 14 were downregulated and only 2
upregulated.
Table 4 summarizes the effect of the 10 % stretch injury
on genes responsible for the synthesis of proteins involved
in neuromodulation (A) and of calmodulin and calmodulin-
binding proteins (B). The upregulation of the expression of
the alpha 1 GABA A receptor, of the AMPA2 subunit of
the ionotropic AMPA receptors, and the simultaneous
downregulation of the ionotropic, NMDA2D glutamate
receptor, indicate a complex response of OHSC injured
cells aimed to avoid excitoxicity caused by mTBI-induced
glutamate release and to counteract glutamate-mediated
Ca2? overloading. Such a gene strategy was also evident
by the upregulation of the genes encoding for calmodulin
and calmodulin-binding proteins (b). In particular, the
upregulation of Rgs4 had multiple effects, i.e., reducing the
glutamate signalling and inhibiting MAP kinase activity,
while the simultaneous upregulation of Calm3 and Gap 43
conferred an increased cell resistance to calcium-mediated
toxicity.
In Table 5, we report the change in expression of 23
genes responsible for the codification of ATP-consuming
proteins, 17 of which were downregulated and only 6 were
upregulated. Fourteen of these 23 genes encode for protein
kinases; out of these 14, 10 were downregulated, while the
remaining 4 were upregulated by the 10 % stretch injury. It
is of note that the downregulation of the Map3k1 gene and
upregulation of the Map3k4 gene, the protein products of
which (MEKK1 or mitogen-activated protein kinase kinase
1 and MEKK4 or mitogen-activated protein kinase kinase
4, respectively) are operative in the complex MAP kinase
pathway which regulates a conspicuous number of cellular
Fig. 2 Concentrations of oxypurines (hypoxanthine xanthine and uric
acid) and nucleosides (inosine, adenosine and guanosine) (a), deriving
from ATP catabolism, and values of nicotinic coenzymes (b) in
control and 10 % stretched organotypic hippocampal cell slices
(OHSC). Values are the mean of three experiments in which five
OHSC preparations were pooled either after 24-h incubation only
(controls), or after 10 % stretch injury and 24-h incubation (10 %
stretched). Standard deviations are represented by vertical bars.
Experimental conditions for OHSC preparation, stretch injury induc-
tion and HPLC conditions for metabolite determination are fully
described in ‘‘Materials and methods’’. *Significantly different from
controls (p \ 0.05)
Fig. 1 Concentrations of ATP and ADP (a) and values of the ATP/
ADP ratio (b), as a measure of the mitochondrial phosphorylating
capacity, in control and 10 % stretched OHSC. Values are the mean
of three experiments in which five OHSC preparations were pooled
either after 24-h incubation only (controls), or after 10 % stretch
injury and 24-h incubation (10 % stretched). Standard deviations are
represented by vertical bars. Experimental conditions for OHSC
preparation, stretch injury induction and HPLC conditions for
metabolite determination are fully described in ‘‘Materials and
methods’’. *Significantly different from controls (p \ 0.05)
Mol Cell Biochem
123
Author's personal copy

processes including activation of c-Jun and therefore
apoptosis. In general, it can be affirmed that one of the
responses of OHSC to mTBI is to decrease intracellular
signaling and, indirectly, to decrease ATP consumption.
The effects of the 10 % stretch injury on the expression
of proapoptotic and antiapoptotic genes, observed at 24-h
post-damage induction, are summarized in Table 6. Eleven
proapoptotic genes showed significant change in expres-
sion, 6 of which were downregulated and 5 were upregu-
lated (Table 6A), while 8 antiapoptotic genes underwent
significant modulation, 5 of which were upregulated and 3
downregulated (Table 6B). In accordance with our previ-
ous genontology results showing no induction of the genes
controlling the apoptotic process [24], the present results
indicate that the differential pattern in the expression of
proapoptotic and antiapoptotic genes leads to an overall
inhibition of apoptosis.
Real-time-quantitative polymerase chain reaction
To confirm the microarray data, as well as to verify whe-
ther changes in the expression of genes related to the
mitochondrial ETC were transitory and dependent on the
time interval from injury, we evaluated by RT-qPCR the
expression of Ndufa11, ND1, ND2, ND5, CYTB, COX2,
COX3, ATP5J in controls and 10 % stretched OHSC at 24
and 72 h from injury. As illustrated in Table 7, the RT-
qPCR data confirmed the decrease in expression of these
selected genes at 24-h post-injury, in perfect accordance
with what recorded with microarray (Table 1). Further-
more, measurement performed 72 h after the 10 % stretch
clearly indicates that expression of the ETC genes returned
to levels not different from those determined in controls.
Discussion
Transient mitochondrial malfunctioning following mTBI is
a well-established phenomenon [34, 35] leading to an
overall derangement of cell energy state and metabolism
(decrease in ATP, ATP/ADP ratio, creatine, creatine
phosphate, acetyl-CoA, N-acetylaspartate, etc.) [9, 17, 18,
36, 37]. In the present model of OHSC receiving a 10 %
stretch injury, we clearly found, at 24-h post-injury, a state
of hypometabolism connected to altered mitochondrial
function (decrease in ATP/ADP ratio and nicotinic coen-
zyme pool, increase in oxypurines and nucleosides; Figs. 1,
2). This was surprisingly accompanied (Table 1) by a
downregulation of genes encoding for different protein
subunits of complexes I, III, and IV of the ETC, as well as
of ATP synthase (complex V). This strongly supports
previous observations indicating that, following mTBI in
the rat, the imbalance in ATP homeostasis is due to a
decreased rate of mitochondrial use of oxygen for energy
production rather than to secondary hypoxic conditions
[16, 17]. On the other hand, it has been demonstrated that
continuation of mitochondrial oxidative phosphorylation in
the pathological milieu (i.e., during temporary mitochon-
drial malfunctioning) generates reactive oxygen species
[38], mitochondrial calcium overload [39], release of
cytochrome C [40]. In our experiments, the downregulation
of the ETC genes may have the role to decrease the rate of
electron transfer, thus decreasing the risks of triggering
oxidative/nitrosative stress during ETC malfunctioning
[38, 41]. Results obtained in 10 % stretched OHSC at 72-h
post-injury clearly show that mitochondrial functions were
only transiently altered as expression of the genes encoding
for different protein subunits of complexes I, III, and IV of
the ETC, as well as of ATP synthase (complex V), was not
different from that found in control OHSC (Table 7). A
significant confirmation of the transitory changes induced
by this type of damage was obtained by values of com-
pounds related to energy metabolism, the concentrations of
which at 72-h post-injury were not different from those
recorded in controls (Figs. 1, 2).
However, lowering the rate of ATP biosynthesis after
mTBI, when cells are engaged in re-establishing homeo-
stasis (ionic balance, oxidants/antioxidants balance, etc.)
and in reparative processes (membrane restoration,
re-folding of unfolded proteins, etc.) would be extremely
deleterious for the entire organ unless accompanied by a
concomitant ‘‘energy conserving program’’. According to
Tables 2, 3, and 5, the gene expression of proteins involved
in some relevant ATP-consuming processes in OHSC
(transcription, translation, and protein phosphorylation) is
drastically downregulated 24 h after a 10 % stretch injury,
Table 7 Expression of genes encoding for protein subunits of the
complexes I, III, IV, and V of the ETC (Table 1), as measured by RT-
qPCR in controls and 10 % stretched cells at 24- and 72-h post-injury
Control 24-h post-injury 72-h post-injury
Ndufa11/Hprt 1 ± 0.15 0.53 ± 0.12a,b 0.89 ± 0.21
ND1/Hprt 1 ± 0.08 0.62 ± 0.08a,b 1.36 ± 0.24
ND2/Hprt 1 ± 0.11 0.59 ± 0.15a,b 0.94 ± 0.14
ND5/Hprt 1 ± 0.03 0.51 ± 0.09a,b 1.08 ± 0.19
CYTB/Hprt 1 ± 0.12 0.68 ± 0.18a,b 1.11 ± 0.24
COX2/Hprt 1 ± 0.15 0.61 ± 0.23a,b 0.97 ± 0.07
COX3/Hprt 1 ± 0.12 0.70 ± 0.13a,b 0.98 ± 0.29
ATP5J/Hprt 1 ± 0.09 0.66 ± 0.18a,b 1.27 ± 0.28
The expression was calculated relatively to the housekeeping Hprt
gene
Values are the mean ± standard deviation of 3 preparations of 5
pooled OHSC eacha Significantly different from control; p \ 0.01b Significantly different from 72-h post-injury; p \ 0.01
Mol Cell Biochem
123
Author's personal copy

indicating a complex adaptive strategy aimed at optimizing
ATP consumption when ATP production is limited. This is
corroborated by data of Li et al. [23], indicating mild–
moderate injury causes downregulation of several gene
sets, while severe injury causes upregulation. It is therefore
conceivable that cells receiving milder injuries (and thus,
more likely to survive) have a molecular response designed
for energy recovery and repair, while those undergoing
severe injuries result in pathological injury cascades that
are not targeted to recovery.
In this light, the upregulation of ionotropic GABAA
receptors and AMPA2 (GluR2) subunit of the AMPA
receptor (Table 4A), should reduce calcium entry into the
cell and guard against excitotoxicity [42, 43], while the
downregulation of Grin2d encoding for the ionotropic
NMDA2D glutamate receptor (Table 4A) should counter-
act glutamate excitoxicity avoiding further calcium entry in
post-injured cells. A gene response aimed at restoring
calcium homeostasis is also evidenced by the simultaneous
upregulation of Calm3 and Gap43, both genes involved in
regulating intracellular calcium and to induce cell resis-
tance to calcium-mediated toxicity when overexpressed
[44].
The indication that the traumatized cerebral tissue acti-
vates a gene program as an adaptive response to afford
neuroprotection is corroborated by a similar pattern of gene
regulation physiologically occurring in hibernators. In win-
ter time, hibernators deal with two critical situations: limited
food supply and enormous energetic costs of maintaining a
constant high body temperature in cold weather [45].
Hibernating cells maintain viability by downregulating
oxygen consumption, ceasing non-essential cellular func-
tions and reducing ATP demand. Similar to what observed in
injured OHSC, it has been shown that the gene expression of
NADH-ubiquinone oxidoreductase and cytochrome C oxi-
dase [46–48] is downregulated in the brain of golden-man-
tled ground squirrels (Spermophilus lateralis) during late
torpor [49], a mechanism that affords them cell protection
[50]. Therefore, hibernators reorganize the priorities for ATP
use, controlling and coordinating the expression and the rate
of all ATP-generating and ATP-utilizing metabolic func-
tions [51–53]. As a consequence, some of the major ATP-
consuming processes, including transcription [54], transla-
tion [55], and ATP-dependent ion transport, are suppressed
during hibernation [56]. Even a striking inhibition of protein
phosphorylation in the brain of ground squirrel S. tride-
cemlineatus during hibernation has been observed [55],
thereby reinforcing a similarity between the pattern of gene
modulation of hibernators and that found in the post-injured
brain (downregulation of genes synthesizing different pro-
tein kinases, Table 5). This is even more evident when
considering that the general strategy of avoiding the induc-
tion of apoptosis recorded in our 10 % stretched OHSC
(Table 6) was observed in the greater horseshoe bat (Rhi-
nolophus ferrumequinum) [57].
Similarities and differences in the gene response
observed following mTBI and that occurring in hibernators
concern receptors for neuromodulators and modes for
controlling calcium overloading. Likewise to post-injured
OHSC (Table 4A), it has been shown that NMDA receptor
expression decreases during hibernation and increases upon
arousal [58], thereby contributing to afford protection from
persistent oxygen and nutrient deprivation [59]. Rather
than modulating the expression of neurotransmitter recep-
tors (Table 4A), hibernators downregulate calcium gating
channels [60] as they do not primarily face the post-mTBI
glutamate-mediated calcium overloading [10].
The causes of activation of the gene program of neu-
roprotection are likely to differ profoundly when consid-
ering ischemic preconditioning [27–30], hibernation and
this model of mTBI. In ischemic preconditioning and
hibernators, the common feature is the decreased oxygen
and substrate availability to tissues, fast in ischemic pre-
conditioning, slow in hibernators. As mitochondria are the
main target of this decrease in oxygen and substrate, it can
be assumed that modulation in gene expression is conse-
quent to protracted mitochondrial malfunction leading to
hypometabolism and progressive imbalance in ATP pro-
duction and consumption. In the case of the present model
of pure ‘‘in vitro’’ mTBI, we demonstrated that this gene
program of neuroprotection, similar to that of hibernators
and possibly of ischemic preconditioning, is not associated
with any change in substrates and oxygen during the whole
duration of the experiments, i.e., stretched and control
OHSC had full availability of substrates and oxygen at
constant concentrations. Also on the strength of our pre-
vious observations indicating sudden hypometabolism and
no differences in TBI damages between spontaneously
breathing and mechanically ventilated rats [13, 16], it can
be hypothesized that following mTBI mitochondria suffer
transient malfunctioning, specifically involving ETC and
its capacity to correctly handle the tetravalent reduction of
molecular oxygen, in spite of no change in oxygen and
substrate availability to cells. This decreases the amount of
ATP generation and might cause, if protracted, a dramatic
increase in oxidative/nitrosative stress. Hypometabolism
and, more importantly, signals derived from mitochondri-
ally produced oxygen and nitrogen radicals are likely to be
the factors triggering the gene program of neuroprotection,
having in the decrease of electron flow through the ETC
during transient mitochondrial malfunctioning, one of its
main effects/target (downregulation of complexes I, III,
and IV of the ETC; see Table 1). Therefore, the present
data demonstrate that following mTBI decrease in oxygen
and substrate availability is unnecessary to cause mito-
chondrial malfunction, hypometabolism and activate this
Mol Cell Biochem
123
Author's personal copy
program of neuroprotection. This also indicates that the
major molecular changes influencing the post-injury period
are triggered by the trauma itself and do not require sec-
ondary ischemic damage, i.e., eventual modifications in
cerebral blood flow following TBI are not the main
determinants for such molecular changes.
In conclusion, our data support the hypothesis that the
ability to depress temporarily the basal metabolic rate and
enter a hypometabolic or dormant state, through a targeted
modulation of gene expression, is a necessary strategy for the
traumatically injured brain. This adaptive physiological
mechanism may also explain why a second mTBI occurring
during this particular period of time (corresponding to the
period of brain vulnerability) may have catastrophic conse-
quences [9, 18, 34, 61, 62]. In this light, it is worth recalling
that previous studies indicated a varied response across cell
types and cellular viability based on repeat insult [34] or
post-stretch injury exposure to the inflammatory milieu [63],
thus confirming that cells experiencing an mTBI enters into a
temporary state of metabolic vulnerability.
A further implication of the present results concerns the
development of pharmacological interventions for mTBI.
For instance, according to the data showing downregula-
tion of genes controlling the ETC and the ATP biosyn-
thesis, potential therapies aimed at optimizing cell
metabolism should allow mildly injured cells to achieve a
net energy gain with no increase in mitochondrial function.
Data presented in this report represent a snapshot of an
evolving and rapidly adapting situation; therefore, further
studies aimed at characterizing the detailed time course of
modified gene expression following mild injury are nec-
essary, in particular with regard to the window of vulner-
ability and the possible therapeutic interventions.
Acknowledgments We wish to thank the Wessex Medical Research
Centre for funding this study and for their support to our research. We
also wish to thank Ms. Kathryn Rasco for her technical assistance in
the manuscript preparation.
References
1. Jennett B (1998) Epidemiology of head injury. Arch Dis Child
78:403–406
2. Teasdale G, Jennett B (1974) Assessment of coma and impaired
consciousness. A practical scale. Lancet 2:81–84
3. Domeniconi M, Filbin MT (2005) Overcoming inhibitors in
myelin to promote axonal regeneration. J Neurol Sci 233:43–47
4. Comper P, Bisschop SM, Carnide N, Tricco A (2005) A sys-
tematic review of treatments for mild traumatic brain injury.
Brain Inj 19:863–880
5. Jay GW, Goka RS, Arakaki AH (1996) Minor traumatic brain
injury: review of clinical data and appropriate evaluation and
treatment. J Insur Med 27:262–282
6. Feinstein A, Rapoport M (2000) Mild traumatic brain injury: the
silent epidemic. Can J Public Health 91:325–326
7. Buck PW (2011) Mild traumatic brain injury: a silent epidemic in
our practices. Health Soc Work 36:299–302
8. Giza CC, Hovda DA (2001) The neurometabolic cascade of
concussion. J Athl Train 36:228–235
9. Vagnozzi R, Signoretti S, Tavazzi B, Cimatti M, Amorini AM,
Donzelli S, Delfini R, Lazzarino G (2005) Hypothesis of the
postconcussive vulnerable brain: experimental evidence of its
metabolic occurrence. Neurosurgery 57:164–171
10. Katayama Y, Becker DP, Tamura T, Hovda DA (1990) Massive
increases in extracellular potassium and the indiscriminate
release of glutamate following concussive brain injury. J Neuro-
surg 73:889–900
11. Barkhoudarian G, Hovda DA, Giza CC (2011) The molecular
pathophysiology of concussive brain injury. Clin Sports Med 30:
33–48
12. Bergsneider M, Hovda DA, Lee SM, Kelly DF, McArthur DL,
Vespa PM, Lee JH, Huang SC, Martin NA, Phelps ME, Becker
DP (2000) Dissociation of cerebral glucose metabolism and level
of consciousness during the period of metabolic depression fol-
lowing human traumatic brain injury. J Neurotrauma 17:389–401
13. Vagnozzi R, Marmarou A, Tavazzi B, Signoretti S, Di Pierro D,
del Bolgia F, Amorini AM, Fazzina G, Sherkat S, Lazzarino G
(1999) Changes of cerebral energy metabolism and lipid perox-
idation in rats leading to mitochondrial dysfunction after diffuse
brain injury. J Neurotrauma 16:903–913
14. Lifshitz J, Friberg H, Neumar RW, Raghupathi R, Welsh FA,
Janmey P, Saatman KE, Wieloch T, Grady MS, McIntosh TK
(2003) Structural and functional damage sustained by mito-
chondria after traumatic brain injury in the rat: evidence for
differentially sensitive populations in the cortex and hippocam-
pus. J Cereb Blood Flow Metab 23:219–231
15. Lin MT, Beal MF (2006) Mitochondrial dysfunction and oxida-
tive stress in neurodegenerative diseases. Nature 443:787–795
16. Signoretti S, Marmarou A, Tavazzi B, Lazzarino G, Beaumont A,
Vagnozzi R (2001) N-Acetylaspartate reduction as a measure of
injury severity and mitochondrial dysfunction following diffuse
traumatic brain injury. J Neurotrauma 18:977–991
17. Tavazzi B, Signoretti S, Lazzarino G, Amorini AM, Delfini R,
Cimatti M, Marmarou A, Vagnozzi R (2005) Cerebral oxidative
stress and depression of energy metabolism correlate with
severity of diffuse brain injury in rats. Neurosurgery 56:582–589
(discussion 582–589)
18. Vagnozzi R, Tavazzi B, Signoretti S, Amorini AM, Belli A,
Cimatti M, Delfini R, Di Pietro V, Finocchiaro A, Lazzarino G
(2007) Temporal window of metabolic brain vulnerability to
concussions: mitochondrial-related impairment—part I. Neuro-
surgery 61:379–388
19. Vagnozzi R, Signoretti S, Tavazzi B, Floris R, Ludovici A, Marziali
S, Tarascio G, Amorini AM, Di Pietro V, Delfini R, Lazzarino G
(2008) Temporal window of metabolic brain vulnerability to con-
cussion: a pilot 1H-magnetic resonance spectroscopic study in
concussed athletes—part III. Neurosurgery 62:1286–1295
20. Vagnozzi R, Signoretti S, Cristofori L, Alessandrini F, Floris R,
Isgro E, Ria A, Marziale S, Zoccatelli G, Tavazzi B, Del Bolgia F,
Sorge R, Broglio SP, McIntosh TK, Lazzarino G (2010) Assess-
ment of metabolic brain damage and recovery following mild
traumatic brain injury: a multicentre, proton magnetic resonance
spectroscopic study in concussed patients. Brain 133:3232–3242
21. Belli A, Sen J, Petzold A, Russo S, Kitchen N, Smith M, Tavazzi
B, Vagnozzi R, Signoretti S, Amorini AM, Bellia F, Lazzarino G
(2006) Extracellular N-acetylaspartate depletion in traumatic
brain injury. J Neurochem 96:861–869
22. Giza CC, Prins ML, Hovda DA, Herschman HR, Feldman JD
(2002) Genes preferentially induced by depolarization after
concussive brain injury: effects of age and injury severity.
J Neurotrauma 19:387–402
Mol Cell Biochem
123
Author's personal copy

23. Li HH, Lee SM, Cai Y, Sutton RL, Hovda DA (2004) Differential
gene expression in hippocampus following experimental brain
trauma reveals distinct features of moderate and severe injuries.
J Neurotrauma 21:1141–1153
24. Di Pietro V, Amin D, Pernagallo S, Lazzarino G, Tavazzi B,
Vagnozzi R, Pringle A, Belli A (2010) Transcriptomics of trau-
matic brain injury: gene expression and molecular pathways of
different grades of insult in a rat organotypic hippocampal culture
model. J Neurotrauma 27:349–359
25. Zhou F, Zhu X, Castellani RJ, Stimmelmayr R, Perry G, Smith
MA, Drew KL (2001) Hibernation, a model of neuroprotection.
Am J Pathol 158:2145–2151
26. Depre C, Vatner SF (2007) Cardioprotection in stunned and
hibernating myocardium. Heart Fail Rev 12:307–317
27. Schulz R, Post H, Sakka S, Wallbridge DR, Heusch G (1995)
Intraischemic preconditioning—increased tolerance to sustained
low-flow ischemia by a brief episode of no-flow ischemia without
intermittent reperfusion. Circ Res 76:942–950
28. Vroom MB, van Wezel HB (1996) Myocardial stunning, hiber-
nation, and ischemic preconditioning. J Cardiothorac Vasc
Anesth 10:789–799
29. Ferrari R, Cargnoni A, Bernocchi P, Pasini E, Curello S, Ceconi
C, Ruigrok TJ (1996) Metabolic adaptation during a sequence of
no-flow and low-flow ischemia. A possible trigger for hiberna-
tion. Circulation 94:2587–2596
30. Stenzel-Poore MP, Stevens SL, Xiong Z, Lessov NS, Harrington CA,
Mori M, Meller R, Rosenzweig HL, Tobar E, Shaw TE, Chu X, Simon
RP (2003) Effect of ischaemic preconditioning on genomic response
to cerebral ischaemia: similarity to neuroprotective strategies in
hibernation and hypoxia-tolerant states. Lancet 362:1028–1037
31. Morrison B 3rd, Cater HL, Benham CD, Sundstrom LE (2006)
An in vitro model of traumatic brain injury utilising two-
dimensional stretch of organotypic hippocampal slice cultures.
J Neurosci Methods 150:192–201
32. Lazzarino G, Amorini AM, Fazzina G, Vagnozzi R, Signoretti S,
Donzelli S, Di Stasio E, Giardina B, Tavazzi B (2003) Single-
sample preparation for simultaneous cellular redox and energy
state determination. Anal Biochem 322:51–59
33. Tavazzi B, Lazzarino G, Leone P, Amorini AM, Bellia F, Janson
CG, Di Pietro V, Ceccarelli L, Donzelli S, Francis JS, Giardina B
(2005) Simultaneous high performance liquid chromatographic
separation of purines, pyrimidines, N-acetylated amino acids, and
dicarboxylic acids for the chemical diagnosis of inborn errors of
metabolism. Clin Biochem 38:997–1008
34. Slemmer JE, Weber JT (2005) The extent of damage following
repeated injury to cultured hippocampal cells is dependent on the
severity of insult and inter-injury interval. Neurobiol Dis 18:421–431
35. Soustiel JF, Larisch S (2010) Mitochondrial damage: a target for
new therapeutic horizons. Neurotherapeutics 7:13–21
36. Deng-Bryant Y, Prins ML, Hovda DA, Harris NG (2011) Ketogenic
diet prevents alterations in brain metabolism in young but not adult
rats after traumatic brain injury. J Neurotrauma 28:1813–1825
37. Arun P, Ariyannur PS, Moffett JR, Xing G, Hamilton K, Grunberg
NE, Ives JA, Namboodiri AM (2010) Metabolic acetate therapy for
the treatment of traumatic brain injury. J Neurotrauma 27:293–298
38. Dickinson BC, Chang CJ (2011) Chemistry and biology of
reactive oxygen species in signaling or stress responses. Nat
Chem Biol 7:504–511
39. Singh BK, Tripathi M, Pandey PK, Kakkar P (2011) Alteration in
mitochondrial thiol enhances calcium ion dependent membrane
permeability transition and dysfunction in vitro: a cross-talk between
mtThiol, Ca(2 ?), and ROS. Mol Cell Biochem 357:373–385
40. Kim GS, Jung JE, Narasimhan P, Sakata H, Yoshioka H, Song
YS, Okami N, Chan PH (2011) Release of mitochondrial apop-
togenic factors and cell death are mediated by CK2 and NADPH
oxidase. J Cereb Blood Flow Metab 32:720–730
41. Hardeland R (2009) Neuroprotection by radical avoidance: search
for suitable agents. Molecules 14:5054–5102
42. Kim DY, Kim SH, Choi HB, Min C, Gwag BJ (2001) High
abundance of GluR1 mRNA and reduced Q/R editing of GluR2
mRNA in individual NADPH-diaphorase neurons. Mol Cell
Neurosci 17:1025–1033
43. Van Damme K, Massie A, Vandesande F, Arckens L (2003)
Distribution of the AMPA2 glutamate receptor subunit in adult
cat visual cortex. Brain Res 960:1–8
44. Boczek T, Kozaczuk A, Ferenc B, Kosiorek M, Pikula S, Zy-
linska L (2012) Gene expression pattern in PC12 cells with
reduced PMCA2 or PMCA3 isoform: selective up-regulation of
calmodulin and neuromodulin. Mol Cell Biochem 360:89–102
45. Wang LC, Belke D, Jourdan ML, Lee TF, Westly J, Nurnberger F
(1988) The ‘‘hibernation induction trigger’’: specificity and
validity of bioassay using the 13-lined ground squirrel. Cryobi-
ology 25:355–362
46. Blackstone E, Morrison M, Roth MB (2005) H2S induces a
suspended animation-like state in mice. Science 308:518
47. Nystul TG, Roth MB (2004) Carbon monoxide-induced sus-
pended animation protects against hypoxic damage in Caeno-rhabditis elegans. Proc Natl Acad Sci USA 101:9133–9136
48. Budinger GR, Duranteau J, Chandel NS, Schumacker PT (1998)
Hibernation during hypoxia in cardiomyocytes. Role of mito-
chondria as the O2 sensor. J Biol Chem 273:3320–3326
49. Williams DR, Epperson LE, Li WZ, Hughes MA, Taylor R,
Rogers J, Martin SL, Cossins AR, Gracey AY (2005) Seasonally
hibernating phenotype assessed through transcript screening.
Physiol Genomics 24:13–22
50. Levy RJ (2007) Mitochondrial dysfunction, bioenergetic impair-
ment, and metabolic down-regulation in sepsis. Shock 28:24–28
51. Storey KB, Storey JM (1990) Frozen and alive. Sci Am 263:
92–97
52. Storey KB, Storey JM (2004) Metabolic rate depression in ani-
mals: transcriptional and translational controls. Biol Rev Camb
Philos Soc 79:207–233
53. Hochachka PW, Buck LT, Doll CJ, Land SC (1996) Unifying
theory of hypoxia tolerance: molecular/metabolic defense and
rescue mechanisms for surviving oxygen lack. Proc Natl Acad
Sci USA 93:9493–9498
54. Bocharova LS, Gordon R, Arkhipov VI (1992) Uridine uptake
and RNA synthesis in the brain of torpid and awakened ground
squirrels. Comp Biochem Physiol B 101:189–192
55. Frerichs KU, Smith CB, Brenner M, DeGracia DJ, Krause GS,
Marrone L, Dever TE, Hallenbeck JM (1998) Suppression of protein
synthesis in brain during hibernation involves inhibition of protein
initiation and elongation. Proc Natl Acad Sci USA 95:14511–14516
56. MacDonald JA, Storey KB (1999) Regulation of ground squirrel
Na ? K ? -ATPase activity by reversible phosphorylation dur-
ing hibernation. Biochem Biophys Res Commun 254:424–429
57. Chen JP, Yuan LH, Sun M, Zhang LB, Zhang SY (2008)
Screening of hibernation-related genes in the brain of Rhinolo-phus ferrumequinum during hibernation. Comp Biochem Phys B
149:388–393
58. Zhao HW, Ross AP, Christian SL, Buchholz JN, Drew KL (2006)
Decreased NR1 phosphorylation and decreased NMDAR function
in hibernating Arctic ground squirrels. J Neurosci Res 84:291–298
59. Ross AP, Christian SL, Zhao HW, Drew KL (2006) Persistent
tolerance to oxygen and nutrient deprivation and N-methyl-D-
aspartate in cultured hippocampal slices from hibernating Arctic
ground squirrel. J Cereb Blood Flow Metab 26:1148–1156
60. Wang SQ, Lakatta EG, Cheng H, Zhou ZQ (2002) Adaptive
mechanisms of intracellular calcium homeostasis in mammalian
hibernators. J Exp Biol 205:2957–2962
61. Laurer HL, Bareyre FM, Lee VM, Trojanowski JQ, Longhi L,
Hoover R, Saatman KE, Raghupathi R, Hoshino S, Grady MS,
Mol Cell Biochem
123
Author's personal copy
McIntosh TK (2001) Mild head injury increasing the brain’s
vulnerability to a second concussive impact. J Neurosurg 95:
859–870
62. Longhi L, Saatman KE, Fujimoto S, Raghupathi R, Meaney DF,
Davis J, McMillan BSA, Conte V, Laurer HL, Stein S, Stocchetti
N, McIntosh TK (2005) Temporal window of vulnerability to
repetitive experimental concussive brain injury. Neurosurgery 56:
364–374
63. Ranaivo HR, Zunich SM, Choi N, Hodge JN, Wainwright MS
(2011) Mild stretch-induced injury increases susceptibility to
interleukin-1 beta-induced release of matrix metalloproteinase-9
from astrocytes. J Neurotrauma 28:1757–1766
Mol Cell Biochem
123
Author's personal copy