II. Macro environmental factors potentially affecting financial ...
24
Macro environmental factors potentially affecting financial sector FINANCIAL STABILITY REPORTMAY 2014 13 Chart 2.1 Global economic growth rates Note: Figures for 2014 are Global Insight estimates. Source: Global Insight (2014/4/15). 2.6 1.4 4.9 2.5 1.3 4.7 3.0 2.0 4.7 0 1 2 3 4 5 6 World Advanced Economies Emerging Markets 2012 2013 2014f % II. Macro environmental factors potentially affecting financial sector 2.1 International economic and financial conditions 2.1.1 International economic conditions Global recovery proceeded at a mild pace In 2013, the global economic recovery proceeded at a cautious pace. In the US, growth momentum waned as a result of fiscal retrenchment, while the downturn in the euro area mitigated with the subsiding of the sovereign debt crisis. Meanwhile, Japan saw an accelerating growth impetus, underpinned by the stimulus package of the Abenomics program. In Mainland China, output growth seems to have leveled off due to structural economic transformation. In particular, declining economic growth in emerging economies reflected concerns about unexpectedly rapid normalization of US monetary policy and the impact of weakening demand in major international commodities markets. From 2014 onwards, domestic consumption momentum in the US picked up, benefiting from continued robust labor market conditions. This, together with the euro area resuming growth following two consecutive years of downturn, presaged that advanced economies would mainly drive a sustainable pace of global economic recovery. Global Insight predicts world real GDP growth to increase to 3.0% in 2014, higher than the 2.5% recorded a year earlier. Real GDP in advanced economies is projected to nudge up to 2.0% from 1.3% in 2013. Output in emerging economies is forecast to grow moderately and reach 4.7% in 2014, approximating that achieved in 2013 8 (Chart 2.1). 8 See Note 1.
-
Upload
khangminh22 -
Category
Documents
-
view
1 -
download
0
Transcript of II. Macro environmental factors potentially affecting financial ...

Macro environmental factors potentially affecting financial sector
FINANCIAL STABILITY REPORTMAY 2014 13
Chart 2.1 Global economic growth rates
Note: Figures for 2014 are Global Insight estimates. Source: Global Insight (2014/4/15).
2.6
1.4
4.9
2.5
1.3
4.7
3.0
2.0
4.7
0
1
2
3
4
5
6
World Advanced Economies Emerging Markets
2012 2013 2014f%
II. Macro environmental factors potentially affecting financial sector
2.1 International economic and financial conditions
2.1.1 International economic conditions
Global recovery proceeded at a mild pace
In 2013, the global economic recovery proceeded at a cautious pace. In the US, growth momentum waned as a result of fiscal retrenchment, while the downturn in the euro area mitigated with the subsiding of the sovereign debt crisis. Meanwhile, Japan saw an accelerating growth impetus, underpinned by the stimulus package of the Abenomics program. In Mainland China, output growth seems to have leveled off due to structural economic transformation. In particular, declining economic growth in emerging economies reflected concerns about unexpectedly rapid normalization of US monetary policy and the impact of weakening demand in major international commodities markets.
From 2014 onwards, domestic consumption momentum in the US picked up, benefiting from continued robust labor market conditions. This, together with the euro area resuming growth following two consecutive years of downturn, presaged that advanced economies would mainly drive a sustainable pace of global economic recovery. Global Insight predicts world real GDP growth to increase to 3.0% in 2014, higher than the 2.5% recorded a year earlier. Real GDP in advanced economies is projected to nudge up to 2.0% from 1.3% in 2013. Output in emerging economies is forecast to grow moderately and reach 4.7% in 2014, approximating that achieved in 20138 (Chart 2.1).
8 See Note 1.

Macro environmental factors potentially affecting financial sector
FINANCIAL STABILITY REPORTMAY 2014 14
Chart 2.3 Unemployment rates in US, Euro area and Japan
Note: Figures for 2014 are Global Insight estimates. Sources: Official websites of the selected economies and Global
Insight (2014/4/15).
8.1
11.3
4.3
7.4
12.0
4.0
6.5
12.4
3.7
0
2
4
6
8
10
12
14
US Euro area Japan
2012 2013 2014f%
Chart 2.2 Economic growth rates in US, Euro area and Japan
Note: Figures for 2014 are Global Insight estimates. Sources: Official websites of the selected economies and Global
Insight (2014/4/15).
2.8
-0.7
1.4
1.9
-0.4
1.5
2.4
1.1 1.4
-1
0
1
2
3
US Euro area Japan
2012 2013 2014f%
Looking ahead, international spillovers from the US exiting it sun conventional monetary policy, a decelerating economic growth rate in Mainland China, along with mounting concerns about Japan’s consumption-tax hike undermining private consumption, all add to uncertainty over global economic growth in 2014.
Advanced economies gained steady growth
momentum
The US continued its road to recovery but
moved toward a more moderate pace of
growth owing to fiscal retrenchment
In 2013, the recovery in the US real estate market pushed domestic private consumption up. Meanwhile, US manufacturers returning jobs back to the States from overseas prompted a build-up in private investment. Nevertheless, US economic growth fell to 1.9% from 2.8% a year before, affected by a reduction in government expenditure due to the rolling back of automatic spending cuts. From the beginning of 2014, improving labor market conditions, coupled with the tempering impact of fiscal retrenchment and the warming up of the real estate market, could promote ongoing economic recovery. Reflecting this, Global Insight estimates the US economic growth to stand at 2.4% in 2014, above the level recorded the previous year (Chart 2.2).
The US unemployment rate dropped to 7.4% in 2013 from 8.1% a year earlier. The rate persistently fell in early 2014 against the backdrop of a rallying housing market and vigorous development in the energy sector. Global Insight anticipates the US unemployment rate to continue reducing to an annual rate of 6.5% in 2014 (Chart 2.3).

Macro environmental factors potentially affecting financial sector
FINANCIAL STABILITY REPORTMAY 2014 15
Chart 2.4 Government debt-to-GDP ratios in US, Euro area and Japan
Note: Figures for 2014 are IMF projections. Source: IMF (2014), Fiscal Monitor, April.
102.4 92.8
237.3
104.5 95.2
243.2
105.7 95.6
243.5
0
40
80
120
160
200
240
280
US Euro area Japan
2012 2013 2014f%
The US deficit shrank to US$680 billion in fiscal year 2013, but outstanding government debt relative to annual GDP kept expanding in recent years. President Barack Obama signed a bipartisan budget agreement, stipulating the total fiscal expenditure to increase by US$62 billion for fiscal years 2014 and 2015. While the incremental spending is expected to be offset by deficit-reduction measures, the International Monetary Fund (IMF) forecasts that the ratio of outstanding government debt relative to annual GDP will elevate to an estimated 105.7% in 20149 (Chart 2.4).
The darkest cloud over the euro area subsided gradually
In the euro area, economic growth posted a rate of -0.4% in 2013 from -0.7% a year earlier thanks to the receding impact of the European sovereign debt crisis, growing exports and rebounding consumption across the area. Furthermore, inflation continued to undershoot projections. This, coupled with the European Central Bank’s (ECB’s) continuing monetary easing, is likely to underpin private consumption and promote corporate investment. Global Insight estimates that euro area GDP will grow by 1.1% year on year in 2014 (Chart 2.2).
The euro area unemployment rate spiked to a new high of 12.0% in 2013. Severe youth unemployment is an open question across the area, where Spain and Greece suffered youth unemployment rates of more than 50%. Global Insight forecasts the unemployment rate in euro area to continue advancing to 12.4% in 2014 (Chart 2.3).
According to IMF projections, the euro area outstanding government debt-to-GDP ratio is expected to surge to 95.6% in 2014 (Chart 2.4). Greece kept implementing harsh fiscal austerity measures, whereas Ireland exited its international bailout program. Against this backdrop, the ratios for these two countries are forecast to fall for the first time in seven years.10
9 IMF (2014), Fiscal Monitor, April. 10 See Note 9.

Macro environmental factors potentially affecting financial sector
FINANCIAL STABILITY REPORTMAY 2014 16
The implementation of “Abenomics” revitalized Japanese economic growth
In 2013, the Shinzo Abe cabinet launched the “three-arrows” strategy that comprises “aggressive monetary policy,” “expansionary fiscal policy” and “growth strategy that promotes private investment” with the aim of curbing deflation and promoting economic growth. Reflecting this, Japanese economic growth registered 1.5% throughout the year. In 2014, the government laid out a 5.5 trillion yen economic stimulus package. This, together with a marked improvement in the performance of domestic corporations as well as vigorous machinery and equipment investment, could sustain this growth momentum. According to Global Insight, Japanese economic growth is expected to stand at 1.4% in 2014, somewhat lower than the figure recorded in 2013(Chart 2.2). Meanwhile, the unemployment rate is forecast to further drop to 3.7% over the same period (Chart 2.3), backstopped by a sharp increase in total employment due to steady recovery.
The Japanese government expanded the budget to invest in local public infrastructure construction with a view to the implementation of “expansionary fiscal policy.” As a result, the government debt-to-GDP ratio further uplifted to 243.2% in 2013. Although a consumption tax hike that raises the tax rate to 8% from 5% from April 2014 onwards might help to relieve the government’s debt burden, fiscal risks remained owing to the build-up of policy uncertainties.11 The IMF forecasts the government debt-to-GDP ratio to slightly rise to 243.5% in 201412 (Chart 2.4).
In contrast, Taiwan differs from Japan with regard to economic conditions. Furthermore, under the precondition of safeguarding price stability, the CBC has provided monetary easing circumstances favorable to Taiwanese economic development in recent years. Against this background, there is no need for Taiwan to echo the adoption of the recent quantitative and qualitative monetary easing as has taken place in Japan (Box 1).
The economic growth of Asian emerging economies proceeded at a mild pace
Hit by the impact of capital outflows owing to the uncertainty surrounding the Fed’s tapering of its asset purchases, coupled with contracting demand for major international commodities, GDP growth in key Asian emerging economies experienced a slowdown in 2013. The Asian newly industrialized economies saw a slack recovery in exports; however, output growth in these economies rose to 2.8% from 1.8% in 2012, spurred by the economic stimulus
11 Major concerns emanate from whether Japan can successfully carry out the second phase of a consumption tax hike program, raising the
tax rate to 10% from 8%, and implement the proposed medium term fiscal policy in 2015 and afterwards. 12 See Note 9.

Macro environmental factors potentially affecting financial sector
FINANCIAL STABILITY REPORTMAY 2014 17
Chart 2.5 Economic growth rates in Asian emerging economies
Notes: 1. Figures for 2014 are Global Insight projections. 2. ANIE refers to Asian Newly Industrialized Economies,
including Taiwan, Hong Kong, Singapore and South Korea.
3. ASEAN-10 refers to the 10 member countries of the Association of South East Asian Nations, including Brunei, Cambodia, Indonesia, Laos, Malaysia, Myanmar, the Philippines, Singapore, Thailand and Vietnam.
Sources: Official websites of the selected economies and Global Insight (2014/4/15).
1.8
5.6
7.7
2.8
5.1
7.7
3.6
4.7
7.5
0
2
4
6
8
10
ANIE ASEAN-10 Mainland China
2012 2013 2014f%
Chart 2.6 Unemployment rates in Asian emerging economies
Notes: 1. Figures for 2014 are Global Insight projections. 2. For ANIE and ASEAN-10, see Notes 2 & 3 in Chart
2.5. Sources: Official websites of the selected economies and Global
Insight (2014/4/15).
3.4
4.5 4.1
3.3
4.6
4.1
3.3
4.7
4.0
0
1
2
3
4
5
ANIE ASEAN-10 Mainland China
2012 2013 2014f%
measures of local governments.
Thailand was mired in political vulnerabilities. Meanwhile, in Indonesia, a slump in major international commodity prices impacted exports, while high interest rates jeopardized domestic investment. As a result, output growth for both of these two countries slowed down. This, in turn, impacted on the overall growth rates of the Association of South East Asian Nations (ASEAN-10) to contract to 5.1% in 2013 from 5.6% a year before. In addition, Mainland China’s growth rate of 7.7% was similar to that in 2012 (Chart 2.5).
Global Insight anticipates that the economic growth rate in the Asian newly industrialized economies will mount to 3.6% in 2014, whereas the ASEAN-10 countries and Mainland China would both see more moderate growth rates of 4.7% and 7.5%, respectively (Chart 2.5). Meanwhile, the unempolyment rate in the Asian newly industrialized economies is projected to stand at 3.3%, the same figure as in 2013, while the rate will slightly rise to 4.7% from 4.6% a year earlier in the ASEAN-10 countries. In Mainland China, the unempolyment rate is forecast to drop to 4.0% from 4.1% in 2013 (Chart 2.6).
Global inflationary pressures kept subsiding
In 2013, global prices of crude oil temporarily surged amid geopolitical uncertainty in the Middle East. Conversely, the international prices of cereals witnessed a continued decline in virtue of increasing production of soy, wheat and corn. Reflecting this, global inflation

Macro environmental factors potentially affecting financial sector
FINANCIAL STABILITY REPORTMAY 2014 18
Chart 2.7 Global headline inflation indices
Note: Figures for 2014 are Global Insight estimates. Sources: Official websites of the selected economies and Global
Insight (2014/4/15).
3.2
1.8
4.8
2.1 2.5
0.0
3.0
1.3
5.0
1.5 1.3
0.4
3.1
1.7
4.9
1.8
0.9
3.0
0
1
2
3
4
5
6
World AdvancedEconomies
EmergingMarkets
US EuroArea
Japan
2012 2013 2014f%
moderated in 2013 compared to the previous year, with the CPI inflation rate registering 3.0%, down from 3.2% in 2012. CPI inflation rates in advanced economies were lower than the figures a year earlier, whereas in the emerging economies they increased marginally (Chart 2.7).
From the beginning of 2014 onwards, cereal production suffered poor yields due to severe cold weather in Northern America and drought in Brazil. This, coupled with mounting concerns about political tension in Ukraine, which is likely to impact its cereal exports, resulted in a rise in international prices. Meanwhile, global crude oil prices fluctuated within a narrow range, affected by an upswing in crude oil supply from Iran and the rising geopolitical risks related to Ukraine. Global Insight predicts the global CPI inflation rate will rise to 3.1% in 2014, slightly higher than that of 3.0% in 2013. However, the figure for Japan will upsurge to 3.0% from 0.4% a year earlier due to its consumption tax hike (Chart 2.7).
Monetary policy kept easing in advanced economies, whereas the US was tapering the size of bond purchases
From May 2013 onwards, the major advanced economies preserved their easy monetary stances. The Reserve Bank of Australia lowered the policy rate by 25 basis points in May. Thereafter, the ECB sequentially cut the main refinancing operations fixed rate by 25 basis points in May and November, separately, hitting a record low of 0.25%. This reflected a raising concern about recovery stalling in the euro area. Additionally, the Fed maintained the target range for the federal funds rate at 0 to 0.25%. Likewise, the Bank of England, the BOJ and the Bank of Canada all kept their low-interest-rate policies unchanged.

Macro environmental factors potentially affecting financial sector
FINANCIAL STABILITY REPORTMAY 2014 19
Chart 2.8 Policy rates in selected economies
Notes: 1. Advanced economies: figure for the US is based on the federal funds rate target; for Australia, cash rate target; for the UK, official bank rate; for the euro area, the main refinancing operations fixed rate; for Japan, uncollateralized overnight call rate.
2. Emerging Asia: figure for Hong Kong is based on discount window base rate; for Mainland China, financial institution one-year lending base rate; for Thailand, 1-day repurchase rate; for Indonesia, Bank Indonesia rate; for Reserve Bank of India, repurchase rate.
3. The BOJ changed the main operating target for money market operations to the monetary base from 4 April 2013 onwards.
4. Figures are as of 3 April 2014. Sources: Central banks’ websites.
-1
0
1
2
3
4
5
6
7
8
2010 2011 2012 2013 2014
US Euro areaAustralia JapanUK
Advanced economies
%
(Jan-Apr)
012345678910
2010 2011 2012 2013 2014
Hong Kong IndonesiaM. China IndiaThailand
Emerging economies
%
(Jan-Apr)
In emerging Asian economies, the Bank of Thailand lowered the 1-day repurchase rate twice to 2.25% in November 2013 in hope of invigorating the economy. Bank Indonesia raised the Bank Indonesia rate five times in an attempt to appreciate Rupiah and dampen inflationary pressure. The Reserve Bank of India consecutively raised the repurchase rate to 8% from September onwards following three rate cuts in the first half of the year. The People’s Bank of China (PBC) held the financial institution one year lending base rate unchanged (Chart 2.8).
2.1.2 International financial conditions
International financial markets improved but global financial risks elevated
In the first half of 2013, global financial risks alleviated, underpinned by the appropriate monetary policy stances and precautionary measures implemented by numerous countries. Over this period, global stock markets initially fluctuated against the backdrop of increasing political tensions on the Korean peninsula, the further spread of avian influenza in China, and the sluggish economy in the US. However, the markets resumed stable growth subsequently. From the second half of 2013 onwards, concerted monetary easing by the major economies and improvement in fiscal conditions in the euro area contributed to allaying tensions in financial markets. However, the spillovers emanating from the advanced economies’ transitions to less accommodative monetary policy stances led to the build-up of global financial risks.
Financial market conditions in the advanced economies saw a notable improvement but risks lingered
In 2013, the prolonged period of accommodative policy and low interest rates in the US led to a search for higher yield, which sent massive flows of funds into high risk assets, and lifted

Macro environmental factors potentially affecting financial sector
FINANCIAL STABILITY REPORTMAY 2014 20
Chart 2.9 Performance of key international equity indices
Note: 1 January 2010 = 100. Source: Bloomberg.
60
80
100
120
140
160
180
2010 2011 2012 2013 2014
MSCI Emerging Asia
MSCI EMU+UK
S&P 500
Nikkei 225MSCI Latin America
(Jan-Mar)
asset prices. As a result, major US stock indices, in particular, trended up noticeably (Chart 2.9). However, against the backdrop of prolonged periods of monetary expansion, speculative transactions searching for high yields increased. Coupled with rising corporate leverage and loosening corporate lending standards in the US credit markets, this, in turn, may become a latent risk to financial stability.
In April 2013, the announcement of QQE aiming at implementing “Abenomics” by the BOJ was largely successful in advancing yen depreciation and resetting deflationary expectations. Accordingly, the main Japanese stock index moved up (Chart 2.9). Nevertheless, from May onwards, the Fed signaled steps toward normalizing monetary policy, coupled with mounting concerns about Japanese government fiscal vulnerabilities, led to bouts of turmoil in bond and stock markets. Reflecting this, the Japanese Nikkei 225 stock index at one point tumbled over 7% in one day, followed by fluctuations within a narrow range. Moreover, to some extent, the spillovers resulting from domestic capital outflows spurred by lasting yen depreciation would impact both emerging economies and advanced economies.
In 2013, in the euro area, market pressure temporarily relieved thanks to continued monetary easing along with various structural reforms launched by member states. Meanwhile, the credit conditions of bond markets for governments, banks and corporate largely improved. However, banks in periphery economies still faced the combined challenges of elevated funding costs, deteriorating asset quality and slender profits that could hinder banks’ lending capabilities. The firms in these economies also confronted considerable debt pressures due to overly high leverage ratios.

Macro environmental factors potentially affecting financial sector
FINANCIAL STABILITY REPORTMAY 2014 21
Chart 2.10 Changes in equity indices and exchange rates among Asian emerging economies
Note: The comparison is based on the difference between the figures of end-May 2013 and of end-February 2014.
Source: Bloomberg.
4.66 6.21
3.53
-1.13
-9.50 -9.86
-15.62
-0.97
-8.84
-5.77
5.7
-5.37
-15.87
-7.29
-20
-15
-10
-5
0
5
10
Taiwan India Malaysia S. Korea Philippines Indonesia Thailand
Stock price changes Exchange rate changes%
Emerging economies’ weakening economic
fundamentals spurred the run-up of
financial fragilities and risks
In the wake of the global financial crisis, the nonconventional monetary policies and policy rate cuts pursued in advanced economies provoked large capital inflows to emerging markets. As of 2013, growing capital inflows stirred declining risk premiums and contracting funding costs. As a consequence, credit expanded dramatically, particularly with regard to corporate bond issuance, which exhibited a notable upsurge. However, some large emerging economies (such as Brazil, Mainland China, India and Russia) observed deteriorating asset quality, ascending leverage and asset prices reaching bubble levels as economic growth moderated and credit expansion lost momentum. This phenomenon, in turn, posed several challenges to emerging market economies, including: (1) governments and corporations with greater debt would be vulnerable to the reversal of interest rate rises, a shrinkage in earnings, and a depreciating currency; (2) debt-laden economies would find it more difficult to re-finance as risk premiums reversed to move upwards; and (3) increased foreign capital inflows exposed some economies to an additional source of capital outflow pressure which may cause renewed bouts of market turmoil in the event of a reversal to a massive outflow. Moreover, geopolitical risks related to Ukraine could also pose a new threat to financial stability.
Monetary policy transitions in advanced economies have substantial impacts on the financial markets in emerging economies. For example, massive international capital flowed back to the US around the Fed tapering announcement and investors showed concerns about political turbulence and unstable financial circumstances in emerging economies. These brought about greater fluctuations in global stock markets, particularly in Latin America, which saw the most significant drop (Chart 2.9). In Asian emerging economies, Indonesia and Thailand suffered considerable impacts on their stock markets and foreign exchange markets. Conversely, Taiwanese financial markets, buttressed by relatively robust economic fundamentals, were affected to a limited extent as they were more resilient to the shocks (Chart 2.10).

Macro environmental factors potentially affecting financial sector
FINANCIAL STABILITY REPORTMAY 2014 22
International organizations urged national governments to take further measures to foster global financial stability
The prolonged period of monetary easing witnessed in recent years could possibly pose a threat to global financial stability, while the US exiting from unconventional monetary policies could give rise to subsequent spillovers. In response, international organizations (such as the IMF13 and the Asian Development Bank14) have advocated national governments to take preemptive measures, and provided the major policy suggestions as follows:
‧ In the US, as the Fed intends to gradually taper its asset purchases, reductions in liquidity could amplify market volatilities. In this regard, the financial supervisors must remain vigilant and preventative plans need to be put in place, such as enhancing oversight of mutual fund, real estate investment trust and exchange-traded fund liquidity terms for investors and management practices. Besides, it is also suggested to develop a contingency leverage unwinding facility for markets that heavily use repo transactions to manage liquidity.
‧ In the euro area, with a view to entrenching the European Monetary Union and reducing debt levels, the improvement in the structure of bank balance sheets is a prerequisite to restoring investor confidence. Meanwhile, the euro area should address financial fragmentation15 through promptly carrying out the Single Supervisory Mechanism and the Single Resolution Mechanism with a commitment of cross-border deposit insurance.
‧ The emerging economies are likely to face the challenge of capital flow reversals. Policy makers should ensure orderly financial market operations and prudential surveillance of risks deriving from soaring corporate leverage and bank exposure to currency mismatch.
‧ Asian emerging economies confronting global and regional threats are expected to prevent themselves from suffering various external financial shocks by sustaining price stability and deploying prudential fiscal policies. Mainland China, among others, should gradually liberalize deposit rates and address moral hazard concerns to rein in credit growth mainly arising from the shadow banking system. Furthermore, an improvement of monitoring and disclosure in the nonbanking system, such as insurance companies and trust funds, is needed.
13 IMF (2013), Global Financial Stability Report, October. 14 Asian Development Bank (2014), Asian Development Outlook 2014: Fiscal Policy for Inclusive Growth. 15 The ECB adopted monetary easing which kept the policy rate at historical lows to increase credits to corporations in core euro area with
low interest rates. However, corporations in periphery economies were still exposed to funding risks.

Macro environmental factors potentially affecting financial sector
FINANCIAL STABILITY REPORTMAY 2014 23
Internationally increased focus on Bitcoin online virtual currency scheme
In the beginning of 2013, the Bitcoin exchange rate against the US dollar was about 20 but subsequently skyrocketed to 1200 or so in November as a result of media exaggeration and manipulation by interested parties. This, in turn, has drawn the attention of national central banks and financial authorities to address a number of issues, particularly about: (1) whether Bitcoin should be supervised; (2) how to supervise Bitcoin; (3) whether Bitcoin undermines financial stability; and (4) whether Bitcoin can be exploited as a tool for criminals. Currently the interconnection between Bitcoin, the real economy, and financial markets is still low, indicating that it is not likely to compromise the economy and financial stability as a whole.
Due to lack of a transaction protection scheme which is subject to exclusive regulation, along with inherent risks coming from the high volatility in price, hacker attacks and collapse of the exchange platform, some economies consecutively employed regulatory measures or provided statements in the hope of protecting consumer rights as well as safeguarding payment systems and financial stability. There are broadly four types of regulatory tendency among the above-mentioned measures, including: (1) excluding Bitcoin as a legal tender; (2) regarding Bitcoin as a virtual commodity; (3) alerting consumers and investors to be cautious about the related risks; and (4) preventing Bitcoin from becoming an alternative currency for money laundering.
2.1.3 Mainland China’s economic and financial conditions
Economic growth momentum waned
In the first half of 2013, Mainland China decelerated infrastructure investments and reduced excess capacity in some industries,16 bringing economic growth rates down to 7.7% and 7.5% in Q1 and Q2, respectively. In Q3, thanks to a series of measures to maintain steady growth taken by the State Council in the second half of July,17 economic growth rebounded to 7.8% and registered an annual growth of 7.7% for the whole year, the same as in 2012 (Chart 2.11).
16 See Note 2. 17 Such measures include temporarily exempting the value-added tax and business tax for micro- and small-sized firms, facilitating trade to
stabilize import and export business, and accelerating railway and infrastructure facilities constructions in the Midwest, etc.

Macro environmental factors potentially affecting financial sector
FINANCIAL STABILITY REPORTMAY 2014 24
Chart 2.11 Economic growth rates of Mainland China
Note: Figure for 2014 is a Global Insight projection. Sources: National Bureau of Statistics of China and Global
Insight (2014/4/15).
10.111.3
12.7
14.2
9.6 9.210.4
9.3
7.7 7.7 7.5
0
2
4
6
8
10
12
14
16
2004 05 06 07 08 09 10 11 12 13 14f
%
Chart 2.12 Inflation rates of Mainland China
Source: National Bureau of Statistics of China.
-6
-4
-2
0
2
4
6
8
10
2010 11 12 13 14
CPI inflation rates PPI inflation rates%
(Jan-Mar)
Although Mainland China’s economic transition, aiming to shift toward a domestic demand-led growth model through structural reforms, might cause economic slowdown, measures to maintain steady growth and the increase in social security expenditures are expected to boost private consumption (Box 2). In March 2014, the National People's Congress (NPC) and Chinese People's Political Consultative Conference (CPPCC) set the economic growth target for 2014 at 7.5%, the same level as Global Insight’s economic growth projection for Mainland
China in 2014 (Chart 2.11).
Prices stabilized and housing prices grew at a slower pace
Due to stable international raw materials prices and domestic food prices, the CPI inflation rate of Mainland China was 2.6% in 2013, lower than the official goal of 3.5%. In 2014, after the CPI inflation rate continued decreasing to a thirteen-month low of 2.0% in February, it slightly rebounded to 2.4% in March. Global Insight projects the CPI inflation rate for the whole year of 2014 to decrease further to 2.0%. Moreover, in March 2014, the producer price index (PPI) inflation rate stood at -2.3%, the 25th consecutive month in negative territory, also indicating a waning growth momentum (Chart 2.12).

Macro environmental factors potentially affecting financial sector
FINANCIAL STABILITY REPORTMAY 2014 25
Chart 2.13 Average growth rates of building sales prices in 70 medium-large cities of Mainland China
Note: Figures for 2011 onwards are estimated by Thomson Reuters based on statistics published by the National Bureau of Statistics of China.
Sources: National Bureau of Statistics of China and Thomson Reuters.
-0.6
0
0.6
1.2
1.8
-5
0
5
10
15
2010 11 12 13 14(Jan-Mar)
Annual growth rates (LHS)Monthly growth rates (RHS)
% %
Chart 2.14 Aggregate financing to the real economy and annual growth rates of M2 of Mainland China
Source: PBC.
0
5
10
15
20
25
30
0
4
8
12
16
20
24
2006 07 08 09 10 11 12 13
Bank loans Off-balance sheet creditsCorporate bonds OthersM2 growth rates (RHS)RMB tn %
The annual growth rate of building sales prices in 70 medium-large cities was 7.7% in March 2014. This marked the fifteenth consecutive month of positive annual increases, although the rate of increase began to decline. The monthly growth rates were positive for the 22nd consecutive month, but also followed a downward trend (Chart 2.13). In response to rising house prices, Mainland China has taken a series of measures to curb house prices since February 2013.18 However, considering that excessively constrained housing markets may decelerate growth momentum and increase downside economic risks,19 no stricter measures to curb house prices have been introduced since then. In November 2013, the Third Plenary Session of the Eighteenth Central Committee of the Communist Party of China decided to give priority to fiscal and land reforms in order to increase supplies of land and residential property.
Aggregate financing to the real economy hit a new high as off-balance sheet credits increased
Although the annual growth rate of broad money supply M2 in 2013 decreased from 15.9% at the beginning of the year to 13.6% at the end of the year, it stayed higher than the official annual target of 13%. Meanwhile, aggregate financing to the real economy20 hit a new high as off-balance sheet credits, representing a proportion of the shadow banking system,21 increased rapidly. In 2013, new off-balance sheet credit accounted for 31.2% of
18 Measures aimed at curbing property prices include levying a 20% individual income tax rate on residential property sales and raising the
down payment ratio and lending rate for second house buyers. 19 Real estate investment accounted for about 20% of fixed investment, while fixed investment accounted for nearly a 50% share of GDP. 20 See Note 3. 21 See Note 4.

Macro environmental factors potentially affecting financial sector
FINANCIAL STABILITY REPORTMAY 2014 26
Chart 2.15 Shanghai Interbank Offered Rates
Source: China Foreign Exchange Trading System & National Interbank Funding Center.
13.44(6/20)
0
2
4
6
8
10
12
14
16
52013
6 7 8 9 10 11 12 12014
2 3
%
new aggregate financing to the real economy (RMB 17.3 trillion), which was well above the 2012 level of 23.2%, indicating a rapid rise in the scale of shadow banking (Chart 2.14).
In order to contain the risk in shadow banking and to gear it toward sound development, Document No. 107, issued by the State Council of Mainland China in 2013, identified the types of shadow banking22 and urged relevant authorities accordingly to ensure segregation of duties, develop a sound supervisory mechanism, strengthen risk management and formulate complementary measures. As Mainland China’s financial authorities continue strengthening supervision on shadow banking, including wealth management products, trust business, credit guarantee companies and micro-finance companies, close monitoring of subsequent developments is needed.
Measures launched successively to curb ballooning local government debts
The National Office of Audit of Mainland China published the audit findings of public debts at all levels of government in December 2013. Based on the report, local government debts swelled from RMB 15.9 trillion at the end of 2012 to RMB 17.9 trillion at the end of June 2013, which equaled more than 30% of GDP, showing a marked increase in local government debts. In order to curb debt risks to the banking industry, in January 2014, financial authorities approved local governments to issue bonds for fundraising. Moreover, the government, aiming to effectively monitor debt risks, vowed to strictly control the use of local government funds deriving from debt, launch an early warning system of local government debts and adopt a differentiated supervisory mechanism on different types of debts.
With policies promoted to reduce leverage and production capacity, expectation of cautious monetary policy remains
In the second half of June 2013, Mainland China’s interbank market experienced a serious liquidity shortage, causing a surge of the Shanghai Interbank Offered Rate (SHIBOR). After the PBC injected funds into
22 See Note 4.

Macro environmental factors potentially affecting financial sector
FINANCIAL STABILITY REPORTMAY 2014 27
markets through repo operations and short-term liquidity operations (SLO), the SHIBOR dropped back gradually (Chart 2.15). Considering the government’s determination to deleverage and reduce production capacity, lessen property bubble risk, trim swelling shadow banking activities and curb local government debts, the PBC is expected to maintain a cautious monetary policy stance in the near future.

Macro environmental factors potentially affecting financial sector
FINANCIAL STABILITY REPORTMAY 2014 28
Box 1 Taiwan has no need to follow Japan’s monetary policy of quantitative and
qualitative easing
In the early 2000s, the Bank of Japan (BOJ) started implementing a quantitative easing (QE) monetary policy. As a result of this policy, until 2004, Japan’s economy appeared to revive after years of recession. The year-on-year growth rate of the consumer price index (CPI) also saw a modest improvement. Nevertheless, the BOJ put an end to the QE policy too early in 2006. On top of that, the global financial crisis erupted in 2008, throwing Japan’s economy into a deflationary dilemma again from 2009 onwards. The BOJ hence re-started its QE policy in October 2010. Furthermore, after Shinzo Abe assumed the premiership in December 2012, the BOJ Governor Haruhiko Kuroda, who took office in April 2013, announced at his first monetary policy meeting that, in order to achieve its price stability target of a 2% inflation rate at the earliest possible time within two years, the BOJ would introduce a policy of quantitative and qualitative monetary easing (QQE). This box will explore the contents of QQE and the reasons Taiwan need not follow Japan’s monetary policy.
1. The contents of QQE
The objective of QQE is, via strong commitment to the target of 2% annual growth rate in core CPI within a time horizon of two years, to significantly change market inflation expectations, reduce long-term interest rates, support asset prices, and facilitate consumption as well as investment. The major contents of the policy are summarized below.
1.1 Switching to control the monetary base while nominal interest rates are near zero
bound
The expansion of the monetary base at an annual pace of about 60-70 trillion yen will be set as the new target of money market operations. The monetary base will double from its original amount within two years and is projected to reach 270 trillion yen by the end of 2014.
1.2 Increasing JGB purchases to push down long-term interest rates
The BOJ will increase their holding of long-term Japanese government bonds (JGBs) by an annual growth of about 50 trillion yen. The holdings are expected to expand to twice the current balance within two years. In addition, JGBs with maturities of 40 years will be eligible for purchase; therefore, the average remaining maturity of the JGB purchases

Macro environmental factors potentially affecting financial sector
FINANCIAL STABILITY REPORTMAY 2014 29
will be extended from slightly less than three years to about seven years.
1.3 Increasing ETF and J-REIT purchases to affect risk premia of asset prices
The BOJ will purchase exchange-traded funds (ETFs) and Japan real estate investment trusts (J-REITs) with annual increases of 1 trillion yen and 30 billion yen, respectively. By way of expanding purchases of financial instruments to ignite the stock market and real estate market, it will help push asset prices upwards and, in turn, elevate domestic demand and prices.
2. Taiwan’s moderately accommodative monetary situation was no less suitable than
Japan’s QE
Taiwan’s economy varied from that of Japan’s because Taiwan’s nominal interest rate didn’t approach the zero bound like Japan’s. Moreover, under the precondition of maintaining price stability and in the context of actual output below full capacity, the CBC provided loose monetary circumstances in recent years, which was conducive to macroeconomic development in Taiwan. Thus, there is no need for Taiwan to echo Japan on its latest execution of QQE.
2.1 Taiwan already implemented its own version of QE during the global financial
crisis
In order to promote financial stability and boost the domestic economy, the CBC lowered its discount rate seven times during the period of the financial crisis from 3.625% on 25 September 2008 to 1.25% on 19 February 2009, slashing it by a total of 2.375 percentage points. The interbank call loan rate subsequently dropped to 0.10% or so. Meanwhile, the CBC maintained excess reserves in the banking system with a peak close to NT$160 billion. These moderately accommodative measures can be regarded as Taiwan’s version of QE.
2.2 Taiwan has never experienced deflation nor a credit crunch
(1) Japan’s deflationary malaise had existed for nearly 15 years since 1998, with the average year-on-year change of CPI being -0.2%. On the other hand, prices in Taiwan remained stable, with the average annual growth rate of CPI stabilizing at around 1% in the same period.
(2) With abundant capital, the average annual growth rate of bank credit in Taiwan posted 5.2% since 1995 while in Japan it registered merely 0.9% (Chart B1.1).

Macro environmental factors potentially affecting financial sector
FINANCIAL STABILITY REPORTMAY 2014 30
Chart B1.1 Annual growth rates of bank credit in Taiwan and Japan
Note: During the global financial crisis in 2009, the BOJ bought up massive amounts of Japanese government bonds, thereby lifting the annual growth rates of bank credit.
Sources: CBC and BOJ.
2013/120.43
2013/124.59
-10
-5
0
5
10
15
20
1995 97 99 2001 03 05 07 09 11 13
Japan Taiwan%
(3) Taiwan actively promoted lending to small- and medium-sized enterprises (SMEs), with the average annual growth rate recording 8.2% from 2009 to 2013, while Japan’s SME loans shrank by 1.3% per year on average.
2.3 Taiwan's M2 money supply grew
steadily and sufficiently to sustain
domestic economic activity
(1) The CBC set a target zone for M2 growth according to economic growth rates and annual change of the CPI. In recent years, M2 growth rates approximated the sum of GDP growth rates and annual change of the CPI (Table B1.1).
(2) In recent years, M2 annual growth rates have fallen within the target zone, showing that M2 money supply has maintained proper growth, sufficient to meet the demands of economic activity.
Table B1.1Annual change in M2 ≈ Real GDP growth rates + Annual change of CPI
Annual average
GDP growth rates
(a)
Annual changeof CPI
(b)
GDP growth rates+ Annual change of CPI
(a) + (b)
Annual change in M2
1995-2013 4.19 1.28 5.47 6.28
2001-2013 3.62 1.05 4.67 5.09
2003-2013 3.95 1.25 5.20 5.18
2008-2013 2.91 1.29 4.20 4.91
Source: DGBAS.
2.4 QE was only beneficial to major economies as it contributed to depreciation of
their currencies
(1) Japan is the world’s third largest economy, and the yen is one of the major currencies in terms of international trade and FX trading. Its adoption of large-scale QE was expected to drive the yen’s depreciation; however, such a policy would not work in Taiwan's favor, as Taiwan didn’t warrant the conditions.

Macro environmental factors potentially affecting financial sector
FINANCIAL STABILITY REPORTMAY 2014 31
Chart B1.3 REER indices for NTD, KRW and RMB
Notes: 1. The compilation of REER refers to the footnote of Chart B1.2.
2. Year 2010=100. Source:BIS.
101.82
118.79
108.64
80
90
100
110
120
130
140
2001 03 05 07 09 11 13
NTD RMB KRW
(2) In spite of the implementation of QE to push down the yen’s value, the intended effect of depreciation might be partly offset by the spillover effects triggered by QE in the US.
2.5 The yen’s depreciation was to
rectify its previous over-valuation
resulting from investors’ hedging
demands
(1) The yen's real effective exchange rate (REER) indices were still higher than the lowest point pegged before the financial crisis (Chart B1.2).
(2) After the earthquake hit northeast Japan on 11 March 2011, massive imports of energy resulted in the trade deficit progressively hitting record highs and in turn speeding up the yen’s depreciation.
(3) The NTD’s REER is still lower than those of South Korea's won (KRW) and Mainland China's RMB. As such, it still gives Taiwan an edge on export prices (Chart B1.3).
3. Conclusion
In the past twenty years, Japan experienced a period of two “lost decades” with an average economic growth rate of just 0.89%, while Taiwan’s economy saw stable growth, maintaining an average annual growth rate of at least 4% and relatively stable prices. Moreover, Taiwan adopted without delay its own version of QE during the global financial crisis. Current monetary circumstances are moderately accommodative, which is beneficial to its macroeconomic development. Therefore, there is no need for Taiwan to follow Japan to introduce a policy of QQE.
Chart B1.2 JPY REER indices
Notes: 1. The REER, which is compiled by the BIS and based on currency data comprising 27 economies, is the weighted average of a country's currency relative to a basket of other major currencies adjusted for the effects of inflation.
2. Year 2010 = 100. Source:BIS.
2001/2109.95
2007/774.11
77.01
70
75
80
85
90
95
100
105
110
115
120
2001 03 05 07 09 11 13
Highest
Lowest
Macro environmental factors potentially affecting financial sector
FINANCIAL STABILITY REPORTMAY 2014 32
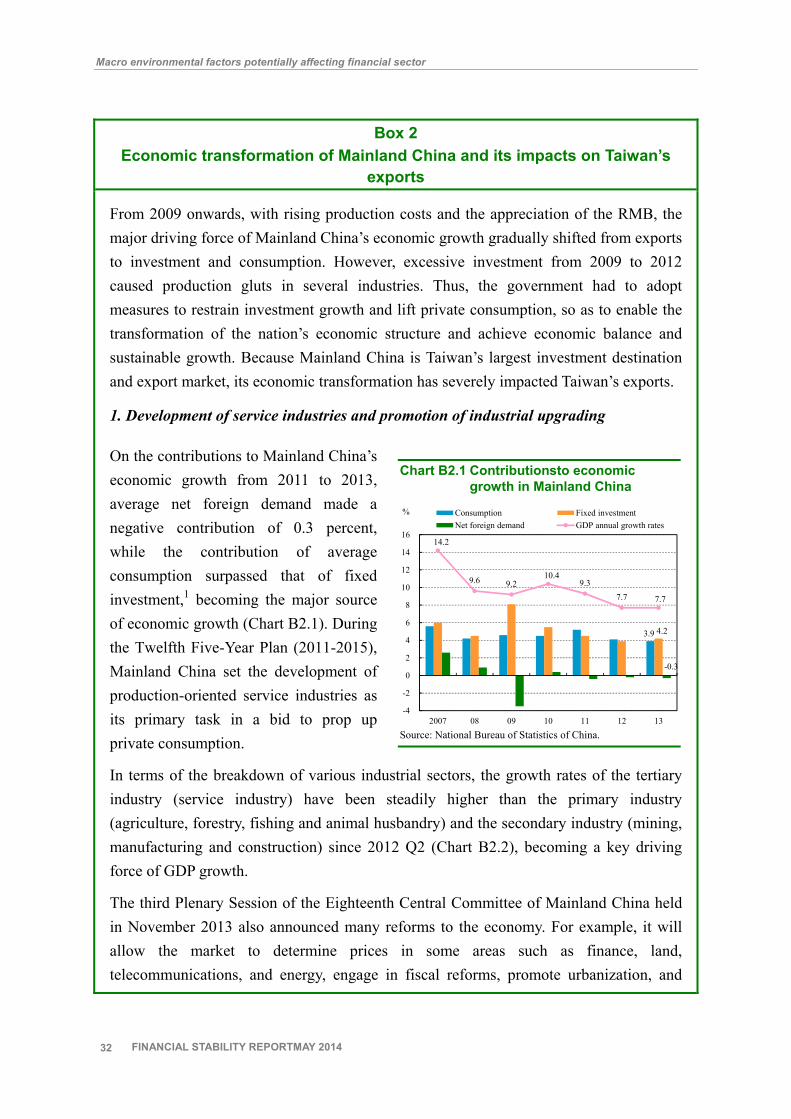
Chart B2.1 Contributionsto economic growth in Mainland China
Source: National Bureau of Statistics of China.
3.9 4.2
-0.3
14.2
9.6 9.2 10.4
9.3 7.7 7.7
-4
-2
0
2
4
6
8
10
12
14
16
2007 08 09 10 11 12 13
Consumption Fixed investmentNet foreign demand GDP annual growth rates
%
Box 2 Economic transformation of Mainland China and its impacts on Taiwan’s
exports
From 2009 onwards, with rising production costs and the appreciation of the RMB, the major driving force of Mainland China’s economic growth gradually shifted from exports to investment and consumption. However, excessive investment from 2009 to 2012 caused production gluts in several industries. Thus, the government had to adopt measures to restrain investment growth and lift private consumption, so as to enable the transformation of the nation’s economic structure and achieve economic balance and sustainable growth. Because Mainland China is Taiwan’s largest investment destination and export market, its economic transformation has severely impacted Taiwan’s exports.
1. Development of service industries and promotion of industrial upgrading
On the contributions to Mainland China’s economic growth from 2011 to 2013, average net foreign demand made a negative contribution of 0.3 percent, while the contribution of average consumption surpassed that of fixed investment,1 becoming the major source of economic growth (Chart B2.1). During the Twelfth Five-Year Plan (2011-2015), Mainland China set the development of production-oriented service industries as its primary task in a bid to prop up private consumption.
In terms of the breakdown of various industrial sectors, the growth rates of the tertiary industry (service industry) have been steadily higher than the primary industry (agriculture, forestry, fishing and animal husbandry) and the secondary industry (mining, manufacturing and construction) since 2012 Q2 (Chart B2.2), becoming a key driving force of GDP growth.
The third Plenary Session of the Eighteenth Central Committee of Mainland China held in November 2013 also announced many reforms to the economy. For example, it will allow the market to determine prices in some areas such as finance, land, telecommunications, and energy, engage in fiscal reforms, promote urbanization, and

Macro environmental factors potentially affecting financial sector
FINANCIAL STABILITY REPORTMAY 2014 33
Chart B2.2 Growth rates of production value in three classes of industries in Mainland China
Note: Primary industry covers agriculture, forestry, fishing and animal husbandry. Secondary industry comprises mining, manufacturing and construction, among others. Tertiary industry consists of various types of service sectors.
Source: National Bureau of Statistics of China.
10.37
6.76
12.14
0
2
4
6
8
10
12
14
16
18
20
2011 2012 2013
Tertiary industry
Primary industry
Secondary industry
%
open-up certain service industries including healthcare, old-age care, telecommunications and logistics services. All of these measures are conducive to the growth of consumption.
Moreover, the manufacturing sector has been experiencing a period of adjustment. For example, industry supply chains are increasingly geared toward localization and investment patterns are moving from downstream to mid- and up-stream industries, resulting in less imports of intermediary goods, parts and components than before. Besides, reducing low efficiency industries via import substitution, replacing domestic production with foreign imports allows factors of production to move to higher efficiency industries with the aim of promoting industrial upgrading.
2. Economic transformation of Mainland China is likely to slow down its economic
growth in the short run, but could help raise per capita GDP in the long run
In the wake of the global financial crisis that erupted in 2008, Mainland China put forward a RMB 4-trillion Economic Stimulus Package. Although the package supported its economy and helped it rebound, there emerged a problem of a production glut in the real sector, coupled with excess liquidity washing around in the financial system. To reduce the economy-wide risks, the government adopted measures to tighten credit growth, facilitate investment rationalization, and weed out over-capacity of production. These measures caused GDP growth to slip.
With the transformation of economic structure and increasing expansion of economic scale, Mainland China’s economic policy in recent years no longer gave top priority to raising economic growth. Instead, it stressed the importance to strike a balance between "stabilizing growth " and "restructuring the economy." The IMF forecasts that, if the proposed reforms are implemented, Mainland China’s economy will grow 6% per annum from 2013-2030.2
It is worth noting that, Mainland China's economy is facing a number of challenges, such

Macro environmental factors potentially affecting financial sector
FINANCIAL STABILITY REPORTMAY 2014 34
Table B2.1 Mainland China’s imports and exports
Source: General Administration of Customs of the People's Republic of China.
Amount % Amount %
2007 1,218.0 617.7 50.7 955.8 368.4 38.5
2008 1,428.5 675.2 47.3 1,133.1 378.4 33.4
2009 1,201.7 587.0 48.8 1,005.6 322.3 32.1
2010 1,577.9 740.3 46.9 1,394.8 417.4 29.9
2011 1,898.6 835.4 44.0 1,743.5 469.8 26.9
2012 2,048.9 862.7 42.1 1,817.8 481.1 26.5
2013 2,210.0 860.8 39.0 1,950.3 497.0 25.5
Unit: US$ bn; %
Processing tradeTotalamount
Export
Year
Import
Totalamount
Processing trade
as rising labor costs, imbalances in economic development, resource constraints, and environmental pollution. The IMF indicated that, if Mainland China does not continue proceeding with structural transformation, it may risk falling into a “middle income trap,” and its per capita GDP would still be merely a fourth of America's by 2030. However, in the case where the proposed reforms are successfully implemented, its per capita GDP is projected to achieve 40% of the US level in 2030.
3. The impacts of Mainland China’s economic transformation on Taiwan’s exports
Much of the decline in the growth of Taiwan’s exports can be attributed to the downswing in the global economy and the slowdown of Mainland China’s economic growth. In recent years, the transformation of Mainland China’s economic structure leading to the reduction of its imports from Taiwan has also been an important factor.
3.1 Economic transformation with a decline in the proportion of processing trade is
unfavorable to the growth of Taiwan’s exports of intermediary goods
Mainland China is Taiwan’s largest investment destination and export market. Under international fragmentation of production, Taiwan exported a lot of intermediary goods to Mainland China for subsequent processing, and then re-exported the final products to various destinations all over the world. Nevertheless, the contribution of net exports to Mainland China’s economic growth turned from positive to negative. The proportion of processing exports to total exports slipped from 50.7% in 2007 to 39.0% in 2013, while the proportion of processing imports to total imports dropped from 38.5% to 25.5% in the same period (Table B2.1). Under this policy of restructuring the economy and expanding domestic demand, a reduction of processing trade has impacted the growth of Taiwan’s exports of intermediary goods to Mainland China.
3.2 The downturn of Taiwan’s export growth is attributed to the slowdown of the
growth in exports to Mainland China, particularly for the panel industry

Macro environmental factors potentially affecting financial sector
FINANCIAL STABILITY REPORTMAY 2014 35
Chart B2.3 Contributions to Taiwan’s exports by region
Source: The Customs Administration, Ministry of Finance.
12.8
6.7
2.2
0.5 1.00.4
3.8
0.81.9
0.2
-0.2
0.1
-2
0
2
4
6
8
10
12
14
Totalexports
MainlandChina and
Hong Kong
ASEAN US EU Japan
Pre-global financial crisis (2003-2007)
Post-global financial crisis (2011-2013)
Pecentagepoints
Over recent years, Mainland China has adopted the policy of import substitution which has actively helped develop local strategic industries, such as the flat-panel and semiconductor industries. This made the trade pattern of vertical specialization wane, led to cross-strait industries moving toward competition with one another, and thereby impacted Taiwan’s exports.
3.2.1 The downturn of Taiwan’s exports to Mainland China is the main cause of the
slowdown of export growth
(1) Before the global financial crisis (2003-2007), the average annual growth rates of Taiwan’s exports reached 12.8%. However, the growth rates after the crisis (2011-2013) sharply plunged by 9 percentage points to 3.8% (Chart B2.3).
(2) Taiwan’s exports to Mainland China accounted for about 40% of Taiwan’s total exports. After the crisis, the export contribution of the Mainland China market fell by 5.9 percentage points compared to that before the crisis (Chart B2.3). The degree of reduction was larger than that in other areas, pointing to the slowdown of Taiwan’s export growth being mainly attributable to the drop in exports to Mainland China.
3.2.2 Taiwan’s main export products were impacted by the policy of industrial
upgrading and import substitution promoted in Mainland China
(1) Before the crisis, the average annual growth rate of Taiwan’s exports to Mainland China reached 18.4%. Nevertheless, the growth rate touched just 2.0% after the crisis (Chart B2.4).
(2) Mineral products, chemicals, plastics & rubber and articles thereof, basic metals and articles thereof, machineries, electronics, information & communication products, and flat panels are key commodities exported from Taiwan to Mainland China. The total amount of these exports accounted for 90% of all exports to Mainland China. Compared to those before the crisis, the pace of their yearly growth rates showed signs of slowing down.

Macro environmental factors potentially affecting financial sector
FINANCIAL STABILITY REPORTMAY 2014 36
Chart B2.4 Annual growth rates of major products exported from Taiwan to Mainland China
Note: Including the data of exports to Hong Kong. Source: The Customs Administration, Ministry of Finance.
18.4
39.0
28.0
18.3 15.6
3.8
19.2
62.0
2.0
25.1
3.5
-0.8 -1.8 -2.5
6.2
-3.8 -10
0
10
20
30
40
50
60
70
Totalexports
Mineralproducts
Chemicals Plastics, rubberand articles
thereof
Basic metalsand articles
thereof
Machineries Electronic,information &communication
products
LCDpanels
Pre-global financial crisis (2003-2007)
Post-global financial crisis (2011-2013)
%
(3) Among the above-mentioned products, the average annual growth rate of flat-panel exports declined substantially to -3.8% from 62.0%, signaling the largest degree of reduction, and constituting a severe challenge to the domestic flat-panel industry. Consequently, as the balances of domestic banks’ loans to local major flat-panel companies are still high, banks are suggested to pay close attention to flat-panel industry developments and related credit risks.
Notes: 1. In 2013, owing to the increase in the investment of railway construction and other civil infrastructure, the contribution from fixed investment was somewhat greater than that from consumption.
2. Referring to Barnett, Steven (2013), China’s Growth: Why Less is More, IMF direct, Oct. 29.