Effect of Process Parameters on Greenhouse Gas Generation by Wastewater Treatment Plants

S C I E N C E O F T H E T O T A L E N V I R O N M E N T 4 0 7 ( 2 0 0 9 ) 2 4 0 4 – 2 4 1 0
ava i l ab l e a t www.sc i enced i r ec t . com
www.e l sev i e r. com/ loca te / sc i to tenv
Potential effects of desalinated water quality on the operationstability of wastewater treatment plants
Beni Lewa, Malka Cochvab, Ori Lahavb,⁎a Agricultural Research Organization, Institute of Agricultural Engineering, P.O.Box 6, Bet Dagan 50250, Israelb Faculty of Civil and Environmental Engineering, Technion, Israel Institute of Technology, Haifa, 32000, Israel
A R T I C L E D A T A
⁎ Corresponding author. Tel.: +972 4 8292191;E-mail address: [email protected] (O. L
0048-9697/$ – see front matter © 2008 Elsevidoi:10.1016/j.scitotenv.2008.12.023
A B S T R A C T
Article history:Received 14 May 2008Accepted 10 December 2008Available online 29 January 2009
Desalinated water is expected to become themajor source of drinkingwater inmany places inthe near future, and thus the major source of wastewater to arrive at wastewater treatmentplants. The paper examines the effect of the alkalinity value with which the water is releasedfrom the desalination plant on the alkalinity value that would develop within the wastewatertreatment process under various nitrification–denitrification operational scenarios. The mainhypothesis was that the difference in the alkalinity value between tap water and domesticwastewater is almost exclusively a result of the hydrolysis of urea (NH2CONH2, excreted in thehuman urine) to ammonia (NH3), regardless of the question what fraction of NH3(aq) istransformed toNH4
+. Results froma field study showthat the ratiobetweenthealkalinityaddedto tap water when raw wastewater is formed (in meq/l units) and the TAN (total ammonianitrogen, mole/l) concentration in the rawwastewater is almost 1:1 in purely domestic sewageandclose to1:1 indomesticwastewater streamsmixedwith light industrywastewaters.Havingestablished the relationship between TAN and total alkalinity in raw wastewater the paperexamines three theoretical nitrification–denitrification treatment scenarios in the wastewatertreatment plant (WWTP). The conclusion is that if low-alkalinity desalinated water constitutesthemajor water source arriving at theWWTP, external alkalinitywill have to be added in orderto avoid pH drop and maintain process stability. The results lead to the conclusion thatsupplying desalinated water with a high alkalinity value (e.g. ≥100mg/l as CaCO3) would likelyprevent the need to add costly basic chemicals in the WWTP, while, in addition, it wouldimprove the chemical and biological stability of the drinking water in the distribution system.
© 2008 Elsevier B.V. All rights reserved.
Keywords:Desalinated waterAlkalinityUreaAmmoniaQuality regulations
1. Introduction
Desalinated water is becoming more and more common.Between 1995 and 2009, the world desalination capacityincreased from 18.9 million cubic meters (mcm)/d to63 mcm/d. At the end of 2008, there were 13,869 desalinationprojects in 155 countries around the world, which suppliedaround 1% of the world's drinking water. Year-on-year growthrates are difficult to ascertain but comparing the averageannual capacity between 2001 and 2005 and the averageannual capacity over the previous five years, it would appear
fax: +972 4 8228898.ahav).
er B.V. All rights reserved
that the desalination market is growing at a rate of 25% peryear (Wangnick, 2006). Since desalination is cost effective onlyif operated constantly, large desalination plants are expectedto become the base water resource for supply in many cases,while other water sources (aquifer and surface waters) will beadded only at peak demand. Consequently, it appears thatunblended desalinated water will become, in the foreseeablefuture, themajor source of water to arrive atmanywastewatertreatment plants (WWTP). With respect to the quality ofdesalinated water that may have an adverse effect on WWTPoperation, it would appear that the low alkalinity value of this
.
2405S C I E N C E O F T H E T O T A L E N V I R O N M E N T 4 0 7 ( 2 0 0 9 ) 2 4 0 4 – 2 4 1 0
watermay be of concern to the pH stability ofWWTP designedfor partial (full nitrification and partial denitrification) or evencomplete nitrogen species removal (i.e. full nitrification–denitrification).
Currently, in most active desalination plants carbonatealkalinity is added to the water (mainly via limestone (CaCO3(s)))dissolution together with Ca2+ ions in order to stabilize thewater with respect to buffering capacity and CaCO3 precipita-tion potential (i.e. to attain positive values for either LSI orCCPP indices). Because of cost considerations associated withthe post treatment applied at desalination plants and the lackof strict water quality regulations, desalinated waters arecurrently supplied in many places with relatively lowalkalinity values. For example, the 100 mcm/y Ashkelonplant in Israel supplieswaterwith an alkalinity concentrationof 45–50 mg/l as CaCO3, similar to the value in the watersupplied by the 30 mcm/y Palmahim plant (also in Israel).Desalination plants in Kuwait supply water with 50–80 mg/las CaCO3 (Odone, 2002) and the Khekelia plant in Cyprus wasdesigned to supply water with an alkalinity value as low as30 mg/l as CaCO3 (Marangou and Savvides, 2001). The sixlargest desalination plants in California supply water with analkalinity concentration of 40–60 mg/l as CaCO3 (US Depart-ment of Interior, 1995). In Spain desalination plants aredesigned to supply water with a value according to theEuropean Directive 80/778/CEE that is as low as 30 mg/l asHCO3
−, i.e., ∼25 mg/l as CaCO3 (Valero et al., 2001).Recently, the Israeli Ministry of Health adopted a set of
recommendations for the quality of desalinated water follow-ing post treatment, in which the required alkalinity value wasset at N80 mg/l as CaCO3 (Lahav and Birnhack, 2007; Birnhacket al., 2008). This value was set as a compromise between thecost of the post treatment and the acknowledgement that ahigher value (at least 100mg/l as CaCO3) is required in order toprevent stability indices from becoming negative followingblend with other water sources, particularly groundwatersources characterized by relatively low pH values (Lahav andBirnhack, 2007).
It is well known that when water is transformed fromdrinking water to wastewater its alkalinity concentrationincreases. This increase has been vaguely associated with avariety of sources, including domestic and industrial additionof phosphate, urea, ammonia, borates, silicates, volatile fattyacids and similar compounds (Metcalf and Eddy, 2003). Weshow in this paper that the main (in domestic sewage, almostexclusive) reason for the rise in the alkalinity value in rawsewage arriving at wastewater treatment plants is thehydrolysis of urea excreted in the urine to NH3(aq), and thatthe increase in the alkalinity concentration is therefore closelyproportional to the total ammonia nitrogen (TAN) concentra-tion measured in the raw sewage. It is also shown that thecombined effect of nitrification and denitrification on thealkalinity value may be such that if the initial alkalinity valuein the raw drinking water is low, the alkalinity value in thetreated wastewater and therefore the pH may drop to valuesthatmay endanger the stability of the treatment process, up toa point that will require the addition of alkalinity-containingchemicals to the sewage at theWWTP.We conclude the paperby calling for supply of desalinated water with higheralkalinity values in order to prevent both the situation
described here and at the same time in order to increase thechemical and biological stability of desalinated water in thewater distribution system.
1.1. The importance of imparting a high alkalinity value todesalinated water
The commonly used term “alkalinity” in natural waters refersto the value of H2CO3⁎ alkalinity, defined as the protonaccepting capacity of the solution with respect to H2CO3⁎ asreference species. The mathematical expression of this valueis given in Eq. (1). Such an alkalinity value is typicallymeasured by strong acid titration to a pH value close to 4.5(i.e. close to the H2CO3⁎ equivalence point), or more accurately,by applying the Gran titration technique (Gran, 1952).
AlkalinityðH2CO3⁎Þ ¼ 2½CO2−3 � þ ½HCO−
3 � þ ½OH−�–½Hþ�: ð1Þ
From the knowledge of the alkalinity and pH values, thebuffering capacity (β) of the water can be calculated. For a givenpH value higher alkalinity results in a higher buffering capacity.The value of β is important because it has been shown thatminimization of local pH variations promotes a denser scalestructure on the walls of water distribution pipes, therebydecreasing the rate of iron release from the scales (Sarin et al.,2004). Moreover, a higher alkalinity value at a given pHtranslates into a higher inorganic carbon concentration (CT)and thus to a higher concentration of the species CO3
2−. This isperceived advantageous because various models that discusscorrosion and red water prevention in distribution systemspoint out that the precipitation of siderite (FeCO3) is imperativefor the development of an effective passivation layer (Sonthei-mer et al., 1981). Another reason in support of a high alkalinityvalue in desalinatedwater relates to the fact that for attaining arequired calcium carbonate precipitation potential (CCPP) valueat a given Ca2+ concentration, a higher alkalinity value wouldenable maintaining a relatively low pH, advantageous withrespect to disinfection (Lahav and Birnhack, 2007). A compre-hensive pilot study conducted on the matter of prevention of“red water” in water distribution systems concluded thatmaintaining the alkalinity concentration above 80 mg/l asCaCO3 is the most important individual parameter for prevent-ing the release of metal ions to the water (Imran et al., 2005).
1.2. Factors affecting the change in alkalinity valuebetween drinking water and wastewater
In raw sewage two more systems (on top of the carbonatesystem) invariably contribute to the alkalinity value: theammonia (NH4
+/NH3) and orthophosphate (H3PO4/H2PO4−/
HPO42−/PO4
3−) weak acid systems. Other weak acid systemsmay also be present (short chain volatile fatty acids, forexample), but typically at very low concentrations. Thealkalinity value in raw sewage is typically measured by strongacid titration to a pH value close to 4.5 (i.e. close to the H2CO3⁎
and HPO4− equivalence points), or by applying the Gran
titration technique to a pH slightly below pH 4. However, itshould be noted that the reference species for the orthopho-sphate system in this alkalinity-analysis approach is H2PO4
−.The mathematical expression of this alkalinity value is given

2406 S C I E N C E O F T H E T O T A L E N V I R O N M E N T 4 0 7 ( 2 0 0 9 ) 2 4 0 4 – 2 4 1 0
in Eq. (2), and more explicitly in Eq. (3) where it is shown as afunction of the total inorganic carbon (CT), TAN and totaldissolved orthophosphate (PT) concentrations.
AlkalinityðH2CO3⁎;NH4þ ;H2PO4
−Þ ¼ 2½CO2−3 � þ ½HCO−
3 � þ 2½PO3−4 �
þ ½HPO2−4 � þ ½NH3�
þ ½OH−�–½Hþ�–½H3PO4� ð2Þ
Alkalinity H2CO⁎3 ;NH
+4 ;H2PO
�4ð Þ =
2Kc1Kc2CT + Kc1 H +½ �CT
Kc1Kc2 + Kc1 H +½ � + H +½ �2
+2Kp1Kp2Kp3PT + Kp1Kp2 H +½ �PT � H +½ �3PT
Kp1Kp2Kp3 + Kp1Kp2 H +½ � + Kp1 H +½ �2 + H +½ �3
+KNTANK + H +½ � +
KwH +½ � � H +½ �:
ð3Þ
In drinking water, and in particular in desalinated water,the values of PT and TAN are zero. From Eq. (2) it follows thatthe increase in the alkalinity value in raw wastewater can bethe result of the addition of strong bases (i.e. OH− addition) tothe water or of alkalinity-containing species of the carbonate,ammonia or phosphate weak-acid systems (i.e. CO3
2−, HCO3−,
NH3, PO43− or HPO4
2). In contrast, the addition of strong acids(or of the species H3PO4) to thewaterwill result in a decrease inthe alkalinity value. Note that the release of CO2(g) to the wateras a result of breakdown of organicmatter does not change thealkalinity value.
1.3. The effect of urea hydrolysis and consequent TANconcentration on the alkalinity value of raw municipalwastewater
Urea, excreted with the human urine, rapidly decomposes inwater to ammonia and ammonium ions in the presence of theenzyme urease (Udert et al., 2003):
NH2CONH2 þ 2H2O→NH3 þ NHþ4 þ HCO−
3 : ð4Þ
At the pH range prevalent in raw municipal sewage, mostof the non-ionic ammonia is transformed to NH4
+ whileassuming a proton. Thus, at pH values lower than ∼pH8 thereaction is better described by Eq. (5) (Fittschen and Hahn,1998):
NH2CONH2 þ 3H2O→2NHþ4 þ HCO−
3 þ OH−: ð5Þ
Irrespective of whether Eqs. (4) or (5) is used, the alkalinityvalue in the sewage, as depicted in Eq. (2), is increased by 1 eq/lfor each mol/l of nitrogen that is added to the sewage with theurine. In Eq. (4) the species that contribute to the alkalinityvalue are NH3 andHCO3
− and in Eq. (5) they are HCO3− and OH−,
but the net result is identical. Since almost all the dissolvedammonia that appears in raw sewage comes from urine(Larsen and Gujer, 1996; Hanaeus et al., 1997), one can expectthat the difference between the alkalinity value (in eq/l units)in the drinking water and that of the raw sewage will beclosely related to the dissolved ammonia concentration in thesewage (in mol/l units). Assuming that the contribution oforthophosphate to the alkalinity value is small, this relation isexpected to tend toward a ratio of 1:1 in sewage that is purelydomestic, where urea is expected to be, almost exclusively, thesource of additional alkalinity.
Another source that contributes to the overall dissolvedammonia flux in wastewater treatment plants is dissolvedand suspended nitrogen-containing organic matter. Typicallyinmunicipal wastewater the value of total Kjeldahl nitrogen ishigher than TAN by 60%–70% (Metcalf and Eddy, 2003). Thefraction of organic nitrogen that is transformed to NH3 as aresult of the decomposition of the organic matter alsocontributes 1 eq/l of alkalinity for each mol/l of NH3 released,thus once again the ratio between ΔTAN and Δalkalinitycontributed to the water is 1:1.
In sewage that is mixed with industrial wastewater, it isexpected that the ΔTAN to Δalkalinity ratio will somewhatdeviate from 1 to 1 depending on the composition of industrialstreams and the flux of acidic and/or basic substances arrivingat the treatment plant, however the Δalkalinity to ΔTANrelationship, with respect to the difference between thedrinking water and the raw sewage, was again hypothesizedto be relatively linear, assuming again that urea is the majorcontributor to the rise in the alkalinity concentration in thesewage relative to the alkalinity value in the original tapwater.
1.4. Effect of nitrogen species removal on the alkalinityvalue in WWTP
Most modern wastewater treatment plans are designed forcomplete removal of nitrogenous species using the nitrifica-tion–denitrification treatment scheme. Regardless of thetreatment method used (activated sludge based methods,trickling filters, RBC, etc.), the stoichiometric reactions of bothprocesses in wastewater treatment plants are fairly wellknown. Eq. (6) is shown to represent a typical nitrificationreaction (Metcalf and Eddy, 2003).
NHþ4 þ 1:863O2 þ 0:098CO2→0:0196C5H7NO2 þ 0:98NO−
3þ 0:0941H2O þ 1:98Hþ: ð6Þ
According to Eqs. (6) and (2) eachmol/l of NH4+ converted to
NO3− brings about a decrease of ∼2.0 eq/l in the alkalinity
value.Eq. (7) is a representative equation for denitrification in
which C10H19O3N represents the average electron donor in rawsewage (Metcalf and Eddy, 2003) assuming a common electronfraction to bacteria synthesis of 0.25:
C10H19O3N þ 7:5NO−3 þ 7:87Hþ→0:62C5H7O2N þ 3:75N2
þ 6:87CO2 þ 10:5H2O þ 0:375NHþ4 : ð7Þ
Combining Eqs. (6) and (7) gives an approximate nitrifica-tion–denitrification process equation:
0:14C10H19O3N þ 1:96O2 þ NHþ4 →0:11C5H7O2N þ 0:52N2
þ 0:84CO2 þ 1:54H2O þ Hþ: ð8Þ
Note that Eq. (8) represents a case in which full nitrifica-tion/denitrification is practiced. Eq. (8) shows that under thepractical assumption that TAN in wastewater appearsalmost exclusively as NH4
+, the combined effect of nitrifica-tion/denitrification on the alkalinity value is a net decreaseof exactly 1.0 eq/l of alkalinity for each mol/l of NH4
+
converted to N2(g). However, it is not uncommon in treat-ment plants that the water is released with a certain nitrate

Table 1 – Data of raw domestic sewage measured duringone-day campaigns in three separate locations. Alkalinityrefers to the value of alkalinity(H2CO3*, H2PO4
−, NH4+),
Time(h)
pH EC(ds/m)
Alkalinity(meq/l)
TAN(mmol/l)
PT(mmol/l)
YagurTap water(n=3)
6.85–6.95 1.523±0.02
6.12±0.07 0 0
07:00 8.03 1.840 9.77 3.45 0.1507:30 7.64 1.955 10.71 2.60 0.0807:55 7.58 1.885 8.50 2.39 0.0708:30 7.41 1.773 7.17 1.20 0.0309:00 7.93 1.900 8.65 2.56 0.1009:30 8.05 1.890 9.48 3.13 0.1110:10 7.82 1.964 8.82 2.60 0.1111:00 7.94 1.860 8.62 2.48 0.1011:45 7.83 1.898 8.08 2.15 0.0912:30 7.75 1.969 8.57 2.29 0.0913:15 8.03 1.900 9.77 3.21 0.1113:55 7.83 1.919 8.44 2.02 0.0814:30 7.75 1.940 8.50 2.90 0.08
Maagan MichaelTap water(n=3)
8.50–8.90 0.482±0.02
2.20±0.07 0 0
07:45 7.35 0.707 3.27 1.32 0.1308:00 8.11 0.676 3.25 1.46 0.1208:15 8.45 0.713 3.53 1.68 0.1408:30 8.47 0.664 3.19 1.19 0.0908:40 8.42 0.591 2.81 0.86 0.0509:00 8.43 0.846 3.75 2.14 0.1509:15 8.65 0.731 3.57 1.24 0.1209:55 8.66 0.763 3.85 1.76 0.1310:30 7.81 0.749 3.52 1.22 0.1811:00 8.33 0.877 4.71 2.19 0.2611:30 8.36 0.908 4.72 2.99 0.2312:00 8.61 0.857 4.56 2.55 0.2312:30 8.68 0.839 4.54 2.57 0.1513:00 8.21 0.804 4.14 1.94 0.13
2407S C I E N C E O F T H E T O T A L E N V I R O N M E N T 4 0 7 ( 2 0 0 9 ) 2 4 0 4 – 2 4 1 0
concentration, i.e. that denitrification is not carried out tocompletion. In such cases, the destruction of alkalinity islarger than the ratio indicated by Eq. (8). Another note-worthy situation is that of treatment plants that do notremove nitrogen species as part of the process, eitherintentionally or due to overloading. Such a case is, forexample, the ∼40 million m3/y Haifa WWTP in Israel, whichis designed to produce water exclusively for agriculturalirrigation and thus is not designed for nitrification–deni-trification. Despite this, when the water temperatureincreases in the summer significant unintentional nitrifica-tion invariably occurs, reducing the alkalinity value in theplant's effluent.
1.5. Minimumalkalinity values for stableWWTP operation
Alkalinity decrease to low values during activated sludgereactor operation may cause a drop in pH resulting in processinstability (e.g. to the activity of nitrifying bacteria, but also toother processes within the treatment plant and in down-stream effluent uses). To avoid this problem a minimumalkalinity concentration in raw sewage is recommended invarious literature sources. For example, Henze et al.(2002) recommended a very high threshold alkalinity concen-tration — 5 meq/l (250 mg/l as CaCO3). Another study on theeffect of alkalinity on nitrification in trickling filters concludedthat as long as the ratio between bicarbonate and TAN in theinfluent was higher than 2.5 eq HCO3
−/mol ammonia, nitrifi-cation was not inhibited due to low alkalinity (Bjornsdotter,2005). In a different study Bliss et al. (1994) observed that theminimum residual total alkalinity in the treated effluentshould be 75 mg/l as CaCO3 in order to sustain stablenitrification. The least stringent requirement was presentedby Ekama and Marais (1984), who recommended a minimumalkalinity concentration of between 40 to 50 mg/l as CaCO3 tomaintain pH≥7.0 in the treated effluent.
In this paper empirical data is shown in support of thehypothesis that the ratio between the additional concentra-tions of alkalinity and TAN in domestic wastewater tendsindeed toward 1 to 1, i.e. that both additions stem predomi-nantly from the hydrolysis of urea. Having established this, atheoretical discussion is presented on the possible effect ofvariousnitrification/denitrification treatment scenarios on thealkalinity mass balance and the possible effect on WWTPoperation.
TechnionTap water(n=3)
7.06–7.29 1.071±0.03
3.76±0.03 0 0
06:50 7.71 1.574 5.83 2.29 0.6307:20 8.09 1.381 4.92 1.35 0.1907:50 7.97 1.258 4.50 0.99 0.0908:20 8.42 1.520 5.81 1.46 0.4808:50 8.46 1.392 5.50 1.40 0.2309:20 8.08 1.263 4.35 1.01 0.1010:20 8.07 1.281 4.66 1.11 0.0911:00 7.93 1.285 4.98 0.80 0.3411:50 7.96 1.339 4.45 1.14 0.1612:40 8.75 1.487 5.86 0.72 0.7813:20 7.86 1.265 4.62 0.55 0.1114:40 7.72 1.308 4.52 0.87 0.2415:30 7.87 1.304 5.32 1.44 0.00
2. Materials and methods
Five different locations were sampled in the work: In the firstthree (Yagur, Maagan Michael and Technion), the sampledwastewater was exclusively from domestic source. The twoother sampling locations were located at the entrance to theWWTP of two medium-sized cities in Northern Israel:Sachnin and Tsfat. In these locations the municipal waste-water arriving at the WWTP is mainly domestic, but it is also,to some extent, mixed with a variety of industrial watersources.
Raw wastewater samples were collected in all locationsthroughout a full day. All sites were fed by only one tap water
source (either ground or surface water) during the time of thesampling campaign.
All samples (tap water and wastewater) were analyzed onsite for pH, EC, temperature and alkalinity. TAN and PT wereanalyzed in the laboratory following acidification and filtra-tion to prevent further biological or chemical reactions.
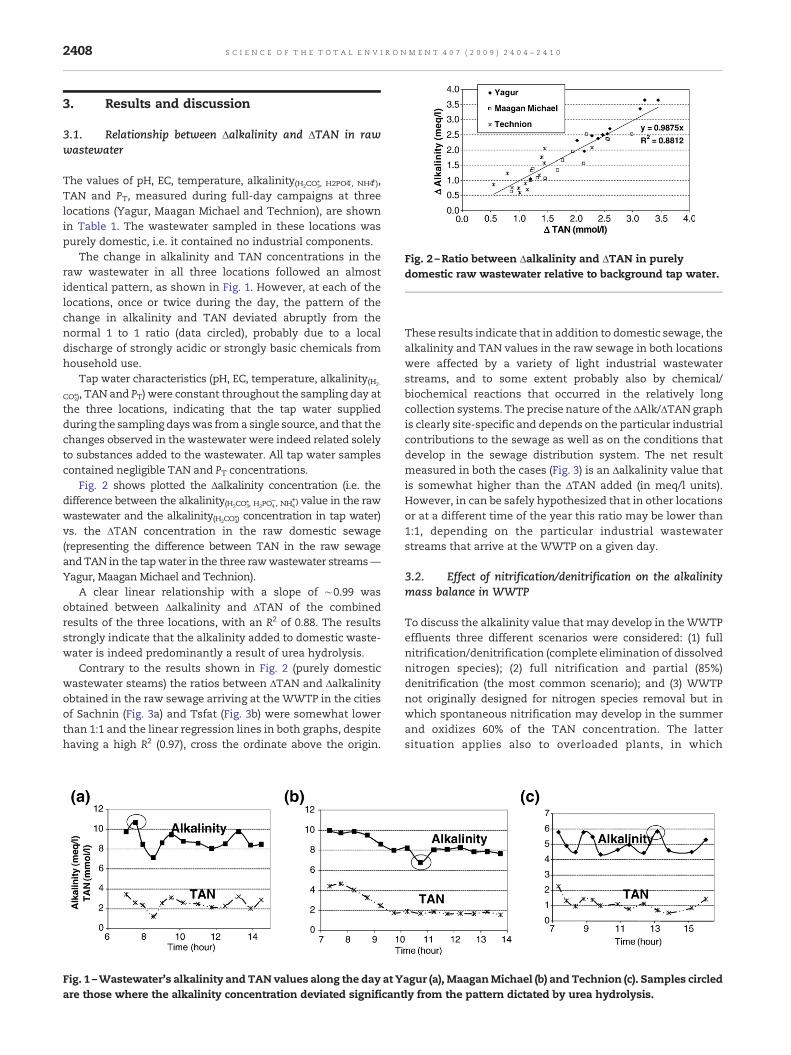
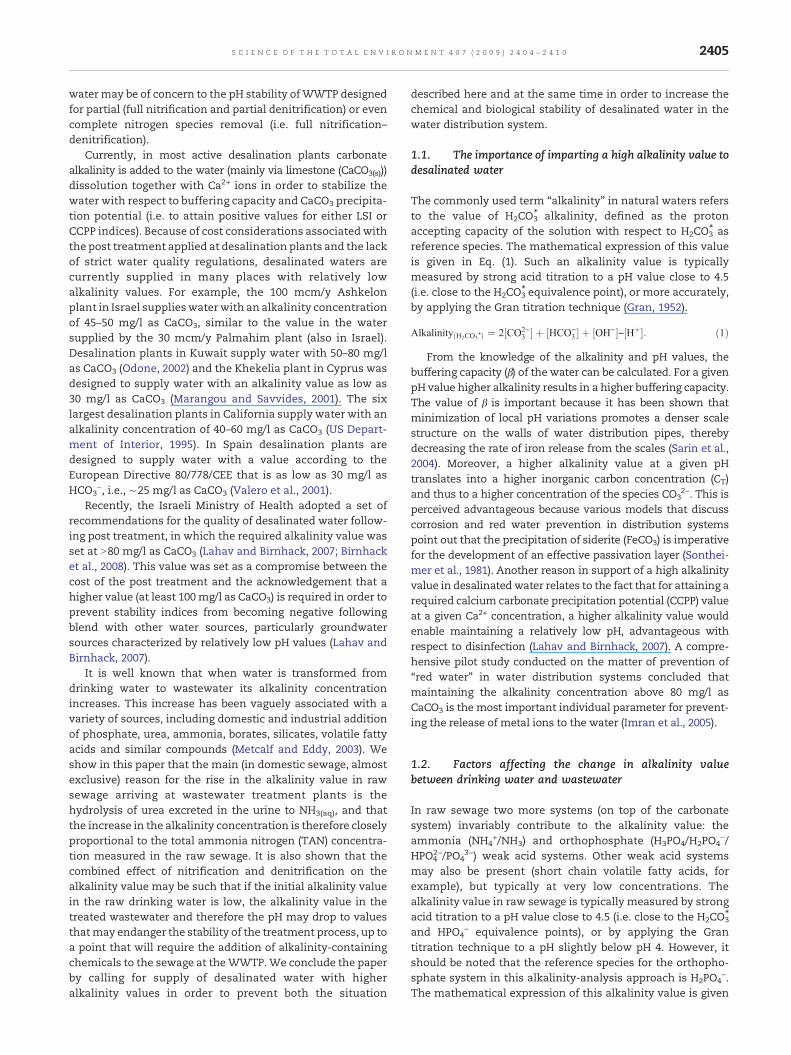
Fig. 2 –Ratio between Δalkalinity and ΔTAN in purelydomestic raw wastewater relative to background tap water.
2408 S C I E N C E O F T H E T O T A L E N V I R O N M E N T 4 0 7 ( 2 0 0 9 ) 2 4 0 4 – 2 4 1 0
3. Results and discussion
3.1. Relationship between Δalkalinity and ΔTAN in rawwastewater
The values of pH, EC, temperature, alkalinity(H2CO3⁎, H2PO4−, NH4+),TAN and PT, measured during full-day campaigns at threelocations (Yagur, Maagan Michael and Technion), are shownin Table 1. The wastewater sampled in these locations waspurely domestic, i.e. it contained no industrial components.
The change in alkalinity and TAN concentrations in theraw wastewater in all three locations followed an almostidentical pattern, as shown in Fig. 1. However, at each of thelocations, once or twice during the day, the pattern of thechange in alkalinity and TAN deviated abruptly from thenormal 1 to 1 ratio (data circled), probably due to a localdischarge of strongly acidic or strongly basic chemicals fromhousehold use.
Tap water characteristics (pH, EC, temperature, alkalinity(H2-
CO3⁎), TAN and PT) were constant throughout the sampling day atthe three locations, indicating that the tap water suppliedduring the sampling dayswas froma single source, and that thechanges observed in the wastewater were indeed related solelyto substances added to the wastewater. All tap water samplescontained negligible TAN and PT concentrations.
Fig. 2 shows plotted the Δalkalinity concentration (i.e. thedifference between the alkalinity(H2CO3⁎, H2PO4
−, NH4+) value in the raw
wastewater and the alkalinity(H2CO3⁎) concentration in tap water)vs. the ΔTAN concentration in the raw domestic sewage(representing the difference between TAN in the raw sewageandTAN in the tapwater in the three rawwastewater streams—Yagur, Maagan Michael and Technion).
A clear linear relationship with a slope of ∼0.99 wasobtained between Δalkalinity and ΔTAN of the combinedresults of the three locations, with an R2 of 0.88. The resultsstrongly indicate that the alkalinity added to domestic waste-water is indeed predominantly a result of urea hydrolysis.
Contrary to the results shown in Fig. 2 (purely domesticwastewater steams) the ratios between ΔTAN and Δalkalinityobtained in the raw sewage arriving at the WWTP in the citiesof Sachnin (Fig. 3a) and Tsfat (Fig. 3b) were somewhat lowerthan 1:1 and the linear regression lines in both graphs, despitehaving a high R2 (0.97), cross the ordinate above the origin.
Fig. 1 –Wastewater's alkalinity and TAN values along the day at Yare those where the alkalinity concentration deviated significan
These results indicate that in addition to domestic sewage, thealkalinity and TAN values in the raw sewage in both locationswere affected by a variety of light industrial wastewaterstreams, and to some extent probably also by chemical/biochemical reactions that occurred in the relatively longcollection systems. The precise nature of the ΔAlk/ΔTAN graphis clearly site-specific and depends on the particular industrialcontributions to the sewage as well as on the conditions thatdevelop in the sewage distribution system. The net resultmeasured in both the cases (Fig. 3) is an Δalkalinity value thatis somewhat higher than the ΔTAN added (in meq/l units).However, in can be safely hypothesized that in other locationsor at a different time of the year this ratio may be lower than1:1, depending on the particular industrial wastewaterstreams that arrive at the WWTP on a given day.
3.2. Effect of nitrification/denitrification on the alkalinitymass balance in WWTP
To discuss the alkalinity value that may develop in theWWTPeffluents three different scenarios were considered: (1) fullnitrification/denitrification (complete elimination of dissolvednitrogen species); (2) full nitrification and partial (85%)denitrification (the most common scenario); and (3) WWTPnot originally designed for nitrogen species removal but inwhich spontaneous nitrification may develop in the summerand oxidizes 60% of the TAN concentration. The lattersituation applies also to overloaded plants, in which
agur (a), MaaganMichael (b) and Technion (c). Samples circledtly from the pattern dictated by urea hydrolysis.
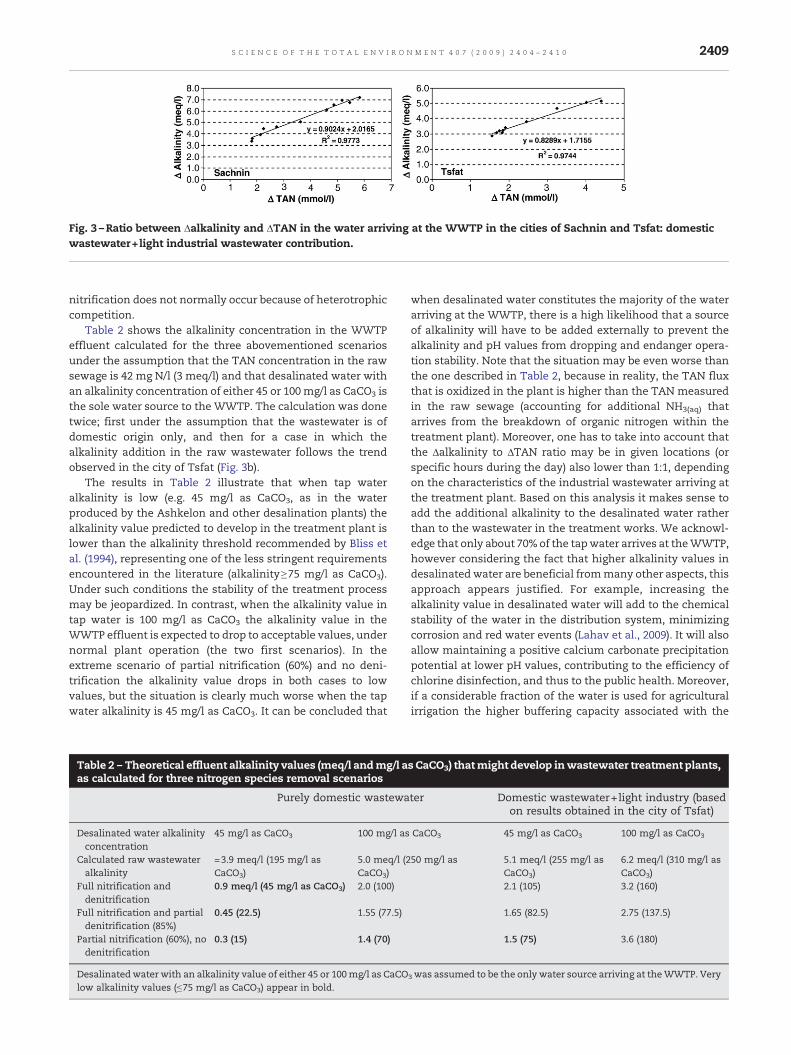
Fig. 3 –Ratio between Δalkalinity and ΔTAN in the water arriving at the WWTP in the cities of Sachnin and Tsfat: domesticwastewater+light industrial wastewater contribution.
2409S C I E N C E O F T H E T O T A L E N V I R O N M E N T 4 0 7 ( 2 0 0 9 ) 2 4 0 4 – 2 4 1 0
nitrification does not normally occur because of heterotrophiccompetition.
Table 2 shows the alkalinity concentration in the WWTPeffluent calculated for the three abovementioned scenariosunder the assumption that the TAN concentration in the rawsewage is 42 mg N/l (3 meq/l) and that desalinated water withan alkalinity concentration of either 45 or 100mg/l as CaCO3 isthe sole water source to the WWTP. The calculation was donetwice; first under the assumption that the wastewater is ofdomestic origin only, and then for a case in which thealkalinity addition in the raw wastewater follows the trendobserved in the city of Tsfat (Fig. 3b).
The results in Table 2 illustrate that when tap wateralkalinity is low (e.g. 45 mg/l as CaCO3, as in the waterproduced by the Ashkelon and other desalination plants) thealkalinity value predicted to develop in the treatment plant islower than the alkalinity threshold recommended by Bliss etal. (1994), representing one of the less stringent requirementsencountered in the literature (alkalinity≥75 mg/l as CaCO3).Under such conditions the stability of the treatment processmay be jeopardized. In contrast, when the alkalinity value intap water is 100 mg/l as CaCO3 the alkalinity value in theWWTP effluent is expected to drop to acceptable values, undernormal plant operation (the two first scenarios). In theextreme scenario of partial nitrification (60%) and no deni-trification the alkalinity value drops in both cases to lowvalues, but the situation is clearly much worse when the tapwater alkalinity is 45 mg/l as CaCO3. It can be concluded that
Table 2 – Theoretical effluent alkalinity values (meq/l andmg/l aas calculated for three nitrogen species removal scenarios
Purely domestic wastewa
Desalinated water alkalinityconcentration
45 mg/l as CaCO3 100 mg/l as
Calculated raw wastewateralkalinity
=3.9 meq/l (195 mg/l asCaCO3)
5.0 meq/l (2CaCO3)
Full nitrification anddenitrification
0.9 meq/l (45 mg/l as CaCO3) 2.0 (100)
Full nitrification and partialdenitrification (85%)
0.45 (22.5) 1.55 (77.5)
Partial nitrification (60%), nodenitrification
0.3 (15) 1.4 (70)
Desalinatedwater with an alkalinity value of either 45 or 100mg/l as CaCOlow alkalinity values (≤75 mg/l as CaCO3) appear in bold.
when desalinated water constitutes the majority of the waterarriving at the WWTP, there is a high likelihood that a sourceof alkalinity will have to be added externally to prevent thealkalinity and pH values from dropping and endanger opera-tion stability. Note that the situation may be even worse thanthe one described in Table 2, because in reality, the TAN fluxthat is oxidized in the plant is higher than the TAN measuredin the raw sewage (accounting for additional NH3(aq) thatarrives from the breakdown of organic nitrogen within thetreatment plant). Moreover, one has to take into account thatthe Δalkalinity to ΔTAN ratio may be in given locations (orspecific hours during the day) also lower than 1:1, dependingon the characteristics of the industrial wastewater arriving atthe treatment plant. Based on this analysis it makes sense toadd the additional alkalinity to the desalinated water ratherthan to the wastewater in the treatment works. We acknowl-edge that only about 70% of the tapwater arrives at theWWTP,however considering the fact that higher alkalinity values indesalinated water are beneficial frommany other aspects, thisapproach appears justified. For example, increasing thealkalinity value in desalinated water will add to the chemicalstability of the water in the distribution system, minimizingcorrosion and red water events (Lahav et al., 2009). It will alsoallow maintaining a positive calcium carbonate precipitationpotential at lower pH values, contributing to the efficiency ofchlorine disinfection, and thus to the public health. Moreover,if a considerable fraction of the water is used for agriculturalirrigation the higher buffering capacity associated with the
s CaCO3) thatmight develop inwastewater treatment plants,
ter Domestic wastewater+light industry (basedon results obtained in the city of Tsfat)
CaCO3 45 mg/l as CaCO3 100 mg/l as CaCO3
50 mg/l as 5.1 meq/l (255 mg/l asCaCO3)
6.2 meq/l (310 mg/l asCaCO3)
2.1 (105) 3.2 (160)
1.65 (82.5) 2.75 (137.5)
1.5 (75) 3.6 (180)
3 was assumed to be the only water source arriving at theWWTP. Very
2410 S C I E N C E O F T H E T O T A L E N V I R O N M E N T 4 0 7 ( 2 0 0 9 ) 2 4 0 4 – 2 4 1 0
higher alkalinity values would prevent a dramatic change inpH when fertigation is practiced (Yermiyahu et al., 2007).
4. Conclusions
In the foreseeable future desalinated water is expected tobecome the major (if not almost exclusive) water source inmany places and thus the major contributor to wastewatertreatment plants. Based on an empirical–theoretical massbalance calculation it was shown that if desalination plantscontinue to supply water with low alkalinity values, alkalinitywould have to be added externally to wastewater treatmentplants in order to prevent process failure due to excessivelylow alkalinity values and pH plummet. To prevent this, thealkalinity value in desalinated water should be increased to≥100 mg/l as CaCO3. Further advantages in favor of thisapproach include increased chemical and biological stabilityof the water in drinking water distribution systems andbenefits to agriculture.
To enable the alkalinity mass balance calculations resultsare shown that strongly indicate that the alkalinity concen-tration added to tap water when it transforms into purelydomestic wastewater emanates almost exclusively from thehydrolysis of urea, and the ratio between the additionalalkalinity concentration (in meq/l) and TAN in (mol/l) isapproximately 1:1. In the case that domestic wastewater isslightly mixed with light industry wastewater streams thealkalinity addition is still expected to be linearly linked withthe TAN concentration in the raw sewage, however in suchcases the ratio between the two values may deviate from 1 to1, depending on the acid–base characteristics of the industrialwastes.
R E F E R E N C E S
Birnhack L, Penn R, Lahav O. Quality criteria for desalinated waterand introduction of a novel, cost effective and advantageouspost treatment process. Desalination 2008;221:70–83.
Bjornsdotter L. Study of nitrification rates in a biofilm system. M.Sc.Thesis. 2005.DepartmentofCivil andEnvironmental Engineering,Chalmers University of Technology, Goteborg, Sweden.
Bliss PJ, Ostarcevic ER, Potter AA. Process optimization forsimultaneous biological nitrification and chemical phosphorusremoval. Water Sci Technol 1994;29(12):107–15.
Ekama GA, Marais GR. Theory, design and operation of nutrientremoval activated sludge processes. Pretoria, South Africa:Publication of the Water Research Commission; 1984.
Fittschen I, Hahn HH. Characterization of the municipalwastewater human urine and a preliminary comparison withliquid cattle excretion. Water Sci Technol 1998;38(6):9-16.
Gran G. Determination of the equivalence point in potentiometrictitrations, Part II. Analyst 1952;77:661–71.
Hanaeus J, Hellström D, Johansson E. A study of a urine separationsystem in an ecological village in northern Sweden. Water SciTechnol 1997;35(9):153–60.
Henze M, Harrmoës P, la Cour Jansen J, Arvin E.Wastewater Treatment. Springer, Verlag Berlin, Heidelberg,New York. 2002.
Imran SA, Dietz JD, Mutoti G, Taylor SJ, Randall AA, Cooper CD. Redwater release in drinking water distribution systems. J AWWA2005;97(7):93-100.
Lahav O, Birnhack L. Quality criteria for desalinated waterfollowing post-treatment. Desalination 2007;207:286–303.
LahavO, Salomons E,OstfeldA.Chemical stability of inlineblendsofdesalinated, surface and ground waters: A plea for higheralkalinity values in desalinated water. Desalination2009;239:334–45. doi:10.1016/j.desal.2008.07.006.
Larsen TA, Gujer W. Separate management of anthropogenicnutrient solutions (human urine). Water Sci Technol1996;34(3–4):87–94.
Marangou VS, Savvides K. First desalination plant inCyprus — product water aggresivity and corrosion control.Desalination 2001;138:251–8.
Metcalf & Eddy. Wastewater engineering: Treatment disposal andreuse. 2003; Metcalf and Eddy, Inc. 4th Edition, McGraw-Hill,International edition.
Odone G. Recarbonation systems for desalination plants. IEEEElectron Devices Soc Newsl 2002;16:6–7.
Sarin P, Snoeyink VL, Lytle DA, Krive WM. Iron-corrosion scales:model for scale growth, iron release, and colored waterformation. J Environ Eng 2004;130:364–73.
Sontheimer H, Kolle W, Snoeyink VL. The siderite model of theformation of corrosion-resistant scales. J AWWA 1981;73:572–9.
Udert KM, Larsen TA, Biebow M, Gujer W. Urea hydrolysis andprecipitation dynamics in a urine collection system. Water Res2003;37:2571–82.
US Department of the Interior. Preliminary Research Study for theConstruction of a Pilot Cogeneration Desalination Plant inSouthern California. Water Treatment Technology ProgramReport No.7; 1995.
Valero A, Uche J, Serra L. La desalacion como alternativa al PHN.Centro Politécnico Superior. Universidad de Zaragoza; 2001.http://circe.cps.unizar.es/spanish/isgwes-/spain/desala.pdf(in Spanish).
Wangnick K. The 19th IDA Worldwide Desalting Plant Inventory.Oxford, England: Global Water Intelligence; 2006.
Yermiyahu U, Tal A, Ben-Gal A, Bar-Tal A, Tarchitzky J, Lahav O.Rethinking desalinated water quality and agriculture. Science2007;318:920–1.
Copyright © 2022 FDOKUMEN