Wastewater Treatment Plant Operation: Simple Control ... - MDPI
28
sustainability Article Wastewater Treatment Plant Operation: Simple Control Schemes with a Holistic Perspective S. Revollar 1, * ,† , R. Vilanova 2,† , P. Vega 1,† , M. Francisco 1,† and M. Meneses 2,† 1 Informatics and Automatics Department, University of Salamanca, 37008 Salamanca, Spain; [email protected] (P.V.); [email protected] (M.F.) 2 Dept. Telecommunications and Systems Engineering, School of Engineering Universitat Autonoma Barcelona, 08193 Barcelona, Spain; [email protected] (R.V.); [email protected] (M.M.) * Correspondence: [email protected] or [email protected] † These authors contributed equally to this work. Received: 18 December 2019; Accepted: 16 January 2020; Published: 21 January 2020 Abstract: In this paper, a control approach for improving the overall efficiency of a wastewater treatment plant (WWTP) is presented. It consists of a cascaded control system that uses a global performance indicator as the controlled variable to drive the plant to operating conditions that satisfies trade-offs involved in the WWTP operation, improving the global performance of the plant. The selected global performance indicator is the N/E index that measures the ratio between the amount of nitrogenated compounds eliminated (kgN) and the energy (kWh) required to achieve that goal. This index links the variables of the activated sludge process with the energy consumed in the whole plant, thus the control strategy takes actions based on plantwide considerations. An external Proportional Integral (PI) controller changes the DO set point according to the N/E index and the basic dissolved oxygen (DO) control scheme in the activated sludge process follows this reference changes varying the aeration intensity. An outer loop with an event-based controller is used to compute the index values when the DO concentration is driven to excessively low limits, preventing long operation periods in this undesirable condition. Simple proportional integral controllers (PI) are used to adapt the strategy to the automation systems available in WWTPs. The implementation in the Benchmark Simulation Model 2 (BSM2) demonstrates the potential of the proposed approach. The results show the possibilities of the N/E index to be used as an indicator of global performance of WWTPs. It provides a link between water line objectives and energy consumption in the whole plant that can be exploited to introduce plantwide considerations in alternative control strategies formulated to drive the plant to operating conditions that optimize the overall process efficiency. Keywords: wastewater treatment plants; environmental costs; PID control; plantwide control; hierarchical control strategies 1. Introduction Municipal wastewater treatment plants (WWTPs) are public benefit processes focused on the attainment of environmental objectives rather than economic benefits. Removing pollutants from wastewater entails consumption of energy, use of chemicals, and treatment of sludge in excess, which are operating expenses that cannot be compensated with economic profitable products. In addition, the operation of a WWTP involves environmental impacts such as direct emissions of greenhouse gases (GHG) from biological processes, indirect emissions of GHG from energy use (electricity and heating), and sludge disposed to land and toxicity of chemicals [1,2]. Such environmental costs affect process sustainability, which plays an important role in process management in the actual context. Therefore, even the effectiveness of pollution removal is the main goal of WWTP operation, and the Sustainability 2020, 12, 768; doi:10.3390/su12030768 www.mdpi.com/journal/sustainability
-
Upload
khangminh22 -
Category
Documents
-
view
4 -
download
0
Transcript of Wastewater Treatment Plant Operation: Simple Control ... - MDPI

sustainability
Article
Wastewater Treatment Plant Operation: SimpleControl Schemes with a Holistic Perspective
S. Revollar 1,*,† , R. Vilanova 2,† , P. Vega 1,†, M. Francisco 1,† and M. Meneses 2,†
1 Informatics and Automatics Department, University of Salamanca, 37008 Salamanca, Spain;[email protected] (P.V.); [email protected] (M.F.)
2 Dept. Telecommunications and Systems Engineering, School of Engineering Universitat AutonomaBarcelona, 08193 Barcelona, Spain; [email protected] (R.V.); [email protected] (M.M.)
* Correspondence: [email protected] or [email protected]† These authors contributed equally to this work.
Received: 18 December 2019; Accepted: 16 January 2020; Published: 21 January 2020�����������������
Abstract: In this paper, a control approach for improving the overall efficiency of a wastewatertreatment plant (WWTP) is presented. It consists of a cascaded control system that uses a globalperformance indicator as the controlled variable to drive the plant to operating conditions thatsatisfies trade-offs involved in the WWTP operation, improving the global performance of the plant.The selected global performance indicator is the N/E index that measures the ratio between theamount of nitrogenated compounds eliminated (kgN) and the energy (kWh) required to achieve thatgoal. This index links the variables of the activated sludge process with the energy consumed in thewhole plant, thus the control strategy takes actions based on plantwide considerations. An externalProportional Integral (PI) controller changes the DO set point according to the N/E index and thebasic dissolved oxygen (DO) control scheme in the activated sludge process follows this referencechanges varying the aeration intensity. An outer loop with an event-based controller is used tocompute the index values when the DO concentration is driven to excessively low limits, preventinglong operation periods in this undesirable condition. Simple proportional integral controllers (PI) areused to adapt the strategy to the automation systems available in WWTPs. The implementation inthe Benchmark Simulation Model 2 (BSM2) demonstrates the potential of the proposed approach.The results show the possibilities of the N/E index to be used as an indicator of global performanceof WWTPs. It provides a link between water line objectives and energy consumption in the wholeplant that can be exploited to introduce plantwide considerations in alternative control strategiesformulated to drive the plant to operating conditions that optimize the overall process efficiency.
Keywords: wastewater treatment plants; environmental costs; PID control; plantwide control;hierarchical control strategies
1. Introduction
Municipal wastewater treatment plants (WWTPs) are public benefit processes focused on theattainment of environmental objectives rather than economic benefits. Removing pollutants fromwastewater entails consumption of energy, use of chemicals, and treatment of sludge in excess, whichare operating expenses that cannot be compensated with economic profitable products. In addition,the operation of a WWTP involves environmental impacts such as direct emissions of greenhousegases (GHG) from biological processes, indirect emissions of GHG from energy use (electricity andheating), and sludge disposed to land and toxicity of chemicals [1,2]. Such environmental costs affectprocess sustainability, which plays an important role in process management in the actual context.Therefore, even the effectiveness of pollution removal is the main goal of WWTP operation, and the
Sustainability 2020, 12, 768; doi:10.3390/su12030768 www.mdpi.com/journal/sustainability

Sustainability 2020, 12, 768 2 of 28
appropriated management of resources and prevention of unnecessary emissions to air and soil mustbe considered to ensure the economic feasibility and the sustainability of WWTP operation. It meansthat operating conditions that satisfy the compromise between these conflicting objectives must beselected from the overall assessment of plant performance that considers the interaction between thedifferent units and subsystems that comprise the plant (water line, sludge line, and gas line) [3–5].
A number of performance indicators have been defined to address the cost-effective operationand sustainability of WWTPs [4,6–8]. The impact of greenhouse (GHG) emissions associated withwastewater treatment has been introduced as an important factor in the evaluation of plant performancein [3,9], and Life Cycle Assessment (LCA) has been used to evaluate sustainable operation of WWTPsin [1,2,10] and integrated water systems in [8,11], providing a wider perspective for the evaluation ofeconomic performance and sustainability in the operation of these processes. The available quantitativeindicators of performance provide an instrument to carry out a comprehensive analysis of the impactof operating conditions on the efficiency of the plant. The analysis allows for measuring cause–effectrelationships between different operating variables and identifying specific situations that needimprovement. The information provided by different performance indicators and efficiency indicesthat measure and link different aspects of the operation make it possible to take process controldecisions that produce an integral improvement of performance [4,8].
Different control strategies to improve the operation of WWTPs have been proposed in a significantnumber of works ([12–18], but the evaluation of performance and the optimization objectives, in thecase of optimizing control strategies ([15–18]), concerns the quality of the effluent and economic aspects.Since pollution removal takes place in the activated sludge process (ASP) in the water line, the controlstrategies are applied to regulate dissolved oxygen (DO) in the aerobic zone or ammonium concentrationin the effluent through manipulation of aeration intensity, and nitrates concentration in the anoxic zone.Few works are found in the literature ([5,19]) dealing with the implementation of control strategiesto improve the overall performance of WWTPs introducing plantwide considerations. Moreover, fewworks [1,2] evaluate the effect of the control system performance considering its impact on the wholeplant behavior in terms of economic and environmental costs. In this work, a control approach isproposed that uses a measure of global efficiency of the plant as the controlled variable with the aimof introducing some sense of optimization in the control actions addressing effluent quality goals andenergy consumption in the whole plant. However, the consideration of efficiency as a controlled variablealso affects operation costs and emissions of CO2 associated with energy use and biological processes.
Most of the works addressing the advanced control and optimization of WWTPs have employedrecognized simulation platforms as Benchmark Simulation Model 1 (BSM1), Benchmark SimulationModel 2 (BSM2) and their modifications to test their strategies. The BSM2 [20] represents the waterline and the sludge line of a typical municipal WWTP. It integrates the Benchmark Simulation Model 1(BSM1) that represents the activated sludge process [21]. The BSM2 [20] is selected as the simulationplatform for the evaluation of the proposed control strategy.
Optimization methods and advanced control strategies are barely used in real practice; suchcomplex strategies are not attractive in an industry with economic limitations. Real WWTPs arerun adopting reasonable compromise solutions between operation objectives based on operatorsexpertise. The analysis of performance concentrates on energy consumption that is the most importantfactor affecting operation and environmental costs [8,22,23], and it is involved in the majority ofthe control actions. The regulation of the ASP variables is performed using the available controlstrategies: open-loop and simple ON–OFF and PI (Proportional Integral) feedback and feed-forwardloops [20,21,24,25]. Some applications of advanced control strategies in real plants [26–29] and thedevelopment of decision support systems for WWTPs that uses online sensors and information fromaccessible data-bases to compute performance indicators associated with energy consumption [22,30]demonstrate that technical limitations to the implementation of control systems to improve theoperation of WWTPs are being sorted out.
Sustainability 2020, 12, 768 3 of 28
A typical municipal WWTP where activated sludge process (ASP) performs removal ofnitrogenated compounds and organic matter is considered in this work; therefore, the efficiencyindex selected as a controlled variable is the ratio between the quantity of nitrogenated compoundseliminated in the activated sludge process (kgN) and the energy (kWh) required by the whole plantto eliminate that amount of nitrogenated compounds which is demoted N/E index ([31,32]). Thus,the index connects ASP process performance with energy consumption in the whole plant giving aholistic perspective to the control strategy. The manipulated variable to regulate the N/E index isthe set-point for the dissolved oxygen (DO) concentration in the aerobic zone of the ASP. An upperlevel PI controller provides the DO set-points that produce the desired efficiency to the lower levelDO control loop. The integration of existing DO control system and the use of simple PI controllersincreases the possibilities of implementing the proposed approach in real WWTPs using the availableonline sensors, laboratory measurements, and automation systems.
One of the key points of the proposed control approach (N/E control strategy) is theimplementation of an event-based control algorithm to avoid DO inadmissible values in the aerobic andN/E unreachable set-points. Due to the variable characteristics of the influent load and temperature,the biological capacity for nitrogen removal can be limited in some situations. In order to attainefficiency requirements given by N/E set-point when nitrogen removal capacity is limited, the use ofenergy is reduced leading DO set-point to their minimum values. The manipulated variable can beforced outside the recommended limits for a prolonged period producing deterioration of performanceand unsafe conditions for a biological system. Then, an event-based control algorithm that adapts anN/E index set-point to reachable values when inadmissible DO values are detected is integrated intothe control scheme.
The use of an integral performance indicator as a controlled variable is a contribution of thiswork that introduces a holistic perspective to control strategy, and the attainment of a desired ofprocess efficiency has a positive impact of effluent quality, energy management, and emissions ofCO2. A comprehensive analysis of performance is carried out to compare existing PI based controlstrategies applied to WWTP and the proposed N/E control strategy. The evaluation of performance iscarried out considering average values of performance indicators on an annual basis and dynamicevolution of selected indices along the operation period (one year). The selected indicators measure thecharacteristics affected by the evaluated control strategies treatment effectiveness, energy consumption,and CO2 emissions.
The rest of the paper is organized as follows. The WWTP system and the control schemes aredescribed in Section 2, and global performance indicators are presented in Section 3. The evaluationof the existing WWTP control strategies is presented in Section 4. The proposed control strategy isdescribed in Section 5. Section 6 is devoted to the comparison of the best existing WWTP controlstrategy and the best N/E control design, closing with some conclusions to the article.
2. Description of Process and Control Strategies
The Benchmark Simulation Model 2 (BSM2) is a standard simulation platform that represents thewater line and the sludge line of a municipal WWTP that uses activated sludge process to performbiological nitrogen removal [33,34]. The BSM2 plant layout (Figure 1) includes, in the water line,a primary clarifier and the activated sludge process (ASP) for biological treatment. The sludge linecomprises a thickener for the sludge in the excess from activated sludge process, an anaerobic digesterto stabilize a mixture of the thickened sludge and sludge from primary clarifier and a dewateringunit. The liquids collected in the thickening and dewatering steps are stored and recycled ahead ofthe primary settler. The ASP is represented by a modification of the benchmark simulation model 1(BSM1) ([21]) that consists of five biological reactors connected in series with internal nitrogen recycleflow (Qa), sludge recycle flow (Qr), and purge flow (Qw). The BSM2 is designed for an influent flow of20,648.36 m3/d and a biodegradable chemical oxygen demand (COD) in the influent of 592.53 mg/L.

Sustainability 2020, 12, 768 4 of 28
The total volume of the bioreactor system is 12,000 m3, 1500 m3 for each anoxic tank and 3000 m3 eachaerobic tank.
QinQbypass
Qpo QeQpo
Qw
Qa
Primaryclarifier
Activated sludge reactors
Secondaryclarifier
Thickener
Anaerobicdigester
Storagetank Dewatering
Qr
SludgeRemoval
Figure 1. BSM2 plant with notation used for flow rates.
The biological processes occurring in the activated sludge process reactors are described using 13state variables and eight biological processes [21,35] by Activated Sludge Model 1 (ASM1), the clarifieris described using Tackacs model [36], and Anaerobic Digestion Model 1 (ADM1) is used for anaerobicdigestion process [37].
The performance of biological treatments carried out in WWTPs is strongly affected by thefrequent and large disturbances in the influent flow and load. Then, the BSM2 model includes acharacteristic influent profile that describes daily flow rate dynamics (low rate at night, high rateduring day time), weekend effects, holiday and seasonal effects and incorporates household andindustrial pollutants. The average flow rate is 20,668 m3/d, the maximum peak reaches 85,841 m3/d,and the minimum is 5146 m3/d. This is considered in the BSM2 influent profile that contains an averageconcentration of 52.2 g/m3 of total nitrogen and 592.2 g/m3 of COD (chemical oxygen demand). Sinusfunctions are used to describe daily and seasonal temperature variation, then a warm and a cold seasonare distinguished. The average temperature is 15 ◦C, the highest values is 20 ◦C, and the lowest is10 ◦C. A detailed description of dynamic influent profile generation can be found in [38]. The influentdata describe an operation period of a year in a plant located in the Northern hemisphere starting July1st. Data provided by simulation protocol describe 609 operation days with a sampling time of 15 min,but evaluation is performed using data from day 245 to day 609. Annual profiles of the characteristicinfluent variables, influent flow (Qin), total nitrogen concentration (Ntot), COD concentration, andtemperature (T) considering weekly average values are presented in (Figure 2).
The effluent quality is usually described in terms of Ntot, ammonium SNH , CODt, SNH , TSS, andBOD5 concentrations. In the BSM2 model, these metrics are estimated considering the variables ofthe ASM1 model. The effluent quality requirements in BSM2 model are Ntot < 18 gN/m3, CODt <
100 gCOD/m3, SNH < 4 gN/m3, TSS < 30 gSS/m3, BOD5 < 10 gBOD/m3. Biological elimination ofnitrogenated compounds and organic matter to reach those effluent quality levels takes place in ASP.In the nitrification process, nitrogenated compounds (mostly ammonium NH4) are oxidized to nitratesas part of aerobic growth of autotrophic bacteria that depends on the availability of free dissolvedoxygen in the system (DO). Nitrifiers growth follows Monod kinetics; it is minimal at DO levels below0.5 g/m3, then increases with DO concentration until maximum growth rate is reached approximately

Sustainability 2020, 12, 768 5 of 28
at DO levels of 2 g/m3 [24,39]. Oxygen demand depends on the load of wastewater to be treated, butnitrification is affected also by temperature and solids retention time (SRT). Nitrates (SNO) producedin the aerobic zone are transported to anoxic zone by internal recirculation (Qa) where denitrificationprocess takes place by means of heterotroph microorganisms growth. Oxygen is taken from nitratesthat are reduced to nitrogen gas (N2) using organic matter as substrate.
Figure 2. Weekly average values of characteristic influent variables in the operating horizon (one year):flow (Qin), total nitrogen concentration (Ntot), COD concentration and temperature (T).
2.1. Description of Operation and Control Strategies
The control actions in the WWTP are focused on the regulation of activated sludge processvariables but interactions between different units of water and sludge line, and impact of influentdisturbances must be considered to attain the optimal operating conditions from a global viewpoint.The control handles available in the ASP process are: the airflow rate, the internal recirculation (Qa),the sludge recirculation (Qr), the sludge purge flow (Qw), and external carbon dosage (Qcarb) asmanipulated variables. All of these control handles are represented in the BSM2 model, but the oxygentransfer coefficient (KLa) is used instead of airflow rate. The oxygen transfer coefficient (KLa) measuresoxygen transfer efficiency in terms of air flow-rate, the dynamics of the air bubbles formation, anddiffusion phenomena.
In practice, the most commonly used control structures using the mentioned control handles are:
• Dissolved oxygen control in the aerobic basin (DO control). The set-point for DO is given by theoperator with values between 1.5–2 g/m3, maximum growth rate is achieved at DO concentrationof 2 g/m3, and non-desirable reactions promoted by filamentous microorganisms can occur atthe DO concentration below 1.5 g/m3. In practice, a cascade scheme is implemented, the inner

Sustainability 2020, 12, 768 6 of 28
loop controls the airflow rate manipulating a valve position, and the external loop controls DOconcentration manipulating the airflow rate. The time constant of the loop is about 30 min [24].
• Ammonium-based supervisory control. This control scheme is applied to reduce aeration costsor to reduce peaks of ammonium concentration in the effluent ([13]. An upper loop is addedto the DO control scheme to compute DO set-points as a function of the measured ammoniumconcentration in the effluent (SNH)). The SNH set-point is selected between 1 g/m3–4 g/m3.
• Nitrates control in the anoxic zone. Qa is used as manipulated variable for the closed loopregulation of SNO, BSM1 platform ([21]) uses a set-point of 1 g/m3. When external carbon sourceis required, carbon dosage (Qcarb) is used to regulate nitrates concentration SNO. In practice, openloop control of nitrates is performed keeping the appropriated values of Qa and Qcarb.
• Open loop control of both recycle flows. The sludge age is regulated with purge flow (Qw),since growth rate decreases with temperature Qw is reduced in winter to increase the sludge age.The external recirculation (Qr) is used to regulate the Food to Microorganism Ratio (F:M); it isusual to maintain a Qr equal to influent flowrate.
One of two, DO control or ammonium control, can be implemented combined with the othercontrol strategies. Feed-forward control can be used also to reduce the effect of disturbances. Thecommented control strategies have been applied on the BSM2 platform ([1,2,5,19]). Figure 3 presentsthe block diagrams of these typical close loop strategies and their implementation in the BSM2 plant.
The default operation strategy proposed in BSM2 plant includes:
• Feedback DO control in the aerobic zone manipulating directly the oxygen transfer coefficientKLa (the aeration equipment is not modeled in the simulator).
• Carbon dosage to improve nitrification: Qcarb = 2 m3 added to the first reactor in the anoxic zone(An external source with a concentration of 40,000 g/m3 is used).
• Fixed values of internal and external recycle flowrate: Qr = 20, 648 m3/d and Qa = 61, 944 m3/d,computed to maintain the appropriated nitrates concentration levels in the anoxic zone and fed tothe microorganism (F:M) ratio respectively.
• Sludge age regulation manipulating the purge flow: Qw = 450 m3/d in the warm season andQw = 300 m3/d in the cold season.
DO control scheme (DO Default), in default BSM2 operation strategy, consists of a PI loopthat regulates the DO concentration in the fourth aeration tank to a constant set-point of 2 g/m3
manipulating the oxygen transfer coefficient (KLa) of the three aerated reactors. KLa4, for the 4threactor is the controller output while KLa3 and KLa5 are calculated using a gain of 1 and 0.5 for the 3rdand 5th reactors, respectively.
In this work, the existing control strategies considered to evaluate their impact on overall plantperformance in comparison with the proposed control strategy based on the control of the N/Eindex are:
• DO + NO control that combines the default DO control scheme and PI control of nitratesconcentration in the anoxic zone (SNO2) manipulating the internal recycle flow Qa.
• Ammonium based supervisory control (Cascade) that controls the ammonium concentration inthe 5th reactor (SNH5) using an external PI loop that computes the DO set-point for the internalloop given by the DO default scheme. Two different set-points are considered for the cascadescheme, SPNH = 1 g/m3 for strict ammonium regulation (Cascade SPNH = 1), and SPNH = 4 g/m3
for relaxed ammonium regulation (Cascade SPNH = 4).
In both cases, strategies for carbon dosage, external recycle, and sludge age regulation aremaintained as in default strategy. The internal recycle Qa is kept constant with cascade control as inDO default control. The tuning parameters for the PI controllers can be found in [20] for DO controller,in [21] for nitrates controller and in [19] for the ammonium controller.

Sustainability 2020, 12, 768 7 of 28
The control schemes implemented in the ASP of BSM2 plant are described in Figure 3.
Figure 3. Activated sludge process control schemes: DO control, cascade control, DO+NO control.Different colors are used to identify the control loops in blocks and process layout
2.2. Evaluation Criteria in BSM2
The BSM2 provides a performance assessment framework divided into two levels. The first levelserves as a proof that the proposed control strategy has been applied properly using standard metricsof control performance [20]. The second level measures the effect of the control strategy on plantperformance accounting for the percentage of time that the effluent limits are not met, the quality ofthe effluent using the Effluent Quality Index (EQI), and the operation costs using the Overall CostIndex (OCI).
The typical indicators of effluent quality total suspended solids (TSS), biological oxygen demand(BOD5), chemical oxygen demand (COD), Kjeldahl nitrogen (SNKj), and total nitrogen concentration(Ntot) are computed in BSM2 using the AM1 model variables obtained from simulations: solubleinert organic matter (SI), readily biodegradable substrate (SS), particulate inert organic matter (XI),slowly biodegradable substrate (XS), active heterotrophic biomass (XB,H), active autotrophic biomass(XB,A), particulate products arising from biomass decay (XP), nitrate, nitrite nitrogen (SNO), NH4+,and NH3 Nitrogen (Ammonium) (SNH), soluble biodegradable organic nitrogen (SND), particulatebiodegradable organic nitrogen (XND). Subscript e is used to denote effluent:
Total suspended solids (TSS):
TSSe(gCOD
m3 ) = 0.75 · (XS,e + XI,e + XB,H,e + XB,A,e + XP,e), (1)
Biological oxygen demand (BOD5):
BOD5,e(gBOD
m3 ) == 0.25 · (SS,e + XS,e + (1 − fP) · (XB,H,e + XB,A,e)), (2)
Chemical oxygen demand (COD)
CODe(gCOD
m3 ) == (SS,e + XS,e + XI,e + XB,H,e + XB,A,e + XP,e, (3)
Kjeldahl nitrogen is the sum of ammonium and organic nitrogen in the effluent:
SNKj,e(gNm3 ) == SNH,e + SND,e + XND,e + iXB · (XB,H,e + XB,A,e) + iXP · (XP,e + XI,e), (4)

Sustainability 2020, 12, 768 8 of 28
Ntot is calculated as the sum of SNO and Kjeldahl nitrogen:
Ntot,e(gNm3 ) == SNKj,e + SNO,e. (5)
The quality of the effluent and the influent are measured using EQI and IQI indices, respectively,that quantifies the amount of pollutants in the water and wastewater averaged over a 364-dayobservation period and are calculated weighting the different compounds of the effluent load.
EQI defined to evaluate the quality of the effluent is:
EQI(kgd) ==
11000 · T
t=609days∫t=245days
(BTSS · TSSe(t) + BCOD · CODe(t)
+BNKj,e · SNKj,e(t) + BNO · SNO,e(t) + BBOD5 · BOD5,i(t) · Qe(t) · dt.
(6)
IQI is defined to evaluate the quality of the influent. Subscript i is used for influent:
IQI(kgd) =
11000 · T
t=609days∫t=245days
(BTSS · TSSi(t) + BCOD · CODi(t)
+BNKj · SNKj,i(t) + BNO · SNO,i(t) + BBOD5 · BOD5,i(t) · Qin(t) · dt,
(7)
where Bi are weighting factors BTSS = 2, BCOD = 1, BNKj = 30, BNO = 10, BBOD5 = 2, and T is thetotal time in days.
The BSM2 platform measures the energy consumption using: Aeration energy (AE) that quantifiesthe amount of energy used for aeration in the ASP as a function of KLa, pumping energy (PE), whichis the amount the energy used for pumping in the whole plant (is the summation of pumping energyof each unit), the mixing energy (ME) consumed in the whole plant, and the heating energy (HE) thatis the energy required to maintain a temperature of 35 ◦C in the anaerobic digester. These indices aredescribed in [20].
Since anaerobic digester is self-sustainable, the net heating energy is computed assuming that1 kg of methane (CH4) produces 7 kWh of heat [20].
HEnet is the net heating energy:
HEnet(kWh) = max(0, HE − 7 · METprod), (8)
where METprod is the methane production in the anaerobic digester (kg CH4/d).The Overall Cost Index (OCI) is defined to evaluate the operation costs:
OCI(EUR
d) = AE + PE + 3 · SP + 3 · EC + ME − 6 · METprod + HEnet, (9)
where SP is the sludge production to be disposed, EC is the consumption of external carbon source,and ME is the mixing energy.
BSM2 protocol performs an analysis of violations of desired limits of Ntot and ammonium (SNH),CODt, BOD5 and suspended solids (SS) in the effluent in terms of percent of the operation period,frequency (occur), and days equivalent (days).
In the next section, the N/E index and other indicators of process performance are presented tobe used for the evaluation of the overall performance of the plant under different control strategies.

Sustainability 2020, 12, 768 9 of 28
3. Assessment of Global WWTP Performance
Methods and key performance indicators are available to address WWTP operation of WWTPsfrom a global perspective [1,6–8,10,23]. In [6], more than 80 performance indicators are presentedas part of a performance assessment system for a cost-effective and sustainable management ofwastewater services. In [23], an interesting review of performance assessment methods for monitoringand diagnosis of WWTP energy consumption is presented. In [7], some indicators to measure theefficiency of nitrogen removal and the carbon footprint of the removal process are described. On theother hand, Life Cycle Assessment (LCA) has been used to perform a comprehensive analysis ofthe environmental impact of WWTPs [1,2,10,11] considering different environmental indicators andfunctional units. An extension of the analysis to the integrated water system is presented in [8].In practice and in the majority of the works, the main objectives of the analysis of performance arethe energy efficiency and the minimization of emissions to water, air, and soil, although factors asmaintenance, services, and personnel costs should be included [8].
Some of those available indicators are selected here for supervising and rating the effect of controlactions on global efficiency of the plant. Energy consumption is the most important factor affectingoperation and environmental costs, and pollution removal is the main objective of plant operationand the major contribution to energy use, then a sensible approach to address energy efficiency is theuse of metrics that associate energy consumption and pollution removal [23]. When the objective ofperformance assessment is energy management, the ratio between energy consumption and pollutionremoval is considered [23] in this work; it is preferred to express the inverse relationship. Lower valuesindex implies excessive requirement of energy and/or poor pollution elimination; on the contrary,the index increases when energy requirements are reduced and/or a large amount of nitrogenatedcompounds have been eliminated.
Specifically, an index that describes dynamically the efficiency of the nitrogen removal is selectedto be used as an integral performance index; the N/E index describes the ratio between nitrogenremoval (kgN) and energy required (kWh) to remove that amount of nitrogen providing a link betweenpollution elimination and energy consumption in the whole plant. Furthermore, the N/E indexconnects the water line with sludge line because the energy required in all the units (aeration energy,heating energy for digestion and pumping and mixing energy) is accounted for.
In this work, the dynamic N/E index is used for evaluation and for control purposes. As an N/Eindex is defined as an integral measure of performance, since nitrogen removal efficiency in termsof energy use has an impact on several aspects of WWTP operation such as operation costs, GHGemissions, organic matter removal, and frequency and amount of violations of desired effluent limits.Thus, the regulation of the N/E index to appropriate values in a close loop control scheme shouldimprove the overall performance of the plant. Using such control approach, the DO set-point whichis a critical variable of the activated sludge process is manipulated to produce operating conditionsthat improves pollution removal, reduce consumption of aeration energy and consequently decreaseindirect GHG emissions on the basis of a controlled variable that provides information about theenergy requirements of the whole plant to perform such actions.
The N/E index which is computed dynamically at each sampling time. It is described in terms ofthe BSM2 plant variables and performance indicators described in Section 2.2:
NE(
kgNkWh
) =IQN − EQN
AE + PE + ME + HE. (10)
Modifications of IQI and EQI are used in this work to quantify nitrogen removal in ASP. IQNand EQN are the influent and effluent quality indices in terms of nitrogenated compounds:
EQN(kgd) =
11000 · T
t=609days∫t=245days
(BNKj · SNKj,e(t) + BNO · SNO,e(t)) · Qe(t) · dt, (11)

Sustainability 2020, 12, 768 10 of 28
IQN(kgd) =
11000 · T
t=609days∫t=245days
(BNKj · SNKj,i(t) + BNO · SNO,i(t)) · Qin(t) · dt, (12)
where Bi are weighting factors reported for EQI (6) and T is the total time.In order to complement the information provided by N/E index evolution, other efficiency
indicators are considered to measure the effect of control actions on dynamic performance. Suchindicators are the ratio between the amount of COD removed in ASP and the energy required (kWh) toremove that quantity of organic matter (R-COD/E), the treatment efficiency in terms of influent flow(D-TE), and the ratio between available COD and nitrogen in a given reactor i or stream (COD/Ni).
The COD removal efficiency is computed as:
R − CODE
(kgCOD
kWh) =
CODi − CODe
AE + PE + ME + HE, (13)
where CODi is given by Equation (3).The treatment efficiency with respect to influent flow is:
D − TE(kgm3 ) =
IQI − EQIQin
kgm3 , (14)
where IQI and EQI are given by Equations (6) and (7).The COD/Ni ratio is computed as the ratio between COD given by Equation (3) and total nitrogen
given by Equation (5) in reactor i or in wastage flow (i = w).The annual average values of selected performance indicators are computed to carry out a
comprehensive evaluation of plant performance under different control strategies. The indicators arechosen to measure the quality of the effluent, the efficiency of the treatment, the environmental costsof the treatment, and the economic aspects that have to be taken into account simultaneously to takedecisions about the impact of control strategies from a multicriteria analysis. The selected indicatorsare described below:
Treatment efficiency is the ratio between the pollution removed in the activated sludge processand the pollution load in the influent. The treatment efficiency (TE):
TE =IQI − EQI
IQI. (15)
Carbon dioxide emissions associated with biological processes: It is a measure of the ratio betweenthe CO2 emissions produced in ASP and anaerobic digestion (AD) and the kg of pollution eliminatedin ASP. In ASP, the growth of heterotrophs and decay of bacteria produces CO2, but the growth ofautotrophs consumes CO2, the emissions are estimated using the reactions presented in [40] for theASM1 model; CO2 generated by anaerobic digestion (CO2AD) is computed by BSM2 platform:
CO2P(kgkg
) =CO2
Pollutionremoved=
CO2ASP + CO2ADIQI − EQI
. (16)
Energy consumption: Two indicators are considered: the total energy consumed per m3 of treatedwastewater and the net energy consumed per m3 of treated wastewater considering that biogas is usedto supply heat to digester. The total energy consumption:
TEQ(kWhm3 ) =
EQin
=AE + PE + ME + HE
Qin. (17)
Sustainability 2020, 12, 768 11 of 28
The net energy consumption:
NEQ(kWhm3 ) =
E(kWh)Qin(m3)
=AE + PE + ME + HEnet − 0.5 · (7 · METprod − HE)
Qin. (18)
External energy for aeration: Given that biogas is used to heat the digester, but excess biogas canbe available for aeration assuming that 1 kg of CH4 produces 3.5 kWh of electricity:
ExternalAE(kWh
d) = AE − 0.5 · (7 · METprod − HE). (19)
Finally, the electricity consumption is used also as a performance indicator:
Electricity(kWh
d) = AE + PE + ME. (20)
Radar plots are used to show the simultaneous impact of each control strategy on differentperformance indicators. The indicators are expressed to increase their values when the desiredcharacteristic is worsened. The diagrams present the ratio between values of the indices for eachstrategy and the worst value obtained for the group of strategies that are being evaluated, thereforethe maximum value of the indices in the plot is 1. The area of the polygons formed in the plots isused to compare the effect on global performance of the control strategies. Indicators used in radarplots decrease their value when they are improved, then strategies that improve simultaneously moreindicators will produce smaller polygons.
In summary, the annual based indicators considered for the evaluation of overall performanceusing radar plots areas are:
• Inverse TE (Equation (15)), EQI (Equation (6)), and violations of effluent quality limits to measureASP treatment effectiveness.
• Electricity (Equation (20)) and pumping energy (PE) in the whole plant, aeration energy (AE), andexternal AE in ASP and HE in the digester to measure energy consumption; and TEQ and NEQ tocompare net energy and required energy with respect to volume of treated water in a year.
• CO2 (Equation (16)) emissions relative to Nitrogen elimination as environmental impact metric.• Overall cost index (OCI) to evaluate operation costs (Equation (9)).
An evaluation performance of existing PI based control strategies typically implemented in WWTPsis carried out using these sets of dynamic and annual-averaged performance indicators. The minimizationof the area of the radar plots is used to deal with the multiple objectives involved in WWTP operation.This information has been used for the design of the proposed control approach based on the regulationof the N/E index. The best existing control strategy is compared with N/E index control approachperforming a multicriteria analysis to evaluate its effect on the global WWTP efficiency.
4. Evaluation of Existing PI-Based Control Strategies
A comprehensive evaluation of performance of the WWTP under the PI (Proportional Integral)based control strategies typically implemented in a WWTP is carried out. The influence of controlactions of control schemes, namely DO control (DO Default), DO control and nitrates control (DO + NOcontrol), and supervisory ammonium based control (Cascade) on dynamic performance is addressedto detect critical situations that affect pollution removal efficiency and the COD/N ratio. Furthermore,the annual average performance indicators are computed and the multicriteria analysis carried outusing the information provided by radar plots of performance indicators and the measurement of thearea of the polygons corresponding to each strategy allow for determining the control strategy thatproduce the best performance from a global viewpoint.
Regarding dynamic behavior analysis, the observation of evolution of N/E and COD/E indexalong the operation period in Figure 4 and influent variations in Figure 2 make evident the influence

Sustainability 2020, 12, 768 12 of 28
of temperature and the effect of variations on load on removal efficiency of the plant. In theperiods of lower temperature between weeks 20 and 35, the efficiency indices reach their minimumvalues. Microorganism growth rate is diminished due to temperature effect, then nitrification anddenitrification processes that govern nitrogen and organic matter removal are slower while heatingenergy requirements of anaerobic digester increases. On the other hand, the oxygen consumptiondepends on the load of wastewater to be treated that varies over the day, then variations of the influentload due to frequent changes on Qin, Ntot and COD concentration produce continuous variationson N/E and R-COD/E indices. However, it can be observed that temperature effect dominates theefficiency of the process. The evolution of the profiles of the N/E and R-COD/E index along theyear is similar because organic matter is consumed as substrate by heterotrophic biomass as part ofdenitrification process.
Figure 4. Weekly profiles of of N/E index (kgN/kWh) and R-COD/E (kgCOD/kWh) index for theexisting control strategies.
Regarding the effect of control strategies, the objective of the implementation of ammonium basedsupervisory control scheme (Cascade) in real practice [27] is to reduce the use of energy for aeration,which is achieved varying DO set-point. Such reduction on aeration energy reflects as larger valuesof N/E and COD/E indices in the full operation period as observed in Figure 4, which means majorefficiency. The evolution of D-TE, which is treatment efficiency with respect to influent flow, andCOD/N ratio in the 2nd reactor is shown in Figure 5. In this case study, it is observed that sensitivity ofD-TE index to control actions is significantly lower than N/E and COD/E indices, a minimal effect ofcontrol actions on pollution removal with respect to influent flow rate is appreciated, and temperatureeffect is unnoticed. The dynamic profile for COD/N ratio in the second reactor shows an effect oftemperature, with lower values between weeks 20 and 35, and an effect of load variations. Larger valuesof COD/N ratio are attained with cascade schemes in the full operation period, which implies lowerrequirements of external carbon, so carbon dosage could be reduced when using such control strategies.
As a conclusion of the analysis of the dynamic performance, it is observed that cascade schemesimprove pollution removal efficiency with respect to energy use and increases COD/N ratio in theanoxic reactor. Both characteristics represent potential improvements on energy efficiency of WWTPsand environmental impact. Reducing energy consumption implies lower indirect GHG emissions dueto energy use, and higher COD/N ratios in the anoxic zone implies a reduction on carbon dosage thatis a chemical additive. Moreover, both factors, energy consumption and external carbon source, affectoperation costs. Temperature is important for the energetic efficiency of the operation; the indices thatquantify energy effects on pollution removal are worsened in the periods of lower temperature, due tokinetic limitations on growth rate and the increased demand of energy from digester. It is importantto indicate that the characteristic of cascade schemes that produce those benefits is the continuous

Sustainability 2020, 12, 768 13 of 28
variation of DO set-point, to levels below the 2 g/m3 imposed by DO default and DO+NO controlstrategies, which results in significant aeration energy savings. Such characteristic is exploited in theformulation of the control strategy proposed in this work. It is important to analyze the effect on DOdynamics of the control movements of cascade strategies, to provide insight of the effect of controlactions on the nitrogen removal process that affects energetic efficiency.
Figure 6 shows DO set-points given by the different control strategies, and DO concentration inthe 4th reactor of aerobic zone in representatives summer and winter weeks of the year. DO set-pointof DO default and DO+NO control strategies is fixed on 2 g/m3 and DO concentration follows thereference very closely. On the other hand, the DO set-point with cascade schemes is continuouslydriven to the minimum values of the admissible range in the warmer week and effluent quality goalsare attained. It could suggest that maintaining a fixed set-point of 2 g/m3 in the periods of highertemperature represents unnecessary consumption of energy for aeration. Nevertheless, maintainingDO concentration at their lowest levels as observed between days 272 and 275 in Figure 6 couldproduce performance deterioration and undesirable reactions [24]. In the winter week, a DO set-pointwith a cascade scheme exhibits continuous variations between its minimum and maximum admissiblevalues, since lower temperatures make treatment more exigent. In this situation, the cascade schemecomputes DO set-points over 2 g/m3, which is also unnecessary, since the effect of DO levels above2 g/m3 on nitrogen removal is minimal [13].
Figure 5. Weekly profiles of lIQI-EQI/Qin (kg/m3) index and COD/N ratio (gCOD/gN) in the 2ndreactor for the existing control strategies.
Figure 6. N/E index profile in the warmest and coldest periods.

Sustainability 2020, 12, 768 14 of 28
The analysis of performance using averaged values for the full operation period (one year) iscarried out; the performance indicators computed for each strategy are reported in Table 1.
Table 1. Performance indicators for the existing control strategies.
Performance Indicator DO Default DO+NOControl
CascadeSPNH = 1
CascadeSPNH = 4
IQI/(IQI-EQI) 1.081 1.093 1.077 1.078EQI (kg/d) 5578 6343 5374 5426CO2P (kg CO2/kg) 0.050 0.052 0.048 0.048OCI (EUR/d) 9447 9451 9023 8837Electricity (kWh/d) 5436 5436 5016 4834AE (kWh/d) 4223 4432 3803 3620PE (kWh/d) 445.45 236.2 445.45 445.45HE (kWh/d) 4225 4225 4225 4225TEQ (kWh/m3) 0.467 0.467 0.447 0.438NEQ (kWh/m3) 0.181 0.181 0.161 0.152External AE (kWh/d) 2537 2746 2116 1933Ntot violations (%) 1.18 46.1 0.5 0.39Ntot violations (occur) 33 350 12 10Ntot violations (days) 4.3 168 2 1.4SNH violations (%) 0.4 0.3 3.4 7.9SNH violations (occur) 11 7 116 207SNH violations (days) 1.5 1.1 12.5 28.7COD violations (%) 0.06 0.06 0.06 0.06SS violations (%) 0.34 0.34 0.34 0.34Radar Area 1.692 2.030 1.428 1.456
Note: IQI: Influent Quality Index, EQI: Effluent Quality Index, OCI: Overall Cost Idex, AE: Aeration Energy,PE: Pumping Energy, HE: Heating Energy, TEQ: Total Energy Consumption NEQ: Net Energy Consumption,Ntot: Total Nitrogen concentration, SNH: Ammonium concentration, COD: Chemical Oxygen Demand, SS:Suspended Solids.
From an overview of performance indicators presented in Table 1, it is corroborated that cascadestrategies improve energy efficiency of the WWTP. All the indicators associated with energy use, exceptpumping energy (PE) and heating energy (HE), are decreased with respect to DO default and DO+NOcontrol strategies; as a consequence, operation costs, measured by OCI, are also reduced. The minimumPE value corresponds to DO+NO control strategy that reduces internal recycle flow to meet the desirednitrates’ reference. The control actions of existing ASP control schemes do not affect HE, which is thesame in all cases; it is known that heating requirements of the digester are associated with temperaturegradient. Even a slight difference is appreciated, CO2 emissions are also reduced by cascade strategies.Regarding effluent quality goals, EQI is improved by cascade schemes, Ntot violations are reduced incomparison with DO and DO+NO control, but ammonium violations are significantly increased infrequency and magnitude as ammonium set-point is relaxed; consequently, lower DO levels in aerobicreactors are admitted. Another difference observed when comparing cascade strategies with differentset-points is that relaxed option SPNH = 4 improves energy indicators and OCI, but slightly increasesEQI and frequency.
Radar plot that represents simultaneously the set of performance indicators of the existing controlstrategies is presented in Figure 7. The area of the polygon corresponding to each control strategy isreported in Table 1. The larger area corresponds to DO+NO strategy and the lower area correspondsto cascade strategy with SPNH = 1; this means that it is the control strategy that reduces in a largeramount, a larger number of performance indicators. Then, according to the proposed assessmentmethod, cascade strategy with SPNH = 1 (Cascade SPNH = 1) produce the major improvement ofperformance from a holistic perspective.

Sustainability 2020, 12, 768 15 of 28
Figure 7. Radar plot of performance indicators for the existing control strategies.
It is observed that varying DO set-point to attain the desired values of ammonium concentration(SNH) produces an improvement of global performance. The information about DO dynamics givenby Figure 8 is useful for the design of the proposed N/E control approach.
Figure 8. DO set-point and DO concentration (g/m3) in the 4th reactor in representative weeks of thewarmest and coldest periods.

Sustainability 2020, 12, 768 16 of 28
5. N/E Index Control Approach
The proposed process control approach uses the N/E index described in Section 3 as the controlledvariable in a cascaded PI based strategy that uses the dissolved oxygen (DO) concentration in theaerobic zone of the ASP as the manipulated variable. As in the cascade control scheme for regulationof ammonium concentration, an external PI controller provides the DO set-point to the internal DOcontrol loop, but, in this case, the DO set-points are computed considering a measure of the expectedefficiency of the plant. Thus, the DO set-point implemented in aerobic reactors lead the plant tooperating conditions that improve the ratio between ASP nitrogen removal efficacy and the energyrequired by the whole plant, which provides a holistic perspective as well as optimizing characteristicsto control strategy.
A variable N/E set-point is considered to account for the effect of load and temperature variations.In order to introduce a sense of optimization to control actions, a range of variation of N/E set-point thatimproves the N/E efficiency observed with the typical strategies is applied to WWTPs. An event-basedcontrol algorithm determines N/E set-point movements, and the algorithm is formulated to avoidDO inadmissible values in the aerobic zone and unreachable N/E set-points. The block diagramrepresenting the proposed strategy and the control scheme in the plant is presented in Figure 9. Theexternal PI controller tuning is performed using the Internal Model Control (IMC) approach of [41].A detailed description of controller tuning is presented in Appendix A.
The purpose of this work is to concentrate on the analysis of the effects of the N/E index usingDO concentration as the only manipulated variable. The external carbon source control is one ofthe more effective ways of guaranteeing the availability of a carbon source, therefore ensuring theheterotrophic denitrification, but it is not considered in the proposed strategy. Then, external carbondosage is maintained as in BSM2 strategy, and a constant Qcarb is added to the first anoxic reactor.
Figure 9. Block diagram representing the proposed N/E control strategy.
In order to determine the appropriated algorithm to vary N/E set-point, the relation betweenN/E requirements and DO dynamics is evaluated considering fixed N/E set-points. When DO control,DO+NO control, and ammonium based cascade control strategies are applied, the N/E index rangesbetween 2.5 and 4.2 kgN/kWh for weekly average values (Figure 4) and the variation observed in

Sustainability 2020, 12, 768 17 of 28
representative summer and winter weeks (Figure 10) ranges between 9 kgN/KWh and 1 kgN/kWh,but peaks and valleys of N/E index values occur in a short time horizon, and the proposed strategycontemplates a larger time horizon. Therefore, the range of variation of N/E set-point is selectedconsidering the weekly variations of N/E index. The maximum value observed in the weekly profileis 4.2 kgN/kWh, so N/E index set-point should be higher to improve efficiency; the possibility ofincreasing the maximum N/E value up to 4.5 kgN/kWh or to 5 kgN/kWh is considered.
Figure 10. N/E index profile in the warmest and coldest periods.
The first step to design the event-based controller is to analyze the impact on manipulated variableof N/E index tracking considering constant set-points. Then, the behavior of DO set-points computedby external PI controller when implementing the proposed N/E control strategy for constant N/Eset-points of 4.2 kgN/kWh, 4.5 kgN/kWh and to 5 kgN/kWh is observed. The range of admissiblevalues for DO set-point in BSM2 platform is 0.5 to 4 g/m3.
Figure 11 shows control movements under N/E control in representative winter and summerweeks. The first observation is that the trend of DO set-point movements to track the constant N/Ereference in the warmer and colder season is opposite to that observed with the cascade scheme(Figure 8). DO set-points with frequent variations between 3.5 g/m3 and 0.5 g/m3 are computedin summer weeks with N/E control, while DO set-points with a cascade scheme in the same weektend to the minimum admissible values. The cascade scheme produces lower DO set-points becauseammonium reference can be easily attained with lower DO requirements at higher temperatures.In the case of N/E control, the possibility of improving nitrogen removal at higher temperature isexploited increasing or decreasing aeration (i.e., DO set-points) when it affects positively N/E index.It is noticed that the peaks of set-point movements decrease as N/E reference increases. On theother hand, DO set-points tend to the minimum admissible values with N/E control in winter week,while cascade control varies DO set-points between 3.5 g/m3 and 0.5 g/m3. At low temperatures,nitrogen removal capacity of microorganisms (nitrifiers) is significantly reduced, then N/E efficiencydecreases and the imposed N/E set-point can be unreachable. The control system tries to achieve thedesired reference, leading DO set-point to the minimum levels (Figure 11) to reduce aeration energyconsumption. In these conditions, the control actions that force the N/E index to higher values produceperformance deterioration instead of improving plant efficiency. Therefore, the event-based controllerintroduced in the proposed N/E control approach is based on the observation of DO dynamics, todetect those situations where the manipulated variable is forced outside the recommended limits for aprolonged period of time and adapt gradually N/E index set-point to reachable values.

Sustainability 2020, 12, 768 18 of 28
Figure 11. DO set-point movements in the 4th aerobic reactor when N/E index control strategy isapplied considering constant N/E set-points.
5.1. Event-Based Controller Algorithm
The rationale of the event-based controller is based on the following operating rule: it shouldreduce the N/E index set-point when DO levels reach the minimum allowed values and the desiredreference can not be attained, but the set-point should be increased when DO levels are high enough torequest more N/E efficiency. Performing these actions in a continuous way produces an N/E indexset-point trajectory associated with DO dynamics.
The DO levels are monitored at a given sampling time (τs); then, when minimum DO levels aredetected, the N/E index set-point is reduced by a certain amount (∆) to adapt the N/E efficiencyrequirements to real possibilities of the process. Once higher DO levels are detected, the N/E indexset-point is increased to improve N/E efficiency.
The parameters considered in the proposed event-based strategy are:
• τs: Sampling time at which the event-based detector will operate.• DOlow: Lower value for the DO that should be avoided.• ∆: Increments on the N/E set-point that should be performed at each event.• N/EMax, N/EMin: Maximum and minimum values for the N/E index.
The logic of the event-based reference update is as follows:Inputs: DO, N/E index set-point (N/ESP), if (DO ≤ DOlow)
N/ESP=min(N/EMin, N/ESP-∆),elseN/ESP=min(N/EMax, N/ESP+∆).endThis procedure is executed every τs, and the N/E reference will therefore remain constant during
the τs time interval. An example of the actions of the event-based algorithm on dynamic response ispresented in (Figure 12), where it is possible to observe how an N/E index set-point is decreased in amagnitude given by ∆ each time period given by τs while DO levels reach the minimum value; if DOincreases, then N/E index is increased in ∆each τs until minimum DO levels are detected again.

Sustainability 2020, 12, 768 19 of 28
Figure 12. Actions of the event-based algorithm to change the index set-point.
The DO set-point can vary between 0.5 and 4 g/m3, then DOlow = 0.5 g/m3 is a fixed value,but the rest of the parameters can be modified by designer: N/EMax, N/EMin, τs and ∆. In the nextsection, event-based strategy with different tuning parameters is evaluated. The idea is to select thecombination of parameters of event-based controllers that produce the major improvement in globalperformance when implementing the N/E control approach and comparing that design with the bestexisting strategy, which is the ammonium-based control with SPNH = 1 (Cascade SPNH = 1).
Tuning of Event-Based N/E Controller Parameters
It has been observed in Figure 11 that a constant N/E set-point of 5 kgN/kWh leads DO set-pointto the minimum value along the whole week; then, it is assumed that higher N/E set-points arenot recommended. The maximum N/E index observed in the evaluation of existing strategies is4.2 kgN/kWh and the idea of the proposed control approach is to improve that value. Therefore,N/EMax values of the event-based controller to be evaluated are: 4.2 kgN/kWh, 4.5 kgN/kWh, and5 kgN/kWh while N/Emin is fixed on 2 kgN/kW to provide a back-off with respect to the minimumobserved for existing control strategies.
The following procedure has been completed to find the best event-based controller parameters:For each N/EMax value, different sampling times τs are tested: 15 min, 30 min, 60 min, and 120 min.For N/EMax 4.2 kgN/kW and 5 kgN/kW, and the best sampling time, different values of ∆ areconsidered: 0.25, 0.5, and 0.75 kgN/kWh.
In order to illustrate how N/E set-point trajectory and DO set-point vary with sampling time τs
and ∆ parameters of the event-based controller, details of the set-point movements with different τs
and ∆ for N/EMax = 5 kgN/kW and N/EMin = 2 kgN/kW are presented in Figure 13. In the figure, itis possible to observe that τs affects the sensitivity and frequency of N/E set-point movements. Thesmaller τs, which is 15 min, produces more trajectories between N/EMax and N/EMin since increasingthe frequency of DO monitoring makes it possible to detect more situations where DO levels reachthe minimum that can be unnoticed with larger sampling times. As a consequence, DO set-pointmovements with smaller N/EMax are more frequent and smaller in magnitude. Regarding the effectof ∆, in Figure 13, it can be observed that larger ∆ produce abrupt variations of N/E index set-pointwhile variations are gradual with smaller ∆; then, larger ∆ produce more trajectories between N/EMaxand N/EMin that are reflected as more frequent and smaller variations in DO set-point.

Sustainability 2020, 12, 768 20 of 28
Figure 13. Effect of τs and ∆ on N/E index set-point and DO set-points.
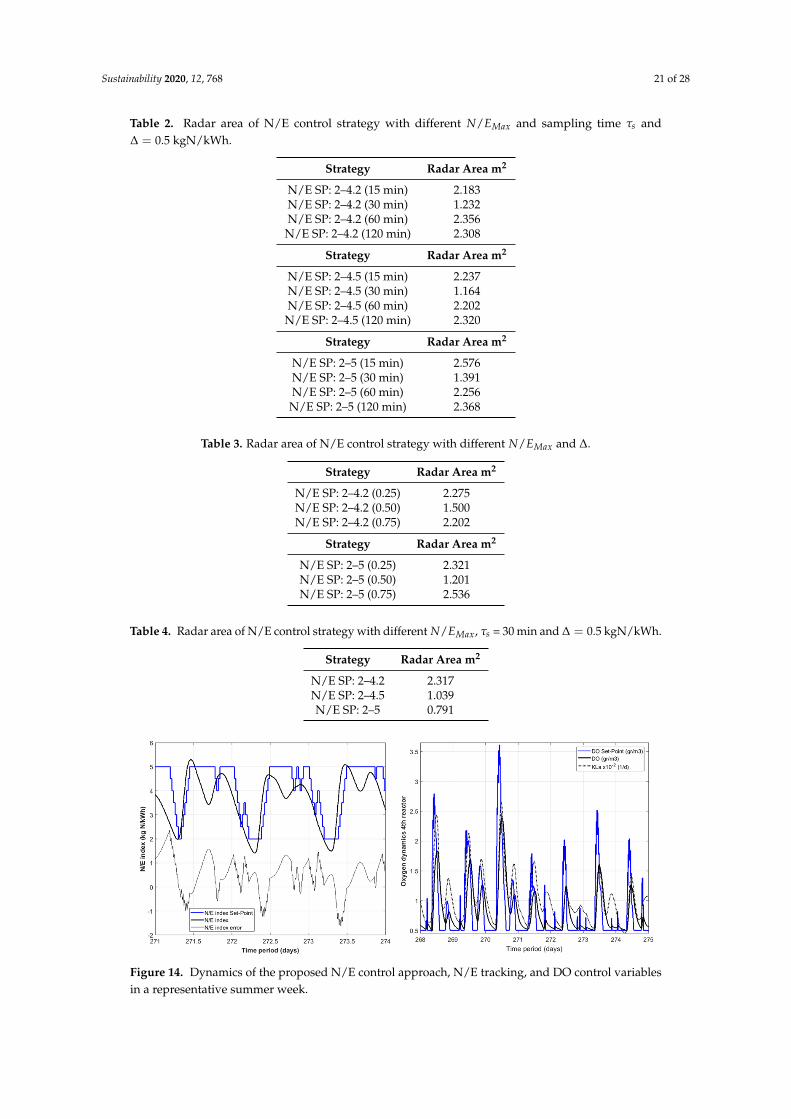
The effect of N/E control approach with each set of tuning parameters on overall efficiency isevaluated using the radar plots of performance indicators to find the best combination of parameters.The radar plots for each combination of parameters have been obtained, and the area of the polygonsformed by each one is computed. The areas of the plots obtained for fixed ∆ = 0.5 kgN/kWh anddifferent τs are reported in Table 2. It is observed that the lowest area corresponds to sampling time of30 min in all cases, which is the approximate time constant of the DO control loop.
The areas of the polygons obtained in the radar plots for different values of ∆ with N/EMax =
4.2 kgN/kWh, N/EMax = 5 kgN/kWh, and τs = 30 min are presented in Table 3. The lowest area isobtained for ∆ = 0.5 kgN/kWh in both cases.
Finally, the areas of the polygons obtained in the radar plots for different values of N/EMax withthe best ∆ and τs: ∆ = 0.5 kgN/kWh and τs = 30 min are presented in Table 4. The lowest area isobtained for N/EMax = 5 kgN/kWh.
Finally, Figure 14 shows the dynamics of the proposed N/E control approach in a representativeweek with the best parameters of the event-based controller: N/EMax = 5 kgN/kWh, τs = 30 minand ∆ = 0.5 kgN/kWh. It is observed that N/E index dynamic response follows the N/E set-pointtrajectory given by an event based controller adjusting DO set-point. DO set-point is adjusted by KLamovements computed by an internal DO controller.
Sustainability 2020, 12, 768 21 of 28
Table 2. Radar area of N/E control strategy with different N/EMax and sampling time τs and∆ = 0.5 kgN/kWh.
Strategy Radar Area m2
N/E SP: 2–4.2 (15 min) 2.183N/E SP: 2–4.2 (30 min) 1.232N/E SP: 2–4.2 (60 min) 2.356
N/E SP: 2–4.2 (120 min) 2.308
Strategy Radar Area m2
N/E SP: 2–4.5 (15 min) 2.237N/E SP: 2–4.5 (30 min) 1.164N/E SP: 2–4.5 (60 min) 2.202
N/E SP: 2–4.5 (120 min) 2.320
Strategy Radar Area m2
N/E SP: 2–5 (15 min) 2.576N/E SP: 2–5 (30 min) 1.391N/E SP: 2–5 (60 min) 2.256N/E SP: 2–5 (120 min) 2.368
Table 3. Radar area of N/E control strategy with different N/EMax and ∆.
Strategy Radar Area m2
N/E SP: 2–4.2 (0.25) 2.275N/E SP: 2–4.2 (0.50) 1.500N/E SP: 2–4.2 (0.75) 2.202
Strategy Radar Area m2
N/E SP: 2–5 (0.25) 2.321N/E SP: 2–5 (0.50) 1.201N/E SP: 2–5 (0.75) 2.536
Table 4. Radar area of N/E control strategy with different N/EMax, τs = 30 min and ∆ = 0.5 kgN/kWh.
Strategy Radar Area m2
N/E SP: 2–4.2 2.317N/E SP: 2–4.5 1.039N/E SP: 2–5 0.791
Figure 14. Dynamics of the proposed N/E control approach, N/E tracking, and DO control variablesin a representative summer week.

Sustainability 2020, 12, 768 22 of 28
6. Effect on Process Behavior and Global Performance: N/E Control Strategy vs.Existing Strategies
In Section 4, it was demonstrated that the typical control strategy that produces the majorimprovement of overall performance is the ammonium-based control with SPNH = 1 (CascadeSPNH = 1). In this section, Cascade SPNH = 1 strategy is compared with the proposed N/Econtrol approach using the best set of tuning parameters: N/EMax = 5 kgN/kWh, τs = 30 min,∆ = 0.5 kgN/kWh in terms of the dynamic behavior of efficiency indicators and key operationvariables and global performance improvement achieved in the whole operation period.
The evolution of N/E and R-COD/E in the evaluation period is presented in Figure 15. Similarpatterns of the indicators are produced by both strategies, but, in most of the operating period (weeks10 to 48), the N/E control strategy produces similar or higher values of the N/E index than cascadecontrol. N/E efficiency increases with cascade control in the first 10 weeks corresponding to highertemperatures when cascade scheme tends to lead DO set-point to the lower bound, but, the rest of thetime, the N/E control strategy produces equal or better N/E values, especially in the colder period(weeks 20 to 35), when cascade strategy tries to compensate for temperature effect increasing DOset-point and N/E control reduces DO set-point to increase N/E efficiency. Similar observations aremade respect to R-COD/E profile, with the particularity that a major improvement of the index isobserved in the colder period with N/E control strategy.
Figure 15. Weekly profiles of of N/E index (kgN/kWh) and R-COD/E (kgCOD/kWh) index forCascade SPNH = 1 and N/E control approach.
The evolution of D-TE and COD/N ratio in the 2nd reactor is shown in Figure 16. As in the caseof existing control strategies, a minimal effect of control strategies on D-TE profile (pollution removalwith respect to influent flow rate) is observed, and the evolution of COD/N ratio in the second reactorshows that slightly larger values are obtained with N/E control strategy in most of the operationperiod, especially in the colder weeks (Week 20–35) that indicate that availability of organic matter tobe used as substrate is improved in some degree.
Annual average values of performance indicators are computed for both control strategies andpresented in Table 5. The effect of executing control actions based on the regulation of an efficiencyindex that accounts for energy requirement of the full plant is notorious, and all performance indicatorsassociated with energy use are improved with N/E control strategy except pumping energy (PE) andheating energy (HE) that are not affected by control actions. It was a positive effect of cascade controlscheme that has been leveraged with the regulation of the efficiency index. The operation costs (OCI)are reduced due to energy savings and the amount of CO2 emissions is similar with both strategies.Regarding effluent quality requirements, EQI is worsened with N/E control as well as SNH violations,but Ntot violations are reduced in frequency and magnitude. This trend is observed in a radar plotshown in Figure 17. The global effect of control strategies on performance is quantified with an

Sustainability 2020, 12, 768 23 of 28
area of the polygon formed in radar plot (Table 5), that is reduced approximately 10% with N/Econtrol strategy.
Finally, a comparison of dynamic performance based on the observation of effluent qualityindicators as EQI and total nitrogen concentration in the effluent (Ntot) is made between DO default,Cascade SPNH = 1, and N/E control. Those dynamic profiles are presented in Figure 18, to show thatan N/E control strategy produces lower values of Ntot than the other strategies in the whole operationperiod. Ntot is directly involved in the N/E index used as a control variable. On the other hand, EQIthat measures other impacts on effluent quality is slightly improved by N/E control in the warmerweeks of the operation period but is worsened in the colder weeks.
Figure 16. Weekly profiles of IQI-EQI/Qin (kg/m3) index and COD/N ratio (gCOD/gN) in the 2ndreactor for Cascade SPNH = 1 and N/E control approach.
Table 5. Comparison of performance indicators for Cascade SPNH = 1 and N/E control strategy.
Performance Indicator CascadeSPNH = 1
N/E Control
IQI/(IQI-EQI) 1.077 1.079EQI (kg/d) 5374 5494CO2P (kg CO2/kg) 0.048 0.047OCI (EUR/d) 9023 8760Electricity (kWh/d) 5016 4757AE (kWh/d) 3803 3544PE (kWh/d) 445.45 445.45HE (kWh/d) 4225 4225TEQ (kWh/m3) 0.447 0.435NEQ (kWh/m3) 0.161 0.149External AE (kWh/d) 2116 1857Ntot violations (%) 0.5 0.21Ntot violations (occur) 12 9Ntot violations (days) 2 0.71SNH violations (%) 3.4 11.9SNH violations (occur) 116 143SNH violations (days) 12.5 43.2COD violations (%) 0.06 0.06SS violations (%) 0.34 0.34Radar Area 2.601 2.347

Sustainability 2020, 12, 768 24 of 28
Figure 17. Radar plot of performance indicators for the comparison between Cascade SPNH = 1 andN/E control strategy.
Figure 18. Evolution of the EQI index and Ntot/Qin in the whole operation period—weekly average values.
The use of the simple PI controllers makes feasible the full-scale implementation of the proposedN/E control strategy. It is possible to compute the N/E index using online measures from availablesensors to estimate nitrogen removal term, and energy term can be computed from power data frompumps, blowers, and heating equipment. The rest of the variables involved in the proposed controlscheme have been implemented in previous works [27,28] using available DO sensors, ammoniumsensors, and nitrate sensors.
7. Conclusions
In this paper, the N/E index, defined as the ratio between the amount of nitrogenated compoundseliminated (kgN) and the energy (kWh) required by the whole plant to eliminate that amount ofnitrogen (N/E index), is used as a global indicator of plant performance. The evaluation of existingcontrol strategies (DO control, cascade control of effluent ammonium concentration, and combinednitrates and DO control) in the BSM2 model showed that cascade control (SPNH = 1 g/m3) producesthe best performance from a global viewpoint, exhibiting the lower values of most of the performanceindicators associated with energy use, CO2 emissions, effluent quality, and effluent violations. In theimplementation of control approach based on the control of N/E index, the event-based controlalgorithm is used to produce a variable N/E set-point that detects when inadmissible values of DO

Sustainability 2020, 12, 768 25 of 28
concentration (0.5 g/m3) are reached. PI controllers prove themselves to be effective to introduce somesense of optimization in the control approach producing the control actions that lead the N/E index tothe desired values with a simple control law. From the evaluation of different tuning parameters forthe event-based N/E control approach, the best parameters were determined: N/EMax = 5 kgN/kWh,N/EMin = 2 kgN/kWh, τs = 30 min, ∆ = 0.5 kgN/kWh. The N/E index control approach usingthe best tuning parameters reduced the area of the polygonal figure of radar plot by 9% whencomparing with the best existing strategy (cascade control SPNH = 1 g/m3) that is associated withthe simultaneous improvement of more performance indicators. These results show the possibilitiesof the N/E index to be used as an indicator of global performance of WWTPs. It provides a linkbetween water line objectives and energy consumption in the whole plant that can be exploited tointroduce plantwide considerations in alternative control strategies formulated to drive the plant tooperating conditions that optimize the overall process efficiency. The combination with other efficiencyindicators is considered for future work.
The use of the simple PI controllers makes feasible the full-scale implementation of the proposedN/E control strategy. It is possible to compute the N/E index using online measures from availablesensors to estimate nitrogen removal term, and energy term can be computed from power data frompumps, blowers, and heating equipment [22]. The rest of variables involved in the proposed controlscheme have been implemented in previous works [27,28] using available DO sensors, ammoniumsensors, and nitrate sensors.
Author Contributions: S.R., R.V. and P.V. conceived and designed the general approach; S.R performed thesimulations; M.F. and M.M. contributed to the simulation interpretations; writing-review and editing, S.R., R.V.and P.V.; supervision, R.V.; S.R. wrote the paper. All authors have read and agreed to the published version ofthe manuscript.
Funding: This work has received funds from the Ministerio de y Competitividad (MINECO) projects DPI2015-67341-C2-1-R, DPI2016-77271-R, and also with FEDER funding. APC have been covered from such projects.
Acknowledgments: The authors wish to thank the support of the Spanish Government through the Ministerio deEconomía y Competitividad (MINECO) projects DPI2015-67341-C2-1-R, DPI2016-77271-R, and also with FEDERfunding. The authors would also like to thank the WWTP of Salamanca (Aqualia) for allowing our research groupto visit, and sharing the plant, in addition to the IWA Task Group from the Department of Industrial ElectricalEngineering and Automation (IEA), Lund University, Sweden (Ulf Jeppsson, Christian Rosen) for the BSM1 models.
Conflicts of Interest: The authors declare no conflicts of interest.
Appendix A
Appendix A.1. N/E Index Controller Tuning
An appropriated controller tuning is important also for control system performance. The internalPI controller that manipulates KLa of the aerobic reactors to regulate DO in the 4th reactor uses thedefault tuning parameters of BSM2 platform [20]. Therefore, it can be considered as an already existingcontroller. For the tuning of the external PI that manipulates DO set-point to regulate N/E index, theidentification of the model of the system is necessary. This controller is tuned on the basis of a firstorder filter with unitary gain and time constant of 0.1 that represent physical delay of the process.To obtain the model, step changes are applied to the DO set-point considering constant influent flowand influent concentrations corresponding to BSM2 steady state operation. The N/E index response(Figure A1) is obtained and approximated with a first order model:
N/EDO
=K
τ · s + 1=
0.250.2 · s + 1
. (A1)

Sustainability 2020, 12, 768 26 of 28
On the basis of this first order model, an Internal Model Control (IMC) approach is followedto design the PI controller. PI = Kp + Kp/Tis [41]. The resulting PI controller parameters obey thefollowing expressions that relate PI parameters with first order model:
Ti = τ, (A2)
Kp =τ
λ · K. (A3)
A tuning value of λ = 0.8 has been taken.
Figure A1. N/E index response to step changes in DO concentration.
References
1. Meneses, M.; Concepcion, H.; Vrecko, D.; Vilanova, R. Life Cycle Assessment as an environmental evaluationtool for control strategies in wastewater treatment plants. J. Clean. Prod. 2015, 107, 653–661. [CrossRef]
2. Meneses, M.; Concepcion, H.; Vilanova, R. Joint Environmental and Economical Analysis of WastewaterTreatment Plants Control Strategies: A Benchmark Scenario Analysis. Sustainability 2016, 8, 360. [CrossRef]
3. Flores-Alsina, X.; Arnell, M.; Amerlinck, Y.; Corominas, L.; Gernaey, K.V.; Guo, L.; Lindblom, E.; Nopens, I.;Porro, J.; Shaw, A.; et al. Balancing effluent quality, economic cost and greenhouse gas emissions duringthe evaluation of (plant-wide) control/operational strategies in WWTPs. Sci. Total Environ. 2014, 466–467,616–624. [CrossRef] [PubMed]
4. Gordon, G.T.; McCann, B.P. Basis for the development of sustainable optimisation indicators for activatedsludge wastewater treatment plants in the Republic of Ireland. WAter Sci. Technol. 2014, 71, 131–138.[CrossRef] [PubMed]
5. Barbu, M.; Santin, I.; Vilanova, R. Applying Control Actions for Water Line and Sludge Line To IncreaseWastewater Treatment Plant Performance. Ind. Eng. Chem. Res. 2018, 57, 5630–5638. [CrossRef]
6. Quadros, S.; Joao Rosa, M.; Alegre, H.; Silva, C. A performance indicators system for urban wastewatertreatment plants. Water Sci. Technol. 2010, 62, 2398–2407. [CrossRef]
7. Mauricio-Iglesias, M.; Garrido, J.M.; Lema, J.M. Operation of an innovative WWTP with environmentalobjectives. A model-based analysis. IFAC-PapersOnLine 2016, 49, 539–543. [CrossRef]
8. Puleo, V.; Notaro, V.; Freni, G.; La Loggia, G. Multicriteria performance analysis of an integrated urbanwastewater system for energy management. J. Hydroinformatics 2017, 19, 865–878. [CrossRef]
9. Flores-Alsina, X.; Corominas, L.; Snip, L.; Vanrolleghem, P.A. Including greenhouse gas emissions duringbenchmarking of wastewater treatment plant control strategies. Water Res. 2011, 45, 4700–4710. [CrossRef]
10. Rodriguez-Garcia, G.; Molinos-Senante, M.; Hospido, A.; Hernández-Sancho, F.; Moreira, M.; Feijoo, G.Environmental and economic profile of six typologies of wastewater treatment plants. Water Res. 2011,45, 5997–6010. [CrossRef]
11. Lemos, D.; Dias, A.C.; Gabarrell, X.; Arroja, L. Environmental assessment of an urban water system.J. Clean. Prod. 2013, 54, 157–165. [CrossRef]

Sustainability 2020, 12, 768 27 of 28
12. Stare, A.; Vrecko, D.; Hvala, N.; Strmcnik, S. Comparison of control strategies for nitrogen removal in anactivated sludge process in terms of operating costs: A simulation study. Water Res. 2007, 41, 2004–2014.[CrossRef] [PubMed]
13. Rieger, L.; Jones, R.M.; Dold, P.; Bott, C. Ammonia-based feedforward and feedback aeration control inactivated sludge processes. Water Environ. Res. 2014, 86, 63–73. [CrossRef] [PubMed]
14. Santin, I.; Pedret, C.; Vilanova, R. Fuzzy Control and Model Predictive Control Configurations for EffluentViolations Removal in Wastewater Treatment Plants. Ind. Eng. Chem. Res. 2015, 54, 2763–2775. [CrossRef]
15. Machado, V.C.; Gabriel, D.; Lafuente, J.; Baeza, J.A. Cost and effluent quality controllers design based on therelative gain array for a nutrient removal WWTP. Water Res. 2009, 43, 5129–5141. [CrossRef] [PubMed]
16. Vega, P.; Revollar, S.; Francisco, M.; MartÃn, J. Integration of set point optimization techniques into nonlinearMPC for improving the operation of WWTPs. Comput. Chem. Eng. 2014, 68, 78–95. [CrossRef]
17. Santin, I.; Pedret, C.; Vilanova, R. Applying variable dissolved oxygen set point in a two level hierarchicalcontrol structure to a wastewater treatment process. J. Process. Control. 2015, 28, 40–55. [CrossRef]
18. Revollar, S.; Vega, P.; Vilanova, R.; Francisco, M. Optimal Control of Wastewater Treatment Plants UsingEconomic-Oriented Model Predictive Dynamic Strategies. Appl. Sci. 2017, 7, 813. [CrossRef]
19. Barbu, M.; Vilanova, R.; Meneses, M.; Santin, I. On the evaluation of the global impact of control strategiesapplied to wastewater treatment plants. J. Clean. Prod. 2017, 149, 396–405. [CrossRef]
20. Alex, J.; Benedetti, L.; Copp, J.; Gernaey, J.; Jeppsson, U.; Nopens, I.; Pons, M.; Rosen, C.; Steyer, J.;Vanrolleghem, P. Benchmark Simulation Model no. 2 (BSM2). In Technical Report 3, IWA Taskgroup onBenchmarking of Control Strategies for WWTPs; International Water Association: London, UK, 2018.
21. Alex, J.; Benedetti, L.; Copp, J.; Gernaey, J.; Jeppsson, U.; Nopens, I.; Pons, M.; Rieger, L.; Rosen, C.;Steyer, J.; et al. Benchmark Simulation Model no. 1 (BSM1). In Technical Report 1, IWA Taskgroup onBenchmarking of Control Strategies for WWTPs; Dpt. of Industrial Electrical Engineering and Automation,Lund University: Lund, Sweden, 2008.
22. Torregrossa, D.; Schutz, G.; Cornelissen, A.; Hernández-Sancho, F.; Hansen, J. Energy saving in WWTP:Daily benchmarking under uncertainty and data availability limitations. Environ. Res. 2016, 148, 330–337.[CrossRef]
23. Longo, S.; d’Antoni, B.M.; Bongards, M.; Chaparro, A.; Cronrath, A.; Fatone, F.; Lema, J.M.; Mauricio-Iglesias, M.;Soares, A.; Hospido, A. Monitoring and diagnosis of energy consumption in wastewater treatment plants. Astate of the art and proposals for improvement. Appl. Energy 2016, 179, 1251–1268. [CrossRef]
24. Amand, L.; Olsson, G.; Carlsson, B. Aeration control-a review. Water Sci. Technol. 2013, 67, 2374–2398.[CrossRef] [PubMed]
25. Olsson, G. ICA and me a subjective review. Water Res. 2012, 46, 1585–1624. [CrossRef] [PubMed]26. O’Brien, M.; Mack, J.; Lennox, B.; Lovett, D.; Wall, A. Model predictive control of an activated sludge process:
A case study. Control. Eng. Pract. 2011, 19, 54–61. [CrossRef]27. Leiv Rieger, Imre Takács, H.S. Improving Nutrient Removal While Reducing Carbon Footprint at Three
Swiss WWTPs Thanks to Advanced Control. Water Environ. Res. 2012, 84, 170–188. [CrossRef]28. Mulas, M.; Tronci, S.; Corona, F.; Haimi, H.; Lindell, P.; Heinonen, M.; Vahala, R.; Baratti, R. An application of
predictive control to the Viikinmäki wastewater treatment plant. IFAC Proc. Vol. 2013, 46, 18–23. [CrossRef]29. Drewnowski, J. Advanced Supervisory Control System Implemented at Full-Scale WWTP—A Case Study of
Optimization and Energy Balance Improvement. Water 2019, 11, 1218. [CrossRef]30. Torregrossa, D.; Castellet-Viciano, L.; Hernández-Sancho, F. A data analysis approach to evaluate the impact
of the capacity utilization on the energy consumption of wastewater treatment plants. Sustain. Cities Soc.2019, 45, 307–313. [CrossRef]
31. Revollar, S.; Vilanova, R.; Francisco, M.; Vega, P. PI Dissolved Oxygen control in wastewater treatment plantsfor plantwide nitrogen removal efficiency. IFAC-PapersOnLine 2018, 51, 450–455. [CrossRef]
32. Revollar, S.; Vega, P.; Francisco, M.; Vilanova, R. A hierachical Plant wide operation in wastewater treatmentplants: Overall efficiency index control and event-based reference management. In Proceedings of the2018 22nd International Conference on System Theory, Control and Computing (ICSTCC), Sinaia, Romania,10–12 October 2018; pp. 201–206.
33. Jeppsson, U.; Pons, M.N.; Nopens, I.; Alex, J.; Copp, J.; Gernaey, K.; Rosen, C.; Steyer, J.P.; Vanrolleghem, P.Benchmark Simulation Model No 2: General protocol and exploratory case studies. Water Sci. Technol. 2007,56, 67–78. [CrossRef]

Sustainability 2020, 12, 768 28 of 28
34. Nopens, I.; Benedetti, L.; Jeppsson, U.; Pons, M.N.; Alex, J.; Copp, J.B.; Gernaey, K.V.; Rosen, C.; Steyer, J.P.;Vanrolleghem, P.A. Benchmark Simulation Model No 2: Finalisation of plant layout and default controlstrategy. Water Sci. Technol. 2010, 62, 1967–1974. [CrossRef] [PubMed]
35. Henze, M.; Grady, C.; Gujer, W.; Marais, G.; Matsuo, T. Activated Sludge Model 1. In IAWQ Scientific andTechnical Report 1; IAWQ: London, UK, 1987.
36. Takács, I.; Patry, G.; Nolasco, D. A dynamic model of the clarification-thickening process. Water Res. 1991,25, 1263–1271. [CrossRef]
37. Batstone, D.; Keller, J.; Angelidaki, R.; Kalyuzhnyi, S.; Pavlostathis, S.; Rozzi, A.; Sanders, W.; Siegrist, H.;Vavilin, V. Anaerobic Digestion Model No.1, STR No.13; IWA Publishing: London, UK, 2002.
38. Gernaey, K.V.; Flores-Alsina, X.; Rosen, C.; Benedetti, L.; Jeppsson, U. Dynamic Influent Pollutant DisturbanceScenario Generation Using a Phenomenological Modelling Approach. Environ. Model. Softw. 2011, 26, 1255–1267.[CrossRef]
39. Makinia, J. Mathematical Model and Computer Simulation of Activated Sludge Systems; IWA Publishing: London,UK, 2010.
40. Takacs, I.; Vanrolleghem, P. Elemental Balances in Activated Sludge Modelling; IWA Publishing: London,UK, 2006.
41. Rivera, D.E.; Morari, M.; Skogestad, S. Internal model control: PID controller design. Ind. Eng. Chem. ProcessDes. Dev. 1986, 25, 252–265. [CrossRef]
c© 2020 by the authors. Licensee MDPI, Basel, Switzerland. This article is an open accessarticle distributed under the terms and conditions of the Creative Commons Attribution(CC BY) license (http://creativecommons.org/licenses/by/4.0/).