Intra- and Inter-Pandemic Variations of Antiviral, Antibiotics and Decongestants in Wastewater...
14
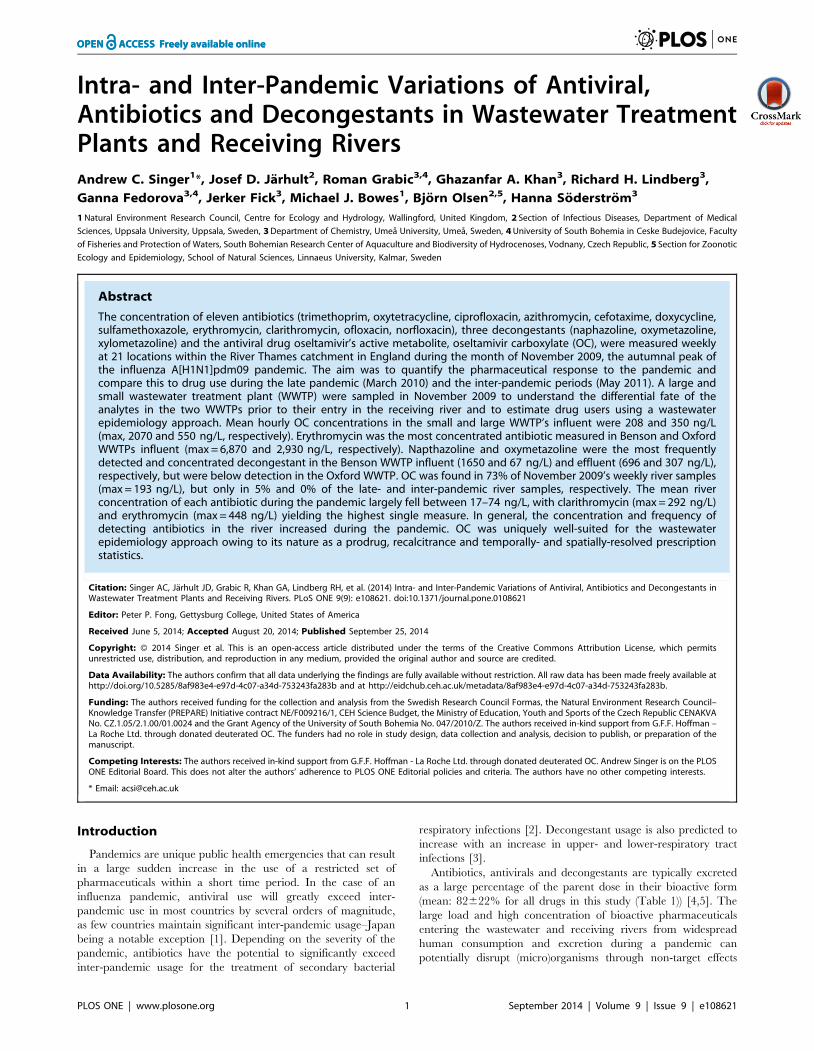
Intra- and Inter-Pandemic Variations of Antiviral, Antibiotics and Decongestants in Wastewater Treatment Plants and Receiving Rivers Andrew C. Singer 1 *, Josef D. Ja ¨ rhult 2 , Roman Grabic 3,4 , Ghazanfar A. Khan 3 , Richard H. Lindberg 3 , Ganna Fedorova 3,4 , Jerker Fick 3 , Michael J. Bowes 1 , Bjo ¨ rn Olsen 2,5 , Hanna So ¨ derstro ¨m 3 1 Natural Environment Research Council, Centre for Ecology and Hydrology, Wallingford, United Kingdom, 2 Section of Infectious Diseases, Department of Medical Sciences, Uppsala University, Uppsala, Sweden, 3 Department of Chemistry, Umea ˚ University, Umea ˚, Sweden, 4 University of South Bohemia in Ceske Budejovice, Faculty of Fisheries and Protection of Waters, South Bohemian Research Center of Aquaculture and Biodiversity of Hydrocenoses, Vodnany, Czech Republic, 5 Section for Zoonotic Ecology and Epidemiology, School of Natural Sciences, Linnaeus University, Kalmar, Sweden Abstract The concentration of eleven antibiotics (trimethoprim, oxytetracycline, ciprofloxacin, azithromycin, cefotaxime, doxycycline, sulfamethoxazole, erythromycin, clarithromycin, ofloxacin, norfloxacin), three decongestants (naphazoline, oxymetazoline, xylometazoline) and the antiviral drug oseltamivir’s active metabolite, oseltamivir carboxylate (OC), were measured weekly at 21 locations within the River Thames catchment in England during the month of November 2009, the autumnal peak of the influenza A[H1N1]pdm09 pandemic. The aim was to quantify the pharmaceutical response to the pandemic and compare this to drug use during the late pandemic (March 2010) and the inter-pandemic periods (May 2011). A large and small wastewater treatment plant (WWTP) were sampled in November 2009 to understand the differential fate of the analytes in the two WWTPs prior to their entry in the receiving river and to estimate drug users using a wastewater epidemiology approach. Mean hourly OC concentrations in the small and large WWTP’s influent were 208 and 350 ng/L (max, 2070 and 550 ng/L, respectively). Erythromycin was the most concentrated antibiotic measured in Benson and Oxford WWTPs influent (max = 6,870 and 2,930 ng/L, respectively). Napthazoline and oxymetazoline were the most frequently detected and concentrated decongestant in the Benson WWTP influent (1650 and 67 ng/L) and effluent (696 and 307 ng/L), respectively, but were below detection in the Oxford WWTP. OC was found in 73% of November 2009’s weekly river samples (max = 193 ng/L), but only in 5% and 0% of the late- and inter-pandemic river samples, respectively. The mean river concentration of each antibiotic during the pandemic largely fell between 17–74 ng/L, with clarithromycin (max = 292 ng/L) and erythromycin (max = 448 ng/L) yielding the highest single measure. In general, the concentration and frequency of detecting antibiotics in the river increased during the pandemic. OC was uniquely well-suited for the wastewater epidemiology approach owing to its nature as a prodrug, recalcitrance and temporally- and spatially-resolved prescription statistics. Citation: Singer AC, Ja ¨rhult JD, Grabic R, Khan GA, Lindberg RH, et al. (2014) Intra- and Inter-Pandemic Variations of Antiviral, Antibiotics and Decongestants in Wastewater Treatment Plants and Receiving Rivers. PLoS ONE 9(9): e108621. doi:10.1371/journal.pone.0108621 Editor: Peter P. Fong, Gettysburg College, United States of America Received June 5, 2014; Accepted August 20, 2014; Published September 25, 2014 Copyright: ß 2014 Singer et al. This is an open-access article distributed under the terms of the Creative Commons Attribution License, which permits unrestricted use, distribution, and reproduction in any medium, provided the original author and source are credited. Data Availability: The authors confirm that all data underlying the findings are fully available without restriction. All raw data has been made freely available at http://doi.org/10.5285/8af983e4-e97d-4c07-a34d-753243fa283b and at http://eidchub.ceh.ac.uk/metadata/8af983e4-e97d-4c07-a34d-753243fa283b. Funding: The authors received funding for the collection and analysis from the Swedish Research Council Formas, the Natural Environment Research Council– Knowledge Transfer (PREPARE) Initiative contract NE/F009216/1, CEH Science Budget, the Ministry of Education, Youth and Sports of the Czech Republic CENAKVA No. CZ.1.05/2.1.00/01.0024 and the Grant Agency of the University of South Bohemia No. 047/2010/Z. The authors received in-kind support from G.F.F. Hoffman – La Roche Ltd. through donated deuterated OC. The funders had no role in study design, data collection and analysis, decision to publish, or preparation of the manuscript. Competing Interests: The authors received in-kind support from G.F.F. Hoffman - La Roche Ltd. through donated deuterated OC. Andrew Singer is on the PLOS ONE Editorial Board. This does not alter the authors’ adherence to PLOS ONE Editorial policies and criteria. The authors have no other competing interests. * Email: [email protected] Introduction Pandemics are unique public health emergencies that can result in a large sudden increase in the use of a restricted set of pharmaceuticals within a short time period. In the case of an influenza pandemic, antiviral use will greatly exceed inter- pandemic use in most countries by several orders of magnitude, as few countries maintain significant inter-pandemic usage–Japan being a notable exception [1]. Depending on the severity of the pandemic, antibiotics have the potential to significantly exceed inter-pandemic usage for the treatment of secondary bacterial respiratory infections [2]. Decongestant usage is also predicted to increase with an increase in upper- and lower-respiratory tract infections [3]. Antibiotics, antivirals and decongestants are typically excreted as a large percentage of the parent dose in their bioactive form (mean: 82622% for all drugs in this study (Table 1)) [4,5]. The large load and high concentration of bioactive pharmaceuticals entering the wastewater and receiving rivers from widespread human consumption and excretion during a pandemic can potentially disrupt (micro)organisms through non-target effects PLOS ONE | www.plosone.org 1 September 2014 | Volume 9 | Issue 9 | e108621
Transcript of Intra- and Inter-Pandemic Variations of Antiviral, Antibiotics and Decongestants in Wastewater...
Intra- and Inter-Pandemic Variations of Antiviral,Antibiotics and Decongestants in Wastewater TreatmentPlants and Receiving RiversAndrew C. Singer1*, Josef D. Jarhult2, Roman Grabic3,4, Ghazanfar A. Khan3, Richard H. Lindberg3,
Ganna Fedorova3,4, Jerker Fick3, Michael J. Bowes1, Bjorn Olsen2,5, Hanna Soderstrom3
1 Natural Environment Research Council, Centre for Ecology and Hydrology, Wallingford, United Kingdom, 2 Section of Infectious Diseases, Department of Medical
Sciences, Uppsala University, Uppsala, Sweden, 3 Department of Chemistry, Umea University, Umea, Sweden, 4 University of South Bohemia in Ceske Budejovice, Faculty
of Fisheries and Protection of Waters, South Bohemian Research Center of Aquaculture and Biodiversity of Hydrocenoses, Vodnany, Czech Republic, 5 Section for Zoonotic
Ecology and Epidemiology, School of Natural Sciences, Linnaeus University, Kalmar, Sweden
Abstract
The concentration of eleven antibiotics (trimethoprim, oxytetracycline, ciprofloxacin, azithromycin, cefotaxime, doxycycline,sulfamethoxazole, erythromycin, clarithromycin, ofloxacin, norfloxacin), three decongestants (naphazoline, oxymetazoline,xylometazoline) and the antiviral drug oseltamivir’s active metabolite, oseltamivir carboxylate (OC), were measured weeklyat 21 locations within the River Thames catchment in England during the month of November 2009, the autumnal peak ofthe influenza A[H1N1]pdm09 pandemic. The aim was to quantify the pharmaceutical response to the pandemic andcompare this to drug use during the late pandemic (March 2010) and the inter-pandemic periods (May 2011). A large andsmall wastewater treatment plant (WWTP) were sampled in November 2009 to understand the differential fate of theanalytes in the two WWTPs prior to their entry in the receiving river and to estimate drug users using a wastewaterepidemiology approach. Mean hourly OC concentrations in the small and large WWTP’s influent were 208 and 350 ng/L(max, 2070 and 550 ng/L, respectively). Erythromycin was the most concentrated antibiotic measured in Benson and OxfordWWTPs influent (max = 6,870 and 2,930 ng/L, respectively). Napthazoline and oxymetazoline were the most frequentlydetected and concentrated decongestant in the Benson WWTP influent (1650 and 67 ng/L) and effluent (696 and 307 ng/L),respectively, but were below detection in the Oxford WWTP. OC was found in 73% of November 2009’s weekly river samples(max = 193 ng/L), but only in 5% and 0% of the late- and inter-pandemic river samples, respectively. The mean riverconcentration of each antibiotic during the pandemic largely fell between 17–74 ng/L, with clarithromycin (max = 292 ng/L)and erythromycin (max = 448 ng/L) yielding the highest single measure. In general, the concentration and frequency ofdetecting antibiotics in the river increased during the pandemic. OC was uniquely well-suited for the wastewaterepidemiology approach owing to its nature as a prodrug, recalcitrance and temporally- and spatially-resolved prescriptionstatistics.
Citation: Singer AC, Jarhult JD, Grabic R, Khan GA, Lindberg RH, et al. (2014) Intra- and Inter-Pandemic Variations of Antiviral, Antibiotics and Decongestants inWastewater Treatment Plants and Receiving Rivers. PLoS ONE 9(9): e108621. doi:10.1371/journal.pone.0108621
Editor: Peter P. Fong, Gettysburg College, United States of America
Received June 5, 2014; Accepted August 20, 2014; Published September 25, 2014
Copyright: � 2014 Singer et al. This is an open-access article distributed under the terms of the Creative Commons Attribution License, which permitsunrestricted use, distribution, and reproduction in any medium, provided the original author and source are credited.
Data Availability: The authors confirm that all data underlying the findings are fully available without restriction. All raw data has been made freely available athttp://doi.org/10.5285/8af983e4-e97d-4c07-a34d-753243fa283b and at http://eidchub.ceh.ac.uk/metadata/8af983e4-e97d-4c07-a34d-753243fa283b.
Funding: The authors received funding for the collection and analysis from the Swedish Research Council Formas, the Natural Environment Research Council–Knowledge Transfer (PREPARE) Initiative contract NE/F009216/1, CEH Science Budget, the Ministry of Education, Youth and Sports of the Czech Republic CENAKVANo. CZ.1.05/2.1.00/01.0024 and the Grant Agency of the University of South Bohemia No. 047/2010/Z. The authors received in-kind support from G.F.F. Hoffman –La Roche Ltd. through donated deuterated OC. The funders had no role in study design, data collection and analysis, decision to publish, or preparation of themanuscript.
Competing Interests: The authors received in-kind support from G.F.F. Hoffman - La Roche Ltd. through donated deuterated OC. Andrew Singer is on the PLOSONE Editorial Board. This does not alter the authors’ adherence to PLOS ONE Editorial policies and criteria. The authors have no other competing interests.
* Email: [email protected]
Introduction
Pandemics are unique public health emergencies that can result
in a large sudden increase in the use of a restricted set of
pharmaceuticals within a short time period. In the case of an
influenza pandemic, antiviral use will greatly exceed inter-
pandemic use in most countries by several orders of magnitude,
as few countries maintain significant inter-pandemic usage–Japan
being a notable exception [1]. Depending on the severity of the
pandemic, antibiotics have the potential to significantly exceed
inter-pandemic usage for the treatment of secondary bacterial
respiratory infections [2]. Decongestant usage is also predicted to
increase with an increase in upper- and lower-respiratory tract
infections [3].
Antibiotics, antivirals and decongestants are typically excreted
as a large percentage of the parent dose in their bioactive form
(mean: 82622% for all drugs in this study (Table 1)) [4,5]. The
large load and high concentration of bioactive pharmaceuticals
entering the wastewater and receiving rivers from widespread
human consumption and excretion during a pandemic can
potentially disrupt (micro)organisms through non-target effects
PLOS ONE | www.plosone.org 1 September 2014 | Volume 9 | Issue 9 | e108621
[6–12] and cause the failure of wastewater treatment plants
(WWTPs) to treat effluent to the required standard [13,14], hasten
the generation of antiviral resistance in wildfowl and other
influenza-susceptible organisms [15–18], and accelerate the
generation and spread of (novel) antibiotic resistance in the
environment [2,19,20].
In this study, we measured eleven antibiotics, one antiviral and
three decongestants (see Table 1) weekly at 21 locations within the
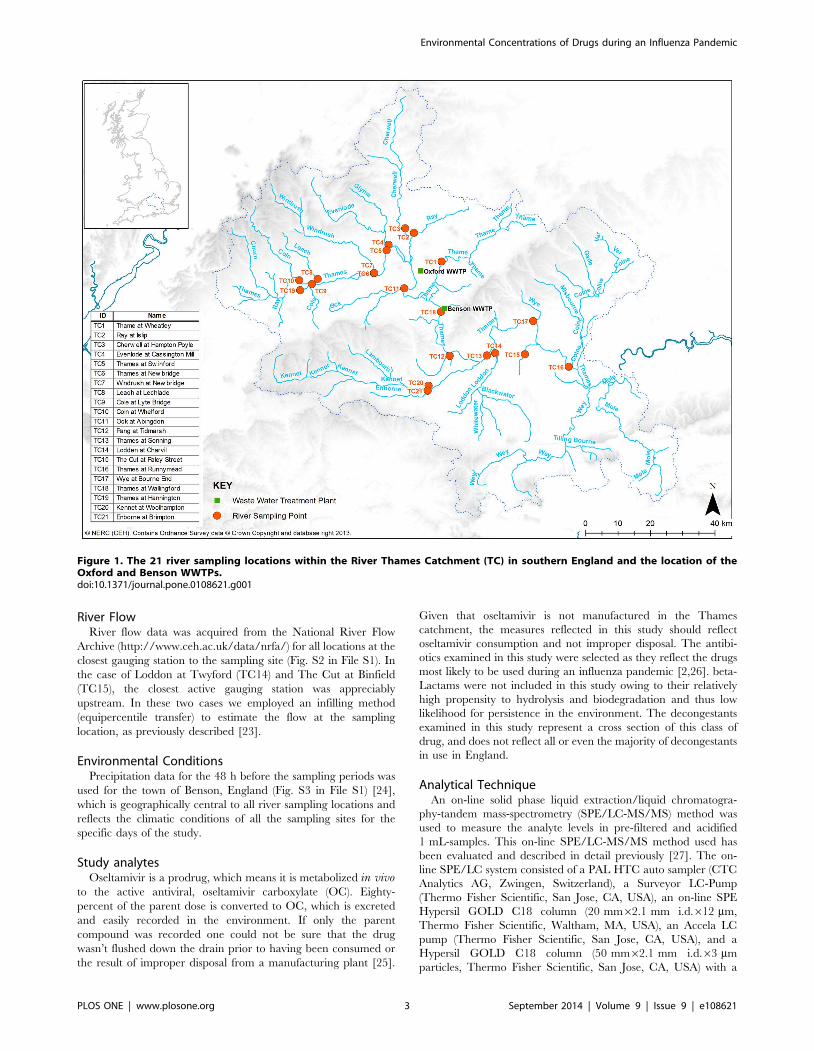
River Thames catchment (Fig. 1) in England during the month of
November 2009, the autumnal peak of the influenza
A[H1N1]pdm09 pandemic. The aim was to quantify the
pharmaceutical response to the pandemic and compare this to
drug use during the late pandemic (March 2010) and the inter-
pandemic periods (May 2011). One relatively large wastewater
treatment plant (WWTP) in Oxford, UK employing activated
sludge wastewater treatment and one relatively small WWTP in
Benson, UK, employing trickle-bed wastewater treatment were
sampled hourly for 24-h in November 2009 to 1) understand the
differential pharmaceutical use patterns among the people within
the WWTP catchments during the pandemic, 2) characterize the
fate of the analytes in the two very different WWTPs prior to their
entry in the receiving River Thames, and 3) examine the suitability
of employing a wastewater epidemiology approach for the
estimation of drug users within the Oxford and Benson WWTP
populations.
Experimental Section
Wastewater Treatment Plant CharacterisationThe Benson WWTP serves a population of 6,230 people with a
consented dry weather flow (DWF) of 2,517 m3/d and an annual
average DWF of 1,368 m3/d (Fig. 1 and Fig. S1 in File S1). The
Benson WWTP has a hydraulic retention time of 7–8 h at DWF
and consists of trickling filters as the main biological treatment
step. Oxford WWTP serves a population of 208,000 with a
consented DWF of 50,965 m3/d and an annual mean DWF of
38,000 m3/d (Fig. 1 and Fig. S1 in File S1). The Oxford WWTP
has a hydraulic retention time of 15–18 h, and utilizes activated
sludge as the main biological treatment step. Both WWTPs have
primary and secondary sedimentation steps. Both Oxford and
Benson WWTPs feed into the main stem of the River Thames
(Fig. 1), separated by approximately 10 miles.
Wastewater Treatment Plant SamplingThe sampling of all analytes (Table 1) in Benson and Oxford
WWTP was performed during a 24-hour period spanning 10–11
November 2009. An additional 24-h sampling was initiated on
May 11, 2011 from only the Benson WWTP effluent for the
primary purpose of confirming the background concentration of
the antiviral, oseltamivir carboxylate (OC), during the inter-
pandemic period. The pandemic officially ended on August 10,
2010, hence, the expectation was that pharmaceutical use in the
study catchments in May 2011 would reflect inter-pandemic
pharmaceutical usage [21]. An automated sampler was used to
recover time-proportional samples (approximately 750 ml) of
influent and effluent every hour for 24 hours. Samples were
aliquoted into triplicate 50-ml borosilicate glass vials with PTFE-
lined caps and immediately stored at 280uC until analysis.
River SamplingGrab samples were acquired within 250 ml borosilicate brown
glass bottles at the end of a 1.5 m-long sampling rod at 21 river
locations within the River Thames catchment (Fig. 1). Sampling
was undertaken on November 3, 11, 17, and 24, 2009, as well as
on March 15, 2010 (late-pandemic period) and May 11, 2011
(inter-pandemic period). These sites are part of the CEH Thames
Initiative Research Platform [22]. Samples were transported from
the field to the laboratory within 6 hours and transferred into 50-
ml borosilicate glass vials with PTFE-lined caps, in triplicate. The
samples were stored at 280uC until analysis.
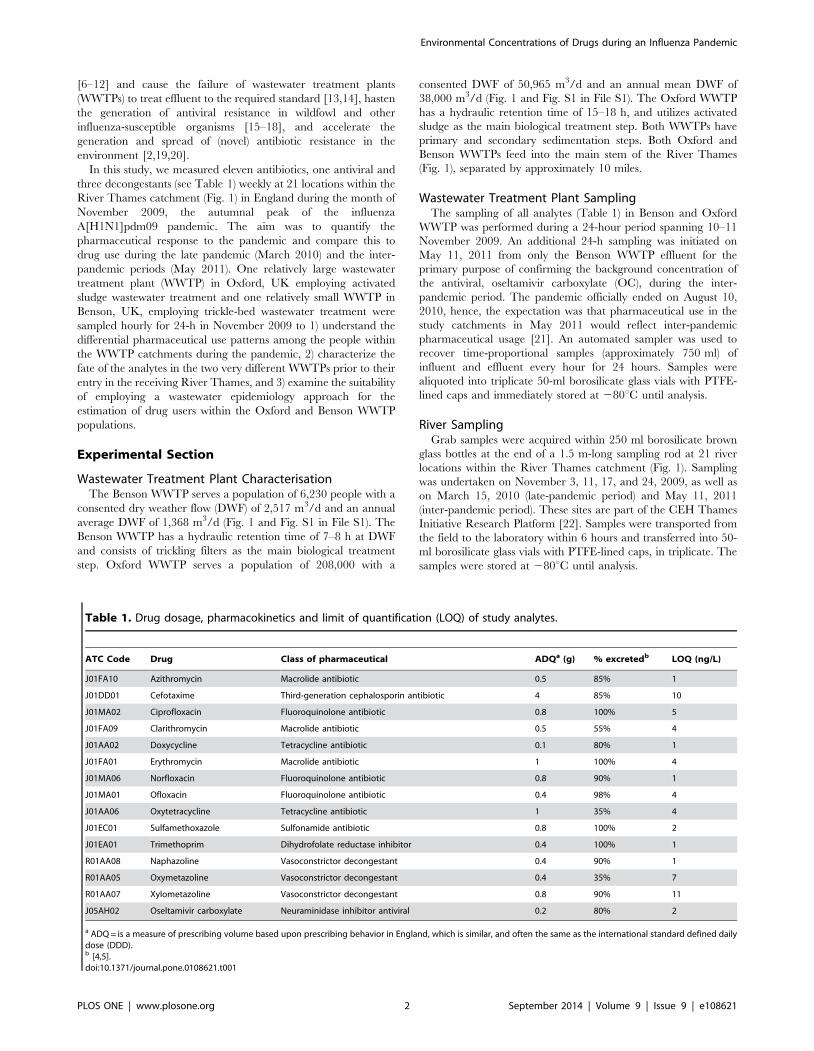
Table 1. Drug dosage, pharmacokinetics and limit of quantification (LOQ) of study analytes.
ATC Code Drug Class of pharmaceutical ADQa (g) % excretedb LOQ (ng/L)
J01FA10 Azithromycin Macrolide antibiotic 0.5 85% 1
J01DD01 Cefotaxime Third-generation cephalosporin antibiotic 4 85% 10
J01MA02 Ciprofloxacin Fluoroquinolone antibiotic 0.8 100% 5
J01FA09 Clarithromycin Macrolide antibiotic 0.5 55% 4
J01AA02 Doxycycline Tetracycline antibiotic 0.1 80% 1
J01FA01 Erythromycin Macrolide antibiotic 1 100% 4
J01MA06 Norfloxacin Fluoroquinolone antibiotic 0.8 90% 1
J01MA01 Ofloxacin Fluoroquinolone antibiotic 0.4 98% 4
J01AA06 Oxytetracycline Tetracycline antibiotic 1 35% 4
J01EC01 Sulfamethoxazole Sulfonamide antibiotic 0.8 100% 2
J01EA01 Trimethoprim Dihydrofolate reductase inhibitor 0.4 100% 1
R01AA08 Naphazoline Vasoconstrictor decongestant 0.4 90% 1
R01AA05 Oxymetazoline Vasoconstrictor decongestant 0.4 35% 7
R01AA07 Xylometazoline Vasoconstrictor decongestant 0.8 90% 11
J05AH02 Oseltamivir carboxylate Neuraminidase inhibitor antiviral 0.2 80% 2
a ADQ = is a measure of prescribing volume based upon prescribing behavior in England, which is similar, and often the same as the international standard defined dailydose (DDD).b [4,5].doi:10.1371/journal.pone.0108621.t001
Environmental Concentrations of Drugs during an Influenza Pandemic
PLOS ONE | www.plosone.org 2 September 2014 | Volume 9 | Issue 9 | e108621
River FlowRiver flow data was acquired from the National River Flow
Archive (http://www.ceh.ac.uk/data/nrfa/) for all locations at the
closest gauging station to the sampling site (Fig. S2 in File S1). In
the case of Loddon at Twyford (TC14) and The Cut at Binfield
(TC15), the closest active gauging station was appreciably
upstream. In these two cases we employed an infilling method
(equipercentile transfer) to estimate the flow at the sampling
location, as previously described [23].
Environmental ConditionsPrecipitation data for the 48 h before the sampling periods was
used for the town of Benson, England (Fig. S3 in File S1) [24],
which is geographically central to all river sampling locations and
reflects the climatic conditions of all the sampling sites for the
specific days of the study.
Study analytesOseltamivir is a prodrug, which means it is metabolized in vivo
to the active antiviral, oseltamivir carboxylate (OC). Eighty-
percent of the parent dose is converted to OC, which is excreted
and easily recorded in the environment. If only the parent
compound was recorded one could not be sure that the drug
wasn’t flushed down the drain prior to having been consumed or
the result of improper disposal from a manufacturing plant [25].
Given that oseltamivir is not manufactured in the Thames
catchment, the measures reflected in this study should reflect
oseltamivir consumption and not improper disposal. The antibi-
otics examined in this study were selected as they reflect the drugs
most likely to be used during an influenza pandemic [2,26]. beta-
Lactams were not included in this study owing to their relatively
high propensity to hydrolysis and biodegradation and thus low
likelihood for persistence in the environment. The decongestants
examined in this study represent a cross section of this class of
drug, and does not reflect all or even the majority of decongestants
in use in England.
Analytical TechniqueAn on-line solid phase liquid extraction/liquid chromatogra-
phy-tandem mass-spectrometry (SPE/LC-MS/MS) method was
used to measure the analyte levels in pre-filtered and acidified
1 mL-samples. This on-line SPE/LC-MS/MS method used has
been evaluated and described in detail previously [27]. The on-
line SPE/LC system consisted of a PAL HTC auto sampler (CTC
Analytics AG, Zwingen, Switzerland), a Surveyor LC-Pump
(Thermo Fisher Scientific, San Jose, CA, USA), an on-line SPE
Hypersil GOLD C18 column (20 mm62.1 mm i.d.612 mm,
Thermo Fisher Scientific, Waltham, MA, USA), an Accela LC
pump (Thermo Fisher Scientific, San Jose, CA, USA), and a
Hypersil GOLD C18 column (50 mm62.1 mm i.d.63 mm
particles, Thermo Fisher Scientific, San Jose, CA, USA) with a
Figure 1. The 21 river sampling locations within the River Thames Catchment (TC) in southern England and the location of theOxford and Benson WWTPs.doi:10.1371/journal.pone.0108621.g001
Environmental Concentrations of Drugs during an Influenza Pandemic
PLOS ONE | www.plosone.org 3 September 2014 | Volume 9 | Issue 9 | e108621
guard C18 column (2 mm62 mm i.d.63 mm particles, Thermo
Fisher Scientific, San Jose, CA, USA). The liquid chromatography
system was coupled to a heated electrospray ionization (HESI)
source and a Quantum Ultra triple quadrupole mass spectrometer
made by Thermo Fisher Scientific (Waltham, MA). The MS/MS
parameters used are described in Table S3 in File S1. The
following internal standards were obtained from Cambridge
Isotope Laboratories (Andover, MA, USA): 13C2-Trimethoprim
(13C2-TRI) (99%), 13C315N–Ciprofloxacin (13C3-CIP) (99%),13C2-Erythromycin (13C2-ERY) and 13C6-Sulphamethoxazole
(13C6-SUL). Oseltamivir carboxylate labeled with deuterium
(OCD3) (RO0604802-004; lot: 511-001-2197/4) was obtained
from Roche (F. Hoffmann-La Roche Ltd., Basel, Switzerland).
Fate in the WWTPs and the Thames RiverCatchment-Calculating WWTP and River Load andPercent Loss in WWTP
Pharmaceutical concentrations were converted to mass loading
using hourly WWTP (Fig. S1 in File S1) and river flows for the
sampling period. Percent loss of analytes between WWTP influent
and effluent as a result of biodegradation and sorption was
calculated from the change in 24-h load of each analyte between
the two sampling locations. As the influent and effluent samples
were acquired simultaneously, the calculated ‘percent loss’
assumes negligible change in drug use between the Monday and
Tuesday during which the samples were acquired and a negligible
change in hydraulic retention time. Resulting from such assump-
tions, the interpretations of the recalcitrance of analytes were
considered with caution.
Wastewater Epidemiology-Forward-CalculatingEnvironmental Concentrations of Antibiotics fromPrescription Statistics
The National Health Service Business Services Authority (NHS
BSA) annual antibiotic prescriptions for England [28] was used for
estimating ‘background’ pharmaceutical use for the population
residing within the two study WWTP catchments in 2009. NHS
BSA data are resolved at the national level and reflect annual
prescription rates (Table S1 in File S1). More spatially resolved
data was acquired from the four Primary Care Trust (PCT) [29]
hospitals and clinics serving the Oxford and Benson WWTP
catchments, however, this level of detail was only available from
November 2011. To assess the value of this data as a proxy for
‘background’ antibiotic use in November, we examined total
antibacterial use in general practice in England since 2007. There
was a ,1% change in total antibiotic prescriptions per year with
the exception of penicillin where an increase of approximately 5%
was seen between 2007–2011 [28]. As penicillins were not
monitored in this study, we argue that the November 2011 data
might serve as an adequate proxy for ‘background’ antibiotics
prescribed during the study period. A large fluctuation from this
‘background’ usage might be indicative of pandemic-linked usage.
The National Pandemic Flu Service (NPFS) [30] recorded
approximately 66,218 courses of Oseltamivir dispensed in Week
43 in 2009, representing 0.13% of the population of England, and
6% of all antivirals dispensed during the pandemic [30]. The
national peak for the autumnal wave of the influenza pandemic
was 3 weeks prior to the WWTP sampling on 10–11 November
[30]. The antiviral prescription rate did not rapidly decline after
the peak (see Fig. 15 in [30]), suggesting that the peak antiviral
prescription rate of 0.13% might be a good proxy for antiviral use
during the sampling period. The standard adult Oseltamivir
dosing regime was assumed: 0.075 g per dose, consumed twice per
day (0.150 g/d).
An additional dataset produced by the HPA’s QSurveillance
National Syndromic Surveillance System [31], was examined for
estimating Oseltamivir prescription rates. The HPA dataset
reports 54.2 people per 100,000 with influenza-like illness (ILI)
in the Oxfordshire PCT during the week of WWTP sampling (i.e.,
Week 46), which was used for modelling purposes. However, the
ILI reporting rate declined during November from Week 46 to
Week 49, which reached as low as 33 per 100,000 [31].
We provide a general model for calculating the concentration of
pharmaceuticals (ng/L) in wastewater influent (Cw) using the
different data sources discussed above:
Cw~M:E:F
P:L
� �:109 ð1Þ
where the product of the population of each WWTP catchment (P)
and the volume of wastewater per person (L; 230 L/capita/d [2])
was divided into the product of the mass of prescriptions (M) in
grams acquired from Average Daily Quantity (ADQ) conversions
(Table 1 and S1) [32], mass of parent compound excreted in its
parent form (E) in grams, and correction factor (F) for adjusting for
when the population served by a PCT is served by more than one
WWTP.
When deriving the mass of drug prescribed using NHS BSA
statistics, M = Ma+Ms, where Ma was the annual mass (g) of
pharmaceutical prescribed (Table S1 in File S1) and Ms reflected
the additional mass of drug used (g) in the winter in excess of the
average monthly usage (Table S1 in File S1). Hence,
Ms = (Ma60.09375), where 0.9375 is the additional fraction of
drug used in the winter as compared to the annual mean (i.e., Ma/
12). This adjustment was performed because it is known that the
mean variation in antibiotic consumption between the summer
and winter period in the UK was approximately 18.75% in 2005
[33]. Hence, the annual prescription rate provided by the NHS
BSA was increased by 9.375% from the annual mean prescription
rate (i.e., reflecting 50% of the total seasonal variability between
summer and winter). Differences in pharmacokinetics were
accounted for using factor E, which reflects the fraction of parent
chemical excreted into wastewater (Table 1) [4].
The patient population of the PCT serving Benson is served by
two different WWTPs at Benson and Cholsey. This difference
between the population served by a PCT and the WWTP
catchment were accounted for by factor F, where F = 0.389,
resulting from the ratio of the population served by the Benson
WWTP (6230) to the patient population of the local PCT (16,000).
However, F = 1 for the Oxford WWTP as it was assumed that the
populations served by the PCT in Oxford all fed into the Oxford
WWTP. Lastly, F = 1 for all NHSBSA statistics, as the NHSBSA
dataset used a national average prescription rate and was not
stratified to the local level.
Notably, trimethoprim and sulfamethoxazole are routinely
dispensed as a mixture, co-trimoxazole. Use of these drugs was
calculated assuming one ADQ of co-trimoxazole contained 0.16 g
of trimethoprim and 0.8 g of sulfamethoxazole.
All raw data has been made freely available at http://doi.org/
10/t2x.
Results
PharmaceuticalFate in Benson and Oxford WWTPsAntiviral in Benson WWTP. The concentration of OC in
the influent on 10–11 November, 2009, ranged from ,limit of
Environmental Concentrations of Drugs during an Influenza Pandemic
PLOS ONE | www.plosone.org 4 September 2014 | Volume 9 | Issue 9 | e108621
Ta
ble
2.
Me
anco
nce
ntr
atio
nan
dlo
ado
fp
har
mac
eu
tica
lsm
eas
ure
dw
ith
inth
eB
en
son
and
Oxf
ord
WW
TP
on
No
vem
be
r1
0–
11
,2
00
9(n
=2
4).
Ox
ford
Be
nso
n
Lo
ad
(mg
/d)
Lo
ad
(mg
/d)
Me
an
con
cen
tra
tio
n(n
g/L
)aM
ea
nco
nce
ntr
ati
on
(ng
/L)
Inle
tO
utl
et
%L
oss
bIn
let
Ou
tle
t%
Lo
ss
An
tib
ioti
c
47
80
49
23
2.3
21
.8
Azi
thro
myc
in1
636
96
306
69
0%
406
20
346
10
32
%
11
66
.80
Ce
fota
xim
e,
LOQ
51
,1
86
7,
LOQ
.9
9%
57
30
01
84
02
21
1.2
Cip
rofl
oxa
cin
10
906
30
05
26
50
97
%2
006
30
31
46
39
9%
27
80
02
59
04
3.7
27
.3
Cla
rith
rom
ycin
52
46
17
99
26
27
91
%6
16
62
506
21
38
%
32
30
62
70
41
45
7.9
Do
xycy
clin
e6
06
43
12
16
83
–9
4%
34
56
44
46
76
15
08
6%
69
50
09
44
08
47
23
4
Eryt
hro
myc
in1
33
06
56
02
366
40
86
%9
546
16
10
24
46
83
72
%
96
80
33
23
71
3.6
No
rflo
xaci
n1
846
80
216
19
7%
596
26
256
56
3%
42
60
47
21
46
29
.68
Ofl
oxa
cin
816
26
236
88
9%
23
206
33
40
19
59
9%
56
10
06
97
23
65
1.3
Oxy
tetr
acyc
line
10
906
22
92
96
16
99
%1
716
40
01
746
83
78
%
89
60
29
70
75
.63
2.7
Sulf
ame
tho
xazo
le1
696
28
676
18
67
%5
76
11
83
46
65
7%
35
50
38
40
31
24
9.0
Tri
me
top
rim
706
14
736
7–
8%
33
26
19
06
86
66
84
%
De
con
ge
stan
t
14
60
69
.2
Nap
haz
olin
e,
LOQ
,LO
Qn
a1
65
06
77
56
966
98
19
5%
65
.84
31
72
Oxy
me
tazo
line
,LO
Q1
66
1n
a6
76
61
30
76
11
0–
29
9%
28
.06
.82
Xyl
om
eta
zolin
e,
LOQ
15
na
136
11
,LO
Qn
a
An
tivi
ral
18
60
01
89
00
41
02
06
Environmental Concentrations of Drugs during an Influenza Pandemic
PLOS ONE | www.plosone.org 5 September 2014 | Volume 9 | Issue 9 | e108621
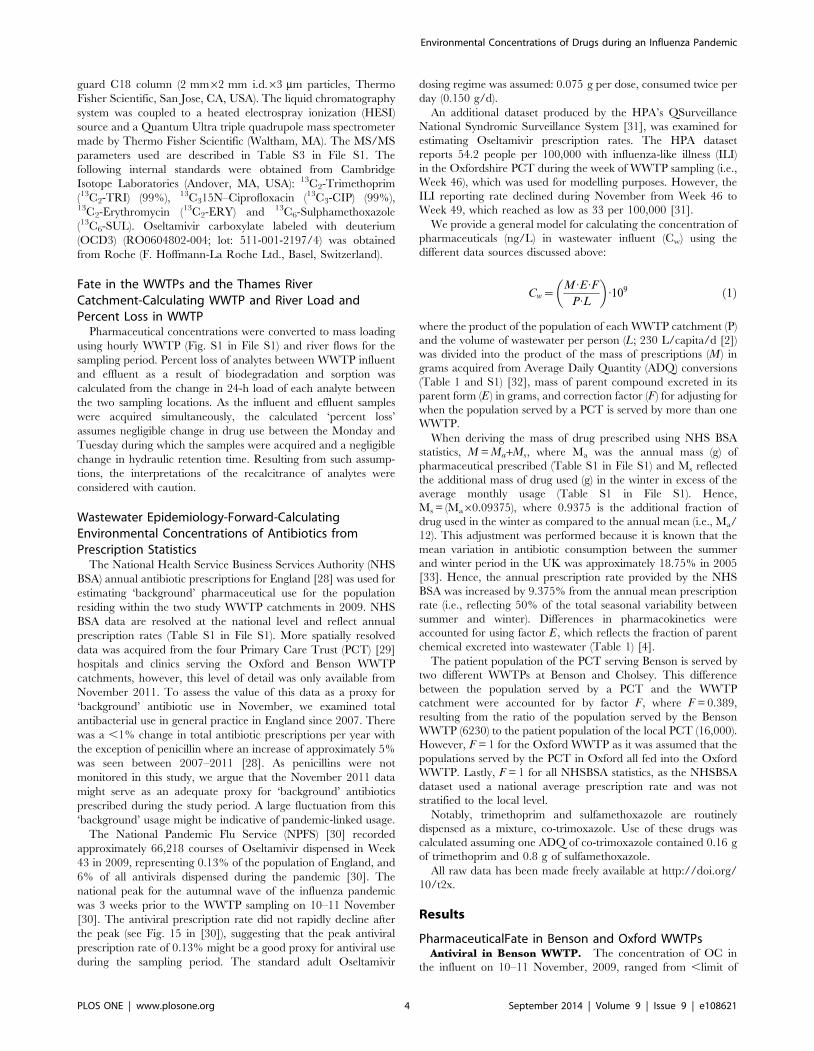
quantification (LOQ; 1–11 ng/L, see Table 1) to 2070 ng/L
(Table 2), with 18 of the 24 measures above the LOQ (Fig. S4 in
File S1). The mean hourly concentration (for samples .LOQ),
was 4336472 ng/L. The 24-h load was 410 mg/d, reaching a
maximum load of 133 mg/h at the 18:00 sampling point, equating
to 66 mg OC/capita/d.
The concentration of OC in the effluent ranged from ,LOQ to
287 ng/L, with 21 of the 24 measures above the LOQ. The mean
hourly concentration (for samples .LOQ), was 208640 ng/L.
The 24-h load was 206 mg/d, reaching a maximum of 16.9 mg/h
at the 9:00 sampling point. The change in load from the influent to
the effluent was 204 mg/d, a reduction of 50%.
Antiviral in Oxford WWTP. The concentration of OC in
the influent on 10–11 November, 2009, ranged from 257 to
550 ng/L (Table 2), with all measures above the LOQ. The mean
hourly concentration was 350659 ng/L. The 24-h load was
18,600 mg/d, equating to 89 mg OC/capita/d reaching a
maximum load of 1,330 mg/h at the 10:00 sampling point.
The concentration of OC in the effluent ranged from 474 to
1,130 ng/L, with all measures above the LOQ. The mean hourly
concentration was 358660 ng/L. The 24-h load in the effluent
was 18,900 mg/d, reaching a maximum of 1130 mg/h at the 8:00
sampling point. The change in 24-h load from the influent to the
effluent was 2300 mg/d, a trivial increase of 2% in the effluent,
suggestive of a fully conservative chemical.
Antibiotics in Benson WWTP. Erythromycin showed the
highest average antibiotic concentration in the influent, 954 ng/L
(n = 17, 134 mg/capita/d) and effluent 244 ng/L (n = 20, 37 mg/
capita/d; Table 2) and reached as high in concentration as
6,870 ng/L in the influent. Three antibiotics, at least once in the
24-h sampling, exceeded the average inlet concentration of
erythromycin: ofloxacin (max = 11,000 ng/L, 235 mg/cap/d,
n = 12), doxycycline (max = 1,550 ng/L, 66 mg/cap/d, n = 23)
and oxytetracycline (max = 1,700 ng/L, 38 mg/cap/d, n = 20).
Notably, ciprofloxacin was recorded as high as 917 ng/L (35 mg/
cap/d, n = 16) and trimethoprim as high as 780 ng/L (50 mg/cap/
d, n = 21).
With the exception of cefotaxime, which was found in only 7 of
24 samples from Benson influent, all antibiotics were found in at
least half of the 24 samples, with 6 antibiotics found at each of the
24 hourly measurements (Fig. S4 in File S1).
The load of each of the 11 antibiotics in the Benson WWTP
effluent was reduced by 32% to a maximum of 99%+ after
treatment (Table 2), the most persistent being azithromycin (32%
loss, n = 18 and n = 15 for inlet and outlet, respectively) and
clarithromycin (38% loss, n = 13 and n = 11, respectively).
Antibiotics in Oxford WWTP. Erythromycin showed the
highest average antibiotic concentration in the influent (1,330 ng/
L, 341 mg/cap/d, n = 24) and reached a maximum concentration
of 2,930 ng/L (Table 2). Two other antibiotics recorded mean
concentrations in the influent above 1,000 ng/L, oxytetracycline
(1,090 ng/L, 275 mg/cap/d, n = 24) and ciprofloxacin (1,090 ng/
L, 281 mg/cap/d, n = 24). Two antibiotics achieved maximum
concentration that exceeded the average inlet concentration set by
erythromycin: oxytetracycline (1,430 ng/L) and ciprofloxacin
(1,530 ng/L; Table 2). Notably, clarithromycin achieved a max-
imum of 980 ng/L (136 mg/cap/d), much higher than the
maximum in Benson (243 ng/L, 7 mg/cap/d).
With the exception of cefotaxime (0/24), azithromycin (13/24)
and trimethoprim (23/24), all antibiotics were found at each of the
24 hourly measurements from the Oxford influent.
The antibiotic load in the Oxford WWTP effluent was reduced
by 67% to ,LOD after treatment for many antibiotics (Table 2),
however, unlike Benson, several demonstrated persistence and
Ta
ble
2.
Co
nt.
Ox
ford
Be
nso
n
Lo
ad
(mg
/d)
Lo
ad
(mg
/d)
Me
an
con
cen
tra
tio
n(n
g/L
)aM
ea
nco
nce
ntr
ati
on
(ng
/L)
Inle
tO
utl
et
%L
oss
bIn
let
Ou
tle
t%
Lo
ss
Ose
ltam
ivir
35
06
59
35
86
60
–2
%4
336
47
22
086
40
50
%
Pe
rce
nt
loss
calc
ula
ted
fro
mch
ang
ein
dai
lyp
har
mac
eu
tica
llo
adb
etw
ee
nth
ein
flu
en
tan
de
fflu
en
t.a
Me
anco
nce
ntr
atio
ns
are
follo
we
db
yst
and
ard
de
viat
ion
for
all
sam
ple
s.
LOQ
du
rin
gth
e2
4-h
ou
rsa
mp
ling
.b
Ne
gat
ive
valu
es
ind
icat
ea
con
cen
trat
ion
incr
eas
efr
om
inle
tto
ou
tle
t.‘,
’is
use
dto
ind
icat
eco
nce
ntr
atio
nw
he
reth
ein
flu
en
tw
asb
elo
wth
eLO
Qw
hile
the
eff
lue
nt
was
.LO
Q.
na
=n
ot
app
licab
le.
do
i:10
.13
71
/jo
urn
al.p
on
e.0
10
86
21
.t0
02
Environmental Concentrations of Drugs during an Influenza Pandemic
PLOS ONE | www.plosone.org 6 September 2014 | Volume 9 | Issue 9 | e108621
concentration, including: cefotaxime (increase from ,LOQ to
51 ng/L (n = 1) for inlet and outlet, respectively), doxycycline
(increase by 94% from 3230 ng/L (n = 24) to 6270 ng/L (n = 24),
respectively) and trimethoprim (increase by 8% from 70 ng/L
(n = 24) to 73 ng/L (n = 24), respectively).
Decongestants in Benson WWTP. Approximately 1.56 g/d
of decongestant was quantified in the Benson WWTP influent
(0.25 mg/capita/d), 97% of which was a single decongestant,
naphazoline. The most frequently quantified decongestant in the
influent was naphazoline (n = 19), however, oxymetazoline was the
most frequently found decongestant in the effluent (n = 18;
Table 2). Oxymetazoline achieved a mean influent and effluent
concentration of 67 ng/L and 307 ng/L, respectively. Unlike
oxymetazoline, naphazoline averaged higher concentrations in the
influent (1,650 ng/L) than the effluent (696 ng/L). Naphazoline
reached a higher maximum concentration in the influent and
effluent (3,070 ng/L, 1,390 ng/L, respectively) than oxymetazo-
line (177 ng/L, 440 ng/L, respectively). The influent load
(1,460 mg/d) for naphazoline, was reduced by 95% as compared
to the effluent (69 mg/d, n = 2), indicating it is unlikely to be a
persistent environmental pollutant. Xylometazoline averaged
concentrations only marginally above the LOQ (11 ng/L) in the
influent (13 ng/L; 7 mg/d, n = 10), and was ,LOQ in all of the
effluent samples.
Decongestants in Oxford WWTP. Unlike at Benson
WWTP, no decongestant was found from the Oxford WWTP
influent, within the limits of quantification. However, deconges-
tants were quantified from the Oxford WWTP effluent during the
hours 2:00 and 3:00–notably the time when the Oxford WWTP
influent flow was at its minimum (Fig. S1 in File S1); these were
xylometazoline (15 ng/L, 28 mg/d, n = 1) and oxymetazoline
(16 ng/L, 66 mg/d, n = 2), the latter of which indicated a
propensity for concentration within the Benson WWTP, while
the former did not.
Pharmaceutical Occurrence in the Thames RiverCatchment
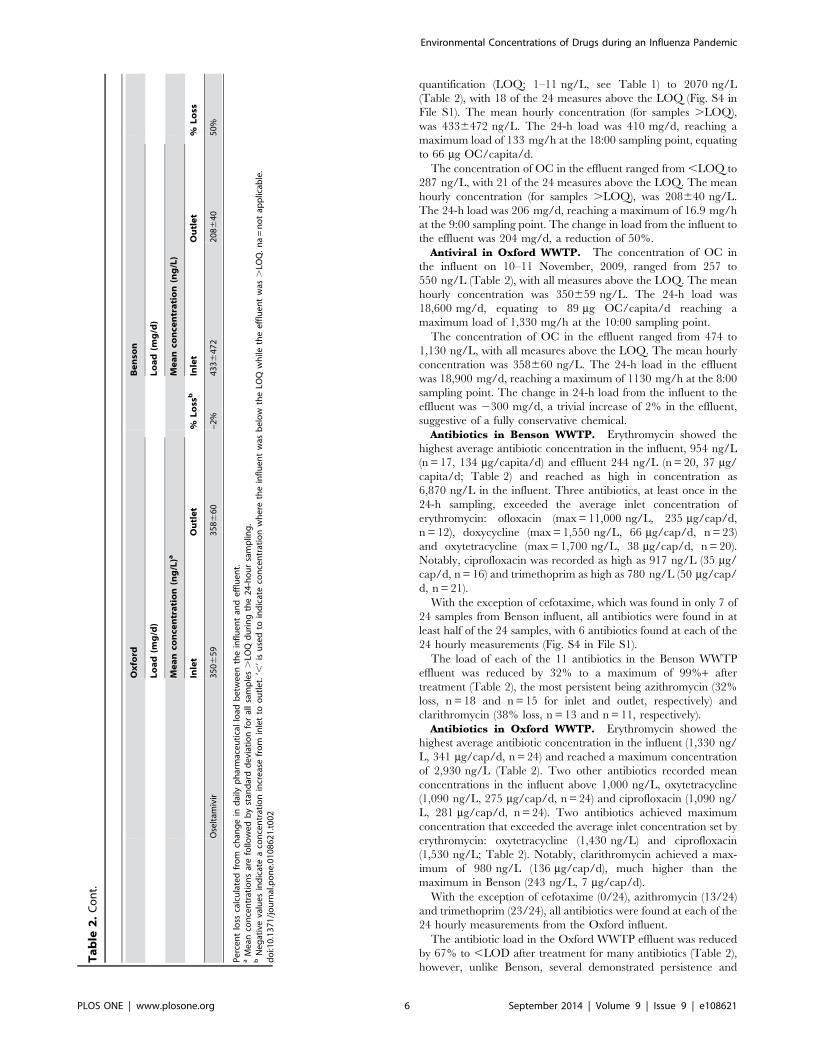
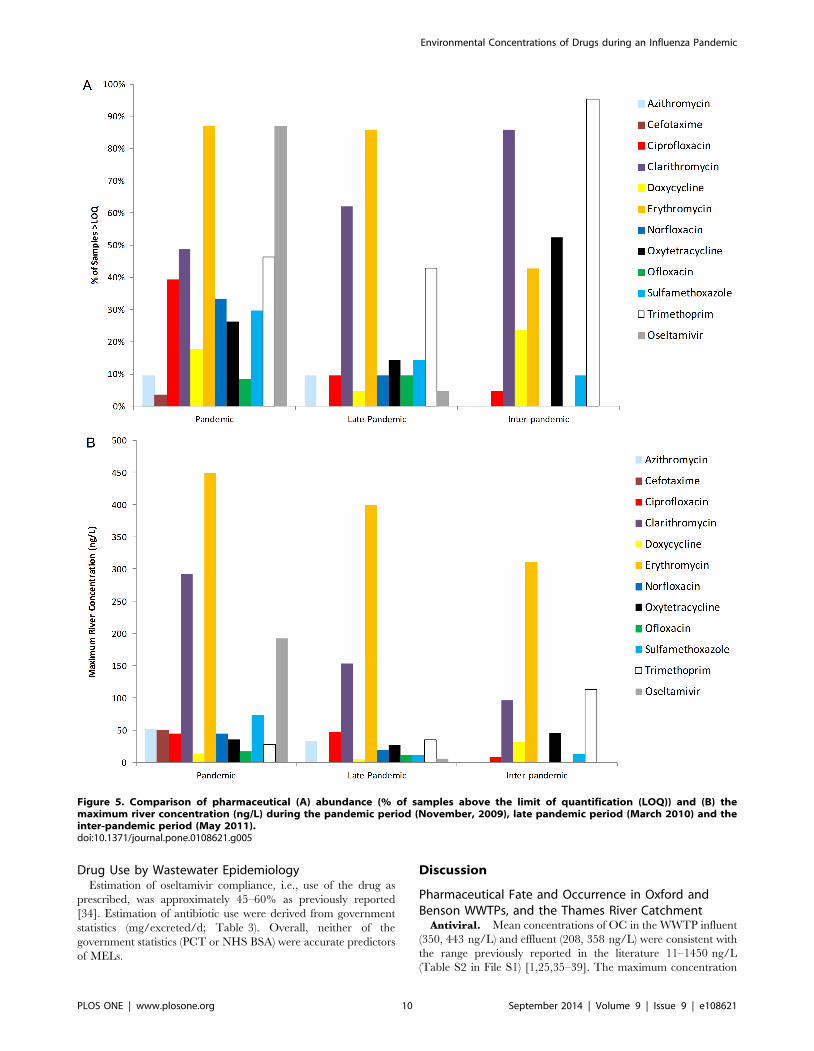
Antiviral. OC was the most frequently measured analyte with
concentrations .LOQ at 73% of the river sampling locations
during the month of November, 2009. The mean concentration of
OC across the Thames catchment was 65, 61, 33 and 33 ng/L for
November 3, 10, 16, and 24, respectively (Fig. 2 & 3). A maximum
OC concentration of 193 ng/L was recorded at The Cut at Paley
Street (T15) on Nov 10 (Figs. 3, S5b in File S1), a site known to be
among the more severely impacted by sewage [22] with relatively
low dilution per capita (Fig. S2 in File S1). The mean load of OC
across all 21 sites was 24, 18, 46 and 55 g OC/d for November 3,
10, 16 and 24, respectively, with a maximum load on November
24 at the Thames at Runnymead (TC16) site, the location with the
Figure 2. Correlation between population upstream and daily load of OC in river (mg OC/d) for each of the four sampling points:November 3 (diamond), November 10 (square), November 16 (triangle) and November 24 (‘x’), 2009.doi:10.1371/journal.pone.0108621.g002
Environmental Concentrations of Drugs during an Influenza Pandemic
PLOS ONE | www.plosone.org 7 September 2014 | Volume 9 | Issue 9 | e108621
Environmental Concentrations of Drugs during an Influenza Pandemic
PLOS ONE | www.plosone.org 8 September 2014 | Volume 9 | Issue 9 | e108621
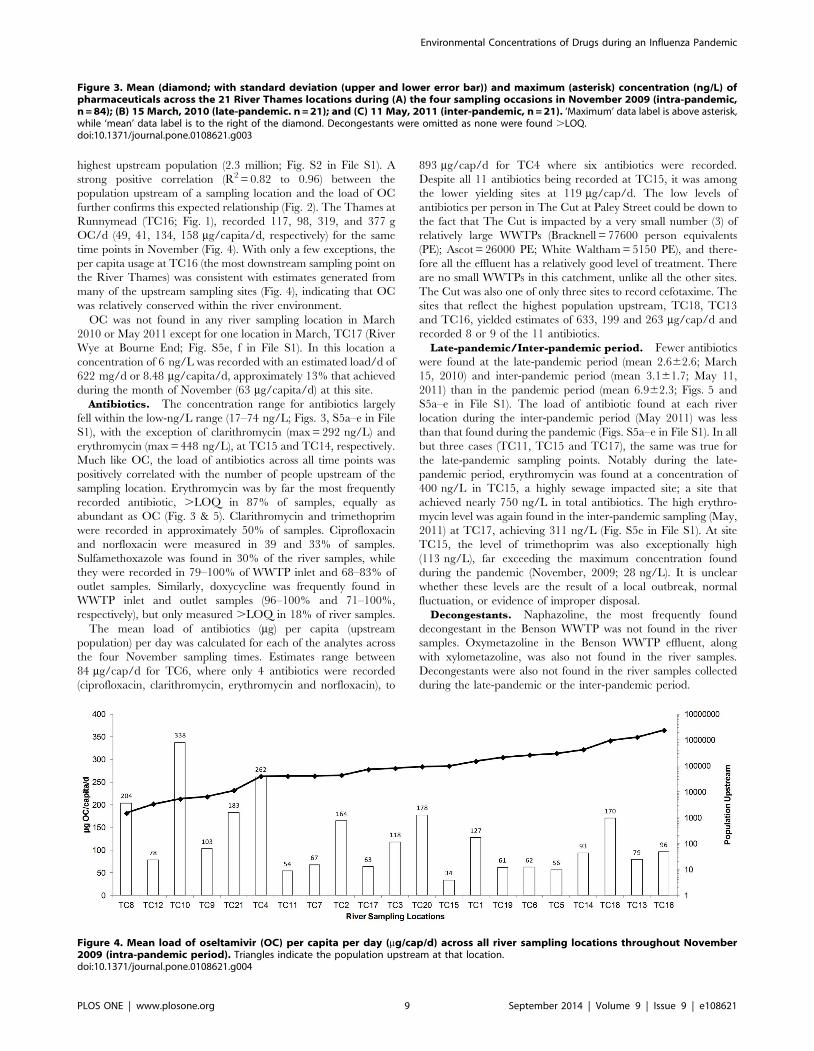
highest upstream population (2.3 million; Fig. S2 in File S1). A
strong positive correlation (R2 = 0.82 to 0.96) between the
population upstream of a sampling location and the load of OC
further confirms this expected relationship (Fig. 2). The Thames at
Runnymead (TC16; Fig. 1), recorded 117, 98, 319, and 377 g
OC/d (49, 41, 134, 158 mg/capita/d, respectively) for the same
time points in November (Fig. 4). With only a few exceptions, the
per capita usage at TC16 (the most downstream sampling point on
the River Thames) was consistent with estimates generated from
many of the upstream sampling sites (Fig. 4), indicating that OC
was relatively conserved within the river environment.
OC was not found in any river sampling location in March
2010 or May 2011 except for one location in March, TC17 (River
Wye at Bourne End; Fig. S5e, f in File S1). In this location a
concentration of 6 ng/L was recorded with an estimated load/d of
622 mg/d or 8.48 mg/capita/d, approximately 13% that achieved
during the month of November (63 mg/capita/d) at this site.
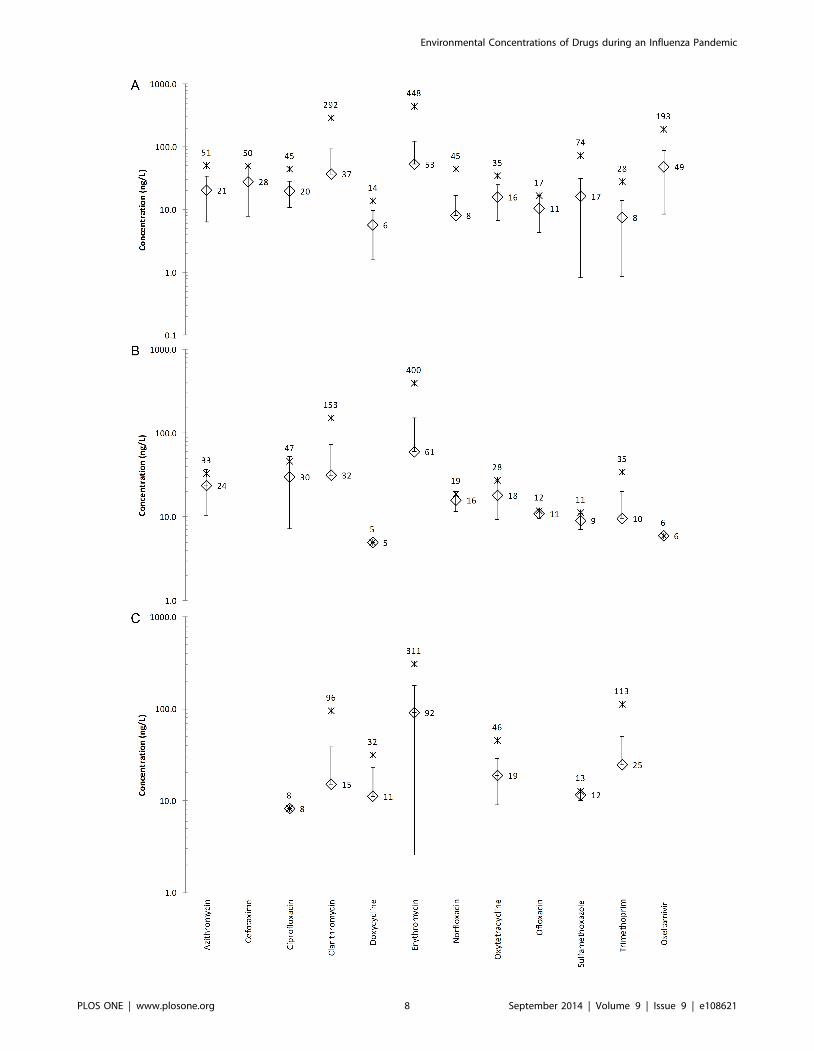
Antibiotics. The concentration range for antibiotics largely
fell within the low-ng/L range (17–74 ng/L; Figs. 3, S5a–e in File
S1), with the exception of clarithromycin (max = 292 ng/L) and
erythromycin (max = 448 ng/L), at TC15 and TC14, respectively.
Much like OC, the load of antibiotics across all time points was
positively correlated with the number of people upstream of the
sampling location. Erythromycin was by far the most frequently
recorded antibiotic, .LOQ in 87% of samples, equally as
abundant as OC (Fig. 3 & 5). Clarithromycin and trimethoprim
were recorded in approximately 50% of samples. Ciprofloxacin
and norfloxacin were measured in 39 and 33% of samples.
Sulfamethoxazole was found in 30% of the river samples, while
they were recorded in 79–100% of WWTP inlet and 68–83% of
outlet samples. Similarly, doxycycline was frequently found in
WWTP inlet and outlet samples (96–100% and 71–100%,
respectively), but only measured .LOQ in 18% of river samples.
The mean load of antibiotics (mg) per capita (upstream
population) per day was calculated for each of the analytes across
the four November sampling times. Estimates range between
84 mg/cap/d for TC6, where only 4 antibiotics were recorded
(ciprofloxacin, clarithromycin, erythromycin and norfloxacin), to
893 mg/cap/d for TC4 where six antibiotics were recorded.
Despite all 11 antibiotics being recorded at TC15, it was among
the lower yielding sites at 119 mg/cap/d. The low levels of
antibiotics per person in The Cut at Paley Street could be down to
the fact that The Cut is impacted by a very small number (3) of
relatively large WWTPs (Bracknell = 77600 person equivalents
(PE); Ascot = 26000 PE; White Waltham = 5150 PE), and there-
fore all the effluent has a relatively good level of treatment. There
are no small WWTPs in this catchment, unlike all the other sites.
The Cut was also one of only three sites to record cefotaxime. The
sites that reflect the highest population upstream, TC18, TC13
and TC16, yielded estimates of 633, 199 and 263 mg/cap/d and
recorded 8 or 9 of the 11 antibiotics.
Late-pandemic/Inter-pandemic period. Fewer antibiotics
were found at the late-pandemic period (mean 2.662.6; March
15, 2010) and inter-pandemic period (mean 3.161.7; May 11,
2011) than in the pandemic period (mean 6.962.3; Figs. 5 and
S5a–e in File S1). The load of antibiotic found at each river
location during the inter-pandemic period (May 2011) was less
than that found during the pandemic (Figs. S5a–e in File S1). In all
but three cases (TC11, TC15 and TC17), the same was true for
the late-pandemic sampling points. Notably during the late-
pandemic period, erythromycin was found at a concentration of
400 ng/L in TC15, a highly sewage impacted site; a site that
achieved nearly 750 ng/L in total antibiotics. The high erythro-
mycin level was again found in the inter-pandemic sampling (May,
2011) at TC17, achieving 311 ng/L (Fig. S5e in File S1). At site
TC15, the level of trimethoprim was also exceptionally high
(113 ng/L), far exceeding the maximum concentration found
during the pandemic (November, 2009; 28 ng/L). It is unclear
whether these levels are the result of a local outbreak, normal
fluctuation, or evidence of improper disposal.
Decongestants. Naphazoline, the most frequently found
decongestant in the Benson WWTP was not found in the river
samples. Oxymetazoline in the Benson WWTP effluent, along
with xylometazoline, was also not found in the river samples.
Decongestants were also not found in the river samples collected
during the late-pandemic or the inter-pandemic period.
Figure 3. Mean (diamond; with standard deviation (upper and lower error bar)) and maximum (asterisk) concentration (ng/L) ofpharmaceuticals across the 21 River Thames locations during (A) the four sampling occasions in November 2009 (intra-pandemic,n = 84); (B) 15 March, 2010 (late-pandemic. n = 21); and (C) 11 May, 2011 (inter-pandemic, n = 21). ‘Maximum’ data label is above asterisk,while ‘mean’ data label is to the right of the diamond. Decongestants were omitted as none were found .LOQ.doi:10.1371/journal.pone.0108621.g003
Figure 4. Mean load of oseltamivir (OC) per capita per day (mg/cap/d) across all river sampling locations throughout November2009 (intra-pandemic period). Triangles indicate the population upstream at that location.doi:10.1371/journal.pone.0108621.g004
Environmental Concentrations of Drugs during an Influenza Pandemic
PLOS ONE | www.plosone.org 9 September 2014 | Volume 9 | Issue 9 | e108621
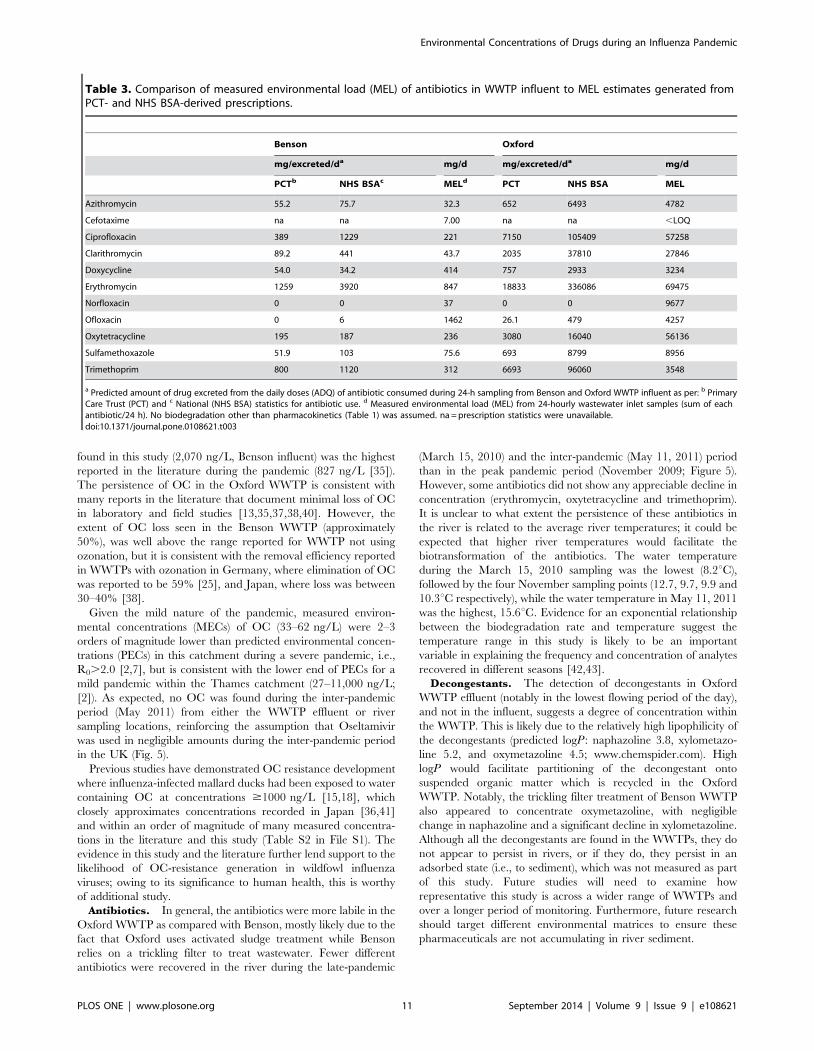
Drug Use by Wastewater EpidemiologyEstimation of oseltamivir compliance, i.e., use of the drug as
prescribed, was approximately 45–60% as previously reported
[34]. Estimation of antibiotic use were derived from government
statistics (mg/excreted/d; Table 3). Overall, neither of the
government statistics (PCT or NHS BSA) were accurate predictors
of MELs.
Discussion
Pharmaceutical Fate and Occurrence in Oxford andBenson WWTPs, and the Thames River Catchment
Antiviral. Mean concentrations of OC in the WWTP influent
(350, 443 ng/L) and effluent (208, 358 ng/L) were consistent with
the range previously reported in the literature 11–1450 ng/L
(Table S2 in File S1) [1,25,35–39]. The maximum concentration
Figure 5. Comparison of pharmaceutical (A) abundance (% of samples above the limit of quantification (LOQ)) and (B) themaximum river concentration (ng/L) during the pandemic period (November, 2009), late pandemic period (March 2010) and theinter-pandemic period (May 2011).doi:10.1371/journal.pone.0108621.g005
Environmental Concentrations of Drugs during an Influenza Pandemic
PLOS ONE | www.plosone.org 10 September 2014 | Volume 9 | Issue 9 | e108621
found in this study (2,070 ng/L, Benson influent) was the highest
reported in the literature during the pandemic (827 ng/L [35]).
The persistence of OC in the Oxford WWTP is consistent with
many reports in the literature that document minimal loss of OC
in laboratory and field studies [13,35,37,38,40]. However, the
extent of OC loss seen in the Benson WWTP (approximately
50%), was well above the range reported for WWTP not using
ozonation, but it is consistent with the removal efficiency reported
in WWTPs with ozonation in Germany, where elimination of OC
was reported to be 59% [25], and Japan, where loss was between
30–40% [38].
Given the mild nature of the pandemic, measured environ-
mental concentrations (MECs) of OC (33–62 ng/L) were 2–3
orders of magnitude lower than predicted environmental concen-
trations (PECs) in this catchment during a severe pandemic, i.e.,
R0.2.0 [2,7], but is consistent with the lower end of PECs for a
mild pandemic within the Thames catchment (27–11,000 ng/L;
[2]). As expected, no OC was found during the inter-pandemic
period (May 2011) from either the WWTP effluent or river
sampling locations, reinforcing the assumption that Oseltamivir
was used in negligible amounts during the inter-pandemic period
in the UK (Fig. 5).
Previous studies have demonstrated OC resistance development
where influenza-infected mallard ducks had been exposed to water
containing OC at concentrations $1000 ng/L [15,18], which
closely approximates concentrations recorded in Japan [36,41]
and within an order of magnitude of many measured concentra-
tions in the literature and this study (Table S2 in File S1). The
evidence in this study and the literature further lend support to the
likelihood of OC-resistance generation in wildfowl influenza
viruses; owing to its significance to human health, this is worthy
of additional study.
Antibiotics. In general, the antibiotics were more labile in the
Oxford WWTP as compared with Benson, mostly likely due to the
fact that Oxford uses activated sludge treatment while Benson
relies on a trickling filter to treat wastewater. Fewer different
antibiotics were recovered in the river during the late-pandemic
(March 15, 2010) and the inter-pandemic (May 11, 2011) period
than in the peak pandemic period (November 2009; Figure 5).
However, some antibiotics did not show any appreciable decline in
concentration (erythromycin, oxytetracycline and trimethoprim).
It is unclear to what extent the persistence of these antibiotics in
the river is related to the average river temperatures; it could be
expected that higher river temperatures would facilitate the
biotransformation of the antibiotics. The water temperature
during the March 15, 2010 sampling was the lowest (8.2uC),
followed by the four November sampling points (12.7, 9.7, 9.9 and
10.3uC respectively), while the water temperature in May 11, 2011
was the highest, 15.6uC. Evidence for an exponential relationship
between the biodegradation rate and temperature suggest the
temperature range in this study is likely to be an important
variable in explaining the frequency and concentration of analytes
recovered in different seasons [42,43].
Decongestants. The detection of decongestants in Oxford
WWTP effluent (notably in the lowest flowing period of the day),
and not in the influent, suggests a degree of concentration within
the WWTP. This is likely due to the relatively high lipophilicity of
the decongestants (predicted logP: naphazoline 3.8, xylometazo-
line 5.2, and oxymetazoline 4.5; www.chemspider.com). High
logP would facilitate partitioning of the decongestant onto
suspended organic matter which is recycled in the Oxford
WWTP. Notably, the trickling filter treatment of Benson WWTP
also appeared to concentrate oxymetazoline, with negligible
change in naphazoline and a significant decline in xylometazoline.
Although all the decongestants are found in the WWTPs, they do
not appear to persist in rivers, or if they do, they persist in an
adsorbed state (i.e., to sediment), which was not measured as part
of this study. Future studies will need to examine how
representative this study is across a wider range of WWTPs and
over a longer period of monitoring. Furthermore, future research
should target different environmental matrices to ensure these
pharmaceuticals are not accumulating in river sediment.
Table 3. Comparison of measured environmental load (MEL) of antibiotics in WWTP influent to MEL estimates generated fromPCT- and NHS BSA-derived prescriptions.
Benson Oxford
mg/excreted/da mg/d mg/excreted/da mg/d
PCTb NHS BSAc MELd PCT NHS BSA MEL
Azithromycin 55.2 75.7 32.3 652 6493 4782
Cefotaxime na na 7.00 na na ,LOQ
Ciprofloxacin 389 1229 221 7150 105409 57258
Clarithromycin 89.2 441 43.7 2035 37810 27846
Doxycycline 54.0 34.2 414 757 2933 3234
Erythromycin 1259 3920 847 18833 336086 69475
Norfloxacin 0 0 37 0 0 9677
Ofloxacin 0 6 1462 26.1 479 4257
Oxytetracycline 195 187 236 3080 16040 56136
Sulfamethoxazole 51.9 103 75.6 693 8799 8956
Trimethoprim 800 1120 312 6693 96060 3548
a Predicted amount of drug excreted from the daily doses (ADQ) of antibiotic consumed during 24-h sampling from Benson and Oxford WWTP influent as per: b PrimaryCare Trust (PCT) and c National (NHS BSA) statistics for antibiotic use. d Measured environmental load (MEL) from 24-hourly wastewater inlet samples (sum of eachantibiotic/24 h). No biodegradation other than pharmacokinetics (Table 1) was assumed. na = prescription statistics were unavailable.doi:10.1371/journal.pone.0108621.t003
Environmental Concentrations of Drugs during an Influenza Pandemic
PLOS ONE | www.plosone.org 11 September 2014 | Volume 9 | Issue 9 | e108621
Drug Use by Wastewater EpidemiologyAntiviral. The potential for wastewater epidemiology is
highest when studying a recalcitrant, water soluble pollutant. This
is one of the major reasons why the wastewater epidemiology
approach has so much potential when applied to OC [34]. The
physico-chemical benefits of OC are further enhanced because it is
consumed as a prodrug. As such, improperly disposed Oseltamivir
would be found in wastewater as the parent compound oseltamivir
not OC. Hence, the difference between consumption and
improper disposal can be relatively easily illuminated.
Antibiotics. To our knowledge the antibiotics within this
study are not provided in a prodrug form, making estimates of
their usage susceptible to misinterpretation owing to potential
improper disposal. The recalcitrance of antibiotics is known to
vary greatly in wastewater [44,45] making it considerably more
difficult to accurately predict environmental concentrations, as can
been seen in Table 3. The variability in the recalcitrance of
antibiotics in WWTPs and within the same WWTP over time and
between differing WWTPs of different size and treatment
technologies are likely among the main sources of error in the
wastewater epidemiology approach when applied to antibiotics.
Typically, the measured environmental load for each antibiotic
(Table 3), was lower than the forward-calculated values from PCT
or NHS BSA statistics, hence, the projected antibiotic users were
frequently over estimated. Efforts to improve the wastewater
epidemiology approach for antibiotics will need to address: (a)
heterogeneity in the temporal distribution of prescriptions over
time; (b) heterogeneity in the spatial distribution of prescriptions
(across the UK) over time; (c) heterogeneity in in vivo and
environmental stability of the antibiotic, including sewage pipes
prior to reaching the WWTP inlet [46]; and (d) variability in
compliance rate. It has been shown that the compliance rate for
antibiotics can depend on the number of doses per day and age
[47–49]. Further consideration should be given to (e) the sample
size and sampling method. The relatively low number of
pharmaceutical users in the two WWTP catchments, and the
Benson WWTP catchment in particular, leaves model estimates of
antibiotic users highly susceptible to systematic errors, as
previously described [50]. The heterogeneity in the content of
wastewater associated with low flush events, typical of low flow
periods in the middle of the night, are a major factor influencing
variations in analyte recovery over much of the sampling period
[51–53]. This higher variability can be witnessed by the higher
standard deviation in hourly measures of OC in Benson
(4336472 ng/L) as compared to Oxford (358660 ng/L). The
Oxford and Benson sewer systems receive flow from a number of
pumping stations that contribute to the mixing of discrete flushing
events, however, the problems associated with sampling small
populations would be more effectively alleviated with more
intensive sampling (every 5–15 minutes) [50]. And finally, the
wastewater epidemiology approach for antibiotics will likely be
highly sensitive to (f) variability in environmental temperatures and
precipitation, where low temperatures will likely retard biodegra-
dation and high precipitation will dilute potentially inhibitory
levels of drug while also resuspending sediment that can
subsequently influence the drug’s fate.
Decongestants. The ability to predict decongestant users
from measured concentrations in WWTP influent was constrained
by the same systematic problems discussed earlier for the
antibiotics, but might be further constrained by: 1) their apparent
susceptibility to biodegradation; 2) their high rate of non-
prescription use (i.e., over-the-counter), thereby hindering the
acquisition of spatially and temporally resolved use data to confirm
model projections; and 3) their more sporadic use pattern than
antibiotics, the latter of which has a typical course of two to four
tables per day for 7 to 10 days, whereas decongestants are only
used as and when required. Given these many limitations, there
was no ability to predict decongestant user numbers from
measured environmental concentrations.
ConclusionsIn hindsight, the 2009 influenza A(H1N1) pdm09a virus
generated a relatively small number of fatalities as compared to
severe pandemics like the 1918 ‘Spanish flu’, which meant that the
medical response was proportionately lower than would have been
expected in a moderate or severe influenza pandemic. Hence, the
potential negative effects to WWTP operation [13] and the
environment proposed to occur in a moderate and severe
pandemic [2,14] were not reported. This study provides the first
evidence that antibiotic and antiviral use was elevated during the
pandemic. Theoretically, the antiviral recorded in the River
Thames was of sufficient concentration to select for antiviral
resistance in wildfowl [18,54]. However, it remains to be
demonstrated whether this had occurred.
There remains a great deal of uncertainty with regard to
pharmaceutical use patterns during a pandemic, as a result of poor
adherence to prescribed drugs [34] and the widespread use of
over-the-counter medications. The focus on Oseltamivir here and
in the literature is unlikely to reflect antiviral practices beyond
2020 owing to an increasing number of influenza antivirals in the
pipeline [55–57]. However, for the time being, Oseltamivir
remains one of the few antivirals within national stockpiles and
as such, remains an important medical tool and potentially
significant environmental pollutant [58]. Future influenza pan-
demics might, in fact, employ a combination therapy of two or
more antivirals in an effort to combat resistance [59,60].
Opportunities to ground truth model predictions for ‘black swan
events’ such as influenza pandemics are, by definition, very rare
(every 30 years), making this study conducted during the last
influenza pandemic a unique window onto public health practice,
human behavior, and drug adherence in the UK. It represents the
first study to measure antibiotics and decongestants in influent and
effluent and receiving rivers during a public health emergency,
thereby establishing a baseline from which future modeling and
risk assessments can be built in preparation for more severe public
health emergencies.
Supporting Information
File S1 Figure S1. Hourly total pharmaceutical load in Benson
(A) and Oxford (B) WWTP inlet, for antibiotics (diamond),
oseltamivir carboxylate (square), and decongestants (triangle) on
November 10–11, 2009. No decongestants were detected in the
Oxford WWTP inlet. Figure S2. Available dilution per capita per
day at each of the River Thames sampling sites on each sampling
occasion (November, 3, 10, 16, 24, 2009; March 15, 2010; May
11, 2011), dry weather flow (L/cap/d) and population. FigureS3. Atmospheric conditions on sampling days, including mean
(max/min) temperature (uC) and precipitation (‘PP’; mm), on the
sampling day, 24-hours and 48-hours ahead of the Thames River
sampling occasion. Figure S4. Percentage of samples in Benson
and Oxford WWTPs (nmax = 24) and the river Thames (nmax = 84;
only November) from which analytes were found above their
LOQ. Analytes arranged by least to most frequently found in the
River Thames, from left to right. Brown = Benson WWTP
influent; Blue = Benson WWTP effluent; Yellow = Oxford WWTP
influent; Red = Oxford WWTP effluent; Black = River Thames.
Figure S5A. Concentration of antibiotics and oseltamivir (ng/L)
Environmental Concentrations of Drugs during an Influenza Pandemic
PLOS ONE | www.plosone.org 12 September 2014 | Volume 9 | Issue 9 | e108621
at all river sampling locations for each of the sampling dates:
November 3, 2009. River sampling locations given sorted by
population upstream with TC8 having the smallest population.
Figure S5B. Concentration of antibiotics and oseltamivir (ng/L)
at all river sampling locations for each of the sampling dates:
November 10, 2009. River sampling locations given sorted by
population upstream with TC8 having the smallest population.
Figure S5C. Concentration of antibiotics and oseltamivir (ng/L)
at all river sampling locations for each of the sampling dates:
November 16, 2009. River sampling locations given sorted by
population upstream with TC8 having the smallest population.
Figure S5D. Concentration of antibiotics and oseltamivir (ng/L)
at all river sampling locations for each of the sampling dates:
November 24, 2009. River sampling locations given sorted by
population upstream with TC8 having the smallest population.
Figure S5E. Concentration of antibiotics and oseltamivir (ng/L)
at all river sampling locations for each of the sampling dates:
March 15, 2010. River sampling locations given sorted by
population upstream with TC8 having the smallest population.
Figure S5F. Concentration of antibiotics and oseltamivir (ng/L)
at all river sampling locations for each of the sampling dates: May
11, 2011. River sampling locations given sorted by population
upstream with TC8 having the smallest population. Table S1.NHS BSA statistics on drug use in England from 2007–8.
Predicted mass of drug used per day per WWTP catchment, using
winter adjusted values, where the annual prescription rate was
adjusted by a factor of 9.375% higher than the annual average rate
(see text for details). Benson drug use rate was adjusted by a factor
of 0.389 (the estimated fraction of the local PCT population within
the Benson WWTP catchment; see text for details). na = data not
available. Table S2. Literature review of oseltamivir in WWTP
and rivers. Table S3. Liquid chromatography-tandem mass-
spectrometry (LC-MS/MS) method parameters of study analytes.
(DOCX)
Author Contributions
Conceived and designed the experiments: ACS JDJ JF HS. Performed the
experiments: ACS JDJ RG GAK GF JF RHL MJB BO HS. Analyzed the
data: ACS HS. Contributed reagents/materials/analysis tools: ACS JF
MJB HS. Contributed to the writing of the manuscript: ACS HS.
References
1. Azuma T, Nakada N, Yamashita N, Tanaka H (2013) Mass balance of anti-
influenza drugs discharged into the Yodo River system, Japan, under an
influenza outbreak. Chemosphere 93: 1672–1677.
2. Singer AC, Colizza V, Schmitt H, Andrews J, Balcan D, et al. (2011) Assessing
the ecotoxicologic hazards of a pandemic influenza medical response. Environ
Health Perspect 119: 1084–1090.
3. Chang CC, Cheng AC, Chang AB (2014) Over-the-counter (OTC) medications
to reduce cough as an adjunct to antibiotics for acute pneumonia in children and
adults. Cochrane Database Syst Rev 3: CD006088.
4. Dollery C (1999) Therapeutic Drugs. London: Harcourt Brace and Company
Limited.
5. Knox C, Law V, Jewison T, Liu P, Ly S, et al. (2011) DrugBank 3.0: a
comprehensive resource for ‘omics’ research on drugs. Nucleic Acids Res 39:
D1035–1041.
6. Edlund A, Ek K, Breitholtz M, Gorokhova E (2012) Antibiotic-induced change
of bacterial communities associated with the copepod Nitocra spinipes. PLoS
One 7: e33107.
7. Singer AC, Nunn MA, Gould EA, Johnson AC (2007) Potential risks associated
with the proposed widespread use of Tamiflu. Environmental Health
Perspectives 115: 102–106.
8. Escher BI, Bramaz N, Lienert J, Neuwoehner J, Straub JO (2010) Mixture
toxicity of the antiviral drug Tamiflu) (oseltamivir ethylester) and its active
metabolite oseltamivir acid. Aquat Toxicol 96: 194–202.
9. Straub JO (2009) An environmental risk assessment for oseltamivir (Tamiflu) for
sewage works and surface waters under seasonal-influenza- and pandemic-use
conditions. Ecotoxicol Environ Saf 72: 1625–1634.
10. Hutchinson TH, Beesley A, Frickers PE, Readman JW, Shaw JP, et al. (2009)
Extending the environmental risk assessment for oseltamivir (Tamiflu) under
pandemic use conditions to the coastal marine compartment. Environ Int 35:
931–936.
11. Chen WY, Lin CJ, Liao CM (2014) Assessing exposure risks for aquatic
organisms posed by Tamiflu use under seasonal influenza and pandemic
conditions. Environ Pollut 184: 377–384.
12. Sacca ML, Accinelli C, Fick J, Lindberg R, Olsen B (2009) Environmental fate
of the antiviral drug Tamiflu in two aquatic ecosystems. Chemosphere 75:
28–33.
13. Slater FR, Singer AC, Turner S, Barr JJ, Bond PL (2011) Pandemic
pharmaceutical dosing effects on wastewater treatment: no adaptation of
activated sludge bacteria to degrade the antiviral drug oseltamivir (Tamiflu) and
loss of nutrient removal performance. FEMS Microbiol Lett 315: 17–22.
14. Singer AC, Howard BM, Johnson AC, Knowles CJ, Jackman S, et al. (2008)
Meeting report: risk assessment of tamiflu use under pandemic conditions.
Environ Health Perspect 116: 1563–1567.
15. Achenbach JE, Bowen RA (2013) Effect of oseltamivir carboxylate consumption
on emergence of drug-resistant H5N2 avian influenza virus in Mallard ducks.
Antimicrob Agents Chemother 57: 2171–2181.
16. Jarhult JD (2012) Oseltamivir (Tamiflu) in the environment, resistance
development in influenza A viruses of dabbling ducks and the risk of
transmission of an oseltamivir-resistant virus to humans - a review. Infect Ecol
Epidemiol 2.
17. Gillman A, Muradrasoli S, Soderstrom H, Nordh J, Brojer C, et al. (2013)
Resistance Mutation R292K Is Induced in Influenza A(H6N2) Virus by
Exposure of Infected Mallards to Low Levels of Oseltamivir. PLoS ONE 8:
e71230.
18. Jarhult JD, Muradrasoli S, Wahlgren J, Soderstrom H, Orozovic G, et al. (2011)
Environmental levels of the antiviral oseltamivir induce development of
resistance mutation H274Y in influenza A/H1N1 virus in mallards. PLoS
One 6: e24742.
19. Wellington EM, Boxall AB, Cross P, Feil EJ, Gaze WH, et al. (2013) The role of
the natural environment in the emergence of antibiotic resistance in gram-
negative bacteria. Lancet Infect Dis 13: 155–165.
20. Gaze WH, Krone SM, Larsson DG, Li XZ, Robinson JA, et al. (2013) Influence
of humans on evolution and mobilization of environmental antibiotic resistome.
Emerg Infect Dis 19.
21. World Health Organization (2010) WHO recommendations for the post-
pandemic period: Pandemic (H1N1) 2009 briefing note 23. Available: http://
www.who.int/csr/disease/swineflu/notes/briefing_20100810/en/. Accessed
2012 Jun 1.
22. Bowes MJ, Jarvie HP, Naden PS, Old GH, Scarlett PM, et al. (2014) Identifying
priorities for nutrient mitigation using river concentration–flow relationships:
The Thames basin, UK. Journal of Hydrology 517: 1–12.
23. Harvey CL, Dixon H, Hannaford J (2012) An appraisal of the performance of
data-infilling methods for application to daily mean river flow records in the UK.
Hydrology Research 43: 618–636.
24. TuTiempo.net (2009) Climate: Benson (November, 2009). Available: http://
www.tutiempo.net/en/Climate/Benson/11-2009/36580.htm. Accessed 2012
Oct 26.
25. Prasse C, Schlusener MP, Schulz R, Ternes TA (2010) Antiviral drugs in
wastewater and surface waters: a new pharmaceutical class of environmental
relevance? Environ Sci Technol 44: 1728–1735.
26. Balcan D, Colizza V, Singer AC, Chouaid C, Hu H, et al. (2009) Modeling the
critical care demand and antibiotics resources needed during the Fall 2009 wave
of influenza A(H1N1) pandemic. PLoS Curr 1: RRN1133.
27. Khan GA, Lindberg R, Grabic R, Fick J (2012) The development and
application of a system for simultaneously determining anti-infectives and nasal
decongestants using on-line solid-phase extraction and liquid chromatography-
tandem mass spectrometry. J Pharm Biomed Anal 66: 24–32.
28. NHS BSA (2011) Prescribing Analysis Charts: National Antibiotics Charts.
Available: http://www.nhsbsa.nhs.uk/PrescriptionServices/2587.aspx. Ac-
cessed 2012 Oct.
29. NHS Information Centre for Health and Social Care (2011) Number of GP
Prescriptions by drug by postcode. Available: http://data.gov.uk/apps/number-
of-gp-prescriptions-by-drug-by-postcode.
30. Health Protection Agency (2010) Epidemiological report of pandemic (H1N1)
2009 in the UK (April 2009 - May 2010). Available: http://www.hpa.org.uk/
webc/HPAwebFile/HPAweb_C/1284475321350. Accessed 2012 Jun 1.
31. Rogers S, Sedghi A (2011) Swine flu data in the UK: see how bad cases are
where you live. Guardian Available: http://www.guardian.co.uk/news/
datablog/2011/jan/06/swine-flu-data-uk#data. Accessed 2012 Jun 1.
32. The Health and Social Care Information Centre PSU (2012) Average Daily
Quantities. Available: http://www.ic.nhs.uk/services/prescribing-support-unit-
psu/using-the-service/reference/measures/volume-measures/average-daily-
quantities-adq. Accessed 2012 Oct 19.
Environmental Concentrations of Drugs during an Influenza Pandemic
PLOS ONE | www.plosone.org 13 September 2014 | Volume 9 | Issue 9 | e108621
33. Davey P, Ferech M, Ansari F, Muller A, Goossens H (2008) Outpatient
antibiotic use in the four administrations of the UK: cross-sectional andlongitudinal analysis. Journal of Antimicrobial Chemotherapy 62: 1441–1447.
34. Singer AC, Jarhult JD, Grabic R, Khan GA, Fedorova G, et al. (2013)
Compliance to oseltamivir among two populations in Oxfordshire, UnitedKingdom affected by influenza A(H1N1) pdm09, November 2009–a waste water
epidemiology study. PLoS One 8: e60221.35. Azuma T, Nakada N, Yamashita N, Tanaka H (2012) Synchronous dynamics of
observed and predicted values of anti-influenza drugs in environmental waters
during a seasonal influenza outbreak. Environ Sci Technol 46: 12873–12881.36. Takanami R, Ozaki H, Giri RR, Taniguchi S, Hayashi S (2012) Antiviral Drugs
Zanamivir and Oseltamivir Found in Wastewater and Surface Water in Osaka,Japan. Journal of Water and Environment Technology 10: 57–68.
37. Leknes H, Sturtzel IE, Dye C (2012) Environmental release of oseltamivir from aNorwegian sewage treatment plant during the 2009 influenza A (H1N1)
pandemic. Sci Total Environ 414: 632–638.
38. Ghosh GC, Nakada N, Yamashita N, Tanaka H (2010) Occurrence and fate ofoseltamivir carboxylate (Tamiflu) and amantadine in sewage treatment plants.
Chemosphere 81: 13–17.39. Ghosh GC, Nakada N, Yamashita N, Tanaka H (2010) Oseltamivir carboxylate,
the active metabolite of oseltamivir phosphate (Tamiflu), detected in sewage
discharge and river water in Japan. Environ Health Perspect 118: 103–107.40. Fick J, Lindberg RH, Tysklind M, Haemig PD, Waldenstrom J, et al. (2007)
Antiviral oseltamivir is not removed or degraded in normal sewage watertreatment: implications for development of resistance by influenza A virus. PLoS
One 2: e986.41. Takanami R, Ozaki H, Giri RR, Taniguchi S, Hayashi S (2010) Detection of
antiviral drugs oseltamivir phosphate and oseltamivir carboxylate in Neya River,
Osaka Japan. Journal of Water and Environment Technology 8: 363–372.42. Kohring GW, Rogers JE, Wiegel J (1989) Anaerobic biodegradation of 2,4-
dichlorophenol in freshwater lake sediments at different temperatures. Appliedand Environmental Microbiology 55: 348–353.
43. Atlas RM (1975) Effects of Temperature and Crude Oil Composition on
Petroleum Biodegradation. Applied Microbiology 30: 396–403.44. Michael I, Rizzo L, McArdell CS, Manaia CM, Merlin C, et al. (2013) Urban
wastewater treatment plants as hotspots for the release of antibiotics in theenvironment: a review. Water Res 47: 957–995.
45. Luo Y, Guo W, Ngo HH, Nghiem LD, Hai FI, et al. (2014) A review on theoccurrence of micropollutants in the aquatic environment and their fate and
removal during wastewater treatment. Sci Total Environ 473–474: 619–641.
46. Lindberg RH, Ostman M, Olofsson U, Grabic R, Fick J (2014) Occurrence andbehaviour of 105 active pharmaceutical ingredients in sewage waters of a
municipal sewer collection system. Water Res 58C: 221–229.
47. Kardas P (2002) Patient compliance with antibiotic treatment for respiratory
tract infections. J Antimicrob Chemother 49: 897–903.
48. Llor C, Hernandez S, Bayona C, Moragas A, Sierra N, et al. (2013) A study of
adherence to antibiotic treatment in ambulatory respiratory infections.
Int J Infect Dis 17: e168–172.
49. McNulty CA, Boyle P, Nichols T, Clappison P, Davey P (2007) The public’s
attitudes to and compliance with antibiotics. J Antimicrob Chemother 60 Suppl
1: i63–68.
50. Ort C, Lawrence MG, Reungoat J, Mueller JF (2010) Sampling for PPCPs in
wastewater systems: comparison of different sampling modes and optimization
strategies. Environ Sci Technol 44: 6289–6296.
51. Ort C, Gujer W (2006) Sampling for representative micropollutant loads in
sewer systems. Water Sci Technol 54: 169–176.
52. Ort C, Schaffner C, Giger W, Gujer W (2005) Modeling stochastic load
variations in sewer systems. Water Sci Technol 52: 113–122.
53. Ort C, Lawrence MG, Rieckermann J, Joss A (2010) Sampling for
pharmaceuticals and personal care products (PPCPs) and illicit drugs in
wastewater systems: are your conclusions valid? A critical review. Environ Sci
Technol 44: 6024–6035.
54. Gillman A, Muradrasoli S, Soderstrom H, Nordh J, Brojer C, et al. (2013)
Resistance mutation R292K is induced in influenza A(H6N2) virus by exposure
of infected mallards to low levels of oseltamivir. PLoS One 8: e71230.
55. Ivachtchenko AV, Ivanenkov YA, Mitkin OD, Yamanushkin PM, Bichko VV,
et al. (2013) A novel influenza virus neuraminidase inhibitor AV5027. Antiviral
Res 100: 698–708.
56. Wathen MW, Barro M, Bright RA (2013) Antivirals in seasonal and pandemic
influenza–future perspectives. Influenza Other Respir Viruses 7 Suppl 1: 76–80.
57. Jefferson T, Jones MA, Doshi P, Del Mar CB, Hama R, et al. (2014)
Neuraminidase inhibitors for preventing and treating influenza in healthy adults
and children. Cochrane Database Syst Rev 4: CD008965.
58. Drinking Water Inspectorate (2007) Desk based review of current knowledge on
pharmaceuticals in drinking water and estimation of potential levels (Defra
Project Code: CSA 7184/WT02046/DWI70/2/213). Available: http://googl/
nkBVlP.
59. Perelson AS, Rong L, Hayden FG (2012) Combination Antiviral Therapy for
Influenza: Predictions From Modeling of Human Infections. Journal of
Infectious Diseases 205: 1642–1645.
60. Kim W-Y, Young Suh G, Huh JW, Kim S-H, Kim M-j, et al. (2011) Triple-
Combination Antiviral Drug for Pandemic H1N1 Influenza Virus Infection in
Critically Ill Patients on Mechanical Ventilation. Antimicrobial Agents and
Chemotherapy 55: 5703–5709.
Environmental Concentrations of Drugs during an Influenza Pandemic
PLOS ONE | www.plosone.org 14 September 2014 | Volume 9 | Issue 9 | e108621