
Post-seismic infrastructure damage assessment using high-resolution SAR satellite data
12
Post-seismic infrastructure damage assessment using high-resolution SAR satellite data Timo Balz *a , Daniele Perissin b , Uwe Soergel c , Lu Zhang a , Mingsheng Liao a a State Key Laboratory of Information Engineering in Surveying, Mapping and Remote Sensing, Wuhan University, P.R. China; b Politecnico di Milano, Italy; c Institute of Photogrammetry and GeoInformation, Leibniz University Hannover, Germany ABSTRACT The Wenchuan Earthquake on May 12, 2008, devastated a vast area in Sichuan, China. The swift rescue and disaster management measures of the Chinese government have been supported by radar remote sensing from the very beginning. The new high-resolution synthetic aperture radar (SAR) satellites, like COSMO-SkyMed and TerraSAR-X, have been used for damage assessment and rapid mapping. Unfortunately, only one stripmap image from the area was acquired by COSMO-SkyMed before the earthquake, allowing therefore the generation of only one co-seismic interferogram over a limited area to evaluate the motion of the terrain. Thorough analysis of the acquired data can reveal the status of build- ings and infrastructure using only post-seismic high-resolution images. In this paper, damaged bridges and dams will be analyzed and strategies for damage detection in SAR images will be discussed. Typical signatures of damaged bridges will be shown and long-time monitoring of dams using SAR is demonstrated. Keywords: Radar, SAR, Earthquake, Bridge, Damage Assessment, High-Resolution, PSI 1. INTRODUCTION On May 12, 2008, the Wenchuan Earthquake with a magnitude of 7.9 devastated a huge area in the Sichuan Province of China. The epicenter was in Wenchuan, northwest of Chengdu, the capital of the Sichuan province [1]. The rupture propagated for about 270km north-northeast alongside the “Dragon’s Gate Mountains (Long Men Shan)” [2]. High- resolution synthetic aperture radar (SAR) satellite images supported the rescue and disaster management operations in the area. The independence of radar from weather and daylight proved to be particularly useful in disaster management and rescue operations, because heavy rainfall and cloud coverage hindered the use of optical remote sensing systems in the days following the earthquake. SAR, especially interferometric SAR, is widely used for the analysis of earthquakes and earthquake related damages [3]. A range of works has been published about post-seismic building damage assessment, using pre- and post-earthquake data [4-5]. Although bridges are of utmost importance for post-disaster logistics, there is not much research work pub- lished about the detection of damaged bridges in SAR images [6]. One reason might be that the spatial resolution of mid- resolution SAR systems, like ERS, JERS, Radarsat-1, etc., is not sufficient for detecting bridge damages [7]. High-resolution SAR data could deliver even more precise results. Unfortunately, high-resolution change detection could not be applied using TerraSAR-X, because the sensor is just operational since early 2008 and did not acquire any pre- seismic data from the devastated area. COSMO-SkyMed took one image over Chengdu in stripmap mode on April 13. A second image along the same orbit was planned soon after the seism and taken on May 15 (three days after the shake). The co-seismic interferogram generated from the two acquisitions is shown in Fig. 1. The imaged area has an extension of 40x40 km 2 and the spatial resolution is about 3x3 m 2 . The normal baseline is 71m and the temporal one 32 days. Fig. 1(a) shows the geo-referenced differential interferogram (after compensating for the topography provided by SRTM da- ta) and Fig 1(b) reports its amplitude in SAR coordinates. The interferometric fringes show with impressive details the * [email protected]; phone +86 15071459772; www.lmars.whu.edu.cn
Transcript of Post-seismic infrastructure damage assessment using high-resolution SAR satellite data
Post-seismic infrastructure damage assessment using high-resolution
SAR satellite data
Timo Balz*a
, Daniele Perissinb, Uwe Soergel
c, Lu Zhang
a, Mingsheng Liao
a
aState Key Laboratory of Information Engineering in Surveying, Mapping and Remote Sensing,
Wuhan University, P.R. China; bPolitecnico di Milano, Italy;
cInstitute of Photogrammetry and GeoInformation, Leibniz University Hannover, Germany
ABSTRACT
The Wenchuan Earthquake on May 12, 2008, devastated a vast area in Sichuan, China. The swift rescue and disaster
management measures of the Chinese government have been supported by radar remote sensing from the very beginning.
The new high-resolution synthetic aperture radar (SAR) satellites, like COSMO-SkyMed and TerraSAR-X, have been
used for damage assessment and rapid mapping. Unfortunately, only one stripmap image from the area was acquired by
COSMO-SkyMed before the earthquake, allowing therefore the generation of only one co-seismic interferogram over a
limited area to evaluate the motion of the terrain. Thorough analysis of the acquired data can reveal the status of build-
ings and infrastructure using only post-seismic high-resolution images. In this paper, damaged bridges and dams will be
analyzed and strategies for damage detection in SAR images will be discussed. Typical signatures of damaged bridges
will be shown and long-time monitoring of dams using SAR is demonstrated.
Keywords: Radar, SAR, Earthquake, Bridge, Damage Assessment, High-Resolution, PSI
1. INTRODUCTION
On May 12, 2008, the Wenchuan Earthquake with a magnitude of 7.9 devastated a huge area in the Sichuan Province of
China. The epicenter was in Wenchuan, northwest of Chengdu, the capital of the Sichuan province [1]. The rupture
propagated for about 270km north-northeast alongside the “Dragon’s Gate Mountains (Long Men Shan)” [2]. High-
resolution synthetic aperture radar (SAR) satellite images supported the rescue and disaster management operations in
the area. The independence of radar from weather and daylight proved to be particularly useful in disaster management
and rescue operations, because heavy rainfall and cloud coverage hindered the use of optical remote sensing systems in
the days following the earthquake.
SAR, especially interferometric SAR, is widely used for the analysis of earthquakes and earthquake related damages [3].
A range of works has been published about post-seismic building damage assessment, using pre- and post-earthquake
data [4-5]. Although bridges are of utmost importance for post-disaster logistics, there is not much research work pub-
lished about the detection of damaged bridges in SAR images [6]. One reason might be that the spatial resolution of mid-
resolution SAR systems, like ERS, JERS, Radarsat-1, etc., is not sufficient for detecting bridge damages [7].
High-resolution SAR data could deliver even more precise results. Unfortunately, high-resolution change detection could
not be applied using TerraSAR-X, because the sensor is just operational since early 2008 and did not acquire any pre-
seismic data from the devastated area. COSMO-SkyMed took one image over Chengdu in stripmap mode on April 13. A
second image along the same orbit was planned soon after the seism and taken on May 15 (three days after the shake).
The co-seismic interferogram generated from the two acquisitions is shown in Fig. 1. The imaged area has an extension
of 40x40 km2 and the spatial resolution is about 3x3 m
2. The normal baseline is 71m and the temporal one 32 days. Fig.
1(a) shows the geo-referenced differential interferogram (after compensating for the topography provided by SRTM da-
ta) and Fig 1(b) reports its amplitude in SAR coordinates. The interferometric fringes show with impressive details the
* [email protected]; phone +86 15071459772; www.lmars.whu.edu.cn

ground shift occurred during the seism. The obtained coherence is remarkable even in vegetated parts of the analyzed
area (low right in (a), low left in (b)) highlighting the great potential of high-resolution data for monitoring ground mo-
tions.
(a)
(b)
Fig. 1. (a) COSMO-SkyMed co-seismic interferogram over Chengdu superimposed to a Google-Earth optical image;
(b) amplitude of the interferogram in SAR coordinates. The work was carried out within a collaboration between Poli-
tecnico di Milano (POLIMI) and the Department of Civil Protection of Italy. The data were processed by the POLIMI
spin-off companies TRE and Aresys.
Directly after the earthquake, the focus of the authorities and the spatial data service providers was the fast coverage of
the area with newly acquired post-earthquake data. To cover a huge area fast, stripmap data was acquired for most of the
area. Only few areas of interesthave been acquired in spotlight mode. For the post-earthquake analysis, single polarized
stripmap data with around three meter resolution had to be used.
The status of the infrastructure, especially roads and bridges, is of utmost importance for the rescue operations in the
aftermath of an earthquake. Bridges are vulnerable key points of the infrastructure and the damage assessment of bridges

is one of the most urgent needed intelligence information for post-disaster logistics. Dams are endangered by earth-
quakes and the collapse of a dam could cost the lives of thousands of people.
In the following section, some theoretical background about the appearance of bridges in SAR images will be presented.
In section 3, the damage assessment of bridges and dams will be exemplarily demonstrated using examples from Sichuan.
Multi-image analysis for dam monitoring is presented in section 4. Finally conclusions are drawn.
2. APPEARANCE OF BRIDGES IN HIGH-RESOLUTION SAR IMAGES
2.1 High-resolution SAR image geometry
SAR systems are side-looking radar systems. The oblique viewing geometry is crucial for SAR processing as well as for
understanding SAR image geometry. The geometry of SAR images differs in azimuth and range direction. SAR needs a
moving platform to make use of the Doppler Effect, improving the resolution in azimuth direction. The position of an
object in azimuth direction is determined by the Doppler Shift. Therefore the position of moving objects can be disturbed,
but fixed objects, like buildings and bridges, will be positioned correctly and precisely in azimuth direction.
The SAR geometry in range direction depends on the running time of the signal between the sensor, the backscattering
object, and the receiving antenna. Ignoring atmospheric effects, the running time of the signal directly corresponds to the
travelling distance of the signal. The distance between the elevated parts of objects, e.g. building roofs, and the sensor is
smaller than that between the lower part and the sensor, therefore the elevated parts are mapped closer to the sensor. This
effect is called layover and is typical for SAR images in urban areas.
Fig. 2. Ambiguous building backscatter.
Different parts of an elevated object are, depending on the spatial resolution of the system, mapped at the same position.
As exemplarily shown in Fig. 2, parts of the roof, the building wall and the area in front of the building have the same
distance to the sensor. The backscatter of these parts is received simultaneously by the receiving antenna and the back-
scatter of these different parts will be mixed up.
Another important geometrical effect is caused by double- and multi-bounce reflections. Double-bounces can occur
when a radar signal is scattered by a building wall to the ground and from the ground back to the radar sensor. Triple-
bouncing can occur when a radar signal is scattered from a building wall to a backscattering surface, subsequently back
to the wall, and from the wall back to the receiving antenna. Regarding buildings surrounded by streets, which typically
can be described as 90° dihedrals with flat surfaces in relation to the wavelength, it is shown that multi-bounces do not
arise [8]. Triple bouncing frequently occurs in SAR images of bridges of water [9-10], which will be shown in section
2.2.
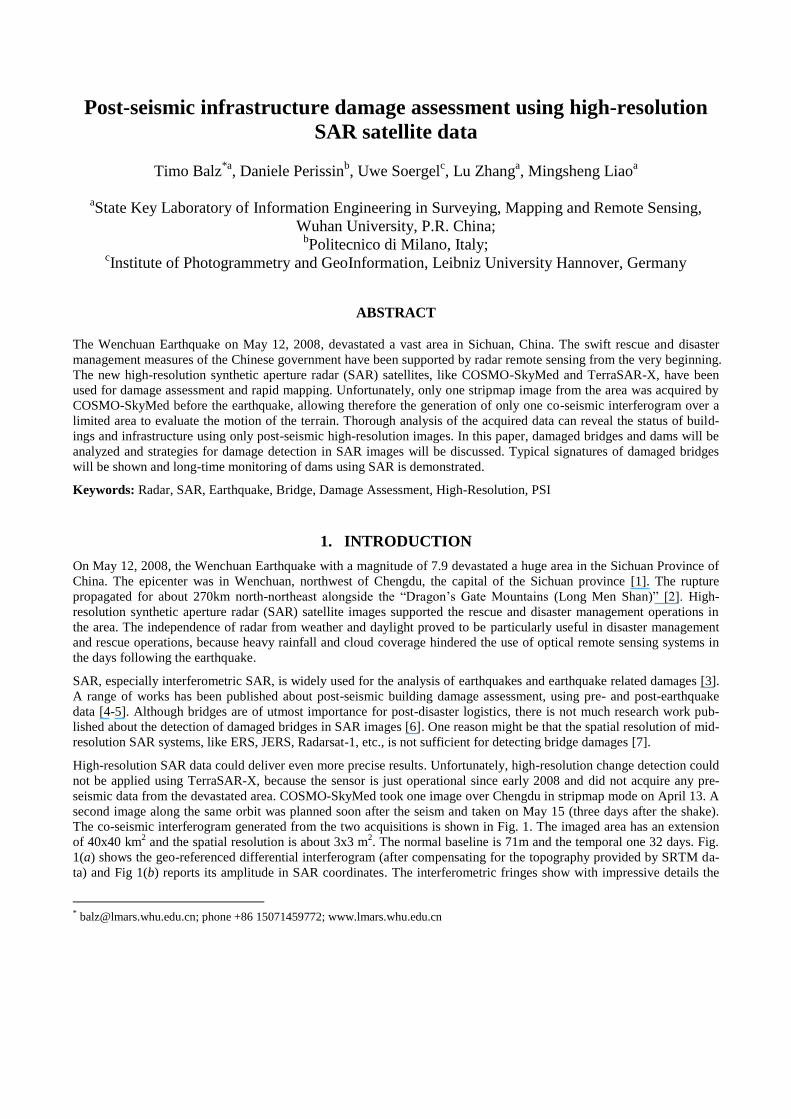
An interesting fact of double-bouncing of 90° dihedrals with flat surfaces is the fact that all double-bounces occurring
between the dihedral have the same length. They are therefore all received by the sensor antenna at the same time.
AB
CB’’
A’’
B’A’
Fig. 3. Double-bouncing of a 90° dihedral.
The situation is sketched in Fig. 3. The distance of each double-bounce is the same as two times the distance between the
foot point of the dihedral and the sensor:
2 ' '' ' ''C A A A B B B
This leads to a very strong overall reflection occurring at the location of the foot point, due to the incoherent summation
of the various double-bounce reflections
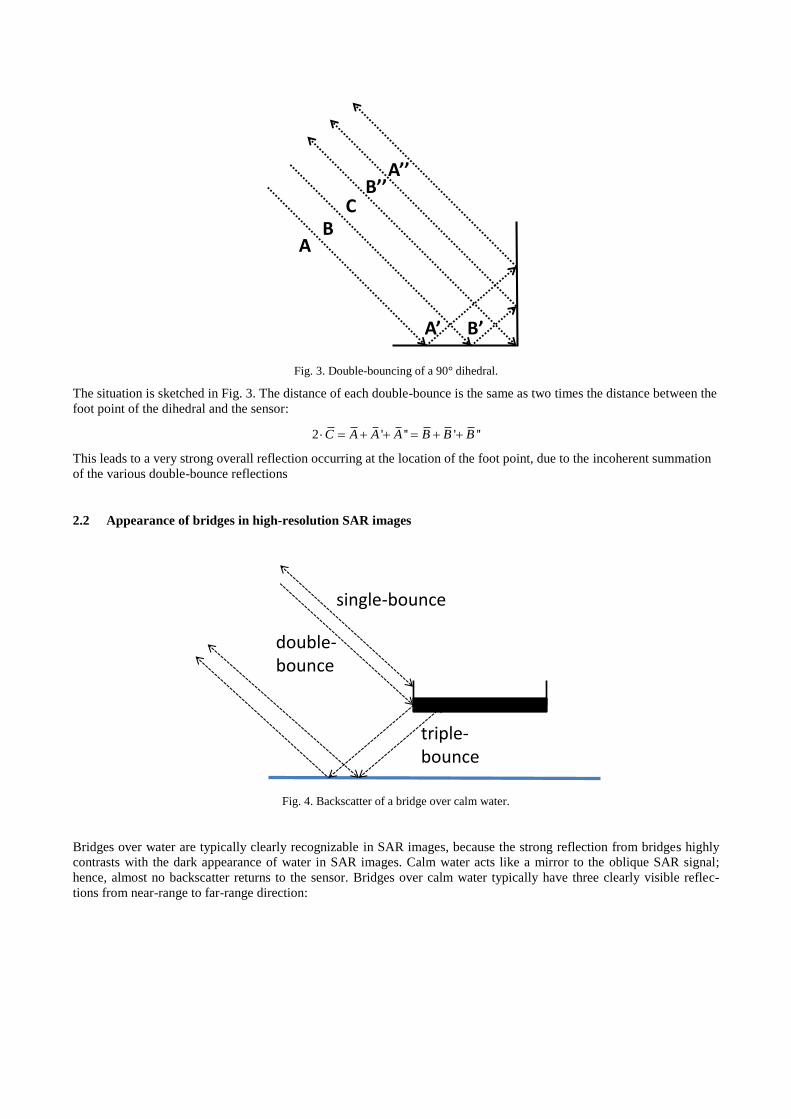
2.2 Appearance of bridges in high-resolution SAR images
single-bounce
double-bounce
triple-bounce
Fig. 4. Backscatter of a bridge over calm water.
Bridges over water are typically clearly recognizable in SAR images, because the strong reflection from bridges highly
contrasts with the dark appearance of water in SAR images. Calm water acts like a mirror to the oblique SAR signal;
hence, almost no backscatter returns to the sensor. Bridges over calm water typically have three clearly visible reflec-
tions from near-range to far-range direction:

1. the single-bounce reflection, caused by a direct reflection of the bridge;
2. the double-bounce reflection, caused by reflections from the bridge to the water and back to the sensor (or vice
versa);
3. the triple-bounce reflection, caused by reflections from the water to the bridge back to the water and finally back
to the sensor.
This is exemplarily illustrated in Fig.4. In SAR scenes with an aspect angle 90o between the orientation of the bridge
and the azimuth direction of the SAR platform, or in scenes with bridges over turbulent water, these features are not visi-
ble.
Often superstructures of bridges are also visible [11], like for example in Fig.5 depicting a SAR image of a bridge over
relatively calm water in Wuhan. The scene in Fig.5 is not geo-referenced. The sensor is illuminating the scene from the
left side. On the left side, near-range of the bridge, the single-bounce reflection of the bridge and the superstructures are
visible, followed by the brighter double-bouncing. The triple-bouncing far-range of the bridge is weaker and blurred due
to small perturbations of the water.
By measuring the distance between the double-bounce reflection of the bridge dbR in ground-range and the ground-range
single-bounce reflectionsbR the height of the bridge above water h can be determined with the incidence angle
i [12].
( ) / cos( )db sb ih R R
Instead of the single-bounce, the triple-bounce position tbR can also be used:
( ) / cos( )tb db ih R R
Fig. 5. TerraSAR-X spotlight image showing a road bridge connecting Hanyang and Hankou in Wuhan, China.

3. DAMAGE ASSESSMENT IN POST-EARTHQUAKE SAR IMAGES
3.1 Analyzing bridges in post-earthquake SAR images
damaged bridge
(a)
damaged bridgecollapsed buildings
(b)
Fig. 6. TerraSAR-X spotlight images showing a bridge south of Maowen (a) and a bridge in the center of Maowen (b). Im-
age acquired on May 16, 2008, from an ascending orbit.
In Fig. 6 two geo-referenced TerraSAR-X spotlight images of damaged bridges in Maowen and south of Maowen are
depicted. The images were acquired from an ascending orbit; hence, the sensor was heading around 350ºand illuminated
the scene from the left side. The remaining parts of the bridges are clearly visible. The damage of the bridges can be
identified by the missing parts of the bridges. The bridge in Fig. 6(a) ends in the middle of the water and in (b) a part of
the bridge is missing. The images are taken from an ascending orbit; therefore, the mountains east of the bridge in Fig.
6(a) do not cast any shadow on the bridge. This is important, because shadows casted on bridges can be mistaken as
bridge damage.
In Fig.7 a bridge near Duanjiangyan city can be seen. The typical single-, double-, triple bounce combination is clearly
visible, especially in the images of May 15 and May 22. The bridge appears to be undamaged. But besides analyzing
damages, bridges in SAR images can also provide useful information about the water level. On May 13, 2008, the water
is around 8m above the water level. The water level dropped afterwards. On May 15, the bridge was approximately 9.2m

above the water level, whereas on May 22 the bridge was around 10.4m above the water level. The level rose back and
on June 6 the bridge is approximately 8.5m above the water level. Using the equations from section 2.3 this can conve-
niently calculated using the incidence angle, which is 49º in the COSMO-SkyMed image from May 13, 46.85º at the
scene center in the image taken on May 15 and 35.09º in the image acquired on May 22. The different water levels can
also be recognized downstream of the bridge.
COSMO-SkyMed May 13
COSMO-SkyMed June 6
TerraSAR-X May 15
TerraSAR-X May 22
Fig. 7. Subsets of two COSMO-SkyMed and two TerraSAR-X images showing a bridge northwest of Duanjiangyan city.
Fig.8 shows the bridge south of Anchang town. The bridge seems to be undestroyed in the image on the left side, but
appears to be destroyed in the image on the right side. The different appearances are caused by the different water levels.
In the image taken on May 15, the water level is high and the bridge shows a clear structure in the SAR image. Due to
the lower water level on May 17, there is no clear double-bouncing between the bridge and the water and the dry river
ground is backscattering in the vicinity of the bridge. This example demonstrates the difficulty of SAR data interpreta-
tion. Attention has to be paid not only to the sensor properties, but also to the changes in the environment while examin-
ing multi-temporal datasets.

Fig. 8. Two TerraSAR-X stripmap images showing a bridge south of Anchang Town. Left side acquired on May 15, 2008
from a descending orbit; right side acquired on May 17, 2008 from an ascending orbit.
In Fig. 9, three SAR images showing two bridges in the center of the Beichuan county town can be seen. Bridge A col-
lapsed due to the earthquake and bridge B was heavily damaged. In Fig. 9(a) the status of bridge A cannot be determined.
Beichuan resides in a deep valley and is surrounded by steep mountain ridges. In the image acquired from a descending
orbit, the valley of bridge A is fore-shortened to just a few pixel. The bridge is barely recognizable and the status of the
bridge is unidentifiable. Bridge B seems undamaged in both stripmap images at Fig. 9(a) and (b). It requires the higher
resolution of a spotlight image to identify the damage. In Fig. 9(c) the partial destruction of bridge B is clearly identifia-
ble due to the shadow casted by the bridge. The collapse of bridge A is also identifiable in the spotlight image.
bridge A ??
(a)
bridge A collapsed
(b)

bridge A collapsed
bridge B damaged
(c)
Fig. 9. Three SAR images showing the status of two bridges in Beichuan county town. (a) TerraSAR-X stripmap image ac-
quired from a descending orbit on May 15, 2008; (b) TeraSAR-X stripmap image acquired from an ascending orbit on
May 22, 2008; (c) COSMO-SkyMed spotlight image acquired from an ascending orbit on May 14, 2008.
COSMO-SkyMed May 13
COSMO-SkyMed June 6
TerraSAR-X May 15
TerraSAR-X May 22
damaged bridge
damaged bridgedamaged bridge
damaged bridge
Fig. 10. Subsets of two COSMO-SkyMed and two TerraSAR-X images showing the Zipingpu Dam.

In Fig.10 a series of high-resolution SAR images showing the Zipingpu Dam can be seen. The Zipingpu Dam, just 500
meters from the fault that failed and 5.5 kilometers from the quake’s epicenter [13], was a high-priority object for post-
earthquake surveillance. Due to its close proximity to the fault line, there were raising concerns about the stability of the
dam. The first post-earthquake COSMO-SkyMed image from May 13 acquired data of the dam and the first TerraSAR-X
spotlight image of the disaster area, taken on May 15, also surveyed the situation of the dam and of Duanjiangyan city
below the dam. Fortunately, the concerns were unfounded as the dam suffered only minor damages [14]. The bridge to
the south of the dam collapsed though, as can be seen in Fig.10.
4. MULTI IMAGE ANALYSIS FOR DAM MONITORING
Whenever repeated images over the same area are available, more advanced analysis become possible. As shown in [15],
exploiting many repeated spaceborne SAR acquisitions at a relatively low resolution (~25m x 5m on the ground), the 3D
position of stable targets can be estimated with sub-meter accuracy. Moreover, by analyzing scattering pattern and pola-
rimetric response of the targets, their main radar characteristics can be estimated and a system for automatic detection of
manmade target typologies (resonating structures, mirrors, poles, dihedrals and trihedrals) can be developed. The inter-
pretation of millimetric deformations detected by the radar can then be improved and the identification of multi-sensor
targets allows the combination of data acquired with different orbits, frequencies and polarizations, increasing the num-
ber of deformation measurements and the number of detected targets [16].
Unfortunately over the earthquake area of interest no data stack is available at this moment. More in general, high-
resolution spaceborne archives are still being acquired. To give an idea of what could be achieved with time series of
high resolution SAR data, we briefly report the results got by analyzing 40 Envisat images over the Three Gorges Dam,
spanning the period 2003-2008. Fig.11 shows all the detected Permanent Scatterers on the dam [17-18], indicating with a
color scale their height with respect to a reference point in the image. Fig.12 reports the millimetric deformation time
series estimated for two Permanent Scatterers on the dam. As visible from Fig.12, a slight seasonal trend can be appre-
ciated, likely due to the seasonal character of the Yangtze river, generating a higher pressure on the dam when the water
level increases.
Fig. 11. Permanent Scatterers detected on the Three Gorges Dam. Color scale: estimated height w.r.t a reference point.

Fig. 12. Deformation time series examples for two Permanent Scatterers detected on the Three Gorges Dam.
5. CONCLUSION
Using high-resolution spaceborne SAR systems, damaged and collapsed bridges can be identified, but the identification
of damaged bridges using only one single SAR image is difficult. Using high-resolution spotlight data increases the abili-
ty to assess bridge damages correctly. High resolutions are crucial and using very high-resolution SAR systems is most
beneficial for the detection of damaged buildings [19-20] and bridges, but such airborne systems are not available in
many countries. In disaster management though, even the spotlight mode of high-resolution SAR satellite systems can
seldom be used if a large area is affected by the disaster and has to be covered as fast as possible.
Persistent Scatterer Interferometry (PSI) is an important tool in risk analysis. Besides monitoring dams and bridges, PSI
can also be used for subsidence monitoring. The subsidence information gained from PSI can be used for mapping areas
endangered by landslides. Knowing which areas are endangered by earthquake induced landslides, can support the post-
disaster image interpretation.
SAR proved to be particularly useful for disaster management in the aftermath of the Wenchuan Earthquake. Damaged
infrastructure was recognized in high-resolution SAR images independently from the weather, at day and night. Fur-
thermore, the co-seismic interferogram, shown in Fig. 1, proves the great potential of the new generation of high-
resolution SAR satellites for ground motion monitoring.
ACKNOWLEDGMENT
The authors would like to thank the Infoterra GmbH, Beijing Spot Image, and Beijing Earth Observation Inc. for their
help and support. Parts of the work in the paper were supported by the National Key Basic Research and Development
Program of China (Contract No. 2007CB714405) and China Postdoctoral Science Foundation (20080440952).

REFERENCES
[1] Stone, R., “An Unpredictably Violent Fault”, Science 320, 1578-1580 (2008). [2] Royden, L.H, Burchfiel, B.C. and van der Hilst, R.D., “The Geological Evolution of the Tibetan Plateau,” Science
321, 1054-1058 (2008). [3] Massonnet, D., Rossi, M., Carmona, C., Adragna, F., Peltzer, G., Feigl, K. and Rabaute, T., “The displacement field
of the Landers earthquake mapped by radar interferometry,” Nature 364, 138–142 (1993). [4] Yonezawa, H.A. and Takeuchi, S., “Decorrelation of SAR data by urban damage caused by the 1995 Hoyogoken-
Nanbu earthquake,” International Journal of Remote Sensing 22, 1585-1600 (2001). [5] Matsuoka, M., Yamazaki, F. and Ohkura, H., “Damage mapping of the 2004 Niigata-ken Chuetsu earth-quake using
Radarsat images,” Proc. 2007 Urban Remote Sensing Joint Event, Paris, France (2007). [6] Gamba, P., Dell’Acqua, F. and Trianni, G., “Rapid Damage Detection in the Bam Area Using Multitemporal SAR
and Exploiting Ancillary Data,” IEEE Transactions on Geoscience and Remote Sensing 45, 1582-1589 (2007). [7] Adams, B., Huyck, C., Mansouri, B and Eguchi, R., “Post-disaster bridge damage assessment,” Proc. Joint ISPRS
and TRM Conference, Denver (2002). [8] Griesser, T. and Balanis, C.A., “Backscatter analysis of dihedral corner reflectors using physical optics and physical
theory of diffraction,” IEEE Transactions on Antennas Propagation 25, 1137-1147 (1987). [9] Lee, J.S., Ainsworth, T.L., Krogagor, E. and Boerner, W.-M., “Polarimetric Analysis of Radar Signature of a Man-
made Structure,” Proc. 2006 IEEE International Geoscience and Remote Sensing Symposium and 27th
Canadian
Symposium on Remote Sensing (IGARSS 2006), Denver, Colorado (2006). [10] Soergel, U., Cadario, E., Thiele, A. and Thoennessen, U., “Feature Extraction and Visualization of Bridges Over
Water From High-Resolution InSAR Data and One Orthophoto,” IEEE Journal of Selected Topics in Applied Earth
Observations and Remote Sensing 1, 147-153 (2008). [11] Raney, R.K., “Radar Fundamentals: Technical Perspective,” Henderson, F.M. and Anthony, J. L. (Eds.): Manual of
Remote Sensing 3rd Edition: Principles and Applications of Imaging Radar, vol. 2, pp. 9–130 (1998). [12] Robalo J. and Lichtenegger J., “ERS-SAR Images a bridge,” ESA, Earth Observation Quarterly [Online], available
at: http://esapub.esrin.esa.it/eoq/eoq64/bridge.pdf, pp. 7–10 (Dec. 1999). [13] Kerr, R.A. and Stone, R., “A Human Trigger for the Great Quake of Sichuan?” Science 323, 322 (2009). [14] Wang, Z., “A preliminary report on the great Wenchuan earthquake”, Earthquake Engineering and Engineering Vi-
bration 7, 225-234 (2008). [15] Perissin, D. and Ferretti, A., “Urban target recognition by means of repeated spaceborne SAR images,” IEEE Trans-
actions on Geoscience and Remote Sensing 45, 4043-4058 (2007). [16] Perissin, D., Prati, C., Rocca, F., Li, D.R. and Liao, M.S., “Multi-track PS analysis in Shanghai,” Proc. ENVISAT
2007, Montreux, Switzerland (2007). [17] Perissin, D., Rocca, F. and Wang, T., “DEM retrieval and landslide monitoring in Badong, Three Gorges, China by
means of InSAR partially coherent targets,” Proc. Dragon Symposium 2007, Aix en Provence, France (2007). [18] Ferretti, A., Prati, C. and Rocca, F., “Permanent scatterers in SAR interferometry,” IEEE Transactions on Geos-
cience and Remote Sensing 39, 8-20 (2001). [19] Brenner, A. and Roessing, L., “Radar Imaging of Urban Areas by Means of Very High-Resolution SAR and Interfe-
rometric SAR”, IEEE Transactions on Geoscience and Remote Sensing 46, 2971-2982 (2008). [20] Soergel, U., Thoennessen, U., Brenner, A. and Stilla, U., “High-resolution SAR data: new opportunities and chal-
lenges for the analysis of urban areas”, IEE Proceedings Radar, Sonar & Navigation 153, 294-300 (2006).