Boron absorption and redistribution in green dwarf coconut tree
Upload
independentCategory
view
4download
0
Geophys. J. Int. (2003) 153, 187–200
Possible mechanisms of magma redistribution under Mt Etna duringthe 1994–1999 period detected through microgravity measurements
D. Carbone, G. Budetta and F. GrecoIstituto Nazionale di Geofisica e Vulcanologia, Sezione di Catania, Piazza Roma 2, 95123 Catania, Italy. E-mail: [email protected]
Accepted 2002 October 23. Received 2002 October 8; in original form 2002 April 3
S U M M A R YWe analyse a microgravity data set acquired along the Etna network and spanning a 5 yearlong period (1994–1999). The main feature observed is a complete gravity increase (1994–1996)–decrease (1997–1999) cycle mainly affecting the southeastern sector of the volcanoand reaching a maximum amplitude of approximately 100 µGal peak-to-peak. The gravitychanges are principally due not to elevation changes but rather to the direct gravitational effectof magma accumulation and drainage below the volcanic pile. In particular, a complete massincrease–decrease cycle took place within a 2–4 km bsl deep reservoir that is elongated, orientedNNW–SSE, and lies in the southeastern sector of the volcano. The observed cycle accountsfor a volume of magma ranging between 3 and 10 × 108 m3, which is believed to have passedthrough the inferred reservoir between 1994 and 1999. Since most of this magma has not beenerupted nor accumulated at shallower levels (at the summit Etna stations a compatible gravityincrease has not been observed), it could have been recycled by the Etna plumbing system,sinking down to a level deeper than that of the inferred source.
Key words: array, density, gravity, magma, reservoirs, volcanic activity.
1 I N T RO D U C T I O N
The study of microgravity changes has been shown to provide pre-cious pieces of information concerning the subsurface mass redis-tributions occurring in active areas. In particular, movements and/ordensity changes of subsurface magma bodies have been detected atmany active volcanoes around the world and associated with theongoing volcanic activity (Jachens & Eaton 1980; Sanderson 1982;Eggers 1983; Rymer & Brown 1987; Berrino et al. 1992; Rymeret al. 1993, 1995, 2000; Budetta & Carbone 1998; Budetta et al.1999).
It is approximately 15 years since microgravity observations werestarted at Mt Etna (Budetta et al. 1989). These observations haveallowed mass redistributions occurring at depths ranging betweenapproximately 6 km bsl and a few hundred metres below the sur-face (magma level changes within the shallower parts of the feedingconduits) to be detected. In particular, a gravity increase for 2 yearsbefore the 1989 eruption was detected and was attributed to accumu-lation of magma in an elongate zone oriented NNW–SSE, between2.5 and 6 km below sea level (Budetta & Carbone 1998). The sub-sequent sudden gravity decrease was attributed to magma drainagefrom this source zone. This magma supplied the 1989 and 1990eruptions and also probably fed the start of the 1991–1993 eruption,since this event was not preceded by significant mass changes atthe inferred source zone (Budetta & Carbone 1998). A large grav-ity increase, detected across the volcano between 1992 June andSeptember, is consistent with the arrival in the same accumulation
zone of new magma, thus favouring continued flank effusion until1993 (Budetta & Carbone 1998). A decrease in magma level in theconduits feeding the summit craters of Etna during the closing stagesof the 1991–1993 event could also be detected through analysis ofgravity variations by Budetta & Carbone (1998).
Gravity changes detected at Mt Etna between 1994 and 1999 arepresented and discussed in the following. Data acquired during the1994–1996 period were already analysed by Budetta et al. (1999)and just some of them are presented again in the next sections to bothprovide a more complete picture of the changes observed at Mt Etnaafter the 1991–1993 eruption and to improve some of the previousestimates (such as the gravity effect of the water-table fluctuationsat Mt Etna) on the grounds of the new data now available.
2 M I C RO G R AV I T Y M E A S U R E M E N T SAT M T E T N A
2.1 The Etna gravity network
Gravity measurements have been carried out at Mt Etna since 1986.The gravity network (Fig. 1) is now composed of 69 stations 0.5–3 km apart, covers an area of approximately 400 km2 and consists offour integrated subarrays (Budetta & Carbone 1998; Budetta et al.1999):
(1) the main network (established in 1986) of 27 stations, sep-arated by distances of 3–4 km, are arranged as a ring around thevolcano at elevations of between 800 and 2000 m asl;
C© 2003 RAS 187
by guest on May 1, 2016
http://gji.oxfordjournals.org/D
ownloaded from
188 D. Carbone, G. Budetta and F. Greco
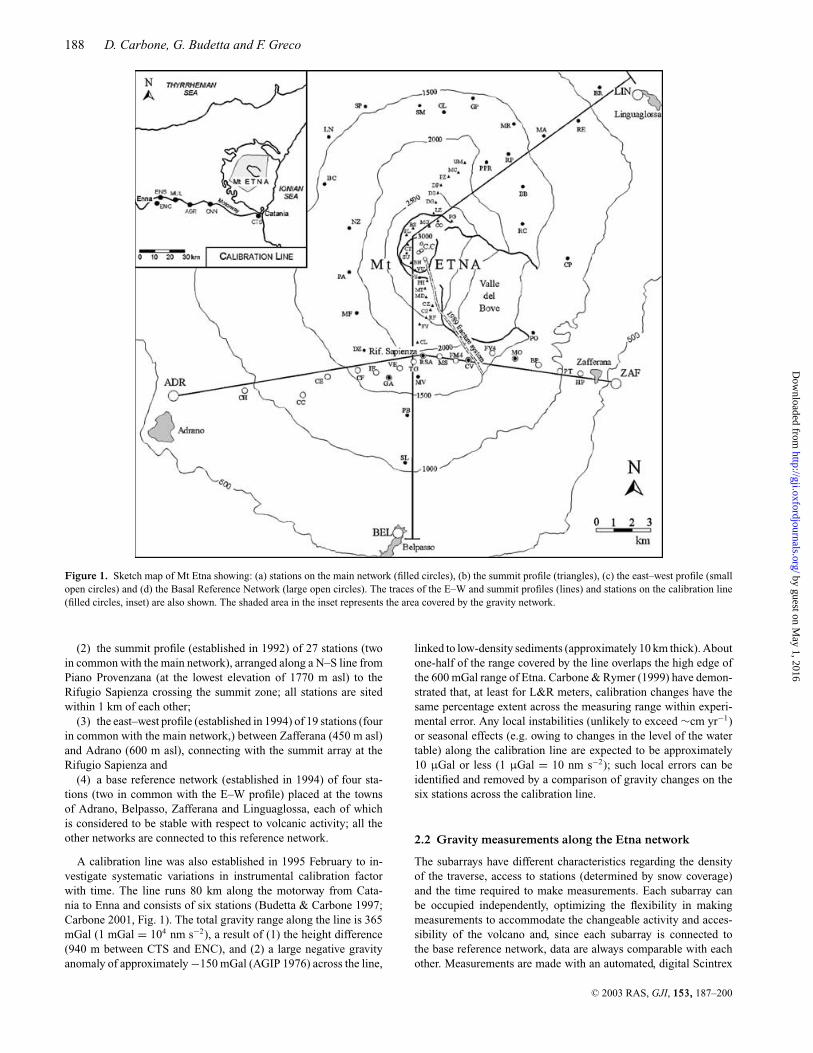
Figure 1. Sketch map of Mt Etna showing: (a) stations on the main network (filled circles), (b) the summit profile (triangles), (c) the east–west profile (smallopen circles) and (d) the Basal Reference Network (large open circles). The traces of the E–W and summit profiles (lines) and stations on the calibration line(filled circles, inset) are also shown. The shaded area in the inset represents the area covered by the gravity network.
(2) the summit profile (established in 1992) of 27 stations (twoin common with the main network), arranged along a N–S line fromPiano Provenzana (at the lowest elevation of 1770 m asl) to theRifugio Sapienza crossing the summit zone; all stations are sitedwithin 1 km of each other;
(3) the east–west profile (established in 1994) of 19 stations (fourin common with the main network,) between Zafferana (450 m asl)and Adrano (600 m asl), connecting with the summit array at theRifugio Sapienza and
(4) a base reference network (established in 1994) of four sta-tions (two in common with the E–W profile) placed at the townsof Adrano, Belpasso, Zafferana and Linguaglossa, each of whichis considered to be stable with respect to volcanic activity; all theother networks are connected to this reference network.
A calibration line was also established in 1995 February to in-vestigate systematic variations in instrumental calibration factorwith time. The line runs 80 km along the motorway from Cata-nia to Enna and consists of six stations (Budetta & Carbone 1997;Carbone 2001, Fig. 1). The total gravity range along the line is 365mGal (1 mGal = 104 nm s−2), a result of (1) the height difference(940 m between CTS and ENC), and (2) a large negative gravityanomaly of approximately −150 mGal (AGIP 1976) across the line,
linked to low-density sediments (approximately 10 km thick). Aboutone-half of the range covered by the line overlaps the high edge ofthe 600 mGal range of Etna. Carbone & Rymer (1999) have demon-strated that, at least for L&R meters, calibration changes have thesame percentage extent across the measuring range within experi-mental error. Any local instabilities (unlikely to exceed ∼cm yr−1)or seasonal effects (e.g. owing to changes in the level of the watertable) along the calibration line are expected to be approximately10 µGal or less (1 µGal = 10 nm s−2); such local errors can beidentified and removed by a comparison of gravity changes on thesix stations across the calibration line.
2.2 Gravity measurements along the Etna network
The subarrays have different characteristics regarding the densityof the traverse, access to stations (determined by snow coverage)and the time required to make measurements. Each subarray canbe occupied independently, optimizing the flexibility in makingmeasurements to accommodate the changeable activity and acces-sibility of the volcano and, since each subarray is connected tothe base reference network, data are always comparable with eachother. Measurements are made with an automated, digital Scintrex
C© 2003 RAS, GJI, 153, 187–200
by guest on May 1, 2016
http://gji.oxfordjournals.org/D
ownloaded from

1994–1999 magma redistribution under Mt Etna 189
CG-3M gravimeter (serial number 9310234; Budetta & Carbone1997). Measurements over the whole array are usually conductedevery 6 months by the step method (Watermann 1957), in whichadjacent stations are connected at least three times. Some parts ofthe array are reoccupied more frequently (approximately monthlymeasurements along the E–W and summit profiles, although snowcoverage restricts measurements along the summit profile to theJune–October period). Because of the more frequent measurementsand the high station density (at least 1 station km−1), the E–W andsummit profiles provide the core microgravity data for Etna. Sta-tions along the calibration line and summit profile are occupied insequence, the arrays being traversed at least two (summit profile)or three (calibration line) times for each survey (profile method;Watermann 1957).
2.2.1 Control of instrumental drift and the calibration factor
The regular control of instrumental drift and the calibration factorare fundamental to maintaining high precision with the ScintrexCG-3M gravimeter. The stationary component of the drift of CG-3M is very strong but is almost linear over intervals of a few days.Drift can therefore be accurately forecast and the effect removed bythe automatic real-time compensator of the instrument, to standardssuitable for our purposes (a few tens of µGal d−1; Budetta & Carbone1997; Carbone 2001).
The first measurements made at Etna with Scintrex CG-3M9310234 between 1994 and 1995 strongly suggested that the metercould have been affected by a gradual increase in the instrumen-tal calibration factor since large (apparent) gravity changes wereobserved during a quiescent period and a strong correlation be-tween gravity change and gravity value was detected at every sta-tion. Accordingly, a new calibration line was established in 1995February to investigate systematic variations in the calibration fac-tor ( f ) with time (Fig. 1). A significant positive correlation wasfound between gravity changes with time and gravity values alongthe line (regression coefficients >0.9, standard errors of estimatebetween 2.3 and 6.1 µGal (6–16 ppm)). Data from the calibrationline have been combined with data previously assessed along theE–W profile to describe the changes in f since the first campaignof CG-3M 9310234 at Etna (Budetta & Carbone 1997). A gradualcalibration factor increase of approximately 1250 ppm was deter-mined between 1994 August, when the instrument was first used,and 1995 August (Budetta & Carbone 1997; Carbone 2001, Fig. 2).After a lower-rate decrease during the next year (approximately 250ppm between 1995 August and 1996 August), the calibration of theinstrument stabilized (Fig. 2) with a standard deviation of just 37ppm (corresponding to 13.5 µGal over the 365 mGal range of thecalibration line), very close to the uncertainty on each f -estimatealong the line (typically 32 ppm at the 95 per cent confidence in-terval). In 1997 August CG-3M 9310234 was sent to Canada forservicing. Its calibration abruptly changed afterwards (Fig. 2), butthe subsequent calibration shifts were close to the values for the pre-vious year (standard deviation over the 1998 February–1999 Juneperiod (seven points) of 50 ppm). The importance of properly cor-recting for uncertainties in instrument calibration are to be stressed.Even the small error of 32 ppm on each f -estimate along the linecould generate a fictitious gravity change of ±10 µGal along theE–W profile of Etna (gravity range of 300 mGal) and ±20 µGalover the complete microgravity network of Etna (gravity range of600 mGal). Correlation studies provide a simple and efficientmethod of estimating changes in f with time and, thereby, of iden-tifying and eliminating any such fictitious anomalies.
Figure 2. Time variation of the CG-3M calibration factor, derived fromfield data along the calibration line of Etna. The variations are referredto 1994 August measurements, in which the value of f supplied by themanufacturer was assumed.
2.2.2 Precision of measurements performed on Etna with theScintrex CG-3M gravimeter
To evaluate the precision of the Scintrex CG-3M 9310234 gravime-ter under the conditions encountered on Mt Etna, the instrumentwas site tested during the first year of its employment (Budetta& Carbone 1997). Using 471 gravity differences (�g) obtainedbetween 18 pairs of stations along the E–W profile (asphaltedroads, stations less than 2 km apart), a standard deviation of thedifferences of �g from the average values of each campaign of3.5 µGal was calculated (Budetta & Carbone 1997, Fig. 3). Wecame to the same result using 69 �g values obtained between 12pairs of stations (3–6 km apart) on dirt tracks (main network). Inthe case of 28 �g values gathered between five pairs of stationsbelonging to the base reference network (stations 20–50 km apart),the standard deviation of the differences of the �g values fromthe average values of each campaign was 4.4 µGal (Budetta &Carbone 1997). The above standard deviations imply uncertain-ties of ±7 µGal (affecting measurements along the E–W profileand main network) and ±9 µGal (affecting measurements alongthe base reference network), respectively, at the 95 per cent confi-dence interval. The profile method (Watermann 1957, Section 2.2),which is normally used to survey the summit profile because of lo-gistic reasons (difficulty in manoeuvring a car along the narrowand dirty road crossing the summit Etna zone, the necessity of
Figure 3. The standard deviation of the differences of �g from the averagevalues for each measuring campaign. The 471 measurements were obtainedwith the CG-3M during nine separate campaigns along the E–W profile ofEtna between 1994 and 1995. Measurements were made between 18 pairsof stations connected by asphalted roads (from Budetta & Carbone 1997).
C© 2003 RAS, GJI, 153, 187–200
by guest on May 1, 2016
http://gji.oxfordjournals.org/D
ownloaded from

190 D. Carbone, G. Budetta and F. Greco
accomplishing the measurements as fast as possible to minimizethe exposure of personnel during paroxysmal activity, etc.), implieserrors larger than those affecting subarrays with stations separatedby the same distance (E–W profile and main network) which aremeasured using the step method. These larger errors are causedby transport drift (Torge 1989), which is the effect of mechanicaland thermal shocks, feature a marked non-linear behaviour and be-come more important when the profile method is followed becausethe gravimeter is driven for a longer time before a given stationis re-occupied. The standard deviation of 237 differences betweenmeasurements obtained at each station of the summit profile duringa single campaign is 5.8 µGal, yielding an uncertainty of ±11 µGalat the 95 per cent confidence interval. The error in temporal gravitydifferences is estimated by calculating
√2×e (Rymer 1989), where
e is the error on a single survey. Thus, at the 95 per cent confidenceinterval, the error on temporal gravity differences along the E–Wprofile is 10 µGal, while the error on temporal gravity differencesalong the summit profile is 15 µGal.
3 V O L C A N I C A C T I V I T Y D U R I N GT H E 1 9 9 7 – 1 9 9 9 P E R I O D
During the first months of 1997 volcanic activity at Mt Etna re-mained at low levels. It started increasing in July when pyroclasticcones began to form inside Bocca Nuova (BN; Fig. 4), lava be-gan to spill from the Southeast Crater (SEC; Fig. 4) rim and theVoragine (VOR; Fig. 4) and the Northeast Crater (NEC; Fig. 4)started producing mild strombolian activity. During 1998 January,marked fluctuations in the intensity of the activity at BN, SEC and
Figure 4. Sketch map of the summit zone of Mt Etna showing the fourcentral craters. BN, Bocca Nuova; NEC, Northeast Crater; SEC, SoutheastCrater; VOR, Voragine.
VOR were observed together with a subsidence of the magma col-umn within the BN and the resumption of seismic activity belowthe western flank of the volcano. During the following months, theactivity at the craters stabilized again and the SEC became the fo-cus of the summit activity. During the spring and early summer of1998 a gradual rise in the activity from all the craters took place.On July 22 a paroxysmal eruptive episode was produced by VORfollowed by the first lava flow from the area of the former CentralCrater since 1964. It covered the road connecting the northern andsouthern flanks of Etna. Vigorous activity at BN and SEC occurredsimultaneously with the paroxysmal event from VOR, indicatingthat the episode affected much of the central conduit system at somedepth (Smithsonian Institution 1998). The SEC, which had been innearly continuous activity since 1996 November, remained totallyquiet after the event on July 22. On September 15 it reactivated,producing a lava fountaining episode. It was the first of 21 parox-ysmal episodes produced by SEC until 1999 February 4. The othersummit craters remained quiet during this period. During the pre-vious lava fountaining episode a fracture formed on the SE flank ofSEC and lava started flowing from it. While mild explosive activityand vigorous lava emission continued at this new fissure, activity atthe other craters gradually ceased. In the summer of 1999 activityfrom VOR and BN gradually resumed while explosions took placedeep inside the NEC conduit. On the fourth of September a stronglava fountain episode was produced by VOR with an eruption col-umn rising ∼2 km high before being blown downwind (SmithsonianInstitution 1999). A revival of strombolian activity occurred a fewhours after this event at SEC with the formation of a new fracture atthe base of the cone, to the north of the previous one, renewing lavaemission. Activity at BN became more energetic after the event onSeptember 4 and climaxed with five lava fountaining episodes. Asa consequence of this activity, the crater was filled with pyroclasticmaterial and lava overflowed on October 17 producing a lava fieldextending towards Monte Nunziata (1750 m asl), which crossedthe road connecting the northern and southern flanks of Etna. InNovember the activity from both BN and SEC came to an end.
4 DATA P R E S E N TAT I O N
As stated in Section 2.2, the E–W and summit profiles provide thecore microgravity data for Etna. Thus, in the following sectionswe refer mainly to data from those profiles while data from theremaining stations of the network (surveyed once or twice a year;Section 2.2) are used to better constrain the areal extent of the gravitychanges assessed through data from E–W and summit profiles.
4.1 Data from the E–W profile
Variations of gravity with time measured along the E–W profile(Fig. 1) between 1994 August and 1999 September are shown inFig. 5. The most evident features are (1) the gravity increase startingduring the final months of 1995 and culminating at the end of 1996,which was discussed by Budetta et al. (1999) and (2) the subsequentgravity decrease continuing until 1999 and bringing the mean valueof gravity at each station affected by the change to a lower level thanit was in 1994–1995, before the increase took place. Both changesaffect mainly the sequences from the eastern limb of the profile andreach the maximum amplitude (+100 and −120 µGal peak-to-peak,respectively) at stations FV4 and CV. It is important to stress thatgravity changes at station CH, the closest to the reference station(ADR, approximately 4 km apart), remain within 20 µGal peak-to-peak during the entire period.
C© 2003 RAS, GJI, 153, 187–200
by guest on May 1, 2016
http://gji.oxfordjournals.org/D
ownloaded from

1994–1999 magma redistribution under Mt Etna 191
Figure 5. Variation of gravity with time along the E–W profile between 1994 August and 1999 August corrected for the gravity effect of seasonal water-tablefluctuations.
Besides the overall changes already presented, other shorter-period changes were observed at the E–W profile stations duringthe time interval considered. The most significant (being describedby four subsequent points) is the increase observed between 1998April and August (with a maximum amplitude of 40 µGal at sta-tion RSA) followed by a sudden decrease between 1998 August andOctober.
4.2 Data from the summit profile
Gravity changes observed at 16 stations of the summit profile (Fig. 1)between 1994 and 1999 are shown in Fig. 6. Given the inaccessibilityof most stations of the profile during the winter time because of snowcoverage, all the available points cluster on the June–October periodof each year and thus the time resolution of the available sequencesis not as good as that of the sequences from the E–W profile stations.Nevertheless, the same increase–decrease cycle already found in thedata from the E–W profile is recognizable. However, in the case ofdata from the summit profile the increase at the very summit stations(from FS to CO) is swamped by the effect of an additional (shal-lower) source causing a shorter-wavelength (approximately 5 km;centred on the crater zone) and shorter-period (1994 September–1996 July) cycle (Budetta et al. 1999). Also, the sequences lack the
1996/97 winter data (apart from the southernmost stations, fromCL to PH, which were measured in 1997 November) during which,according to the E–W profile data, the climax of the main cycle tookplace. So the gravity increase was not recognized by Budetta et al.(1999) for the summit profile data. It is noticeable that during thesummer of 1997 a step increase was also observed at station SU, oneof the closest stations to the summit craters zone, indicating a massredistribution in the shallowest part of the plumbing system of Etna.Other shorter-period anomalies are superimposed on the general de-crease (Fig. 6). The most significant one is the decrease–increasecycle that took place between 1999 June and October and reached 80µGal peak-to-peak at station LZ (Carbone et al. in press). It is note-worthy that, during the summers of 1997 and 1998, measurementsat an unusually high rate (weekly to fortnightly) were accomplishedalong the summit profile (Fig. 6). The standard errors of estimate onthe regression lines through these data are between 2 and 15 µGal,in good agreement with the uncertainty of ±11 µGal affecting datafrom the summit profile (Section 2.2.2).
4.3 Data from the entire Etna network
The entire Etna network (i.e. E–W and summit profiles plus mainnetwork; Section 2 and Fig. 1) was measured twice a year until 1997
C© 2003 RAS, GJI, 153, 187–200
by guest on May 1, 2016
http://gji.oxfordjournals.org/D
ownloaded from

192 D. Carbone, G. Budetta and F. Greco
Figure 6. Variation of gravity with time at some stations belonging to the summit profile between 1994 August and 1999 October.
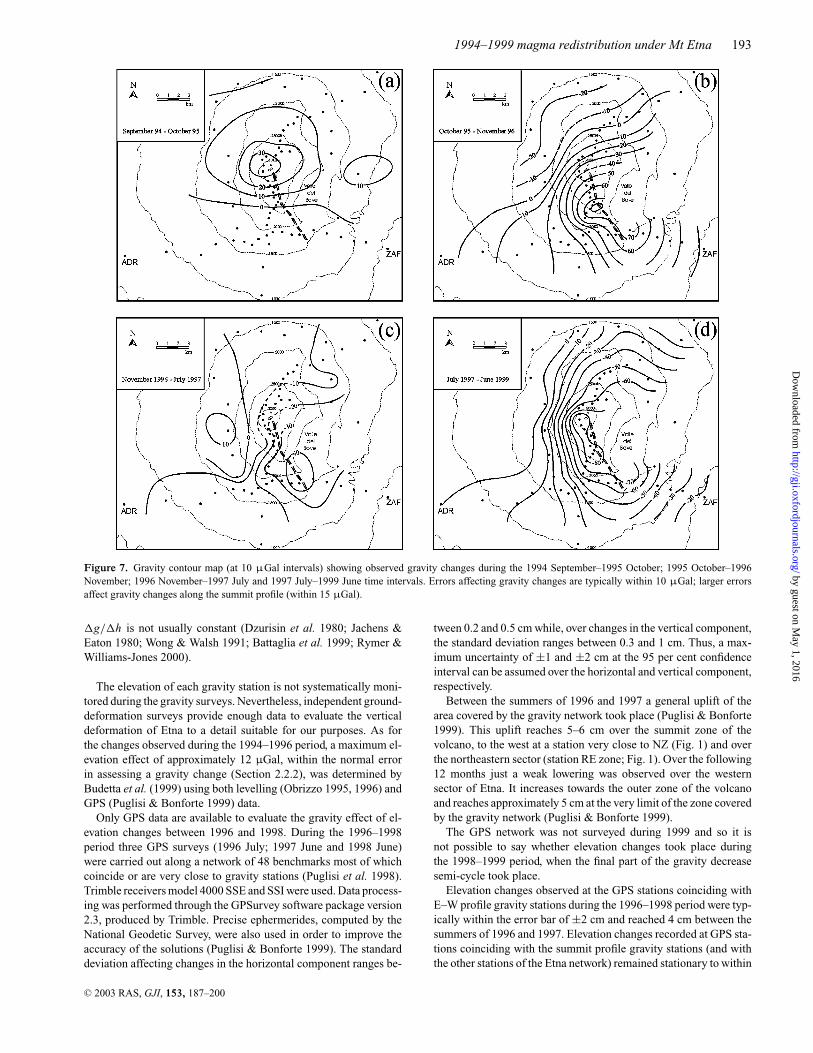
(June–July and September–October) and just once a year in 1998 and1999. In Fig. 7 contour maps of some gravity changes from the entireEtna network are shown. All maps show only the changes alreadyidentified from the E–W and summit profiles stations, indicating anabsence of major mass redistributions elsewhere within the gravitynetwork. The second map (Fig. 7b, 1995 October–1996 November)lacks information from the summit stations (between Stations VUand UM, Fig. 1), owing to extensive snow cover in 1996 Novem-ber. Even so, a wide anomaly corresponding to the gravity increasealready described from the profile data is apparent, with a maxi-mum amplitude of approximately 80 µGal (Budetta et al. 1999).The gravity decrease discussed above, which took place betweenthe 1996/97 winter and the summer of 1999, also clearly appearsin the previous two maps (Figs 7c and d; 1996 November–1997 Julyand 1997 July–1999 June).
5 P O S S I B L E P E RT U R B AT I O N ST O T H E DATA
5.1 Elevation changes
Besides the redistribution of subsurface masses, changes in surfaceelevation also cause a gravity change at active volcanoes as theedifice inflates and deflates. Thus gravity and displacement data
must be analysed together in order to correctly identify subsurfaceprocesses in volcanic areas (Fernandez et al. 2001). Three basiccategories of relationship between gravity and elevation changescan be recognized (Rymer 1996; Budetta & Carbone 1998).
(1) Gravity variations are caused by the inflation or deflation of ashallow magma chamber, as magma is injected or withdrawn. In thiscase changes in gravity (�g) and elevation (�h) are well correlatedwith a constant value of �g/�h which, for typical densities ofbasaltic magma, is approximately −233 µGal m−1 (Johnsen et al.1980; Torge 1981; Berrino et al. 1984; Eggers 1987).
(2) Gravity changes are caused by variations in static magmadensity (e.g. during degassing), by fluctuations in the level of thewater table, or by the injection of magma into previously open dykes.In this case changes in gravity are not accompanied by significantchanges in elevation (Sanderson 1982; Rymer et al. 1993; Jentzschet al. 2001).
(3) Gravity changes are caused by magma injection or with-drawal coupled with other processes causing a change in bulk density(magma filling and emptying microfractures within a chamber; re-placement of relatively low-density summit magma (being eruptedor intruded along dykes) by denser magma rising from depth; mi-gration of magma between a chamber and a surrounding porouszone, etc.). In this case �g and �h are again well-correlated, but
C© 2003 RAS, GJI, 153, 187–200
by guest on May 1, 2016
http://gji.oxfordjournals.org/D
ownloaded from
1994–1999 magma redistribution under Mt Etna 193
Figure 7. Gravity contour map (at 10 µGal intervals) showing observed gravity changes during the 1994 September–1995 October; 1995 October–1996November; 1996 November–1997 July and 1997 July–1999 June time intervals. Errors affecting gravity changes are typically within 10 µGal; larger errorsaffect gravity changes along the summit profile (within 15 µGal).
�g/�h is not usually constant (Dzurisin et al. 1980; Jachens &Eaton 1980; Wong & Walsh 1991; Battaglia et al. 1999; Rymer &Williams-Jones 2000).
The elevation of each gravity station is not systematically moni-tored during the gravity surveys. Nevertheless, independent ground-deformation surveys provide enough data to evaluate the verticaldeformation of Etna to a detail suitable for our purposes. As forthe changes observed during the 1994–1996 period, a maximum el-evation effect of approximately 12 µGal, within the normal errorin assessing a gravity change (Section 2.2.2), was determined byBudetta et al. (1999) using both levelling (Obrizzo 1995, 1996) andGPS (Puglisi & Bonforte 1999) data.
Only GPS data are available to evaluate the gravity effect of el-evation changes between 1996 and 1998. During the 1996–1998period three GPS surveys (1996 July; 1997 June and 1998 June)were carried out along a network of 48 benchmarks most of whichcoincide or are very close to gravity stations (Puglisi et al. 1998).Trimble receivers model 4000 SSE and SSI were used. Data process-ing was performed through the GPSurvey software package version2.3, produced by Trimble. Precise ephermerides, computed by theNational Geodetic Survey, were also used in order to improve theaccuracy of the solutions (Puglisi & Bonforte 1999). The standarddeviation affecting changes in the horizontal component ranges be-
tween 0.2 and 0.5 cm while, over changes in the vertical component,the standard deviation ranges between 0.3 and 1 cm. Thus, a max-imum uncertainty of ±1 and ±2 cm at the 95 per cent confidenceinterval can be assumed over the horizontal and vertical component,respectively.
Between the summers of 1996 and 1997 a general uplift of thearea covered by the gravity network took place (Puglisi & Bonforte1999). This uplift reaches 5–6 cm over the summit zone of thevolcano, to the west at a station very close to NZ (Fig. 1) and overthe northeastern sector (station RE zone; Fig. 1). Over the following12 months just a weak lowering was observed over the westernsector of Etna. It increases towards the outer zone of the volcanoand reaches approximately 5 cm at the very limit of the zone coveredby the gravity network (Puglisi & Bonforte 1999).
The GPS network was not surveyed during 1999 and so it isnot possible to say whether elevation changes took place duringthe 1998–1999 period, when the final part of the gravity decreasesemi-cycle took place.
Elevation changes observed at the GPS stations coinciding withE–W profile gravity stations during the 1996–1998 period were typ-ically within the error bar of ±2 cm and reached 4 cm between thesummers of 1996 and 1997. Elevation changes recorded at GPS sta-tions coinciding with the summit profile gravity stations (and withthe other stations of the Etna network) remained stationary to within
C© 2003 RAS, GJI, 153, 187–200
by guest on May 1, 2016
http://gji.oxfordjournals.org/D
ownloaded from

194 D. Carbone, G. Budetta and F. Greco
5–6 cm. The nominal �g/�h value of −2.33 µGal cm−1 implies amaximum gravity change of approximately 9 and 12–14 µGal forE–W and summit profile stations, respectively. In both cases thegravity effect of the observed elevation changes remains within thenormal errors affecting gravity changes along these profiles (typ-ically 10 and 15 µGal on gravity differences from the E–W andsummit profiles, respectively; see Section 2.2.2).
Thus, the variations in gravity measured during the period coveredby the present study seem not to be related to elevation changes. Ac-cordingly, gravity changes were not corrected for elevation changes.This was also the conclusion of Budetta & Carbone (1998) andBudetta et al. (1999) for data acquired at the Etna network duringthe 1987–1992 and 1994–1996 periods, respectively. Similarly, bothSanderson (1982) and Rymer et al. (1993, 1995) found that localelevation changes were not important for gravity changes associatedwith the 1981 and 1991–1993 eruptions of Etna, respectively. Thus,apparently height variations on Etna are too small to significantlyaffect surface gravity measurements. Accordingly, where adequateelevation data are not available, large gravity changes can be as-sumed to be the result only of subsurface variations in mass.
5.2 Water-table effects
The gravity effect of seasonal water-table fluctuations at Mt Etnahas been investigated by Budetta et al. (1999). Given the short-ness of the sequences at their disposal (from 1994 August to 1996November), Budetta et al. (1999) were forced to use a polynomialfit to extract the seasonal part of the signal. Data from the westernE–W profile stations (from CH to TG; see Fig. 1), the least af-fected by volcanically induced gravity changes, were averaged andapproximated by an eighth-order polynomial fit the Student’s t-testshowed to be significant at the 92 per cent level. The polynomialfit that closely resembled a sinusoidal pattern with a period of 1 yr(late-winter maxima and late-summer minima) and a peak-to-peakamplitude equal to 20 µGal was assumed to represent the gravityeffect of water-table fluctuations (Budetta et al. 1999).
The longer sequences now available allow suitable filters to beused. Being able to extract a given frequency band from a signal,bandpass filters allow data from all the E–W profile stations to beused (polynomials behave as low-pass filter and thus they preventdata from the higher E–W profile stations, affected by volcanic-related components with period longer than 1 yr, from being used toextract the seasonal part of the signal). The use of the averaged trendfrom all the stations of the profile makes the result more robust froma statistical point of view. Naturally, it also implies that a unique cor-rection for the water-table effect is defined for all the stations of theE–W profile (Budetta et al. 1999, also used the same correction for
Figure 8. Comparison between the model proposed by Budetta et al. (1999) for the gravity effect of water-table fluctuation on Etna (continuous line) and thebandpass filter, with cut-off periods centred around 1 yr (dashed line), performed over the averaged data from all the stations of the E–W profile (dotted line).
all the stations). A bandpass filter (Fig. 8; dashed line), with cut-offperiods centred around 1 yr (lower-pass frequency equal to 2.15 ×10⁻³ cycle d−1 and higher-pass frequency equal to 3.77 ×10⁻³ cycle d−1), has been performed over the averaged trend fromall the stations of the profile (Fig. 8; dotted line). The result ofthe above filter is compared with the sinusoidal model proposed byBudetta et al. (1999), which was extrapolated over successive datafrom the E–W profile, assuming that the fluctuation was stationaryin time and its amplitude was constant (Fig. 8; continuous line).The sinusoidal model coincides with the bandpass filter output overthe first part of the sequence (approximately 1.5 yr). Afterwards thefit between the two curves worsens even though phase shifts neverexceed 2–3 months. The explanations for appreciable divergencesbetween the theoretical stationary model and the bandpass-filteredsequence could be that:
(1) it is logical to expect some phase shift in water-table fluc-tuations since, being a natural phenomenon, they are affected byvariables such as changes in rainfall, temporal shifts in the maxi-mum and minimum annual temperature, etc.;
(2) gravity changes not linked to water-table fluctuations withperiods close to 1 yr could also have affected the E–W profilestations.
As stated before, the intrinsic advantages of bandpass filters, al-lowing extraction of the required band regardless of the length ofthe data sequence, make the result of the above bandpass filter morerobust than the model proposed by Budetta et al. (1999). Accord-ingly, the results of the new model are used to correct data from theE–W profile for the gravity effect of water-table fluctuations (Fig. 5).Since the summit profile is normally accessible only from June toOctober (Section 4.2), the data acquired are not suitable for evaluat-ing the seasonal effect of water-table fluctuations. Accordingly, datafrom the summit profile are not corrected for this effect. However,the gravity change of approximately 10 µGal expected for the June–October interval on the E–W profile (Fig. 8) can be considered anupper limit on the possible effects of water-table variations on thesummit measurements.
6 D I S C U S S I O N
As stated before, a general gravity increase–decrease cycle was ob-served along the Etna network between 1995 and 1999. The 1995–1996 increase part of the cycle was not recognized at the summitprofile stations by Budetta et al. (1999) because of swamping by the1994–1996 local changes at the stations closer to the summit cratersand to the lack of 1996–1997 winter data from all but the southern-most stations of the profile. Data from 1997 onwards, now available,
C© 2003 RAS, GJI, 153, 187–200
by guest on May 1, 2016
http://gji.oxfordjournals.org/D
ownloaded from

1994–1999 magma redistribution under Mt Etna 195
suggest that the main 1995–1999 cycle may also have occurred atthe summit profile stations (Fig. 6).
The apparent shift in time at the climax of the cycle, which seemsto exist if data sequences from E–W and summit profile stations arecompared (Figs 5 and 6), could be, at least in part, the effect of thelack of winter 1996/97 data from the summit stations. To illustratethis point, the southernmost summit profile stations (from CL toPH), which were unusually measured in 1996 November, show theclimax of the main cycle over that date (Fig. 6). Given the simi-larity of the increase–decrease 1995–1999 cycles assessed throughthe sequences from E–W and summit profiles as for overall periodand phase, they are likely to be caused by the same source. Thus,the mass centre of the model source calculated by Budetta et al.(1999) to explain the 1995–1996 gravity increase on the ground ofthe data from the E–W profile stations alone is likely to be shiftedtowards the south with respect to its actual position and also themass involved in the redistribution phenomenon is likely to be un-derestimated. To invert the 1997–1999 decrease part of the cycle,both data sets from the E–W and summit profiles are used. The maindrawback of doing so is the lack of 1996–1997 winter data from thesummit profile, which forces the interval 1997 July–1999 June tobe selected to represent contemporary gravity changes along theE–W and summit profiles (1997 July is the first campaign accom-plished along the summit profile after the decrease took place). Thisnaturally implies that just 60–70 per cent of the amplitude of thedecrease observed along the E–W profile (Fig. 5) will be inverted.However, the advantage of using data from both profiles in order tobetter constrain the position of the model source and the total massinvolved in the redistribution process is evident. In Fig. 9 gravitychanges observed during the 1997 July–1999 June period along theE–W and summit profiles are presented. The wider anomaly showsa wavelength of approximately 12 km along the E–W profile (cen-
Figure 9. Gravity changes observed along the E–W (a) and summit (b) profiles during the 1997 July–1999 June period and the gravity effect of the best-fittingmodel source (see text for details). The position of station RSA, common to both profiles, is indicated. Errors affecting gravity changes along the E–W profileare typically within 10 µGal, whereas those on changes from the summit profile are typically within 15 µGal.
tred on station FV4) and more than 20 km along the summit profile(centred on station SU).
Since it is not possible to assess analytically a unique model froma measured gravity anomaly (or field), to solve the inversion prob-lem the model that is most realistic on geological and geophysicalgrounds has to be chosen. That means that some limiting a prioriconditions have to be assumed in order to guide the inversion pro-cess. For the inversion of the 1997 July–1999 June gravity changes,the following constraints on the model source have been assumed.
6.1 Mass change
The total mass involved in a redistribution process can be uniquelydetermined without any assumption whatsoever regarding shape,density change or depth of the source body. The basis of the cal-culation is a Gaussian surface integration of the residual anomalyover the area of measurement (Sharma 1986). The formula givingthe total mass (in metric tons) is (Grant & West 1965)
M = 1
2πG
∫ ∫s�g(x, y) dx dy (1)
= 2.39∑
�g × �S, (2)
where �g is the mean anomaly (gravity change, in the case of thepresent study, in mGal) within a small area element �S (m2) and∑
�g × � s is the summation over the whole measurement area.Since only the order of magnitude of the 1997–1999 mass changeis needed at this stage to define the edge values for the range to beinvestigated, the term
∑�g × �S in eq. (2) can be replaced by the
area within the zero contour line in Fig. 7(d) multiplied by the meangravity change occurring within it. Comparing Figs 7(d) and 9, onecan argue that reasonable values for these two variables are 3.25 ×
C© 2003 RAS, GJI, 153, 187–200
by guest on May 1, 2016
http://gji.oxfordjournals.org/D
ownloaded from

196 D. Carbone, G. Budetta and F. Greco
109 m2 and 0.05 mGal. The corresponding mass change thus equalsapproximately 4 × 10⁸ metric tons, i.e. 4 × 10¹¹ kg.
6.2 Shape
The extensional stress regime beneath Etna is thought to allow theascent of magma from the asthenospheric source (Continisio et al.1997; Cristofolini et al. 1987). Magma batches that accumulateepisodically beneath the volcano are thus likely to be lens-shaped,especially if a model of magma movement by fracture propagationis assumed (Shaw 1980). Such a geometry can be approximated by aprism and has already been used to interpret mass changes detectedbelow the base of the volcano (Budetta & Carbone 1998; Budettaet al. 1999).
6.3 Azimuth
As shown in Fig. 7(d) the 1997 July–1999 June gravity changeis centred on the southeastern sector of the volcano. The majorstructural trend located in that sector is that oriented NNW–SSE(Lo Giudice & Rasa 1986; Lo Giudice & Rasa 1992), which isthought to be a preferred alignment for the ascent of Etnean magmas(Continisio et al. 1997) especially for activity since 1989 (Ferrucciet al. 1993; Alparone et al. 1994; Bonaccorso et al. 1994; Budetta& Carbone 1998).
6.4 Depth of the mass centre
Magma accumulations have been found at different levels within thecrust under Etna by several geophysical techniques. In general, theshallower zones of magma accumulation have been found to lie atdepths between 1.5 and 5 km bsl (Bonaccorso et al. 1994; Nunnari& Puglisi 1994; Bonaccorso 1996; Budetta & Carbone 1998; Murruet al. 1999). Deeper zones of magma accumulation are thought to lieat approximately 10 km bsl (Lanari et al. 1998; Murru et al. 1999),but their possible gravity effect would cover a distance greater thanthe total extent of our network and thus would be beyond the limitsof detection by the gravity surveys.
The kernel of a 3-D computer program named GRAVERSE(Carbone 2001), which automatically calculates the effect of aprism-shaped model source over a range of values set by the op-erator for each sensitive parameter has been utilized. In particular,following the above conditions, the range of depths for the modelmass centre has been set to 1500–5000 m bsl (increment of 500 m),whereas the range for the azimuths of the elongated body has beenset to 360–315◦N (increment = 15◦). The total mass of the bodyhas been allowed to range between 2.5 and 6 × 10¹¹ kg. This meansthat, since the vertical extent, the thickness and the density changeare not sensitive parameters, their product has been fixed to 5 ×10⁷ kg m−1, whereas the length of the body (i.e. the only sensi-tive parameter affecting the total mass) has been allowed to rangebetween 5000 and 12 000 m (increment of 1000 m).
The above ranges for each sensitive parameter are summarizedin Table 1.
Table 1. Ranges for each sensitive parameter of the source model to becalculated.
Parameter Start value End value Increment
Length 5000 m 12 000 m 1000 mMass centre depth 1500 m bsl 5000 m bsl 500 mAzimuth 360◦N 315◦N 15◦
As for the position of the source model in the horizontal plane,based on the shape of the anomaly (Fig. 7d), the projection of themass centre has been assumed to lie on the southeastern sector ofthe volcano, strictly on one of the nodes of a square grid (side lengthof 10 km) the bottom left vertices of which coincides with the RSAstation (Fig. 1) and where the node spacing is equal to 500 m.
The above degrees of freedom involved in the choice of the modelused to invert the 1997 July–1999 June gravity change requirednearly 113 000 iterations by GRAVERSE. For each model tried theprogram automatically calculates the standard error of the estimate(sxy in µGal):
Sxy =√∑
(Yobs − Yest)2
N, (3)
where Y obs is the gravity change observed at a given station duringthe 1997 July–1999 June period, Y est is the effect of each modelsource calculated at the same station by the program, whereas N isthe total number of stations used for the inversion process.
The result of the above calculation is shown in Fig. 10 where thesxy statistic, corresponding to each model tried is reported. It must bestressed that to make the chart easier to be read only models givingsxy ≤ 50 have been reported (the maximum sxy value obtained was84). The points in the chart cluster in different fields are separatedby vertical lines: thick lines separate models with a different length(and thus total mass), while thin lines separate, within each classof length, models at different depths. Within each class of depth,four different classes of azimuth are comprised (lines have beenreported only on the very first sector). As stated before for eachmodel of given length, depth and azimuth, 441 positions on thehorizontal plane were tried.
Fig. 10 also shows that the longer the source model is (and thus thegreater the total mass), the deeper it must be to better fit the observedchange (the minimum sxy occurs closer and closer to the right-handedge of each length field as the length of the model source increases).As one can easily see, a pronounced minimum does not exist (theminimum sxy ranges between 13.3 and 14.3 µGal for models withlengths ranging between 8000 and 12 000 m). However, since noindependent estimate can be made of the amount of matter to beremoved within the volcano, the model giving the absolute minimumsxy is chosen. The characteristics of this model, which gives sxy =13.3 µGal, are reported in Table 2. The mass change inferred isapproximately 5 × 10¹¹ kg.
To assess the quality of the model source a paired t-test has beenperformed. This tests the hypothesis that the mean of the differencesbetween the observed gravity change and the corresponding calcu-lated effect of the model source at each station is equal to zero. Thep-value obtained (0.88) indicates that is likely (a chance of 88 in 100)that the hypothesized zero mean difference would occur by chance.The absence of a statistically significant difference between the ob-served and calculated gravity changes confirms the effectiveness ofthe best model source.
In Fig. 9 the effect of the best-fitting model source is presentedand compared with the gravity changes observed along the E–Wand summit profiles between 1997 July and 1999 June. The val-ues of sxy relative to the E–W and summit profiles data (9.5 and
Table 2. Best model source parameters. The origin of the coordinate systemis coincident with RSA station (Lat. N = 37◦42′ 00′′; Long. E = 14◦59′ 54′′;Fig. 1).
X centre (m) Y centre (m) Z centre (m bsl) Length (m) Azimuth (◦N)
1000 4500 3500 10 000 330
C© 2003 RAS, GJI, 153, 187–200
by guest on May 1, 2016
http://gji.oxfordjournals.org/D
ownloaded from

1994–1999 magma redistribution under Mt Etna 197
Figure 10. sxy statistic (standard error of the estimate) corresponding to each of the nearly 113 000 models automatically tried to fit the 1997 July–1999 Julygravity changes (see text). Bold vertical lines separate points corresponding to models with different length (values reported in the very upper field); thin verticallines separate models at different depth (only values corresponding to the first class of length have been reported). In the very first sector, lines separatingmodels with different azimuth have been also drawn (values, not reported, are 360◦N, 345◦N, 330◦N and 315◦N).
15.2 µGal, respectively) are very close to the errors typically af-fecting changes along those profiles (10 and 15 µGal, respectively;Budetta et al. 1999).
The projection on to the surface of the above best-fitting modelsource is shown in Fig. 11 together with the projection on to thesurface of the model source calculated by Budetta et al. (1999) toexplain the 1995–1996 gravity increase. The model source calcu-lated to invert the 1997 July–1999 June gravity decrease is largerthan that calculated to explain the previous increase, with its south-ern tip overlapping the smaller source model. In fact, because of thereasons stated at the beginning of the present section, only data fromthe E–W profile were used for the inversion of the 1995–1996 grav-ity increase and thus just part of the entire source could have beendetected by Budetta et al. (1999). As stated previously, this couldimply that more mass than Budetta et al. (1999) calculated (1.5 ×10¹¹ kg) could have entered the basement of the volcano between1995 October and 1996 November (the mass associated with the1997 July–1999 June gravity decrease through the above calcula-tion is approximately three times larger than the mass associated byBudetta et al. (1999) with the previous increase, in spite of the com-parable amplitude of the two semi-cycles; Figs 5 and 6). Finally, itshould be stressed that the centre of the above calculated best-fittingmodel source is approximately 1 km deeper than the magma bodypostulated by (Budetta et al. 1999, Fig. 11).
7 C O N C L U S I O N S
The calculation performed in the above section shows that a massdecrease of approximately 5 × 10¹¹ kg took place between 1997 Julyand 1999 June within an elongated volume 3–4 km bsl deep, orientedNNW–SSE and with its mass centre approximately 2 km SSE ofthe summit craters. For a large amount of matter to be removedwithout appreciable elevation changes (Puglisi & Bonforte 1999,see Section 5.1), either a density change must have occurred in a pre-existing magma body or magma movements must have taken place.Previous gravity measurements have shown that significant amountsof magma have been accommodated within the same accumulation
zone (Budetta & Carbone 1998; Budetta et al. 1999). Thus, this zoneis likely to be a preferred reservoir for magma rising from deepersources. The most important mechanism allowing the density of astatic magma body to sensibly decrease is gas exsolution (Rymer& Brown 1987). In general, a decrease of pressure within a magmabody causes a simple gas law expansion of vesicles on one handand a decrease in solubility of the volatile component on the other.Both effects result in a net density decrease as shown at the Poasand Masaya volcanoes by Rymer et al. (1998, 2000).
The principal gases present in Etnean magmas are H2O, CO2 andSO2. The study of melt inclusions trapped in phenocrysts, matrixglasses and whole rocks indicates the volatile abundance of the Etnaprimitive basalts to be at approximately 1.5 wt per cent for H2O and0.3 wt per cent for both CO2 and SO2 (Metrich & Mosbah 1988;Metrich et al. 1993). The solubility of H2O and SO2 in magma ismuch greater than that of CO2 and thus, although water dominatesshallow strombolian activity, CO2 is the main volatile at greaterdepths. In general, the temperature dependence on volatile solubilityis negligible, whilst pressure and initial concentration are key factors(Wilson & Head 1981). For the above abundances a boiling depthof approximately 3 km below the surface (∼100 MPa) has beenproposed (Kadik & Lukanin 1973; Wilson & Head 1981).
As shown in Fig. 11, the best-fitting model source calculated inthe previous section lies below the minimum depth at which gasexsolution, corresponding to the above reported abundances, startsoccurring.
A more realistic model, involving non-vesicular magma, is basedon the control that extensional tectonic stresses, acting on the litho-sphere of eastern Sicily (Cristofolini et al. 1987; Bousquet et al.1988), exercise on magma rising from the deep-seated mantlesource.
At Mt Etna magma is thought to rise from the asthenosphericsource through a plexus of molten lenses within the lithospherebehaving as a porous medium (Hill 1977; Shaw 1980). Followingthis view, the amount of molten material within these porous zonesis controlled by extensional tectonic stresses and thus, given thedensity contrast between magma and host rock, tectonic stressesalso control the density changes occurring within these volumes.
C© 2003 RAS, GJI, 153, 187–200
by guest on May 1, 2016
http://gji.oxfordjournals.org/D
ownloaded from

198 D. Carbone, G. Budetta and F. Greco
Figure 11. The gravity decrease occurred at Mt Etna between 1997 and 1999 has been attributed to a density change in a prism-shaped source-body wherethe projection on to the surface is shown in (a) and where the projection on to a NNW–SSE cross-section (AB) is shown in (b). The projection on to the surfaceand the same cross-section of the model-source postulated by Budetta et al. (1999) are also reported. The dashed line in (b) marks the depth at which etneanmagmas start exsolving gases (see the text for details).
Regional stresses deforming the lithosphere could have a very smalleffect on the volcanic edifice (i.e. no significant deformation), owingto attenuation by: (1) concentrated deformation along a failure planebelow Etna between the Apennine–Maghrebide Chain and the IbleanPlateau (Lentini et al. 1995), (2) slippage between the nappes of theApennine–Maghrebide Chain and (3) fracturing near the base of thevolcanic pile (McGuire & Pullen 1989).
Our data indicate that between 1997 and 1999 the magma pre-viously accumulated within the inferred model source volume (orjust a part of it) migrated. Some of the escaping magma could haveentered the shallower part of the plumbing system of Etna, givingrise to the subsequent explosive activity that culminated during thespring and early summer of 1998 (Section 3). Consistent with thisview are: (1) the gradual increase in the strain release from 1996July until the beginning of 1999 (Bonaccorso & Patane 2001; LaDelfa et al. 2001); (2) a large increase in the tremor amplitude in1998–1999 (La Delfa et al. 2001) and (3) the emission of primitiveand gas-rich magma from depth (La Delfa et al. 2001) in 1998 (VORand BN; Fig. 4) and in 1999 (SEC; Fig. 4).
The model proposed above implies a volume of lost magma givenby �M/(ρm − ρr ), where �M is the observed change in mass,
ρm is the density of new magma and ρr is the density of the hostrock (Budetta & Carbone 1998). Using the empirical relation ofNafe & Drake (1963), seismic tomographic data for Etna (Cardaciet al. 1993) indicate a mean host rock density of approximately2300 kg m−3 at 3–4 km below sea level. Assuming a density of2800 kg m−3 for non-vesicular basic magma, the volume of magmacorresponding to the mass lost from the inferred source zone withinthe volcano is approximately 109 m3.
Measurements of SO2 flux indicate approximately 2–4 × 10⁸ m3
of magma exsolving SO2 (and thus entering the shallower part of theEtna plumbing system at depths less than 2–3 km below the surface)each year (Allard 1997; Bruno et al. 1999). Thus, at one extreme,nearly all the magma lost from the 3–4 km deep reservoir duringthe 1997–1999 period could have entered the shallower part of theplumbing system of Etna. This would imply the absence of any re-plenishment from deeper zones during the above period. However,it should be stressed that, according to the calculations performedby Allard (1997), Bruno et al. (1999) and Harris et al. (2000), onlyapproximately 10 per cent of the basalt that contributes the SO2
emission at Etna has erupted. The unerupted degassed magma isthought to sink down into the magma column and be recycled in
C© 2003 RAS, GJI, 153, 187–200
by guest on May 1, 2016
http://gji.oxfordjournals.org/D
ownloaded from

1994–1999 magma redistribution under Mt Etna 199
subedifice feeders (Allard 1997). For the density in the 3–4 km bsldeep accumulation zone to decrease, the descending flux must havesunk down to greater depths. Accordingly, Allard (1997) proposesthe ‘plutonic’ complex approximately 10 km wide and deep, de-tected within the sedimentary basement of Etna (Hirn et al. 1991,1997; Borgia et al. 1992; Mauriello et al. 1997), to be the finaldestination for the unerupted magma that thus contributes to theaccretion of wide plutonic roots in the basement of Etna.
Also, since significant anomalies have not been observed at thesummit stations, the rising to sinking magma budget (i.e. the to-tal mass) along the shallower part of the plumbing system of Etna(from the 3–4 km bsl deep accumulation zone upward) must have re-mained almost balanced during the 1997–1999 period. This meansthat the mass decrease at the inferred accumulation zone is the re-sult of a decrease in the number of magma batches coming fromdeeper zones. Sudden breaks to the equilibrium in the upper part ofthe feeder system of Etna (i.e. a large amount of magma suddenlyentering the volcanic pile without the system being able to recycleit), which would be detected by our network, could lead to systeminstability and, possibly, large flank eruptions.
A C K N O W L E D G M E N T S
The authors thank both Dr G. Williams-Jones and Dr G. Jentzschfor their helpful suggestions.
R E F E R E N C E S
AGIP, 1976. Carta gravimetrica della Sicilia.Allard, P., 1997. Endogenous magma degassing and storage at Mount Etna,
Geophys. Res. Lett., 24, 2219–2222.Alparone, S., Pellicori, O., Ursino, A., Ferrucci, F., Gresta, S. & Guerra,
I., 1994. Shallow microseismic swarms and intrusive mechanisms at MtEtna, Acta Vulcanol., 4, 75–79.
Battaglia, M., Roberts, C. & Segall, P., 1999. Magma intrusion beneath LongValley caldera confirmed by temporal changes in gravity, Science, 285,2119–2122.
Berrino, G., Corrado, G., Luongo, G. & Toro, B., 1984. Ground deforma-tion and gravity changes accompanying the 1982 Pozzuoli uplift, Bull.Volcanol., 47, 187–200.
Berrino, G., Rymer, H., Brown, G.C. & Corrado, G., 1992. Gravity–heightcorrelations for unrest at calderas, J. Volc. Geotherm. Res., 53, 11–26.
Bonaccorso, A., 1996. Dynamic inversion of ground deformation data formodelling volcanic sources (Etna 1991–1993), Geophys. Res. Lett., 25,451–454.
Bonaccorso, A. & Patane, D., 2001. Shear response to an intrusive episodeat Mt Etna volcano (January 1998) inferred through seismic and tilt data,Tectonophysics, 334, 61–75.
Bonaccorso, A., Velardita, R. & Villari, L., 1994. Ground deformation mod-eling of geodynamic activity associated with the 1991–1993 Etna eruption,Acta Vulcanol., 4, 87–96.
Borgia, A., Ferrari, L. & Pasquare, G., 1992. Importance of gravitationalspreading in the tectonic and volcanic evolution of Mount Etna, Nature,37, 231–235.
Bousquet, J.C., Lanzafame, G. & Paquin, C., 1988. Tectonics, stress andvolcanism: in situ stress measurement and neotectonic investigations inthe Etna area (Italy), Tectonophysics, 149, 219–231.
Bruno, N., Caltabiano, T. & Romano, R., 1999. SO2 emissions at Mt Etnawith particular reference to the period 1993–1995, Bull. Volcanol., 60,405–411.
Budetta, G. & Carbone, D., 1997. Potential application of the Scintrex CG-3M gravimeter for monitoring volcanic activity: results of field trials onMt Etna, Sicily, J. Volc. Geotherm. Res., 66, 199–214.
Budetta, G. & Carbone, D., 1998. Temporal variations in gravity at Mt Etna(Italy) associated with the 1989 and 1991 eruptions, Bull. Volcanol., 59,311–326.
Budetta, G., Grimaldi, M. & Luongo, G., 1989. Variazioni di gravita nell’areaetnea (1986–1989), Boll. GNV, 5, 137–146.
Budetta, G., Carbone, D. & Greco, F., 1999. Subsurface mass redistributionat Mount Etna (Italy) during the 1995–1996 explosive activity detectedby microgravity studies, Geophys. J. Int., 138, 77–88.
Carbone, D., 2001. Gravity monitoring of Mount Etna (Italy) through discreteand continuous measurements, PhD thesis, The Open University, MiltonKeynes.
Carbone, D. & Rymer, H., 1999. Calibration shifts in a LaCoste-and-Romberg gravimeter: comparison with a Scintrex CG-3M, Geophys.Prospect., 47, 73–83.
Carbone, D., Budetta, G., Greco, F. & Rymer H. Combined discrete andcontinuous gravity observations at Mt Etna, J. Volc. Geotherm. Res., inpress.
Cardaci, C., Coviello, M., Lombardo, G., Patane, G. & Scarpa, R., 1993.Seismic tomography of Etna volcano, J. Volc. Geotherm. Res., 56, 357–368.
Continisio, R., Ferrucci, F., Gaudiosi, G., Lo Bascio, D. & Ventura, G.,1997. Malta escarpment and Mt Etna: early stages of an asymmetric riftingprocess? Evidences from geophysical and geological data, Acta Vulcanol.,9, 45–53.
Cristofolini, R., Gresta, S., Imposa, S., Menza, S. & Patane, G., 1987. Anapproach to problems on energy sources at Mt Etna from seismologicaland volcanological data, Bull. Volcanol., 49, 729–736.
Dzurisin, D. et al., 1980. Geophysical observations of Kilauea volcano,Hawaii, 2. Constraints on the magma supply during November 1975–September 1977, J. Volc. Geotherm. Res., 7, 241–269.
Eggers, A.A., 1983. Temporal gravity and elevation changes at Pacaya vol-cano, Guatemala, J. Volc. Geotherm. Res., 19, 223–237.
Eggers, A.A., 1987. Residual gravity changes and eruption magnitudes. J.Volc. Geotherm. Res., 33, 201–216.
Fernandez, J., Charco, M., Tiampo, K.F., Jentzsch, G. & Rundle, J.B., 2001.Joint interpretation of displacement and gravity data in volcanic areas. Atest example: Long Valley Caldera, Geophys. Res. Lett., 28, 1063–1066.
Ferrucci, F., Rasa, R., Gaudiosi, G., Azzaro, R. & Imposa, S., 1993. Mt Etna:a model for the 1989 eruption, J. Volc. Geotherm. Res., 56, 35–56.
Grant, F.S. & West, G.F., 1965. Interpretation Theory in Applied Geophysics,McGraw-Hill, New York.
Harris, A.J.L., Murray, J.B., Aries, S.E., Davies, M.A., Flynn, L.P., Wooster,M.J., Wright, R. & Rothery, D.A., 2000. Effusion rate trends at Etna andKrafla and their implications for eruptive mechanisms, J. Volc. Geotherm.Res., 102, 237–270.
Hill, D.P., 1977. A model for earthquake swarms, J. geophys. Res., 82, 1347–1352.
Hirn, A., Nercessian, A., Sapin, M., Ferrucci, F. & Wittlinger, G., 1991.Seismic heterogeneity of Mt Etna: structure and activity, Geophys. J. Int.,105, 139–153.
Hirn, A., Nicolich R., Gallart, J., Laigle, M., Cernobori, L. & ETNASEISScientific Group, 1997. Roots of Etna volcano in faults of great earth-quakes, Earth planet. Sci. Lett., 148, 171–191.
Jachens, R.C. & Eaton, G.P., 1980. Geophysical observations of Kilaueavolcano, Hawaii, 1. Temporal gravity variations related to the 29 Novem-ber, 1975, M = 7.2 earthquake and associated summit collapse, J. Volc.Geotherm. Res., 7, 225–240.
Jentzsch, G., Punongbayan, R.S., Schreiber, U., Seeber, G., Volksen, C.& Weise, A., 2001. Mayon volcano, Philippines: changes of monitoringstrategy after microgravity and GPS measurement from 1992 to 1996,J. Volc. Geotherm. Res., 109, 219–234.
Johnsen, G.V., Bjornson, A. & Sigurdsson, S., 1980. Gravity and elevationchanges caused by magma movement beneath Krafla caldera, northwestIceland, J. Geophys., 47, 132–140.
Kadik, A.A. & Lukanin, O.A., 1973. The solubility-dependent behaviourof water and carbon dioxide in magmatic processes, Geochem. Int., 10,115–129.
La Delfa, S., Patane, G., Clocchiatti, R. Joron, J.-L. & Tanguy J.-C., 2001.Activity of Mount Etna preceding the February 1999 fissure eruption:inferred mechanism from seismological and geochemical data, J. Volc.Geotherm. Res., 105, 121–139.
C© 2003 RAS, GJI, 153, 187–200
by guest on May 1, 2016
http://gji.oxfordjournals.org/D
ownloaded from

200 D. Carbone, G. Budetta and F. Greco
Lanari, R., Lundgren, P. & Sansosti, E., 1998. Dynamic deformation of Etnavolcano observed by satellite radar interferometry, Geophys. Res. Lett.,25, 1541–1544.
Lentini, F., Carbone, S., Catalano, S., Di Stefano, A., Gargano, C., Romeo,M., Strazzulla, S. & Vinci, G., 1995. Sedimentary evolution of basins inmobile belts: examples from the Tertiary terrigenous sequences of thePeloritani Mountains (NE Sicily), TerraNova, 7, 161–170.
Lo Giudice, E. & Rasa, R., 1986. The role of the NNW structural trend inthe recent geodynamic evolution of North-Eastern Sicily and its volcanicimplications in the Etnean area, J. Geodyn., 5, 309–330.
Lo Giudice, E. & Rasa, R., 1992. Very shallow earthquakes and brittle defor-mation in active volcanic areas: the etnean region as exsample, Tectono-physics, 202, 257–268.
Mauriello, P., Patella, D., Petrillo, Z. & Siniscalchi, A., 1997. Mount Etnastructural exploration by magnetotellurics, Acta Vulcanol., 9, 141–146.
McGuire W.J. & Pullen A.D., 1989. Location and orientation of eruptivefissures and feeder-dykes at Mount Etna; influence of gravitational andregional tectonic stress regimes, J. Volc. Geotherm. Res., 38, 325–344.
Metrich, N. & Mosbah, M., 1988. Carbon content of some basaltic glasses:nuclear microprobe analysis, Bull. Mineral., 111, 511–522.
Metrich, N., Clocchiatti, R., Mosbah, M. & Chaussidon, M., 1993. The1989–1990 activity of Etna magma mingling and ascent of H2O–Cl-Srich basalt magma. Evidence from melt inclusions, J. Volc. Geotherm.Res., 59, 131–144.
Murru, M., Montuori, C., Wyss, M. & Privitera, E., 1999. The locations ofmagma chambers at Mt Etna, Italy, mapped by b-values, Geophys. Res.Lett., 26, 2553–2556.
Nafe, J.E. & Drake, C.L., 1963. Physical properties of marine sediments, inThe Sea, Vol. 3, pp. 794–815, ed. Hill, M.N., Interscience, New York.
Nunnari, G. & Puglisi, G., 1994. The Global Positioning System as a usefultechnique for measuring ground deformations in volcanic areas, J. Volc.Geotherm. Res., 61, 267–280.
Obrizzo, F., 1995. Monte Etna—movimenti verticali del suolo, Rep. Osser-vatorio Vesuviano, Napoli.
Obrizzo, F., 1996. Monte Etna—movimenti verticali del suolo, Rep. Osser-vatorio Vesuviano, Napoli.
Puglisi, G. & Bonforte, A., 1999. Monitoring active deformation of vol-canoes by interferometry as an early warning system, in MADVIEWS,EC Project n. ENV4-CT96–0294, Contribution of CNR – IIV, FinalReport.
Puglisi, G. et al., 1998. GPS measurements: improvements in network con-figuration and surveying techniques, in Data Related to Eruptive Activity,Unrest Phenomena and Other Observations on the Italian Active Vol-canoes. Geophysical Monitoring of the Italian Active Volcanoes 1993–
1995—Etna—Ground Deformation Monitoring, Vol. 10, pp. 158–169, ed.Gasperini, P., Acta Volcanol.
Rymer, H., 1989. A contribution to precision microgravity data analysisusing LaCoste and Romberg gravity meters, Geophys. J., 97, 311–322.
Rymer, H., 1996. Microgravity monitoring, in Monitoring and Mitigation ofVolcanic Hazards, pp. 169–197, eds Scarpa, R. & Tilling, R.I., Springer,Berlin.
Rymer, H. & Brown, G.C., 1987. Causes of Microgravity change at Poasvolcano, Costa Rica: an active but non-erupting system, Bull. Volcanol.,49, 389–398.
Rymer, H. & Williams-Jones, G., 2000. Volcanic eruption prediction: magmachamber physics from gravity and deformation measurements, Geophys.Res. Lett., 27, 2389–2392.
Rymer, H., Murray, J.B., Brown, G.C., Ferrucci, F. & McGuire, J., 1993.Mechanisms of magma eruption and emplacement at Mt Etna between1989 and 1992, Nature, 361, 439–441.
Rymer, H., Cassidy, J., Locke, C.A. & Murray, J.B., 1995. Magma move-ments in Etna volcano associated with the major 1991–1993 lava erup-tion: evidence from gravity and deformation, Bull. Volcanol., 57, 451–461.
Rymer, H., van Wyk de Vries, B., Stix, J. & Williams-Jones, G., 1998. Pitcrater structure and processess governing persistent activity at Masayavolcano, Nicaragua, Bull. Volcanol., 59, 345–355.
Rymer, H., Cassady, J., Locke, C.A., Barboza, M.V., Barquero, J., Brenes,J. & Van der Laat, R., 2000. Geophysical studies of the recent 15-yeareruptive cycle at Poas Volcano, Costa Rica, J. Volc. Geotherm. Res., 97,425–442.
Sanderson, T.J.O., 1982. Direct gravimetric detection of magma movementsat Mount Etna, Nature, 297, 487–490.
Sharma, P.V., 1986. Geophysical Methods in Geology, Elsevier, New York.Shaw, H.R., 1980. The fracture machanisms of magma transport from the
mantle to the surface, in Physics of Magmatic Processes, pp. 201–264,ed. Hargraves, R.B., Princeton University Press, Princeton.
Smithsonian Institution, 1998. Bulletin November, 23.Smithsonian Institution, 1999. Bulletin June–September, 24.Torge, W., 1981. Gravity and height variatons connected with the current
rifting episode in northen Iceland, Tectonophysics, 71, 227–240.Torge, W., 1989. Gravimetry, de Gruyter, Berlin.Watermann, H., 1957. Uber systematische Fehler bei Gravimetermessunger.
DGK, Munchen, 21.Wilson, L. & Head, J.W.I., 1981. Ascent and eruption of basaltic magma on
the Earth and Moon, J. geophys. Res., 86, 2971–3001.Wong, T.-F. & Walsh, J.B., 1991. Deformation-induced gravity changes in
volcanic regions, Geophys. J. Int., 106, 513–520.
C© 2003 RAS, GJI, 153, 187–200
by guest on May 1, 2016
http://gji.oxfordjournals.org/D
ownloaded from
Copyright © 2022 FDOKUMEN