Population structure, mortality and growth of Pinna nobilis Linnaeus, 1758 (Mollusca, Bivalvia) at...
11
Mar Biol (2007) 150:861–871 DOI 10.1007/s00227-006-0386-1 123 RESEARCH ARTICLE Population structure, mortality and growth of Pinna nobilis Linnaeus, 1758 (Mollusca, Bivalvia) at di Verent depths in Moraira bay (Alicante, Western Mediterranean) J. R. García-March · A. M. García-Carrascosa · A. L. Peña Cantero · Y.-G. Wang Received: 13 October 2005 / Accepted: 2 June 2006 / Published online: 21 July 2006 © Springer-Verlag 2006 Abstract An investigation to characterize the causes of Pinna nobilis population structure in Moraira bay (Western Mediterranean) was developed. Individuals of two areas of the same Posidonia meadow, located at diVerent depths (A1, ¡13 and A2, ¡6 m), were invento- ried, tagged, their positions accurately recorded and monitored from July 1997 to July 2002. On each area, diVerent aspects of population demography were stud- ied (i.e. spatial distribution, size structure, displacement evidences, mortality, growth and shell orientation). A comparison between both groups of individuals was car- ried out, Wnding important diVerences between them. In A1, the individuals were more aggregated and mean and maximum size were higher (A1, 10.3 and A2, 6 indi- viduals/100 m 2 ; A1, x = 47.2 § 9.9; A2, x = 29.8 § 7.4 cm, P < 0.001, respectively). In A2, growth rate and mortality were higher, the latter concentrated on the largest individuals, in contrast to A1, where the small- est individuals had the higher mortality rate [A1, L = 56.03(1 ¡ e ¡0.17t ); A2, L = 37.59(1 ¡ e ¡0.40t ), P < 0.001; mean annual mortality A1: 32 dead individu- als out of 135, 23.7% and A2: 16 dead individuals out of 36, 44.4%, and total mortality coeYcients (z), z A1(¡30) = 0.28, z A1(31–45) = 0.05, z A1(46¡) = 0.08; z A2(¡30) = 0.15, z A2(31–45) = 0.25]. A common shell orien- tation N–S, coincident with the maximum shore expo- sure, was observed in A2. Spatial distribution in both areas showed not enough evidence to discard a random distribution of the individuals, despite the greater aggregation on the deeper area (A1) (A1, 2 = 0.41, df = 3, P > 0.5, A2, 2 = 0.98, df = 2 and 0.3 < P < 0.5). The obtained results have demonstrated that the depth- related size segregation usually shown by P. nobilis is mainly caused by diVerences in mortality and growth among individuals located at diVerent depths, rather than by the active displacement of individuals previ- ously reported in the literature. Furthermore, dwarf individuals are observed in shallower levels and as a consequence, the relationship between size and age are not comparable even among groups of individuals inhabiting the same meadow at diVerent depths. The Wnal causes of the diVerences on mortality and growth are also discussed. Introduction Pinna nobilis L., 1758 is the largest Mediterranean bivalve mollusc and is usually found anchored among Posidonia oceanica shoots, hidden by the leaves of the seagrass (Vicente 1990) and with the shell strongly overgrown by epibionts (Zavodnik 1967). In general, typical densities of individuals are relatively low. Zavodnik et al. (1991) estimated a mean of nine indi- Communicated by S.A. Poulet, RoscoV J. R. García-March (&) · A. M. García-Carrascosa Department of Zoology, Marine Biology Laboratory, University of Valencia, C/Doctor Moliner 50, 46100 Burjassot (Valencia), Spain e-mail: [email protected] A. L. Peña Cantero Cnidarian Biodiversity and evolution Laboratory, Instituto Cavanilles de Biodiversidad y Biología Evolutiva, Universidad de Valencia, Apdo. Correos 22085, 46071 Valencia, Spain Y.-G. Wang CSIRO Mathematical and Information Sciences, 65 Brockway Road, Floreat, WA, 6014, Australia
Transcript of Population structure, mortality and growth of Pinna nobilis Linnaeus, 1758 (Mollusca, Bivalvia) at...

Mar Biol (2007) 150:861–871
DOI 10.1007/s00227-006-0386-1RESEARCH ARTICLE
Population structure, mortality and growth of Pinna nobilis Linnaeus, 1758 (Mollusca, Bivalvia) at diVerent depths in Moraira bay (Alicante, Western Mediterranean)
J. R. García-March · A. M. García-Carrascosa · A. L. Peña Cantero · Y.-G. Wang
Received: 13 October 2005 / Accepted: 2 June 2006 / Published online: 21 July 2006© Springer-Verlag 2006
Abstract An investigation to characterize the causesof Pinna nobilis population structure in Moraira bay(Western Mediterranean) was developed. Individuals oftwo areas of the same Posidonia meadow, located atdiVerent depths (A1, ¡13 and A2, ¡6 m), were invento-ried, tagged, their positions accurately recorded andmonitored from July 1997 to July 2002. On each area,diVerent aspects of population demography were stud-ied (i.e. spatial distribution, size structure, displacementevidences, mortality, growth and shell orientation). Acomparison between both groups of individuals was car-ried out, Wnding important diVerences between them. InA1, the individuals were more aggregated and meanand maximum size were higher (A1, 10.3 and A2, 6 indi-viduals/100 m2; A1, x = 47.2 § 9.9; A2, x = 29.8 §7.4 cm, P < 0.001, respectively). In A2, growth rate andmortality were higher, the latter concentrated on thelargest individuals, in contrast to A1, where the small-est individuals had the higher mortality rate [A1,
L = 56.03(1 ¡ e¡0.17t); A2, L = 37.59(1 ¡ e¡0.40t),P < 0.001; mean annual mortality A1: 32 dead individu-als out of 135, 23.7% and A2: 16 dead individuals out of36, 44.4%, and total mortality coeYcients (z),zA1(¡30) = 0.28, zA1(31–45) = 0.05, zA1(46¡) = 0.08;zA2(¡30) = 0.15, zA2(31–45) = 0.25]. A common shell orien-tation N–S, coincident with the maximum shore expo-sure, was observed in A2. Spatial distribution in bothareas showed not enough evidence to discard a randomdistribution of the individuals, despite the greateraggregation on the deeper area (A1) (A1, �2 = 0.41,df = 3, P > 0.5, A2, �2 = 0.98, df = 2 and 0.3 < P < 0.5).The obtained results have demonstrated that the depth-related size segregation usually shown by P. nobilis ismainly caused by diVerences in mortality and growthamong individuals located at diVerent depths, ratherthan by the active displacement of individuals previ-ously reported in the literature. Furthermore, dwarfindividuals are observed in shallower levels and as aconsequence, the relationship between size and age arenot comparable even among groups of individualsinhabiting the same meadow at diVerent depths. TheWnal causes of the diVerences on mortality and growthare also discussed.
Introduction
Pinna nobilis L., 1758 is the largest Mediterraneanbivalve mollusc and is usually found anchored amongPosidonia oceanica shoots, hidden by the leaves of theseagrass (Vicente 1990) and with the shell stronglyovergrown by epibionts (Zavodnik 1967). In general,typical densities of individuals are relatively low.Zavodnik et al. (1991) estimated a mean of nine indi-
Communicated by S.A. Poulet, RoscoV
J. R. García-March (&) · A. M. García-CarrascosaDepartment of Zoology, Marine Biology Laboratory, University of Valencia, C/Doctor Moliner 50, 46100 Burjassot (Valencia), Spaine-mail: [email protected]
A. L. Peña CanteroCnidarian Biodiversity and evolution Laboratory, Instituto Cavanilles de Biodiversidad y Biología Evolutiva, Universidad de Valencia, Apdo. Correos 22085, 46071 Valencia, Spain
Y.-G. WangCSIRO Mathematical and Information Sciences, 65 Brockway Road, Floreat, WA, 6014, Australia
123

862 Mar Biol (2007) 150:861–871
viduals/100 m2 in the Adriatic Sea and Vicente et al.(1980) and Moreteau and Vicente (1982) one individ-ual/100 m2 in Port Cros National Park (France). Insouth Spanish coasts, densities of ten individuals/100 m2 are common (Templado 2001). Only in particu-lar habitats, such as some littoral lagoons or shelteredcoasts, the density reaches higher values of up to sixindividuals/m2 (De Gaulejac and Vicente 1990; Catsikiand Catsilieri 1992), although these are seldomobserved exceptional populations. Therefore, greatsampling eVorts are necessary to obtain an inventory ofindividuals, because large underwater areas must beexplored and the utilization of indirect remote-videotechniques are not always suitable, since the majorityof individuals are hidden by the leaves of P. oceanica.Consequently, they must be located directly bySCUBA diving, whose technical limitations (mainlylimited working time, water transparency and weatherconditions), reduce the performance of the surveys. Asindicated by Richardson et al. (2004), it is diYcult toperform the necessary repeated surveys to study thespecies ecology. Therefore, only a few surveys on thissubject have been recently developed (cf. Porchedduet al. 1998; Siletic and Peharda 2003; Katsanevakis2005) and many aspects of the species ecology remainstill unknown.
Vicente (1990), Ramos (1998) and Templado (2001)have also indicated the fragmentary knowledge of P.nobilis biology, even in fundamental aspects. Previousstudies have evidenced the existence of peculiar fea-tures of the population structure in this species, someof which have not been deeply studied up to date.Some of them are concerned with its spatial distribu-tion: depth-related size segregation, i.e. the occurrenceof smaller individuals, and absence of larger ones, inshallower waters (Zavodnik 1967; Vicente et al. 1980;Moreteau and Vicente 1982; Vicente 1990; Vicente andMoreteau 1991; Barberá et al. 1996, unpublished data;Templado 2001), patchiness distribution (Combelleset al. 1986; Butler et al. 1993), and common orientationof the valves in some localities (Combelles et al. 1986;De Gaulejac and Vicente 1990; Butler et al. 1993).
The Wrst hypothesis postulated to explain the sizesegregation of P. nobilis refers to the displacementcapacity of the individuals. According to this idea,young individuals would implant at shallower sites andwould move towards deeper ones during ontogeny(Zavodnik 1967; Vicente et al. 1980; Moreteau andVicente 1982; Vicente 1990; Vicente and Moreteau1991; Barberá et al. 1996, unpublished data; Templado2001). However, the only prove of the change of posi-tion is the localization of some old individuals lying onthe sand and later re-implanted some metres away
from their original location (Moreteau and Vicente1982; Butler et al. 1993; Vicente, personal communica-tion) and the experimentally proved capacity of re-implantation of small individuals (up to 20 cm in totallength) (De Gaulejac and Vicente 1990). The supposedmechanism for this movement would be crawlingthrough the substratum, in a similar way to many otherPteriomorphia (Smeathers and Vincent 1979; Price1983; Reimer and Tedengren 1997; Taylor et al. 1997)either attaching new byssus Wlaments in the directionof the movement and liberating the old rear ones, orshedding the entire byssus complex and producing anew one for re-implantation as indicated by Price(1983) and Taylor et al. (1997). The displacement usingthe foot as is done by many Veneroida is less probablesince in the Pinnidae the foot is reduced and too smallin relation to shell size (Yonge 1953). Other ideas sug-gested to explain this peculiarity of P. nobilis popula-tion structure are related to higher mortality of largeindividuals in shallower waters, either by amateur col-lection (Vicente 1990) or by the increased hydrody-namic stress respect to deeper sites (García-March2003).
Combelles et al. (1986) suggested that the patchinessdistribution is mainly related to habitat availability(e.g. the presence of Posidonia meadows), while thecommon orientation of the valves is the result of anincreased mortality rate of inadequately oriented indi-viduals in relation to some factor (i.e. deep currents orthe slope of the bottom).
Anyway, the agreement of the displacement hypoth-esis makes it necessary to discriminate between thoseecological features actually produced by diVerences inmortality and those due to an active displacement ofindividuals according to some kind of gradient. How-ever, if the displacement hypothesis is not accepted,one question remains: what is causing the generallyobserved size segregation with depth?
In order to characterize the main factors inXuencingP. nobilis population structure from an holistic point ofview and improve the understanding of P. nobilisautoecology, diVerent aspects of the species demogra-phy were studied in two groups on individuals inhabit-ing at diVerent depths (at ¡6 and ¡13 m) in the sameP. oceanica meadow. On these sites, the individualswere inventoried, tagged and their positions accuratelyrecorded inside known areas. Displacement evidences,common valve orientation, density of individuals, spa-tial distribution, size distribution, growth and mortalitywere studied periodically during a 5 years period (fromJuly 1997 to July 2002).
Furthermore, the eVects of collection of large indi-viduals by amateur divers and the inXuence of hydro-
123

Mar Biol (2007) 150:861–871 863
dynamic stress on the population structure were alsoconsidered. The results of the experiments carried outto investigate the shell drag coeYcients and drag forcesupported by the individuals of both areas, as well asthe estimation of P. nobilis dislodgement force, aredescribed in García-March et al. in press.
Material and methods
The research was developed on a dense population ofP. nobilis located in Moraira bay (Alicante, E ofSpain), at the south of La Nao Cape, at 38°41�N and0°8�W, from July 1997 to July 2002 (Fig. 1). Morairashoreline is dominated by medium and low cliVsformed by ancient dunes of Würmiens eolianites, withsmall sandy beaches between them (Sanjaume 1985).
Posidonia oceanica meadows are frequent in shallowwaters in the coast of Alicante where they reach depthsof c. 20 m and are characterized by high foliar density(Torres et al. 1990a, b). Preliminary exploration ofMoraira Posidonia meadows reported a high foliarindex up to 500 shots/m2, according to Giraud’s (1977)method, and a bathymetric range between 3 and 22 m.Observations on meadow topography indicate that it isirregular at shallow levels, with many channels, poolsand small front steps, and more homogeneous atdeeper levels, with some high front steps (between 1and 2 m high) and large channels among large P. ocea-nica patches at some places.
Pinna nobilis was occasionally found in hollowsamong large rocks or in sandy sheltered areas at shal-lower levels. However, most of the individuals wereobserved in the meadow itself. In a previous study,García-March (2005) put in evidence that the densityof individuals increased along a depth interval between3 and 15 m, from one individual/100 m2 at 3 m,6.5 § 3.1 at the range 5–10 m and to 10.7 § 4.3 individ-uals/100 m2 at the range 10–15 m. Likewise, mean sizealso augmented with depth increment, 25.8 § 10.3 cmat 3 m, 35 § 11.9 cm at the depth range 5–10 m and49.1 § 9.8 cm in the depth interval of 10–15 m. There-fore, the zone was selected as an optimal locality tostudy the evolution of a P. nobilis population and totest the diVerent hypothesis proposed to explain thesize segregation, spatial distribution model and com-mon shell orientation.
Two areas of study, A1, located at 13 m depth andwith a surface of 1,000 m2, and A2, located at 6 mdepth and with a surface of 314 m2, were selected forthe research (Fig. 1, 2). A smaller surface in A2 wasstudied, since individuals displacement was expected tobe higher in shallower levels and, thus, surveys wereperformed more often on this site (each 3 monthsinstead of each year for A1).
All individuals located in the studied areas weretagged and their positions recorded respect to the ver-tex of triangles formed by stainless-steel rods driven inthe bottom. Three triangles were deployed in A1 andtwo in A2. The smallest triangle in A2 was placed neara group of Wve individuals to increase precision in thecase of occurring displacement of only a few centime-tres (Fig. 2). The individuals were located searchinginside concentric circles of diVerent radius (5, 10 and
Fig. 1 Location of Moraira bay in Western Mediterranean withsampling stations A1 (¡13 m) and A2 (¡6 m), where all Pinnanobilis individuals were inventoried and catalogued for their sub-sequent study
Fig. 2 Design of the two areas where all Pinna nobilis individualswere inventoried in Moraira bay: A1, surface = 1,000 m2; A2,surface = 314 m2
123

864 Mar Biol (2007) 150:861–871
15 m). Divers placed marking buoys near each individ-ual found during the localization surveys. Each speci-men was registered, labelled with slackly tight bridlesand positioned measuring its distance to the trianglesticks.
The antero-posterior length outside the substratum(unburied length, UL), the maximum and minimumdorso-ventral lengths, usually called width (W and w,respectively), and the orientation of the valves respectto the hinge line of each specimen were measured(Fig. 3). In situ measurements were performed with atree calliper for the period 1997–1998 and with themulti-calliper proposed by García-March et al. (2002)from 1999 to 2002. Total sizes were estimated with theequation by García-March and Ferrer (1995).
The study of spatial distribution was carried outusing the position of the individuals in both areas. Theanalysis of the data was developed using the Poisson’sseries as mathematical model and the �2-test (good-ness-of-Wt) for agreement with a Poisson series (Elliott1983). The surface of each area was subdivided on thepaper in 9 m2 grids because of the adjustment of theunits to the scale of the distribution study, since theoccurrence of individuals inside the grids becomes a
rare event, what agrees with the premises of the statis-tical method used for the study.
To evaluate the diVerences of mortality betweendepths, the percentage of dead individuals and thetotal mortality coeYcient (z) (Gulland 1988) were cal-culated in each area after the Wrst 3 years of survey. Todiscriminate if mortality is size-dependent, all individu-als (alive and dead) of each area were grouped in15 cm size-sets, and comparisons between expectedand observed mortalities were done by means of a �2-test.
Shell-length data of the diVerent individuals duringthe period 1997–2002 were adjusted to the Von Berta-lanVy growth equation, according to the method pro-posed by Wang (2004) for multiple recaptures, wheninitial ages for all individuals are unknown. To test ifthe growth patterns are the same in each group of indi-viduals, the generalised T2-Statistic (Anderson 1971)was used.
Finally, orientation of the shell was measured tak-ing as reference point the bend (b) formed by thehinge-line of the animals (Fig. 3). The measurementswere Wtted to the following four 90° intervals of thecardinal points: N(315°–45°), S(135°–225°), E(45°–135°) and W(225°–315°). Two tests were carried outfor each group to discriminate if the orientation of thehinge-line is signiWcant or not. In the Wrst case, thefour orientations are compared, N, S, E and W and, inthe second one, the intervals are compared in groupsof 2: N–S against E–W. To check if some relationshipexists between the orientation of the individuals andthe wave exposure of the shore, the wave exposureindex proposed by Thomas (1982), which reXects theshoreline exposure to hydrodynamism according tothe slope of the beach, the fetch and the intensity anddirection of preferential winds in the area, was calcu-lated. Wind data were recorded from the nearestmeteorological station in San Antonio Cape Light-house of the Spanish Institute of Meteorology (SIM).To test the signiWcance of the results, orientation dis-tributions were compared to a uniform distributionusing a �2, as indicated by Fisher (2000) for groupeddata.
The individuals were monitored annually at A1 andevery three months at A2, resulting in a total of 6 and21 samplings for each group, respectively. All the indi-viduals of both areas were measured in each surveyduring the period 1997–2000. Afterwards, only controlsof subgroups of animals were performed. For that rea-son, the study of size segregation, spatial distribution,mortality and orientation was developed using the dataof July 2000, whereas for the studies of growth andmovement the 1997–2002 period data.
Fig. 3 Biometry of Pinna nobilis: W maximum width; w mini-mum width; UL unburied length; h buried length; Or orientation;b bend
123

Mar Biol (2007) 150:861–871 865
Results
All the inventoried individuals of both areas could beeasily relocated at each new survey from their mea-sured distances to the stainless-steel sticks. Soon, it wasevident that the repetition of observations after shorttime periods to control displacement of individuals wasnot necessary, because individuals were always in thesame previously observed location. After the 5 years ofstudy, all live specimens remained in the same place ofthe Wrst observation.
As it can be deduced from the displacement data,neither individual changed its position during the mon-itored period. Consequently, to perform the orienta-tion study, only the orientation data of individuals alivein the last complete survey (year 2000) were necessaryfor the analysis. The results show that it is not possibleto discard random shell orientation in A1 (¡13 m)(P = 0.663 and 0.375 for the orientations N, S, E and Wand N–S versus E–W, respectively). By contrast, thediVerences are highly signiWcant in A2 (¡6 m)(P = 0.007) when N–S against E–W orientations areconsidered, and non signiWcant when the four 90° inter-vals N, S, E and W are considered (P = 0.055),although in this last case �2-test is very close to signiW-cant results. Indeed, in A2, 16 of the 20 individualshave their valves oriented towards N–S direction(Fig. 4). In this context, Thomas’s (1982) exposureindex shows that the maximum wave exposure laysbetween WSW and ESE in both areas, being moreintense at 6 m depth, where the A2 is located (Fig. 5)(Table 1).
As expected from previous observations performedin Moraira bay, density of individuals is higher in A1 at
13 m depth (103 specimens alive, 10.3 individuals/100 m2) than in A2 at 6 m depth (20 specimens alive,six individuals/100 m2), closely matching with the pre-vious density estimations in the same depths citedabove (García-March 2005). The current result,together with the previous data, conWrms that individu-als are progressively more aggregated as depthincreases.
Nevertheless, the study of the individual’s spatialdistribution in both inventoried areas shows notenough evidence to aYrm that the specimens are notrandomly distributed (A1, �2 = 0.41, df = 3, P > 0.5,A2, �2 = 0.98, df = 2 and 0.3 < P < 0.5). Therefore,although the individuals tend to be more aggregatedwith the depth increment, at the smaller scale of thestudied areas they tend to be neither aggregated norevenly distributed.
In the same way, the size distribution also shows sig-niWcant statistical diVerences between both sites, asexpected from previous author observations. Meansize is higher at 13 m depth (A1) than at 6 m depth(A2) (A1, x = 47.2 § 9.86 cm; A2, x = 29.8 § 7.39 cm,P < 0.001). Not only the group of individuals withsmaller specimens is located in the shallowest zone, butalso the proportion of small individuals is greater andthe minimum sizes are also smaller in this site (Fig. 6).Furthermore, in situ observations have clearly shownthat at ¡6 m individuals are smaller than at ¡13 m,both in the studied areas and in adjacent places, anddirect observations on line transects perpendicular tothe shore show that larger individuals are founddeeper.
With regard to the study of in vivo growth, repeatedmeasurements of the inventoried individuals soon indi-cated diVerent growth rhythms in both areas, as it wassubsequently demonstrated by the Wtting of the VonBertalanVy growth equations. DiVerences wereobserved both at the rate at which maximum asymp-totic size is reached [K (y¡1)] and in the maximum sizereached [Linf (cm)]. However, striking inverse diVer-ences are observed. In A2, at 6 m depth, the growthrate at which the asymptotic size is reached is distinctlysuperior to that of A1, whereas the asymptotic size isclearly inferior than that of A1 (Fig. 7) [A1,L = 56.03(1 ¡ e¡0.17t); A2, L = 37.59(1 ¡ e¡0.40t)], indi-cating that individuals grow to similar sizes during theWrst 5–6 years but subsequently there is a sharp growthbrake in A2. The diVerences between growth curvesare signiWcant, with a P < 0.001. Therefore, there areimportant diVerences in growth rates between the twogroups of individuals, with smaller maximum size atthe lower depths, and consequently, “dwarf” individu-als occur in A2, compared to those of A1. The diVerent
Fig. 4 Shell orientation of alive Pinna nobilis in both ar-eas
123

866 Mar Biol (2007) 150:861–871
parameters of the Von BertalanVy equations, as well astheir conWdence limits can be observed in Table 2.
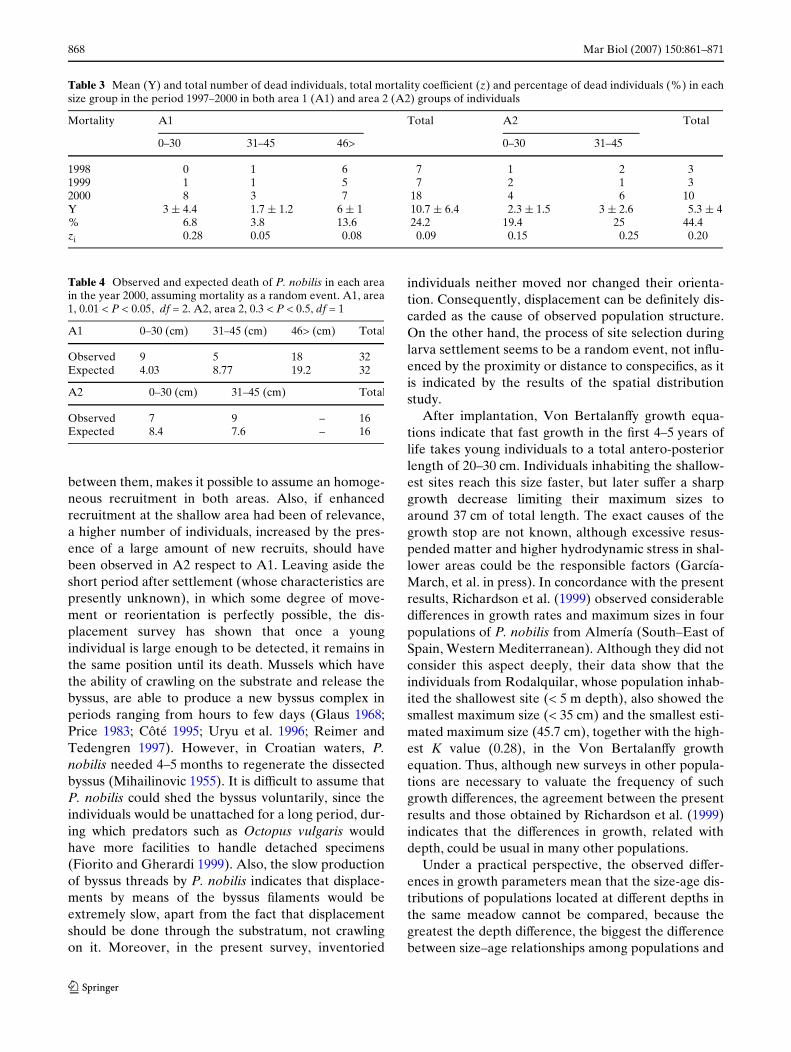
Annual mortality was homogeneous during the Wrst2 years and increased drastically in 2000 in both sites(Mean annual mortality A1 = 10.7 § 6.4, A2 = 5.3 § 4individuals) (Table 3). Total mortality has however,shown important diVerences between both sites, sincemuch more individuals died in A2 than in A1, in rela-tion to total individuals density (A2: 16 dead individu-als out of 36, 44.4%; A1: 32 dead individuals out of 135,23.7%); total mortality coeYcient being zA2 = 0.20 andzA1 = 0.09, respectively. Regarding to size-group
mortalities on each area, signiWcant diVerences occur inA1 (0.05 < P < 0.01, df = 2), where the individuals upto 30 cm died much more often than expected from arandom distributed mortality on each size group, andthe individuals of the 31–45 cm size-group died consid-erably less often than expected. The same tendencydoes not occur in A2 and the mortality is concentratedon the larger individuals (31–45 cm), although thediVerences among the observed and expected deathsare not statistically signiWcant (Table 4). Total mortal-ity coeYcients calculated for each size group showimportant diVerences between sites for the range 31–45 cm (zA1(31–45) = 0.05, zA2(31–45) = 0.25), being moresimilar for the range 0–31 cm (zA1(0–31) = 0.25, zA2(0–
31) = 0.15) (Table 3).
Discussion
The population structure of P. nobilis in Moraira bayfollows similar trends to those observed before in otherP. nobilis populations, with a depth-related size segre-gation, contagious distribution (as an increment innumber of individuals with depth) and valve orienta-tion in some sites (Zavodnik 1967; Vicente et al. 1980;Moreteau and Vicente 1982; Vicente 1990; Vicente andMoreteau 1991; Butler et al. 1993; Barberá et al. 1996,unpublished data; Templado 2001). However, the addi-tional data on mortality, small-scale spatial distribu-tion, individuals displacement and growth, allowcompleting the general view of the structure of P. nobi-lis population in Moraira bay. The result is a global pic-ture where causes and eVects can be related, except forsome particular ecological features, beyond the scopeof the present study, that should be investigated infuture surveys.
The observation of young individuals in both shal-low (6 m depth) and deep levels (13 m depth) proves
Fig. 5 Comparison between Thomas’s (1982) exposure in-dex and Pinna nobilis shell orientation. Numbers inside Wgures representing the total of individuals oriented on each 90° orientation interval (N, S, E and W)
Table 1 Observed (O) and expected (E) number of individualsfor each area, oriented in the pre-established range of orienta-tions respect to the cardinal points in the year 2000
In the lower part of the table, the percentage of individuals ori-ented N–S is compared with the main exposure index by Thomas(1982). A1, area 1 at 13 m depth. A2, area 2 at 6 m depth
Intervals (°)
N (315–45°)
S (135–225°)
E (45–135°)
W (225–315°)
Total number of individuals
O A1 26 21 26 30 103E A1 25.75 25.75 25.75 25.75 103O A2 8 8 1 3 20E A2 5 5 5 5 20
N–S (315–45°+ 135–225°)
E–W (45–135°+ 225–315°)
O A1 – – 47 56 103E A1 – – 51.5 51.5 103O A2 – – 16 4 20E A2 – – 10 10 20
% Of individuals N–S
% Exposure index N + S
A1 – – 45 57.41 –A2 – – 75 64.81 –
123

Mar Biol (2007) 150:861–871 867
that larvae settle along all the depth range, as alreadywas supposed by Combelles et al. (1986), after theobservation, in the P. nobilis population of Port Cros,
of young individuals also implanted in deep zones. Lar-val behaviour could also have some inXuence on popu-lation structure of P. nobilis, increasing the prevalenceof small individuals in the shallowest sites, similarly toTellina spp. and Mulinina lateralis, where the activemaintenance of a preferred depth keeps the spat within5 km of shore at Duck (NC, USA) (Shanks and Brink2005). However, in the present study, the proximity ofboth areas to the shore, < 1 km, and one from theother, circa 500 m, with no unevenness in the meadow
Fig. 6 Size distribution of live Pinna nobilis in both areas in year 2000: a area 1; b area 2
Fig. 7 Von BertalanVy growth equations of Pinna nobilis locatedin the two surveyed areas: A1, area 1 at 13 m depth, L = 56.03(1 ¡ e¡0.17t); A2, area 2 at 6 m depth, L = 37.59(1 ¡ e¡0.40t)
Table 2 Estimated parameters of the Von BertalanVy growthcurve for both groups of individuals
A1 and A2 as in Table 1. Linf, asymptotic size. K, growth rate atwhich the asymptotic size is reached. Vlinf and Vk, variances ofLinf and k. CovkLinf, covariance matrix of k and Linf. Std k and StdLinf, standard deviations of k and Linf. n, number of captures/recaptures
Linf (cm)K (year¡1) VLinf CovKLVk Std kStd Linfn
A1 (F)56.03 0.17 0.50¡0.01 0.000.01 0.70 244A2 (F)37.59 0.40 29.60¡0.19 0.020.12 172.10 99
123
868 Mar Biol (2007) 150:861–871
between them, makes it possible to assume an homoge-neous recruitment in both areas. Also, if enhancedrecruitment at the shallow area had been of relevance,a higher number of individuals, increased by the pres-ence of a large amount of new recruits, should havebeen observed in A2 respect to A1. Leaving aside theshort period after settlement (whose characteristics arepresently unknown), in which some degree of move-ment or reorientation is perfectly possible, the dis-placement survey has shown that once a youngindividual is large enough to be detected, it remains inthe same position until its death. Mussels which havethe ability of crawling on the substrate and release thebyssus, are able to produce a new byssus complex inperiods ranging from hours to few days (Glaus 1968;Price 1983; Côté 1995; Uryu et al. 1996; Reimer andTedengren 1997). However, in Croatian waters, P.nobilis needed 4–5 months to regenerate the dissectedbyssus (Mihailinovic 1955). It is diYcult to assume thatP. nobilis could shed the byssus voluntarily, since theindividuals would be unattached for a long period, dur-ing which predators such as Octopus vulgaris wouldhave more facilities to handle detached specimens(Fiorito and Gherardi 1999). Also, the slow productionof byssus threads by P. nobilis indicates that displace-ments by means of the byssus Wlaments would beextremely slow, apart from the fact that displacementshould be done through the substratum, not crawlingon it. Moreover, in the present survey, inventoried
individuals neither moved nor changed their orienta-tion. Consequently, displacement can be deWnitely dis-carded as the cause of observed population structure.On the other hand, the process of site selection duringlarva settlement seems to be a random event, not inXu-enced by the proximity or distance to conspeciWcs, as itis indicated by the results of the spatial distributionstudy.
After implantation, Von BertalanVy growth equa-tions indicate that fast growth in the Wrst 4–5 years oflife takes young individuals to a total antero-posteriorlength of 20–30 cm. Individuals inhabiting the shallow-est sites reach this size faster, but later suVer a sharpgrowth decrease limiting their maximum sizes toaround 37 cm of total length. The exact causes of thegrowth stop are not known, although excessive resus-pended matter and higher hydrodynamic stress in shal-lower areas could be the responsible factors (García-March, et al. in press). In concordance with the presentresults, Richardson et al. (1999) observed considerablediVerences in growth rates and maximum sizes in fourpopulations of P. nobilis from Almería (South–East ofSpain, Western Mediterranean). Although they did notconsider this aspect deeply, their data show that theindividuals from Rodalquilar, whose population inhab-ited the shallowest site (< 5 m depth), also showed thesmallest maximum size (< 35 cm) and the smallest esti-mated maximum size (45.7 cm), together with the high-est K value (0.28), in the Von BertalanVy growthequation. Thus, although new surveys in other popula-tions are necessary to valuate the frequency of suchgrowth diVerences, the agreement between the presentresults and those obtained by Richardson et al. (1999)indicates that the diVerences in growth, related withdepth, could be usual in many other populations.
Under a practical perspective, the observed diVer-ences in growth parameters mean that the size-age dis-tributions of populations located at diVerent depths inthe same meadow cannot be compared, because thegreatest the depth diVerence, the biggest the diVerencebetween size–age relationships among populations and
Table 3 Mean (Y) and total number of dead individuals, total mortality coeYcient (z) and percentage of dead individuals (%) in eachsize group in the period 1997–2000 in both area 1 (A1) and area 2 (A2) groups of individuals
Mortality A1 Total A2 Total
0–30 31–45 46> 0–30 31–45
1998 0 1 6 7 1 2 31999 1 1 5 7 2 1 32000 8 3 7 18 4 6 10Y 3 § 4.4 1.7 § 1.2 6 § 1 10.7 § 6.4 2.3 § 1.5 3 § 2.6 5.3 § 4% 6.8 3.8 13.6 24.2 19.4 25 44.4zi 0.28 0.05 0.08 0.09 0.15 0.25 0.20
Table 4 Observed and expected death of P. nobilis in each areain the year 2000, assuming mortality as a random event. A1, area1, 0.01 < P < 0.05, df = 2. A2, area 2, 0.3 < P < 0.5, df = 1
A1 0–30 (cm) 31–45 (cm) 46> (cm) Total
Observed 9 5 18 32Expected 4.03 8.77 19.2 32
A2 0–30 (cm) 31–45 (cm) Total
Observed 7 9 – 16Expected 8.4 7.6 – 16
123

Mar Biol (2007) 150:861–871 869
the possibility to confuse adult individuals of shallowerpopulations with young specimens of deeper ones.What is more, the most exposed the shore, the mostimportant these diVerences would be. Moreover, thegrowing tendency of individuals total size in relation todepth, together with the diVerences in growth equa-tions in both groups of individuals, show a gradual evo-lution between growth parameters of populationslocated in shallow waters and those located at deeperones, introducing the necessity of a new form of calcu-lating P. nobilis growth taxes, as an integrated continu-ous evolution of growth parameters with the increaseof depth. For that reason, subsequent studies aboutgrowth and age of P. nobilis populations should bestratiWed in narrow depth intervals as the best approxi-mation.
On the other hand, mortality data shows that thegroup of small individuals is under a higher selectivepressure throughout the Moraira bay and many ofthem died before reaching larger sizes, as demon-strated by the high values of total mortality coeYcients(z) of this size-group in both areas. However, the des-tiny of the survivors above 30 cm length is drasticallydiVerent on each site. Whereas in A1 the individualsbetween 31 and 45 cm have the minimum z of all size-groups in both areas, hence being in an optimal loca-tion for their survival, in A2 these groups of individu-als, which represent the largest specimens at 6 m depth,have a relatively huge z (0.05 vs. 0.25, respectively)(Table 3), being strongly decimated. These observa-tions are in consistence with the idea suggested byCombelles et al. (1986) that some factor, withanthropic or natural origin, could be conditioning thesurvival of the largest individuals in the shallowestareas. It is improbable that collection of large individu-als in A2 is the cause of the adult mortality in this shal-low area of Moraira bay, since the zone is far from theshore, individuals are completely hidden by the leavesof P. oceanica and amateur divers seldom approximateto the location of the experimental area.
However, the shell drag force experiments simulta-neously developed, have shown that, given a waveheight, individuals of shallower levels are subjected tohigher drag forces than those located at deeper ones inMoraira bay. Also, lateral valve orientation suppose adrag force increment of more than fourfold respect tothe dorso-ventral position of the valves (García-Marchet al. in press). Thus, above a minimum threshold ofwater speed, more frequently reached in shallower lev-els (i.e. A2), both large individuals and those badly ori-ented with regard to the main water direction, are indisadvantage for survival. Therefore, according to Tho-mas’s (1982) shore exposure index, those specimens
oriented E–W in Moraira bay are suVering much morehydrodynamic stress than those oriented N–S. Indeed,A2 preferential valve orientation matches with theoptimum dorso-ventral orientation N–S in this bay.These results are consistent with those observed byCombelles et al. (1986), since the preferential orienta-tion N–S coincides with the slope of the bottom. How-ever, the fact that valve orientation matches with theslope of the bottom does not mean that mortality ofindividuals with improper orientation respect to nearbottom currents bringing food, is the causing factor inMoraira bay, chieXy because it is only observed in theshallowest site. Furthermore, the combination of a N–S(dorso-ventral) orientation together with the smallestsizes in A2, strongly reduce mean drag force, beingalways lower than that observed in A1, whatever thewave height and wave period are (García-March et al.in press). Consequently, all indicates that, in the shal-lowest sites, maximum total sizes and shell orientationare controlled by hydrodynamic stress, causing thedeath of larger and improperly oriented individuals,and by some kind of endogenous biological limitationof the maximum size, as suggested above.
In this context, it has been demonstrated thatextreme wave heights, produced during huge storms,have an essential regulation capacity over the popula-tion structure of P. nobilis, inasmuch as they kill thelargest individuals inhabiting deeper waters, seldomsubjected to such high water speeds (García-March,et al. in press). These events, the strongest probablyoccurring each 22 years, according to the climate cyclesobserved in the western Mediterranean (Duarte et al.1999), produce a cycled decline in population densityby the punctual mortality increase of large individualsand, what is more important, a drastic reduction of themean age of the population, probably killing manyadult specimens before reaching their potential maxi-mum age.
The irregular topography of the P. oceanicameadow, with many channels, pools and front steps,can alter water direction and speed in some sites (Gra-nata et al. 2001), so that some individuals can takeadvantage of those niches and grow larger or with the-oretical improper orientations than expected fromhydrodynamic forces calculations. In fact, in Morairabay some large individuals are observed in the cornerof a front step in an apparently sheltered zone. There-fore, in the “picture” of Moraira P. nobilis populationstructure, sometimes large individuals are observedamong many smaller ones.
Summarising, in the general view of Moraira P. nobilispopulation, mean sizes (not strictly age-related), andnumber of individuals, gradually increase with depth
123

870 Mar Biol (2007) 150:861–871
throughout the bay, due to the reduction of hydrody-namic stress and the consequent decrease of its selectivepressure. The general reduction of stress does not inXu-ence small-scale spatial distribution, since it occurs at alarge scale, aVecting similarly all the individuals from thesame depth range, except those inhabiting special niches,as indicated above. In a global view, it seems that juvenileindividuals preferentially settle at lower depths and after-wards move toward deeper areas as they grow; the occur-rence of dwarf individuals in the shallowest zonesstrongly contributes to this impression.
Likewise, the observation of size segregation with theincrement of depth in many other Mediterranean coastscould be also consequence of the eVects of hydrody-namic stress on individual’s survival and growth. In fact,they could be the causes of the population structureobserved by Combelles et al. (1986) in Port Cros.
Acknowledgments We thank to Prof. M. Jesús Bayarri(Department of Statistics and Operational Research, Univ.Valencia) and M. A. Sanchís, Prof. R. Capaccioni and J. D Acuña(Marine Biology Laboratory, University of Valencia) for theirtechnical support in the Wrst stages of the research. We are alsogreatful to Prof. A. Márquez and F. Robles (Department of Pale-ontology, University of Valencia). This experiments compliedwith the current environmental laws of Spain.
Reference
Anderson TW (1971) An introduction to multivariate statisticalanalysis. Wiley, New York
Butler A, Vicente N, De Gaulejac B (1993) Ecology of de Pteri-oid bivalves Pinna bicolor Gmelin and Pinna nobilis L. Life3(1–2):37–45
Catsiki VA, Catsikieri CH (1992) Presence of chromium in P. no-bilis collected from a polluted area. Fresenius Environ Bull1:644–649
Combelles S, Moreteau JC, Vicente N (1986) Contribution a laconnaissance de l’ecologie de Pinna nobilis L. (Mollusqueeulamelibranche). Sci Rep Port-Cros Nat Park 12:29–43
Côté IM (1995) EVects of predatory crab eZuent on byssus pro-duction in mussels. J Exp Mar Biol Ecol 188:233–241
De Gaulejac B, Vicente N (1990) Ecologie de Pinna nobilis (L.)mollusque bivalve sur les côtes de Corse. Essais de transplan-tation et expériences en milieu contrôlé. Haliotis 10:83–100
Duarte CM, Agustí S, Kennedy H, Vaqué D (1999) The Mediter-ranean climate as a template for Mediterranean marine eco-systems: the example of the northeast Spanish littoral. ProgOceanogr 44:245–270
Elliott JM (1983) Some methods for the statistical analysis ofsamples of benthic invertebrates. Freshwater BiologicalAssociation, ScientiWc Publication No 25, Oxford
Fiorito G, Gherardi F (1999) Prey-handling behaviour of Octopusvulgaris (Mollusca, Cephalopoda) on bivalve preys. BehavProc 46:75–88
Fisher NI (2000) Statistical analysis of circular data. CambridgeUniversity Press, New York
García-March JR (2003) Contribution to the knowledge of thestatus of Pinna nobilis (L.) 1758 in Spanish coasts. Mem InstOceanogr Paul Ricard 9:29–41
García-March JR (2005) Aportaciones al conocimiento de la Bi-ología de Pinna nobilis Linnaeus, 1758 (Mollusca: Bivalvia),en el litoral mediterráneo Ibérico. Publication Service of theUniversity of Valencia, Valencia (in press)
García-March JR, Ferrer JF (1995) Biometría de Pinna nobilis L.,1758: una revisión de la ecuación de De Gaulejac y Vicente(1990). Bol Inst Esp Oceanogr 11(2):175–181
García-March JR, García-Carrascosa AM, Peña A (2002) Theproblems of in situ measurement of Pinna nobilis Linnaeus,1758 shell, for age and growth studies: a new device. MarEcol PSZN 23(3):207–217
García-March JR, Garcia-Carrascosa AM, Perez-Rojas L (inpress) InXuence of hydrodynamic forces on population struc-ture of Pinna nobilis L., 1758 (Mollusca: Bivalvia): the criti-cal combination of drag force, water depth shell size andorientation. J Exp Mar Biol Ecol
Giraud G (1977) Essai de classement des herbiers de Posidoniaoceanica. (Linné) Delile. Bot Mar 20:487–491
Glaus KJ (1968) Factors inXuencing the production of byssusthreads in Mytilus edulis. Biol Bull 135:420
Granata TC, Serra T, Colomer J, Casamitjana X, Duarte CM, Ga-cia E (2001) Flow and particle distributions in a nearshoreseagrass meadow before and after a storm. Mar Ecol ProgrSer 218:95–106
Gulland JA (1988) Fish stock assesment: a manual of basic meth-ods. FAO/WILEY series on food and agriculture, vol 1. Wi-ley, Chichester, New York, Brisbane, Toronto, Singapore
Katsanevakis S (2005) Population ecology of the endangered fanmussel Pinna nobilis in a marine lake. Endang Species Res1:1–9
Mihailinovic M (1955) Lostura. Morsko Ribarstvo 7:113–114Moreteau JC, Vicente N (1982) Evolution d’une population de
Pinna nobilis L. (Mollusca, Bivalvia). Malacologia 22(1–2):341–345
Porcheddu AS, Castelli A, Romor R (1998) Considerazioni su unpopolamento di Pinna nobilis L., nel Golfo degli Aranci(Sardegna nord-orientale): prospettive di salvaguardia. BollMalacol 33(1–4):21–24
Price HA (1983) Structure and formation of the byssus complexin Mytilus (Mollusca, Bivalvia). J Mollus Stud 49:9–17
Ramos MA (1998) Implementing the habitats directive for mol-lusc species in Spain. J Conchol Spec Publ 2:125–132
Remier O, Tedengren M (1997) Predator-induced changes inbyssal attachment, aggregation and migration in the bluemussel, Mytilus edulis. Mar Freshw Behav Physiol30(4):251–266
Richardson CA, Kennedy H, Duarte CM, Kennedy DP, ProudSV (1999) Age and growth of the fan mussel Pinna nobilisfrom south-east Spanish Mediterranean seagrass (Posidoniaoceanica) meadows. Mar Biol 133:205–212
Richardson CA, Peharda M, Kennedy H, Kennedy P, Onofri V(2004) Age, growth rate and season of recruitment of Pinnanobilis (L) in the Croatian Adriatic determined fromMg:Ca and Sr:Ca shell proWles. J Exp Mar Biol Ecol 299:1–16
Sanjaume E (1985) Las costas valencianas. Sedimentología ymorfología. PhD Thesis, Universidad de Valencia, Valencia,España
Shanks AL, Brink L (2005) Upwelling, downwelling, and cross-shelf transport of bivalve larvae: test of a hypothesis. MarEcol Prog Ser 302:1–12
Siletic T, Peharda M (2003) Population study of the fan shell Pin-na nobilis L. in Malo and Veliko Jezero of the Mljet NationalPark (Adriatic Sea). Sci Mar 67(1):91–98
Smeathers JE, Vincent JFV (1979) Mechanical properties of mus-sel byssus threads. J Mollus Stud 45:219–230
123

Mar Biol (2007) 150:861–871 871
Taylor JJ, Rose RA, Southgate PC (1997) Byssus production insix age classes of the silver-lip pearl oyster, Pinctata maxima(Jameson). J Shell Res 16(1):97–101
Templado J (2001) Pinna nobilis Linnaeus, 1758. In: Ramos MA,Bragado D, Hernández J (eds) Los invertebrados no insectosde la Directiva Hábitat en España. Ministerio de Medio Am-biente, Serie Técnica, Madrid, pp 82–92
Thomas MLH (1982) A physically derived exposure index formarine shorelines. Ophelia 8:1–13
Torres J, Giner ML, Esteban JL, Capaccioni R, García-Carrasco-sa AM (1990a) Distribution and preliminary evaluation ofthe state of the Posidonia oceanica Meadows on the Coastsof Alicante. Rapp Comm Int Expl Sci Mer Mediterr 32(1):9
Torres J, García-Carrascosa AM, Benedito V, Esteban JL, GinerLM, Capaccioni R (1990b) Posidonia oceanica Barrier-Reefsat Spain Eastern Coasts. Preliminary data. Rapp Comm IntExpl Sci Mer Mediterr 32(1):9
Uryu Y, Iwasaki K, Hinoue M (1996) Laboratory experiments onbehaviour and movement of a freshwater mussel, Limnoper-na fortunei (Dunker). J Mollus Stud 62:327–341
Vicente N (1990) Estudio ecológico y protección del moluscolamelibranquio Pinna nobilis L. 1758 en la costa mediterrá-nea. Iberus 9(1–2):269–279
Vicente N, Moreteau JC (1991) Statut de Pinna nobilis L. enMediterranee (mollusque eulamellibranche). In: Boudour-esque CF, Avon M, Gravez V (eds) Les Espèces Marines àProtéger en Méditerranée. Gis Posidonie publication, Mar-seille, pp 159–168
Vicente N, Moreteau JC, Escoubet P (1980) Etude de l’evolutiond’une population de Pinna nobilis L. (Mollusque Eulamelib-ranche) au large de l’anse de la Palud (Parc National de Port-Cros). Trav Sci Parc Natl Port-Cros 6:39–67
Wang YG (2004) Estimation of growth parameters from multi-ple-recapture data. Biometrics 60:670–675
Yonge CM (1953) Form and habit in Pinna carnea Gmelin. PhilTrans R Soc Lond Ser B. 237:335–374
Zavodnik D (1967) Contribution to the ecology of Pinna nobilisL. (moll. bivalvia) in the Northern Adriatic sea. Thalas Yu-gol 3:93–102
Zavodnik D, Hrs-Brenko M, Legac M (1991) Synopsis on the fanshell Pinna nobilis L. in the eastern Adriatic sea. In: Bou-douresque CF, Avon M, Gravez V (eds) Les Espèces Ma-rines à Protéger en Méditerranée. Gis Posidonie publication,Marseille, pp 169–178
123