Comparison of aerosol optical depths from the Ozone Monitoring Instrument (OMI) on Aura with results...
23
Atmos. Chem. Phys., 9, 6743–6765, 2009 www.atmos-chem-phys.net/9/6743/2009/ © Author(s) 2009. This work is distributed under the Creative Commons Attribution 3.0 License. Atmospheric Chemistry and Physics Comparison of aerosol optical depths from the Ozone Monitoring Instrument (OMI) on Aura with results from airborne sunphotometry, other space and ground measurements during MILAGRO/INTEX-B J. M. Livingston 1 , J. Redemann 2 , P. B. Russell 3 , O. Torres 4 , B. Veihelmann 5 , P. Veefkind 6 , R. Braak 6 , A. Smirnov 7,8 , L. Remer 7 , R. W. Bergstrom 2 , O. Coddington 9 , K. S. Schmidt 9 , P. Pilewskie 9 , R. Johnson 3 , and Q. Zhang 2 1 SRI International, Menlo Park, CA, 94025, USA 2 Bay Area Environmental Research Institute (BAERI), Sonoma, CA, 95476, USA 3 NASA Ames Research Center, Moffett Field, CA, 94035, USA 4 Center for Atmospheric Sciences, Hampton University, Hampton, VA, 23668, USA 5 European Space Agency (ESA/ESTEC), Noordwijk, The Netherlands 6 Royal Netherlands Meteorological Institute (KNMI), De Bilt, The Netherlands 7 NASA Goddard Space Flight Center, Greenbelt, MD, 20771, USA 8 Science Systems and Applications, Inc., Lanham, MD, 20706, USA 9 Laboratory for Atmospheric and Space Physics, University of Colorado, Boulder, CO, 80309, USA Received: 17 March 2009 – Published in Atmos. Chem. Phys. Discuss.: 20 April 2009 Revised: 26 August 2009 – Accepted: 2 September 2009 – Published: 18 September 2009 Abstract. Airborne sunphotometer measurements are used to evaluate retrievals of extinction aerosol optical depth (AOD) from spatially coincident and temporally near- coincident measurements by the Ozone Monitoring Instru- ment (OMI) aboard the Aura satellite during the March 2006 Megacity Initiative-Local And Global Research Observa- tions/Phase B of the Intercontinental Chemical Transport Experiment (MILAGRO/INTEX-B). The 14-channel NASA Ames Airborne Tracking Sunphotometer (AATS) flew on nine missions over the Gulf of Mexico and four in or near the Mexico City area. Retrievals of AOD from near-coincident AATS and OMI measurements are compared for three flights over the Gulf of Mexico for flight segments when the air- craft flew at altitudes 60–70 m above sea level, and for one flight over the Mexico City area where the aircraft was restricted to altitudes ∼320–800 m above ground level over the rural area and ∼550–750 m over the city. OMI- measured top of atmosphere (TOA) reflectances are rou- tinely inverted to yield aerosol products such as AOD and Correspondence to: J. M. Livingston ([email protected]) aerosol absorption optical depth (AAOD) using two differ- ent retrieval algorithms: a near-UV (OMAERUV) and a multiwavelength (OMAERO) technique. This study uses the archived Collection 3 data products from both algo- rithms. In particular, AATS and OMI AOD comparisons are presented for AATS data acquired in 20 OMAERUV retrieval pixels (15 over water) and 19 OMAERO pixels (also 15 over water). At least four pixels for one of the over-water coincidences and all pixels for the over-land case were cloud-free. Coincident AOD retrievals from 17 pix- els of the Moderate Resolution Imaging Spectroradiometer (MODIS) aboard Aqua are available for two of the over- water flights and are shown to agree with AATS AODs to within root mean square (RMS) differences of 0.00–0.06, de- pending on wavelength. Near-coincident ground-based AOD measurements from ground-based sun/sky radiometers oper- ated as part of the Aerosol Robotic Network (AERONET) at three sites in and near Mexico City are also shown and are generally consistent with the AATS AODs (which ex- clude any AOD below the aircraft) both in magnitude and spectral dependence. The OMAERUV algorithm retrieves AODs corresponding to a non-absorbing aerosol model for Published by Copernicus Publications on behalf of the European Geosciences Union.
Transcript of Comparison of aerosol optical depths from the Ozone Monitoring Instrument (OMI) on Aura with results...
Atmos. Chem. Phys., 9, 6743–6765, 2009www.atmos-chem-phys.net/9/6743/2009/© Author(s) 2009. This work is distributed underthe Creative Commons Attribution 3.0 License.
AtmosphericChemistry
and Physics
Comparison of aerosol optical depths from the Ozone MonitoringInstrument (OMI) on Aura with results from airbornesunphotometry, other space and ground measurements duringMILAGRO/INTEX-B
J. M. Livingston1, J. Redemann2, P. B. Russell3, O. Torres4, B. Veihelmann5, P. Veefkind6, R. Braak6, A. Smirnov7,8,L. Remer7, R. W. Bergstrom2, O. Coddington9, K. S. Schmidt9, P. Pilewskie9, R. Johnson3, and Q. Zhang2
1SRI International, Menlo Park, CA, 94025, USA2Bay Area Environmental Research Institute (BAERI), Sonoma, CA, 95476, USA3NASA Ames Research Center, Moffett Field, CA, 94035, USA4Center for Atmospheric Sciences, Hampton University, Hampton, VA, 23668, USA5European Space Agency (ESA/ESTEC), Noordwijk, The Netherlands6Royal Netherlands Meteorological Institute (KNMI), De Bilt, The Netherlands7NASA Goddard Space Flight Center, Greenbelt, MD, 20771, USA8Science Systems and Applications, Inc., Lanham, MD, 20706, USA9Laboratory for Atmospheric and Space Physics, University of Colorado, Boulder, CO, 80309, USA
Received: 17 March 2009 – Published in Atmos. Chem. Phys. Discuss.: 20 April 2009Revised: 26 August 2009 – Accepted: 2 September 2009 – Published: 18 September 2009
Abstract. Airborne sunphotometer measurements are usedto evaluate retrievals of extinction aerosol optical depth(AOD) from spatially coincident and temporally near-coincident measurements by the Ozone Monitoring Instru-ment (OMI) aboard the Aura satellite during the March 2006Megacity Initiative-Local And Global Research Observa-tions/Phase B of the Intercontinental Chemical TransportExperiment (MILAGRO/INTEX-B). The 14-channel NASAAmes Airborne Tracking Sunphotometer (AATS) flew onnine missions over the Gulf of Mexico and four in or near theMexico City area. Retrievals of AOD from near-coincidentAATS and OMI measurements are compared for three flightsover the Gulf of Mexico for flight segments when the air-craft flew at altitudes 60–70 m above sea level, and forone flight over the Mexico City area where the aircraftwas restricted to altitudes∼320–800 m above ground levelover the rural area and∼550–750 m over the city. OMI-measured top of atmosphere (TOA) reflectances are rou-tinely inverted to yield aerosol products such as AOD and
Correspondence to:J. M. Livingston([email protected])
aerosol absorption optical depth (AAOD) using two differ-ent retrieval algorithms: a near-UV (OMAERUV) and amultiwavelength (OMAERO) technique. This study usesthe archived Collection 3 data products from both algo-rithms. In particular, AATS and OMI AOD comparisonsare presented for AATS data acquired in 20 OMAERUVretrieval pixels (15 over water) and 19 OMAERO pixels(also 15 over water). At least four pixels for one of theover-water coincidences and all pixels for the over-land casewere cloud-free. Coincident AOD retrievals from 17 pix-els of the Moderate Resolution Imaging Spectroradiometer(MODIS) aboard Aqua are available for two of the over-water flights and are shown to agree with AATS AODs towithin root mean square (RMS) differences of 0.00–0.06, de-pending on wavelength. Near-coincident ground-based AODmeasurements from ground-based sun/sky radiometers oper-ated as part of the Aerosol Robotic Network (AERONET)at three sites in and near Mexico City are also shown andare generally consistent with the AATS AODs (which ex-clude any AOD below the aircraft) both in magnitude andspectral dependence. The OMAERUV algorithm retrievesAODs corresponding to a non-absorbing aerosol model for
Published by Copernicus Publications on behalf of the European Geosciences Union.

6744 J. M. Livingston et al.: Comparison of aerosol optical depths from the OMI and AATS
all three over-water comparisons, whereas the OMAERO al-gorithm retrieves best-fit AODs corresponding to an absorb-ing biomass-burning aerosol model for two of the three over-water cases. For the four cloud-free pixels in one over-water coincidence (10 March), the OMAERUV retrievalsunderestimate the AATS AODs by∼0.20, which exceedsthe expected retrieval uncertainty, but retrieved AODs agreewith AATS values within uncertainties for the other twoover-water events. When OMAERO retrieves AODs corre-sponding to a biomass-burning aerosol over water, the val-ues significantly overestimate the AATS AODs (by up to0.55). For the Mexico City coincidence, comparisons arepresented for a non-urban region∼50–70 km northeast of thecity and for a site near the center of the city. OMAERUVretrievals are consistent with AERONET AOD magnitudesfor the non-urban site, but are nearly double the AATS andAERONET AODs (with differences of up to 0.29) in the cen-ter of the city. Corresponding OMAERO retrievals exceedthe AATS and/or AERONET AODs by factors of 3 to 10.
1 Introduction
In March 2006 the 14-channel Ames Airborne Tracking Sun-photometer (AATS-14 or AATS) was operated on a Jet-stream 31 (J31) aircraft based in Veracruz, Mexico dur-ing MILAGRO/INTEX-B (Megacity Initiative-Local andGlobal Research Observations/Phase B of the Intercontinen-tal Chemical Transport Experiment; Molina et al., 2009).AATS measured aerosol optical depth (AOD) at 13 wave-lengths (354–2139 nm) and columnar water vapor (CWV)in 13 flights that sampled clean and polluted airmasses overthe Gulf of Mexico and Mexico City. Vertical differentiationof AOD and CWV data obtained during J31 vertical profilesyields vertical profiles of multiwavelength aerosol extinctionand water vapor concentration, respectively. J31 flights werecoordinated with overpasses by several satellites, includingAqua and Aura, plus flights by other aircraft, including theNASA DC-8 and King Air and the NCAR C-130.
Top of Atmosphere (TOA) reflectances measured by theOzone Monitoring Instrument (OMI) aboard Aura are rou-tinely inverted using two different inversion schemes, anear-UV algorithm and a multiwavelength algorithm, toyield retrievals of AOD and aerosol absorption optical depth(AAOD). During MILAGRO, there were four Aura over-passes for which OMI aerosol retrievals have been performedand AATS AOD spectra have been calculated at coincidentor near-coincident times and locations. Three of these (3, 10,and 17 March) were over water (the Gulf of Mexico), and one(19 March) was over land (in and near Mexico City). Coin-cident AOD retrievals from the Moderate Resolution Imag-ing Spectroradiometer (MODIS) aboard the Aqua satelliteare available for 17 pixels for the 10 March and 17 Marchevents, but there is only one MODIS pixel with an acceptable
(MODIS quality assurance flag 3) retrieval along the J31track for the 19 March case study. For the 19 March case alimited number of AOD retrievals is available from ground-based sun/sky radiometers that were operated as part of theAerosol Robotic Network (AERONET) (Holben et al., 1998)at three sites in and northeast of Mexico City: T0, T1 and T2(Molina et al., 2009). The purpose of this paper is to evaluatethe performance of the OMI AOD Collection 3 retrievals forthese events by comparison with collocated AATS AODs andwith MODIS and AERONET AOD retrievals, where avail-able. In a companion paper, Redemann et al. (2009) usethe AATS MILAGRO data set to present a detailed compar-ison of MODIS Collection 004 and Collection 005 aerosolretrievals.
Due to the relatively recent nature of the OMI aerosol dataset (Aura was launched on 15 July 2004), only a few OMIaerosol validation studies have been published to date. Ahnet al. (2008) compare Collection 2 OMAERUV retrievals ofAOD with corresponding retrievals from Aqua-MODIS andTerra-Multiangle Imaging Spectroradiometer (MISR) for se-lected collocated granules during 2006 and early 2007. Inaddition, they compare the seasonal variability of monthlyAOD in 2006 from OMI 500 nm, MODIS 550 nm, and MISR558 nm retrievals. Curier et al. (2008) evaluate the per-formance of the OMI multiwavelength retrieval algorithmfor the period May–July 2005 by comparing AERONETand OMAERO AOD retrievals for measurements collectedat/near a small number of AERONET sites in Western Eu-rope, and OMAERO and MODIS AOD retrievals for 161 528collocated MODIS pixels over land and sea in the same re-gion. In their paper presenting NO2, aerosol, and ozone datafrom the 2005 and 2006 Dutch Aerosol and Nitrogen Diox-ide Experiments for Validation of OMI and SCHIAMACHY(DANDELIONS) project, Brinksma et al. (2008) include atime series comparison of OMAERO AOD at 440 nm withcoincident AOD retrievals from three ground-based sun pho-tometers (two automated and one hand-held) at Cabauw,Netherlands for five days in September 2006.
Whereas the other validation efforts to date have usedground-based sunphotometer measurements to investigateOMI AOD retrievals over land and near the sea, the currentstudy is the first to attempt validation of OMI over-waterAOD retrievals with over-water measurements from otherthan a satellite-borne sensor.
2 Instruments/aerosol retrieval algorithms
2.1 OMI
OMI is a nadir-viewing imaging spectrometer that mea-sures the TOA upwelling radiances in the ultraviolet andvisible (270–500 nm) regions of the solar spectrum with aspatial resolution of approximately 0.5 nm (Levelt et al.,2006). OMI flies aboard the EOS-Aura spacecraft and has
Atmos. Chem. Phys., 9, 6743–6765, 2009 www.atmos-chem-phys.net/9/6743/2009/

J. M. Livingston et al.: Comparison of aerosol optical depths from the OMI and AATS 6745
a 2600 km wide swath at a spatial resolution varying non-linearly from 13×24 km2 at nadir to 28×150 km2 at theswath extremes (median pixel size 15×32 km2). Althoughthe instrument was designed primarily for retrieval of tracegases like O3, NO2, SO2, etc., it contains valuable infor-mation on aerosols. The wavelength range around 400 nmcan be used to detect elevated layers of absorbing aerosolssuch as biomass burning and desert dust plumes. EOS-Aura is part of the A-Train satellite constellation; thus, OMImakes near simultaneous measurements with Aqua-MODIS,PARASOL, and CALIPSO.
The reflectance at the top of the atmosphere in the wave-length range from 330 to 500 nm is sensitive to the aerosolconcentration, size distribution, composition and verticaldistribution. The micro-physical properties determine theaerosol optical properties, which are described by the aerosolextinction efficiency, single scattering albedo and phasefunction as a function of altitude. Although the reflectanceis sensitive to the concentration, size distribution, composi-tion and vertical distribution, it is not possible to derive allthese parameters from the OMI measured reflectances be-cause the inversion is ill-posed. The OMI measurementsin the wavelength range 330–500 nm contain 2 to 4 degreesof freedom (independent pieces of information) on aerosolproperties (Veihelmann et al., 2007). The first degree of free-dom is dominated by the aerosol column content or AOD,and the size distribution, composition and altitude are mixedin the remaining independent pieces of information. Sincethe number of unknowns in the inversion problem is muchlarger, the retrievals have to be based partly on a-priori in-formation. The a-priori information used in the OMI aerosolretrievals consists of surface reflectance and a database ofaerosol models and their possible occurrence for a certain lo-cation and time of the year.
There are two algorithms for retrieving aerosol infor-mation from OMI measurements of TOA reflectance: theOMAERUV, or near-UV, algorithm; and the OMAERO, ormultiwavelength, technique. The OMAERUV algorithmhas a strong heritage in the TOMS aerosol retrieval algo-rithm (Torres et al., 2002) and uses only a small range ofwavelengths in the near UV from the OMI spectrum. TheOMAERO algorithm is a new approach designed for OMIand can use the wavelength range from 330 to 500 nm. Thetwo algorithms are described in more detail below.
The OMAERUV aerosol algorithm uses the radiancesmeasured at 354 and 388 nm to retrieve UV Aerosol In-dex, and AOD and AAOD at 388 nm. The algorithm is de-scribed in detail in Torres et al. (2007) and references therein(e.g. Herman et al., 1997; Torres et al., 1998, 2002). It usesthe same technique as that used in TOMS aerosol retrievals(Torres et al., 1998). There are two major advantages of thistechnique. First, it is capable of retrieving aerosol proper-ties over a wider variety of land surfaces than possible usingmeasurements only in the visible or near-IR because the re-flectance of all terrestrial surfaces (not covered with snow) is
small in the UV. Secondly, the technique is capable of retriev-ing aerosol absorption due to the strong interaction betweenaerosol absorption and the molecular scattering from belowthe aerosol layer.
The OMAERUV algorithm uses pre-computed TOA re-flectances for a set of 21 assumed aerosol models to retrieveAOD and AAOD. The set of aerosol models is composed ofthree major aerosol types: desert dust, carbonaceous aerosolsfrom biomass burning, and weakly absorbing aerosols. Eachtype includes seven models with different SSAs. The aerosolsize distribution functions are based on the long-term dataset of measurements by AERONET. The retrieval algorithmis sensitive to aerosol height, so AOD and AAOD results arearchived in the HDF data file for five different assumptionsfor the altitude of the aerosol. Separate Scientific Data Set(SDS) parameters giving the best solution values of AOD andAAOD from among the five are also provided. In this paper,we use only these best solution SDS values for the highestquality (SDS “AlgorithmFlags”=0) retrievals. OMAERUVresults are reported not only at 388 nm, which is the pri-mary retrieval wavelength, but also at 354 and 500 nm to al-low comparison with measurements from other sensors andwith model calculations. However, Torres et al. (2007) em-phasize that results reported at 354 and 500 nm, and espe-cially those at 500 nm, should be considered less reliablebecause the transformation necessary to calculate those val-ues increases the dependence of the retrieval on the assumedaerosol model. The relatively large size of the OMI pixelmakes results susceptible to sub-pixel cloud contamination,and such cloud-contamination can lead to overestimation ofAOD and underestimation of the single scattering co-albedo(Torres et al., 1998, 2007). However, due to a cancellation ofthese two effects in the calculation of AAOD, this quantity isless sensitive to sub-pixel cloud contamination and, hence, isconsidered the more reliable OMI aerosol product (Torres etal., 2007).
The OMAERO algorithm (Torres et al., 2002) is a multi-wavelength optimal estimation technique for retrieving AODfrom OMI TOA reflectances judged to be cloud-free. Theapproach used in the algorithm is to try to derive as muchaerosol information as possible from the OMI spectra, thusgiving the algorithm the freedom to choose among aerosolmodels. In the current setup of the algorithm, data from14 wavelength bands between 342.5 and 483.5 nm are used(Curier et al., 2008). OMAERO uses forward calculations ofTOA reflectances for a wide variety of microphysical aerosolmodels representative of desert dust, biomass burning, vol-canic and weakly absorbing aerosol types. The various mod-els differ by size distribution, refractive index, and aerosollayer height. As a constraint on the retrieval, in the currentimplementation of the algorithm, major aerosol types are pre-selected on the basis of a climatology of aerosol geographicaldistribution generated by a chemical transport model as de-scribed by Curier et al. (2008). It is noted that more thanone major type can be selected for a specific location and
www.atmos-chem-phys.net/9/6743/2009/ Atmos. Chem. Phys., 9, 6743–6765, 2009

6746 J. M. Livingston et al.: Comparison of aerosol optical depths from the OMI and AATS
time of year to give the algorithm the freedom to choose,for example, between biomass burning and weakly absorb-ing aerosol models. Using non-linear least squares method-ology, the best-fitting aerosol model is found by minimizingthe sum (over wavelength) of the squares of error-weighteddifferences between wavelength-dependent measured TOAreflectances and wavelength- and AOD-dependent model re-flectances. In addition to the best-fitting aerosol model, thevalues of AOD, SSA, size distribution and aerosol height thatare associated with the best fit aerosol model are provided inthe archived OMAERO Level 2 data files. In addition, thefiles provide retrieval results for up to ten of all those aerosolmodels for which the root mean square of the residual re-flectance falls below a given threshold (3×10⁻³). These in-clude the aerosol models together with their associated val-ues of AOD and SSA, and the mean and standard deviation ofthe AODs and SSAs for all retrievals satisfying the thresholdcriterion. The surface reflectance is prescribed using a clima-tology based on MISR (Curier et al., 2008). Over the oceanthe full bi-directional surface reflectance (BRDF) is takeninto account, and it is modeled as a function of wind speedand chlorophyll concentration. Curier et al. concluded thatthe current land surface albedo climatology contains obviousshortcomings, and work is ongoing to replace this databasewith one derived from OMI (Kleipool et al., 2008).
2.2 MODIS
MODIS is a scanning spectroradiometer with 36 visible,near-infrared, and infrared spectral bands between 0.553and 14.235µm (King et al., 1992). There are two MODISinstruments currently in operation: one on Terra, whichwas launched in December 1999, and one on Aqua, whichwas launched in May 2002. In this paper, we includeAODs archived in the MODIS Aqua MYD04L2 Version 005aerosol data set, in which AOD spectra are provided for nom-inal (at nadir view) 10 by 10 km2 pixels at wavelengths 466,553, 644, 855, 1243, 1632 and 2119 nm over the ocean,and at wavelengths 470, 660, and 2120 nm over land. Foreach pixel for which a spectral AOD has been retrieved, thearchive data file also provides an estimate of the fraction ofthe pixel covered by clouds, as described below.
The MODIS over-ocean operational algorithm for the re-trieval of AOD has been described in detail by Remer etal. (2005), and the over-land algorithm has been describedby Remer et al. (2005) and Levy et al. (2007). The over-ocean algorithm aggregates reflectances from the six chan-nels between 553 and 2119 nm into nominal 10 by 10 km2
pixels each composed of 20 by 20 pixels at 500 m resolu-tion. The algorithm uses the difference in spatial variabilitybetween aerosols and clouds for the identification of clouds(Martins et al., 2002). Specifically, the standard deviation of553-nm reflectances of a square set of 3 by 3500-m pixelsis compared to a threshold value of 0.0025. If the standarddeviation is larger than the threshold value the center pixel is
declared “cloudy” and the set of 3×3 pixels is moved in sucha way that a pixel neighboring the previous center pixel be-comes the new center pixel. The result is a cloud mask at aneffective resolution of 500 m. The fraction of “cloudy” 500by 500 m2 pixels within the 10 by 10 km2 pixel is archived inthe level-2 data file for each large pixel for which an AOD isretrieved. This test separates aerosol from most cloud types,but may fail for large, thick clouds and for cirrus, which canbe spatially homogeneous. It may also erroneously identifyinhomogeneous aerosol fields as clouds. After the applica-tion of various cloud masks, a sediment mask is applied (Liet al., 2003), after which the brightest 25% and darkest 25%(at 855 nm) of the remaining pixels are discarded. The re-flectances in the remaining pixels are averaged and comparedto a look-up table consisting of four fine and five coarse modeaerosol types (Remer et al., 2005). All combinations of fineand coarse mode pairs that fit the measured reflectances towithin 3% (or the best three combinations if no solution fitsthe reflectances to within 3%) are then averaged to yield theaverage combination of fine and coarse mode aerosol.
2.3 AATS-14
The AATS-14 instrument has been described in detail in sev-eral previous publications (e.g. Russell et al., 2005, 2007;Livingston et al., 2007; and references therein), so we pro-vide only a brief synopsis here. The instrument measures theatmospheric transmission of the direct solar beam in 14 spec-tral channels with center wavelengths,λ, ranging from 354to 2139 nm and bandwidths of∼5 nm (exceptions are 2.0 nmfor the 354-nm channel and 17.3 nm for the 2139-nm chan-nel). Azimuth and elevation motors rotate a tracking headto lock on to the solar beam and maintain detectors normalto it. During MILAGRO/INTEX-B, the AATS was mountedon the J31 in the same configuration (Russell et al., 2007)as used during the 2004 INTEX-A/Intercontinental Transportand Chemical Transformation (ITCT) field deployment.
The AATS channel wavelengths have been chosen to per-mit separation of aerosol, water vapor, and ozone transmis-sion along the AATS-to-Sun slant path. Our methods fordata acquisition, reduction, calibration, and error analysishave been well documented in the literature (Russell et al.,1993a, b; Schmid and Wehrli, 1995; Schmid et al., 1996,1998, 2001, 2003b; Livingston et al., 2005, 2007) and arenot repeated here. AODs are calculated from detector volt-ages measured in 13 channels, with the channels centered at940 nm and neighboring wavelengths used for calculation ofCWV. Calculation of AOD(λ), where is the AATS channelcenter wavelength, and CWV requires knowledge of exoat-mospheric detector voltages, V0(λ). These were calculatedfrom analysis of sunrise measurements acquired at MaunaLoa Observatory (MLO), Hawaii, before (January 2006) andafter (May 2006) the MILAGRO deployment and, followingthe procedure described in Schmid et al. (2003a, b), by anal-ysis of high altitude clear air AOD spectra obtained during
Atmos. Chem. Phys., 9, 6743–6765, 2009 www.atmos-chem-phys.net/9/6743/2009/

J. M. Livingston et al.: Comparison of aerosol optical depths from the OMI and AATS 6747
the deployment. Specifically, the V0 values were derived us-ing the Langley plot technique (e.g. Russell et al., 1993a,b; Schmid and Wehrli, 1995) for all channels except 940 nm,for which a modified Langley technique (Reagan et al., 1995;Michalsky et al., 1995; Schmid et al., 1996, 2001) was em-ployed to account for water vapor absorption. Analysis of thehigh altitude AOD spectra involved calculating the best-fitsecond order polynomial of log(AOD(λ)) vs. log(λ) to insurepositive values of AOD(λ) and a “smooth” variation withwavelength. The residuals between the AOD(λ) calculatedfrom the best fit polynomial and the AOD(λ) calculated fromthe MLO V0 values were then used to calculate small correc-tion factors to be applied to the MLO V0 values. In fact, themean V0 values derived from the two MLO data sets agreedto better than 0.5% in 10 of the 13 AOD channels, with dif-ferences of 0.86% and 0.76% for the 380-nm and 1558-nmchannels, respectively, and a difference of 2.58% for the 778-nm channel. Because of the good agreement between the twoMLO data sets for most channels, it was decided to applythe results of the high altitude AOD spectral fits to the Jan-uary 2006 MLO values of V0 and use these adjusted valuesin the analysis of the MILAGRO data. The statistical com-ponent of the uncertainty in V0 was set equal to 50% of themean difference between the January and May MLO results.
2.4 SSFR
The Solar Spectral Flux Radiometer (SSFR) (Pilewskie etal., 2003) is a moderate resolution (8–12 nm) spectrometerthat spans the wavelength range 350–2100 nm. It consists ofupward and downward looking sensors that were mountedon the J31 during MILAGRO/INTEX-B and provided coin-cident measurements of upwelling and downwelling spec-tral irradiance. Coddington et al. (2008) have shown thatSSFR measurements can be combined with other airborneand ground-based atmospheric measurements to yield spec-tral surface albedo, and they have applied this methodologyto the MILAGRO data set. In this paper, we use SSFRretrievals of spectral surface albedo for J31 data acquiredover Mexico City on 19 March for comparison to OMAEROassumptions of terrain reflectivity. We also use the SSFRdata with the AATS data to derive the SSA and AAOD on19 March (Bergstrom et al., 2009).
2.5 AERONET
AERONET is a global network of ground-based automatictracking sun/sky radiometers (Holben et al., 1998). Datafrom these instruments are analyzed to yield spectral AOD,CWV, aerosol size distribution, and SSA (Holben et al.,1998, 2001; Eck et al., 2001; Dubovik et al., 2000, 2002),which are archived after application of cloud screeningand quality control procedures described by Smirnov etal. (2000). In this paper, we use data obtained at threeAERONET sites in the Mexico City area: the T0 supersite
-100 -99 -98 -97
Latit
ude
(deg
)
-94-95-96 -93
Longitude (deg)
18
20
21
19
22
23
Fig. 1. Map view of the four J31 flight tracks coincident with OMIoverpasses during MILAGRO.
(19.49◦ N, 99.15◦ W) located at IMP (Instituto Mexicano delPetroleo) about 9 km west-northwest of the Mexico City In-ternational Airport, and the T1 (19.70◦ N, 98.98◦ W) and T2(20.01◦ N, 98.91◦ W) non-urban sites located approximately30 and 63 km, respectively, northeast of T0.
3 Results
3.1 Overview of MILAGRO data cases
The J31 made 13 science flights originating from its basein Veracruz, Mexico during the MILAGRO/INTEX-B study.Nine of these were primarily just offshore over the Gulf ofMexico, and four were inland over the Mexico City mega-lopolis. Four of the 13 flights included Aura overpasses forwhich OMI and AATS AOD spectra have been retrieved atcoincident or near-coincident times and locations. As shownin Fig. 1, three of these (3, 10, and 17 March) were overthe Gulf of Mexico, and one (19 March) was over the Mex-ico City area. AOD retrievals from near-coincident Aqua-MODIS measurements are available for the 10 and 17 Marchcases, but not for the 3 March case because the MODIS pix-els along the J31 flight track were in sun glint.
3.2 10 March 2006
The 10 March J31 science flight included a low altitude hor-izontal transect over the Gulf of Mexico timed to coincidewith the Aqua overpass at 19:58 UT. The Aura overpass oc-curred at 20:13 UT. Figure 2a displays the Aqua-MODIS truecolor image acquired during the satellite overpass and the J31flight track color-coded by aircraft GPS altitude. The J31flew from SW to NE at 60 m above sea level (a.s.l.) duringthe period 19:40–20:01 UT, and this portion of the track is
www.atmos-chem-phys.net/9/6743/2009/ Atmos. Chem. Phys., 9, 6743–6765, 2009

6748 J. M. Livingston et al.: Comparison of aerosol optical depths from the OMI and AATS
colored cyan. Figure 2b superimposes this segment of theJ31 flight track on the OMAERUV, OMAERO and MODISretrieval pixels that intersect the track. As indicated by thetime callouts along the track, the J31 was at the northeast por-tion of this transect at the time of Aqua overpass. The pixelgeo-registration values for the OMAERUV and OMAEROretrievals differ slightly because the OMAERUV retrievaluses the visible (VIS) channel and the OMAERO retrievaluses the UV-2 channel of the OMI sensor to calculate thesevalues. Hence, corresponding OMI pixels are outlined withthe same color but different line styles (OMAERUV-solid,OMAERO-dashed) in this paper. This difference in geo-registration has no significant effect on the results presentedin this paper, but it does mildly complicate the analyses tothe extent that sometimes slightly different segments of theJ31 flight track (and, hence, the AATS measurements) inter-sect the corresponding OMAERUV and OMAERO retrievalpixels.
There was no OMAERO retrieval corresponding to theOMAERUV retrieval within the dark green pixel centeredat 19.89◦ N, 95.51◦ W in Fig. 2b due to extensive clouds, andthis brings into question the validity of the OMAERUV re-trieval within that pixel. The best measure of clouds avail-able to these analyses is the MODIS cloud fraction, whichis a product of the MODIS aerosol retrieval algorithm. Itequals the fraction of “cloudy” 500×500 m2 pixels withinthe nominal MODIS 10×10 km2 pixel, where the “cloudy”designation is derived from the MODIS cloud-screening al-gorithm that takes into account spatial variability (Martinset al., 2002). This parameter is only available for thoseMODIS pixels for which an AOD retrieval is performed.In Fig. 2b, all MODIS pixels with a non-zero cloud frac-tion have been shaded grey, and the percent cloud is listedat the center of each of those pixels. Those pixels with noMODIS AOD retrieval because of extensive cloudiness areshown with grey hatching. Consistent with the MODIS truecolor image shown in Fig. 2a, the southern portion of themeasurement region was cloud-free, whereas clouds domi-nated the northwest region. Figure 2c plots AATS-14 AODsmeasured along the J31 low altitude transect. AATS mea-sured a small but distinct AOD gradient (∼0.05 in the mid-visible) increasing from S to N in the cloud-free region southof 19.8◦ N from 19.68 to 19.82 UT, and then a decreasinggradient along the W to E portion of the track from 19:95 to20:02 UT.
Before comparing AATS and OMI AOD retrievals alongthe J31 low altitude flight segment, we assess the degree ofagreement between the AATS and MODIS retrievals. Asshown in Fig. 2b, the J31 transect intersected 13 MODISpixels. Figure 3 compares the MODIS AOD retrieval andthe mean AATS AOD spectrum calculated within each ofthese pixels. Error bars depicting the standard MODIS over-water AOD uncertainty estimate (Remer et al., 2005) of±(0.03+0.05×AOD) are included, but no AATS measure-ment uncertainties or standard deviations within each pixel
(b)
(c)
Alt (km)
J31 low altitude transect
(a)
Fig. 2. Case study for 10 March:(a) Aqua-MODIS true color im-age with superimposed J31 flight track color-coded by altitude;(b)plan view of the J31 low altitude flight track and intersecting OMI(OMAERUV solid, OMAERO dotted) and MODIS (dashed) pixels,with all nonzero MODIS cloud percentages and with times (UT)along the flight track;(c) AOD (color-coded by wavelength givenin the legend in nm) measured by AATS along the low altitude J31flight track.
Atmos. Chem. Phys., 9, 6743–6765, 2009 www.atmos-chem-phys.net/9/6743/2009/

J. M. Livingston et al.: Comparison of aerosol optical depths from the OMI and AATS 6749
Fig. 3. Comparison of AATS (open black squares) and MODIS (filled colored circles with error bars) AOD spectra within MODIS pixelsalong the J31 low altitude flight track on 10 March. The color scheme used to plot the MODIS spectra is the same as that used in Fig. 2b toplot the locations of the MODIS pixels. No error bars are shown on the AATS data points because the measurement uncertainties and/or thestandard deviations within a particular MODIS pixel are smaller than the square symbols.
are shown because these are smaller than the symbols usedto plot the AATS AODs. The agreement between AATS andMODIS AODs is well within MODIS uncertainty bars forall pixels except that centered at 19.98◦ N, 95.32◦ W (olivecolor), for which the MODIS spectrum exceeds the AATSspectrum at all wavelengths. Since this is the intersect-ing MODIS pixel with the largest cloud fraction (79%), itraises the question whether this MODIS retrieval is, in fact,cloud-contaminated. Figure 4 is a scatterplot of MODISvs. AATS AOD, where the AATS values have been inter-polated to MODIS wavelengths and the AODs in the pixelwith the largest cloud fraction have been highlighted withlarger concentric circles. Except for values from this pixel,
all AODs fall within the MODIS AOD uncertainty esti-mates given above. MODIS-minus-AATS AOD bias andrms differences that exclude values from this pixel are listedon the plot. MODIS AODs at 466, 553, 644 and 855 nmshow a slight positive bias (0.015 to 0.027), and the 1632and 2119 nm values show a slight negative bias (−0.010 to−0.016).
Figure 5a compares AOD spectra retrieved from AATS,OMI, and MODIS using the same pixel color scheme shownin Fig. 2b. The mean AATS AOD spectrum along the low-level transect is plotted together with three sets of verticalbars representing the uncertainty (narrowest ticks), standarddeviation (medium width ticks), and range (widest ticks)
www.atmos-chem-phys.net/9/6743/2009/ Atmos. Chem. Phys., 9, 6743–6765, 2009

6750 J. M. Livingston et al.: Comparison of aerosol optical depths from the OMI and AATS
Fig. 4. Scatterplot of MODIS vs. AATS AOD within the pixelsalong the J31 low altitude flight track on 10 March. AATS val-ues have been interpolated to the MODIS wavelengths, and AODswithin the olive-colored MODIS pixel in Fig. 2b (color code shownin nm in legend) have been emphasized with large concentric cir-cles. The black dashed line gives the one-to-one correspondence,and the two blue lines delineate the expected MODIS AOD uncer-tainty of±(0.03+0.05×AOD). RMS and bias values omit the olive-colored pixel.
of AODs along the transect. We have already shown thatAATS and MODIS spectral AODs agree within MODIS un-certainty bars except for the olive MODIS pixel. Two setsof OMAERO retrieval results are shown: the archived Col-lection 3 best-fit spectra, and results from a special runin which only weakly absorbing aerosol models (refractiveindex 1.4-5.0e-08i) were included in the set of allowablemodels. Figure 5a shows clearly that the OMAERUV re-trievals are significantly less than the AATS AODs and thatthe archived OMAERO retrievals significantly exceed AATSvalues. The magnitudes of the constrained OMAERO re-trievals agree much better with AATS AODs, but the spec-tral shapes are much flatter, as discussed further below. Theonly OMAERUV retrieval close to the mean AATS spec-trum is that for the dark green OMAERUV pixel, for whichthere is no corresponding OMAERO retrieval. Based on thelarge MODIS cloud fractions for MODIS pixels intersect-ing this OMI pixel, we believe this OMAERUV retrieval iscloud-contaminated. All OMAERUV retrievals correspondto a non-absorbing sulfate aerosol model with a refractive in-dex of 1.40-0i, and all archived OMAERO best-fit retrievalscorrespond to one of two carbonaceous (biomass-burning)aerosol models, each with a refractive index of 1.50-0.03i.
Table 1 lists various parameters associated with OMI andAATS retrievals for each intersecting pixel for each of the
(biomass burning)
non-absorbing sulfate
OMAERO
OMAERUV
OMAEROAATS
weakly absorb.
(a)
MODIS
(b)
Fig. 5. For 10 March:(a) AOD spectra retrieved by OMAERO (xsymbols with dashed lines), OMAERUV (circles with solid lines),MODIS (triangles with solid lines), and AATS (squares with shortdashed line). The color scheme is the same as that used in Figs. 2band 3. The AOD at the primary OMAERUV retrieval wavelengthof 388 nm is emphasized with concentric circles. For OMAERUVand MODIS, vertical bars give representative uncertainties. ForAATS, vertical bars give the AOD measurement uncertainty (nar-row ticks), standard deviation (medium width ticks) and range (wideticks) along the track. Two sets of OMAERO results are plotted:the archived retrievals that yield biomass-burning aerosol models,and a special run constrained to retrieve only weakly absorbingaerosol models.(b) Variation of AOD at 466 nm as a function ofOMAERUV pixel, where AATS and OMI values have been in-terpolated to 466 nm. Vertical bars on the MODIS data give therange of MODIS retrievals for all MODIS pixels intersecting theOMAERUV pixel.
four AATS/OMI coincident events. Among these parametersis theAngstrom exponent,α, which we calculate using leastsquares fits. For comparison to OMI values, the AATSα foreach pixel was derived from the mean AATS AOD spectrumfor all cloud-free measurements within that pixel using onlydata from the five AATS channels centered at wavelengths
Atmos. Chem. Phys., 9, 6743–6765, 2009 www.atmos-chem-phys.net/9/6743/2009/

J. M. Livingston et al.: Comparison of aerosol optical depths from the OMI and AATS 6751
Table 1. Dates, colors, locations, and selected aerosol retrieval parameters for OMI pixels.
OMI Pixel Latitude Longitude Angstrom Exp,α AOD1 Aerosol SSA Z3layerRetrieval Date Color [deg] [deg] OMI AATS OMI AATS Model2 (388 nm) [km]
OMAERUV 3 Mar cyan 21.381 −97.163 1.824 1.067 0.325 0.370 3 1.000 0.0light blue 21.502 −97.189 1.824 1.054 0.313 0.368 3 1.000 0.0dark blue 21.623 −97.215 1.824 0.965 0.316 0.394 3 1.000 0.0light green 21.744 −97.241 1.824 1.087 0.293 0.344 3 1.000 0.0dark green 21.864 −97.268 1.824 1.166 0.276 0.286 3 1.000 0.0
OMAERO 3 Mar cyan 21.382 −97.194 0.742 1.070 0.929 0.370 2313 0.851 0–2light blue 21.503 −97.221 0.743 1.052 0.884 0.368 2313 0.851 0–2dark blue 21.624 −97.247 1.351 0.965 0.701 0.394 2312 0.857 0–2light green 21.744 −97.273 1.602 1.088 0.502 0.343 2311 0.852 0–2dark green 21.865 −97.300 1.393 1.167 0.393 0.285 2212 0.898 0–2
OMAERUV 10 Mar cyan 19.408 −95.411 1.824 1.473 0.113 0.317 3 1.000 0.0light blue 19.528 −95.434 1.824 1.467 0.129 0.323 3 1.000 0.0dark blue 19.649 −95.458 1.824 1.444 0.143 0.340 3 1.000 0.0light green 19.770 −95.482 1.824 1.411 0.179 0.360 3 1.000 0.0dark green 19.891 −95.506 1.824 1.413 0.292 0.350 3 1.000 0.0olive 19.905 −95.090 1.824 1.402 0.158 0.358 3 1.000 0.0maroon 20.026 −95.113 1.824 1.421 0.191 0.351 3 1.000 0.0violet 20.146 −95.137 1.824 1.425 0.192 0.331 3 1.000 0.0
OMAERO 10 Mar cyan 19.402 −95.467 1.600 1.474 0.522 0.317 2311 0.852 0–2light blue 19.522 −95.491 1.601 1.467 0.543 0.323 2311 0.852 0–2dark blue 19.643 −95.515 1.602 1.446 0.574 0.339 2311 0.852 0–2light green 19.764 −95.539 1.600 1.411 0.652 0.360 2311 0.852 0–2olive 19.900 −95.152 1.349 1.409 0.681 0.349 2312 0.857 0–2maroon 20.021 −95.175 1.350 1.421 0.805 0.353 2312 0.857 0–2violet 20.141 −95.199 1.349 1.425 0.833 0.333 2312 0.857 0–2
OMAERO4 10 Mar cyan 19.402 −95.467 0.264 1.474 0.231 0.317 1114 1.000 0–2light blue 19.522 −95.491 0.259 1.467 0.239 0.323 1114 1.000 0–2dark blue 19.643 −95.515 0.257 1.446 0.251 0.339 1114 1.000 0–2light green 19.764 −95.539 0.257 1.411 0.281 0.360 1114 1.000 0–2olive 19.900 −95.152 0.258 1.409 0.271 0.349 1114 1.000 0–2maroon 20.021 −95.175 0.259 1.421 0.312 0.353 1114 1.000 0–2violet 20.141 −95.199 0.265 1.425 0.321 0.333 1114 1.000 0–2
OMAERUV 17 Mar cyan 20.467 −96.290 1.824 1.257 0.226 0.290 3 1.000 0.0light blue 20.588 −96.313 1.824 1.241 0.217 0.274 3 1.000 0.0
OMAERO 17 Mar cyan 20.464 −96.359 0.266 1.257 0.279 0.291 1114 1.000 0–2light blue 20.585 −96.382 0.261 1.251 0.271 0.270 1114 1.000 0–2dark blue 20.598 −95.897 0.764 1.234 0.742 0.277 2213 0.893 0–2
OMAERUV 19 Mar, T2 cyan 19.834 −99.009 0.606 0.117 0.692 0.280 2 0.896 4.1light blue 19.954 −99.036 0.606 0.147 0.698 0.213 2 0.900 4.1dark blue 19.985 −98.813 0.606 0.211 0.545 0.200 2 0.890 4.0
OMAERO 19 Mar, T2 cyan 19.849 −99.028 1.602 0.117 2.977 0.288 2321 0.852 2–4dark blue 19.999 −98.834 0.763 0.232 2.144 0.198 2233 0.893 4–6
OMAERUV 19 Mar, T0 cyan 19.439 −99.147 0.606 – 0.578 – 2 0.888 4.1light blue 19.560 −99.175 0.606 0.644 0.572 0.284 2 0.893 4.1dark blue 19.681 −99.203 0.606 0.585 0.520 0.308 2 0.878 4.1
OMAERO 19 Mar, T0 cyan 19.456 −99.166 1.601 0.701 2.846 0.258 2331 0.852 4–6light blue 19.576 −99.193 0.764 0.631 1.679 0.290 2233 0.893 4–6
1 OMI wavelength: 388 nm, AATS wavelength: 380 nm.2 OMAERUV: 2=dust aerosol, 3=sulfate aerosol. OMAERO: 1114=weakly absorbing aerosol,>2000=biomass-burning aerosol.3 Altitude of aerosol layer assumed in the retrieval.4 OMAERO retrieval restricted to weakly absorbing aerosol models.
www.atmos-chem-phys.net/9/6743/2009/ Atmos. Chem. Phys., 9, 6743–6765, 2009

6752 J. M. Livingston et al.: Comparison of aerosol optical depths from the OMI and AATS
between 353 nm and 519 nm. For the 10 March com-parison, OMAERUV spectra are steeper (αOMAERUV=1.82)and archived best-fit OMAERO spectra are slightly steeper(αOMAERO=1.60) or slightly flatter (αOMAERO=1.35) than thecorresponding AATS spectra (αAATS=1.41–1.47). The smallvariation in the OMAEROα values is attributed to the dis-cretization of the aerosol models. With SSA of∼0.85 at388 nm, the OMAERO aerosol models yield AAOD (notshown) at 388 nm of only 0.08–0.12. The OMAERO spec-tra constrained to retrieve a weakly absorbing aerosol yield amuch flatter wavelength dependence (αOMAERO=0.26).
In Fig. 5b, we examine the variation of AOD as a func-tion of OMI pixel along a path from SSW to NNE. Forease in interpretation, the ticks along the abscissa are la-beled with the locations of the OMAERUV pixel centers.The data points for the OMI retrievals are color-coded us-ing the same scheme used in Figs. 2b and 5a; the color of theconnecting lines is arbitrary and chosen solely to facilitategraph interpretation. All AODs in Fig. 5b are for the shortestMODIS retrieval wavelength, 466 nm, with the AATS andOMI values interpolated to that wavelength. The verticalbars on the MODIS AODs in Fig. 5b delineate the rangeof all MODIS retrievals in those MODIS pixels intersect-ing the larger OMAERUV pixel, and the line connects themean values. Hence, for a particular OMAERUV pixel, theMODIS mean value may include retrievals from one or moreMODIS pixels for which part or even most of the pixel fallsoutside the OMAERUV pixel. It should be noted that theAATS data points are the mean cloud-free values along theJ31 track within the OMAERUV pixel and, hence, representmeasurements acquired over a much smaller sampling regionthan that of the OMI retrieval or the MODIS mean valuecalculated over several MODIS pixels. All retrievals ob-serve the AOD gradient increasing from S to N within the re-gion spanned by the four southernmost OMI pixels. MODISand OMAERUV retrievals exhibit a similar behavior for allOMAERUV pixels, especially if the OMAERUV retrievalwithin the dark green pixel centered at 19.89◦ N, 95.51◦ W isignored due to the high likelihood of cloud contamination, asnoted above. The MODIS/OMAERUV data for the remain-ing seven pixels yield a coefficient of determination,r2, of0.91. The archived OMAERO best-fit retrieval yields AODsthat exhibit a significantly larger relative increase than dothose retrieved by the MODIS and OMAERUV algorithms inthe three northeastern-most OMI pixels. The aerosol modelcorresponding to the best-fit archived OMAERO retrievalswithin these pixels differs slightly from the model corre-sponding to the best-fit result in the other four OMI pixels.Specifically, the latter aerosol size distribution has slightlylarger modal radii for the fine and coarse modes and containsslightly more particles in the coarse mode than the former(cf. Table 2; Torres et al., 2007). Results are also shownfor the OMAERO retrievals constrained to retrieve a weaklyabsorbing aerosol, and these exhibit much better agreementwith the AATS and MODIS AODs. The correlation between
the constrained OMAERO (or the archived OMAERO) andAATS AODs is poor (r2=0.26 or 0.21, respectively) if allseven OMAERO retrieval pixels are included, but this iscaused by the AATS and OMAERO AOD differences in thetwo northeastern-most OMAERO pixels. These differencesmight be due to spatio-temporal sampling differences be-tween AATS and OMI, as discussed above, or to possiblecloud contamination in the satellite data. The correlation im-proves dramatically (r2=0.97) if these two pixels are omitted,and the result is similar (r2=0.98) if only the four cloud-free pixels (southwestern-most) are considered. Althoughthe constrained OMAERO AODs are more than double thecorresponding OMAERUV values, the pixel-to-pixel AODbehavior is well-correlated (r2=0.95) with the OMAERUVresults, which might be expected since the two algorithmsoperate on the same radiances.
Next, we examine for each pixel the range of OMAEROsolutions that passed the retrieval reflectance threshold test(Sect. 2.1). Figure 6 overplots these spectra for each pixel.The legend lists the RMS reflectance residual value and thecorresponding identifier code for the aerosol model for eachretrieval. For each pixel, the best-fit (lowest RMS residual)solution is plotted as a solid cyan circle with connecting line;these are the archived spectra shown in Fig. 5. The meanof all solutions satisfying the RMS threshold test is plottedas an open brown circle with a connecting dotted line. Forreference, the mean AATS AOD spectrum calculated overthe entire low altitude J31 flight track is shown together withvertical bars delineating the range of AODs along the track.For each of the pixels shown, the slope of the best-fit retrievaldiffers little from that of the corresponding AATS spectrum.In all except the two northernmost pixels, for which onlytwo or three solutions satisfy the RMS threshold criterion,there is one solution that corresponds to the weakly absorb-ing aerosol model 1114 chosen by the constrained OMAEROretrievals included in Fig. 5. As shown in Fig. 6, the retrievalschoosing a biomass burning aerosol model overestimate theAATS AOD, whereas those selecting the weakly absorbingaerosol model show better agreement in AOD. We note thatthe RMS values for the different aerosol models are nearlyequal, which indicates that the information in the OMI spec-tra in this case is not enough to select the correct aerosol maintype. Therefore, instead of relying on the best-fit results, it ispreferable to examine the mean and standard deviation overthe set of models that passed the RMS threshold test. Thesemean AODs agree better with the AATS values than the best-fit values. The tendency of OMAERO to choose biomassburning aerosol models for this case (and the other two over-water cases presented below) may be related to shortcomingsin the ocean surface reflectance model, and this is still underinvestigation.
Atmos. Chem. Phys., 9, 6743–6765, 2009 www.atmos-chem-phys.net/9/6743/2009/

J. M. Livingston et al.: Comparison of aerosol optical depths from the OMI and AATS 6753
Fig. 6. For 10 March, OMAERO AOD spectra that passed the RMS residual reflectance threshold within each OMAERO pixel. Legends givethe RMS value of residual reflectance and the aerosol model code. The best-fit OMAERO solution (smallest RMS residual) is colored cyan,and the brown circles with connecting dotted line represent the mean of all the solutions. For comparison, the mean AATS AOD spectrumalong the low altitude flight track is shown with the black squares and dashed line; the vertical bars indicate the range. Latitude and longitudeof each OMAERO pixel centerpoint is listed at the bottom of each frame using the same color scheme as that used in Figs. 2b and 3.
3.3 3 March 2006
On 3 March, the J31 flew over the Gulf of Mexico duringthe period 16:36–20:00 UT. Figure 7a shows the J31 flighttrack superimposed on the Aqua-MODIS 19:50–19:55 UTtrue color image. AATS obtained measurements during twoover-water low altitude horizontal segments during the J31’ssouthbound transit back to Veracruz. The first was 18:50–19:01 UT, and the second was 19:24–19:29 UT. The Auraoverpass was 20:07 UT, but OMI AOD retrievals are avail-able only for the earlier J31 low altitude transect due to cloudcontamination in the OMI pixels collocated with the laterflight segment, as evidenced by the standard MODIS cloudmask product in Fig. 7b. Unfortunately, there are no MODISaerosol retrievals or cloud fraction data available along theJ31 track due to sun glint, as noted in Sect. 3.1.
The 18:50–19:01 UT low altitude (60 m a.s.l.) aircraft seg-ment intersected five OMI pixels, as shown in Fig. 7c. Gapsin the flight track indicate AATS measurements that havebeen flagged as cloud-contaminated and removed. Thesesame gaps are reflected by missing data in the time traceof AATS AODs shown in Fig. 7d. Most of the cloud oc-currences were along the J31 track in the three southern-most OMI pixels, as there were none in the northernmost(dark green) OMI pixel and the northern two-thirds of theadjacent (light green) pixel. It can be seen in Fig. 7d thatAATS observed an increasing gradient in AOD from N toS along the northern half of the low altitude flight segment.The magnitude of this gradient was∼0.10 in the mid-visibleand decreased with wavelength. The OMI AOD retrievalswithin the three northernmost pixels (dark green, light green,
www.atmos-chem-phys.net/9/6743/2009/ Atmos. Chem. Phys., 9, 6743–6765, 2009

6754 J. M. Livingston et al.: Comparison of aerosol optical depths from the OMI and AATS
(c)
(a)
transect low altitude
(d)
(b)
(e)
Fig. 7. Case study for 3 March:(a) Aqua MODIS true color image with color-coded J31 flight track;(b) MODIS standard cloud maskproduct;(c) plan view of the J31 low-altitude flight track and intersecting OMI (OMAERUV solid, OMAERO dotted) pixels, with J31 flighttrack times;(d) AOD measured by AATS along the low altitude J31 flight track with same color code as in Fig. 2c;(e)AOD spectra retrievedby OMAERO (x symbols with dashed lines), OMAERUV (circles with solid lines), and AATS (squares with short dashed line). The colorscheme is the same as in (c). Vertical bars on AATS AODS are described in Fig. 5 caption.
and dark blue) also indicate a gradient, although the gradientmagnitudes retrieved by the OMAERO and OMAERUV al-gorithms differ from that observed by AATS. This is evidentin Fig. 7e, which compares the OMI AOD retrievals with themean AATS AOD spectrum along the low altitude flight seg-ment. In general, the OMAERO AODs significantly exceedthe AATS AODs, and the OMAERUV values are slightlyless than the AATS values. All OMAERUV retrievals corre-spond to a non-absorbing sulfate aerosol model, whereas theOMAERO best-fit solutions correspond to a carbonaceousaerosol model, as was the case for the 10 March compari-son. No data were available with OMAERO constrained toweakly absorbing aerosol models only. The measured AODgradient is masked by the mean AATS AOD spectrum plot-ted in Fig. 7e, although this gradient is consistent with theaccompanying vertical bars with wide ticks that delineate therange of AATS AODs.
In Fig. 8 we compare OMI and mean AATS spectrawithin each OMI pixel. OMAERUV AODs at 354 nm
agree well with the corresponding AATS values, and theOMAERUV AODs at the primary retrieval wavelengthof 388 nm are only slightly less than the correspond-ing AATS values, which fall within the upper error barof the OMAERUV AODs for all 5 pixels. However,OMAERO AODs significantly exceed corresponding AATSvalues in each pixel, and even the OMAERO spectrum withthe smallest AODs and smallest AATS-OMI AOD differ-ences (the northernmost dark green pixel for which AATSobserved no cloud blockages) overestimates the correspond-ing mean AATS spectrum within that pixel by 0.1–0.2. AllOMAERUV spectra (αOMAERUV=1.82) and the three north-ernmost OMAERO spectra (αOMAERO=1.35–1.60) exhibita steeper wavelength dependence than do the correspond-ing AATS spectra (αAATS=0.96–1.17). Examination of thearchived OMAERO pixel-by-pixel mean AODs (not shown)for all retrievals passing the RMS difference threshold indi-cates that use of the means would yield little improvementin the comparison between OMAERO and AATS AODs.
Atmos. Chem. Phys., 9, 6743–6765, 2009 www.atmos-chem-phys.net/9/6743/2009/

J. M. Livingston et al.: Comparison of aerosol optical depths from the OMI and AATS 6755
Fig. 8. Comparison of AOD spectra from AATS (black circles with vertical lines showing the range), OMAERO (colored circles), andOMAERUV (triangles with vertical bars giving the expected AOD uncertainty) for the 3 March case study.
However, this exercise may provide some insight into thelikelihood of cloud contamination, as the numbers of re-trievals passing the threshold were 16, 11, 1, 1, and 0 fromnorth to south, respectively, which seems consistent with thespatially limited AATS measurements that indicate most ofthe clouds were in the three southern pixels.
3.4 17 March 2006
The third over-water case study occurred on 17 March,and it is presented in Fig. 9. In Fig. 9a, the J31 flighttrack is overlaid on the MODIS true color image for theAqua overpass at 20:04 UT. The corresponding Aura over-pass was at 20:19 UT. AATS measurements were acquiredduring a low altitude (70 m a.s.l.) SW–NE flight leg dur-ing a six-minute time period, 19:25–19:31 UT, and tem-porally near-coincident MODIS and OMI AOD retrievalsare available along this short flight segment, as shown inFig. 9b. Results for the other low-altitude J31 transect(∼20.9◦ to 21.5◦ N, flown 20:57–21:10 UT) are not shownbecause clouds resulted in few AATS and no OMI AODretrievals. OMAERO retrievals are available for three in-tersecting pixels, OMAERUV retrievals for two pixels, andMODIS retrievals for four pixels. In fact, MODIS retrievalsare available for the entire area shown in Fig. 9b. TheMODIS cloud percentages shown in Fig. 9b indicate thatthe eastern portion of the sampled area was quite cloud-contaminated, which suggests that the OMAERO retrievalin the eastern (dark blue) pixel, at least, is likely cloud-contaminated. Even the MODIS pixels within the two west-ern OMI pixels show some cloud contamination, with thecyan MODIS pixel having a cloud fraction of 40%, whichsuggests that the OMI retrievals in the OMI pixel encompass-ing this MODIS pixel are also cloud-contaminated. In fact,OMI retrievals in all three pixels may be cloud-contaminated.
Along the low-altitude segment of the J31 flight track, 19%of the AATS data points were flagged as cloud-contaminated,and these have been omitted from the AATS AODs presentedin Fig. 9c and d.
AATS AOD was not constant along the track, but thevariation was only 0.02–0.03 in the near UV and visible,and even less in the near IR. Most of the AATS measure-ments fall within the southernmost OMI pixel (cyan) andthe remainder lie within the adjacent pixel to the north ifonly the OMAERUV geolocation data are considered. TheAOD spectra retrieved within these two pixels by a sin-gle OMI algorithm are essentially equal, but the best-fitOMAERO spectra (αOMAERO=0.26) are significantly flat-ter than and exceed the corresponding OMAERUV spectra(αOMAERUV=1.82); correspondingαAATS values are 1.24–1.26. Both algorithms retrieve a weakly absorbing aerosolin these two pixels. OMAERO AOD magnitudes agree bet-ter with the corresponding AATS and MODIS values than dothe OMAERUV values, although both appear to agree withAATS within the expected OMI AOD uncertainty (not givenfor OMAERO). The best-fit OMAERO AOD spectrum re-trieved in the eastern pixel (dark blue) is a biomass burningaerosol and significantly exceeds the other retrievals. We dis-count this retrieval as cloud-contaminated, but it may be nomore or less cloud-contaminated than the results for eitherof the other two pixels. Examination of all OMAERO re-trievals (not shown) passing the RMS difference threshold ineach pixel yields additional information consistent with theresults found in the other two over-water cases, and leadsus to conclude that, in terms of the full set of solutions sat-isfying the OMAERO RMS radiance threshold, there is es-sentially no difference among the OMAERO retrievals foreach of the three pixels for this case. OMAERO retrieved7–9 solutions that satisfied the RMS threshold in each of thethree pixels, despite the appearance of the best-fit OMAERO
www.atmos-chem-phys.net/9/6743/2009/ Atmos. Chem. Phys., 9, 6743–6765, 2009

6756 J. M. Livingston et al.: Comparison of aerosol optical depths from the OMI and AATS
(d) (c)
(a)
low altitude transect
Altitude (km)
(b)
Fig. 9. Case study for 17 March:(a) Aqua-MODIS true color image with color-coded J31 flight track;(b) plan view of the J31 low-altitude flight track and intersecting OMI (OMAERUV solid, OMAERO dotted) and MODIS (dashed) pixels, with all nonzero MODIScloud percentages;(c) AOD measured by AATS along the low altitude J31 flight track;(d) AOD spectra retrieved by OMAERO (x symbolswith dashed lines), OMAERUV (circles with solid lines), and AATS (squares with short dashed line). The color scheme is the same as in (b).
solutions shown in Fig. 7d; one solution in each correspondsto the weakly absorbing aerosol model 1114, and the remain-ing solutions correspond to biomass burning aerosol mod-els. In the cyan and light blue pixels, this weakly absorbingmodel exhibits (barely) the lowest RMS value; in the darkblue pixel, it has the second lowest RMS value. Because themean AOD spectra of those solutions satisfying the thresholdcriterion includes primarily biomass burning aerosol models,each of these mean spectra significantly exceeds the weaklyabsorbing AOD spectrum and the AATS results and there islittle difference among the mean spectra for each of the threepixels.
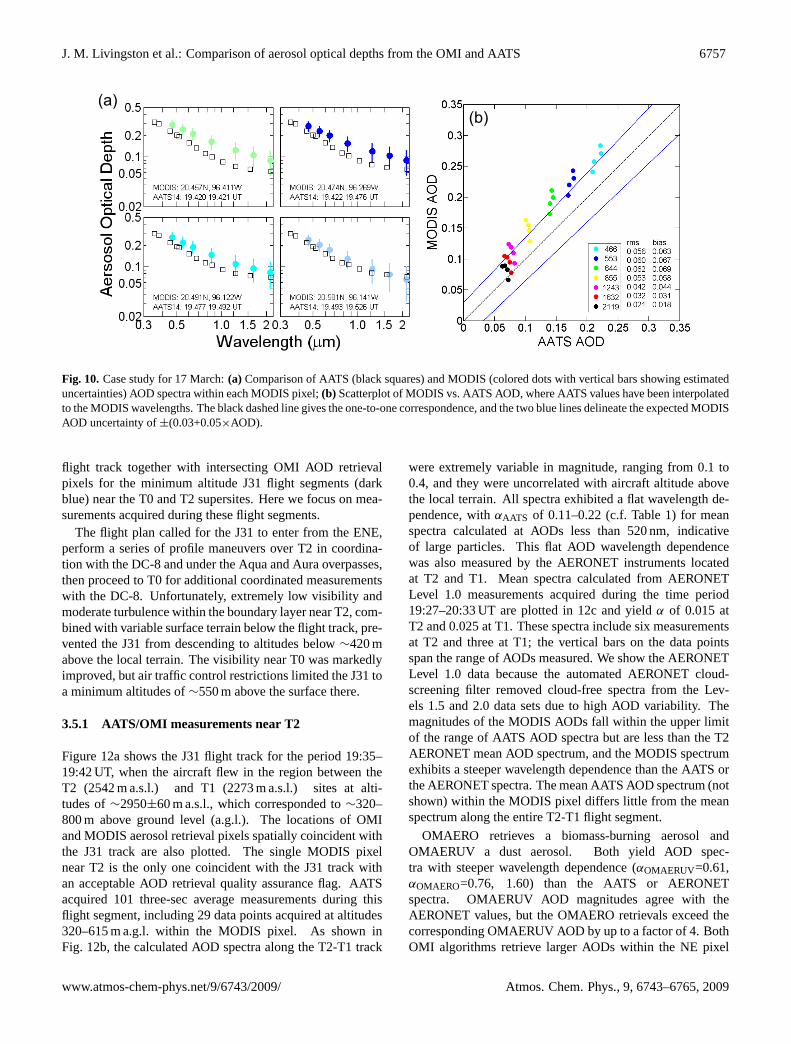
Figure 10 compares AATS and MODIS AOD spectra forthis case. For the four MODIS channels centered at wave-lengths below 860 nm, MODIS AODs exceed the corre-sponding AATS values by∼0.02 more than the expectedMODIS one-sigma uncertainty in the three southern MODIS
pixels. RMS and bias differences decrease with wavelength,as shown in Fig. 10.
3.5 19 March 2006
A flight to Mexico City on 19 March presented the only op-portunity for comparison of AATS and OMI AODs over land.Figure 11a shows a photo taken at∼19:25 UT from the DC-8 at an altitude of 7000 m looking over Mexico City towardthe mountain peaks of Ixtaccihuatl and Popocateptl to theeast. The predominant atmospheric feature is the pervasiveboundary layer haze over Mexico City. In addition, a smallbiomass burning plume in the foreground west (right) of thecity and large plumes in the mountains to the east can beseen. There are no clouds over the city; the only clouds areover the mountains and beyond. The Aura overpass occurredat 20:07 UT. Figure 11b shows the altitude color-coded J31
Atmos. Chem. Phys., 9, 6743–6765, 2009 www.atmos-chem-phys.net/9/6743/2009/
J. M. Livingston et al.: Comparison of aerosol optical depths from the OMI and AATS 6757
(a) (b)
Fig. 10. Case study for 17 March:(a) Comparison of AATS (black squares) and MODIS (colored dots with vertical bars showing estimateduncertainties) AOD spectra within each MODIS pixel;(b) Scatterplot of MODIS vs. AATS AOD, where AATS values have been interpolatedto the MODIS wavelengths. The black dashed line gives the one-to-one correspondence, and the two blue lines delineate the expected MODISAOD uncertainty of±(0.03+0.05×AOD).
flight track together with intersecting OMI AOD retrievalpixels for the minimum altitude J31 flight segments (darkblue) near the T0 and T2 supersites. Here we focus on mea-surements acquired during these flight segments.
The flight plan called for the J31 to enter from the ENE,perform a series of profile maneuvers over T2 in coordina-tion with the DC-8 and under the Aqua and Aura overpasses,then proceed to T0 for additional coordinated measurementswith the DC-8. Unfortunately, extremely low visibility andmoderate turbulence within the boundary layer near T2, com-bined with variable surface terrain below the flight track, pre-vented the J31 from descending to altitudes below∼420 mabove the local terrain. The visibility near T0 was markedlyimproved, but air traffic control restrictions limited the J31 toa minimum altitudes of∼550 m above the surface there.
3.5.1 AATS/OMI measurements near T2
Figure 12a shows the J31 flight track for the period 19:35–19:42 UT, when the aircraft flew in the region between theT2 (2542 m a.s.l.) and T1 (2273 m a.s.l.) sites at alti-tudes of∼2950±60 m a.s.l., which corresponded to∼320–800 m above ground level (a.g.l.). The locations of OMIand MODIS aerosol retrieval pixels spatially coincident withthe J31 track are also plotted. The single MODIS pixelnear T2 is the only one coincident with the J31 track withan acceptable AOD retrieval quality assurance flag. AATSacquired 101 three-sec average measurements during thisflight segment, including 29 data points acquired at altitudes320–615 m a.g.l. within the MODIS pixel. As shown inFig. 12b, the calculated AOD spectra along the T2-T1 track
were extremely variable in magnitude, ranging from 0.1 to0.4, and they were uncorrelated with aircraft altitude abovethe local terrain. All spectra exhibited a flat wavelength de-pendence, withαAATS of 0.11–0.22 (c.f. Table 1) for meanspectra calculated at AODs less than 520 nm, indicativeof large particles. This flat AOD wavelength dependencewas also measured by the AERONET instruments locatedat T2 and T1. Mean spectra calculated from AERONETLevel 1.0 measurements acquired during the time period19:27–20:33 UT are plotted in 12c and yieldα of 0.015 atT2 and 0.025 at T1. These spectra include six measurementsat T2 and three at T1; the vertical bars on the data pointsspan the range of AODs measured. We show the AERONETLevel 1.0 data because the automated AERONET cloud-screening filter removed cloud-free spectra from the Lev-els 1.5 and 2.0 data sets due to high AOD variability. Themagnitudes of the MODIS AODs fall within the upper limitof the range of AATS AOD spectra but are less than the T2AERONET mean AOD spectrum, and the MODIS spectrumexhibits a steeper wavelength dependence than the AATS orthe AERONET spectra. The mean AATS AOD spectrum (notshown) within the MODIS pixel differs little from the meanspectrum along the entire T2-T1 flight segment.
OMAERO retrieves a biomass-burning aerosol andOMAERUV a dust aerosol. Both yield AOD spec-tra with steeper wavelength dependence (αOMAERUV=0.61,αOMAERO=0.76, 1.60) than the AATS or AERONETspectra. OMAERUV AOD magnitudes agree with theAERONET values, but the OMAERO retrievals exceed thecorresponding OMAERUV AOD by up to a factor of 4. BothOMI algorithms retrieve larger AODs within the NE pixel
www.atmos-chem-phys.net/9/6743/2009/ Atmos. Chem. Phys., 9, 6743–6765, 2009

6758 J. M. Livingston et al.: Comparison of aerosol optical depths from the OMI and AATS
(a)
(b)
Fig. 11. For the 19 March J31 science flight over the MexicoCity urban complex:(a) photo taken looking east from the DC-8 at an altitude of 7000 m at∼19:25 UT; (b) plan view of thealtitude color-coded J31 low-altitude flight track and intersectingOMI (OMAERUV solid, OMAERO dotted) pixels. Locations ofAERONET sites at T0, T1, and T2 are shown, in addition to theMexico City International Airport (MEX). The two lowest altitudeJ31 flight legs near T2 and T0 are dark blue; small black asterisksmark location of J31 corresponding to the listed times in UT.
than those retrieved in the SW pixel. The OMAERUV spec-tra in the two western pixels are almost equal and are indis-tinguishable in the plot. There was no OMAERO retrievalcorresponding to the OMAERUV NW pixel. AATS AODsare significantly less than the AERONET values, by a min-imum of 0.1 even if the maximum values within the rangeof AATS values given by the vertical bars are considered.However, this is not surprising, as the AATS AODs shown donot include the amount of AOD below the aircraft. The J31had no sensors to provide coincident in-situ measurements ofaerosol scattering and absorption, so we have not attemptedto estimate the amount of AOD below the aircraft.
(a)
(b)
(c)
(a)
(b)
(c)
Fig. 12. For the 19 March J31 science flight over the rural areanortheast of Mexico City :(a) plan view of the J31 lowest alti-tude flight track near T2 and intersecting OMI (OMAERUV solid,OMAERO dotted) and MODIS (magenta dashed) pixels, with J31flight track times in UT;(b) AOD measured by AATS along thisflight track (wavelength color code as in Fig. 2) with times cor-responding to MODIS pixel boundaries shown by magenta verti-cal lines;(c) AOD spectra retrieved by OMAERO (x symbols withdotted lines), OMAERUV (circles with solid lines), MODIS (ma-genta dashed line), AATS (squares with short dashed line), andAERONET (at T1 and T2). As noted in the text, the minimum J31altitude was∼320 m a.g.l.
Atmos. Chem. Phys., 9, 6743–6765, 2009 www.atmos-chem-phys.net/9/6743/2009/

J. M. Livingston et al.: Comparison of aerosol optical depths from the OMI and AATS 6759
3.5.2 AATS/OMI measurements near T0
Figure 13 presents analogous results for AATS mea-surements acquired near T0 during the period 20:24–20:28 UT. During this time, the J31 flew at altitudes of∼2790±20 m a.s.l., or about 600 m above T0 (2189 m a.s.l.).The J31 flight track and the OMI retrieval pixels are over-laid in 13a, AATS AODs along the track are plotted in 13b,and the AATS, OMI, and T0 AERONET (Level 1.0) AODspectra are plotted in 13c. Unlike the AOD spectra mea-sured near T2, those sampled by the sunphotometers near T0exhibit a distinct decrease with wavelength, withAngstromexponents of 0.58–0.70 (Table 1) for AATS AOD at wave-lengths less than 520 nm. Values of the mean spectrum cal-culated from three AERONET spectra measured at T0 duringthe period 20:00–20:33 UT fall within the upper half of therange of AODs measured by AATS. Again, the AATS spectrado not include any estimate of the AOD below the J31, butthe AERONET data suggest this contribution is small, andthis seems consistent with the flight notes that visibility wasmuch better at T0 than at T2, as noted in Sect. 3.5 above. TheOMAERUV AOD retrievals are approximately twice as largeas the AATS values, but with the same wavelength depen-dence (αOMAERUV=0.61 vs.αAATS=0.58 and 0.64). Withinthe pixel (light blue) that includes the locations of most ofthe AATS measurements, the OMAERO AODs are aboutsix times the AATS values, but with a similarAngstrom ex-ponent (αOMAERO=0.76 vs.αAATS=0.63). The OMAEROspectrum in the southern (cyan) pixel has much higherAOD with a steeper wavelength dependence (αOMAERO=1.60vs.αAATS=0.11).
3.5.3 Surface Albedo, SSA, and AAOD at T2 and T0
The plots in Fig. 14 provide additional analyses of theOMI aerosol retrievals near T2 and T0 by examining val-ues of the assumed surface albedo and the retrieved SSAand AAOD. In frames 14a and d, we compare values ofthe OMAERO archived Scientific Data Set parameter “ter-rain reflectivity” with spectral surface albedos derived fromSSFR measurements near T2 (12 spectra between 20:28:30and 20:28:48 UT) and T0 (21 spectra between 19:36:36 and19:37:05 UT), respectively. The OMAERO “terrain reflec-tivity” is defined in Kleipool et al. (2008) as a “Lambertianequivalent surface albedo”, and is comparable to the SSFR-derived surface albedo, which is the “actual” or “blue-sky”surface albedo, as explained in Coddington et al. (2008).At T2, the SSFR surface albedo exceeds the OMAERO as-sumptions by<0.01 at 350 nm,∼0.01–0.02 at 388 nm, and∼0.025–0.03 at 483 nm. The comparison near T0 is similar,except the values of the OMAERO terrain reflectivity withinthe southern (cyan) pixel, for which the retrieved OMAEROAODs were significantly higher than those in the middle(light blue) pixel, were 0.01–0.02 less than the correspondingvalues within the light blue pixel.
(a)
Fig. 13. For the 19 March J31 science flight over the Mexico Cityurban complex:(a) plan view of the J31 lowest altitude flight tracknear T0 and intersecting OMI (OMAERUV solid, OMAERO dot-ted) pixels, with J31 flight track times in UT;(b) AOD measured byAATS along this flight track (wavelength color code as in Fig. 2);(c) AOD spectra retrieved by OMAERO (x symbols with dashedlines), OMAERUV (circles with solid lines), AATS (squares withshort dashed line), and AERONET (at T0). The minimum J31 flightaltitude was∼590 m a.g.l.
www.atmos-chem-phys.net/9/6743/2009/ Atmos. Chem. Phys., 9, 6743–6765, 2009

6760 J. M. Livingston et al.: Comparison of aerosol optical depths from the OMI and AATS
(a)SSFR
OMAERO
(d)SSFR
OMAERO
T2 T0
(e)OMAERUV
OMAERO
(c)
OMAERO
OMAERUV
(f)
OMAERO
OMAERUV
Wavelength (μm)
(b)
OMAERUVOMAERO
Fig. 14. For AATS and OMI measurements near the T2 (a–c) and T0 (d–f) supersites on 19 March:(a), (d) Terrain reflectivity assumed bythe OMAERO retrieval algorithm and surface albedo derived from coincident J31 SSFR measurements;(b), (e) Single scattering albedosfrom the OMI retrievals, from Bergstrom et al. (2009) for T2 and T0, and from Bergstrom et al. (2007) results for ACE Asia dust/urban,SAFARI biomass-burning, and PRIDE Saharan dust aerosol;(c), (f) AAOD derived from the OMI retrievals, and calculated from AATSAODs assuming various Bergstrom et al. results (see text for discussion).
Atmos. Chem. Phys., 9, 6743–6765, 2009 www.atmos-chem-phys.net/9/6743/2009/

J. M. Livingston et al.: Comparison of aerosol optical depths from the OMI and AATS 6761
Frames 14b and e examine the SSA associated with theaerosol models retrieved by the OMI algorithms at T2 andT0, respectively. Like the AOD, the OMAERUV SSAsare shown at 354 and 500 nm, but these are strictly a func-tion of the retrieved aerosol model, as the primary retrievalis at 388 nm. For the data near T2, the OMAERUV andOMAERO 388-nm SSA in the eastern pixel (dark blue) areequal (0.89, c.f. Table 1), but differ markedly for the SWpixel (cyan). A similar comparison is seen near T0, where the388-nm SSA values agree to within 0.015 for the pixel (lightblue) that includes most of the AATS data, but SSAOMAEROis 0.045 less than the SSAOMAERUV for the southern (cyan)pixel. Obviously, the spectral absorption characteristics ofthe aerosol models retrieved by the two algorithms differ sig-nificantly, as can be seen by the very large difference in SSAslopes at both sites. For comparison, we also plot the SSAcalculated (Bergstrom et al., 2009) from AATS and SSFRmeasurements over T2 and T0 during the J31 flight, in addi-tion to values calculated (Bergstrom et al., 2007) from AATSand SSFR measurements of Saharan dust, Asian dust/urbanpollution, and African biomass-burning aerosol during pre-vious field campaigns. The OMAERO retrievals near T2and T0 correspond to a biomass-burning aerosol model, butthe OMAERUV retrievals correspond to a dust model. Themagnitudes of the corresponding SSA at 388 nm agree bestwith the Bergstrom et al. (2007) biomass-burning SSA, ex-cept for the OMAERO cyan pixel. The spectral shapesof the retrieved OMAERO model SSA agree best with theBergstrom et al. (2007) biomass-burning SSA, but the re-trieved OMAERUV model SSA spectral shapes agree bestwith those of the Bergstrom et al. (2009) Mexico City SSAand the Bergstrom et al. (2007) Saharan dust and Asiandust/urban pollution SSA spectra. No trusted AERONET re-trievals of SSA at T0 or T2 are available for comparison nearthe times of Aura or J31 overpass. At T0, the only trustedSSA retrievals are for AERONET almucantar scans acquired5–6 h before (at 13:49, 14:10 and 14:56 UT) and 2–3 h af-ter (at 22:37, 23:22 and 23:43 UT) the Aura overpass time,but the AERONET direct sun measurements indicate that theparticles were much larger while the J31 was there than theywere during these times.
Frames 14c and f plot the OMI retrievals of AAOD forthe T2 and T0 measurements, respectively. For compari-son, we also show AAOD estimated from the AATS AODvalues (uncorrected for AOD below the J31) by assum-ing various Bergstrom et al. SSA spectra. At eachsite, the OMAERO AAOD values significantly exceed theOMAERUV values, but the magnitude of the differencescannot be explained by the difference in SSAs. Also, at eachsite the OMAERUV AAOD values are much closer to theAATS AAOD estimates (using the Bergstrom et al. MexicoCity, Saharan dust, or Asian dust/urban pollution SSA) thanare the OMAERO values.
4 Discussion and conclusions
We have compared AOD retrievals from spatially and tem-porally near-coincident measurements acquired by AATSand by OMI for three cases over the Gulf of Mexico andone over Mexico City. Aqua-MODIS AOD retrievals areavailable for two of the three over-water comparisons – 10and 17 March, and these have been shown to agree withAATS AODs to within MODIS AOD retrieval uncertaintiesfor 10 March and to within MODIS uncertainties plus 0.02for 17 March. Results have been presented separately fortwo segments of the J31 flight to Mexico City on 19 March –the first over the non-urban T2 supersite northeast of the cityand the second over the T0 supersite near the center of thecity. A MODIS AOD retrieval within a single pixel includingthe T2 site and AOD spectra derived from near-coincidentAERONET measurements at the T0, T1, and T2 sites havebeen included in the analyses.
The three over-water AATS/OMI comparisons are of spe-cial interest because of the scarcity of surface-based mea-surements available for validation of OMI aerosol retrievalsover water (Torres et al., 2007). The 10 March coinci-dent event represents an excellent test of the OMAERUVand OMAERO retrieval algorithms for a variety of rea-sons. First, the J31 flight track included a 20-minlow altitude (60 m a.s.l.) transect that intersected eightOMAERUV and seven OMAERO pixels and, based on theMODIS MOD04 L2 cloud fraction product, at least four ofthese pixels were cloud-free. This is important because sub-pixel cloud contamination within the nominal 13×24 km2
OMI pixel is one of the largest sources of uncertainty inthe retrieval of AOD from OMI measurements (Torres et al.,2007; Ahn et al., 2008; Curier et al., 2008). Secondly, AATSmeasured moderate AODs (0.21–0.40) at wavelengths withinthe OMI AOD retrieval spectral range. Finally, AATS ob-served a small but distinct AOD gradient (∼0.05) over thatportion of the aircraft track that coincided with the cloud-freeOMI pixels.
For the 10 March comparison, if the OMAERUV re-trieval with the largest AODs is omitted due to likely cloud-contamination in that pixel, then all OMAERUV retrievalsin the remaining seven pixels significantly underestimate(by ∼0.14–0.20 at OMI 388 nm/AATS 380 nm) the corre-sponding AATS (and MODIS) AODs, and all OMAERObest-fit retrievals significantly exceed (by∼0.30–0.50 at388/380 nm) the AATS values. Both OMI algorithms re-trieve an AOD gradient corresponding to that measuredby AATS, although the magnitudes of the gradient differslightly. All OMAERUV retrievals correspond to a non-absorbing sulfate aerosol with a refractive index of 1.40-0i,whereas all OMAERO best-fit retrievals correspond to abiomass-burning aerosol with a refractive index of 1.5-0.03i(SSA≈0.85). For both OMAERUV and OMAERO, corre-spondingAngstrom exponents are within 0.2 of the AATSvalues.
www.atmos-chem-phys.net/9/6743/2009/ Atmos. Chem. Phys., 9, 6743–6765, 2009

6762 J. M. Livingston et al.: Comparison of aerosol optical depths from the OMI and AATS
When the OMAERO retrieval was rerun restricting the setof allowable aerosol models to weakly absorbing aerosols,the retrieved AOD spectra were found to agree much moreclosely in magnitude with the AATS results but exhibit amuch flatter spectral behavior. Interestingly, the aerosolmodel (model 1114, with a refractive index of 1.40-5.0e-08i)corresponding to the best-fit solution is the same in each ofthe seven OMAERO pixels and is also among those solu-tions that passed the residual reflectance RMS threshold testfor the archived data product in five of the seven, includingthe four cloud-free, pixels. These results indicate that the in-formation in the OMI spectra in this case is not enough toselect the correct aerosol main type and the algorithm shouldbe constrained further to yield reliable AODs for such cases.Analysis of the RMS radiance error of the fit shows very lit-tle difference among the acceptable solutions. If mean val-ues calculated over the solutions passing the RMS thresholdare used instead of the best-fit AOD spectra, the agreementbetween the OMAERO AOD retrievals and the AATS mea-surements improves.
The strength of the near-UV technique is its ability tomeasure aerosol absorption and, as noted in Sect. 2.1, theAOD product is considered much less reliable than AAOD(Torres et al., 2007). Preliminary results from Bergstromet al. (2009) indicate that the overwater aerosol was con-siderably less absorbing than the Mexico City aerosol. Ifthe aerosol was either non-absorbing, as the OMAERUV re-trievals suggest, or even weakly absorbing, then it is not toosurprising that the OMAERUV algorithm does not have thesensitivity (within the set of available aerosol models andforward-calculated TOA reflectances) to retrieve the correctmagnitude of the AOD for this case. Although it is beyondthe scope of this study, it would be interesting to understandwhat incremental changes in the measured reflectances at354 nm and 388 nm would have been required to cause thealgorithm to retrieve a weakly absorbing instead of a non-absorbing aerosol and, hence, larger AODs.
The over-water AATS/OMI coincidences on 3 and17 March are less optimal for evaluating the performanceof the OMI aerosol retrieval algorithms due primarily to ahigher likelihood of sub-pixel cloud contamination but alsodue to fewer AATS AOD measurements intersecting fewerOMI pixels than for the 10 March comparison. Even so, bothcomparisons are useful. The AOD magnitudes measured byAATS during these events were comparable to those mea-sured on 10 March.
On 3 March, there were coincident AATS measurementswithin five OMI pixels, but the AATS measurements wereacquired about one hour before the OMI overpass. Due tosun glint there are no corresponding MODIS AOD retrievalsand, hence, no MODIS cloud fractions for this event. Basedon the number of AATS data points removed by the stan-dard AATS cloud-screening procedure, it appears that onlythe northernmost OMI pixel may have been cloud-free.AATS measured a larger AOD gradient (∼0.10 at OMI
wavelengths) on 3 March than on 10 March, and again bothOMI algorithms retrieve the sign, although not the mag-nitude, of this gradient. AATS and OMAERUV observethis gradient only within the three northernmost pixels, butOMAERO retrievals continue the gradient across all pix-els. As is the case for 10 March, OMAERUV retrieves anon-absorbing aerosol and OMAERO (best-fit retrieval) abiomass-burning aerosol model. We showed in Fig. 8 that inall five pixels the OMAERUV AOD at 388 nm agrees withthe AATS AOD to within the estimated uncertainty. TheOMAERO best-fit AOD spectrum significantly exceeds theAATS AOD spectrum in all pixels, and the difference in-creases along the J31 track to the south, where sub-pixelcloud contamination may have been greater. Similar to the10 March case, the algorithm chooses the wrong aerosolmodel, showing that stronger constraints on the aerosol maintype should be used for this case.
On 17 March, the J31 low altitude track intersected onlytwo OMAERUV and three OMAERO retrieval pixels, andmost of the AATS data points fall within a single pixel.The OMAERO best-fit AOD spectrum significantly exceedsthe AATS spectrum for the one pixel for which there isno corresponding OMAERUV retrieval, but this retrieval isjudged to be cloud-contaminated based on MODIS cloudfractions and it is also the only best-fit OMAERO solutionthat corresponds to a biomass-burning aerosol. For the othertwo pixels, OMAERO retrieves a best-fit weakly absorb-ing aerosol model and OMAERUV a non-absorbing aerosol.Both OMI algorithms retrieve AODs at 388 nm that agreewith the AATS values to within expected uncertainties, al-though the OMAERUV values appear to be biased slightlylow. Consistent with the results found in the March 3 andMarch 10 cases, the OMAERO AOD spectrum correspond-ing to a weakly absorbing aerosol model is significantlyflatter than the mean AATS spectrum. Examination of allOMAERO solutions that passed the RMS difference thresh-old for each of the three pixels reveals that one of severalsolutions in each pixel corresponds to the weakly absorbingaerosol model 1114 and there is little difference among theOMAERO mean AOD spectra for each of the pixels. MODIScloud fractions suggest that, in fact, OMI retrievals in allthree pixels may be cloud-contaminated.
During the J31 flight to Mexico City on 19 March, AATSmeasured AOD spectra near T2 and just north of T1 that wereextremely variable in magnitude, but all exhibit a flat spec-tral dependence indicative of large dust particles. AOD spec-tra derived from AERONET measurements taken at T1 andT2 also show a flat wavelength dependence, but because theJ31 was unable to fly lower than∼320 m above the under-lying terrain due to poor visibility and moderate turbulence,the resultant AATS AODs not adjusted for the AOD belowthe aircraft are∼30–80% lower than the AERONET val-ues. OMAERUV AODs agree well with the AERONET data,although the OMAERUV spectra exhibit a steeper wave-length dependence. The MODIS AOD retrieval in the pixel
Atmos. Chem. Phys., 9, 6743–6765, 2009 www.atmos-chem-phys.net/9/6743/2009/

J. M. Livingston et al.: Comparison of aerosol optical depths from the OMI and AATS 6763
including T2 exhibits magnitudes between the AATS andAERONET values and a steeper wavelength dependence.Corresponding OMAERO AODs exceed the OMAERUVand AERONET values by factors of∼3–8. The best fitOMAERO solutions correspond to biomass-burning aerosolmodels, whereas the OMAERUV retrievals yield a dustaerosol model. At T0, the visibility from the J31 wasmarkedly better than that at T2, and AATS AOD spectra mea-sured at 550–750 m a.g.l. were much less variable and exhibita distinct decrease with wavelength, withαAATS≈0.6. AATSand AERONET spectra at T0 agree well within respectiveuncertainties, despite no adjustment to the AATS values forthe AOD below the aircraft, and this suggests that the mag-nitude of this AOD contribution was small. OMAERUV re-trievals are about twice as large as the AATS values, but witha similar wavelength dependence. Corresponding OMAEROretrievals are 7 to 10 times larger than the AATS AODs.
One source of the large differences between the OMAEROand AATS/AERONET AODs at both T2 and T0 may bethe retrieved aerosol model type (biomass-burning aerosol).However, the most significant source of the observed discrep-ancies may be an incorrect assumption for the surface albedospectrum. We have calculated surface albedo spectra at T2and T0 from coincident measurements from the J31 by theSSFR, and these exceed the terrain reflectivity spectra used inthe OMAERO retrievals by<0.01 at 350 nm to 0.025–0.03 at483 nm. We have not attempted to quantify the sensitivity ofthese OMAERO AOD retrievals to the assumed value of ter-rain reflectivity. However, it is well recognized that the sur-face albedo assumption can and does affect satellite retrievalsof AOD (e.g. Veefkind et al., 1998; Torres et al., 2002, 2007;Currier et al., 2008; Veihelmann et al., 2007). In a relatedstudy, Castanho et al. (2007) have used ground-based sun-photometer data acquired in and near Mexico City before andduring MILAGRO to investigate the effect of an incorrect as-sumption of the visible/near-infrared surface reflectance ratioon retrieval of AOD from coincident MODIS measurements.They find significant improvement in the agreement betweenthe sunphotometer and MODIS AODs after use of a largersurface reflectance ratio for the urban Mexico City area thanthat typically assumed in the MODIS operational algorithm.Separately, Barnard et al. (2008) report enhanced absorptionin the near-UV spectral range (250 to 400 nm) due to ab-sorption by organic carbon in the Mexico City area. If theaerosol models used in the forward radiative transfer calcu-lations of TOA reflectance for the OMAERO retrievals un-derestimate the amount of absorption in the near-UV, thenthis could be another source of uncertainty in the retrievedAAOD and AOD.
In summary, we have found that OMAERO AOD re-trievals exceed AATS and MODIS values in two of threeover-water comparisons, and OMAERO retrievals exceedAATS and AERONET values at a non-urban site and anurban site for a single Aura overpass of the Mexico Cityarea. These results are consistent with the findings of
Curier et al. (2008), who report differences of the same or-der of magnitude as those we report here and who con-clude that OMAERO AODs tend to overestimate MODISand AERONET values. The corresponding OMAERUVretrievals slightly underestimate the AATS values for thecloud-free pixels of the 10 March over-water case, and agreewith AATS values to within uncertainties for the other twoover-water cases. For the Mexico City case, the OMAERUVretrievals are consistent with AERONET values at T2/T1, butexceed the AATS and AERONET values in the center of thecity near T0.
The current study has been limited in scope by the avail-ability of coincident data, but that should not diminish thesignificance of the findings. It points to the need for addi-tional OMI aerosol validation attempts using ground-basedand airborne correlative sensors over the ocean, at least, andthe need for additional in-depth OMI aerosol retrieval sen-sitivity studies such as that of Veihelmann et al. (2007) toexplain the observed AOD discrepancies over land and overocean.
Acknowledgements.The MILAGRO/INTEX-B Campaign is acollaborative effort of a large number of participants with thesupport of multi-national agencies. The MILAGRO/INTEX-Bparticipants would like to thank the governments of the FederalDistrict, the States of Mexico, Hidalgo and Veracruz, the MexicanMinistries of the Environment, Foreign Relations, Defense and Fi-nance for their logistical support; IMP, U-Tecamac, and Rancho LaBisnega for hosting the supersites as well as many other Mexicaninstitutions for their support. The photograph in Fig. 11a was takenand provided to us by Cameron McNaughton of the University ofHawaii School of Ocean and Earth Science Technology. We thankall INTEX-B/MILAGRO participants and sponsoring agencies formaking this research possible. J31 measurements were supportedby the NASA Radiation Science Program.
Edited by: S. Madronich
References
Ahn, C., Torres, O., and Bhartia, P. K.: Comparison of ozonemonitoring instrument UV aerosol products with Aqua/ModerateResolution Imaging Spectroradiometer and Multiangle ImagingSpectroradiometer observations in 2006, J. Geophys. Res., 113,D16S27, doi:10.1029/2007JD008832, 2008.
Barnard, J. C., Volkamer, R., and Kassianov, E. I.: Estimation of themass absorption cross section of the organic carbon componentof aerosols in the Mexico City Metropolitan Area, Atmos. Chem.Phys., 8, 6665–6679, 2008,http://www.atmos-chem-phys.net/8/6665/2008/.
Bergstrom, R. W., Pilewskie, P., Russell, P. B., Redemann, J., Bond,T. C., Quinn, P. K., and Sierau, B.: Spectral absorption propertiesof atmospheric aerosols, Atmos. Chem. Phys., 7, 5937–5943,2007,http://www.atmos-chem-phys.net/7/5937/2007/.
Bergstrom, R. W., Schmidt, K. S., Coddington, O., Pilewskie, P.,Livingston, J., Redemann, J., and Russell, P.: Aerosol absorp-
www.atmos-chem-phys.net/9/6743/2009/ Atmos. Chem. Phys., 9, 6743–6765, 2009

6764 J. M. Livingston et al.: Comparison of aerosol optical depths from the OMI and AATS
tion in the Mexico City area; results from airborne measurementsduring MILAGRO/INTEX-B, manuscript in preparation for sub-mission to Atmos. Chem. Phys. Discuss., 2009.
Brinksma, E. J., Pinardi, G., Volten, H., Braak, R., Richter, A.,Schonhardt, A., van Roozendael, M., Fayt, C., Hermans, C.,Dirksen, R. J., Vlemmix, T., Berkhout, A. J. C., Swart, D. P.J., Oertjen, H., Wittrock, F., Wagner, T., Ibrahim, O. W., deLeeuw, G., Moerman, M., Curier, R. L., Celarier, E. A., Cede,A., Knap, W. H., Veefkind, J. P., Eskes, H. J., Allaart, M., Rothe,R., Piters, A. J. M., and Levelt, P. F.: The 2005 and 2006 DAN-DELIONS NO2 and aerosol intercomparison campaigns, J. Geo-phys. Res., 113, D16S46, doi:10.1029/2007JD008808, 2008.
de Almeida Castanho, A. D., Prinn, R., Martins, V., Herold, M.,Ichoku, C., and Molina, L. T.: Analysis of Visible/SWIR surfacereflectance ratios for aerosol retrievals from satellite in MexicoCity urban area, Atmos. Chem. Phys., 7, 5467–5477, 2007,http://www.atmos-chem-phys.net/7/5467/2007/.
Coddington, O., Schmidt, K. S., Pilewskie, P., Gore, W. J.,Bergstrom, R. W., Roman, M., Redemann, J., Russell, P.B., Liu, J., and Schaaf, C. C.: Aircraft measurements ofspectral surface albedo and its consistency with ground-basedand space-borne observations, J. Geophys. Res., 113, D17209,doi:10.1029/2008JD010089, 2008.
Curier, R. L., Veefkind, J. P., Braak, R., Veihelmann, B., Torres,O., and de Leeuw, G.: Retrieval of aerosol optical propertiesfrom OMI radiances using a multiwavelength algorithm: Ap-plication to western Europe, J. Geophys. Res., 113, D17S90,doi:10.1029/2007JD008738, 2008.
Dubovik, O., Smirnov, A., Holben, B. N., King, M. D., Kauf-man, Y. J., Eck, T. F., and Slutsker, I.: Accuracy assessments ofaerosol optical properties retrieved from Aerosol Robotic Net-work (AERONET) Sun and sky radiance measurements, J. Geo-phys. Res., 105(D8), 9791–9806, 2000.
Dubovik, O., Holben, B. N., Eck, T. F., Smirnov, A., Kaufman,Y. J., King, M. D., Tanre, D., and Slutsker, I.: Variabilityof ab-sorption and optical properties of key aerosol types observed inworldwide locations, J. Atmos. Sci., 59, 590–608, 2002.
Eck, T. F., Holben, B. N., Dubovik, O., Smirnov, A., Slutsker, I.,Lobert, M., and Ramanathan, V.: Column-integrated aerosol op-tical properties over the Maldives during the northeast monsoonfor 1998–2000, J. Geophys. Res., 106, 28555–28566, 2001.
Herman, J. R., Bhartia, P. K., Torres, O., Hsu, C., Seftor, C., andCelarier, E.: Global distribution of UV-absorbing aerosol fromNimbus-7/TOMS data, J. Geophys. Res., 102, 16911–16922,1997.
Holben, B. N., Eck, T. F., Slutsker, I., Tanre, D., Buis, J. P., Set-zer, A., Vermote, E., Reagan, J. A., Kaufman, Y. J., Nakajima,F., Lavenu, T., Jankowiak, I., and Smirnov, A.: AERONET – Afederated instrument network and data archive for aereosol char-acterization, Remote Sens. Environ., 66, 1–16, 1998.
Holben, B. N., Tanre, D., Smirnov, A., Eck, T. F., Slutsker, I.,Abuhassan, N., Newcomb, W. W., Schafer, J. S., Chatenet,B., Lavenu, F., Kaufman, Y. J., Vande Castle, J., Setzer, A.,Markham, B., Clark, D., Frouin, R., Halthore, R., Karneli, A.,O’Neill, N. T., Pietras, C., Pinker, R. T., Voss, K., and Zibordi,G.: An emerging ground-based aerosol climatology: Aerosoloptical depth from AERONET, J. Geophys. Res., 106(D11),12067–12097, 2001.
King, M. D., Kaufman, Y. J., Menzel, W. P., and Tanre, D.: Remote-
sensing of cloud, aerosol, and water-vapor properties form theModerate Resolution Imaging Spectrometer (MODIS), IEEE T.Geosci. Remote, 30(1), 2–27, 1992.
Kleipool, Q. L., Dobber, M. R., de Haan, J. F., and Levelt, P. F:Earth surface reflectance climatology from 3 years of OMI data,J. Geophys. Res., 113, D18308, doi:10.1029/2008JD010290,2008.
Levelt, P. F., Hilsenrath, E., Leppelmeier, G. W., van den Ooord, G.H. J., Bhartia, P. K., Taminnen, J., de Haan, J. F., and Veefkind,J. P.: Science objectives of the Ozone Monitoring Instrument,IEEE T. Geosci. Remote, 44(5), 1283–1287, 2006.
Levy, R. C., Remer, L. A., Mattoo, S., Vermote, E. F., and Kauf-man, Y. J.: Second-generation operational algorithm: Retrievalof aerosol properties over land from inversion of Moderate Res-olution Imaging Spectroradiometer spectral reflectance, J. Geo-phys. Res., 112, D13211, doi:10.1029/2006JD007811, 2007.
Li, R.-R., Kaufman, Y. J., Gao, B.-C., and Davis, C. O.: Re-mote sensing of suspended sediments and shallow coastal waters,IEEE T. Geosci. Remote, 41, 559–566, 2003.
Livingston, J. M., Schmid, B., Russell, P. B., Eilers, J. A., Kolyer,R. W., Redemann, J., Ramirez, S. R., Yee, J.-H., Swartz, W. H.,Trepte, C. R., Thomason, L. W., Pitts, M. C., Avery, M. A., Ran-dall, C. E., Lumpe, J. D., Bevilacqua, R. M., Bittner, M., Er-bertseder, T., McPeters, R. D., Shetter, R. E., Browell, E. V.,Kerr, J. B., and Lamb, K.: Retrieval of ozone column contentfrom airborne Sun photometer measurements during SOLVE II:comparison with coincident satellite and aircraft measurements,Atmos. Chem. Phys., 5, 2035–2054, 2005,http://www.atmos-chem-phys.net/5/2035/2005/.
Livingston, J. M., Schmid, B., Redemann, J., Russell, P. B.,Ramirez, S. A., Eilers, J., Gore, W., Howard, S., Pommier, J.,Fetzer, E. J., Seemann, S. W., Borbas, E., Wolfe, D. E., andThompson, A. M.: Comparison of water vapor measurements byairborne Sun photometer and near-coincident in situ and satel-lite sensors during INTEX/ITCT 2004, J. Geophys. Res., 112,D12S16, doi:10.1029/2006JD007733, 2007.
Martins, J. V., Tanre, D., Remer, L., Kaufman, Y., Mattoo, S., andLevy, R.: MODIS cloud screening for remote sensing of aerosolsover oceans using spatial variability, Geophys. Res. Lett., 29(12),8009, doi:10.1029/2001GL013252, 2002.
Michalsky, J. J., Liljegren, J. C., and Harrison, L. C.: A compar-ison of Sun photometer derivations of total column water va-por and ozone to standard measures of same at the SouthernGreat Plains Atmospheric Radiation site, J. Geophys. Res., 100,25995–26003, 1995.
Molina, L. T., Madronich, S., Gaffney, J., et al.: An Overviewof MILAGRO 2006 Campaign: Mexico City Emissions and itsTransport and Transformation, manuscript submitted to Atmos.Chem. Phys. Discuss., 2009.
Pilewskie, P., Pommier, J., Bergstrom, R., Gore, W., Howard, S.,Rabbette, M., Schmid, B., Hobbs, P. V., and Tsay, S. C.: So-lar spectral radiative forcing during the Southern African Re-gional Science Initiative, J. Geophys. Res., 108(D13), 8486,doi:10.1029/2002JD002411, 2003.
Reagan, J., Thome, K., Herman, B., Stone, R., Deluisi, J., andSnider, J.: A comparison of columnar water-vapor retrievals ob-tained with near-IR solar radiometer and microwave radiometermeasurements, J. Appl. Meteorol., 34, 1384–1391, 1995.
Redemann, J., Zhang, Q., Livingston, J., Russell, P., Shinozuka, Y.,
Atmos. Chem. Phys., 9, 6743–6765, 2009 www.atmos-chem-phys.net/9/6743/2009/

J. M. Livingston et al.: Comparison of aerosol optical depths from the OMI and AATS 6765
Clarke, A., Johnson, R., and Levy, R.: Testing aerosol proper-ties in MODIS (MOD04/MYD04) Collection 4 and 5 using air-borne sunphotometer observations in INTEX-B/MILAGRO, At-mos. Chem. Phys. Discuss., 9, 11753–11781, 2009,http://www.atmos-chem-phys-discuss.net/9/11753/2009/.
Remer, L., Kaufman, Y. J., Tanre, D., Mattoo, S., Chu, D. A., Mar-tins, J. V., Li, R.-R., Ichoku, C., Levy, R. C., Kleidman, R. G.,Eck, T. F., Vermote, E., and Holben, B. N.: The MODIS aerosolalgorithm, products and validation, J. Atmos. Sci., 62, 947–973,2005.
Russell, P. B., Livingston, J. M., Dutton, E. G., Pueschel, R. F., Rea-gan, J. A., DeFoor, T. E., Box, M. A., Allen, D., Pilewskie, P.,Herman, B. M., Kinne, S. A., and Hofmann, D. J.: Pinatuboand pre-Pinatubo optical-depth spectra: Mauna Loa measure-ments, comparisons, inferred particle size distributions, radia-tive effects, and relationship to lidar data, J. Geophys. Res., 98,22969–22985, 1993a.
Russell, P. B., Livingston, J. M., Pueschel, R. F., Reagan, J. A.,Browell, E. V., Toon, G. C., Newman, P. A., Schoeberl, M.R., Lait, L. R., Pfister, L., Gao, Q., and Herman, B. M.: Post-Pinatubo optical depth spectra vs. latitude and vortex structure:Airborne tracking sunphotometer measurements in AASE II,Geophys. Res. Lett., 20, 2571–2574, 1993b.
Russell, P., Livingston, J., Schmid, B., Eilers, J., Kolyer, R., Rede-mann, J., Ramirez, S., Yee, J.-H., Swartz, W., Shetter, R., Trepte,C., Risley Jr., A., Wenny, B., Zawodny, J., Chu, W., Pitts, M.,Lumpe, J., Fromm, M., Randall, C., Hoppel, K., and Bevilac-qua, R.: Aerosol optical depth measurements by airborne sunphotometer in SOLVE II: Comparisons to SAGE III, POAM IIIand airborne spectrometer measurements, Atmos. Chem. Phys.,5, 1311–1339, 2005,http://www.atmos-chem-phys.net/5/1311/2005/.
Russell, P. B., Livingston, J. M., Redemann, J., Schmid, B.,Ramirez, S. A., Eilers, J., Kahn, R., Chu, A., Remer, L.,Quinn, P. K., Rood, M. J., and Wang, W.: Multi-grid-cell validation of satellite aerosol property retrievals in IN-TEX/ITCT/ICARTT 2004, J. Geophys. Res., 112, D12S09,doi:10.1029/2006JD007606, 2007.
Schmid, B. and Wehrli, C.: Comparison of sun photometer calibra-tion by Langley technique and standard lamp, Appl. Optics, 34,4500–4512, 1995.
Schmid, B., Thome, K. J., Demoulin, P., Peter, R., Matzler, C., andSekler, J.: Comparison of modeled and empirical approaches forretrieving columnar water vapor from solar transmittance mea-surements in the 0.94-µm region, J. Geophys. Res., 101, 9345–9358, 1996.
Schmid, B., Spyak, P. R., Biggar, S. F., Wehrli, C., Sekler, J., Ingold,T., Matzler, C., and Kampfer, N.: Evaluation of the applicabilityof solar and lamp radiometric calibrations of a precision Sun pho-tometer operating between 300 and 1025 nm, Appl. Optics, 37,3923–3941, 1998.
Schmid, B., Michalsky, J. J., Slater, D. W., Barnard, J. C., Halthore,R. N., Liljegren, J. C., Holben, B. N., Eck, T. F., Livingston,J. M., Russell, P. B., Ingold, T., and Slutsker, I.: Comparisonof columnar water-vapor measurements from solar transmittancemethods, Appl. Optics, 40, 1886–1896, 2001.
Schmid, B., Redemann, J., Russell, P. B., Hobbs, P. V., Hlavka, D.L., McGill, M. J., Holben, B. N., Welton, E. J., Campbell, J. R.,Torres, O., Kahn, R. A., Diner, D. J., Helmlinger, M. C., Chu,D. A., Robles-Gonzalez, C., and de Leeuw, G.: Coordinated air-borne, spaceborne, and ground-based measurements of massive,thick aerosol layers during the dry season in Southern Africa,J. Geophys. Res., 108(D13), 8496, doi:10.1029/2002JD002297,2003a.
Schmid, B., Hegg, D. A., Wang, J., Bates, D., Redemann, J., Rus-sell, P. B., Livingston, J. M., Jonsson, H. H., Welton, E. J., Se-infeld, J. H., Flagan, R. C., Covert, D. S., Dubovik, O., Jeffer-son, A.: Column closure studies of lower tropospheric aerosoland water vapor during ACE-Asia using airborne sunphotometer,airborne in-situ and ship-based lidar measurements, J. Geophys.Res. , 108(D23), 8656, doi:10.10292002JD003361, 2003b.
Smirnov, A., Holben, B. N., Eck, T. F., Dubovik, O., and Slutsker,I.: Cloud screening and quality control algorithms for theAERONET data base, Remote Sens. Enviorn., 73(3), 337–349,2000.
Torres, O., Bhartia, P. K., Herman, J. R., and Ahmad, Z.: Derivationof aerosol properties from satellite measurements of backscat-tered ultraviolet radiation: Theoretical basis, J. Geophys. Res.,103, 17099–17110, 1998.
Torres, O., Decae, R., Veefkind, J. P., and de Leeuw, G.: OMIaerosol retrieval algorithm, in OMI Algorithm Theoretical BasisDocument: Clouds, Aerosols, and Surface UV Irradiance, editedby Stammes, P., NASA Goddard Space Flight Cent., Greenbelt,Md. OMI-ATBD-03, vol. 3, version 2, pp. 47–71, 2002. (Avail-able athttp://eospso.gsfc.nasa.gov/eoshomepage/for-scientists/atbd/docs/OMI/ATBD-OMI-03.pdf)
Torres, O., Tanskanen, A., Veihelmann, B., Ahn, C., Braak, R.,Bhartia, P. K., Veefkind, P., and Levelt, P.: Aerosols andsurface UV products from Ozone Monitoring Instrument ob-servations: An overview, J. Geophys. Res., 112, D24S47,doi:10.1029/2007JD008809, 2007.
Veefkind, J. P., de Leeuw, G., and Durkee, P. A.: Retrieval of aerosoloptical depth over land using two angle view satellite radiometryduring TARFOX, Geophys. Res. Lett., 25(16), 3135–3138, 1998.
Veihelmann, B., Levelt, P. F., Stammes, P., and Veefkind, J. P.: Sim-ulation study of the aerosol information content in OMI spectralreflectance measurements, Atmos. Chem. Phys., 7, 3115–3127,2007,http://www.atmos-chem-phys.net/7/3115/2007/.
www.atmos-chem-phys.net/9/6743/2009/ Atmos. Chem. Phys., 9, 6743–6765, 2009