
Evaluating model performance of an ensemble-based chemical data assimilation system during INTEX-B...
16
Atmos. Chem. Phys., 7, 5695–5710, 2007 www.atmos-chem-phys.net/7/5695/2007/ © Author(s) 2007. This work is licensed under a Creative Commons License. Atmospheric Chemistry and Physics Evaluating model performance of an ensemble-based chemical data assimilation system during INTEX-B field mission A. F. Arellano Jr. 1 , K. Raeder 2 , J. L. Anderson 2 , P. G. Hess 1 , L. K. Emmons 1 , D. P. Edwards 1 , G. G. Pfister 1 , T. L. Campos 1 , and G. W. Sachse 3 1 Atmospheric Chemistry Division, Earth and Sun Systems Laboratory, National Center for Atmospheric Research, PO Box 3000, Boulder, Colorado 80307-3000, USA 2 Institute for Mathematics Applied to Geosciences, Computational and Information Systems Laboratory, National Center for Atmospheric Research, PO Box 3000, Boulder, Colorado, 80307-3000, USA 3 Chemistry and Dynamics Branch, NASA Langley Research Center, Hampton, Virginia, 23681-2199, USA Received: 1 June 2007 – Published in Atmos. Chem. Phys. Discuss.: 5 July 2007 Revised: 30 October 2007 – Accepted: 31 October 2007 – Published: 16 November 2007 Abstract. We present a global chemical data assimilation system using a global atmosphere model, the Community At- mosphere Model (CAM3) with simplified chemistry and the Data Assimilation Research Testbed (DART) assimilation package. DART is a community software facility for assim- ilation studies using the ensemble Kalman filter approach. Here, we apply the assimilation system to constrain global tropospheric carbon monoxide (CO) by assimilating mete- orological observations of temperature and horizontal wind velocity and satellite CO retrievals from the Measurement of Pollution in the Troposphere (MOPITT) satellite instrument. We verify the system performance using independent CO ob- servations taken on board the NSF/NCAR C-130 and NASA DC-8 aircrafts during the April 2006 part of the Intercon- tinental Chemical Transport Experiment (INTEX-B). Our evaluations show that MOPITT data assimilation provides significant improvements in terms of capturing the observed CO variability relative to no MOPITT assimilation (i.e. the correlation improves from 0.62 to 0.71, significant at 99% confidence). The assimilation provides evidence of median CO loading of about 150 ppbv at 700 hPa over the NE Pacific during April 2006. This is marginally higher than the mod- eled CO with no MOPITT assimilation (∼140 ppbv). Our ensemble-based estimates of model uncertainty also show model overprediction over the source region (i.e. China) and underprediction over the NE Pacific, suggesting model errors that cannot be readily explained by emissions alone. These results have important implications for improving regional chemical forecasts and for inverse modeling of CO sources and further demonstrate the utility of the assimilation system in comparing non-coincident measurements, e.g. comparing satellite retrievals of CO with in-situ aircraft measurements. Correspondence to: A. F. Arellano Jr. ([email protected]) 1 Introduction The availability of near-global and long-term measurements of tropospheric chemical constituents from space offers an opportunity to better understand changes in tropospheric composition through the integration of measurements with predictions from global chemical transport models. Cen- tral to this integration is a chemical data assimilation system that is reasonably efficient and flexible in assimilating mea- surements of various scales and of various chemical species. Such a system is useful as a tool in providing initial condi- tions for chemical weather forecasts, which are important in regional to global air quality and field missions (e.g. Chai et al., 2006). Here, the term chemical weather is analogous to meteorological weather and is described by Lawrence et al. (2005) as the local to global distribution of important trace gas and aerosols and their associated short-term variability. Such a system is also useful in building a framework for model system diagnosis and process evaluation (e.g. Lary, 1999; Rasch et al., 2001), as well as in conducting retrospec- tive analysis of chemically and radiatively important trace gases and aerosols (e.g. Dethof and Holm, 2004; Stajner et al., 2001; Juckes and Lawrence, 2006 among others). Chemical data assimilation systems extend from simple suboptimal techniques such as Newtonian relaxation (nudg- ing, e.g. Sekiyama and Shibata, 2005), optimal interpolation (OI, e.g. Levelt et al., 1998; Lamarque et al., 1999; Cler- baux et al. 2001; Collins et al., 2001), variations of subop- timal Kalman filtering (e.g. Khattatov et al., 2000; Menard et al., 2000; Lamarque et al., 2002; Lamarque et al., 2003; Auger and Tangborn, 2004), to more complex techniques such as four-dimensional variational methods (4D-var, e.g. Fisher and Lary, 1995; Elbern and Schmidt, 1999; Wang et al., 2001; Eskes et al., 2003; Engelen and McNally, 2005; Chai et al., 2006) and ensemble-based approaches (EnKF, Published by Copernicus Publications on behalf of the European Geosciences Union.
Transcript of Evaluating model performance of an ensemble-based chemical data assimilation system during INTEX-B...

Atmos. Chem. Phys., 7, 5695–5710, 2007www.atmos-chem-phys.net/7/5695/2007/© Author(s) 2007. This work is licensedunder a Creative Commons License.
AtmosphericChemistry
and Physics
Evaluating model performance of an ensemble-based chemical dataassimilation system during INTEX-B field mission
A. F. Arellano Jr. 1, K. Raeder2, J. L. Anderson2, P. G. Hess1, L. K. Emmons1, D. P. Edwards1, G. G. Pfister1,T. L. Campos1, and G. W. Sachse3
1Atmospheric Chemistry Division, Earth and Sun Systems Laboratory, National Center for Atmospheric Research, PO Box3000, Boulder, Colorado 80307-3000, USA2Institute for Mathematics Applied to Geosciences, Computational and Information Systems Laboratory, National Center forAtmospheric Research, PO Box 3000, Boulder, Colorado, 80307-3000, USA3Chemistry and Dynamics Branch, NASA Langley Research Center, Hampton, Virginia, 23681-2199, USA
Received: 1 June 2007 – Published in Atmos. Chem. Phys. Discuss.: 5 July 2007Revised: 30 October 2007 – Accepted: 31 October 2007 – Published: 16 November 2007
Abstract. We present a global chemical data assimilationsystem using a global atmosphere model, the Community At-mosphere Model (CAM3) with simplified chemistry and theData Assimilation Research Testbed (DART) assimilationpackage. DART is a community software facility for assim-ilation studies using the ensemble Kalman filter approach.Here, we apply the assimilation system to constrain globaltropospheric carbon monoxide (CO) by assimilating mete-orological observations of temperature and horizontal windvelocity and satellite CO retrievals from the Measurement ofPollution in the Troposphere (MOPITT) satellite instrument.We verify the system performance using independent CO ob-servations taken on board the NSF/NCAR C-130 and NASADC-8 aircrafts during the April 2006 part of the Intercon-tinental Chemical Transport Experiment (INTEX-B). Ourevaluations show that MOPITT data assimilation providessignificant improvements in terms of capturing the observedCO variability relative to no MOPITT assimilation (i.e. thecorrelation improves from 0.62 to 0.71, significant at 99%confidence). The assimilation provides evidence of medianCO loading of about 150 ppbv at 700 hPa over the NE Pacificduring April 2006. This is marginally higher than the mod-eled CO with no MOPITT assimilation (∼140 ppbv). Ourensemble-based estimates of model uncertainty also showmodel overprediction over the source region (i.e. China) andunderprediction over the NE Pacific, suggesting model errorsthat cannot be readily explained by emissions alone. Theseresults have important implications for improving regionalchemical forecasts and for inverse modeling of CO sourcesand further demonstrate the utility of the assimilation systemin comparing non-coincident measurements, e.g. comparingsatellite retrievals of CO with in-situ aircraft measurements.
Correspondence to:A. F. Arellano Jr.([email protected])
1 Introduction
The availability of near-global and long-term measurementsof tropospheric chemical constituents from space offers anopportunity to better understand changes in troposphericcomposition through the integration of measurements withpredictions from global chemical transport models. Cen-tral to this integration is a chemical data assimilation systemthat is reasonably efficient and flexible in assimilating mea-surements of various scales and of various chemical species.Such a system is useful as a tool in providing initial condi-tions for chemical weather forecasts, which are important inregional to global air quality and field missions (e.g. Chaiet al., 2006). Here, the term chemical weather is analogousto meteorological weather and is described by Lawrence etal. (2005) as the local to global distribution of important tracegas and aerosols and their associated short-term variability.Such a system is also useful in building a framework formodel system diagnosis and process evaluation (e.g. Lary,1999; Rasch et al., 2001), as well as in conducting retrospec-tive analysis of chemically and radiatively important tracegases and aerosols (e.g. Dethof and Holm, 2004; Stajner etal., 2001; Juckes and Lawrence, 2006 among others).
Chemical data assimilation systems extend from simplesuboptimal techniques such as Newtonian relaxation (nudg-ing, e.g. Sekiyama and Shibata, 2005), optimal interpolation(OI, e.g. Levelt et al., 1998; Lamarque et al., 1999; Cler-baux et al. 2001; Collins et al., 2001), variations of subop-timal Kalman filtering (e.g. Khattatov et al., 2000; Menardet al., 2000; Lamarque et al., 2002; Lamarque et al., 2003;Auger and Tangborn, 2004), to more complex techniquessuch as four-dimensional variational methods (4D-var, e.g.Fisher and Lary, 1995; Elbern and Schmidt, 1999; Wang etal., 2001; Eskes et al., 2003; Engelen and McNally, 2005;Chai et al., 2006) and ensemble-based approaches (EnKF,
Published by Copernicus Publications on behalf of the European Geosciences Union.

5696 A. F. Arellano Jr. et al.: Ensemble-based global chemical data assimilation
e.g., van loon et al., 2000; Hanea et al., 2004; Eben et al.,2005; Sandu et al., 2005). Incorporation of bias estimationand model parameter estimation in chemical data assimila-tion has also been applied in recent years (Elbern et al., 2000;Lamarque et al., 2004; Yudin et al., 2004) to enhance the fi-delity of model forecasts and analyses.
Reports of improved performance using variational orensemble-based data assimilation in global atmosphericmodels (Rabier, 2005; Houtekamer et al., 2005) and chem-ical transport models (Chai et al., 2006; Sandu et al., 2005)are encouraging. Such techniques are especially appealing tostudies in global atmospheric constituent transport and chem-istry where observations are available for a range of chemi-cal species having observation operators of varying complex-ity. They also have the potential to provide conditional dis-tributions of poorly-observed or unobserved model param-eters, such as surface fluxes or emission rates (e.g. Rayneret al., 2005; Muller and Stavrakou, 2005; Peters et al., 2005;Frankenberg et al., 2006; Elbern et al., 2007) that are relevantto modeling transport and chemistry and in designing pollu-tion control strategies. More recent collaborative efforts toinclude atmospheric chemical constituents such as CO2, O3and CO in global prediction systems also show great poten-tial for significant gains in meteorology, climate and chem-istry (e.g. Engelen and McNally, 2005; McLaughlin et al.,2005).
We continue these efforts by applying an ensemble-basedapproach in assimilating both meteorological and chemicalobservations with a global atmospheric model. In particu-lar, we present an ensemble-based chemical data assimila-tion system using a global atmospheric model, the Commu-nity Atmosphere Model (CAM3) with simplified chemistry,and an assimilation package, the Data Assimilation ResearchTestbed (DART) developed at the National Center for Atmo-spheric Research (NCAR). This system serves as an onlineglobal chemical transport model (GCTM) with observationalconstraints to both meteorological fields and trace gas dis-tribution. For this reason, it potentially offers a consistentglobal representation of the dynamical and chemical stateof the atmosphere with an opportunity for studies relatedto coupling of chemistry and meteorology. To our knowl-edge, this type of system is one of the first applications ofEnKF in global chemical data assimilation. In this work, wedemonstrate its utility to chemical weather forecasting. Inparticular, we apply the DART/CAM data assimilation sys-tem to better constrain the global distribution of CO. Wevalidate our results against independent observations fromNASA’s Intercontinental Chemical Transport Experiment B(INTEX-B) field mission conducted over the northern Pa-cific in Spring 2006 (http://www.espo.nasa.gov/intex-b). Weshow a significant improvement in modeling the CO distri-bution with assimilation of meteorological observations andCO retrievals from the Measurement of Pollution in the Tro-posphere (MOPITT) instrument on the Terra satellite. Wealso show that such constraints in CO distribution provides
a structure of CO forecasts different from that derived frommodel simulations and forecast systems with no CO assimi-lation.
The outline of the paper is as follows. In Sect. 2, wepresent in detail the components of the global chemical dataassimilation system being developed and applied specificallyto CO data assimilation. We describe the assimilation ex-periments conducted for initial verification of the system inSect. 3 followed by a presentation of results and verificationwith INTEX-B CO data in Sects. 4.1 to 4.2 and a discussionon several insights from the experiment results in Sects. 4.3and 4.4. Further analysis on the assimilation diagnostics arepresented in Sect. 4.5 followed by summary and conclusionsin Sect. 5.
2 Description of the chemical data assimilation system
2.1 Data Assimilation Research Testbed (DART)
DART is a community assimilation software package be-ing developed at the Data Assimilation Research Section(DAReS) of NCAR (http://www.image.ucar.edu/DAReS/DART). Built under an ensemble Kalman filter (EnKF) as-similation framework, it provides a flexible and extensibleenvironment for collaborative data assimilation research andapplication. Originally introduced by Evensen (1994), theunderlying principle of an ensemble Kalman filter is to per-form an ensemble of forecasts and analysis cycles or an en-semble of Kalman filters. The error statistics are approxi-mated using a finite sample of model states as opposed tohandling explicitly a large error covariance matrix. This hasthe advantage of reduced cost in propagating the error statis-tics relative to a Kalman filter. It is also simple to imple-ment and flexible compared to variational assimilation ap-proaches such as 4D-VAR, which requires the developmentof a tangent linear and an adjoint of the GCTM. Further de-tails on the comparison of 4D-VAR and EnKF are discussedin Lorenc (2005).
In this particular application, we use the ensemble adjust-ment Kalman filter scheme (EAKF) introduced by Ander-son (2001). The EAKF approach differs from other EnKFschemes (e.g. Houtekamer and Mitchell, 1998) in its deter-ministic analysis update, which ensures that both the ensem-ble posterior mean and the posterior error covariance as esti-mated by the ensemble are consistent with Kalman filteringtheory. Based on Anderson (2001) and other variants of whatis generally known as deterministic ensemble square root fil-ters (EnSRF, Tippett et al., 2003), this type of assimilationscheme updates the prior ensemble to a new set of observa-tions without the addition of stochastic noise.
In practice, the use of EAKF (and EnKF) in global chem-ical data assimilation requires some additional approxima-tions in computing posterior means and covariances. Theapproximations are needed to minimize degeneracy in co-
Atmos. Chem. Phys., 7, 5695–5710, 2007 www.atmos-chem-phys.net/7/5695/2007/

A. F. Arellano Jr. et al.: Ensemble-based global chemical data assimilation 5697
variance matrices, errors in sampling, and filter divergence,as a result of using limited ensemble sizes for computationalexpedience in such large systems. Our first approximationinvolves applying the filter locally and independently ontosubsets of the model states. In particular, we use the filter onCO observations to only influence the model CO states. Wealso use the filter on temperature and wind velocity obser-vations to only influence a subset of the model meteorolog-ical states that includes temperature, wind, surface pressure,specific humidity, cloud ice and cloud water. Our second ap-proximation involves artificially inflating the covariance toaccount for model error, low bias and inaccuracies in sam-pling the prior covariance and mean by a small ensemblesize (Anderson and Anderson, 1999). Such error causes theprior covariances to shrink at some point in the assimilation,ultimately causing filter divergence. Specifically, the ensem-ble is linearly inflated around its mean prior to the update,by increasing the deviations of each ensemble member abouttheir ensemble mean with an inflation factor slightly largerthan one. This covariance inflation retains the information ofthe ensemble mean and correlation structure between ensem-ble state variables. We use a constant inflation factor whichis calculated empirically such that the ensemble mean root-mean-square error (RMSE) relative to observations is at itsminimum. The values of the inflation factor we obtained foreach assimilation cycle range from 1.1 to 1.4. There are how-ever more advanced methods in dealing with covariance in-flation, which are currently being developed and tested forfuture applications (e.g. Anderson, 2007b). In effect, thesetwo approximations avoid degeneracy in sample covariancesof small ensemble sizes. Our third approximation involvesthe use of covariance localization. This is also related to ourfirst approximation, but here we use the localization to mini-mize the impact of spurious correlations between an observa-tion and a state variable that are physically separated (Hamillet al., 2001; Anderson, 2007a). We multiply the samplecovariance between the observation and the state variableby a distance dependent correlation function with local sup-port. We use the fifth order piecewise rational function fromEq. (4.10) of Gaspari and Cohn (1999) for this application.
2.2 Community Atmosphere Model (CAM3)
We use the Community Atmosphere Model (CAM) version3.1.1 as the model component of our chemical data assimi-lation system (CDAS). CAM3 is an atmospheric general cir-culation model (AGCM) developed as either a stand-aloneAGCM or as an atmospheric component of the communityclimate system model, CCSM3 (seehttp://www.ccsm.ucar.edu/models/atm-camfor documentation, input datasets andmodel simulations). A full description of its physics and dy-namical formulation is also given by Collins et al. (2006). Weuse CAM3 with the finite-volume (FV) dynamical core at aspatial resolution of 2◦×2.5◦ horizontal and 26 vertical levelswith a model top of about 4 hPa. We choose to use the FV dy-
namical core as it exhibits certain numerical properties (e.g.conservative, less diffusive) favorable for tracer transport andchemistry studies (Rasch et al., 2006). A coupling of CAMwith the Model for Ozone And Related chemical Tracers v4(MOZART4) chemistry (or CAM-MZ4) has been developedfor climate-chemistry studies (Lamarque et al., 2005).
For CO simulations, we treat CO as a tracer constituent inCAM3, by specifying the direct emissions (e.g. fossil-fuel,biofuel, biomass burning, biogenic) and indirect emissions(e.g. chemical oxidation of hydrocarbons) of CO and pre-scribing the sink of CO by fixing the distribution of OH rad-icals (e.g. Granier et al., 1999; Bey et al., 2001). This is ap-propriate due to the medium lifetime of CO (globally about2 months) and the dominance of oxidation by OH as the COsink. Both the OH fields and CO from chemical oxidation ofhydrocarbons are taken from an archive of MOZART4 fullchemistry simulation (Emmons et al., 20071). While it is en-visaged that future CAM/CO simulations will be performedusing interactive chemistry (in anticipation of possible multi-species chemical data assimilation), this work reports modelsimulations using the “tagged-CO” scheme for the purposeof initial CDAS development.
2.3 Initial ensembles
Below, we describe our approach for generating our initialensembles of model states. It is recognized that having areasonable representation of the initial ensembles (both itsmean and spread) appreciably aids in making a successfulensemble-based CDAS (e.g. Sandu et al., 2005). Albeit lim-ited in scope, our approach is predicated on the assump-tion that the variability of the CO state is mostly due to thevariability induced from atmospheric transport (Allen et al.,1996) and from the spatial and temporal variability in emis-sions (e.g. Logan, 1981; Novelli et al., 2003). We partitionour approach to include the following pre-processing proce-dures: 1) create an initial ensemble of CAM meteorologi-cal state variables, 2) create a monthly ensemble of CO to-tal emissions, and 3) create an ensemble of CO distributionsconsistent with our ensembles in meteorology and emissions.The choice of using an ensemble of meteorology and an en-semble of emissions within an online GCTM framework isdirectly tied to the need of an EnKF system to maintain thevariability of CO states over the period of forecast and anal-ysis cycles.
2.3.1 Ensemble of meteorological state variables
A 20-member ensemble of CAM initial conditions for 1April 2006 is constructed using a 100-year climatological
1Emmons, L. K., Hess, P. G., Lamarque, J.-F., Fillmore, D.,Granier, C., Kinnison, D., Laepple, T., Orlando, J., Petron, G., Pfis-ter, G., Tie, X., Tyndall, G., and Walters, S.: Sensitivity of chemicalbudgets to meteorology in MOZART-4, manuscript in preparation,2007.
www.atmos-chem-phys.net/7/5695/2007/ Atmos. Chem. Phys., 7, 5695–5710, 2007

5698 A. F. Arellano Jr. et al.: Ensemble-based global chemical data assimilation
Temperature (mean) Temperature (spread)
U Wind Component (mean) U Wind Component (spread)
V Wind Component (mean) V Wind Component (spread)
Fig. 1. Ensemble-mean (left panels) and ensemble-spread (rightpanels) of initial conditions for CAM3 temperature (T ) in K, hor-izontal wind velocity componentsU andV in m/s at 500 hPa (1April 2006).
simulation of CAM. It is assumed here that each 1 Aprilinitial condition across the entire span of the climatologicalsimulations is a realization of CAM meteorology for a clima-tological April and that the 100-year period spans the spreador variability of the majority of CAM state variables. A sub-set of these initial files is used as members of our ensemble ofCAM initial conditions. Shown in Fig. 1 are ensemble meansand ensemble spreads of CAM temperature and horizontalwind velocity state variables. They are calculated from the20-member ensemble generated for CAM initial conditions.Here, the large spread is interpreted as a gross estimate ofvariability of the modeled initial states which is intended tobe larger than typical uncertainties of modeled states.
2.3.2 Ensemble of CO total emissions
We based our estimates of uncertainty in CO emissionson recent inverse modeling results, as well as on recent
30E 130E 130W 30W
50S
E Q
50N
7 55 400
30E 130E 130W 30W
50S
E Q
50N
3.5e9 1.5e12
(a) (b)
Fig. 2. Ensemble-spread of CAM3 total surface CO emissions forthe month of April 2006 in molecules/cm2/s (a), and in percentage% relative to ensemble mean emissions(b).
data-constrained biomass burning inventories. In partic-ular, we used a recently compiled monthly emission in-ventory at 1◦×1◦ resolution from MOZART4 for the pe-riod 1996 to 2006. This inventory includes direct emis-sions from fossil-fuel/biofuel sources, based on Precursorsof Ozone and their Effects in the Troposphere (POET) inven-tory (http://www.aero.jussieu.fr/projet/ACCENT/POET) andscaled to have regional magnitudes consistent with estimatesof optimized emissions from inverse modeling using MO-PITT for the year 2000 (Petron et al., 2004). This inventoryalso includes biomass burning sources, based on GFEDv2dataset (van der Werf et al., 2006) for 1996–2004. Emissionsfrom biomass burning for 2005–2006 are taken from a cli-matological mean of GFEDv2 and scaled with year-specificMODIS Climate Modeling Grid 8-day fire product (Giglioet al., 2006). The compiled emission inventory,µemis, isthen perturbed assuming that the monthly emissionxemisis log-normally distributed with meanµemis and covariance6emis. The covariance6emis is the combination of sub-gridand inter-annual variability as well as estimates of regionalmagnitude uncertainties from inverse analyses (Arellano andHess, 2006). Details on the construction of6emis are pre-sented in Appendix A. In principle, we draw random samplesof the distributionp(xemis)∼ ln(µemis, 6emis), and use thesesamples as members of the ensemble. These are then used asmonthly emission input to CAM ensemble forecast cycle.
As an example, we show in Fig. 2 a spatial distributionof diag(6emis)
1/2 for April 2006. We note that in additionto the variability mainly coming from estimates in the in-verse analyses, which is about 50% of the mean in mostregions, there is also a large variability apparent in regionsof frequent biomass burning consistent with our current un-derstanding. We acknowledge however that this empirically-based methodology is limited in various aspects especiallyas to its applicability to other emission and modeling studies.We view this approach simply as an interim solution to pro-vide realistic estimates of direct emission ensembles for COensemble-based data assimilation.
For indirect emissions, which consist of CO sourcesfrom chemical oxidation of non-methane hydrocarbons and
Atmos. Chem. Phys., 7, 5695–5710, 2007 www.atmos-chem-phys.net/7/5695/2007/

A. F. Arellano Jr. et al.: Ensemble-based global chemical data assimilation 5699
methane, we draw samples of the distributionp(xchem) as-suming a log-normal distribution with meanµchem fromMOZART4 full chemistry simulation and a covariance6chemwhose square root of its diagonal elements is equal to10% ofµchem. This is a simplification of the bulk uncertaintyassociated with this type of source, which certainly consistsof various precursors that are non-linearly related and diffi-cult to quantify.
2.3.3 Ensemble of initial CO distribution
The ensembles are generated using the ensembles of CAMinitial conditions (Sect. 2.3.1) and emissions (Sect. 2.3.2).We start off by using a single CO initial condition from aprevious MOZART4 simulation. We allow the CO in themodel to be propagated forward in time, to gain sufficientvariance, as each member of the ensemble of CAM initialconditions are integrated for two weeks. The integration in-cludes a randomly assigned CAM3 emission from membersof the emission ensembles. As such, the CO states after spin-up exhibit an equilibrated variability due to coupled pertur-bations of the dynamical states and emissions. We used thisensemble of CO states as our ensemble of CO initial condi-tions. A sample of the mean and spread of the ensemble areshown in Fig. 3. As can be expected, the variability of COis large in regions where there is a strong direct CO source(i.e. east Asia, northern Africa) and also in regions wheretransport can have significant impact (i.e. Pacific basin). Wealso find that the variability of CO has equilibrated across allregions after about 5 to 7 days.
2.4 Observations
The current DART/CAM global system has the ability toassimilate both meteorological and chemical observations.For the system’s initial development and evaluation, we fo-cus on assimilating a subset of available meteorological datacurrently used in NWP centers and satellite-derived CO re-trievals from the MOPITT instrument. The following sec-tions briefly describe these observations within the contextof this assimilation system.
2.4.1 Meteorological observations
We use the meteorological observations processed at Na-tional Centers for Environmental Prediction (NCEP) (http://dss.ucar.edu/datasets/ds351.0). These data are taken from ra-diosondes, pibals and aircraft reports collected by the GlobalTelecommunications System (GTS), and from satellite dataprocessed at National Environmental Satellite, Data and In-formation Service (NESDIS). These are used as primary in-put to the NCEP Global Data Assimilation System (GDAS)for producing operational forecasts and final meteorologicalanalyses. Here, we use a subset of these data including ob-servations of temperature (T ) from radiosondes and observa-tions of horizontal wind velocities (U , V ) from radiosondes
CO (mean) CO (spread)
Fig. 3. Ensemble-mean (left panel) and ensemble-spread (rightpanel) of initial conditions of CAM3 CO in ppbv at 500 hPa for1 April 2006.
and cloud drift analysis (or satwind). We selected this smallsubset to simplify our evaluation of the system performance.Also, this particular setup for DART/CAM only assimilatesobservations of a subset of meteorological state variables (i.e.T , U , V ). However, it uses these observations to influenceother model state variables such as surface pressure. Furtherdetails of the assimilation setup are discussed in Sect. 3.
We use a limited quality control on top of NCEP data pro-tocol for these observations. In particular, we limit obser-vations below 150 hPa and observations with values withinthree standard deviations from the expected observations de-rived from the model. We also assign associated observationerrors based on reported instrument uncertainties (i.e. on av-erage,∼3–4 m/s for satwind,∼1–2 m/s for radiosonde windand∼0.8 K for radiosonde temperature).
2.4.2 MOPITT CO retrievals
We use the satellite-derived CO observations from MO-PITT satellite instrument on board the NASA Terra satel-lite (http://mopitt.eos.ucar.edu/mopitt). It has a horizontalresolution (in nadir view) of about 22×22 km2 and offersnear-global coverage within 3-5 days. The MOPITT instru-ment provides CO retrieved profiles based on measured radi-ances in a 4.7µm thermal channel for cloud-free pixels andpixels covered by low clouds. The reported profiles nomi-nally represent 7 vertical levels in the troposphere (surface,850, 700, 500, 350, 250, 150 hPa). However, these pro-files are strongly correlated, exhibiting vertical sensitivitieswhich are limited only within the free troposphere (Deeteret al., 2004). For our purposes, we use a subset of theCO observations by only using CO retrievals having highmeasurement sensitivity and physically realistic mixing ra-tios. In particular, we use MOPITT v3 Level 2 700 hPa re-trievals having less than 50% retrieval a priori contributionand mixing ratios greater than 30 ppbv. Our quality control,which is mainly based on MOPITT data quality statement(http://mopitt.eos.ucar.edu/mopitt/data), ensures that we useCO observations that are reasonably representative of the trueCO states. We use the retrieval associated averaging kernel,
www.atmos-chem-phys.net/7/5695/2007/ Atmos. Chem. Phys., 7, 5695–5710, 2007

5700 A. F. Arellano Jr. et al.: Ensemble-based global chemical data assimilation
5
10R
MS
E
R adWind, m/s
3
6R adT emp, K
4
8S atWind, m/s
April 1 to May 1 April 1 to May 1 April 1 to May 10 0 0
0 5 10
0
500
1000
Pre
ss
ure
(h
Pa
)
R MS E
R adWind, m/s
0 1 2R MS E
R adT emp, K
0 5R MS E
S atWind, m/s
700 hP a 700 hP a700 hP a
Fig. 4. Global root-mean-square error of prior (black) and pos-terior (red) ensemble-mean relative to observations of radiosondehorizontal wind velocity, radiosonde temperature and satwind hori-zontal wind velocity for the entire assimilation period (April 2006).Lower panels correspond to global RMSEs in the vertical using allobservations over the same period.
which is a measure of the vertical sensitivity of the measure-ment, as an additional observation operator in the assimila-tion system. We note that the broad averaging kernel ex-hibited by MOPITT retrievals implies assimilating a partialCO column observation instead of a typical point observation(see also Sect. 4). Although we recognize that our selectioncriteria limit the full use of available information provided byMOPITT, again we use this subset to simplify our evaluationof the system. The selected CO retrievals are assumed in thiswork to be independent and unbiased with observation er-ror of 10% of the CO retrieved mixing ratio (Emmons et al.,2004). The unbiased assumption is verified and discussedlater in this paper (Sect. 4.2).
3 Assimilation experiments
Two sets of assimilation experiments are carried out to testand evaluate the performance of DART/CAM system. First,we conduct a reference CO simulation (REFSIM), consistingof a 20-member ensemble, which sequentially assimilatesmeteorological observations for the whole month of April2006. This simulation is similar to a free-running offlineGCTM simulation of CO, which may be driven by either as-similated meteorology (i.e. Global Modeling and Assimila-tion Office, GMAO) or reanalysis meteorology (i.e. NCEPor European Centre for Medium-Range Weather Forecast,ECMWF). The second experiment (COASSIM) involves a20-member ensemble simulation of CO assimilating bothmeteorological observations and MOPITT CO retrievals overthe same period. In combination, these two experiments pro-
vide insights on how well tracer transport is represented inthe model.
As mentioned in Sect. 2.1, the current system is configuredso that the meteorological observations of temperature andwind velocities statistically influence the model state vari-ables, namely, surface pressure, temperature, horizontal ve-locity, specific humidity, cloud ice and cloud water but notCO. In contrast, the CO observations only statistically influ-ence the CO state variable. In a statistical sense, it is pos-sible that the CO observations can influence the other statevariables and that the meteorological observations can im-pact the CO state. However, this EnKF feature is not appliedin the present experiments.
In addition to localizing the impact of observations to asubset of state variables, a physically-based localization isalso implemented for all types of observations. The observa-tional impact is localized by multiplying a correlation func-tion (from Gaspari and Cohn, 1999) to the flow-dependentcovariances between the prior state variables and observa-tion variables. We use a half-width of∼1200 km in the hori-zontal component of the correlation function for all types ofobservations. In the vertical, we use∼2 km for all types ofobservations except MOPITT CO. Assimilation of MOPITTCO presents a particular difficulty since the retrieved profilesexhibit longer vertical length scales (2–3 km) than typicalvertical length scales of DART/CAM CO (∼1 km). And so,we adjust the calculated vertical correlation distance betweenthe observed CO and the CO state variable such that the ef-fective correlation function exhibits broader vertical lengthscales comparable to MOPITT. By effectively broadening thevertical localization, this adjustment only partially accountsfor the scale mismatch between a partial column observationand the model. A more appropriate transformation shouldbe used in future assimilation of this type of observation tofully account for the apparent scale mismatch. Details onthe scale mismatch between satellite retrieved profiles andglobal chemical transport models will be discussed in a sep-arate paper (Arellano, A. F. and Hess, P. G.: Ensemble-basedestimates of CO sensitivity during INTEX-B field mission,manuscript in preparation).
4 Results and discussions
4.1 Summary statistics of assimilation experiments
Shown in Fig. 4 are global comparisons of the meteorologi-cal observations and the expected observations of model vari-ables, represented as ensemble means of the forecast (prior)and analysis (posterior). Figure 5 corresponds to the en-semble spreads or standard deviations (both prior and pos-terior) of the model variables across the 20-member ensem-bles. These results correspond to both assimilation experi-ments (REFSIM and COASSIM) as the two are identical intheir configuration for assimilating meteorological observa-
Atmos. Chem. Phys., 7, 5695–5710, 2007 www.atmos-chem-phys.net/7/5695/2007/

A. F. Arellano Jr. et al.: Ensemble-based global chemical data assimilation 5701
5
10
April 1 to May 1
En
s S
pre
ad
R adWind, m/s
3
6
April 1 to May 1
R adT emp, C
4
8
April 1 to May 1
S atWind, m/s
0 0 0
Fig. 5. Corresponding global prior (black) and posterior (red)ensemble-spread of expected observations for radiosonde horizon-tal wind velocity, radiosonde temperature and satwind horizontalwind velocity for the entire assimilation period (April 2006).
tions. The plots in Fig. 4 show that the predicted temperatureand horizontal velocities are significantly improved in termsof root-mean-square errors (RMSEs) and bias relative to ra-diosonde and satwind observations used in the assimilation.In fact, the RMSEs for both model variables are reasonablyclose to the error range of radiosonde and satwind observa-tions, pointing to low errors in the assimilation. This is alsoevident in the ensemble spread shown in Fig. 5, which alsoshows rapid reduction over the first few assimilation cycles.However, the error estimate, which is represented here as theensemble spread, is less than the RMSE relative to observa-tions. This appears to suggest an insufficient variance of theensemble and an underestimation of the uncertainty of themodeled states. Even so, it is clear from these results that themean of the system rapidly converges to observed tempera-ture and wind velocities within 2–3 days of assimilation. Re-gional comparisons (not shown here) suggest a convergencerate in the data-dense Northern Hemisphere region of about2 days and about 5 days in the Southern Hemisphere region.
Assimilating MOPITT CO retrievals in COASSIM experi-ment also show similar improvements in terms of RMSE andbias (Fig. 6, left panel). Globally, the posterior ensemblemean of expected CO observations has an RMSE of about11 ppbv and bias of about 1–2 ppbv relative to MOPITT re-trievals. The resulting ensemble spread for CO (Fig. 6, rightpanel) has also dropped significantly during the first fewassimilation cycles indicating that information from the re-trievals are being integrated effectively into the model space.The rate of model convergence to observed CO is longer thanthe convergence of meteorological variables to observed me-teorology due to the larger variability of CO over its sourceregions and the longer period for the MOPITT instrumentto achieve near-global coverage (∼3–5 days). The nature ofMOPITT retrievals, which exhibit broader vertical structuresthan typical point observations, potentially slows down theconvergence as well.
4.2 Verification with other datasets
Results of the assimilation experiments are verified using twomain datasets. First, the assimilated meteorological variables
11
22MOP IT T C O, ppbv
11
22
April 1 to May 1
MOP IT T C O, ppbv
April 1 to May 1 0 0
RM
SE
En
s S
pre
ad
Fig. 6. Global RMSE of prior (black) and posterior (red) ensemble-mean CO relative to MOPITT CO (left panel) and their correspond-ing ensemble-spread (right panel) for the entire assimilation period(April 2006). Global bias relative to MOPITT is∼2.14 ppbv forprior ensemble-mean and∼1.55 ppbv for posterior ensemble-mean.
are compared for the same time period with the analysisof the NCEP Global Forecast System (GFS) product. Thisdataset is currently used as input meteorology by several of-fline GCTMs (e.g. MOZART4). This comparison providesa means of assessing the ability of DART/CAM assimilationsystem to represent key components of tracer transport in aGCTM. It is recognized however that this dataset does notserve as an independent verification since the NCEP GFSuses similar observational dataset (e.g., but with additionaldata) in its assimilation system.
The modeled CO states are compared with an independentCO dataset from the second phase of the NASA INTEX-Bfield mission, which was conducted during Spring of 2006(17 April–15 May). This intensive field campaign aimed atsampling chemical (pollution) outflow from Asia and at as-sessing its long-range transport across the Pacific and impactover North America. This is an especially good opportunityto evaluate the model performance of the DART/CAM sys-tem and its potential for chemical weather forecasting. Ourverification focuses on the April campaign period for NCARC-130 flights over the northeast Pacific basin and for NASADC-8 flights out of Hawaii. Shown in Fig. 7 are the flighttracks for C-130 and DC-8 aircrafts for this period. Bothaircrafts carried CO instrumentations, in particular an aero-laser fast-response carbon monoxide analyser on board C-130 (by T. Campos) and a Differential Absorption CO Mea-surement (DACOM) spectrometer system on board DC-8 (byG. Sachse).
4.2.1 Meteorological variables
As shown in Fig. 8, the ensemble-mean analyses of horizon-tal wind velocities averaged over the month of April 2006are remarkably similar to the NCEP GFS product. The plotsshow a high degree of similarity both in terms of magnitudeand spatial structure demonstrating a decent performanceof DART/CAM assimilation system relative to GFS, givenalso that only a subset of NCEP observations was used inDART/CAM assimilation. The similarity is particularly clearin the Northern Hemisphere where the data is dense. Differ-
www.atmos-chem-phys.net/7/5695/2007/ Atmos. Chem. Phys., 7, 5695–5710, 2007

5702 A. F. Arellano Jr. et al.: Ensemble-based global chemical data assimilation
120E 160E 160W 120W
20N
40N
60N
500 1000hP a
120E 160E 160W 120W
20N
40N
60N
500 1000hP a
C -130 F light 17-22
DC -8 F light 10-14
Fig. 7. INTEX-B flight tracks for NSF/NCAR C-130 and for NASADC-8 during 17 April to 1 May 2006 campaign period. Colors rep-resent the corresponding flight altitudes in hPa.
ences can be seen mostly in the Southern Hemisphere, es-pecially in the tropical Pacific, coastal regions in India, cen-tral Africa and in the polar region. The difference can beattributed to the difference in the model used for the assim-ilation system and the larger density of data (e.g. satellite)in the Southern Hemisphere used in GFS than in this work.Nonetheless, the comparison provides confidence in the fi-delity of DART/CAM to represent realistic transport driversin the global model.
4.2.2 CO
Our system verification for CO is summarized in Fig. 9a.These are Taylor diagrams showing the distance of modeledCO from observed CO defined in terms of correlation (R),root-mean-square error (RMSE) and bias. Results are shownfor both the experiment with MOPITT assimilation (COAS-SIM) and without MOPITT assimilation (REFSIM). Basedon Taylor (2001), a typical RMSE metric (E) can be decom-posed into two orthogonal components, a bias term (E) anda pattern RMS difference (E′). That is,
E2= E
2+ E′2 (1)
where
E′2= σ 2
f + σ 2r − 2σf σrR (2)
such thatσf andσr correspond to the standard deviation ofthe modeled CO concentration and the observed CO concen-tration, respectively; andR corresponds to the correlation be-tween the modeled and observed CO concentration. We can
DART/CAM U at 700 hPa NCEP/GFS U at 700 hPa DIFFERENCE
DART/CAM U Zonal Mean NCEP/GFS U Zonal Mean DIFFERENCE
Pres
sure
Pres
sure
Pres
sure
Fig. 8a. Global comparison of April 2006 mean horizontalwind component (U ) in m/s from DART/CAM assimilation andNCEP/GFS forecast/analysis product (regridded to 2◦
×2.5◦). Theupper panels correspond to 700 hPa distribution while the lowerpanels correspond to zonal distribution (vertical axis in hPa).
DART/CAM V at 700 hPa NCEP/GFS V at 700 hPa DIFFERENCE
DART/CAM V Meridional Mean NCEP/GFS V Meridional Mean DIFFERENCE
Pres
sure
Pres
sure
Pres
sure
Fig. 8b. Global comparison of April 2006 mean horizontalwind component (V ) in m/s from DART/CAM assimilation andNCEP/GFS forecast/analysis product (regridded to 2◦
×2.5◦). Theupper panels correspond to 700 hPa distribution while the lowerpanels correspond to meridional distribution (vertical axis in hPa).
then construct a diagram which shows these relationships,by plottingσf andσr as distances from the origin in a polargraph (see Fig. 9b), with the angle represented as the arcco-sine ofR. The shortest distance between the modeled andobserved quantity represents the pattern RMS difference (orunbiased RMSE). We can also extend this to indicate over-all means, by attaching to the plotted model quantity, a linesegment that is perpendicular to the line defined byE′ and
Atmos. Chem. Phys., 7, 5695–5710, 2007 www.atmos-chem-phys.net/7/5695/2007/

A. F. Arellano Jr. et al.: Ensemble-based global chemical data assimilation 5703
0 9 19 29 39 48
1.00
0.99
0.90
0.80
0.60
0.40
0.200.00
0.2
0.4
0.4
0.6
0.6
0.8
0.8
0.8 1
1
1.2
0 10 21 31 42 53
1.00
0.99
0.90
0.80
0.60
0.40
0.200.00
0.2
0.2
0.4
0.4
0.6
0.6
0.8
0.8
0.8
11
1.2
σ, ppbv
R
σ, ppbv
R
C-130 April 17 to May 1 DC-8 April 17 to May 1
Fig. 9a. DART/CAM model skills relative to INTEX-B flight ob-servations (gray). The blue dots represent the model skills foreach ensemble member of DART/CAM with MOPITT assimila-tion (COASSIM) while red dots correspond to DART/CAM withoutMOPITT assimilation (REFSIM). Large filled circles correspond toensemble-mean of analyses with the unfilled circles representing thetotal RMSE (see Fig. 9b).
whose distance is equal toE. The distance from the obsquantity to the extended model quantity is then equal toE.A best fit to observations is typically interpreted to exhibitthe smallest pattern difference. However, we can also definea skill score which summarizes the relationship between themodeled and observed CO concentrations. Here, we defineda skill S as:
S =4(1 + R)4(
σf + 1/σf
)2(1 + R0)
4(3)
whereσf is the ratio ofσf andσr , andR0 is the maximumpotentially realizable correlation, assumed here to be 0.90based on assimilated CO and MOPITT comparisons. Thisskill score, which is based on Eq. (5) of Taylor (2001), issuperimposed as contours in Fig. 9a. Unlike typical skillscores, this skill score places more emphasis on modeled COthat is highly correlated with observations and that exhibitsbetter simulation of the pattern difference. The skill ap-proaches unity asσf approaches toσr and asR approaches toR0. It is also interpreted to decrease with increasing RMSEbut with additional penalty for low correlation and low modelvariability. Note that the skill also depends on maximumrealizable correlationR0, which in this case, is assumed tobe lower than a perfect correlation of 1. This means that aperfect skill score (or most skillful model) will have a rangefrom 1 to about 1.2 since it is relax towards achieving a cor-relation ofR0 as well.
It is clear from the diagrams in Fig. 9a that the assimi-lation of MOPITT retrievals improves the pattern statisticsin modeled CO when compared to both C-130 and DC-8flight observations. The ensemble mean of REFSIM CO hasa correlation of 0.63 and 0.62 for C-130 and DC-8 respec-tively, while the COASSIM CO shows an improved correla-tion of 0.72 (C-130) and 0.68 (DC-8). In terms of model
Fig. 9b. Taylor diagram representation of correlation (R), RMSEand bias of modeled CO relative to observation (based from Taylor,2001).
skill, COASSIM shows a skill of about 0.6 in contrast toREFSIM which has a skill of about 0.2 to 0.4. This improve-ment is attributed to the increase in modeled CO variabilityand correlation, and is significant at 99% confidence giventhe spread of the model skill for all ensemble members.
Also apparent from the Taylor diagrams is the increasein bias on the COASSIM CO relative to REFSIM CO. Asnoted in Sect. 4.1, the assimilation of MOPITT retrievals inDART/CAM, which has a global bias of about 1–2 ppbv rela-tive to MOPITT, implies that the assimilated CO is very closeto MOPITT CO and exhibits low error associated with the as-similation. This suggests that the assimilated CO is a goodsurrogate for MOPITT. The bias observed relative to INTEX-B CO therefore is primarily due to the bias of MOPITT re-trievals relative to INTEX-B. Such comparison with inde-pendent observations demonstrates the utility of an assim-ilation system in validating and comparing non-coincidentdatasets and measurements with complex observation oper-ators. The positive bias observed in MOPITT is approxi-mately 23–27 ppbv for C-130 CO and 11–14 ppbv for DC-8CO. Based on two CO data inter-comparisons conducted dur-ing the 2nd phase of INTEX-B, it is possible that differencesin the bias between C-130 and DC-8 observed by the assim-ilation can be mainly attributed to instrument discrepancieson board the two aircrafts. The DC-8 CO appears to be 5-10ppbv higher than C-130 CO. That is, the ratio of DC-8 COversus C-130 CO is observed to be 1.08 from the two inter-comparison analyses. The bias estimates are nonetheless inreasonable agreement with past and present MOPITT valida-tions, which also report a positive bias in MOPITT retrievalsof about 7–14% or 7–18 ppbv at 700 hPa (e.g. Emmons etal., 2004; Emmons et al., 2007). This apparent bias in theMOPITT retrievals with respect to this and other validationdata is being investigated by the NCAR MOPITT team. Itis expected that the next data reprocessing (version 4) whichwill include several retrieval enhancements will greatly re-duce this discrepancy. Since the model verification is lim-ited to the INTEX-B domain (Fig. 7), it is complicated to
www.atmos-chem-phys.net/7/5695/2007/ Atmos. Chem. Phys., 7, 5695–5710, 2007
5704 A. F. Arellano Jr. et al.: Ensemble-based global chemical data assimilation
0 200 400 600 800 1000 1200 1400 1600 1800
50
100
150
200
250
0 500 1000 1500 2000 2500
50
100
150
200
250
1-minute flight observation points
1-minute flight observation points
C-130 CO
DC-8 CO
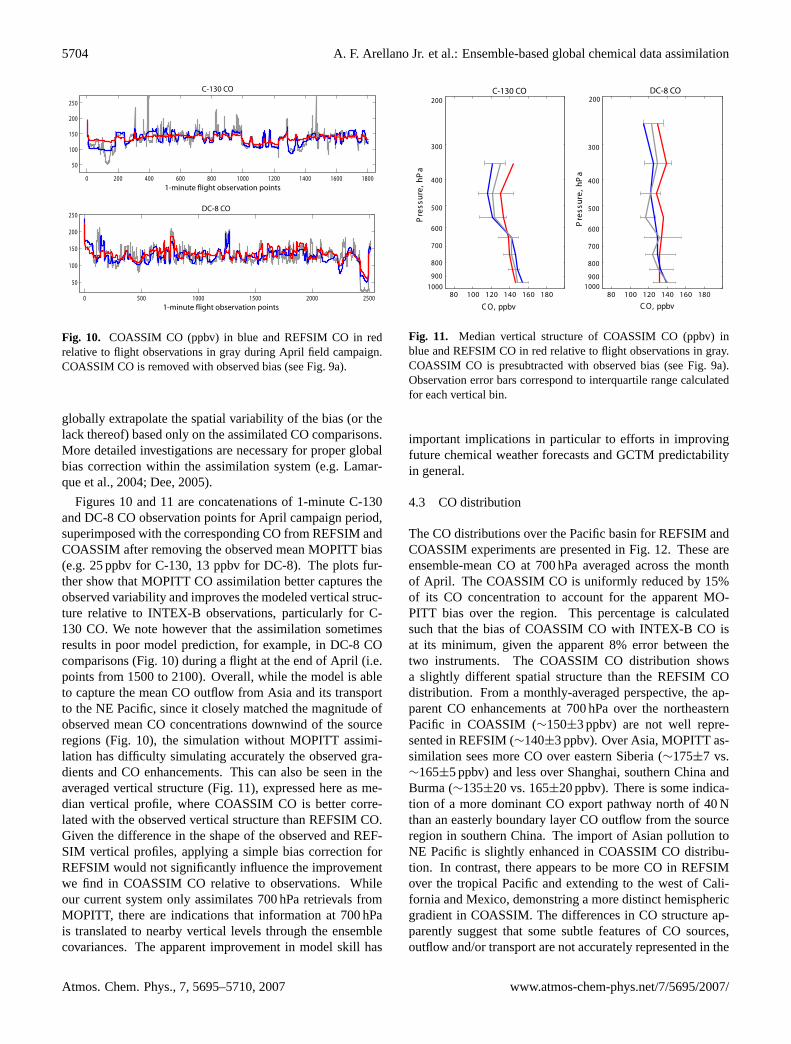
Fig. 10. COASSIM CO (ppbv) in blue and REFSIM CO in redrelative to flight observations in gray during April field campaign.COASSIM CO is removed with observed bias (see Fig. 9a).
globally extrapolate the spatial variability of the bias (or thelack thereof) based only on the assimilated CO comparisons.More detailed investigations are necessary for proper globalbias correction within the assimilation system (e.g. Lamar-que et al., 2004; Dee, 2005).
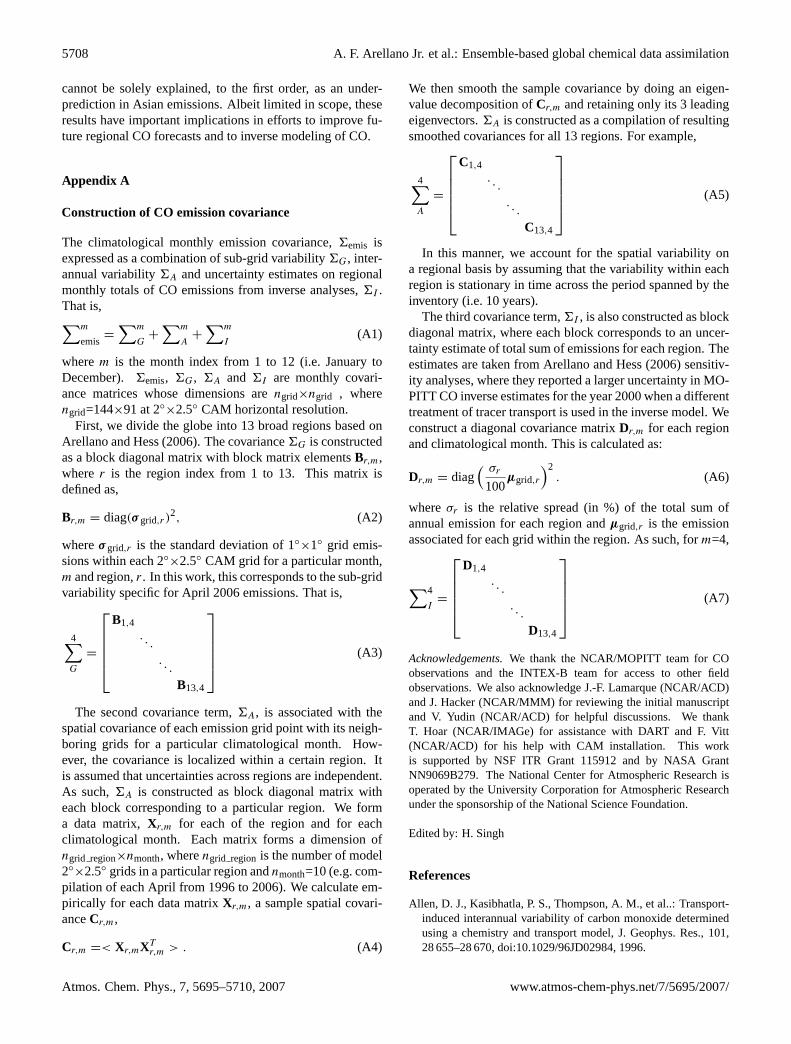
Figures 10 and 11 are concatenations of 1-minute C-130and DC-8 CO observation points for April campaign period,superimposed with the corresponding CO from REFSIM andCOASSIM after removing the observed mean MOPITT bias(e.g. 25 ppbv for C-130, 13 ppbv for DC-8). The plots fur-ther show that MOPITT CO assimilation better captures theobserved variability and improves the modeled vertical struc-ture relative to INTEX-B observations, particularly for C-130 CO. We note however that the assimilation sometimesresults in poor model prediction, for example, in DC-8 COcomparisons (Fig. 10) during a flight at the end of April (i.e.points from 1500 to 2100). Overall, while the model is ableto capture the mean CO outflow from Asia and its transportto the NE Pacific, since it closely matched the magnitude ofobserved mean CO concentrations downwind of the sourceregions (Fig. 10), the simulation without MOPITT assimi-lation has difficulty simulating accurately the observed gra-dients and CO enhancements. This can also be seen in theaveraged vertical structure (Fig. 11), expressed here as me-dian vertical profile, where COASSIM CO is better corre-lated with the observed vertical structure than REFSIM CO.Given the difference in the shape of the observed and REF-SIM vertical profiles, applying a simple bias correction forREFSIM would not significantly influence the improvementwe find in COASSIM CO relative to observations. Whileour current system only assimilates 700 hPa retrievals fromMOPITT, there are indications that information at 700 hPais translated to nearby vertical levels through the ensemblecovariances. The apparent improvement in model skill has
80 100 120 140 160 180
Pre
ssu
re,
hP
a
80 100 120 140 160 180
Pre
ssu
re,
hP
a
1000 1000
200 200
C O, ppbv C O, ppbv
C-130 CO DC-8 CO
900
800
700
600
500
400
300
900
800
700
600
500
400
300
Fig. 11. Median vertical structure of COASSIM CO (ppbv) inblue and REFSIM CO in red relative to flight observations in gray.COASSIM CO is presubtracted with observed bias (see Fig. 9a).Observation error bars correspond to interquartile range calculatedfor each vertical bin.
important implications in particular to efforts in improvingfuture chemical weather forecasts and GCTM predictabilityin general.
4.3 CO distribution
The CO distributions over the Pacific basin for REFSIM andCOASSIM experiments are presented in Fig. 12. These areensemble-mean CO at 700 hPa averaged across the monthof April. The COASSIM CO is uniformly reduced by 15%of its CO concentration to account for the apparent MO-PITT bias over the region. This percentage is calculatedsuch that the bias of COASSIM CO with INTEX-B CO isat its minimum, given the apparent 8% error between thetwo instruments. The COASSIM CO distribution showsa slightly different spatial structure than the REFSIM COdistribution. From a monthly-averaged perspective, the ap-parent CO enhancements at 700 hPa over the northeasternPacific in COASSIM (∼150±3 ppbv) are not well repre-sented in REFSIM (∼140±3 ppbv). Over Asia, MOPITT as-similation sees more CO over eastern Siberia (∼175±7 vs.∼165±5 ppbv) and less over Shanghai, southern China andBurma (∼135±20 vs. 165±20 ppbv). There is some indica-tion of a more dominant CO export pathway north of 40 Nthan an easterly boundary layer CO outflow from the sourceregion in southern China. The import of Asian pollution toNE Pacific is slightly enhanced in COASSIM CO distribu-tion. In contrast, there appears to be more CO in REFSIMover the tropical Pacific and extending to the west of Cali-fornia and Mexico, demonstring a more distinct hemisphericgradient in COASSIM. The differences in CO structure ap-parently suggest that some subtle features of CO sources,outflow and/or transport are not accurately represented in the
Atmos. Chem. Phys., 7, 5695–5710, 2007 www.atmos-chem-phys.net/7/5695/2007/

A. F. Arellano Jr. et al.: Ensemble-based global chemical data assimilation 5705
Fig. 12. Mean CO distribution (in ppbv) at 700 hPa over theINTEX-B domain as depicted in DART/CAM analyses (top panel)REFSIM, (middle panel) COASSIM with observed MOPITT biasremoved and (bottom panel) difference between REFSIM andCOASSIM.
model. To some extent, this supports the previous results thatwhile REFSIM reasonably simulates the large-scale features,it has difficulty capturing the CO variability and gradientsobserved in INTEX-B. In part, this can be attributed to thecoarse resolution of the model where the observed variabil-ity may possibly be within the model sub-grid scales. Theassimilation however is able to compensate for the lack ofvariability (and inherent model deficiencies) and hence pro-vides a good source of model diagnosis.
4.4 Illustration of CO forecast sensitivity
Short-term regional forecasts require an even more accuraterepresentation, particularly an initial condition that is closeto observations. Representing the short-term variability ontop of the mean flow patterns is critical in regional forecasts.This is true in forecasting pollution from Asia, which canbe episodically transported to the NE Pacific within the timescales of 5 to 7 days depending on prevailing transport con-
Fig. 13.Comparison of DART/CAM CO 3-day forecasts (top panel:forecast in ppbv at 700 hPa valid for 20 April 2006 00:00 UTCfrom a free-running CO simulation (REFSIM), middle panel: fore-cast initialized with MOPITT-constrained CO at 17 April 200600:00 UTC, bottom panel: difference between the two forecasts).
ditions (Yienger, 2000; Jaffe et al., 1999). This highlights therole of initial condition in providing a fairly reliable forecast.In Fig. 13, we demonstrate the utility of the assimilation sys-tem to provide observationally-constrained CO initial condi-tions for CO forecasts. In addition to the two assimilation ex-periments, we conducted a 3-day forecast-mode experimentvalid for 20 April 2006 00:00 UTC, which was initializedwith bias-corrected COASSIM CO (see Sect. 4.3) at 17 April2006 00:00 UTC. The difference shown in Fig. 13 is a com-parison between the 3-day forecasts at 700 hPa from REF-SIM and the 3-day forecast at the same level using COAS-SIM initial condition. Differences of about 20–40 ppbv areevident in regions of Asian outflow and along the frontal sys-tems across the Pacific. The spatial patterns depicted in thefigure illustrate the key role of observationally-constrainedinitial condition in producing accurate forecasts. This mayhave an effect on efforts like mission flight planning wherethe goal is to correctly track enhanced plumes of pollution.
www.atmos-chem-phys.net/7/5695/2007/ Atmos. Chem. Phys., 7, 5695–5710, 2007

5706 A. F. Arellano Jr. et al.: Ensemble-based global chemical data assimilation
Fig. 14. Ensemble-spread (in ppbv) of DART/CAM CO at 700 hPawithin the INTEX-B domain averaged between 6 April to 1 May2006. The upper and lower panels correspond respectively to en-semble spread from REFSIM (top panel) and COASSIM analyses(bottom panel).
4.5 Estimates of model uncertainties
4.5.1 Ensemble spread
The ensemble-based data assimilation system provides aprobabilistic characterization of the CO state estimates.Here, we show the ensemble spread of modeled CO for REF-SIM and COASSIM. Taken as the standard deviation of thepredicted CO concentrations across the 20 ensemble mem-bers, the ensemble spread can be considered as a measureof uncertainty on the estimate of the CO states (or on howwell the ensemble members agree on the CO forecast). Aspresented in Fig. 14, the ensemble spread of REFSIM COis mainly characterized by a large spread in two source re-gions. This is most likely influenced by our large error es-timates (>50%) of biomass burning emissions in SoutheastAsia and Central America (see Fig. 2) rather than the spreaddue to perturbations in meteorology. We expect this since thespread in meteorology is significantly reduced in the meteo-rological assimilation component of CDAS while the spreadin emissions is fixed during the assimilation cycles and isnot presently constrained. We see changes in the structureon the ensemble spread of COASSIM, with clear indicationsof transport-related uncertainties, such as an outflow east ofChina and Japan and a regional circulation over southeast-ern Siberia. Although not shown here, the flow-dependentpatterns of variability as estimated from the mean ensem-
Fig. 15. Mean spatial distribution of analysis increments (PosteriorCO – Prior CO, in ppbv) at 700 hPa averaged between 6 April to 1May 2006.
ble spread are consistent with the variability of the assimi-lated CO in the region as estimated from the standard devi-ation of ensemble-mean CO across the time period. To anextent, the COASSIM ensemble spread is an improvementin representing the structure of the uncertainties in the COdistribution since it appears to represent additional featuresother than emission uncertainties. However, when comparedto the model RMSE relative to MOPITT (Fig. 6), the poste-rior ensemble spread still appears to be under-estimated espe-cially in the downwind region, where the variability is mostlytransport-induced. Such differences in the structure of theensemble spread between COASSIM and REFSIM demon-strate the spatial variability of the error estimates and pointto locations were the errors are apparently too small. Forthis reason, a more appropriate characterization of the uncer-tainties as estimated from the ensemble approach is to takeadvantage of the structure by conducting an analysis of thecorrelation in conjunction with an analysis of the variance.
4.5.2 Mean analysis increments
The assimilation system can also be used to diagnose modeland/or observation errors. Following Dee (2005), we use thedifference of CO analysis and forecast (or increments) to rep-resent short-term systematic errors in the model. The adjust-ments in the CO forecast for each 6-hour assimilation cyclecan be assumed to be mostly attributed to errors in the model.As previously discussed in Sect. 4.1, the errors from the as-similation methodology are relatively small. If it can be as-sumed that the assimilated CO has already converged to MO-PITT CO after several assimilation cycles, then, the mannerin which the systematic CO short-term forecast diverges fromMOPITT CO largely relates to errors in the model. To illus-trate, we took the 6-hourly ensemble-mean forecast CO andthe analysis CO in the observation space and averaged overthe INTEX-B domain (from equator to 65N latitude, 90 E to90 W longitude). The resulting time series of the spatially-averaged observation increment describes the evolution ofthe forecast and analysis errors relative to assimilated MO-
Atmos. Chem. Phys., 7, 5695–5710, 2007 www.atmos-chem-phys.net/7/5695/2007/

A. F. Arellano Jr. et al.: Ensemble-based global chemical data assimilation 5707
PITT retrievals. Similar to the global time series shown onthe left panel of Fig. 6, the mean forecast RMSEs are sys-tematically larger than the analysis errors. This differencerepresents the adjustment made in the analysis step to bringthe modeled CO closer to observations. We can also takethe temporal mean of these increments and look at its spa-tial distribution to explore characteristic regions where themodeled CO is frequently adjusted. Figure 15 shows the spa-tial distribution of the mean adjustments about the 6 April–1May 2006 period. We specifically remove the first 5 daysof assimilation to allow for spin-up in the assimilation. Asshown, the model appears to overpredict in source regions(i.e. China and east of Asia) and underpredict in downwindregions (i.e. northeastern Pacific across the C-130 and DC-8flight coverage). The mean adjustments are consistent withresults discussed in the previous sections (e.g. Fig. 12). Ad-ditionally, this model error characteristic has been reported inother GCTM simulations. In particular, some offline GCTMresults consistently report a negative bias in CO concentra-tions during Spring over Hawaii and Midway (e.g. Bey et al.,2001; Liang et al., 2004; Arellano et al., 2004). However,increasing Asian emissions to account for this bias degradesthe model further over Asia. We note in particular that theensemble-mean emissions of Asian CO (and other regionslike Europe) used in DART/CAM have already been opti-mized following Petron et al. (2004). The spatial structureprovides further evidence of a GCTM related error, whichcan not be readily explained by emissions alone. It is a bulkerror that appears to be a combination of errors due to trans-port, emissions and/or chemistry. It is possible that the mod-eled CO is transported slightly differently from what is ob-served by MOPITT and/or the modeled chemical productionof CO from hydrocarbon oxidation during transport is under-estimated. While further analysis is necessary to identify thesources of this error, knowledge of model error is useful inproviding a consistent inverse analysis. Without a reason-able model error estimate, results of inverse analyses will belargely sensitive to the choice of the observation domain andthe proximity of the observations to the source location ofinterest.
5 Conclusions
We have introduced a new global chemical data assimilationsystem based on an ensemble Kalman filter approach. Thesystem interfaces CAM3 global atmosphere model with sim-plified chemistry into the DART ensemble framework. Suchan ensemble-based data assimilation system is appealing forstudies in global chemical transport as it offers the flexibil-ity and efficiency to assimilate measurements with variousscales and of various chemical species. This is especiallytrue, at present, in light of the availability of near-global andlong-term chemical observations.
One of the goals of this work is to demonstrate the utilityof the system to studies related to chemical weather fore-casts, focusing initially on assessing its model performanceon Asian CO outflow and its episodic transport to NorthAmerica during the INTEX-B field mission in April 2006.We apply the assimilation system in constraining the globaltropospheric CO distribution within CAM3, by jointly as-similating observations of temperature and horizontal windvelocity as well as satellite CO retrievals from the MOPITTsatellite instrument. Since the variability of CO is mainlyinduced by transport and emissions, a reasonable ensemblerepresentation of CO is generated first. This includes rep-resenting an ensemble of initial meteorological conditionsin CAM3, based on long-term climatological CAM3 sim-ulations, together with an ensemble of total CO emissions,mainly based on our current estimates of emission uncertain-ties. The DART/CAM assimilation performance is verifiedusing independent CO observations from C-130 and DC-8flights during the field campaign. Assimilation results showthat the current system converges to the observed MOPITTCO distribution within the first 5 days of assimilation, con-sistent with the duration of MOPITT obtaining near-globalcoverage. The DART/CAM analyzed meteorology also ap-pears to be very similar in magnitude and structure to opera-tional NCEP GFS analyses. Significant improvements in themodel skill are evident with MOPITT assimilation (COAS-SIM), notably capturing the observed CO variability and im-proving the correlation between modeled CO and INTEX-Bflight observations. We note however that the present modelrepresentation of CO with no MOPITT assimilation (REF-SIM) generally captures the large-scale CO outflow. Thiscan be mostly attributed to optimized estimates of Asian an-thropogenic emissions. Also, the activity of biomass burningin the region, which largely accounts for uncertainty in mod-eling CO emissions, is observed to be relatively low over NEPacific during the campaign period.
Constraining CO using the assimilation system, and eval-uating against independent set of measurements, providesimportant information on the MOPITT retrievals as well ason the fidelity of the model to represent CO transport overthe Pacific. The assimilation reveals a slight positive biasin MOPITT CO, of about 10–18% compared to INTEX-Bmean CO concentration. The results demonstrates an im-portant utility of the assimilation system in validating andcomparing non-coincident datasets and measurements (likeMOPITT) having complex observation operators. With re-moval of the observed bias in COASSIM CO, the assimila-tion results show evidence of monthly-mean CO loadings ofabout 150 ppbv over the NE Pacific, which is slightly higherthan REFSIM CO (∼140 ppbv). Furthermore, analysis ofmean assimilation increments reveals a model error structureshowing model overprediction of CO in the source regionsof Asia and underprediction in downwind regions consistentwith several offline GCTM simulations. Yet, it appears thatthe model error, depicted in this work as mean adjustments,
www.atmos-chem-phys.net/7/5695/2007/ Atmos. Chem. Phys., 7, 5695–5710, 2007
5708 A. F. Arellano Jr. et al.: Ensemble-based global chemical data assimilation
cannot be solely explained, to the first order, as an under-prediction in Asian emissions. Albeit limited in scope, theseresults have important implications in efforts to improve fu-ture regional CO forecasts and to inverse modeling of CO.
Appendix A
Construction of CO emission covariance
The climatological monthly emission covariance,6emis isexpressed as a combination of sub-grid variability6G, inter-annual variability6A and uncertainty estimates on regionalmonthly totals of CO emissions from inverse analyses,6I .That is,∑m
emis=
∑m
G+
∑m
A+
∑m
I(A1)
wherem is the month index from 1 to 12 (i.e. January toDecember). 6emis, 6G, 6A and 6I are monthly covari-ance matrices whose dimensions arengrid×ngrid , wherengrid=144×91 at 2◦×2.5◦ CAM horizontal resolution.
First, we divide the globe into 13 broad regions based onArellano and Hess (2006). The covariance6G is constructedas a block diagonal matrix with block matrix elementsBr,m,wherer is the region index from 1 to 13. This matrix isdefined as,
Br,m = diag(σ grid,r)2, (A2)
whereσ grid,r is the standard deviation of 1◦×1◦ grid emis-
sions within each 2◦×2.5◦ CAM grid for a particular month,m and region,r. In this work, this corresponds to the sub-gridvariability specific for April 2006 emissions. That is,
4∑G
=
B1,4
. . .
. . .
B13,4
(A3)
The second covariance term,6A, is associated with thespatial covariance of each emission grid point with its neigh-boring grids for a particular climatological month. How-ever, the covariance is localized within a certain region. Itis assumed that uncertainties across regions are independent.As such,6A is constructed as block diagonal matrix witheach block corresponding to a particular region. We forma data matrix,Xr,m for each of the region and for eachclimatological month. Each matrix forms a dimension ofngrid region×nmonth, wherengrid region is the number of model2◦
×2.5◦ grids in a particular region andnmonth=10 (e.g. com-pilation of each April from 1996 to 2006). We calculate em-pirically for each data matrixXr,m, a sample spatial covari-anceCr,m,
Cr,m =< Xr,mXTr,m > . (A4)
We then smooth the sample covariance by doing an eigen-value decomposition ofCr,m and retaining only its 3 leadingeigenvectors.6A is constructed as a compilation of resultingsmoothed covariances for all 13 regions. For example,
4∑A
=
C1,4
. . .
. . .
C13,4
(A5)
In this manner, we account for the spatial variability ona regional basis by assuming that the variability within eachregion is stationary in time across the period spanned by theinventory (i.e. 10 years).
The third covariance term,6I , is also constructed as blockdiagonal matrix, where each block corresponds to an uncer-tainty estimate of total sum of emissions for each region. Theestimates are taken from Arellano and Hess (2006) sensitiv-ity analyses, where they reported a larger uncertainty in MO-PITT CO inverse estimates for the year 2000 when a differenttreatment of tracer transport is used in the inverse model. Weconstruct a diagonal covariance matrixDr,m for each regionand climatological month. This is calculated as:
Dr,m = diag( σr
100µgrid,r
)2. (A6)
whereσr is the relative spread (in %) of the total sum ofannual emission for each region andµgrid,r is the emissionassociated for each grid within the region. As such, form=4,
∑4
I=
D1,4
. . .
. . .
D13,4
(A7)
Acknowledgements.We thank the NCAR/MOPITT team for COobservations and the INTEX-B team for access to other fieldobservations. We also acknowledge J.-F. Lamarque (NCAR/ACD)and J. Hacker (NCAR/MMM) for reviewing the initial manuscriptand V. Yudin (NCAR/ACD) for helpful discussions. We thankT. Hoar (NCAR/IMAGe) for assistance with DART and F. Vitt(NCAR/ACD) for his help with CAM installation. This workis supported by NSF ITR Grant 115912 and by NASA GrantNN9069B279. The National Center for Atmospheric Research isoperated by the University Corporation for Atmospheric Researchunder the sponsorship of the National Science Foundation.
Edited by: H. Singh
References
Allen, D. J., Kasibhatla, P. S., Thompson, A. M., et al..: Transport-induced interannual variability of carbon monoxide determinedusing a chemistry and transport model, J. Geophys. Res., 101,28 655–28 670, doi:10.1029/96JD02984, 1996.
Atmos. Chem. Phys., 7, 5695–5710, 2007 www.atmos-chem-phys.net/7/5695/2007/

A. F. Arellano Jr. et al.: Ensemble-based global chemical data assimilation 5709
Anderson, J. L. and Anderson, S. L.: A Monte Carlo implementa-tion of the nonlinear filtering problem to produce ensemble as-similations and forecasts, Mon. Weather Rev., 127, 2741–2758,1999.
Anderson, J. L.: An ensemble adjustment Kalman Filter for dataassimilation, Mon. Weather Rev., 129, 2884–2903, 2001.
Anderson, J. L.: Exploring the need for localization in ensembledata assimilation using an hierarchical ensemble filter, PhysicaD, 230, 99-11, doi:10.1016/j.physd.2006.02.011, 2007a.
Anderson, J. L.: An adaptive covariance inflation error correctionalgorithm for ensemble filters, Tellus A, 59, 210–224, 2007b.
Arellano Jr., A. F., Kasibhatla, P. S, Giglio, L., et al.: Top-downestimates of global CO sources using MOPITT measurements,Geophys. Res. Lett., 31, L01104, doi:10.1029/2003GL018609,2004.
Arellano, A. F. and Hess, P. G.: Sensitivity of top-down estimatesof CO sources to GCTM transport, Geophys. Res. Lett., 33,L21807, doi:10.1029/2006GL027371, 2006.
Auger, L. and Tangborn, A. V.: A Wavelet-Based Reduced RankKalman Filter for Assimilation of Stratospheric Chemical TracerObservations, Mon. Weather Rev., 132, 1220–1237, 2004.
Bey, I., Jacob, D. J., Logan, J. A., and Yantosca, R. M.:Asian chemical outflow to the Pacific in spring: Origins, path-ways, and budgets, J. Geophys. Res., 106, 23 097–23 114,doi:10.1029/2001JD000806, 2001.
Chai T., Carmichael, G. R., Sandu, A., et al.: Chemical data as-similation of Transport and Chemical Evolution over the Pa-cific (TRACE-P) aircraft measurements, J. Geophys. Res., 111,D02301, doi:10.1029/2005JD005883, 2006.
Clerbaux, C., Hadji-Lazaro, J., Hauglustaine, D., et al.: Assimi-lation of carbon monoxide measured from satellite in a three-dimensional chemistry-transport model, J. Geophys. Res., 106,15 385–15 394, doi:10.1029/2000JD900682, 2001.
Collins, W. D., Rasch, P. J., Eaton, B. E., et al.: Simulating aerosolsusing a chemical transport model with assimilation of satelliteaerosol retrievals: Methodology for INDOEX, J. Geophys. Res.,106, 7313–7336, doi:10.1029/2000JD900507, 2001.
Collins, W. D., Bitz, C. M., Blackmon, M. L., et al.: The Formula-tion and atmospheric simulation of the Community AtmosphereModel Version 3 (CAM3), J. Climate, 19(11), 2144–2161, 2006.
Dee, D. P.: Bias and data assimilation, Q. J. Roy. Meteor. Soc.,131(613), 3323–3343, 2005.
Deeter, M. N., Emmons, L. K., Edwards, D. P., et al.:Vertical resolution and information content of CO profilesretrieved by MOPITT, Geophys. Res. Lett., 31, L15112,doi:10.1029/2004GL020235, 2004.
Dethof, A. and Holm, E.: Ozone assimilation in the ERA-40 reanal-ysis project, Q. J. R. Meteor. Soc., 130, 2851–2872, 2004.
Eben, K., Juru, P., Resler, J., et al.: An ensemble Kalman filter forshort-term forecasting of tropospheric ozone concentrations, Q.J. Roy. Meteor. Soc., 131, 3313–3322, 2005.
Elbern, H., Strunk, A., Schmidt, H., and Talagrand, O.: Emissionrate and chemical state estimation by 4-dimensional variationalinversion, Atmos. Chem. Phys., 7, 1–59, 2007,http://www.atmos-chem-phys.net/7/1/2007/.
Elbern, H. and Schmidt, H.: A four-dimensional variational chem-istry data assimilation scheme for Eulerian chemistry transportmodeling, J. Geophys. Res., 104, 18 583–18 598, 1999.
Elbern, H., Schmidt, H., Talagrand, O., and Ebel, A.: 4D-variational
data assimilation with an adjoint air quality model for emissionanalysis, Environ. Modell. Software, 15, 539–548, 2000.
Emmons, L. K., Deeter, M. N., Gille, J. C., et al.: Validation ofMeasurements of Pollution in the Troposphere (MOPITT) COretrievals with aircraft in situ profiles, J. Geophys. Res., 109,D03309, doi:10.1029/2003JD004101, 2004.
Emmons, L. K., Pfister, G. G., Edwards, D. P., et al.: Measurementsof Pollution in the Troposphere (MOPITT) validation exer-cises during summer 2004 field campaigns over North America,J. Geophys. Res., 112, D12S02, doi:10.1029/2006JD007833,2007.
Engelen, R. J. and McNally, A. P.: Estimating atmospheric CO2from advanced infrared satellite radiances within an opera-tional four-dimensional variational (4D-Var) data assimilationsystem: Results and validation, J. Geophys. Res., 110, D18305,doi:10.1029/2005JD005982, 2005.
Eskes, H. J., Van Velthoven, P. F. J., Valks, P. J. M., et al.: As-similation of GOME total ozone satellite observations in a three-dimensional tracer transport model, Q. J. Roy. Meteor. Soc., 129,1663–1681, 2003.
Evensen, G.: Sequential data assimilation with a nonlinear quasi-geostrophic model using Monte-Carlo methods to forecast errorstatistics, J. Geophys., Res., 99, 10 143–10 162, 1994.
Fisher, M. and Lary, D. J.: Lagrangian four-dimensional variationaldata assimilation of chemical species, Q. J. Roy. Meteor. Soc.,121, 1681–1704, 1995.
Frankenberg, C., Meirink, J. F., Bergamaschi, P., et al.: Satellitechartography of atmospheric methane from SCIAMACHY onboard ENVISAT: Analysis of the years 2003 and 2004, J. Geo-phys. Res., 111, D07303, doi:10.1029/2005JD006235, 2006.
Gaspari, G. and Cohn, S. E.: Construction of correlation functionsin two and three dimensions, Q. J. Roy. Meteor. Soc., 125, 723–758, 1999.
Giglio, L., Csiszar, I., and Justice, C. O.: Global distribu-tion and seasonality of active fires as observed with theTerra and Aqua Moderate Resolution Imaging Spectrora-diometer (MODIS) sensors, J. Geophys. Res., 111, G02016,doi:10.1029/2005JG000142, 2006.
Granier, C., Muller, J.-F. , Petron, G., et al.: A three-dimensionalstudy of the global CO budget, Chemosphere, Global. ChangeSci., 1, 255–261, 1999.
Hamill, T. M., Whitaker, J., and Snyder, C.: Distance-dependentfiltering of background error covariance estimates in an ensembleKalman filter, Mon. Weather Rev., 129, 2776–2790, 2001.
Hanea, R. G., Velders, G. J. M., and Heemink, A.: Data assim-ilation of ground-level ozone in Europe with a Kalman filterand chemistry transport model, J. Geophys. Res., 109, D10302,doi:10.1029/2003JD004283, 2004.
Houtekamer, P. L. and Mitchell, H. L.: Data assimilation using anensemble Kalman filter technique, Mon. Weather Rev., 126, 796–811, 1998.
Houtekamer, P. L., Mitchell, H. L., Pellerin, G., et al.: Atmosphericdata assimilation with an ensemble Kalman filter: Results withreal observations, Mon. Weather Rev., 133(3), 604–620, 2005.
Jaffe, D., Anderson, T., Covert, D., et al.: Transport of Asian airpollution to North America, Geophys. Res. Lett., 26(6), 711–714, doi:10.1029/1999GL900100, 1999.
Juckes, M. N. and Lawrence, B. N.: Data Assimilation for Reanal-yses: potential gains from full use of post-analysis-time observa-
www.atmos-chem-phys.net/7/5695/2007/ Atmos. Chem. Phys., 7, 5695–5710, 2007

5710 A. F. Arellano Jr. et al.: Ensemble-based global chemical data assimilation
tions, Tellus A, 58(2), 171–178, 2006.Khattatov, B. V., Lamarque, J.-F., Lyjak, L. V., et al.: Assimilation
of satellite observations of long-lived chemical species in globalchemistry transport models, J. Geophys. Res., 105(D23), 29 135–29 144, doi:10.1029/2000JD900466, 2000.
Lamarque, J.-F., Khattatov, B. V., Gille, J. C., and Brasseur, G.P.: Assimilation of Measurement of Air Pollution from space(MAPS) CO in a global three-dimensional model, J. Geophys.Res., 104(D21), 26 209–26 218, doi:10.1029/1999JD900807,1999.
Lamarque J.-F. and Gille, J. C.: Improving the modeling of er-ror variance evolution in the assimilation of chemical species:Application to MOPITT data, Geophys. Res. Lett., 30(9), 1470,doi:10.1029/2003GL016994, 2003.
Lamarque, J.-F., Khattatov, B. V., and Gille, J. C.: Constraining tro-pospheric ozone column through data assimilation, J. Geophys.Res., 107(D22), 4651, doi:10.1029/2001JD001249, 2002.
Lamarque, J.-F., Khattatov, B. V.,Yudin, V., et al.: Applica-tion of a bias estimator for the improved assimilation of Mea-surements of Pollution in the Troposphere (MOPITT) car-bon monoxide retrievals, J. Geophys. Res., 109, D16304,doi:10.1029/2003JD004466, 2004.
Lamarque J.-F., Kiehl, J. T., Hess, P. G., et al.: Response of acoupled chemistry climate model to changes in aerosol emis-sions: Global impact on the hydrological cycle and the tropo-spheric burdens of OH, ozone, and NOx, Geophys. Res. Lett.,32, L16809, doi:10.1029/2005GL023419, 2005.
Lary, D. J.: Data assimilation: a powerful tool for atmosphericchemistry, Philos. Trans. R. Soc. Lond. Ser. A. Math Phys.,357(1763), 3445–3457, 1999.
Lawrence, M. G., Hov, Ø., Beekmann, M., et al.: The ChemicalWeather, Environ. Chem., 2, 6–8, doi:10.1071/EN05014, 2005.
Levelt, P. F., Khattatov, B. V., Gille, J. C., et al.: Assimilation ofMLS ozone measurements in the global three-dimensional chem-istry transport model ROSE, Geophys. Res. Lett., 25(24), 4493–4496, doi:10.1029/1998GL900152, 1998.
Liang, Q., Jaegle, L., Jaffe, D. A., et al.: Long-range transport ofAsian pollution to the northeast Pacific: Seasonal variations andtransport pathways of carbon monoxide, J. Geophys. Res., 109,D23S07, doi:10.1029/2003JD004402, 2004.
Logan, J. A., Prather, M. J., Wofsy, S. C., and McElroy, M. B.:Tropospheric chemistry: A global perspective, J. Geophys. Res.,86, 7210–7254, 1981.
Lorenc, A. C.: The potential of the ensemble Kalman . lter forNWP—a comparison with 4D-Var, Q. J. Roy. Meteor. Soc., 129,3183–3203, 2003.
McLaughlin, D., O’Neill, A., Derber, J., and Kamachi, M.: Oppor-tunities for enhanced collaboration within the data assimilationcommunity, Q. J. Roy. Meteor. Soc., 131, 3683–3693, 2005.
Menard, R., Cohn, S. E., Chang, L.-P., and Lyster, P. M.: Assim-ilation of Stratospheric Chemical Tracer Observations Using aKalman Filter, Part I: Formulation, Mon. Weather Rev., 128,2654–2671, 2000.
Muller, J. F. and T. Stavrakou, T.: Inversion of CO and NOx emis-sions using the adjoint of the IMAGES model, Atmos. Chem.Phys., 5, 1157–1186, 2005,http://www.atmos-chem-phys.net/5/1157/2005/.
Novelli, P. C., Masarie, K. A., Lang, P. M., et al.: Reanalysis of tro-pospheric CO trends: Effects of the 1997–1998 wildfires, J. Geo-phys. Res., 108(D15), 4464, doi:10.1029/2002JD003031, 2003.
Peters, W., Miller, J. B., Whitaker, J., et al.: An ensemble dataassimilation system to estimate CO2 surface fluxes from atmo-spheric trace gas observations, J. Geophys. Res., 110, D24304,doi:10.1029/2005JD006157, 2005.
Petron, G., Granier, C., Khattatov, B., et al.: Monthly COsurface sources inventory based on the 2000–2001 MO-PITT satellite data, Geophys. Res. Lett., 31, L21107,doi:10.1029/2004GL020560, 2004.
Rabier, F.: Overview of global data assimilation developments innumerical weather-prediction centres, Q. J. Roy. Meteor. Soc.,131, 3215–3233, 2005.
Rasch, P. J., Coleman, D. B., Mahowald, N., et al.: Characteristicsof atmospheric transport using three numerical formulations foratmospheric dynamics in a single GCM framework, J. Climate,19(11), 2243–2266, 2006.
Rasch, P. J., Collins, W. D., and Eaton, B. E.: Understanding theIndian Ocean Experiment (INDOEX) aerosol distributions withan aerosol assimilation, J. Geophys. Res., 106(D7), 7337–7356,doi:10.1029/2000JD900508, 2001.
Rayner, P. J., Scholze, M., Knorr, W., et al.: Two decades ofterrestrial carbon fluxes from a carbon cycle data assimila-tion system (CCDAS), Global Biogeochem. Cy., 19, GB2026,doi:10.1029/2004GB002254, 2005.
Sandu, A., Constantinescu, E. M., Liao, W., et al.: Ensemble-based data assimilation for atmospheric chemical transport mod-els, Lect. Notes in Comp. Sci., 3515, 648–655, 2005.
Sekiyama, T. T. and Shibata, K.: Predictability of Total OzoneUsing a Global Three-Dimensional Chemical Transport ModelCoupled with the MRI/JMA98 GCM, Mon. Weather Rev. 133(8),2262–2274, 2005.
Stajner, I., Riishøjgaard, L. P., and Rood, R.: The GEOS ozone dataassimilation system: specification of error statistics, Q. J. Roy.Meteor. Soc., 127, 1069–1094, 2001.
Tippett, M. K., Anderson, J. L., Bishop, C. H., et al.: Ensemblesquare root filters, Mon. Weather Rev., 131, 1485–1490, 2003.
Van Loon, M., Builtjes, P. J. H., and Segers, A.: Data assimilationof ozone in the atmospheric transport chemistry model LOTOS,Env. Mod. Softw., 15, 603–609, 2000.
van der Werf, G. R., Randerson, J. T., Giglio, L., et al.: Interannualvariability in biomass burning emissions from 1997 to 2004, At-mos. Chem. Phys., 6, 3423–3441, 2006,http://www.atmos-chem-phys.net/6/3423/2006/.
Wang, K. Y., Lary, D. J., Shallcross, D. E., et al.: A review onthe use of the adjoint method in four-dimensional atmospheric-chemistry data assimilation, Q. J. Roy. Meteor. Soc., 127(576),2181–2204, 2001.
Yienger, J. J., Galanter, M., Holloway, T. A., et al.: Theepisodic nature of air pollution transport from Asia toNorth America, J. Geophys. Res., 105(D22), 26 931–26 946,doi:10.1029/2000JD900309, 2000.
Yudin, V. A., Petron, G., Lamarque, J.-F., et al.: Assimi-lation of the 2000–2001 CO MOPITT retrievals with opti-mized surface emissions, Geophys. Res. Lett., 31, L20105,doi:10.1029/2004GL021037, 2004.
Atmos. Chem. Phys., 7, 5695–5710, 2007 www.atmos-chem-phys.net/7/5695/2007/