Comparison of UV irradiances from Aura/Ozone Monitoring Instrument (OMI) with Brewer measurements at...
39
ACPD 10, 16385–16423, 2010 Analysis of site aerosol influence V. E. Cachorro et al. Title Page Abstract Introduction Conclusions References Tables Figures Back Close Full Screen / Esc Printer-friendly Version Interactive Discussion Discussion Paper | Discussion Paper | Discussion Paper | Discussion Paper | Atmos. Chem. Phys. Discuss., 10, 16385–16423, 2010 www.atmos-chem-phys-discuss.net/10/16385/2010/ doi:10.5194/acpd-10-16385-2010 © Author(s) 2010. CC Attribution 3.0 License. Atmospheric Chemistry and Physics Discussions This discussion paper is/has been under review for the journal Atmospheric Chemistry and Physics (ACP). Please refer to the corresponding final paper in ACP if available. Comparison of UV irradiances from Aura/Ozone Monitoring Instrument (OMI) with Brewer measurements at El Arenosillo (Spain) – Part 2: Analysis of site aerosol influence V. E. Cachorro 1 , C. Toledano 1 , M. Ant ´ on 2 , A. Berj ´ on 1 , A. de Frutos 1 , J. M. Vilaplana 3 , A. Arola 4 , and N. A. Krotkov 5,6 1 Grupo de ´ Optica Atmosf ´ erica, Universidad de Valladolid GOA-UVA, Valladolid, Spain 2 Departamento de F´ ısica, Universidad de Extremadura, Badajoz, Spain 3 ESAt “El Arenosillo”, INTA, Huelva, Spain 4 Finnish Meteorological Institute (FMI), Kuopio, Finland 5 GEST Center, University of Maryland, Baltimore County, Maryland, USA 16385
-
Upload
independent -
Category
Documents
-
view
1 -
download
0
Transcript of Comparison of UV irradiances from Aura/Ozone Monitoring Instrument (OMI) with Brewer measurements at...

ACPD10, 16385–16423, 2010
Analysis of siteaerosol influence
V. E. Cachorro et al.
Title Page
Abstract Introduction
Conclusions References
Tables Figures
J I
J I
Back Close
Full Screen / Esc
Printer-friendly Version
Interactive Discussion
Discussion
Paper
|D
iscussionP
aper|
Discussion
Paper
|D
iscussionP
aper|
Atmos. Chem. Phys. Discuss., 10, 16385–16423, 2010www.atmos-chem-phys-discuss.net/10/16385/2010/doi:10.5194/acpd-10-16385-2010© Author(s) 2010. CC Attribution 3.0 License.
AtmosphericChemistry
and PhysicsDiscussions
This discussion paper is/has been under review for the journal Atmospheric Chemistryand Physics (ACP). Please refer to the corresponding final paper in ACP if available.
Comparison of UV irradiances fromAura/Ozone Monitoring Instrument (OMI)with Brewer measurements atEl Arenosillo (Spain) – Part 2: Analysis ofsite aerosol influenceV. E. Cachorro1, C. Toledano1, M. Anton2, A. Berjon1, A. de Frutos1,J. M. Vilaplana3, A. Arola4, and N. A. Krotkov5,6
1Grupo de Optica Atmosferica, Universidad de Valladolid GOA-UVA, Valladolid, Spain2Departamento de Fısica, Universidad de Extremadura, Badajoz, Spain3ESAt “El Arenosillo”, INTA, Huelva, Spain4Finnish Meteorological Institute (FMI), Kuopio, Finland5GEST Center, University of Maryland, Baltimore County, Maryland, USA
16385

ACPD10, 16385–16423, 2010
Analysis of siteaerosol influence
V. E. Cachorro et al.
Title Page
Abstract Introduction
Conclusions References
Tables Figures
J I
J I
Back Close
Full Screen / Esc
Printer-friendly Version
Interactive Discussion
Discussion
Paper
|D
iscussionP
aper|
Discussion
Paper
|D
iscussionP
aper|
6Laboratory of Atmosphere, NASA/Goddard Space Flight Center, Greenbelt, Maryland, USA
Received: 21 April 2010 – Accepted: 19 June 2010 – Published: 1 July 2010
Correspondence to: V. E. Cachorro Revilla ([email protected])
Published by Copernicus Publications on behalf of the European Geosciences Union.
16386

ACPD10, 16385–16423, 2010
Analysis of siteaerosol influence
V. E. Cachorro et al.
Title Page
Abstract Introduction
Conclusions References
Tables Figures
J I
J I
Back Close
Full Screen / Esc
Printer-friendly Version
Interactive Discussion
Discussion
Paper
|D
iscussionP
aper|
Discussion
Paper
|D
iscussionP
aper|
Abstract
Several validation studies have shown a notable overestimation of the clear sky ul-traviolet (UV) irradiance at the Earth’s surface derived from satellite sensors such asthe Total Ozone Mapping Spectrometer (TOMS) and the Ozone Monitoring Instrument(OMI) with respect to ground-based UV data at many locations. Most of this positive5
bias is attributed to boundary layer aerosol absorption that is not accounted for in theTOMS/OMI operational UV algorithm. Therefore, the main objective of this study is toanalyse the aerosol effect on the bias between OMI erythemal UV irradiance (UVER)and spectral UV (305 nm, 310 nm and 324 nm) surface irradiances and ground-basedBrewer spectroradiometer measurements from October 2004 to December 2008 at10
El Arenosillo station, with meteorological conditions representative of the south-west ofSpain.
The effect of other factors as clouds, ozone and the solar elevation over this inter-comparison were analysed in detail in a companion paper (Anton et al., 2010). Inthat paper the aerosol effects were analysed making only a rough evaluation based on15
aerosol optical depth (AOD) information at 440 nm wavelength (visible range) withoutapplying any correction. Here, the correction of the OMI UV data is proposed based ona detailed study about the determination of absorbing aerosols provided by AERONETdata. Because of the difficulty to have reliable data about absorbing aerosol propertiesat many sites, first we consider AOD, Angstrom exponent and also OMI-Aerosol Index20
for this determination, but finally single scattering albedo (SSA) from AERONET wasused since it represents a much more precise information.
An aerosol correction expression was applied to the OMI operational UV data usingtwo approaches to estimate the UV absorption aerosol optical depth, AAOD. The firstapproach was based on an assumption of constant SSA value of 0.91. This approach25
reduces OMI UVER bias from 13.4 to 8.4%. Second approach uses daily AERONETSSA values reducing the bias only to 11.6%. Therefore we have obtained a 37% and12% of improvement, respectively. Similar results were obtained for spectral irradi-
16387

ACPD10, 16385–16423, 2010
Analysis of siteaerosol influence
V. E. Cachorro et al.
Title Page
Abstract Introduction
Conclusions References
Tables Figures
J I
J I
Back Close
Full Screen / Esc
Printer-friendly Version
Interactive Discussion
Discussion
Paper
|D
iscussionP
aper|
Discussion
Paper
|D
iscussionP
aper|
ances at 305 nm, 310 nm and 324 nm, where for 324 nm the OMI bias is reduced from10.5 to 6.98% for constant SSA and to 9.03% for variable SSA.
Contrary to what was expected, the constant SSA approach has a greater bias re-duction than variable SSA, but this is a reasonable result according to the discussionabout the reliability of SSA values. Our results reflect the level of accuracy that may5
be reached at the present time in this type of comparison, which may be consideredas satisfactory taking into account the remaining dependence on other factors. Never-theless, improvements must be accomplished to determine reliable absorbing aerosolproperties, which appear as a limiting factor for improving OMI retrievals.
1 Introduction10
It is well established by several validation works (Arola et al., 2005, 2009; Anton et al.,2007; Kazantzidis et al., 2006; Kazadzis et al., 2009) that UV irradiance at the groundgiven by satellite instruments such as TOMS (Total Ozone Mapping Spectrometer) andOMI (Ozone Monitoring Instrument) (Krotkov et al., 2002) is overestimated comparedwith ground based UV measurements at many polluted locations. This positive (satel-15
lite overestimation) clear-sky bias varies widely depending on the climatological condi-tions at validation sites. Most of this positive bias is attributed to boundary layer aerosolabsorption that is not accounted for in the current TOMS/OMI algorithm (Krotkov et al.,2005; Arola et al., 2009).
The OMI instrument is a Dutch-Finnish push-broom UV-Visible spectrometer, a con-20
tribution to NASA-EOS/Aura mission, launched in July 2004. It is the successor of thelong-lived NASA-TOMS programme (onboard different platforms: Nimbus-7, Meteo-3and Earth-Probe) which began at the end of 1970’s years to measure atmosphericcomposition. First validation of OMI UV data can be found in the work of Tanskanenet al. (2007). The validation results showed a good agreement between OMI-derived25
daily erythemal doses and the daily doses calculated from the ground-based spectralUV measurements from 18 reference instruments (stations in Europe, Canada, Japan,
16388

ACPD10, 16385–16423, 2010
Analysis of siteaerosol influence
V. E. Cachorro et al.
Title Page
Abstract Introduction
Conclusions References
Tables Figures
J I
J I
Back Close
Full Screen / Esc
Printer-friendly Version
Interactive Discussion
Discussion
Paper
|D
iscussionP
aper|
Discussion
Paper
|D
iscussionP
aper|
USA and Antarctic). However, it was noticed a positive OMI bias up ∼50% was foundfor polluted sites significantly affected by absorbing aerosols or trace gases.
Recent publications on OMI operational UV validation have been carried out byBuchard et al. (2008), Ialongo et al. (2008) and Weihs et al. (2008) at different Eu-ropean locations but no aerosol corrections were made. More recently, the works of5
Kazadzis et al. (2009) and Arola et al. (2009) have applied the aerosol absorptioncorrection suggested earlier in Krotkov et al. (2005) and Arola et al. (2005). The firstwork applies the correction based on local aerosol in the urban location of Thessaloniki(Greece) showing OMI overestimates UV spectral irradiances by 30%, 17% and 13%for 305 nm, 324 nm, and 380 nm, respectively. In the paper of Arola et al. (2009) the10
correction is based on a global climatology of aerosols, using combined information ofaerosol models and AERONET data. This work has been carried out over seven Euro-pean sites (including El Arenosillo station) and showed a reduction of the bias from 22to 17% for the UV spectral irradiance at 324 nm under different atmospheric conditions.
In this framework, our work is focused on the comparison between OMI UV irradi-15
ance products (erythemal irradiance (UVER), and spectral irradiances at 305, 310 and324 nm) and the ground-based UV measurements using Brewer spectroradiometer lo-cated at El Arenosillo (Huelva), representative of the SW of Spain. In a companionpaper (Anton et al., 2010) the effect of several factors as clouds, aerosols, ozone andthe solar elevation on OMI-Brewer UV bias were analysed and compared with pre-20
vious TOMS-Brewer results (Anton et al., 2007). In the previous works, the aerosoleffect was analysed in terms of aerosol extinction optical depth (AOD) measured atvisible 440 nm wavelength. The comparison results showed that under moderate-highaerosol load (AOD>0.25) the OMI bias is about 19–15% for UVER and spectral UVirradiances. Under cloud-free and low aerosol load conditions (AOD<0.1) the OMI bias25
was smaller ∼11% for UVER with similar spectral results. These studies had not at-tempted correcting OMI UV data for aerosol absorption, because no information aboutaerosol absorption properties at UV wavelengths was available at our site.
16389

ACPD10, 16385–16423, 2010
Analysis of siteaerosol influence
V. E. Cachorro et al.
Title Page
Abstract Introduction
Conclusions References
Tables Figures
J I
J I
Back Close
Full Screen / Esc
Printer-friendly Version
Interactive Discussion
Discussion
Paper
|D
iscussionP
aper|
Discussion
Paper
|D
iscussionP
aper|
In this paper we first analyse absorption properties of local aerosols at El Arenosillosite, representative area of South Europe, summarizing our previous measurements(Toledano et al., 2007a,b, 2009; Cachorro et al., 2006, 2008; Prats, 2009). Even dis-crimination of absorbing and non-absorbing aerosols is challenging task, related tothe discrimination of aerosol types. Measurements of absorption aerosol optical thick-5
ness (AAOT) or single scattering albedo (SSA) is routinely available only in the visiblewavelengths (440 nm and longer wavelengths, Dubovik et al., 2002). The uncertaintyof these parameters from AERONET inversions is not yet known. Furthermore, thespectral dependence of SSA depends on aerosol type, thus, AERONET SSA values atvisible wavelengths can not be simply extrapolated into UV wavelengths (Krotkov et al.,10
2005, 2009; Arola et al., 2009).El Arenosillo is an appropriate location for aerosol studies because of a high fre-
quency of cloud-free days, and a great variety of aerosol types with a high occur-rence of desert dust outbreaks from Africa during all seasons (Toledano et al., 2007a,b,2009). In addition, this location enjoys availability of long term measurements of differ-15
ent aerosol types. The period of study is determined by availability of OMI data fromOctober 2004 to December 2008.
The paper is organized as follows. Site characteristics, ground and satellite-basedmeasurements are briefly described in Sect. 2. Section 3 introduces the methodologyused for comparison between OMI and Brewer measurements. The comparison results20
are presented in Sect. 4 with focus on different approaches for OMI aerosol correction.Finally, Sect. 5 summarizes the main conclusions.
2 Site, instruments and data
Short comments about site, instruments and the type of data are given in this paper.For a more detailed description read the earlier mentioned companion paper (Anton25
et al., 2010).
16390

ACPD10, 16385–16423, 2010
Analysis of siteaerosol influence
V. E. Cachorro et al.
Title Page
Abstract Introduction
Conclusions References
Tables Figures
J I
J I
Back Close
Full Screen / Esc
Printer-friendly Version
Interactive Discussion
Discussion
Paper
|D
iscussionP
aper|
Discussion
Paper
|D
iscussionP
aper|
Aerosols were characterized by information provided by a CIMEL sun-photometerbelonging to AERONET (Toledano et al., 2007) and UV irradiances were measured byBrewer MK-III double monochromator spectrophotometer #150.
The site of study is located at “El Arenosillo” Atmospheric Sounding Station (ESAt-El Arenosillo) in Hueva, south-west of Spain (37.1◦ N, 6.7◦ W, 20 m a.s.l.). This station5
belongs to the Earth Observation, Remote Sensing and Atmosphere Department, Na-tional Institute of Aerospace Technology of Spain (INTA). This centre participates in theGlobal Ozone Observing System (GO3OS) of the Global Atmosphere Watch (GAW)program of World Meteorological Organization (WMO) as station #213. Data gather-ing, retrieval and reporting procedures at these stations are standardized by the WMO10
quality assurance procedures.Aerosol data are provided by the CIMEL-AERONET sun-photometer available since
year 2000 (Toledano et al., 2007a,b, 2009). Aerosol optical depth AOD or thicknessAOT (we use both indistinctly) and the derived Angstrom coefficient (also denotedby alpha) are obtained from direct sun measurements using the current version 2 of15
AERONET algorithm or by the GOA algorithm (Cachorro et al., 1987, 2001; Ortiz deGalisteo et al., 2009). The absorption aerosol optical depth or thickness, AAOD (AAOT)and single scattering albedo (SSA) parameters are derived from the more sophisticatedinversion algorithm used by AERONET.
The UV irradiance weighted with the erythemal action spectrum adopted by the Com-20
mission Internationale de l’Eclairage (CIE) (McKinlay and Diffey, 1987) (denoted asUVER) and absolute spectral UV irradiances (Watts/nm/m2) (at 305 nm, 310 nm and324 nm) were used for the comparison between OMI UV products and Brewer mea-surements.
The OMI instrument is a nadir viewing spectrometer that measures solar reflected25
and backscattered light in the wavelength range from 270 nm to 500 nm with a spectralresolution of 0.45 nm in the ultraviolet and 0.63 nm in the visible interval. The instru-ment has a 2600 km wide viewing swath and it is capable of daily, global contiguousmapping. The OMI surface UV algorithm (OMUVB) is based on the TOMS UV algo-
16391

ACPD10, 16385–16423, 2010
Analysis of siteaerosol influence
V. E. Cachorro et al.
Title Page
Abstract Introduction
Conclusions References
Tables Figures
J I
J I
Back Close
Full Screen / Esc
Printer-friendly Version
Interactive Discussion
Discussion
Paper
|D
iscussionP
aper|
Discussion
Paper
|D
iscussionP
aper|
rithm developed at NASA Goddard Space Flight Center (Krotkov et al., 2002, 2005;Tanskanen et al., 2007; Torres et al., 2007). In this study OMI UV products correspondto the new version of the OMI level 1 (radiance and irradiance) and level 2 (atmosphericdata products) data set named collection 3. This new version takes advantage of a co-herent calibration and revised dark current correction. For more information, please,5
visit the NASA DISC at http://disc.gsfc.nasa.gov/Aura/OMI/ for EOS Aura OMI level 2orbit data, and the Aura Validation data Center at http://avdc.gsfc.nasa.gov for EOS-Aura OMI station overpass data. Please consult the OMI README files for the latestOMI data product information.
For the latitude of El Arenosillo station, OMI instrument provides more than one10
overpass per day. In this work, we used daily OMI data recorded closest to the ground-based location. Thus, the distance between the centre of the satellite pixel and thestation vary from 0.1 km to 48 km, with a average value of 11.5 km. In addition, Brewerdata recorded closest to the daily OMI overpass time (between 12:30 and 14:30 LSTfor El Arenosillo station) were used. The average of the daily differences between the15
time of Brewer measurements and the OMI overpass time is 6 min. The OMI-Brewerdata with time differences higher than 15 min (∼5% of all data) were removed in thecomparison.
In a previous paper by Anton et al. (2010), OMI-Brewer irradiance under all-sky con-ditions with 1206 available data, representing 80% of total days during the period of20
study, were compared. In that work, the OMI Lambertian Equivalent Reflectivity (LER)at 360 nm was used to describe cloud-free conditions. A certain day was classified ascloud-free if LER was lower than 10% (Kalliskota et al., 2000). Thus, 703 (49% of thetotal days) days were selected as cloud-free. In this study, CIMEL AERONET cloudscreening data have been also used to define cloud-free conditions, due to the need25
of simultaneous AOD and OMI-Brewer irradiance data. Thus, the number of selecteddata is slightly lower, 633, and finally reduced to 583 (45% of the total days) in order touse the available SSA values, as we explain below. This high number of values (as wasshown in Arola et al., 2009) reflects the good weather conditions of El Arenosillo for so-
16392

ACPD10, 16385–16423, 2010
Analysis of siteaerosol influence
V. E. Cachorro et al.
Title Page
Abstract Introduction
Conclusions References
Tables Figures
J I
J I
Back Close
Full Screen / Esc
Printer-friendly Version
Interactive Discussion
Discussion
Paper
|D
iscussionP
aper|
Discussion
Paper
|D
iscussionP
aper|
lar radiation and aerosol studies, currently providing of one of the best ten AERONETlong-continuous data-set, suitable to analyse the OMI bias due to aerosols.
3 Methodology
The comparison analysis for irradiance is carried out by regression analysis and also bythe mean bias error, MBE, and the mean absolute bias error MABE. These parameters5
are defined by:
MBE=100× 1N
N∑i=1
OMI−BrewerOMI
(1)
MABE=100× 1N
N∑i=1
|OMI−Brewer|OMI
(2)
The uncertainty of MBE and MABE is characterized by the standard error (SE). Thesetwo statistical parameters were used according to the methodology used in previous10
works (Anton et al., 2007, 2010).For the OMI UV data correction the formula provided by Krotkov et al. (2005) based
on the aerosol absorbing correction factor (CAA) was used:
UVcorr(λ)=CAA(λ)×UVoperationa(λ), (3)
where λ is the corresponding OMI working wavelength in nm. CAA can be estimated15
by the aerosol absorption optical thickness (AAOT) as follows:
CAA(λ)=1
[1+b×AAOT(λ)](4)
The denominator describes the linear dependence of the overestimation ratio ofsatellite-based UV on AAOT being b the constant slope. This parameter weakly de-pends on solar zenith angle (SZA) and aerosol type (Arola et al., 2005; Krotkov et al.,20
16393

ACPD10, 16385–16423, 2010
Analysis of siteaerosol influence
V. E. Cachorro et al.
Title Page
Abstract Introduction
Conclusions References
Tables Figures
J I
J I
Back Close
Full Screen / Esc
Printer-friendly Version
Interactive Discussion
Discussion
Paper
|D
iscussionP
aper|
Discussion
Paper
|D
iscussionP
aper|
2005). A value of b=3 has been used as the most current value. However, accordingto its definition and following the approach of Kazadzis et al. (2009), the parameter bmust be determined from the available data. Although CAA will be applied to all OMIUV products, the wavelength λ is restricted to 340 nm, the only available for AAOT.
Therefore, AOT and AAOT (or the equivalent SSA) at UV wavelengths are necessary5
for OMI correction data. AAOT (or SSA) needs more sophisticated inversion algorithmsfor its determination, presenting a high uncertainty when available. These parametersare retrieved at visible-NIR spectral range by the AERONET inversion algorithm. Thisalgorithm is based on aureole radiance data, restricting SZA to low values and withothers limitations, such as AOD greater than 0.4. All these restrictions considerably10
reduce the number of available site-data. In the UV range, AOT values are more scarcethan those at visible or near infrared in AERONET stations. In addition, there is nocurrent retrieval methodology available with AERONET data for AAOT or SSA in theUV range. To overcome this issue, Krotkov et al. (2005) use UV-MFRSR radiometeraerosol data, and in the work of Kazadzis et al. (2009) all the aerosol information is15
obtained from Brewer measurements. However, these methodologies present somelimitations for aerosol retrieval radiative properties.
SSA is a function of the wavelength and this dependence can be used to definethe aerosol type. Most current discrimination of aerosol types is based on AOD-alphaplots information (Eck et al., 1999; Toledano et al., 2007a) which may give additional20
information to select partially absorbing aerosols, but not to retrieve reliable absorb-ing properties. Therefore, here different approaches will be followed, from AERONETaerosol information based only on AOD-alpha to a more detailed approaches basedon SSA or AAOT.
Moreover, Aerosol index AI (Hsu et al., 1999; Torres et al., 1999) provided by the OMI25
sensor also gives information about absorbing aerosols. In this study, this approachhas been explored in correspondence with AOD-alpha or SSA values in order to getmore detailed aerosol information.
16394

ACPD10, 16385–16423, 2010
Analysis of siteaerosol influence
V. E. Cachorro et al.
Title Page
Abstract Introduction
Conclusions References
Tables Figures
J I
J I
Back Close
Full Screen / Esc
Printer-friendly Version
Interactive Discussion
Discussion
Paper
|D
iscussionP
aper|
Discussion
Paper
|D
iscussionP
aper|
4 Results and discussion: aerosol effect on OMI bias
For this analysis the results of our previous paper of Anton et al. (2010) must be bornein mind. The overestimation of OMI irradiance values about 13% for cloud-free condi-tions and the initial evaluation of aerosol influence were very informative. Nevertheless,that paper did not analyse the influence of absorbing and non-absorbing aerosols on5
the observed OMI bias and hence no correction could be applied.It is needed to achieve a more detailed analysis of absorbing aerosols in order to
correct its effect on OMI bias. This topic will be discussed in the next sections. However,the first issue is how to identify absorbing aerosols. As already mentioned differentapproaches have been considered depending on the available aerosol information.10
4.1 Absorbing aerosol determination based on AOD-alpha and AI information
A first approach for determining absorbing aerosols based on AOD-alpha informationwas evaluated and its relationship with OMI bias was investigated. The most com-mon and widely available information about aerosol properties are AOD and alpha pa-rameters. Thus, climatological tables for both parameters are provided by AERONET.15
However, this is not the case for SSA.Values of AOD at UV wavelengths are needed to perform this analysis. The standard
sun-photometer installed at El Arenosillo has no measurements at UV wavelengthssince it is a polarized model. In order to overcome this drawback, AOD at 340 nm wasmeasured by another Cimel photometer which was installed at our station during more20
than a year (between June 2006 and August 2007) within the period of study. Thus,AOD values at 440 nm and the alpha parameters have been used to extrapolate theAOD to UV wavelengths. This approach has been validated using the measurementsof AOD values at 340 nm. In this sense, Fig. 1a shows a good agreement between themeasured and calculated values at 340 nm.25
It would be desirable to have AOD values at shorter UV wavelength, lower than340 nm, but only Cimel data at this wavelength are available at this moment. AOD
16395

ACPD10, 16385–16423, 2010
Analysis of siteaerosol influence
V. E. Cachorro et al.
Title Page
Abstract Introduction
Conclusions References
Tables Figures
J I
J I
Back Close
Full Screen / Esc
Printer-friendly Version
Interactive Discussion
Discussion
Paper
|D
iscussionP
aper|
Discussion
Paper
|D
iscussionP
aper|
Brewer data were not used in this work since there is currently a high disagreementbetween our retrieved Brewer data and Cimel data at UV wavelengths. Although manyworks give a good assessment about AOD Brewer retrieval (Grobner et al., 2001;Marenco et al., 2002; Grobner and Meleti, 2004; Kazadzis et al., 2005, 2007; Ca-chorro et al., 2009) some problems remain that must be solved to have reliable Brewer5
AOD data in an operational way, without additional measurements as in the works byKazadzis et al. (2005, 2007). Further improvements are necessary in calibration con-stants to obtain operational AOD Brewer data.
It is interesting to analyse the relationship between AOD at 340 nm and AOD at440 nm (Fig. 1b) since part of the information given at UV range is derived from vis-10
ible spectral range and in this case, by the alpha coefficient or Angstrom exponent(hereafter we use alpha). The figure shows two branches: one corresponding to theblack points and the other to the grey points. This behaviour could disagree with theexpected more linear correlation between both wavelengths (or between others pair ofwavelengths: i.e., 440–670, etc. . . ). Nevertheless, this behaviour appears when there15
are two well defined groups of size particles.These findings are based on the characterization of AOD-alpha aerosol climatology
in El Arenosillo given by Toledano et al. (2007a). The histogram of frequencies ofthe alpha parameter given in Fig. 2a (see also Fig. 7 in Toledano et al., 2007a forthe period 2000–2005) shows two separated modes at alpha 0.82, defining coarse20
and fine-moderate size particles. The peak of the coarse mode, about alpha=0.5, ismainly due to desert dust aerosol type and the other mode (about alpha=1.2) is mainlyrelated to the prevailing coastal marine aerosols. Fine particles have a low weight inthe histogram for our station but, in the latter mode, continental aerosol type and fineparticles associated with polluted or other type of events have been included.25
Hence, the cloud-free data set have been divided into two groups, one of alphavalues lower than 0.82 and another one with values equal or greater than 0.82 (rep-resenting the 28.3% and 71.7% of all cloud-free cases, respectively) according to theinformation given by Figs. 1 and 2a. In addition, both modes or branches can be
16396

ACPD10, 16385–16423, 2010
Analysis of siteaerosol influence
V. E. Cachorro et al.
Title Page
Abstract Introduction
Conclusions References
Tables Figures
J I
J I
Back Close
Full Screen / Esc
Printer-friendly Version
Interactive Discussion
Discussion
Paper
|D
iscussionP
aper|
Discussion
Paper
|D
iscussionP
aper|
clearly distinguished in Fig. 1b when the value of AOD(440 nm) reaches 0.25. ForAOD values lower than 0.25 both branches are joined, being difficult to separate bothgroups. Therefore, AOD(440 nm)=0.25 is considered as the limiting point between bothbranches. The additional information given by the alpha parameter allows us to per-form this separation for lower AOD values. Figure 2b shows the relationship between5
the alpha coefficient and AOD at 440 nm. Two data sets of AOD≥0.25 and one dataset AOD<0.1 can be very clearly seen. These two groups of high AOD differentiate be-tween moderate-fine (alpha greater than 0.82) related to polluted aerosol episodes andlarge particles (alpha lower than 0.82) associated with desert dust particles. Hence, itis expected that these two groups may represent absorbing aerosols.10
It must be remembered that desert dust (DD) aerosols attenuate the UV radiationmore strongly than other aerosol type with the same AOD due to its low single scat-tering albedo at UV wavelengths (Krotkov et al., 1998; Meloni et al., 2003). In thecase of our area of study and taking into account their characteristics (Toledano et al.,2007a,b) polluted aerosols are represented by those arriving from industrial-urban ar-15
eas mixed with marine or continental aerosols, but not pure coastal-marine aerosols(AOD lower than 0.25). However, values of high alpha and AOD may also correspond tobiomass-burning (BB) aerosols. Aerosols of this type correspond to isolated episodeswell identified in our station (Cachorro et al., 2008). They are mainly related to casesof local forest fires and those arriving from Portugal during the period of study. BB20
aerosols correspond to 5–6 points and, hence, represent a low percentage of the totalnumber of cases (about 0.5–1%).
Figure 3a shows the relationship between the relative differences OMI-Brewer andthe valid associated values of AOD at 340 nm for cloud-free conditions (black rhomboidpoints). A very low correlation is found with R2=0.17 (R=0.41). This correlation is25
notably improved when data with alpha below 0.82 are selected (grey points), givingR2=0.42 (or R=0.65). The set of values with AOD(440 nm)>0.25 and alpha≥0.82 isshown as red points. The relationship between OMI-Brewer differences and AOD at340 nm is very variable, depending on the site or aerosol type (e.g, Kazantzidis et al.,
16397
ACPD10, 16385–16423, 2010
Analysis of siteaerosol influence
V. E. Cachorro et al.
Title Page
Abstract Introduction
Conclusions References
Tables Figures
J I
J I
Back Close
Full Screen / Esc
Printer-friendly Version
Interactive Discussion
Discussion
Paper
|D
iscussionP
aper|
Discussion
Paper
|D
iscussionP
aper|
2006; Ialongo et al., 2008; Buchard et al., 2008). A better correlation is found for binneddata, as shown by Anton et al. (2007). Note that this correlation is relevant because isthe correlation that works if we consider the case of SSA constant as we will discusslater in this paper. Although the correlation is very poor, the OMI bias increases as theAOD increase.5
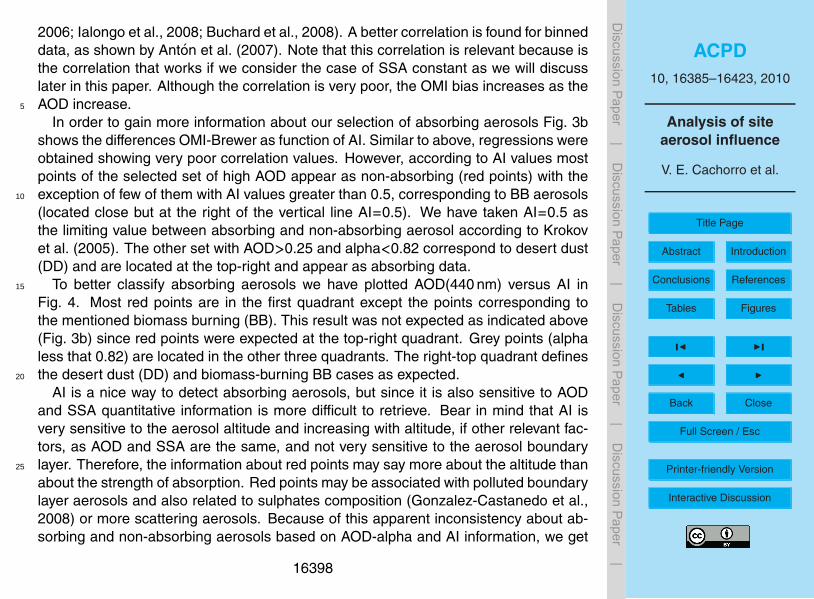
In order to gain more information about our selection of absorbing aerosols Fig. 3bshows the differences OMI-Brewer as function of AI. Similar to above, regressions wereobtained showing very poor correlation values. However, according to AI values mostpoints of the selected set of high AOD appear as non-absorbing (red points) with theexception of few of them with AI values greater than 0.5, corresponding to BB aerosols10
(located close but at the right of the vertical line AI=0.5). We have taken AI=0.5 asthe limiting value between absorbing and non-absorbing aerosol according to Krokovet al. (2005). The other set with AOD>0.25 and alpha<0.82 correspond to desert dust(DD) and are located at the top-right and appear as absorbing data.
To better classify absorbing aerosols we have plotted AOD(440 nm) versus AI in15
Fig. 4. Most red points are in the first quadrant except the points corresponding tothe mentioned biomass burning (BB). This result was not expected as indicated above(Fig. 3b) since red points were expected at the top-right quadrant. Grey points (alphaless that 0.82) are located in the other three quadrants. The right-top quadrant definesthe desert dust (DD) and biomass-burning BB cases as expected.20
AI is a nice way to detect absorbing aerosols, but since it is also sensitive to AODand SSA quantitative information is more difficult to retrieve. Bear in mind that AI isvery sensitive to the aerosol altitude and increasing with altitude, if other relevant fac-tors, as AOD and SSA are the same, and not very sensitive to the aerosol boundarylayer. Therefore, the information about red points may say more about the altitude than25
about the strength of absorption. Red points may be associated with polluted boundarylayer aerosols and also related to sulphates composition (Gonzalez-Castanedo et al.,2008) or more scattering aerosols. Because of this apparent inconsistency about ab-sorbing and non-absorbing aerosols based on AOD-alpha and AI information, we get
16398

ACPD10, 16385–16423, 2010
Analysis of siteaerosol influence
V. E. Cachorro et al.
Title Page
Abstract Introduction
Conclusions References
Tables Figures
J I
J I
Back Close
Full Screen / Esc
Printer-friendly Version
Interactive Discussion
Discussion
Paper
|D
iscussionP
aper|
Discussion
Paper
|D
iscussionP
aper|
the available values of SSA.
4.2 Absorbing aerosol based on SSA values and its relation with AOD, alphaand AI
Two groups of high AOD with potential absorbing properties have been selected. It isworth noting that they only correspond to a small subset of the total free-cloud data5
(15%). Figures 3 and 4 show the behaviour of these two subsets and also the wholedata set in order to distinguish the different absorbing features of these data. Due tothe non sufficient information with AI and AOD-alpha parameters, the available SSAvalues at our station given by AERONET must be considered, as the most relevantparameter to define the absorbing properties of aerosols.10
Although AERONET provide SSA (or AAOT) values at the four aerosol wavelengthsaccording to AERONET algorithm (Dubovik and King, 2000; Dubovik et al., 2002),a climatology is not usually feasible at most AERONET sites. Level 2 for SSA re-quires a set of restrictions which reduce considerably the data and hence it is difficultto have a representative climatology. Additionally, the restriction of AOD(440 nm)≥0.415
eliminates most of the aerosol data, as in the cases of our station.All these conditions make it impossible to obtain a climatology based on AERONET
level 2 data nor a reliable seasonal characterization at El Arenosillo in spite of usingmore than nine continuous years of data and taking into account its excellent weatherconditions (Prats et al., 2008). Furthermore, the low number of data is not sufficient to20
analyse OMI irradiance data and they are only representative of desert dust aerosols(Toledano et al., 2007b). Therefore it was necessary to take SSA level 1.5. Meandaily values (not overpass data) were used as the most reliable values for this analy-sis because of the restrictions of the inversion AERONET algorithm for SZA as men-tioned above. The error of SSA reported by AERONET depends on the values of25
AOD(440 nm) and also on aerosol types (DD, BB, etc.), with higher uncertainty forlower wavelengths (Dubovik et al., 2002), varying from 0.03 to 0.07.
16399

ACPD10, 16385–16423, 2010
Analysis of siteaerosol influence
V. E. Cachorro et al.
Title Page
Abstract Introduction
Conclusions References
Tables Figures
J I
J I
Back Close
Full Screen / Esc
Printer-friendly Version
Interactive Discussion
Discussion
Paper
|D
iscussionP
aper|
Discussion
Paper
|D
iscussionP
aper|
In spite of this assigned error, we must emphasize that the quality of the ob-tained SSA data-set at level 1.5 is not guaranteed (quality not assured according toAERONET). In addition, to check the SSA quality with other methodology is not gen-erally feasible. This is the case for our analysis and unfortunately for other reportedcases (Pere et al., 2009). To solve this problem, the work of Arola et al. (2009) pro-5
posed to use model data in combination to AERONET data in order to get a climatologyexpressing the SSA values as monthly-means. Also monthly SSA values were usedin the work of Kazadzis et al. (2009) but using other methodology based on Brewerglobal-direct measurements and a radiative transfer model. For the moment at thisstation only AERONET data are available.10
Figure 5a shows SSA(440 nm) versus AOD, both taken at 440 nm wavelengths.A first look of this figure indicates that SSA values range from 0.7 to 1 with a 66%of points between 0.9 and 1. In addition, there are a significant number of points be-low 0.85 (14%), presenting most of then AOD(440 nm) smaller than 0.25. The caseswith SSA(440 nm) smaller than 0.9 and AOD(440 nm) smaller than 0.25 represent 29%15
of all. Our selected two groups of data with AOD≥0.25 appear as the top-right side,with most of them with SSA values between 0.9–1. Thus according SSA, they arenot absorbent, as it was expected. The cloud-free data set has a mean value ofSSA(440 nm)=0.9 and the most frequent value is 0.95 (histogram of frequencies notshown). Also it can be seen that the alpha values are more or less homogeneous20
distributed around all the SSA range, not being associated with the absorbing charac-teristics.
In Fig. 5b SSA(440 nm) values are plotted versus AI for the whole data set and theset of alpha lower than 0.82 together with both sub-groups of AOD≥0.25 (red andgreen points). It can be seen that there is no correlation as it may be expected. Ap-25
pearing at the left of AI=0.5 most of the points correspond to moderate-low absorptionaround SSA=0.92 and a non-neglected number of points show very low SSA values(high absorption) which correspond to AOD lower than 0.25. As before, red points(polluted) appear as non-absorbing according to AI but with a mean SSA value of 0.92,
16400
ACPD10, 16385–16423, 2010
Analysis of siteaerosol influence
V. E. Cachorro et al.
Title Page
Abstract Introduction
Conclusions References
Tables Figures
J I
J I
Back Close
Full Screen / Esc
Printer-friendly Version
Interactive Discussion
Discussion
Paper
|D
iscussionP
aper|
Discussion
Paper
|D
iscussionP
aper|
thus as moderately absorbing. Green points or desert dust (DD) have a mean valueof SSA=0.9 (lower than red points), giving also low-moderate or non pronounced ab-sorbing characteristics. It must be empathized that these same cases appeared asabsorbing aerosols according to AI (right side). In conclusion AI and SSA values donot show contradictory information to define absorbing aerosol groups. It is difficult to5
choose what experimental values (AI or SSA) are most adequate to describe absorbingaerosol properties, although SSA parameters appear as the most reliable according toMie theory.
For the OMI bias correction it is necessary to obtain the SSA at UV wavelengthswhere no retrieval methodology is currently available with AERONET data. In order to10
solve this issue, we extrapolate from 440 nm to 340 nm assigning the same slope thatSSA has between 440 and 670 nm as a good approach. Figure 6 shows the correlationbetween the SSA at 440 nm and at 340 nm. The agreement is high (R2=0.97), beingthe values at 340 nm slightly higher than at 440 nm. To illustrate the spectral behaviourof SSA Fig. 7 depicts the mean value of SSA at level 1.5 for the four aerosol wave-15
lengths used in AERONET during the whole OMI analysed data set in El Arenosillo.Also it is depicted the SSA values of the whole data-set without desert dust (DD) groupand the SSA of the DD group. As can be seen the SSA decreases for larger wavelengthand the contrary happens for DD aerosols. Slightly lower values have been obtainedfor the period 2000–2008, as shown below in Fig. 8b.20
The SSA values obtained in El Arenosillo are, in general, quite lower (more absorb-ing) than those found in other areas. Our values are equivalent or lower than thosefound in big urban cities as Paris or Mexico, or more polluted areas as the site of theGSFC (Goddard Space Flight Center) at Greenbelt near Washington-DC, as it is de-picted in Fig. 8a. The three AERONET sites have a long-record of data as indicated in25
Fig. 8a for level 1.5 and 2 where the observed difference are sufficient illustrative to putin discussion the true validity of data at level 1.5.
To confirm these non-expected high absorbing values of SSA of El Arenosillo wehave also analysed the SSA values for our AERONET station of Palencia in the north
16401

ACPD10, 16385–16423, 2010
Analysis of siteaerosol influence
V. E. Cachorro et al.
Title Page
Abstract Introduction
Conclusions References
Tables Figures
J I
J I
Back Close
Full Screen / Esc
Printer-friendly Version
Interactive Discussion
Discussion
Paper
|D
iscussionP
aper|
Discussion
Paper
|D
iscussionP
aper|
of Spain. Although the site is located near a little city of 82 000 inhabitants withoutindustry, very low values of SSA are not expected. In Fig. 8b the earlier values ofEl Arenosillo are depicted together with that of Palencia for level 1.5 and 2. SSA valuesin level 1.5 lower in Palencia than in El Arenosillo were obtained. It must be noted thatlevel 2 is represented by the features of desert dust aerosols where SSA increases with5
the wavelength, because in both sites only DD intrusions reach values of AOD as highas 0.4 to reach level 2. Therefore, this is a non expected result because El Arenosillois located in a rural area and although it may have some influence of the industrialbelt of the city of Huelva, this can not reach this lower SSA values. Observe thatGSFC at level 2 has a value of SSA at 440 nm higher than 0.95 and at UV about 0.98,10
thus appearing as a reliable value. On the other hand, the error of SSA reported byAERONET depends on the values of AOD(440 nm) and also on aerosol types (DD, BB,etc.), with higher uncertainty for lower wavelengths (Dubovik et al., 2002), varying from0.03 to 0.07.
The above results show the current state of the research about the values and un-15
certainties of the SSA parameter. In spite of these shortcomings, the SSA values atlevel 1.5 will be used to analyse their relationship with the OMI irradiance correction.
4.3 Application of corrections for OMI bias. Approaches of SSA constant andSSA variable
The SSA of DD aerosols increase as the wavelengths increase (Dubovik et al., 2002)20
in contrast with the behaviour of the SSA for the whole data set (with and without DDaerosols) which decreases. Because of this opposite spectral behaviour both sets havethe same value of 0.915 for 340 nm, when the straight line that joins the SSA values atthe wavelengths of 440 and 670 nm is extrapolated. We must also note that the spectralbehaviour of the red points is very similar to the spectral behaviour of the whole data25
set. Therefore, as first approach a fixed SSA value of 0.915 will be considered togenerate the AAOD=(1+AOD×SSA) at 340 nm for the whole data set. In this case,the AAOD variation is exclusively due to AOD changes. As second approach, AAOD
16402

ACPD10, 16385–16423, 2010
Analysis of siteaerosol influence
V. E. Cachorro et al.
Title Page
Abstract Introduction
Conclusions References
Tables Figures
J I
J I
Back Close
Full Screen / Esc
Printer-friendly Version
Interactive Discussion
Discussion
Paper
|D
iscussionP
aper|
Discussion
Paper
|D
iscussionP
aper|
values are derived from average daily values of SSA at 340 nm. In this second case,the slope of the line between 440 and 670 nm was evaluated to get the value of SSA at340 nm for each individual spectral data of SSA. Thus, while AAOD values range from0 to almost 0.07 for the first approach, they reach more than the double value (∼0.17)for the second approach.5
The two plots of Fig. 9 show the relationship between OMI/Brewer ratio for UVERand AAOD at 340 nm obtained by means of the first approach (top) and the second one(bottom). The fitting has been added to each plot in order to determine the parameterb of the correction formula for the two approaches. The value b=3.42 was obtainedfor the first approach which is near the proposed value of Krotkov et al. (2005) and10
b=1.155 for the second approach taking SSA(340 nm) variable. Both fits show verypoor correlation with coefficient of determination R2 equal to 0.17 and 0.04, respec-tively. The constants for the spectral irradiances at 305, 310 and 324 nm were alsoobtained and given in Table 1 (plot are not shown).
Figure 10 shows the correlation between OMI and Brewer values for UVER before15
and after the correction using the first approach (top) and the second one (bottom).Table 2 contains all the information of slopes and intercepts values and statisticalparameters for UVER, 305, 310 and 324 nm wavelengths. The regression analysiswithout correction shows positive OMI bias characterized by regression slopes of 1.18(UVER), 1.18 (UV 305 nm), and 1.14 (UV 310 nm), and 1.10 (UV 324 nm), and with20
coefficients of determination higher than 0.96.The RMSE statistics (residual error ofthe fit) is 7.1% for UVER and between 6% and 8.3% for spectral wavelengths, beinglarger for shorter wavelengths in agreement with the work of Kazadzis et al. (2009).The values of the MBE (Mean Bias Error) parameters are 13.38% (UVER), 14.92%(UV 305 nm), 11.75% (UV 310 nm) and 10.30% (UV 324 nm), indicating the notable25
agreement between satellite and ground-based irradiance data in our area, as hasbeen reported previously (Anton et al., 2010).
The correction of the OMI irradiance data (Eqs. 3 and 4) reduces significantly thebias with respect to Brewer measurements. Table 2 shows that MBE for UVER de-
16403

ACPD10, 16385–16423, 2010
Analysis of siteaerosol influence
V. E. Cachorro et al.
Title Page
Abstract Introduction
Conclusions References
Tables Figures
J I
J I
Back Close
Full Screen / Esc
Printer-friendly Version
Interactive Discussion
Discussion
Paper
|D
iscussionP
aper|
Discussion
Paper
|D
iscussionP
aper|
creases to 11.65% (SSA variable approach) and 8.4% (SSA constant approach), whichrepresents a relative decrease of 13% and 37% with respect to the values without cor-rection. Similar improvement was obtained for the three spectral wavelengths. Thesmallest bias correspond to wavelengths at 310 nm (6.9%) and 324 nm (6.3%) for theSSA constant approach, representing a relative reduction of OMI bias of 32% and 38%,5
respectively.As can be seen a better improvement has been obtained for the SSA constant ap-
proach which may be surprising in principle, but not taking into account the abovediscussion about SSA values. A fixed value of SSA equal to 0.915 at UV range is morereliable for the whole data set that the variable values of SSA at level 1.5. As it was10
discussed above, AAOD values obtained for SSA variable appears as a whole as veryabsorbing, reaching a value of 0.17. The correlation between these two sets of AAODvalues has been evaluated showing a low correlation, smaller than 0.3 (not shown).Thus, the constant slope b in the SSA variable approach decreases considerably, re-ducing the posterior effectiveness of the correction (see that b=1.155 is near 1). When15
values greater than 0.08 are removed, a value of b=1.49 is obtained but the improve-ment is not significant.
Otherwise, if a value of b=3 is applied (Krotkov et al., 2005) the OMI bias of UVERdecreases to 9.4% (324 nm falls to 4.5%) but the application of this value is not justi-fied. Additionally, it is worth noting that for the second approach using SSA at 440 nm20
instead of at 340 nm gives the same results. Also, the performance of the correctionhas been evaluated in the case of using a constant value of SSA equal to 0.95, whichmay be a reasonable value for the whole data set assuming less absorption, as in thearea of GSFC (where the interpolate value go to 0.95 at UV range). In this case, theslope b increases up about 5 but the AAOD values decrease in such a way that the25
correction factor, and hence the correction, are substantially modified. Thus, theseother explored possibilities or approaches do not improve the previous one.
Figure 11 depicts OMI bias as function of AOD(340 nm) before (same as earlierFig. 4a) and after the application of the two corrections. Now no dependence is ob-
16404

ACPD10, 16385–16423, 2010
Analysis of siteaerosol influence
V. E. Cachorro et al.
Title Page
Abstract Introduction
Conclusions References
Tables Figures
J I
J I
Back Close
Full Screen / Esc
Printer-friendly Version
Interactive Discussion
Discussion
Paper
|D
iscussionP
aper|
Discussion
Paper
|D
iscussionP
aper|
served with horizontal slopes for the regression lines after the correction. Accordingto the results of Taskanen et al. (2008), our results are inside the range to be con-sidered as satisfactory. Therefore, these results indicated the level of accuracy thatmay be reached by the OMI algorithm at the present status of research. Otherwise,ongoing investigations must be accomplished to better assess SSA values and hence5
to improve the estimated OMI values.
5 Conclusions
This work focuses on the influence of aerosols over the comparison between OMI andBrewer UV products at El Arenosillo station (south of Spain) for the period October2004–December 2008. Under cloud-free conditions, our ground-based measurements10
overestimate the OMI data, around 13% for UVER and ranging from 10% to 15% for thespectral wavelengths, in agreement with other locations. When the aerosol correctionsare applied, we find an OMI bias ranging from 6–10% (SSA constant approach), whichrepresents a relative reduction between 30% and 40% with respect to OMI bias withoutaerosol correction. For the SSA constant approach, the variation of AAOD depends15
only on AOD features. Less effective reduction is obtained when using available meandaily SSA values, which in principle would appear as more reliable approach for aerosolcorrection.
This incongruent result may be related to the uncertain reliability of AERONET SSAlevel 1.5 of our data. Mainly due to the difficulty to determine absorbing aerosols in20
many sites a detailed analysis in our area of study has been performed, based on theavailable information of AOD-alpha parameters, more frequently available than AI andSSA. The analysis allows the selection of some defined aerosol groups, as polluted ordesert dust types. However, some inconsistence appeared. Polluted aerosols basedon AOD-alpha values appear as non-absorbent according to AI values or moderate25
absorbing according to SSA values and also a few percent of data shows low values ofSSA (very absorbing) in contrast with AI values lower than 0.5 (non-absorbing). Only
16405

ACPD10, 16385–16423, 2010
Analysis of siteaerosol influence
V. E. Cachorro et al.
Title Page
Abstract Introduction
Conclusions References
Tables Figures
J I
J I
Back Close
Full Screen / Esc
Printer-friendly Version
Interactive Discussion
Discussion
Paper
|D
iscussionP
aper|
Discussion
Paper
|D
iscussionP
aper|
desert dust data are in agreement for AOD-alpha, AI and SSA data. Most of the data oflow AOD values appear as non-absorbing according to AI with moderate SSA values,then the applied corrections work.
Proposed corrections for aerosol effect showed a relative high efficiency for reducingthe OMI bias depending significantly on the slope of OMI/Brewer ratio over the absorp-5
tion aerosol optical depth. Our results reflect the level of accuracy that may be reachedin this type of comparison at present which may be considered as satisfactory. Never-theless, improvements must be accomplished to determine reliable absorbing aerosolproperties, which appears as the limiting factor to improve OMI bias.
Acknowledgements. The authors thank the OMI International Science Team for the satellite10
data used in this study and also to the teams of aerosol networks GSFC-NASA and PHO-TONS. Also thanks to Antonio Serrano for his help in editing the manuscript. This work hasbeen partially supported by MICIN under coordinated project CGL2008-05939-C03/CLI of UVA-INTA-UNEX. Also this work is financed by GR220 project of “Junta de Castilla y Leon”.
References15
Anton, M., Cachorro, V. E., Vilaplana, J. M., Krotkov, N. A., Serrano, A., Toledano, C.,de la Morena, B., and Herman, J. R.: Total ozone mapping spectrometer retrievalsof noon erythemal-CIE ultraviolet irradiance compared with Brewer ground-based mea-surements at El Arenosillo (Southwestern Spain), J. Geophys. Res., 112, D11206,doi:10.1029/2006JD007254, 2007.20
Anton, M., Cachorro, V. E., Vilaplana, J. M., Toledano, C., Krotkov, N. A., Arola, A., Serrano, A.,and de la Morena, B.: Comparison of UV irradiances from Aura/Ozone Monitoring Instrument(OMI) with Brewer measurements at El Arenosillo (Spain) – Part 1: Analysis of parameterinfluence, Atmos. Chem. Phys. Discuss., 10, 6797–6827, doi:10.5194/acpd-10-6797-2010,2010.25
Arola, A., Kazadzis, S., Krotkov, N., Bais, A., Grobner, J., and Herman, J. R.: Assess-ment of TOMS UV bias due to absorbing aerosols, J. Geophys. Res., 110, D23211,doi:10.1029/2005JD005913, 2005.
16406

ACPD10, 16385–16423, 2010
Analysis of siteaerosol influence
V. E. Cachorro et al.
Title Page
Abstract Introduction
Conclusions References
Tables Figures
J I
J I
Back Close
Full Screen / Esc
Printer-friendly Version
Interactive Discussion
Discussion
Paper
|D
iscussionP
aper|
Discussion
Paper
|D
iscussionP
aper|
Arola, A., Kazadzis, S., Lindfors, A., Krotkov, N. A., Kujanpa, J., and Tamminen, J.: A newapproach to correct for absorbing aerosols in OMI UV, Geophys. Res. Lett., 36, L22805,doi:10.1029/2009GL0411137,2009.
Buchard, V., Brogniez, C., Auriol, F., Bonnel, B., Lenoble, J., Tanskanen, A., Bojkov, B., andVeefkind, P.: Comparison of OMI ozone and UV irradiance data with ground-based mea-5
surements at two French sites, Atmos. Chem. Phys., 8, 4517–4528, doi:10.5194/acp-8-4517-2008, 2008.
Cachorro, V. E., De Frutos, A. M., and Casanova, J. L.: Determination of Angstrom turbidityparameters, Appl. Optics, 26, 3069–3076, 1987.
Cachorro, V. E., Vergaz, R., Martin, M. J., de Frutos, A. M., Vilaplana, J. M., and de la Morena,10
B.: Measurements and estimation of the columnar optical depth of tropospheric aerosolsin the UV spectral region, Ann. Geophys., 20, 565–574, doi:10.5194/angeo-20-565-2002,2002.
Cachorro, V. E., Vergaz, R., de Frutos, A. M., Vilaplana, J. M., Henriques, D., Laulainen, N., andToledano, C.: Study of desert dust events over the southwestern Iberian Peninsula in year15
2000: two case studies, Ann. Geophys., 24, 1493–1510, doi:10.5194/angeo-24-1493-2006,2006.
Cachorro, V. E., Toledano, C., Prats, N., Sorribas, M., Mogo, S., Berjon, A., Torres, B., Ro-drigo, R., de Frutos, A. M., and de la Rosa, J.: The strongest desert dust intrusion mixedwith smoke over the Iberian Peninsula registered with sun-photometry, J. Geophys. Res.,20
113, D14504, doi:10.1029/2007JD009582, 2008.Cachorro, V. E., Berjon, A., Toledano, C., Mogo, S., Prats, N., de Frutos, A. M., Vila-
plana, J. M., Grobner, J., and Naulainen, N.: Detailed Diurnal Aerosol Optical Depth in-tercomparison between Brewer, Licor1800 spectroradiometer and Cimel sun-photometerduring various short intensive campaigns, J. Atmos. Ocean. Tech., 26, 1558–1571,25
doi:10.1175/2009JTECHA1217.1, 2009.Dubovik, O., King, M. D.: A flexible inversion algorithm for retrieval of aerosol optical properties
from Sun and sky radiance measurements, J. Geophys. Res., 105, 20673–20696, 2000.Dubovik, O., Holben. B. N., Eck, T. F., Smirnov. A., Kaufman Y. J., King, M. D., Tanre, D., and
Slutsker, I.: Variability of absorption and optical properties of key aerosol types observed in30
woldwide locations, J. Atmos. Sci., 59, 590–608, 2002.Eck, T. F., Holben, B. N., Reid, J. S., Dubovik, O., Smirnov, A., O’Neil, N. O., Slutsker, I., and
Kinne, S.: Wavelength dependence of the optical depth of biomass burning, urban, and
16407

ACPD10, 16385–16423, 2010
Analysis of siteaerosol influence
V. E. Cachorro et al.
Title Page
Abstract Introduction
Conclusions References
Tables Figures
J I
J I
Back Close
Full Screen / Esc
Printer-friendly Version
Interactive Discussion
Discussion
Paper
|D
iscussionP
aper|
Discussion
Paper
|D
iscussionP
aper|
desert dust aerosols, J. Geophys. Res., 106, 31333–31349, 1999.Gonzalez, Y.: Caracterizacion geoquimica y contribucion de fuentes de material particulado
atmosferico en El Arenosillo, SW de la Peninsula Iberica, Ph.D. degree, University of Huelva,2007.
Grobner, J., Vergaz, R., Cachorro, V., Henriques, D., Lamb, K., Redondas, A., Vilaplana, J.,5
and Rembges, D.: Intercomparison of aerosol optical depth measurements in the UVB usingBrewer spectrophotometers and a Li-Cor spectrophotometer, Geophys. Res. Lett., 28(9),1691–1694, 2001.
Grobner, J. and Meleti, C.: Aerosol optical depth in the UVB and visible from Brewer spec-trophotometer direct irradiance measurements: 1991 to 2002, J. Geophys. Res., 109(D9),10
D09202, doi:2003JD004409, 2004.Hsu, N. C., Herman, J. R., Torres, O., Holben, B., Tanre, D., Eck, T. F., Smirnov, A., Chatenet, B.,
and Lavenu, F.: Comparison of the TOMS aerosol index with sun photometer aerosol opticalthickness: results and applications, J. Geophys. Res., 104, 6269–6279, 1999.
Ialongo, I., Casale, G. R., and Siani, A. M.: Comparison of total ozone and erythemal UV15
data from OMI with ground-based measurements at Rome station, Atmos. Chem. Phys., 8,3283–3289, doi:10.5194/acp-8-3283-2008, 2008.
Kalliskota, S., Kaurola, J., Taalas, P., Herman, J., Celarier, E., and Krotkov, N.: Comparison ofdaily UV doses estimated from Nimbus 7/TOMS measurements and ground-based spectro-radiometer data, J. Geophys. Res., 105, 4273– 4277, 2000.20
Kazantzidis, A., Bais, A. F., Grobner, J., Herman, J. R., Kazadzis, S., Krotkov, N., Kyro, E., denOuter, P. N., Garane, K., Gorts, P., Lakkala, K., Meleti, C., Slaper, H., Tax, R. B., and Tu-runen, T.: Comparison of satellite-derived UV irradiances with ground-based measurementsat four European stations, J. Geophys. Res., 111, D13207, doi:10.1029/2005JD006672,2006.25
Kazadzis, S., Bais, A., Kouremeti, N., Garasopoulos, E., Garane, K., Blumthaler, M., Schall-hart, B., and Cede, A.: Direct spectral measurements with a Brewer spectroradiometer:absolute calibration and aerosol optical depth retrieval, Appl. Opt., 44, 1681–1690, 2005.
Kazadzis, S., Bais, A., Amiridis, V., Balis, D., Meleti, C., Kouremeti, N., Zerefos, C. S., Rapso-manikis, S., Petrakakis, M., Kelesis, A., Tzoumaka, P., and Kelektsoglou, K.: Nine years of30
UV aerosol optical depth measurements at Thessaloniki, Greece, Atmos. Chem. Phys., 7,2091–2101, doi:10.5194/acp-7-2091-2007, 2007.
Kazadzis, S., Bais, A., Arola, A., Krotkov, N., Kouremeti, N., and Meleti, C.: Ozone Monitoring
16408

ACPD10, 16385–16423, 2010
Analysis of siteaerosol influence
V. E. Cachorro et al.
Title Page
Abstract Introduction
Conclusions References
Tables Figures
J I
J I
Back Close
Full Screen / Esc
Printer-friendly Version
Interactive Discussion
Discussion
Paper
|D
iscussionP
aper|
Discussion
Paper
|D
iscussionP
aper|
Instrument spectral UV irradiance products: comparison with ground based measurementsat an urban environment, Atmos. Chem. Phys., 9, 585–594, doi:10.5194/acp-9-585-2009,2009.
Krotkov, N. A., Barthia, P. K., Herman, J. R., Fioletov, V., and Kerr, J.: Satellite estimation ofspectral surface UV irradiance in the presence of tropospheric aerosols 1. clod free cases,5
J. Geophys. Res., 103, 8779–8793, 1998.Krotkov, N. A., Herman, J., Barthia, P. K., et al.: Clouds, aerosols, and surface UV
irradiance, in: OMI Algorithm Theoretical Basis Document, vol. III, ATBD-OMI-03,edited by: Stammes, P., NASA Goddard Space Flight Cent., Greenbelt, Md., 72–109,http://www.knmi.com/omi/documents/data/OMI ATBD Volume 3 V2.pdf, last access: 1st10
April 2010, 2002.Krotkov, N. A., Barthia, P. K., Herman, J. R., Slusser, J., Scott, G., Labow, G., Vasilkov, A. P.,
Eck, T. F., Dubovik, O., and Holben, B. N.: Aerosol ultraviolet absorption experiment (2000to 2004), Part 2: Absorption optical thickness, refractive index, and single scattering albedo,Opt. Eng., 44(4), 041005, 2005.15
Krotkov, N., Labow, G., Herman, J., Slusser, J., Tree, R., Jason, G., Durham, B., Eck, T., andHolben, B.: Aerosol column absorption measurements using co-located UV-MFRSR andAERONET CIMEL instruments, in: Ultraviolet Ground- and Space-based Measurements,Models, and Effects VI, edited by: Herman, J. R. and Gao, W., Proceedings of SPIE, 7462,SPIE, Bellingham, WA, 746205–746205-7, 2009.20
Marenco, F., di Sarra, A., and de Luisi, J.: Methodology for determining aerosol optical depthfrom Brewer 300–320 nm measurements, Appl. Opt., 41, 1805–1814, 2002.
McKinlay, A. F. and Diffey, B. L.: A reference spectrum for ultraviolet induced erythema in humanskin, CIE-J., 6, 21– 27, 1987.
Meloni, D., di Sarra, A., DeLuisi, J., Di Iorio, T., Fiocco, G., Junkermann, W., and Pace, G.:25
Tropospheric aerosols in the Mediterranean: 2. Radiative effects through model simulationsand measurements, J. Geophys. Res., 108(D10), 4317, doi:10.1029/2002JD002807, 2003.
Ortiz de Galisteo, P., Toledano, C., Cachorro, V., Rodrıguez, E., and de Frutos, A.: Analysisof aerosol optical depth evaluation in polar regions and associated uncertainties, Adv. Sci.Res., 2, 5–8, doi:10.5194/asr-2-5-2008, 2008.30
Pere, J. C., Mallet, M., Bessagnet, B., and Pont, V.: Evidence of the aerosol core-shell mixingstate over Europe during the heat wave of summer 2003 by using CHIMERE simulations andAERONET inversions, Geophys. Res. Lett., 36, L09807, doi:10.1029/2009GL037334, 2009.
16409

ACPD10, 16385–16423, 2010
Analysis of siteaerosol influence
V. E. Cachorro et al.
Title Page
Abstract Introduction
Conclusions References
Tables Figures
J I
J I
Back Close
Full Screen / Esc
Printer-friendly Version
Interactive Discussion
Discussion
Paper
|D
iscussionP
aper|
Discussion
Paper
|D
iscussionP
aper|
Prats, N., Cachorro, V. E., Sorribas, M., Toledano, C., Berjon, A., Rodrigo, R., Torres, B., andde Frutos, A. M.: Analysis of AERONET inversion algorithm’s products at “El Arenosillo”station, Southwest Spain, International Radiation Symposium (IRS2008), Foz do Iguacu,Brazil, 2008.
Prats, N.: Utilizacion del fotometro Cimel (AERONET) para el analisis de parametros mi-5
crofısicos y radiativos del aerosol atmosferico en el suroeste de la Penınsula Iberica, Ph.D.dissertation, Universidad de Valladolid (Spain), 2009.
Tanskanen, A., Lindfors, A., Maatta, A., Krotkov, N., Herman, J., Kaurola, J., Koskela, T.,Lakkala, K., Fioletov, V., Bernhard, J., McHenzie, R., Kondo, Y., O’Neill, M., Slaper, H.,den Outer, P., Bais, A. F., and Tamminen, J.: Validation of daily erythemal doses10
from OMI with ground-based UV measurement data, J. Geophys. Res., 112, D24S44,doi:10.1029/2007JD008830, 2007.
Toledano, C., Cachorro, V. E., Sorribas, M., Berjon, A., de la Morena, B. A., de Frutos, A. M.,and Gouloub, P.: Aerosol optical depth and Angstrom exponent climatology at “El Arenosillo”AERONET site (Huelva, Spain), Q. J. Roy. Meteor. Soc., 133, 795–807, doi:10.1002/qj.54,15
2007a.Toledano, C., Cachorro, V. E, de Frutos, A. M., Sorribas, M., Prats, N., and de la Morena, B.:
Inventory of African desert dust events over the Southwestern Iberian Peninsula in2000–2005 with an AERONET Cimel Sun photometer, J. Geophys. Res., 112, D21201,doi:10.1029/2006JD008307, 2007b.20
Toledano, C., Cachorro, V. E., de Frutos, A. M., Torres, B., Sorribas, M., and Stone, R.: Airmasses classification and analysis of aerosol types at El Arenosillo (Spain), J. Appl. Meteo-rol., 48(5), 962–981, doi:10.1175/2008JAM 2006.1, 2009.
Torres, O. and Barthia, P. K.: Impact of tropospheric aerosol absorption on ozone retrieval frombackscattered ultraviolet measurements, J. Geophys. Res., 104, 21569–21577, 1999.25
Torres, O., Tanskanen, A., Veihelmann, B., Ahn, C., Braak, R., Bhartia, P. K., Veefkind, P., andLevelt, P.: Aerosols and surface UV products from Ozone Monitoring Instrument observa-tions: an overview, J. Geophys. Res., 112, D24S47, doi:10.1029/2007JD008809, 2007.
Weihs, P., Blumthaler, M., Rieder, H. E., Kreuter, A., Simic, S., Laube, W., Schmalwieser, A. W.,Wagner, J. E., and Tanskanen, A.: Measurements of UV irradiance within the area of one30
satellite pixel, Atmos. Chem. Phys., 8, 5615–5626, doi:10.5194/acp-8-5615-2008, 2008.
16410

ACPD10, 16385–16423, 2010
Analysis of siteaerosol influence
V. E. Cachorro et al.
Title Page
Abstract Introduction
Conclusions References
Tables Figures
J I
J I
Back Close
Full Screen / Esc
Printer-friendly Version
Interactive Discussion
Discussion
Paper
|D
iscussionP
aper|
Discussion
Paper
|D
iscussionP
aper|
Table 1. Results of linear regression analysis between OMI/Brewer ratio of UV products andAAOT at 340 nm for the two approaches: SSA variable and SSA constant.
SSA variable b (Slope) Y intercept R2
UVER 1.16 1.14 0.05305 1.07 1.16 0.03310 1.09 1.12 0.04324 1.01 1.10 0.04
SSA constant b (Slope) Y intercept R2
UVER 3.42 1.10 0.17305 2.44 1.12 0.13310 3.28 1.08 0.15324 2.67 1.17 0.13
16411

ACPD10, 16385–16423, 2010
Analysis of siteaerosol influence
V. E. Cachorro et al.
Title Page
Abstract Introduction
Conclusions References
Tables Figures
J I
J I
Back Close
Full Screen / Esc
Printer-friendly Version
Interactive Discussion
Discussion
Paper
|D
iscussionP
aper|
Discussion
Paper
|D
iscussionP
aper|
Table 2. Results of linear regression analysis between OMI and Brewer UV products withoutcorrection and the correction for the two approaches: SSA variable and SSA constant, and thestatistical parameters of relative differences. The parameters are the following: the slope of theregression, the standard error (SE) of the slope, the Y intercept, the SE of the Y intercept, thecorrelation coefficients (R2), and the root mean square errors (RMSE).
Without correctionSlope SE (Slope) Y intercept SE (Y intercept) R2 RMSE
(mW/m2) (mW/m2) (%)
UVER 1.18 0.01 −1.89 1.08 0.98 7.16305 1.18 0.01 0.10 0.27 0.98 8.35310 1.14 0.01 −0.07 0.55 0.97 7.42324 1.10 0.01 5.37 2.85 0.96 6.56
N MBE SE (MBE) MABE SE (MABE)(%) (%) (%) (%)
UVER 583 13.38 0.26 13.48 0.25305 583 14.92 0.28 15.05 0.27310 583 11.75 0.27 11.94 0.25324 583 10.30 0.24 10.50 0.22
Correction with SSA variable (b=1.55)SSA Slope SE (Slope) Y intercept SE (Y intercept) R2 RMSEvariable (mW/m2) (mW/m2) (%)
UVER 1.16 0.01 −1.69 1.01 0.98 6.99305 1.16 0.01 0.12 0.26 0.98 8.23310 1.12 0.01 0.01 0.52 0.98 7.26324 1.08 0.01 5.50 2.70 0.96 6.39
SSA N MBE SE (MBE) MABE SE (MABE)variable (%) (%) (%) (%)
UVER 583 11.65 0.26 11.85 0.24305 583 13.34 0.29 13.58 0.27310 583 10.08 0.27 10.44 0.24324 583 8.73 0.24 9.08 0.21
Correction with SSA constant (b=3.42)SSA Slope SE (Slope) Y intercept SE (Y intercept) R2 RMSEconstant (mW/m2) (mW/m2) (%)
UVER 1.11 0.01 −0.89 0.94 0.98 6.62305 1.11 0.01 0.23 0.24 0.98 7.78310 1.07 0.01 0.36 0.48 0.98 6.86324 1.04 0.01 7.79 2.52 0.96 6.10
SSA N MBE SE (MBE) MABE SE (MABE)constant (%) (%) (%) (%)
UVER 583 8.40 0.25 8.91 0.22305 583 10.01 0.28 10.50 0.25310 583 6.90 0.26 7.71 0.21324 583 6.30 0.23 6.98 0.19
16412

ACPD10, 16385–16423, 2010
Analysis of siteaerosol influence
V. E. Cachorro et al.
Title Page
Abstract Introduction
Conclusions References
Tables Figures
J I
J I
Back Close
Full Screen / Esc
Printer-friendly Version
Interactive Discussion
Discussion
Paper
|D
iscussionP
aper|
Discussion
Paper
|D
iscussionP
aper|
FIGURES
y = 1.12x
R2 = 0.99
y = 1.39x
R2 = 0.98
0.00
0.10
0.20
0.30
0.40
0.50
0.60
0.70
0.80
0.00 0.10 0.20 0.30 0.40 0.50 0.60 0.70 0.80
AOD (440 nm) measured
AO
D (
340
nm
) c
alc
ula
ted
alpha less 0.82
alpha GT. eq. 0.82
b)
Figure 1
y = 1.008x
R2 = 0.98
0.00
0.10
0.20
0.30
0.40
0.50
0.60
0.70
0.80
0.00 0.10 0.20 0.30 0.40 0.50 0.60 0.70 0.80
AOD(340 nm) measured
AO
D (
340 n
m)
calc
ula
ted
a)
Fig. 1. (a) Calculated AOD at 340 nm (based on extrapolated data at 440 nm using the alphaclimatological AERONET values) as function of measured AOD at 340 nm during a year ofmeasurements and its fit; (b) Calculated AOD values at 340 nm as function of the measuredAOD at 440 nm during the analysed period (2004–2008) for alpha less and greater than 0.82.Also both fits are shown.
16413

ACPD10, 16385–16423, 2010
Analysis of siteaerosol influence
V. E. Cachorro et al.
Title Page
Abstract Introduction
Conclusions References
Tables Figures
J I
J I
Back Close
Full Screen / Esc
Printer-friendly Version
Interactive Discussion
Discussion
Paper
|D
iscussionP
aper|
Discussion
Paper
|D
iscussionP
aper|
Figure 2
0.00
0.40
0.80
1.20
1.60
2.00
2.40
0.00 0.10 0.20 0.30 0.40 0.50 0.60 0.70
AOD(440 nm)
Alp
ha c
oeff
icie
nt
cloud-free datab)
a)
0.0 0.2 0.4 0.6 0.8 1.0 1.2 1.4 1.6 1.80
10
20
30
40
50
60
Co
un
ts
alpha coefficient
Figure 2
0.00
0.40
0.80
1.20
1.60
2.00
2.40
0.00 0.10 0.20 0.30 0.40 0.50 0.60 0.70
AOD(440 nm)
Alp
ha c
oeff
icie
nt
cloud-free datab)
a)
0.0 0.2 0.4 0.6 0.8 1.0 1.2 1.4 1.6 1.80
10
20
30
40
50
60
Co
un
ts
alpha coefficient
Fig. 2. (a) Frequency histogram of alpha values and (b) plot of alpha versus AOD at 440 nmduring the analysed OMI period (2004–2008) under cloud-free conditions.
16414

ACPD10, 16385–16423, 2010
Analysis of siteaerosol influence
V. E. Cachorro et al.
Title Page
Abstract Introduction
Conclusions References
Tables Figures
J I
J I
Back Close
Full Screen / Esc
Printer-friendly Version
Interactive Discussion
Discussion
Paper
|D
iscussionP
aper|
Discussion
Paper
|D
iscussionP
aper|
Fig. 3. (a) Dependence of the relative difference between OMI and Brewer UVER with respectto the aerosol optical depth (AOD) at 340 nm for cloud-free conditions. Grey points are thosewith alpha coefficient less than 0.82. The two fits are shown (b) OMI bias as function of AIindex where different subsets of aerosols specified by alpha and AOD values are represented(see text).
16415

ACPD10, 16385–16423, 2010
Analysis of siteaerosol influence
V. E. Cachorro et al.
Title Page
Abstract Introduction
Conclusions References
Tables Figures
J I
J I
Back Close
Full Screen / Esc
Printer-friendly Version
Interactive Discussion
Discussion
Paper
|D
iscussionP
aper|
Discussion
Paper
|D
iscussionP
aper|
0.00
0.10
0.20
0.30
0.40
0.50
0.60
0.70
0.80
-1.00 -0.50 0.00 0.50 1.00 1.50 2.00 2.50 3.00 3.50 4.00
AI
AO
D(4
40
nm
)
all alpha data
alpha less eq. 0.82
alpha GT. eq. 0.82 and AOD GT. 0.25
N=583 data
Polluted
DD,BB
Figure 4
0.00
0.10
0.20
0.30
0.40
0.50
0.60
0.70
0.80
-1.00 -0.50 0.00 0.50 1.00 1.50 2.00 2.50 3.00 3.50 4.00
AI
AO
D(4
40
nm
)
all alpha data
alpha less eq. 0.82
alpha GT. eq. 0.82 and AOD GT. 0.25
N=583 data
Polluted
DD,BB
Figure 4
Fig. 4. AOD at 440 nm as function of AI index where different subsets of aerosols are indicated.
16416

ACPD10, 16385–16423, 2010
Analysis of siteaerosol influence
V. E. Cachorro et al.
Title Page
Abstract Introduction
Conclusions References
Tables Figures
J I
J I
Back Close
Full Screen / Esc
Printer-friendly Version
Interactive Discussion
Discussion
Paper
|D
iscussionP
aper|
Discussion
Paper
|D
iscussionP
aper|
Figure 5
0.5
0.6
0.7
0.8
0.9
1
-1.00 -0.50 0.00 0.50 1.00 1.50 2.00 2.50 3.00 3.50 4.00
AI
SS
A(4
40 n
m)
all alpha data
alpha less 0.82
alpha less 0.82 and AOD GT. 0.25
alpha GT. eq 0.82 AOD GT. 0.25
0.92 b)
0.4
0.5
0.6
0.7
0.8
0.9
1
0.00 0.10 0.20 0.30 0.40 0.50 0.60 0.70 0.80
AOD(44O nm)
SS
A(4
40 n
m)
all alpha data
alpha less 0.82
N=583 data
a)
Fig. 5. (a) Mean day values of SSA at 440 nm of level 1.5 as function of AOD at 440 nm for theEl Arenosillo station for the 2004–2008 period and (b) as function of AI, where different subsetsof aerosols specified by alpha and AOD values are represented (see text).
16417

ACPD10, 16385–16423, 2010
Analysis of siteaerosol influence
V. E. Cachorro et al.
Title Page
Abstract Introduction
Conclusions References
Tables Figures
J I
J I
Back Close
Full Screen / Esc
Printer-friendly Version
Interactive Discussion
Discussion
Paper
|D
iscussionP
aper|
Discussion
Paper
|D
iscussionP
aper|
Figure 6
y = 0.95x + 0.056
R2 = 0.97
0.40
0.50
0.60
0.70
0.80
0.90
1.00
0.4 0.5 0.6 0.7 0.8 0.9 1
SSA(440 nm)
SS
A(3
40 n
m)
Figure 6
y = 0.95x + 0.056
R2 = 0.97
0.40
0.50
0.60
0.70
0.80
0.90
1.00
0.4 0.5 0.6 0.7 0.8 0.9 1
SSA(440 nm)
SS
A(3
40 n
m)
Fig. 6. Correlation and fit of SSA at 340 nm and 440 nm.
16418

ACPD10, 16385–16423, 2010
Analysis of siteaerosol influence
V. E. Cachorro et al.
Title Page
Abstract Introduction
Conclusions References
Tables Figures
J I
J I
Back Close
Full Screen / Esc
Printer-friendly Version
Interactive Discussion
Discussion
Paper
|D
iscussionP
aper|
Discussion
Paper
|D
iscussionP
aper|
Figure 7
0.70
0.75
0.80
0.85
0.90
0.95
1.00
300 400 500 600 700 800 900 1000 1100wavelength(nm)
SS
A
all data, OMI set (2004-2008)
all data without desert
desert dust
Level 1.5
SSA=0.916
El Arenosillo-AERONET
Figure 7
0.70
0.75
0.80
0.85
0.90
0.95
1.00
300 400 500 600 700 800 900 1000 1100wavelength(nm)
SS
A
all data, OMI set (2004-2008)
all data without desert
desert dust
Level 1.5
SSA=0.916
El Arenosillo-AERONET
Fig. 7. The mean values of SSA as function of wavelengths (level 1.5) for the period 2004–2008. The SSA spectral mean value when desert dust data are removed from the total and thespectral SSA for desert dust aerosol (this behaviour is the same as that given by level 2 SSA).
16419

ACPD10, 16385–16423, 2010
Analysis of siteaerosol influence
V. E. Cachorro et al.
Title Page
Abstract Introduction
Conclusions References
Tables Figures
J I
J I
Back Close
Full Screen / Esc
Printer-friendly Version
Interactive Discussion
Discussion
Paper
|D
iscussionP
aper|
Discussion
Paper
|D
iscussionP
aper|
Figure 8
0.70
0.75
0.80
0.85
0.90
0.95
1.00
300 400 500 600 700 800 900 1000 1100wavelength(nm)
SS
A
Paris, 2005-2009, level 1.5Paris 2005-2009, level 2Mexico, 1999-2009, level 1.5Mexico, 1999-2006, level 2GSFC, 1993-2009, level 1.5GSFC, 1993-2008, level 2
a)
0.70
0.75
0.80
0.85
0.90
0.95
1.00
300 400 500 600 700 800 900 1000 1100wavelength(nm)
SS
A
all data, OMI set (2004-2008)
desert dust, OMI set (2004-2008)
all data, 2000-2009, level 1.5
Palencia, 2003-2008, level 1.5
Palencia, 2003-2008, level 2
b)
0.70
0.75
0.80
0.85
0.90
0.95
1.00
300 400 500 600 700 800 900 1000 1100wavelength(nm)
SS
A
Paris, 2005-2009, level 1.5Paris 2005-2009, level 2Mexico, 1999-2009, level 1.5Mexico, 1999-2006, level 2GSFC, 1993-2009, level 1.5GSFC, 1993-2008, level 2
a)
0.70
0.75
0.80
0.85
0.90
0.95
1.00
300 400 500 600 700 800 900 1000 1100wavelength(nm)
SS
A
Paris, 2005-2009, level 1.5Paris 2005-2009, level 2Mexico, 1999-2009, level 1.5Mexico, 1999-2006, level 2GSFC, 1993-2009, level 1.5GSFC, 1993-2008, level 2
a)
0.70
0.75
0.80
0.85
0.90
0.95
1.00
300 400 500 600 700 800 900 1000 1100wavelength(nm)
SS
A
all data, OMI set (2004-2008)
desert dust, OMI set (2004-2008)
all data, 2000-2009, level 1.5
Palencia, 2003-2008, level 1.5
Palencia, 2003-2008, level 2
b)
0.70
0.75
0.80
0.85
0.90
0.95
1.00
300 400 500 600 700 800 900 1000 1100wavelength(nm)
SS
A
all data, OMI set (2004-2008)
desert dust, OMI set (2004-2008)
all data, 2000-2009, level 1.5
Palencia, 2003-2008, level 1.5
Palencia, 2003-2008, level 2
b)
Fig. 8. (a) Mean values of the spectral SSA for level 1.5 of El Arenosillo for the periods 2004–2008 (as in Fig. 6) and 2000–2008 with SSA for desert dust (as in Fig. 6) together with thoseof Palencia station as indicated. (b) The same for three representative cities and their corre-sponding periods of data for level 1.5 and 2.
16420

ACPD10, 16385–16423, 2010
Analysis of siteaerosol influence
V. E. Cachorro et al.
Title Page
Abstract Introduction
Conclusions References
Tables Figures
J I
J I
Back Close
Full Screen / Esc
Printer-friendly Version
Interactive Discussion
Discussion
Paper
|D
iscussionP
aper|
Discussion
Paper
|D
iscussionP
aper|
Figure 9
y = 3.42x + 1.10
R2 = 0.17
0.70
0.80
0.90
1.00
1.10
1.20
1.30
1.40
1.50
1.60
1.70
0.00 0.02 0.04 0.06 0.08 0.10
AAOD
Ra
tio
OM
I/B
rew
er
UVER, constant SSA=0.915a)
y = 1.16x + 1.14
R2 = 0.046
0.70
0.80
0.90
1.00
1.10
1.20
1.30
1.40
1.50
1.60
1.70
0.00 0.02 0.04 0.06 0.08 0.10 0.12 0.14 0.16 0.18 0.20
AAOD
Ra
tio
OM
I/B
rew
er
UVER, variable SSA(340 nm)b)
Fig. 9. Ratio of OMI/Brewer UVER data as function of aerosol absorption optical depth AAODand the corresponding fits for b determination (a) first approach bases on SSA constant and(b) second approach based on SSA variable.
16421

ACPD10, 16385–16423, 2010
Analysis of siteaerosol influence
V. E. Cachorro et al.
Title Page
Abstract Introduction
Conclusions References
Tables Figures
J I
J I
Back Close
Full Screen / Esc
Printer-friendly Version
Interactive Discussion
Discussion
Paper
|D
iscussionP
aper|
Discussion
Paper
|D
iscussionP
aper|
Figure 10
y = 1.18x - 1.89
R2 = 0.98
MBE=13.38
non corrected
y = 1.11x - 0.89
R2 = 0.98
MBE=8.40
corrected
0
50
100
150
200
250
300
0.00 50.00 100.00 150.00 200.00 250.00 300.00
UVER Brewer
UV
ER
OM
I
Non corrected
corrected SSA constant
Lineal (Non corrected)
y = 1.18x - 1.89
R2 = 0.98
MBE=13.38
uncorrected
y = 1.16x - 1.69
R2 = 0.98
MBE=11.65
corrected
0
50
100
150
200
250
300
0.00 50.00 100.00 150.00 200.00 250.00 300.00
UVER Brewer
UV
ER
OM
I
Non corrected
corrected SSA variable
Fig. 10. Correlations and fits of OMI and Brewer irradiances without correction and for the twocorrections: (a) first approach bases on SSA constant and (b) second approach based on SSAvariable.
16422

ACPD10, 16385–16423, 2010
Analysis of siteaerosol influence
V. E. Cachorro et al.
Title Page
Abstract Introduction
Conclusions References
Tables Figures
J I
J I
Back Close
Full Screen / Esc
Printer-friendly Version
Interactive Discussion
Discussion
Paper
|D
iscussionP
aper|
Discussion
Paper
|D
iscussionP
aper|
Figure 11
y = 0.0003x + 11.65
R2 = 1E-06
-30.0
-20.0
-10.0
0.0
10.0
20.0
30.0
40.0
50.0
0.00 0.10 0.20 0.30 0.40 0.50 0.60 0.70 0.80
AOD (340 nm)
Re
lati
ve
Dif
fere
nc
es
OM
I-B
rew
er(
%)
non corrected
corrected; b=1.554, SSA variable
corrected; b=3.425, SSA constant
y=0.0047x+8.4
R =0.00032
N=583 data
Fig. 11. Relative difference between OMI for UVER data as function of aerosol optical depthwithout correction when the two corrections are applied (a) for the first correction approach withSSA constant; (b) for the second correction approach with SSA variable.
16423