A study on the formation and trend of the Brewer-Dobson circulation
11
A study on the formation and trend of the Brewer‐Dobson circulation K. Okamoto, 1 K. Sato, 1 and H. Akiyoshi 2 Received 26 August 2010; revised 28 February 2011; accepted 4 March 2011; published 27 May 2011. [1] The Brewer‐Dobson circulation (BDC) is approximately expressed by the residual circulation (RC) and considered to be driven by the body force induced by the breaking and/or dissipation of atmospheric waves. The contribution of different types of waves to the RC in the Center for Climate System Research/National Institute for Environmental Studies (CCSR/NIES) Chemistry Climate Model (CCM) is diagnosed using the “downward control principle (DC).” Gravity wave drag (GWD) including orographic gravity wave drag (OGWD) has a great influence on the RC in the low and middle latitudes of the lower stratosphere. In particular, the summer hemispheric low‐latitude part of winter circulation is mainly formed by the GWD. These results are consistent with the estimates of the GWD contribution using reanalysis data by subtracting the resolved wave contribution from the RC with DC principle. In addition, it is seen that the net upward mass flux on the 70 hPa surface is strengthened during the 21st century because of the upward shift of the OGWD, which is consistent with previous studies. These conclusions indicate that gravity waves play an important role in maintaining the BDC. Citation: Okamoto, K., K. Sato, and H. Akiyoshi (2011), A study on the formation and trend of the Brewer‐Dobson circulation, J. Geophys. Res., 116, D10117, doi:10.1029/2010JD014953. 1. Introduction [2] Stratospheric chemical tracer distributions are modified by the global‐scale circulation consisting of an upwelling branch in the tropics and downwelling branches in the higher latitudes. This circulation is called the Brewer‐Dobson cir- culation (BDC), named after its discoverers, Brewer and Dobson, who observed water vapor and ozone, respectively [Brewer, 1949; Dobson, 1952]. It is recognized that most stratospheric air comes from the troposphere passing through the tropical tropopause. This troposphere‐stratosphere mass exchange controlled by the BDC is expressed as the net upward mass flux in the tropics, which is an index of the strength of the BDC [Holton, 1990]. The overturning time, which is defined as the mass of the atmosphere above 70 hPa (3.642 × 10 17 kg) divided by the annual mean net upward mass flux, is expected to be about five years based on observations and model simulations [Rosenlof, 1995]. The residual circulation (RC) is a good approximation of the BDC [Andrews et al., 1987], although the BDC is an overall stratospheric transport system including mixing processes as well. In this paper, a study regarding the BDC was made by focusing on the RC. The driving mechanism of the RC has been examined by some theoretical studies, and a well‐ known mechanism is “the downward control principle (DC)” proposed by Haynes et al. [1991]. According to this mechanism, the meridional flow is driven by the wave forcing in the middle latitudes associated with the breaking and/or dissipation of the waves propagating from the tro- posphere. The vertical flows are then induced in higher and lower latitudes by mass conservation. Since there is a fric- tional forcing in the lower boundary of the atmosphere, a flow can violate the conservation law of the angular momentum at ground surface; thus, the stratospheric wave forcing can drive the circulation below, although the stratospheric portion of the near‐ground return flow is minute. Previous studies suggest that the main driver of the RC is the wave forcing of planetary waves propagating into the middle stratosphere [Plumb, 2002; Shepherd, 2007]. They also suggest the importance of synoptic waves in the lower stratosphere and importance of the gravity waves in the mesosphere. In addition, it is known that gravity waves also influence the formation of the RC. In this study, the contribution of respective waves to the RC is examined in the meridional cross section using CCM data. In addition, similar analysis is performed using European Centre for Medium‐Range Weather Forecasts Reanalysis‐Interim (ERA‐Interim) data, which observational data were assimi- lated into, to confirm the model results. [3] Recent CCMs simulate future climate changes under the scenarios by IPCC regarding the increased rate of greenhouse gases (GHG) concentration and the scenarios by WMO regarding the increased rate of the concentrations of the ozone‐depleting substances [Intergovernmental Panel on Climate Change (IPCC), 2000; World Meteorological Organization/United Nations Environment Program (WMO/UNEP), 2003, chapter 6]. The change of the RC, which modifies the distribution of various minor con- 1 Department of Earth and Planetary Physics, University of Tokyo, Tokyo, Japan. 2 National Institute for Environmental Studies, Tsukuba, Japan. Copyright 2011 by the American Geophysical Union. 0148‐0227/11/2010JD014953 JOURNAL OF GEOPHYSICAL RESEARCH, VOL. 116, D10117, doi:10.1029/2010JD014953, 2011 D10117 1 of 11
Transcript of A study on the formation and trend of the Brewer-Dobson circulation

A study on the formation and trend of theBrewer‐Dobson circulation
K. Okamoto,1 K. Sato,1 and H. Akiyoshi2
Received 26 August 2010; revised 28 February 2011; accepted 4 March 2011; published 27 May 2011.
[1] The Brewer‐Dobson circulation (BDC) is approximately expressed by the residualcirculation (RC) and considered to be driven by the body force induced by the breakingand/or dissipation of atmospheric waves. The contribution of different types of wavesto the RC in the Center for Climate System Research/National Institute for EnvironmentalStudies (CCSR/NIES) Chemistry Climate Model (CCM) is diagnosed using the“downward control principle (DC).” Gravity wave drag (GWD) including orographicgravity wave drag (OGWD) has a great influence on the RC in the low and middlelatitudes of the lower stratosphere. In particular, the summer hemispheric low‐latitude partof winter circulation is mainly formed by the GWD. These results are consistent with theestimates of the GWD contribution using reanalysis data by subtracting the resolved wavecontribution from the RC with DC principle. In addition, it is seen that the net upwardmass flux on the 70 hPa surface is strengthened during the 21st century because of theupward shift of the OGWD, which is consistent with previous studies. These conclusionsindicate that gravity waves play an important role in maintaining the BDC.
Citation: Okamoto, K., K. Sato, and H. Akiyoshi (2011), A study on the formation and trend of the Brewer‐Dobson circulation,J. Geophys. Res., 116, D10117, doi:10.1029/2010JD014953.
1. Introduction
[2] Stratospheric chemical tracer distributions are modifiedby the global‐scale circulation consisting of an upwellingbranch in the tropics and downwelling branches in the higherlatitudes. This circulation is called the Brewer‐Dobson cir-culation (BDC), named after its discoverers, Brewer andDobson, who observed water vapor and ozone, respectively[Brewer, 1949; Dobson, 1952]. It is recognized that moststratospheric air comes from the troposphere passing throughthe tropical tropopause. This troposphere‐stratosphere massexchange controlled by the BDC is expressed as the netupward mass flux in the tropics, which is an index of thestrength of the BDC [Holton, 1990]. The overturning time,which is defined as the mass of the atmosphere above 70 hPa(3.642 × 10¹⁷ kg) divided by the annual mean net upwardmass flux, is expected to be about five years based onobservations and model simulations [Rosenlof, 1995]. Theresidual circulation (RC) is a good approximation of theBDC [Andrews et al., 1987], although the BDC is an overallstratospheric transport system including mixing processes aswell. In this paper, a study regarding the BDC was made byfocusing on the RC. The driving mechanism of the RC hasbeen examined by some theoretical studies, and a well‐known mechanism is “the downward control principle(DC)” proposed by Haynes et al. [1991]. According to this
mechanism, the meridional flow is driven by the waveforcing in the middle latitudes associated with the breakingand/or dissipation of the waves propagating from the tro-posphere. The vertical flows are then induced in higher andlower latitudes by mass conservation. Since there is a fric-tional forcing in the lower boundary of the atmosphere, aflow can violate the conservation law of the angularmomentum at ground surface; thus, the stratospheric waveforcing can drive the circulation below, although thestratospheric portion of the near‐ground return flow isminute. Previous studies suggest that the main driver of theRC is the wave forcing of planetary waves propagating intothe middle stratosphere [Plumb, 2002; Shepherd, 2007].They also suggest the importance of synoptic waves in thelower stratosphere and importance of the gravity waves inthe mesosphere. In addition, it is known that gravity wavesalso influence the formation of the RC. In this study, thecontribution of respective waves to the RC is examined inthe meridional cross section using CCM data. In addition,similar analysis is performed using European Centre forMedium‐Range Weather Forecasts Reanalysis‐Interim(ERA‐Interim) data, which observational data were assimi-lated into, to confirm the model results.[3] Recent CCMs simulate future climate changes under
the scenarios by IPCC regarding the increased rate ofgreenhouse gases (GHG) concentration and the scenarios byWMO regarding the increased rate of the concentrations ofthe ozone‐depleting substances [Intergovernmental Panelon Climate Change (IPCC), 2000; World MeteorologicalOrganization/United Nations Environment Program(WMO/UNEP), 2003, chapter 6]. The change of the RC,which modifies the distribution of various minor con-
1Department of Earth and Planetary Physics, University of Tokyo,Tokyo, Japan.
2National Institute for Environmental Studies, Tsukuba, Japan.
Copyright 2011 by the American Geophysical Union.0148‐0227/11/2010JD014953
JOURNAL OF GEOPHYSICAL RESEARCH, VOL. 116, D10117, doi:10.1029/2010JD014953, 2011
D10117 1 of 11

stituents, is important for the ozone recovery owing to twopossible reasons. The first is its transport ability, and thesecond is the adiabatic heating/cooling that influences theformation of the polar stratospheric cloud, and thus indi-rectly influences the ozone destruction through heteroge-neous reaction on it. Most CCM simulations indicate astrengthening of the BDC [Butchart et al., 2000, 2006;Garcia and Randel, 2008; McLandress and Shepherd,2009]. It is generally expected that GHG increase modi-fies the radiative balance to cause warming in the tropo-sphere and cooling in the stratosphere. The temperaturefluctuation causes a change in the background wind fieldthrough the thermal wind balance, and hence leads to achange of the spatial distribution of the wave forcings[Garcia and Randel, 2008;McLandress and Shepherd, 2009].McLandress and Shepherd [2009] showed an increasetrend of the net upward mass flux at the 70 hPa surface inthe 21st century using Canadian Middle Atmosphere Model(CMAM) data. They concluded that this increase is largelydue to the upward shift of the orographic gravity wave drag(OGWD) to around 70 hPa. In this study, the change in thewave forcing distribution for interannual variability of thenet upward mass flux is examined using the Center forClimate System Research/National Institute for Environ-mental Studies CCM (CCSR/NIES CCM) REF2 data pro-viding a diagnosis using a different CCM to compare withthe results obtained by McLandress and Shepherd [2009].[4] The configuration of this paper is as follows. In
section 2, we discuss the DC principle by Haynes et al.[1991] and derive several important formulas used in thisstudy. Description of CCSR/NIES CCM and ERA‐Interimdata is made in section 3. In section 4, the DC theory isapplied to evaluate the respective contribution of variouswaves, including planetary, synoptic and gravity waves, tothe formation of the RC. A comparison of reanalysis dataconfirms the results. In section 5, we examine the trend ofthe RC in the 21st century in terms of the stream functionand the net upward mass flux, particularly, the effects ofgravity wave drag on the RC. Summary and concludingremarks are given in section 6.
2. The Downward Control Analysis
[5] The DC principle [Haynes et al., 1991] is a usefultheory for evaluating contributions of different types ofwave drag to the residual mean circulation. This principlestates that in the steady state, the extratropical meridionalmass flow is controlled solely by the sum of all zonal forcesabove the pressure surface. Several important formulas arederived to show the DC principle for zonal mean fields inthe steady condition in the transformed Eulerian mean(TEM) framework [Andrews et al., 1987].
2.1. The Residual Circulation
[6] In the steady state, zonal momentum equation in log‐pressure coordinates in the TEM system is written as
�f̂ v* ¼ 1
�0a cos�r � Fþ X ¼ F ; ð1Þ
r � F ¼ 1
a cos�
@
@�F� cos�� �þ @
@zFz; ð2Þ
F ¼ �0a cos� uzv′�′
�z� v′u′; f̂
v′�′
�z� w′u′
� �� F�;Fz
� �; ð3Þ
where X represents any unresolved zonal force (e.g.,GWD); r · F is the divergence of the resolved Eliassen‐Palm (E‐P) flux (EPFD); v* and w* are the meridional andvertical components of the residual velocity, respectively; ais the radius of the Earth; � is the latitude; u is the zonalmean zonal wind; f = 2W sin � is the Coriolis parameterwhere W is the rotation rate of the Earth; z is the log‐pressureheight; r0 is the reference density of air; and f̂ = f − (a cos�)−1∂(u cos �)/∂�. In spherical coordinates the continuityequation is expressed as
1
a cos�
@
@�v* cos�ð Þ þ 1
�0
@
@z�0w*ð Þ ¼ 0: ð4Þ
Thus, a stream function for the residual velocities can bedefined as
v* � � 1
�0 cos�
@Y@z
; w* � 1
�0a cos�
@Y@�
: ð5Þ
By substituting (5) into (1), integrating with respect to z, andrewriting in pressure coordinates we obtain
Y �; pð Þ ¼ cos�
g
Z 0
p
Ff̂dp′; ð6Þ
where g is the gravitational acceleration. This equation is animportant equation for the analysis of this paper. Equation (6)indicates that the strength and direction of the residualcirculation at a given latitude � and a pressure level p isexpressed by the sum of all zonal forcings above the pressurelevel p at the latitude �. The stream function is calculated sothat the stream function at the top of atmosphere is 0.[7] In this paper, a subscript to show “direct” is used for
the result calculated by the TEM analysis using (5), that is,Ydirect. The subscripts “dc”, “gwd” and “epfd” are used torepresent the contribution of the zonal forcing by all waves,parameterized gravity waves, and resolved waves, respec-tively, which are calculated by the DC analysis using (6), thatis, Ydc, Ygwd, and Yepfd.
2.2. The Vertical Mass Flux
[8] The net vertical mass flux is also an important quantityfor the expression of the RC because it is equivalent to thetroposphere‐stratosphere mass exchange. Following Holton[1990], the area‐averaged extratropical vertical massfluxes across an isobaric surface in the northern hemisphere(NH) and southern hemisphere (SH), Fdirect
NH and FdirectSH , are
expressed as
FNHdirect ¼ 2�a2�0
Z �=2
�NHt
w*direct cos� d�; ð7Þ
and
FSHdirect ¼ 2�a2�0
Z �SHt
��=2w*direct cos� d�; ð8Þ
OKAMOTO ET AL.: FORMATION AND TREND OF THE BREWER‐DOBSON CIRCULATION D10117D10117
2 of 11

respectively. Here, �tNH and �t
SH are the so‐called turn-around latitudes (TLs) in the NH and SH, respectively,where tropical upwelling changes to extratropical down-welling; in other words, the latitudes at which the magnitudeof the mass stream function Ydirect is maximized. Note thatFdirectNH and Fdirect
SH provide the sum of the downward massflux in respective hemispheres in the stratosphere becausethe sign of wdirect* anywhere in the region between the TLand a pole is usually negative. As Y vanishes at the poles,the net downward mass fluxes in respective hemispheres aregiven using (5), by
FNHdirect ¼ �2�aYdirect �
NHt
� � ð9Þ
FSHdirect ¼ 2�aYdirect �
SHt
� �: ð10Þ
Thus, FdirectNH and Fdirect
SH depend on stream function valuesonly at TLs. From the constraint of zero global average massflux, the net upward mass flux, which appears mainly in thetropics, is given by
F trdirect ¼ � FNH
direct þ FSHdirect
� � ¼ 2�a Ydirect �NHt
� �� Ydirect �SHt
� �� �:
ð11Þ
These mass fluxes can also be evaluated by the DC theoryusing Ydc at the TLs. Note that the stream function at a TLdepends only on the zonal force at the TL (see equation (6)).
3. Description of the Model and Data Set
[9] The CCSR/NIES CCM simulation whose data is usedin this study was made as a part of Stratospheric ProcessesAnd their Role in Climate (SPARC) Chemistry‐ClimateModel Validation (CCMVal) research activity. The modelincludes a fully interactive stratospheric chemistry module,radiation scheme, and other parameterizations [Eyring et al.,2006]. The model has 34 vertical layers in sigma coordinatesat height intervals of one to a few kilometers with a top levelat 0.012 hPa. The vertical resolution around the pressurelevel of 70 hPa, the focused level in this paper, is 1–2 km,which is comparable to that of McLandress and Shepherd[2009] around the level. The horizontal resolution is T42(about 2.8° × 2.8°). Gravity wave parameterizations wereused to include the effects of subgrid‐scale gravity waves.McFarlane’s [1987] scheme was applied as the orographicgravity wave parameterization, while the nonorographicgravity wave parameterization as presented by Hines [1997]was incorporated. Outputs from the REF2 run of theCCMVal that simulated the atmospheric fields in the 21stcentury were used in the present study. In the calculation,the time evolution scenario of the greenhouse gases such asthe CO2, CH4, and N2O concentrations at the surface wastaken from the IPCC‐A1B scenario [IPCC, 2000], and thatof halogen gases was taken from the WMO‐Ab scenario[WMO/UNEP, 2003], not including the effects of thequasi‐biennial oscillation (QBO), the 11 year solar cycle,and volcanic eruptions. The monthly mean sea surface tem-perature data were provided from the 20th century simulationwith an atmosphere‐ocean coupled general circulation model(CGCM). The CGCM is called MIROC and was developedby CCSR, NIES, and the Frontier Research Center for Global
Change (FRCGC). This model data is useful for examiningthe present and future stratospheric climate because thismodel well reproduces dynamical fields and reasonablefuture ozone change, although severe cold bias is observed inthe tropical tropopause and southern polar region comparedwith the other models in CCMVal [Eyring et al., 2006;Butchart et al., 2010]. See Akiyoshi et al. [2009, 2010] formore details of this model description. Physical quantities areinterpolated to 31 vertical layers with a top level of 0.1 hPa inisobaric coordinates to ease analysis.[10] Analyses for the time period 2000–2008 are per-
formed as the “present1” climate in section 4. In section 5,the “present2” and “future” climates refers to the timeperiods of 1995–2010 (including the “present1” climate)and 2065–2080, respectively. The analyses on long‐termclimate change were made by comparing the present2 andfuture climates in section 5. Linear trends are estimated forthe time period of 2005–2070 for various parameters.[11] The performance of the CCSR/NIES CCM is evalu-
ated by comparison with the ERA‐Interim data. Physicalparameters in ERA‐Interim data used in this study aresmoothed to lower the horizontal resolution to 3° × 3°,which is comparable to that of CCSR/NIES CCM. Figure 1shows the zonal mean zonal wind calculated from the CCMdata and from ERA‐Interim data in the NH winter months,December–February (DJF), for the present1 climate. Thestrength and positions of the tropospheric and stratosphericjets are well reproduced by the CCM; for instance, sub-tropical jets in the NH are located around a latitude of 30°and around 200 hPa with a magnitude of about 40 m s−1.This assures that the results on the RC obtained by theanalysis using the CCM are realistic, although the polarnight jet in the NH is slightly stronger in CCM data than inERA‐Interim data. Note that the jet structure plays animportant role in the propagation and dissipation of bothresolved and parameterized waves.
4. The Contribution of Wave Forcing to the BDC
[12] In this section, validity of the DC analysis is firstconfirmed by comparing Ydc and Ydirect in the meridionalcross section. Next, the contributions of respective waves tothe formation of RC are separately examined using the CCMdata. The effect of gravity wave drag is estimated for ERA‐Interim data through the DC theory and comparing it withthe CCM results. Finally in this section, the net upwardmass flux is examined in terms of seasonal variation andcontribution of each wave drag.
4.1. Results From the CCM Data Analysisand Validation of the DC Analysis
[13] Figure 2 shows the meridional cross sections of massstream function obtained by the DC analysis and directcalculation for the present1 climate in DJF when the RC isstrongest. The DC analysis is considered to be appropriateonly for solstice seasons because a steady state condition isassumed. The DC analysis is also not available for the tro-pics because of f̂ in the denominator of equation (6). Thus,Figures 2a and 2c–2h show the results only in the latitudeshigher than 10°.[14] It is clear that Ydc, the sum of Yepfd and Ygwd, is in
good agreement with Ydirect in terms of strength and loca-
OKAMOTO ET AL.: FORMATION AND TREND OF THE BREWER‐DOBSON CIRCULATION D10117D10117
3 of 11
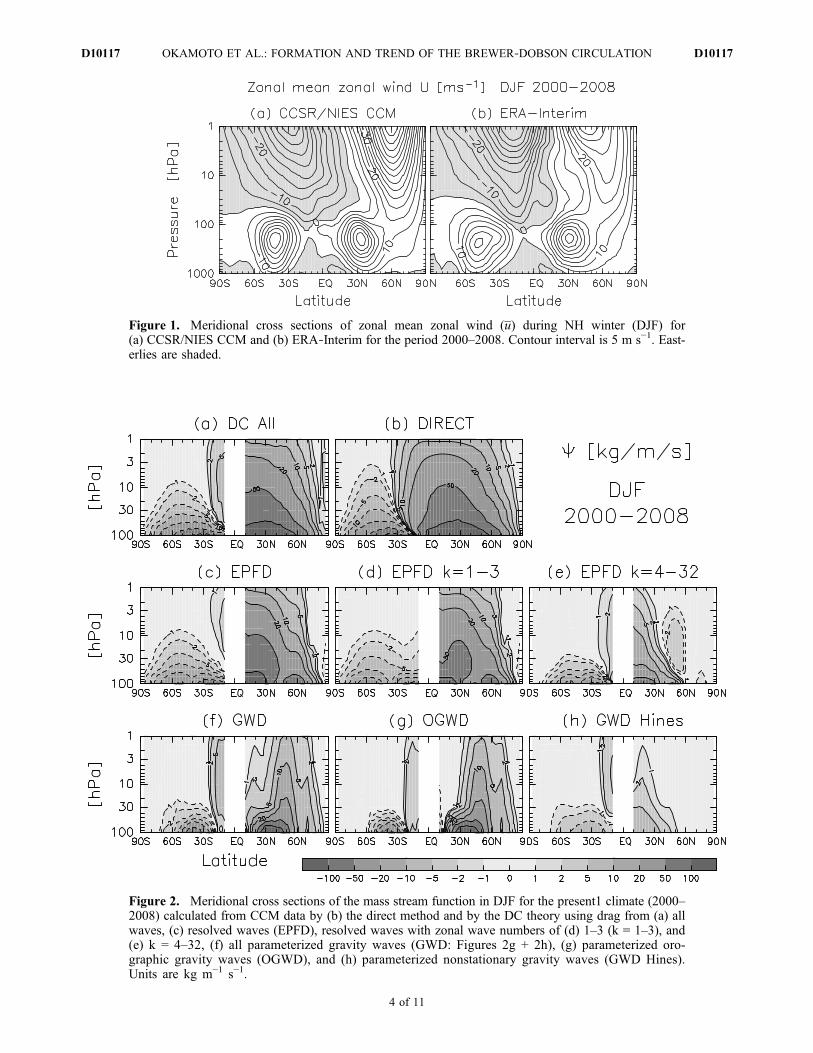
Figure 1. Meridional cross sections of zonal mean zonal wind (u) during NH winter (DJF) for(a) CCSR/NIES CCM and (b) ERA‐Interim for the period 2000–2008. Contour interval is 5 m s−1. East-erlies are shaded.
Figure 2. Meridional cross sections of the mass stream function in DJF for the present1 climate (2000–2008) calculated from CCM data by (b) the direct method and by the DC theory using drag from (a) allwaves, (c) resolved waves (EPFD), resolved waves with zonal wave numbers of (d) 1–3 (k = 1–3), and(e) k = 4–32, (f) all parameterized gravity waves (GWD: Figures 2g + 2h), (g) parameterized oro-graphic gravity waves (OGWD), and (h) parameterized nonstationary gravity waves (GWD Hines).Units are kg m−1 s−1.
OKAMOTO ET AL.: FORMATION AND TREND OF THE BREWER‐DOBSON CIRCULATION D10117D10117
4 of 11

tion. This good quantitative agreement between Ydc andYdirect assures that the DC analysis provides accurate esti-mates of the RC in the stratosphere. Thus, further analysis ismade for the contribution of each kind of wave force tothe RC.[15] Overall structure of the RC is primarily determined
by the resolved waves, especially planetary waves [Plumb,2002] in the NH except for the middle latitudes, which isconsistent with the result of McLandress and Shepherd[2009]. The NH cell of Ydirect extends much higher intothe stratosphere compared with that of the SH mainly as aresult of significant differences in the planetary wave dragbetween the two hemispheres as indicated by Figure 2d. Theplanetary waves hardly propagate into the stratosphere inthe summer hemisphere where the easterly is dominant. Theeffects of synoptic wave drag are confined to the low lati-tudes and midlatitudes of the NH and do not extend deepinto the stratosphere in the midlatitudes and high latitudes(Figure 2e). The circulation induced by OGWD is confinedmainly to the middle latitudes in the NH (Figure 2g). TheOGWD‐induced and EPFD‐induced circulations are com-parable in the middle latitudes around 35°N in the lowerstratosphere (below 50 hPa). The effect of nonstationary‐GWD (GWD Hines) is generally small, though it is signif-icant in the subtropics (Figure 2h).[16] Another interesting point obtained in Figure 2 is that
GWD‐induced circulation is dominant in the summerhemisphere upwelling part (about 20°S) of the winterhemisphere cell (Figure 2f). This fact suggests that theGWD plays an important role for the extension of the wintercell to the summer hemisphere. This feature is not reportedin previous studies.
4.2. The Estimation of GWD Contribution UsingReanalysis Data
[17] The validity of the results from the CCM data analysisis confirmed using ERA‐Interim data. The stream function ofRC is calculated directly as Ydirect and the contribution of theE‐P flux divergence, Yepfd, is calculated by using the DCtheory. As Ydirect includes the effects of all waves in theatmosphere, GWD‐induced circulation Ygwd† can be esti-mated by subtracting Yepfd from Ydirect, that is,
Ygwdy ¼ Ydirect � Yepfd: ð12Þ
Such estimates are possible in the steady state because the DCtheory indicates that the mass stream function, the residualvelocity, and the mass flux are all linear as to the wave forcingF .[18] Figure 3 shows the mass stream functions calculated
by the direct method (Figures 3a and 3d), by the DC theoryfor resolved wave forcing (Figures 3b and 3e), and indi-rectly for gravity waves (Figures 3c and 3f) for DJF in thepresent1 climate from ERA‐Interim data and CCM data,respectively. The RC estimated from ERA‐Interim data(Figure 3a) consists of two‐celled circulation, and is stron-ger in the NH than in the SH, which is in accord with theCCM result (Figure 3d).[19] The calculation of Y at a given pressure level is
performed by integrating v* (equation (5)), or by integratingwave drag (equation (6)) from the pressure to the top ofatmosphere (0 hPa). Thus, the circulation in the upperstratosphere over 5 hPa is not obtained because of a lack ofERA‐Interim data. The higher part of Y is, therefore, more
Figure 3. Same as Figure 2 but for the result using (a, b, and c) ERA‐Interim data and (d, e, and f) CCMdata. Ygwd† (Figures 3c and 3f) are estimated as the difference between Ydirect (Figures 3a and 3d) andYepfd (Figures 3b and 3e).
OKAMOTO ET AL.: FORMATION AND TREND OF THE BREWER‐DOBSON CIRCULATION D10117D10117
5 of 11

largely affected by the missing of the data; hence, the dif-ference observed in the upper stratosphere between theCCM and ERA‐Interim should not be overinterpreted. Inaddition, Ygwd† in CCM (Figure 3f) and Ygwd† in ERA‐Interim (Figure 3c) are different in some regions. There are afew possible explanations: forcings other than GWD,assumption of a steady state, and interannual variabilities inthese regions. This point is, however, beyond the scope ofthis paper.[20] However, the overall RC characteristics in the ERA‐
Interim data in the lower stratosphere are similar to the CCMresults, assuring the validity of the results from the CCMdata analysis: The resolved wave drag is a main componentin determining the overall structure of the RC, though thereare some differences in the planetary wave activity betweenthe CCM and ERA‐Interim results: for example, the plan-etary wave activity in the lower stratosphere is stronger inlow latitudes and weaker in high latitudes for the CCMresults (Figures 3b and 3e). The GWD considerably influ-ences the RC in the lower stratosphere. It is of interest thatYgwd† is dominant in the summer hemispheric upwellingbranch of the winter RC cell, which is also consistent withthe CCM results as noted above. In other words, it is sug-gested that the winter circulation of RC can extend to thesummer hemisphere by the existence of the GWD.
4.3. The Wave Forcing Role in the Net UpwardMass Flux
[21] Contributions of zonal wave forcings to the netupward mass flux at 70 hPa in DJF for the present1 climateusing CCM and ERA‐Interim data are summarized in Figure4. The contribution of GWD is as large as that of EPFD inERA‐Interim data. Thus, GWD and EPFD are essential tothe mass circulation in the lower stratosphere. Figure 4 alsoshows the indirect estimation of the contribution of GWD at70 hPa using CCM data. The value agrees with the sum ofthose of parameterized OGWD and nonorographic GWDusing CCM data within 0.1%. This result suggests that theDC analysis can be applied in DJF, and can be used for
accurate evaluation of the contribution of GWD using ERA‐Interim data.
5. The Trend of the BDC
[22] In this section, possible changes of the RC in the 21stcentury are examined using projection data from the CCMREF2 run. Linear trends in the time period 2005–2070 ofthe residual mass stream function are calculated and dis-cussed. The long‐term variation of the contributions ofrespective wave forcings to the net upward mass flux isshown.
5.1. Linear Trend of the BDC
[23] Figure 5 shows linear trend of the seasonal meanmass stream function for DJF calculated by the directmethod and by the DC theory for each wave force contri-bution. The NH cell in the lower stratosphere and a sub-tropical part of the SH cell in the lower stratosphere areintensified. The trend of the annual mean residual circula-tion Ydirect consists of two cells with the same sign as thepresent1 climate except for the Antarctic region, indicatingstrengthening of the residual circulation at most heights.This feature is consistent with the results from the other CCMruns [Butchart et al., 2006;McLandress and Shepherd, 2009].[24] Similarity of Ydirect (Figure 5b) and Ydc (Figure 5a)
except for the NH subtropics around 10 hPa assures thevalidity of the DC analysis for trends. In the lower strato-sphere, the trend of the circulation driven by the resolvedwave drag (Figure 5c) consists of two or three cells in theNH. It is also seen by comparing Figures 5d and 5e thatplanetary waves are the most important among the resolvedwaves. The trend by OGWD has a positive cell in themiddle latitudes of the NH. This positive cell by OGWD isstronger than the negative cell by EPFD, resulting in one‐celled circulation in the NH lower stratosphere. Therefore,OGWD is important for strengthening the trend of the RC.In addition, the positive peak of the OGWD trend in thelower stratosphere significantly affects the net upward massflux trend because the mass flux is determined only by the
Figure 4. Contribution of each wave forcing to the net upward mass flux for DJF for the present1 cli-mate (2000–2008).
OKAMOTO ET AL.: FORMATION AND TREND OF THE BREWER‐DOBSON CIRCULATION D10117D10117
6 of 11

stream function at the TL around 30° (see equation (11) andsection 5.2). Synoptic wave drag effects are confined to lowlatitudes of the lower stratosphere and in middle latitudes ofthe middle stratosphere (Figure 5e). The circulation inducedby nonstationary gravity waves has weak but intensifyingtrend, particularly, for low latitudes of the middle strato-sphere in both the hemispheres (Figure 5h).[25] In section 4, the importance of GWD for the winter
circulation extending to the summer hemisphere was denoted.In spite of the positive trend of the RC in the summer hemi-spheric subtropics of the middle stratosphere (Figure 5b), thetrend of stream function estimated by the downward controlanalysis is unclear due to insignificance (Figure 5a).
5.2. Long‐Term Change of the Net Upward Mass Flux
[26] Figure 6a shows time series of the net upward massflux at 70 hPa for DJF. The net upward mass flux has astrong seasonal cycle with a maximum in DJF [Rosenlof,1995]. The net upward mass flux Fdirect
tr shows a nearlylinear trend in each season, which agrees with the increasedtrend of RC in the tropics and the results of Butchart et al.[2006], Garcia and Randel [2008], and McLandress andShepherd [2009]. The colored curves in Figure 6 denotethe contributions of different types of wave drag to the netupward mass flux obtained from the DC analysis for DJF.Although the resolved wave drag (blue) accounts for morethan half of the upward mass flux for solstice seasons in the
past climate, the trend of the upward mass flux by OGWD(pink) is comparable to and/or greater than that by theplanetary wave drag. These results are consistent with thoseof McLandress and Shepherd [2009] using the CMAM. Toexamine the contribution of each hemisphere to the netupward mass flux, the downward mass flux is shown sep-arately for the NH and SH in DJF in Figures 6b and 6c. Thenet downward mass flux is larger in the northern (winter)hemisphere for DJF during the entire period of 1978–2100than in the southern (summer) hemisphere. Positive trendsare seen for the net downward mass flux in all panels ofFigure 6. The contribution of planetary wave drag (green) isdominant for the mass fluxes in the winter hemispheres.However, the trend of the contribution of the OGWD (pink)is largest for both hemispheres. The contribution of OGWDto the mass flux becomes comparable to that of the EPFD(blue) in the late 21st century. This result is different fromthat of McLandress and Shepherd [2009]; in their results,OGWD contribution is smaller than EPFD contributionthroughout the 21st century. The magnitude of peaks ofOGWD around 30°N in CCSR/NIES is about 2 m s−1 d−1
(see Figure 7), which is similar to the settings byMcFarlane[1987] or Palmer et al. [1986].
5.3. The OGWD Trend Mechanism
[27] In this section, we will examine the change in theOGWD effect during the 21st century. According to the DC
Figure 5. Same as Figure 2 but for linear trend of the mean stream function in DJF in the time period2005–2070. Dark shading denotes the under 80% confidence levels.
OKAMOTO ET AL.: FORMATION AND TREND OF THE BREWER‐DOBSON CIRCULATION D10117D10117
7 of 11

theory, the stream function of the residual circulation at agiven pressure level is not influenced by the wave dragbelow the pressure level (equation (6)). Moreover, the netupward mass flux and its trend that are defined at 70 hPadepend on the sum of wave drag only at TLs (seeequations (6) and (11)). The vertical distributions of EPFDand OGWD around 30°N in DJF are shown in Figure 7. Thefocused latitude 30°N is given by the TL at the 70 hPasurface in the NH. The difference between the future andpresent2 climate is responsible for the trend of the netupward mass flux. The OGWD in the height range between70 hPa and 30 hPa in the future climate is significantly large,1.25–2.73 times of magnitude than that in the present2 cli-mate, while the difference in EPFD over 70 hPa is notremarkable. These differences are consistent with theincreasing trend of the OGWD‐induced mass flux andunremarkable trend of the EPFD‐induced mass flux in DJF(Figure 6).
[28] Two possible mechanisms are considered for deter-mining the change of OGWD. One is the change in the sourcemomentum flux, and the other is the change in the distri-bution of the region in which the wave breaks in themeridional cross section. The latter would be reconfirmationof the result by McLandress and Shepherd [2009]. In CCM,the effects of the orographic gravity waves are includedusing the parameterization scheme developed byMcFarlane[1987]. Orographic gravity waves are excited in a stablystratified air flowing over irregular terrain. Such waves maypropagate freely to considerable altitudes before being sig-nificantly dissipated or absorbed. The wave drag parame-terization developed by McFarlane is based on simple lineartheory: The momentum flux divergence occurs in associa-tion with the breaking of the stationary monochromaticgravity waves, in which the wave breaking is expressed bythe wave saturation hypothesis as proposed by Lindzen[1981].
Figure 6. Time series of DJF mean net vertical mass flux at 70 hPa in (a) tropics (Ftr), (b) NH (FNH),and (c) SH (FSH). Direct calculation (black), DC estimations using OGWD (pink), EPFD (blue), planetarywave drag (green), synoptic wave drag (yellow), nonorographic gravity wave drag (red), and all waveforcing (purple) are displayed in each panel.
Figure 7. Vertical profiles of EPFD and OGWD at a TL in NH at in DJF. The TL is estimated at 70 hPa(about 30°N). Solid lines are results for the future (2065–2080), and dashed lines for the present2 (1995–2010). The horizontal line shows the height of 70 hPa.
OKAMOTO ET AL.: FORMATION AND TREND OF THE BREWER‐DOBSON CIRCULATION D10117D10117
8 of 11
[29] The source momentum flux of the orographic gravitywave at the ground, t, is approximately expressed byMcFarlane’s parameterization
� � �h2
2�0N0U0; ð13Þ
where m is the wave number; h is the amplitude of theorographic perturbation; r0 is the air density at the groundsurface; N0 is the Brunt‐Väisälä frequency at the groundsurface; and U0 is the magnitude of the horizontal surfacewind.[30] The source momentum flux is reproduced using
equation (13) since the data was not saved. The difference inthe source momentum flux of the orographic gravity wavesat the surface between the future and present2 climate is lessthan 5% (not shown). This fact suggests that the sourceintensity of orographic gravity wave is not the main factor tomodify the effect of OGWD in the trend of the residualcirculation in the lower stratosphere.[31] Another important mechanism determining the
OGWD is wave breaking, which occurs when the amplitudeof horizontal wind fluctuations associated with the oro-graphic gravity wave exceeds the mean wind and when thevertical structure of temperature gets unstable. In suchsituations, the OGWD parameterization adjusts t to a criti-cal value so as to make the static stability neutral. This is thewave saturation hypothesis [Lindzen, 1981]. The OGWD isthen obtained as convergence of t,
@U
@t¼ g
@�
@p: ð14Þ
The breaking of orographic gravity wave tends to occurmore easily when the mean wind is weaker. Thus, the peakof OGWD is located in the weak wind region above thesubtropical jet core. See McFarlane [1987] for detaileddiscussion.[32] The trends of OGWD, EPFD, and zonal mean zonal
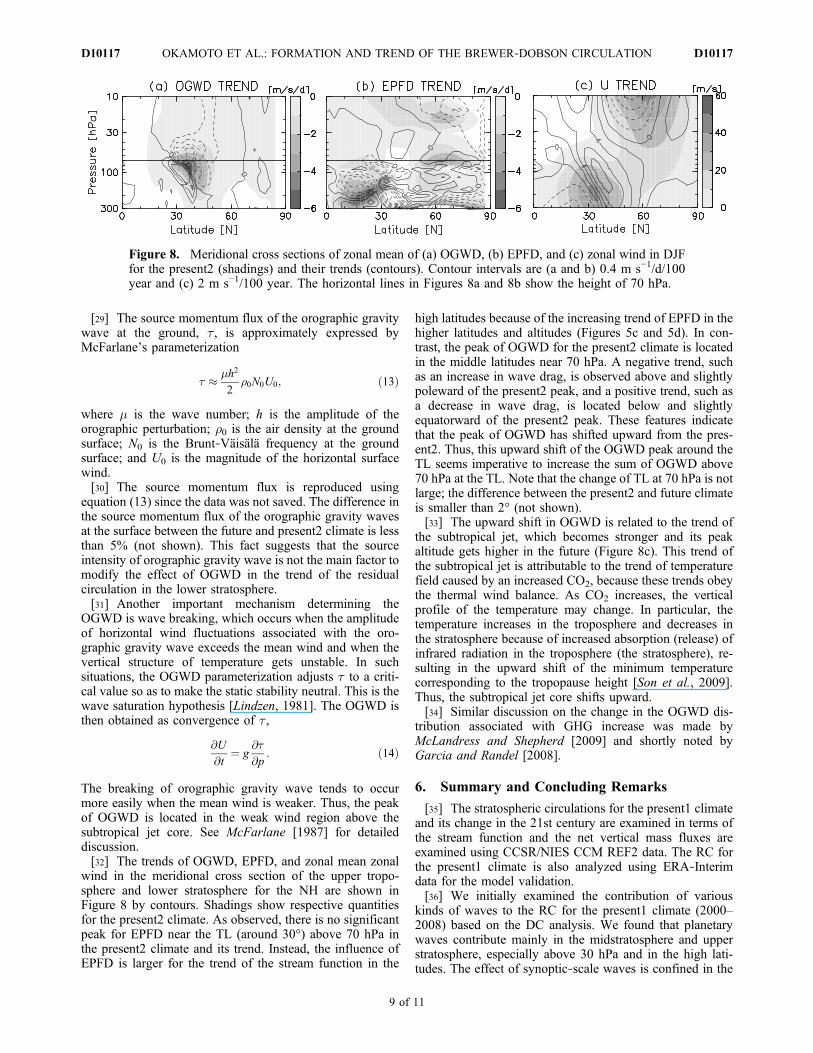
wind in the meridional cross section of the upper tropo-sphere and lower stratosphere for the NH are shown inFigure 8 by contours. Shadings show respective quantitiesfor the present2 climate. As observed, there is no significantpeak for EPFD near the TL (around 30°) above 70 hPa inthe present2 climate and its trend. Instead, the influence ofEPFD is larger for the trend of the stream function in the
high latitudes because of the increasing trend of EPFD in thehigher latitudes and altitudes (Figures 5c and 5d). In con-trast, the peak of OGWD for the present2 climate is locatedin the middle latitudes near 70 hPa. A negative trend, suchas an increase in wave drag, is observed above and slightlypoleward of the present2 peak, and a positive trend, such asa decrease in wave drag, is located below and slightlyequatorward of the present2 peak. These features indicatethat the peak of OGWD has shifted upward from the pres-ent2. Thus, this upward shift of the OGWD peak around theTL seems imperative to increase the sum of OGWD above70 hPa at the TL. Note that the change of TL at 70 hPa is notlarge; the difference between the present2 and future climateis smaller than 2° (not shown).[33] The upward shift in OGWD is related to the trend of
the subtropical jet, which becomes stronger and its peakaltitude gets higher in the future (Figure 8c). This trend ofthe subtropical jet is attributable to the trend of temperaturefield caused by an increased CO2, because these trends obeythe thermal wind balance. As CO2 increases, the verticalprofile of the temperature may change. In particular, thetemperature increases in the troposphere and decreases inthe stratosphere because of increased absorption (release) ofinfrared radiation in the troposphere (the stratosphere), re-sulting in the upward shift of the minimum temperaturecorresponding to the tropopause height [Son et al., 2009].Thus, the subtropical jet core shifts upward.[34] Similar discussion on the change in the OGWD dis-
tribution associated with GHG increase was made byMcLandress and Shepherd [2009] and shortly noted byGarcia and Randel [2008].
6. Summary and Concluding Remarks
[35] The stratospheric circulations for the present1 climateand its change in the 21st century are examined in terms ofthe stream function and the net vertical mass fluxes areexamined using CCSR/NIES CCM REF2 data. The RC forthe present1 climate is also analyzed using ERA‐Interimdata for the model validation.[36] We initially examined the contribution of various
kinds of waves to the RC for the present1 climate (2000–2008) based on the DC analysis. We found that planetarywaves contribute mainly in the midstratosphere and upperstratosphere, especially above 30 hPa and in the high lati-tudes. The effect of synoptic‐scale waves is confined in the
Figure 8. Meridional cross sections of zonal mean of (a) OGWD, (b) EPFD, and (c) zonal wind in DJFfor the present2 (shadings) and their trends (contours). Contour intervals are (a and b) 0.4 m s−1/d/100year and (c) 2 m s−1/100 year. The horizontal lines in Figures 8a and 8b show the height of 70 hPa.
OKAMOTO ET AL.: FORMATION AND TREND OF THE BREWER‐DOBSON CIRCULATION D10117D10117
9 of 11

low latitudes and midlatitudes in the lower stratosphere. Inthe middle latitudes, the contribution of gravity waves iscomparable to that of the planetary waves. These results areconsistent with previous studies using different CCMs[McLandress and Shepherd, 2009]. In this study, it is alsoshown that the GWD including parameterized OGWD[McFarlane, 1987] and nonstationary GWD [Hines, 1997]significantly influence the formation of the summer hemi-spheric upward branch of the winter circulation in DJF. Thisfactor was not previously reported. The GWD‐induced cir-culation in the real atmosphere can be evaluated by sub-tracting Yepfd from Ydirect using ERA‐Interim data becausereanalysis data are based on observation and include latentlythe effects of the GWD. The resultant Ygwd† is in goodagreement with the CCM data in terms of the importance ofGWD in the middle latitudes of the lower stratosphere andthe summer hemispheric subtropics. Therefore, it is con-cluded that the GWD in the lower stratosphere is crucial inthe BDC formation.[37] We then examined the trends of the RC in the 21st
century. The mass stream functions in the CCM haveincreasing trend in the period 2005–2070, which is consis-tent with many previous studies using CCMs. We evaluatedthe trend of the contributions of wave drag to the RC in DJF.In the lower stratosphere, the trend of Yepfd consists of twoor three cells in the NH, while the Ygwd has a large andpositive cell in the middle latitudes. As a result, the trend ofthe lower stratospheric circulation in the NH is one‐celled;the RC in the 21st century can be accelerated in all latitudesby combining various types of waves.[38] The net upward mass flux, which is determined only
by the stream function at the TL, has an increasing trend in allseasons, which is similar to the stream function. We exam-ined the contribution of respective wave forcings to the trendof the net upward mass flux in DJF. The trend of the OGWDsignificantly influences the trend of the net upward mass fluxin DJF, while the trend of EPFD‐induced mass flux is notremarkable, although the trend of EPFD is also large for thenet mass flux trend for the CMAM [McLandress andShepherd, 2009]. Thus, the contribution of the OGWD tothe BDC acceleration is comparable to or greater than that ofthe EPFD in the late 21st century.[39] The trend of the net upward mass flux in DJF was
largely attributed to that of OGWD at the TL in the NH. Themechanism of the change of OGWD is explored in detail.The difference in the source momentum mass flux of OGWbetween the future and present2 climate was small. Incontrast, the OGWD above the 70 hPa at TL significantlyincreased and was attributed to the upward shift of thesubtropical jet associated with upward shift of the tropo-pause in response to the increasing GHGs under the sce-narios of IPCC [2000] in the 21st century. This mechanismis consistent with the work of McLandress and Shepherd[2009] and Garcia and Randel [2008].[40] In this paper, we examined the contribution of vari-
ous waves to the residual circulation using the DC theory.However, it may be difficult to apply the DC analysis for theequinox seasons where the assumption of steady state maynot be valid; more generalized theory is necessary toinvestigate the seasonal variability of the BDC. For thefuture works, it is interesting to examine the interannual andseasonal variability in BDC using reanalysis data. Recent
observational studies do not indicate an acceleration of theBDC [Engel et al., 2009]. As noted, most CCMs includingthe present model simulated the acceleration of the BDC.The BDC should closely be analyzed in terms of the RCtogether with mixing to clarify the mechanism. In addition,with respect to the DC principle, it is also important toinvestigate the RC in the mesosphere, focusing on theconnection between the stratosphere and mesosphere.
[41] Acknowledgments. The authors thank Diane Pendlebury andElisa Manzini for their useful comments and discussions. We also thankTatsuya Nagashima and Yosuke Yamashita for providing codes of the oro-graphic gravity wave parameterization scheme. ERA‐Interim data wereused for the analysis. Yoshihiro Tomikawa and Kazue Suzuki helped inthe treatment. All figures in this paper are drawn by using the DCL library.This study is supported by Grant‐in‐Aid for Scientific Research (B)22340134 of the Ministry of Education, Culture, Sports and Technology(MEXT), Japan, and by the Global Environmental Research Fund (GERF)of the Ministry of the Environment (MOE) of Japan (A‐071), and the simu-lations were completed with the supercomputer at CGER of the NationalInstitute for Environmental Studies (NIES).
ReferencesAkiyoshi, H., L. B. Zhou, Y. Yamashita, K. Sakamoto, M. Yoshiki,T. Nagashima, M. Takahashi, J. Kurokawa, M. Takigawa, and T. Imamura(2009), A CCM simulation of the breakup of the Antarctic polar vortex inthe years 1980–2004 under the CCMVal scenarios, J. Geophys. Res., 114,D03103, doi:10.1029/2007JD009261.
Akiyoshi, H., Y. Yamashita, K. Sakamoto, L. B. Zhou, and T. Imamura(2010), Recovery of stratospheric ozone in calculations by the Centerfor Climate System Research/National Institute for Environmental Studieschemistry‐climate model under the CCMVal‐REF2 scenario and a no‐climate‐change run, J. Geophys. Res., 115, D19301, doi:10.1029/2009JD012683.
Andrews, D. G., J. R. Holton, and C. B. Leovy (1987), Middle AtmosphereDynamics, 504 pp., Academic, San Diego, Calif.
Brewer, A. W. (1949), Evidence for a world circulation provided by themeasurements of helium and water vapour distribution in the strato-sphere, Q. J. R. Meteorol. Soc., 75, 351–363.
Butchart, N., J. Austin, J. R. Knight, A. A. Scaife, and M. L. Gallani(2000), The response of the stratospheric climate to projected changesin the concentrations of well‐mixed greenhouse gases from 1992 to2051, J. Clim., 13, 2142–2159.
Butchart, N., et al. (2006), Simulations of anthropogenic change in thestrength of the Brewer‐Dobson circulation, Clim. Dyn., 27, 727–741,doi:10.1007/s00382-006-0162-4.
Butchart, N., et al. (2010), Chemistry‐climate model simulations of twenty‐first century stratospheric climate and circulation changes, J. Clim., 23,5349–5374, doi:10.1175/2010JCLI3404.1.
Dobson, G. M. B. (1952), Ozone in the Earth’s atmosphere, Endeavour, 11,215–219.
Engel, A., et al. (2009), Age of stratospheric air unchanged within uncer-tainties over the past 30 years, Nat. Geosci., 2, 28–31, doi:10.1038/NGEO388.
Eyring, V., et al. (2006), Assessment of temperature, trace species, and ozonein chemistry‐climate model simulations of the recent past, J. Geophys.Res., 111, D22308, doi:10.1029/2006JD007327.
Garcia, R. R., and W. J. Randel (2008), Acceleration of the Brewer‐Dobsoncirculation due to increases in greenhouse gases, J. Atmos. Sci., 65,2731–2739, doi:10.1175/2008JAS2712.1.
Haynes, P. H., C. J. Marks, M. E. McIntyre, T. G. Shepherd, and K. P. Shine(1991), On the “downward control” of extratropical diabatic circulationsby eddy‐induced mean zonal forces, J. Atmos. Sci., 48, 651–678.
Hines, C. P. (1997), Doppler‐spread parameterization of gravity‐wavemomentum deposition in the middle atmosphere. Part 2: Broad and quasimonochromatic spectra, and implementation, J. Atmos. Sol. Terr. Phys.,59, 387–400.
Holton, J. R. (1990), On the global exchange of mass between the strato-sphere and troposphere, J. Atmos. Sci., 47, 392–395.
Intergovernmental Panel on Climate Change (IPCC) (2000), Special Reporton Emissions Scenarios: A Special Report of Working Group III of theIntergovermental Panel on Climate Change, 599 pp., Cambridge Univ.Press, Cambridge, U. K.
OKAMOTO ET AL.: FORMATION AND TREND OF THE BREWER‐DOBSON CIRCULATION D10117D10117
10 of 11

Lindzen, R. S. (1981), Turbulence and stress owing to gravity wave andtidal breakdown, J. Geophys. Res., 86, 9707–9714, doi:10.1029/JC086iC10p09707.
McFarlane, N. A. (1987), The effect of orographically excited gravity wavedrag on the general circulation of the lower stratosphere and troposphere,J. Atmos. Sci., 44, 1775–1800.
McLandress, C., and T. G. Shepherd (2009), Simulated anthropogenicchanges in the Brewer‐Dobson circulation, including its extension tohigh latitudes, J. Clim., 22, 1516–1540, doi:10.1175/2008JCLI2979.1.
Palmer, T. N., G. J. Shutts, and R. Swinbank (1986), Alleviation of a sys-tematic bias in general‐circulation and numerical weather predictionmodels through an orographic gravity‐wave drag parameterization,Q. J. R. Meteorol. Soc., 112, 1001–1039.
Plumb, R. A. (2002), Stratospheric transport, J. Meteorol. Soc. Jpn., 80,793–809.
Rosenlof, K. H. (1995), Seasonal cycle of the residual mean meridionalcirculation in the stratosphere, J. Geophys. Res., 100, 5173–5191,doi:10.1029/94JD03122.
Shepherd, T. G. (2007), Transport in the middle atmosphere, J. Meteorol.Soc. Jpn., 85B, 165–191.
Son, S., L. M. Polvani, D. W. Waugh, T. Birner, H. Akiyoshi, R. R. Garcia,A. Gettelman, D. A. Plummer, and E. Rozanov (2009), The impact ofstratospheric ozone recovery on tropopause height trends, J. Clim., 22,429–445, doi:10.1175/2008JCLI2215.1.
World Meteorological Organization/United Nations EnvironmentProgramme (WMO/UNEP) (2003), Scientific Assessment of OzoneDepletion: 2002, Nairobi.
H. Akiyoshi, National Institute for Environmental Studies, 16‐2Onogawa, Tsukuba, Ibaraki 305‐8506, Japan.K. Okamoto and K. Sato, Department of Earth and Planetary Physics,
University of Tokyo, Tokyo 113‐0033, Japan. ([email protected]‐tokyo.ac.jp)
OKAMOTO ET AL.: FORMATION AND TREND OF THE BREWER‐DOBSON CIRCULATION D10117D10117
11 of 11