CITY OF BREWER, MAINE Annual Financial Report For the ...
120
CITY OF BREWER, MAINE Annual Financial Report For the Year Ended June 30, 2020
-
Upload
khangminh22 -
Category
Documents
-
view
3 -
download
0
Transcript of CITY OF BREWER, MAINE Annual Financial Report For the ...
CITY OF BREWER, MAINE
Annual Financial Report
For the Year Ended June 30, 2020
CITY OF BREWER, MAINEAnnual Financial Report
For the Year Ended June 30, 2020
Table of Contents
Statement Page
FINANCIAL SECTION
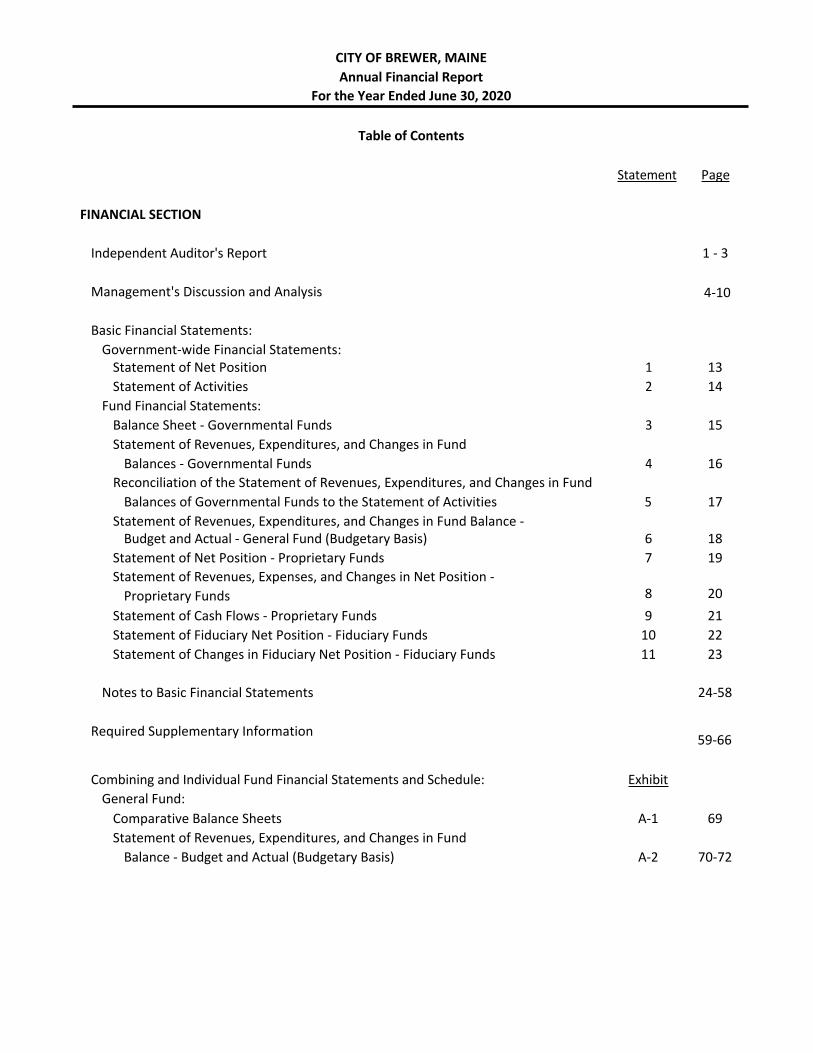
Independent Auditor's Report 1 - 3
Management's Discussion and Analysis 4-10
Basic Financial Statements:Government-wide Financial Statements:
Statement of Net Position 1 13Statement of Activities 2 14
Fund Financial Statements:Balance Sheet - Governmental Funds 3 15Statement of Revenues, Expenditures, and Changes in Fund
Balances - Governmental Funds 4 16Reconciliation of the Statement of Revenues, Expenditures, and Changes in Fund
Balances of Governmental Funds to the Statement of Activities 5 17Statement of Revenues, Expenditures, and Changes in Fund Balance -
Budget and Actual - General Fund (Budgetary Basis) 6 18Statement of Net Position - Proprietary FundsStatement of Revenues, Expenses, and Changes in Net Position -
Proprietary Funds
7
8
19
20Statement of Cash Flows - Proprietary Funds 9 21Statement of Fiduciary Net Position - Fiduciary Funds 10 22Statement of Changes in Fiduciary Net Position - Fiduciary Funds 11 23
Notes to Basic Financial Statements 24-58
Required Supplementary Information 59-66
Combining and Individual Fund Financial Statements and Schedule: ExhibitGeneral Fund:
Comparative Balance Sheets A-1 69Statement of Revenues, Expenditures, and Changes in Fund
Balance - Budget and Actual (Budgetary Basis) A-2 70-72
CITY OF BREWER, MAINEAnnual Financial Report
For the Year Ended June 30, 2020
Table of Contents
Exhibit Page
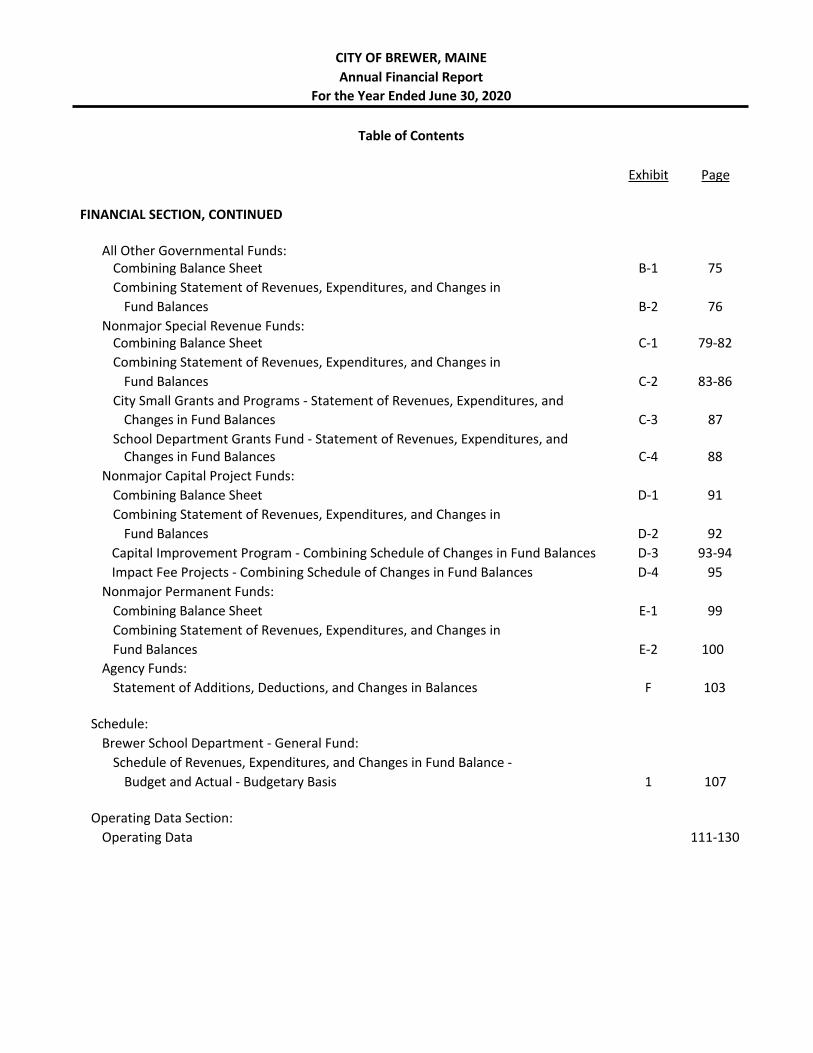
FINANCIAL SECTION, CONTINUED
All Other Governmental Funds:Combining Balance Sheet B-1 75Combining Statement of Revenues, Expenditures, and Changes in
Fund Balances B-2 76Nonmajor Special Revenue Funds:
Combining Balance Sheet C-1 79-82Combining Statement of Revenues, Expenditures, and Changes in
Fund Balances C-2 83-86City Small Grants and Programs - Statement of Revenues, Expenditures, and
Changes in Fund Balances C-3 87School Department Grants Fund - Statement of Revenues, Expenditures, and
Changes in Fund Balances C-4 88Nonmajor Capital Project Funds:
Combining Balance Sheet D-1 91Combining Statement of Revenues, Expenditures, and Changes in
Fund Balances D-2 92Capital Improvement Program - Combining Schedule of Changes in Fund Balances D-3 93-94Impact Fee Projects - Combining Schedule of Changes in Fund Balances D-4 95
Nonmajor Permanent Funds:Combining Balance Sheet E-1 99Combining Statement of Revenues, Expenditures, and Changes inFund Balances E-2 100
Agency Funds:Statement of Additions, Deductions, and Changes in Balances F 103
Schedule:Brewer School Department - General Fund:
Schedule of Revenues, Expenditures, and Changes in Fund Balance -Budget and Actual - Budgetary Basis 1 107
Operating Data Section:Operating Data 111-130
Certified Public Accountants and Business Consultants
Independent Auditor's Report
City CouncilCity of Brewer, Maine
Report on the Financial Statements
We have audited the accompanying financial statements of the governmental activities, the business-type activities, each major fund, and the aggregate remaining fund information of the City of Brewer, Maine as of and for the year ended June 30, 2020, and the related notes to the financial statements, which collectively comprise the City’s basic financial statements as listed in the table of contents.
Management's Responsibility for the Financial Statements
Management is responsible for the preparation and fair presentation of these financial statements in accordance with accounting principles generally accepted in the United States of America; this includes the design, implementation, and maintenance of internal control relevant to the preparation and fair presentation of financial statements that are free from material misstatement, whether due to fraud or error.
Auditor’s Responsibility
Our responsibility is to express opinions on these financial statements based on our audit. We conducted our audit in accordance with auditing standards generally accepted in the United States of America and the standards applicable to financial audits contained in Government Auditing Standards, issued by the Comptroller General of the United States. Those standards require that we plan and perform the audit to obtain reasonable assurance about whether the financial statements are free from material misstatement.
An audit involves performing procedures to obtain audit evidence about the amounts and disclosures in the financial statements. The procedures selected depend on the auditor’s judgment, including the assessment of the risks of material misstatement of the financial statements, whether due to fraud or error. In making those risk assessments, the auditor considers internal control relevant to the entity’s preparation and fair presentation of the financial statements in order to design audit procedures that are appropriate in the circumstances, but not for the purpose of expressing an opinion on the effectiveness of the entity’s internal control. Accordingly, we express no such opinion. An audit also includes evaluating the appropriateness of accounting policies used and the reasonableness of significant accounting estimates made by management, as well as evaluating the overall presentation of the financial statements.
We believe that the audit evidence we have obtained is sufficient and appropriate to provide a basis for our audit opinions.

City Council Page 2
Opinions
In our opinion, the financial statements referred to above present fairly, in all material respects, the respective financial position of the governmental activities, the business-type activities, each major fund, and the aggregate remaining fund information of the City of Brewer, Maine as of June 30, 2020, and the respective changes in financial position, and where applicable, cash flows, thereof and budgetary comparison for the General Fund for the year then ended in accordance with accounting principles generally accepted in the United States of America.
Other Matters
Required Supplementary Information
Accounting principles generally accepted in the United States of America require that the management’s discussion and analysis, and schedules related to the pension and OPEB liabilities, as listed in the table of contents be presented to supplement the basic financial statements. Such information, although not a part of the basic financial statements, is required by the Governmental Accounting Standards Board who considers it to be an essential part of financial reporting for placing the basic financial statements in an appropriate operational, economic, or historical context. We have applied certain limited procedures to the required supplementary information in accordance with auditing standards generally accepted in the United States of America, which consisted of inquiries of management about the methods of preparing the information and comparing the information for consistency with management’s responses to our inquiries, the basic financial statements, and other knowledge we obtained during our audit of the basic financial statements. We do not express an opinion or provide any assurance on the information because the limited procedures do not provide us with sufficient evidence to express an opinion or provide any assurance.
Other Information
Our audit was conducted for the purpose of forming opinions on the financial statements that collectively comprise the City of Brewer, Maine’s basic financial statements. The combining and individual fund financial statements, schedule, and operating data section, are presented for purposes of additional analysis and are not a required part of the basic financial statements.
The combining and individual fund financial statements and schedule are the responsibility of management and were derived from and relate directly to the underlying accounting and other records used to prepare the basic financial statements. Such information has been subjected to the auditing procedures applied in the audit of the basic financial statements and certain additional procedures, including comparing and reconciling such information directly to the underlying accounting and other records used to prepare the basic financial statements or to the basic financial statements themselves, and other additional procedures in accordance with auditing standards generally accepted in the United States of America. In our opinion, the combining and individual fund financial statements and schedule are fairly stated in all material respects in relation to the basic financial statements as a whole.
City Council Page 3
The operating data section has not been subjected to the auditing procedures applied in the audit of the basic financial statements and, accordingly, we do not express an opinion or provide any assurance on it.
Other Reporting Required by Government Auditing Standards
In accordance with Government Auditing Standards, we have also issued our report dated December 29, 2020 on our consideration of the City of Brewer, Maine’s internal control over financial reporting and on our tests of its compliance with certain provisions of laws, regulations, contracts, and grant agreements and other matters. The purpose of that report is solely to describe the scope of our testing of internal control over financial reporting and compliance and the results of that testing, and not to provide an opinion on the effectiveness of the City of Brewer, Maine's internal control over financial reporting or on compliance. That report is an integral part of an audit performed in accordance with Government Auditing Standards in considering the City of Brewer, Maine's internal control over financial reporting and compliance.
December 29, 2020South Portland, Maine
4
CITY OF BREWER, MAINEManagement’s Discussion and Analysis
June 30, 2020
As management of the City of Brewer, we offer readers of the City’s financial statements this narrative overview and analysis of the financial activities of the City of Brewer for the fiscal year ended June 30, 2020.
Financial Highlights
The assets and deferred outflows of resources of the City of Brewer exceeded liabilities and deferredinflows of resources by $40,868,100 (net position). Of this amount, a deficit of ($9,869,396) was reportedas unrestricted net position. The City’s total net position increased by $1,048,527 from the prior year.Net position of Governmental Activities increased by $546,948, while Business-type Activities increasedby $501,579.
At the close of the fiscal year, the City’s governmental funds reported a combined ending fundbalance of $11,537,758, which was an increase of $1,708,593 from the prior fiscal year. This increasewas comprised of an $1,042,573 increase in the City’s general fund, an $831,894 increase in the City’smajor capital projects fund and ($165,874) decrease in the other governmental funds.
The City’s general fund reports an unassigned fund balance of $4,882,182 and total fund balance of$7,377,415, an increase of $1,042,573. The City’s unassigned fund balance is currently at 12.21% ofbudgeted expenditures and 12.86% of general fund expenditures (see statement 6).
The City of Brewer authorized FY20 CIP bond funding of $931,500, which was issued on October 31, 2020in conjunction with FY19 CIP authorized bond funding of $500,000, adding an additional $1,431,500 in long-term debt in the capital projects fund. However, the City retired $3,032,259 in old bonds and notes.
Overview of the Financial Statements
This discussion and analysis is intended to serve as an introduction to the City of Brewer’s basic financial statements. The City of Brewer’s basic financial statements have three components: 1) government-wide financial statements, 2) fund financial statements, and 3) notes to the financial statements. This report also contains supplementary information in addition to the basic financial statements themselves.
Government-wide Financial Statements
The government-wide financial statements are designed to provide readers with a broad overview of the City of Brewer’s finances in a manner similar to a private-sector business.
The statement of net position presents information on the City of Brewer’s assets and deferred outflows of resources less liabilities and deferred inflows of resources, with the difference reported as net position. Over time, increases or decreases in net position may serve as a useful indicator of whether the financial position of the City of Brewer is improving or deteriorating.
The statement of activities presents information showing how the City’s net position changed during the most recent fiscal year. All changes in net position are reported as soon as the underlying event giving rise to the change occurs regardless of the timing of related cash flows. Thus, revenues and expenses are reported in this statement for some items that will only result in cash flows in future fiscal periods (e.g., uncollected taxes and earned but unused vacation leave).
Both of the government-wide financial statements distinguish functions of the City of Brewer that are principally supported by taxes and intergovernmental revenues (governmental activities) from other functions that are intended to recover all or a significant portion of their costs through user fees and charges (business-type activities).
5
CITY OF BREWER, MAINEManagement’s Discussion and Analysis, Continued
The governmental activities of the City of Brewer include administration, protection, public services, public works, unclassified, education, state retirement contributions, interest on debt, assessments and capital outlay. The business-type activities of the City of Brewer include a water department and a sewer operation. The government-wide financial statements can be found on pages 13-14 of this report, and are denoted in the top right corner as Statement 1 and Statement 2.
Financial Statements
A fund is a grouping of related accounts that is used to maintain control over resources that have been segregated for specific activities or objectives. The City of Brewer, like other state and local governments, uses fund accounting to ensure and demonstrate compliance with finance-related legal requirements. All of the funds of the City of Brewer can be divided into three categories: governmental funds, proprietary funds, and fiduciary funds.
Governmental Funds. Governmental funds are used to account for essentially the same functions reported as governmental activities in the government-wide financial statements. However, unlike the government-wide financial statements, governmental fund financial statements focus on near-term inflows and outflows of spendable resources, as well as on balances of spendable resources available at the end of the fiscal year. Such information may be useful in evaluating a government’s near-term financing requirements.
Because the focus of governmental funds is narrower than that of the government-wide financial statements, it is useful to compare the information presented for governmental funds with similar information presented for governmental activities in the government-wide financial statements. By doing so, readers may better understand the long-term impact of the city’s near-term financing decisions. Both the governmental fund balance sheet and the governmental fund statement of revenues, expenditures, and changes in fund balances provide a reconciliation to facilitate this comparison between governmental funds and governmental activities.
The City of Brewer maintains 36 individual governmental funds. Information is presented separately in the governmental fund balance sheet and in the governmental fund statement of revenues, expenditures, and changes in fund balances for the two major funds: the general fund and the other capital projects fund. Data from the other 34 non-major governmental funds are combined into a single, aggregated presentation. Individual fund data for each of these non- major funds is provided in the form of combining statements elsewhere in the report.
The City of Brewer adopts an annual appropriated budget for its general fund, as well as the capital improvement program, sewer fund and water fund. A budgetary comparison statement has been provided for the general fund to demonstrate compliance with this budget.
The basic governmental fund financial statements are found starting on page 15 of this report, denoted as Statement 3.
Proprietary funds. The City of Brewer maintains one type of proprietary fund. Enterprise funds are used to report the same functions presented as business-type activities in the government-wide financial statements. The City of Brewer uses enterprise funds to account for its Water and Sewer Departments.
Proprietary funds provide the same type of information as the government-wide financial statements only in more detail. The proprietary fund financial statements provide separate information on the individual enterprise funds.
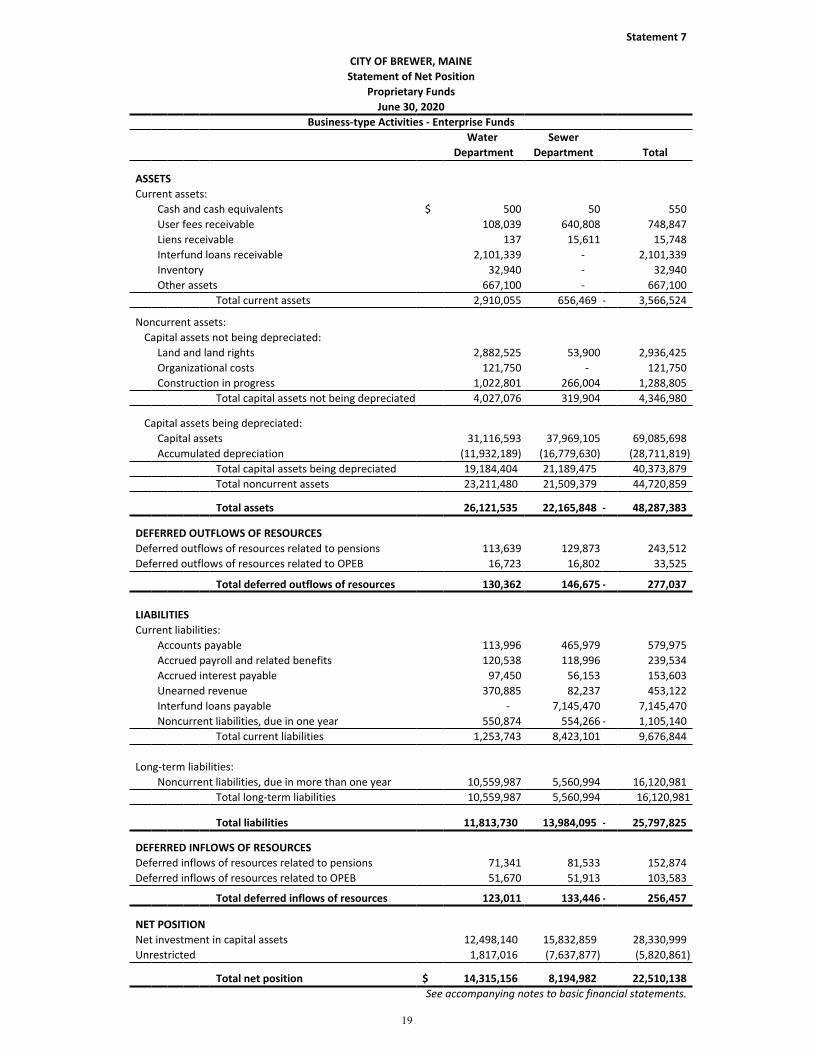
The basic proprietary fund financial statements are found starting on page 19 of this report, denoted as Statement 7.
6
CITY OF BREWER, MAINEManagement’s Discussion and Analysis, Continued
Fiduciary funds. Fiduciary funds are used to account for resources held for the benefit of parties outside the City. Fiduciary funds are not reflected in the government-wide financial statement because the resources of those funds are not available to support the City of Brewer’s own programs. The accounting used for fiduciary funds is much like that used for proprietary funds.
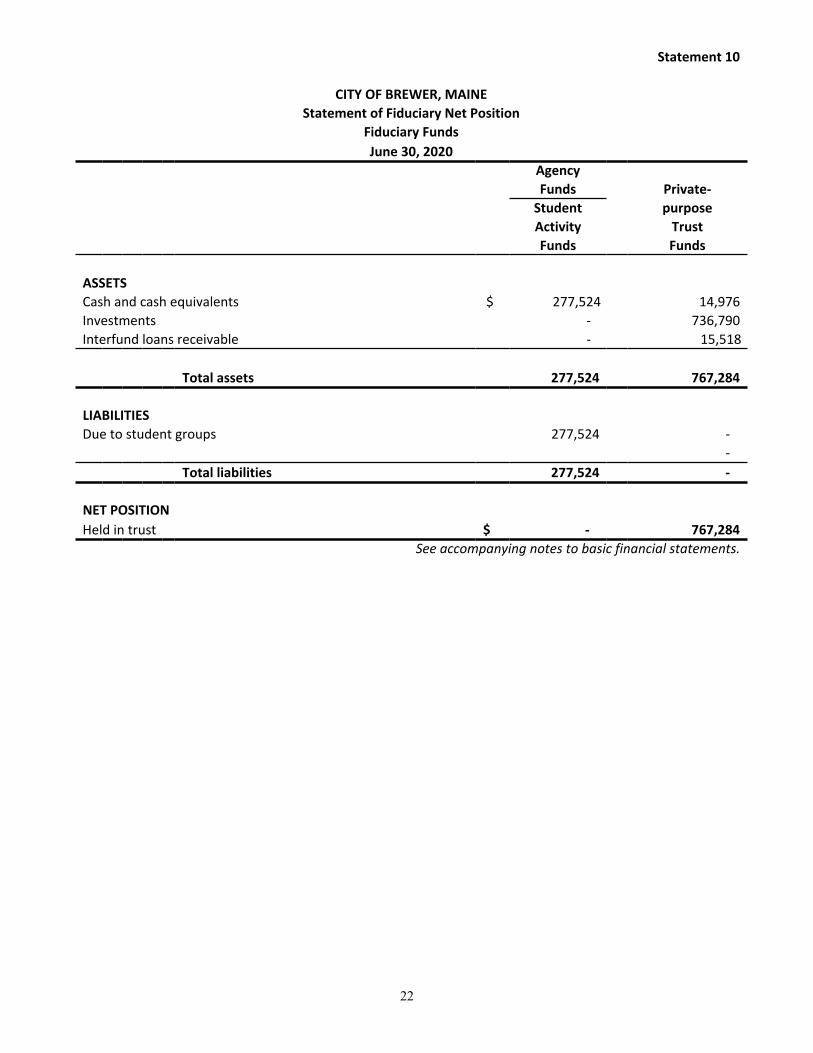
The basic fiduciary fund financial statements are found starting on pages 22 of this report, denoted as Statement 10.
Notes to the financial statements. The notes provide additional information that is essential to a full understanding of the data provided in the government-wide and fund financial statements. The notes to the financial statements can be found on pages 24-58 of this report.
Other information. The combining statements referred to earlier in connection with non-major governmental funds are presented immediately following the required supplementary information. Combining and individual statements and schedules are found on pages 69-107 of this report.
Government-wide Financial Analysis
As noted earlier, net position may serve over time as a useful indicator of a government’s financial position. In the case of the City of Brewer, governmental activity assets and deferred outflows of resources exceeded liabilities and deferred inflows of resources by $18,357,962. Business-type activity assets and deferred outflows of resources exceeded liabilities and deferred inflows of resources by $22,510,138 for a City-wide total of net position of $40,868,100 at the close of the most recent fiscal year. The Statement of Net Position can be found on page 13 of this report.
The largest portion of the City of Brewer’s net position 115.12% reflects its investment in capital assets (e.g., land, buildings and improvements, machinery, equipment and infrastructure); less any related debt used to acquire those assets that is still outstanding. The City of Brewer uses these capital assets to provide services to citizens. Consequently, these assets are not available for future spending. Although the City of Brewer’s investment in its capital assets is reported net of related debt, it should be noted that the resources needed to repay this debt must be provided from other sources, since the capital assets themselves cannot be used to liquidate these liabilities.
An additional portion of the City’s net position, 9.03%, represents resources that are subject to external restrictions on how they may be used. This means that the City has a negative unrestricted net position of (24.15%) as far as being able to meet ongoing obligations. This was mostly a result of implementation of GASBs #68 and #75, which does not impact the cash ability of the City to meet ongoing obligations.

7
CITY OF BREWER, MAINEManagement’s Discussion and Analysis, Continued
Summary Statement of Net Position
2020 2019 2020 2019 2020 2019
ASSETSCurrent and other assets $ 16,302,495 14,022,624 (3,578,946) (1,884,541) 12,723,549 12,138,083Capital assets 34,830,814 35,800,691 44,720,859 43,345,029 79,551,673 79,145,720
Total assets 51,133,309 49,823,315 41,141,913 41,460,488 92,275,222 91,283,803
DEFERRED OUTFLOWS OF RESOURCESRelated to pensions and OPEB 2,313,481 1,906,305 277,037 219,002 2,590,518 2,125,307
Total deferred outflows 2,313,481 1,906,305 277,037 219,002 2,590,518 2,125,307
LIABILITIESLong-term liabilities 27,447,250 26,983,753 16,120,981 17,226,918 43,568,231 44,210,671Other liabilities 6,316,551 5,877,771 2,531,374 2,300,059 8,847,925 8,177,830
Total liabilities 33,763,801 32,861,524 18,652,355 19,526,977 52,416,156 52,388,501
DEFERRED INFLOWS OF RESOURCESRelated to pensions and OPEB 1,325,027 1,057,082 256,457 143,954 1,581,484 1,201,036
Total deferred inflows 1,325,027 1,057,082 256,457 143,954 1,581,484 1,201,036
NET POSITIONNet investment in capital assets 19,168,057 19,332,445 28,330,999 25,878,004 47,049,106 * 44,668,824 *Restricted 3,688,390 2,859,222 - - 3,688,390 2,859,222Unrestricted (deficit) (4,498,485) (4,380,653) (5,820,861) (3,869,445) (9,869,396) * (7,708,473) *
Total net position $ 18,357,962 17,811,014 22,510,138 22,008,559 40,868,100 39,819,573
GovernmentalActivities
Business-typeActivities
PrimaryGovernment Total
* These amounts do not cross-foot due to the 2020 amount of $449,950 and 2019 amount of $541,625 pertainingto bond principal remaining on the $1,000,000 of bonds used by the Government Activities to purchase capitalassets, which were contributed to the business-type activities. These amounts are not considered capital relatedin the governmental activities’ column, but are considered capital related in the primary government column.
8
CITY OF BREWER, MAINEManagement’s Discussion and Analysis, Continued
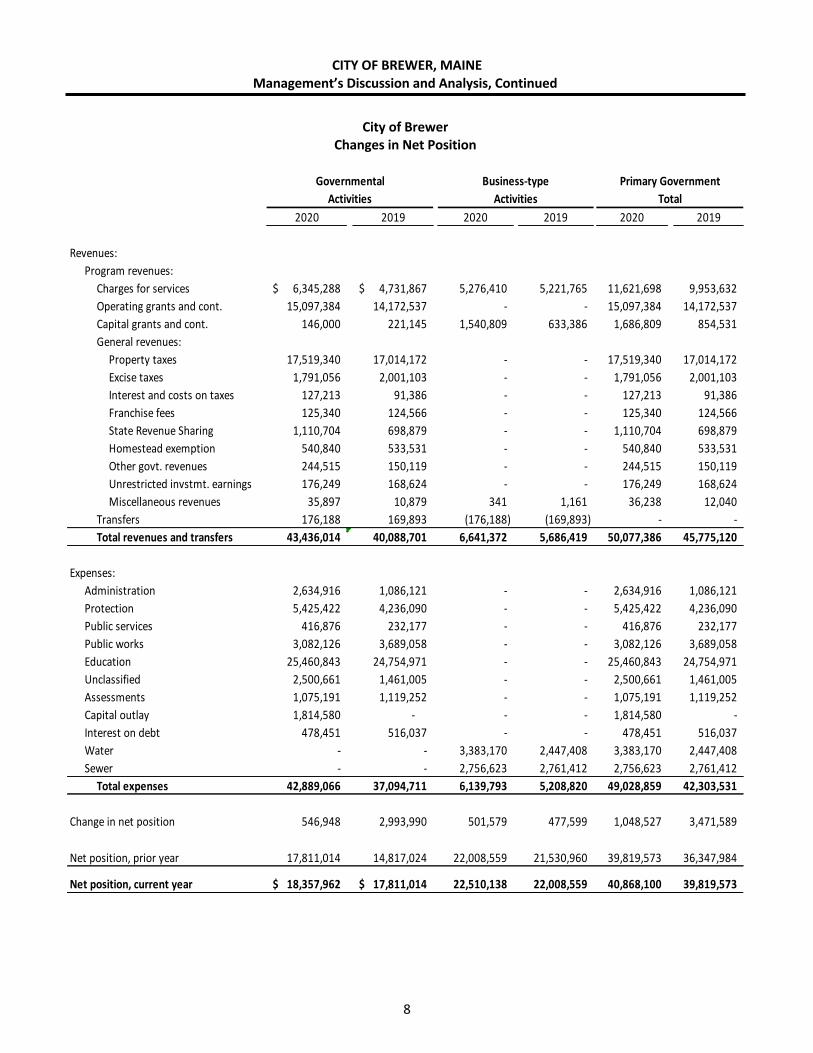
City of BrewerChanges in Net Position
Governmental Business-type Primary GovernmentActivities Activities Total
2020 2019 2020 2019 2020 2019
Revenues:Program revenues:
Charges for services 6,345,288$ 4,731,867$ 5,276,410 5,221,765 11,621,698 9,953,632Operating grants and cont. 15,097,384 14,172,537 - - 15,097,384 14,172,537Capital grants and cont. 146,000 221,145 1,540,809 633,386 1,686,809 854,531General revenues:
Property taxes 17,519,340 17,014,172 - - 17,519,340 17,014,172Excise taxes 1,791,056 2,001,103 - - 1,791,056 2,001,103Interest and costs on taxes 127,213 91,386 - - 127,213 91,386Franchise fees 125,340 124,566 - - 125,340 124,566State Revenue Sharing 1,110,704 698,879 - - 1,110,704 698,879Homestead exemption 540,840 533,531 - - 540,840 533,531Other govt. revenues 244,515 150,119 - - 244,515 150,119Unrestricted invstmt. earnings 176,249 168,624 - - 176,249 168,624Miscellaneous revenues 35,897 10,879 341 1,161 36,238 12,040
Transfers 176,188 169,893 (176,188) (169,893) - -Total revenues and transfers 43,436,014 40,088,701 6,641,372 5,686,419 50,077,386 45,775,120
Expenses:Administration 2,634,916 1,086,121 - - 2,634,916 1,086,121Protection 5,425,422 4,236,090 - - 5,425,422 4,236,090Public services 416,876 232,177 - - 416,876 232,177Public works 3,082,126 3,689,058 - - 3,082,126 3,689,058Education 25,460,843 24,754,971 - - 25,460,843 24,754,971Unclassified 2,500,661 1,461,005 - - 2,500,661 1,461,005Assessments 1,075,191 1,119,252 - - 1,075,191 1,119,252Capital outlay 1,814,580 - - - 1,814,580 -Interest on debt 478,451 516,037 - - 478,451 516,037Water - - 3,383,170 2,447,408 3,383,170 2,447,408Sewer - - 2,756,623 2,761,412 2,756,623 2,761,412
Total expenses 42,889,066 37,094,711 6,139,793 5,208,820 49,028,859 42,303,531
Change in net position 546,948 2,993,990 501,579 477,599 1,048,527 3,471,589
Net position, prior year 17,811,014 14,817,024 22,008,559 21,530,960 39,819,573 36,347,984
Net position, current year 18,357,962$ 17,811,014$ 22,510,138 22,008,559 40,868,100 39,819,573
9
CITY OF BREWER, MAINEManagement’s Discussion and Analysis, Continued
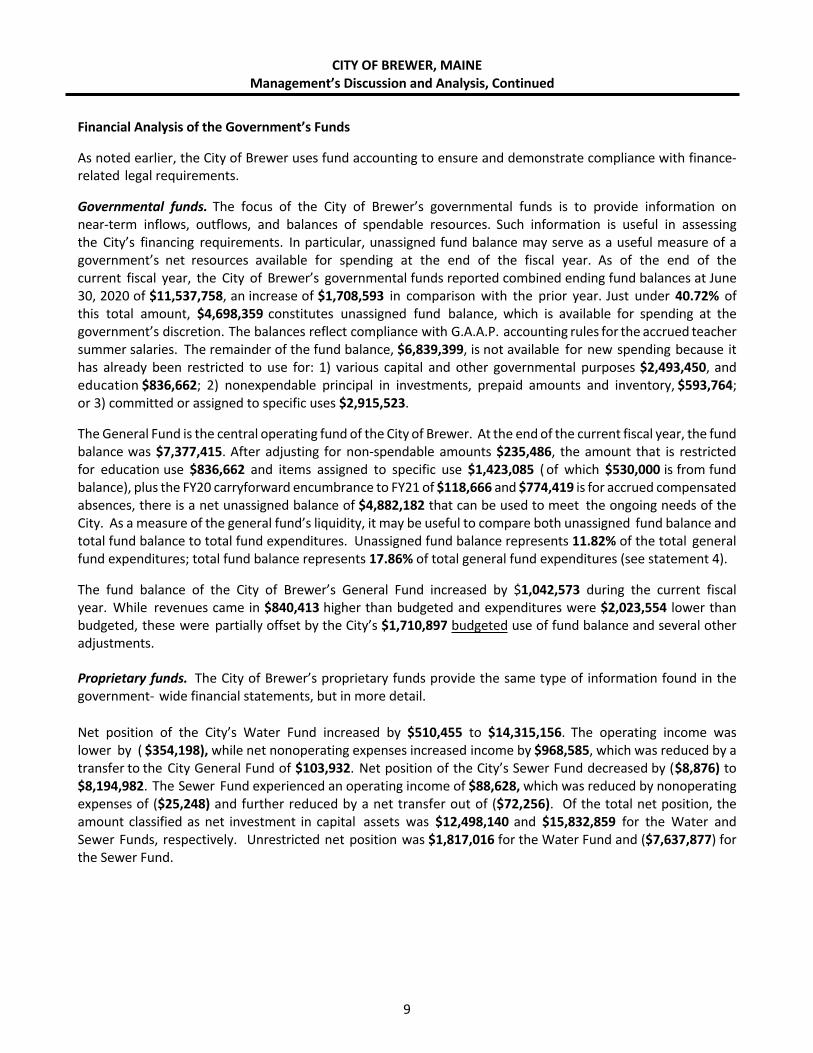
Financial Analysis of the Government’s Funds
As noted earlier, the City of Brewer uses fund accounting to ensure and demonstrate compliance with finance-related legal requirements.
Governmental funds. The focus of the City of Brewer’s governmental funds is to provide information on near-term inflows, outflows, and balances of spendable resources. Such information is useful in assessing the City’s financing requirements. In particular, unassigned fund balance may serve as a useful measure of a government’s net resources available for spending at the end of the fiscal year. As of the end of the current fiscal year, the City of Brewer’s governmental funds reported combined ending fund balances at June 30, 2020 of $11,537,758, an increase of $1,708,593 in comparison with the prior year. Just under 40.72% of this total amount, $4,698,359 constitutes unassigned fund balance, which is available for spending at the government’s discretion. The balances reflect compliance with G.A.A.P. accounting rules for the accrued teacher summer salaries. The remainder of the fund balance, $6,839,399, is not available for new spending because it has already been restricted to use for: 1) various capital and other governmental purposes $2,493,450, and education $836,662; 2) nonexpendable principal in investments, prepaid amounts and inventory, $593,764; or 3) committed or assigned to specific uses $2,915,523.
The General Fund is the central operating fund of the City of Brewer. At the end of the current fiscal year, the fund balance was $7,377,415. After adjusting for non-spendable amounts $235,486, the amount that is restricted for education use $836,662 and items assigned to specific use $1,423,085 ( of which $530,000 is from fund balance), plus the FY20 carryforward encumbrance to FY21 of $118,666 and $774,419 is for accrued compensated absences, there is a net unassigned balance of $4,882,182 that can be used to meet the ongoing needs of the City. As a measure of the general fund’s liquidity, it may be useful to compare both unassigned fund balance and total fund balance to total fund expenditures. Unassigned fund balance represents 11.82% of the total general fund expenditures; total fund balance represents 17.86% of total general fund expenditures (see statement 4).
The fund balance of the City of Brewer’s General Fund increased by $1,042,573 during the current fiscal year. While revenues came in $840,413 higher than budgeted and expenditures were $2,023,554 lower than budgeted, these were partially offset by the City’s $1,710,897 budgeted use of fund balance and several other adjustments.
Proprietary funds. The City of Brewer’s proprietary funds provide the same type of information found in the government- wide financial statements, but in more detail.
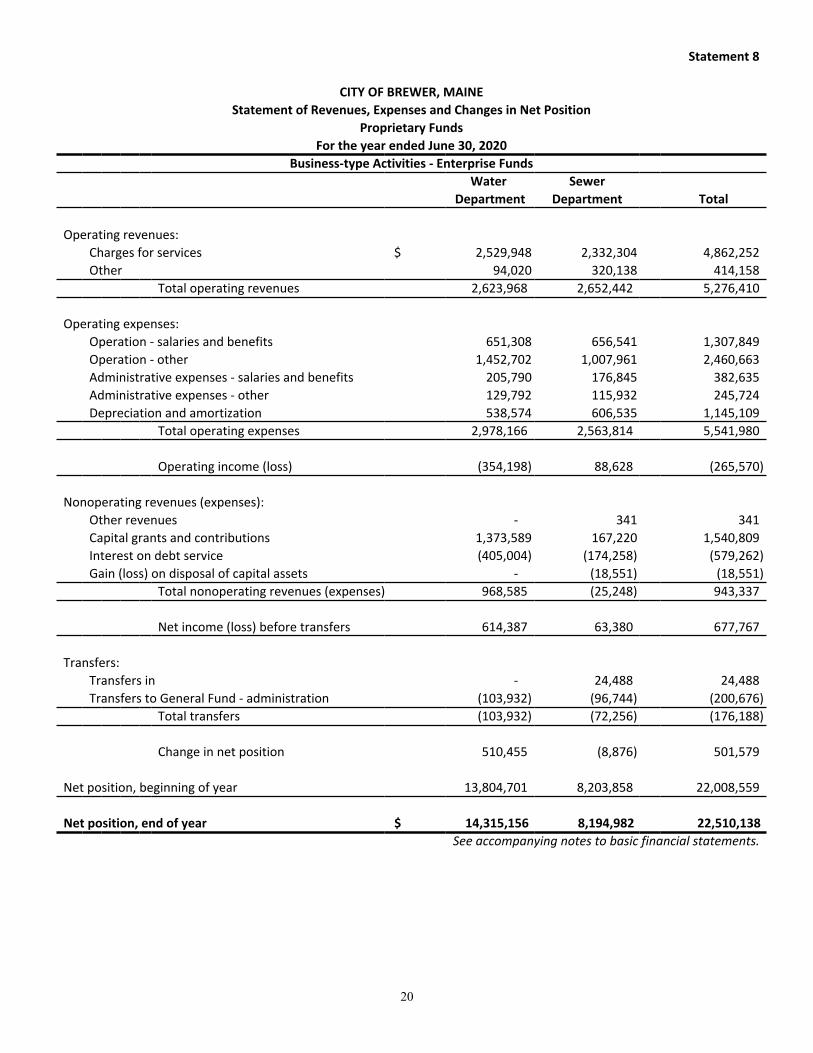
Net position of the City’s Water Fund increased by $510,455 to $14,315,156. The operating income was lower by ( $354,198), while net nonoperating expenses increased income by $968,585, which was reduced by a transfer to the City General Fund of $103,932. Net position of the City’s Sewer Fund decreased by ($8,876) to $8,194,982. The Sewer Fund experienced an operating income of $88,628, which was reduced by nonoperating expenses of ($25,248) and further reduced by a net transfer out of ($72,256). Of the total net position, the amount classified as net investment in capital assets was $12,498,140 and $15,832,859 for the Water and Sewer Funds, respectively. Unrestricted net position was $1,817,016 for the Water Fund and ($7,637,877) for the Sewer Fund.
10
CITY OF BREWER, MAINEManagement’s Discussion and Analysis, Continued
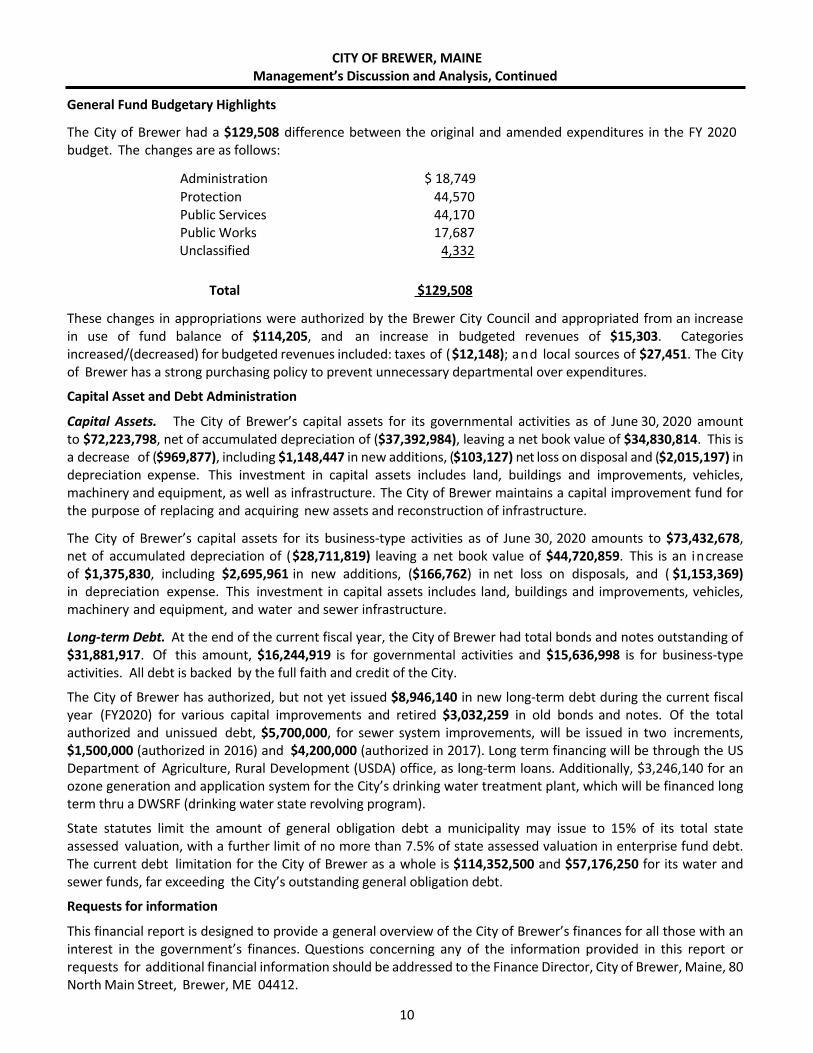
General Fund Budgetary Highlights
The City of Brewer had a $129,508 difference between the original and amended expenditures in the FY 2020 budget. The changes are as follows:
Administration $ 18,749Protection 44,570Public Services 44,170Public Works 17,687Unclassified 4,332
Total $129,508
These changes in appropriations were authorized by the Brewer City Council and appropriated from an increase in use of fund balance of $114,205, and an increase in budgeted revenues of $15,303. Categories increased/(decreased) for budgeted revenues included: taxes of ($12,148); and local sources of $27,451. The City of Brewer has a strong purchasing policy to prevent unnecessary departmental over expenditures.
Capital Asset and Debt Administration
Capital Assets. The City of Brewer’s capital assets for its governmental activities as of June 30, 2020 amount to $72,223,798, net of accumulated depreciation of ($37,392,984), leaving a net book value of $34,830,814. This is a decrease of ($969,877), including $1,148,447 in new additions, ($103,127) net loss on disposal and ($2,015,197) in depreciation expense. This investment in capital assets includes land, buildings and improvements, vehicles, machinery and equipment, as well as infrastructure. The City of Brewer maintains a capital improvement fund for the purpose of replacing and acquiring new assets and reconstruction of infrastructure.
The City of Brewer’s capital assets for its business-type activities as of June 30, 2020 amounts to $73,432,678, net of accumulated depreciation of ($28,711,819) leaving a net book value of $44,720,859. This is an increase of $1,375,830, including $2,695,961 in new additions, ($166,762) in net loss on disposals, and ( $1,153,369) in depreciation expense. This investment in capital assets includes land, buildings and improvements, vehicles, machinery and equipment, and water and sewer infrastructure.
Long-term Debt. At the end of the current fiscal year, the City of Brewer had total bonds and notes outstanding of $31,881,917. Of this amount, $16,244,919 is for governmental activities and $15,636,998 is for business-type activities. All debt is backed by the full faith and credit of the City.
The City of Brewer has authorized, but not yet issued $8,946,140 in new long-term debt during the current fiscal year (FY2020) for various capital improvements and retired $3,032,259 in old bonds and notes. Of the total authorized and unissued debt, $5,700,000, for sewer system improvements, will be issued in two increments, $1,500,000 (authorized in 2016) and $4,200,000 (authorized in 2017). Long term financing will be through the US Department of Agriculture, Rural Development (USDA) office, as long-term loans. Additionally, $3,246,140 for an ozone generation and application system for the City’s drinking water treatment plant, which will be financed long term thru a DWSRF (drinking water state revolving program).
State statutes limit the amount of general obligation debt a municipality may issue to 15% of its total state assessed valuation, with a further limit of no more than 7.5% of state assessed valuation in enterprise fund debt. The current debt limitation for the City of Brewer as a whole is $114,352,500 and $57,176,250 for its water and sewer funds, far exceeding the City’s outstanding general obligation debt.
Requests for information
This financial report is designed to provide a general overview of the City of Brewer’s finances for all those with an interest in the government’s finances. Questions concerning any of the information provided in this report or requests for additional financial information should be addressed to the Finance Director, City of Brewer, Maine, 80 North Main Street, Brewer, ME 04412.

BASIC FINANCIAL STATEMENTS
13
Statement 1
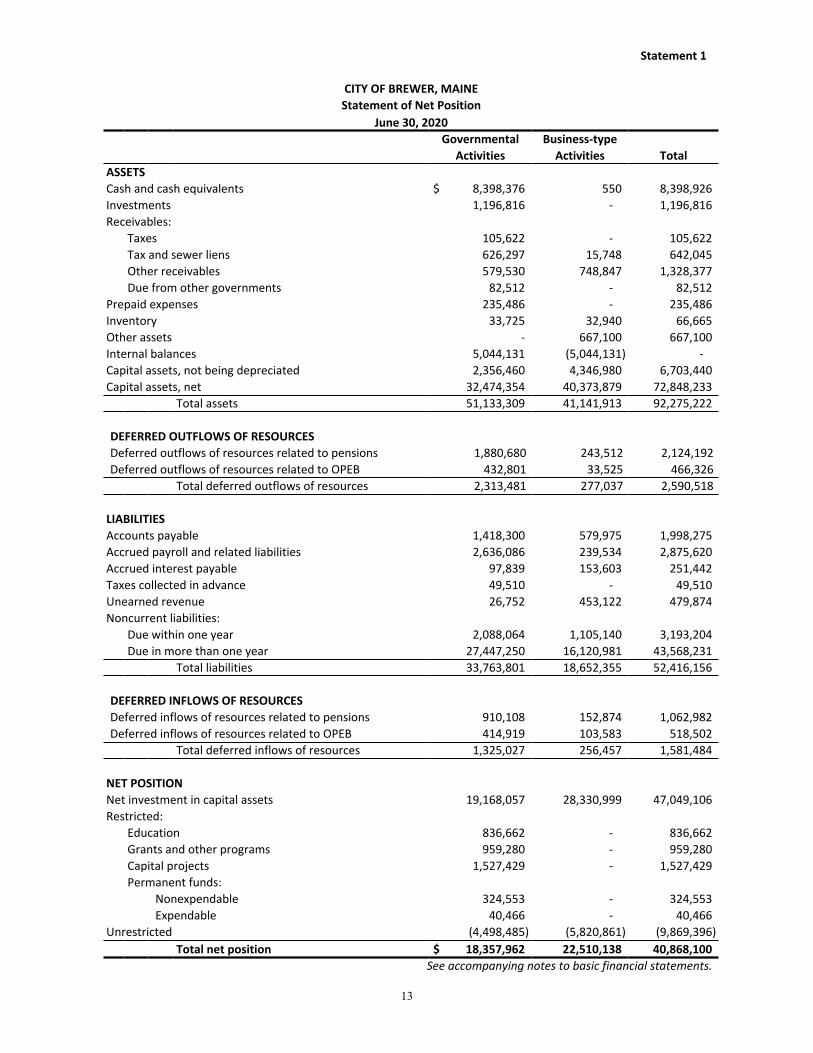
CITY OF BREWER, MAINEStatement of Net Position
June 30, 2020Governmental Business-type
Activities Activities TotalASSETSCash and cash equivalents $ 8,398,376 550 8,398,926Investments 1,196,816 - 1,196,816Receivables:
Taxes 105,622 - 105,622Tax and sewer liens 626,297 15,748 642,045Other receivables 579,530 748,847 1,328,377Due from other governments 82,512 - 82,512
Prepaid expenses 235,486 - 235,486Inventory 33,725 32,940 66,665Other assets - 667,100 667,100Internal balances 5,044,131 (5,044,131) - Capital assets, not being depreciated 2,356,460 4,346,980 6,703,440Capital assets, net 32,474,354 40,373,879 72,848,233
Total assets 51,133,309 41,141,913 92,275,222
DEFERRED OUTFLOWS OF RESOURCESDeferred outflows of resources related to pensions 1,880,680 243,512 2,124,192Deferred outflows of resources related to OPEB 432,801 33,525 466,326
Total deferred outflows of resources 2,313,481 277,037 2,590,518
LIABILITIESAccounts payable 1,418,300 579,975 1,998,275Accrued payroll and related liabilities 2,636,086 239,534 2,875,620Accrued interest payable 97,839 153,603 251,442Taxes collected in advance 49,510 - 49,510Unearned revenue 26,752 453,122 479,874Noncurrent liabilities:
Due within one year 2,088,064 1,105,140 3,193,204Due in more than one year 27,447,250 16,120,981 43,568,231
Total liabilities 33,763,801 18,652,355 52,416,156
DEFERRED INFLOWS OF RESOURCESDeferred inflows of resources related to pensions 910,108 152,874 1,062,982Deferred inflows of resources related to OPEB 414,919 103,583 518,502
Total deferred inflows of resources 1,325,027 256,457 1,581,484
NET POSITIONNet investment in capital assets 19,168,057 28,330,999 47,049,106Restricted:
Education 836,662 - 836,662Grants and other programs 959,280 - 959,280Capital projects 1,527,429 - 1,527,429Permanent funds:
Nonexpendable 324,553 - 324,553Expendable 40,466 - 40,466
Unrestricted (4,498,485) (5,820,861) (9,869,396)Total net position $ 18,357,962 22,510,138 40,868,100
See accompanying notes to basic financial statements.
14
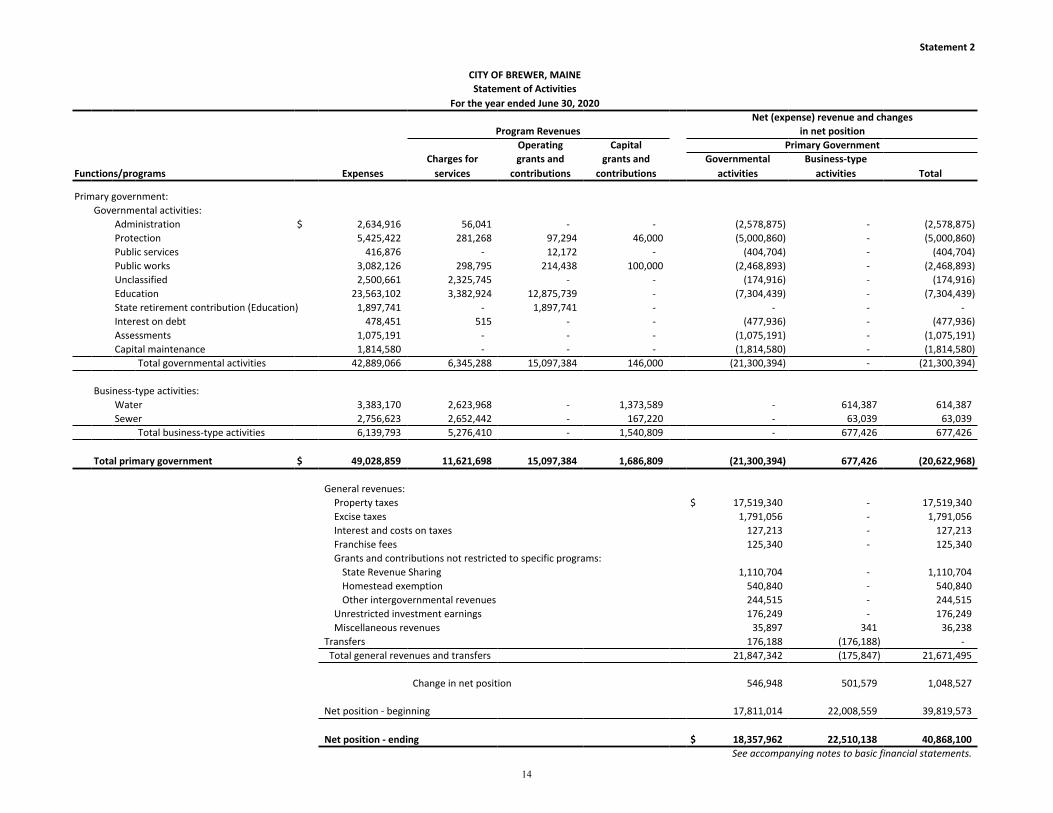
Statement 2
CITY OF BREWER, MAINEStatement of Activities
For the year ended June 30, 2020Net (expense) revenue and changes
Program Revenues in net positionOperating Capital Primary Government
Charges for grants and grants and Governmental Business-typeFunctions/programs Expenses services contributions contributions activities activities Total
Primary government:Governmental activities:
Administration $ 2,634,916 56,041 - - (2,578,875) - (2,578,875)Protection 5,425,422 281,268 97,294 46,000 (5,000,860) - (5,000,860)Public services 416,876 - 12,172 - (404,704) - (404,704)Public works 3,082,126 298,795 214,438 100,000 (2,468,893) - (2,468,893)Unclassified 2,500,661 2,325,745 - - (174,916) - (174,916)Education 23,563,102 3,382,924 12,875,739 - (7,304,439) - (7,304,439)State retirement contribution (Education) 1,897,741 - 1,897,741 - - - -Interest on debt 478,451 515 - - (477,936) - (477,936)Assessments 1,075,191 - - - (1,075,191) - (1,075,191)Capital maintenance 1,814,580 - - - (1,814,580) - (1,814,580)
Total governmental activities 42,889,066 6,345,288 15,097,384 146,000 (21,300,394) - (21,300,394)
Business-type activities:Water 3,383,170 2,623,968 - 1,373,589 - 614,387 614,387Sewer 2,756,623 2,652,442 - 167,220 - 63,039 63,039
Total business-type activities 6,139,793 5,276,410 - 1,540,809 - 677,426 677,426
Total primary government $ 49,028,859 11,621,698 15,097,384 1,686,809 (21,300,394) 677,426 (20,622,968)
General revenues: Property taxes $ 17,519,340 - 17,519,340 Excise taxes 1,791,056 - 1,791,056 Interest and costs on taxes 127,213 - 127,213 Franchise fees 125,340 - 125,340 Grants and contributions not restricted to specific programs:
State Revenue Sharing 1,110,704 - 1,110,704 Homestead exemption 540,840 - 540,840 Other intergovernmental revenues 244,515 - 244,515
Unrestricted investment earnings 176,249 - 176,249 Miscellaneous revenues 35,897 341 36,238Transfers 176,188 (176,188) - Total general revenues and transfers 21,847,342 (175,847) 21,671,495
Change in net position 546,948 501,579 1,048,527
Net position - beginning 17,811,014 22,008,559 39,819,573
Net position - ending $ 18,357,962 22,510,138 40,868,100See accompanying notes to basic financial statements.
15
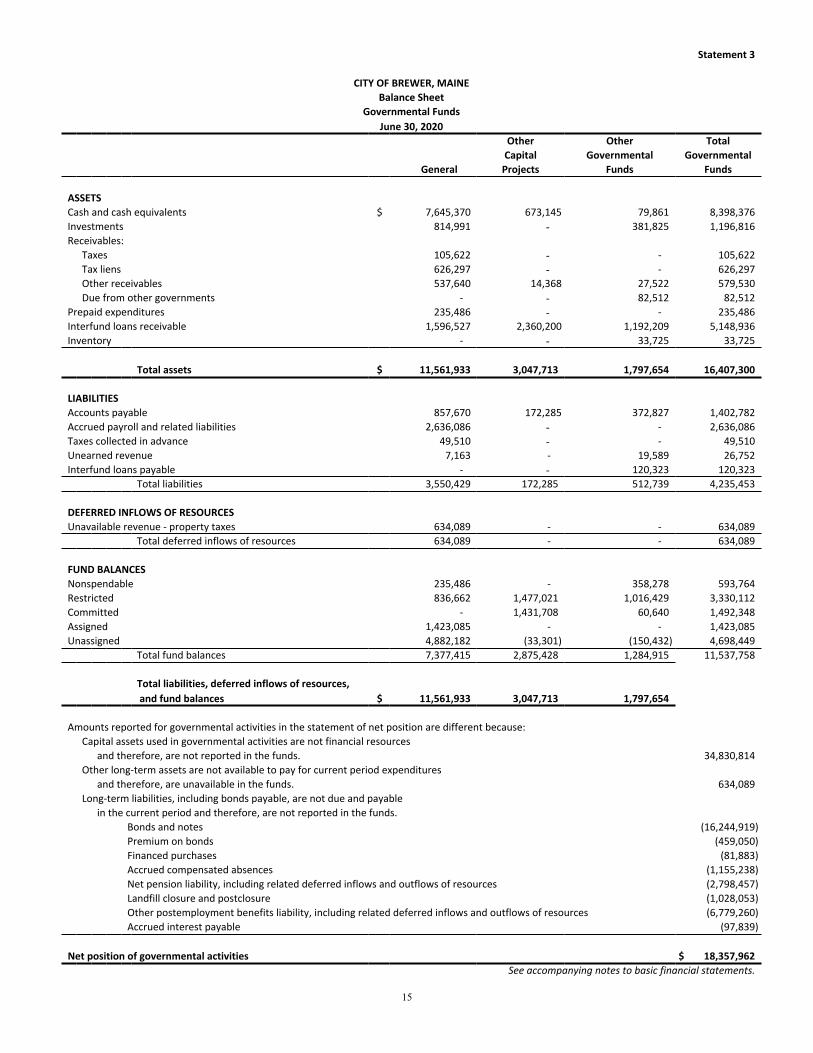
Statement 3
CITY OF BREWER, MAINEBalance Sheet
Governmental FundsJune 30, 2020
Other Other TotalCapital Governmental Governmental
General Projects Funds Funds
ASSETSCash and cash equivalents $ 7,645,370 673,145 79,861 8,398,376Investments 814,991 - 381,825 1,196,816Receivables:
Taxes 105,622 - - 105,622Tax liens 626,297 - - 626,297Other receivables 537,640 14,368 27,522 579,530Due from other governments - - 82,512 82,512
Prepaid expenditures 235,486 - - 235,486Interfund loans receivable 1,596,527 2,360,200 1,192,209 5,148,936Inventory - - 33,725 33,725
Total assets $ 11,561,933 3,047,713 1,797,654 16,407,300
LIABILITIES Accounts payable 857,670 172,285 372,827 1,402,782Accrued payroll and related liabilities 2,636,086 - - 2,636,086Taxes collected in advance 49,510 - - 49,510Unearned revenue 7,163 - 19,589 26,752Interfund loans payable - - 120,323 120,323
Total liabilities 3,550,429 172,285 512,739 4,235,453
DEFERRED INFLOWS OF RESOURCESUnavailable revenue - property taxes 634,089 - - 634,089
Total deferred inflows of resources 634,089 - - 634,089
FUND BALANCESNonspendable 235,486 - 358,278 593,764Restricted 836,662 1,477,021 1,016,429 3,330,112Committed - 1,431,708 60,640 1,492,348Assigned 1,423,085 - - 1,423,085Unassigned 4,882,182 (33,301) (150,432) 4,698,449
Total fund balances 7,377,415 2,875,428 1,284,915 11,537,758
Total liabilities, deferred inflows of resources, and fund balances $ 11,561,933 3,047,713 1,797,654
Amounts reported for governmental activities in the statement of net position are different because:Capital assets used in governmental activities are not financial resources
and therefore, are not reported in the funds. 34,830,814Other long-term assets are not available to pay for current period expenditures
and therefore, are unavailable in the funds. 634,089Long-term liabilities, including bonds payable, are not due and payable
in the current period and therefore, are not reported in the funds.Bonds and notes (16,244,919)Premium on bonds (459,050)Financed purchases (81,883)Accrued compensated absences (1,155,238)Net pension liability, including related deferred inflows and outflows of resources (2,798,457)Landfill closure and postclosure (1,028,053)Other postemployment benefits liability, including related deferred inflows and outflows of resources (6,779,260)Accrued interest payable (97,839)
Net position of governmental activities $ 18,357,962See accompanying notes to basic financial statements.

16
Statement 4
CITY OF BREWER, MAINEStatement of Revenues, Expenditures and Changes in Fund Balances
Governmental FundsFor the year ended June 30, 2020
Other Other TotalCapital Governmental Governmental
General Projects Funds Funds
Revenues:Taxes $ 19,340,789 - - 19,340,789Licenses and permits 243,159 - - 243,159Intergovernmental 15,598,707 - 1,295,180 16,893,887Local sources 4,241,426 1,872,431 294,103 6,407,960Unclassified - - 100,960 100,960Investment earnings 155,813 - 20,436 176,249
Total revenues 39,579,894 1,872,431 1,710,679 43,163,004
Expenditures:Current:
Administration 2,012,509 - - 2,012,509Protection 4,806,523 - 113,265 4,919,788Public services 323,225 - 93,651 416,876Public works 2,256,038 - - 2,256,038Unclassified 1,456,481 - 64,904 1,521,385Education 22,059,633 - 1,508,979 23,568,612Assessments 1,075,191 - - 1,075,191Retirement and group term life contributions 1,897,741 - - 1,897,741
Debt service:Principal 2,005,623 - - 2,005,623Interest 514,379 - - 514,379
Capital outlay 1,482,069 1,342,962 99,495 2,924,526Total expenditures 39,889,412 1,342,962 1,880,294 43,112,668
Excess (deficiency) of revenues over (under) expenditures (309,518) 529,469 (169,615) 50,336
Other financing sources (uses):Notes from direct borrowing proceeds 1,431,500 - - 1,431,500Financed purchases proceeds 50,569 - - 50,569Transfers from other funds 1,294,452 302,425 17,000 1,613,877Transfers to other funds (1,424,430) - (13,259) (1,437,689)
Total other financing sources (uses) 1,352,091 302,425 3,741- 1,658,257
Net change in fund balances 1,042,573 831,894 (165,874) 1,708,593
Fund balances, beginning of year 6,334,842 2,043,534 1,450,789 9,829,165
Fund balances, end of year $ 7,377,415 2,875,428 1,284,915 11,537,758See accompanying notes to basic financial statements.
17
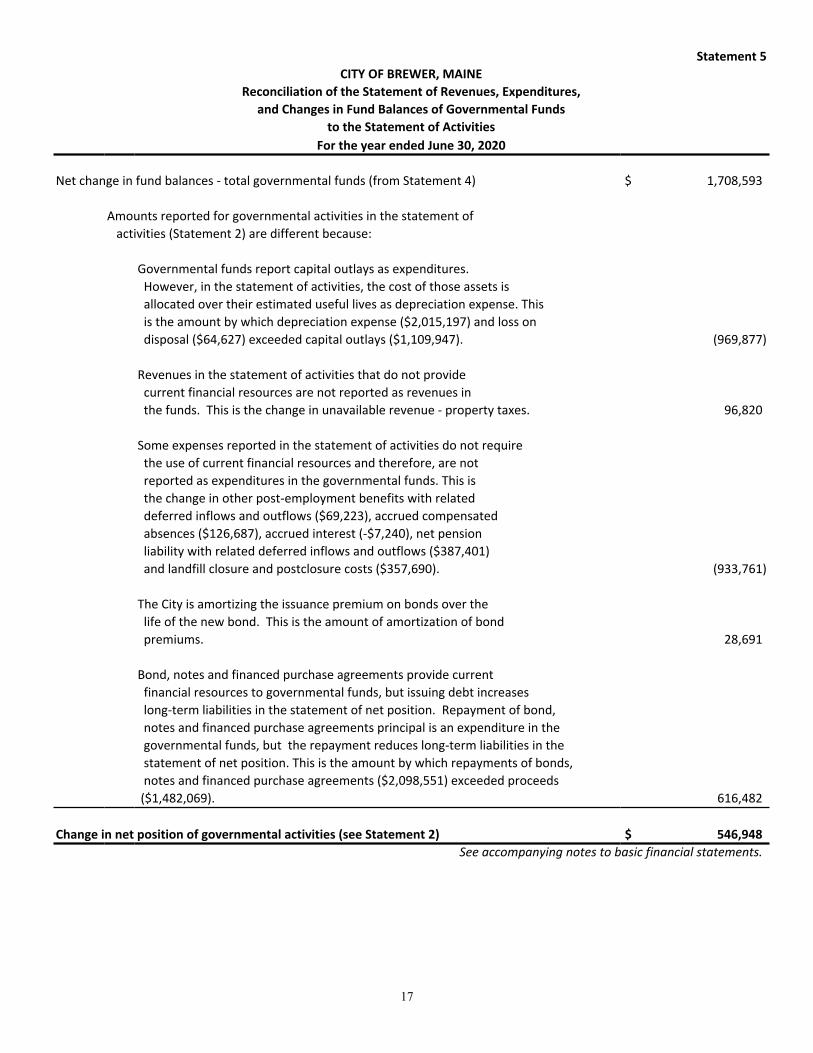
Statement 5CITY OF BREWER, MAINE
Reconciliation of the Statement of Revenues, Expenditures,and Changes in Fund Balances of Governmental Funds
to the Statement of ActivitiesFor the year ended June 30, 2020
Net change in fund balances - total governmental funds (from Statement 4) $ 1,708,593
Amounts reported for governmental activities in the statement of activities (Statement 2) are different because:
Governmental funds report capital outlays as expenditures. However, in the statement of activities, the cost of those assets is allocated over their estimated useful lives as depreciation expense. This is the amount by which depreciation expense ($2,015,197) and loss on disposal ($64,627) exceeded capital outlays ($1,109,947). (969,877)
Revenues in the statement of activities that do not provide current financial resources are not reported as revenues in the funds. This is the change in unavailable revenue - property taxes. 96,820
Some expenses reported in the statement of activities do not require the use of current financial resources and therefore, are not reported as expenditures in the governmental funds. This is the change in other post-employment benefits with related deferred inflows and outflows ($69,223), accrued compensated absences ($126,687), accrued interest (-$7,240), net pension liability with related deferred inflows and outflows ($387,401) and landfill closure and postclosure costs ($357,690). (933,761)
The City is amortizing the issuance premium on bonds over the life of the new bond. This is the amount of amortization of bond premiums. 28,691
Bond, notes and financed purchase agreements provide current financial resources to governmental funds, but issuing debt increases long-term liabilities in the statement of net position. Repayment of bond, notes and financed purchase agreements principal is an expenditure in the governmental funds, but the repayment reduces long-term liabilities in the statement of net position. This is the amount by which repayments of bonds, notes and financed purchase agreements ($2,098,551) exceeded proceeds ($1,482,069). 616,482
Change in net position of governmental activities (see Statement 2) $ 546,948See accompanying notes to basic financial statements.
18
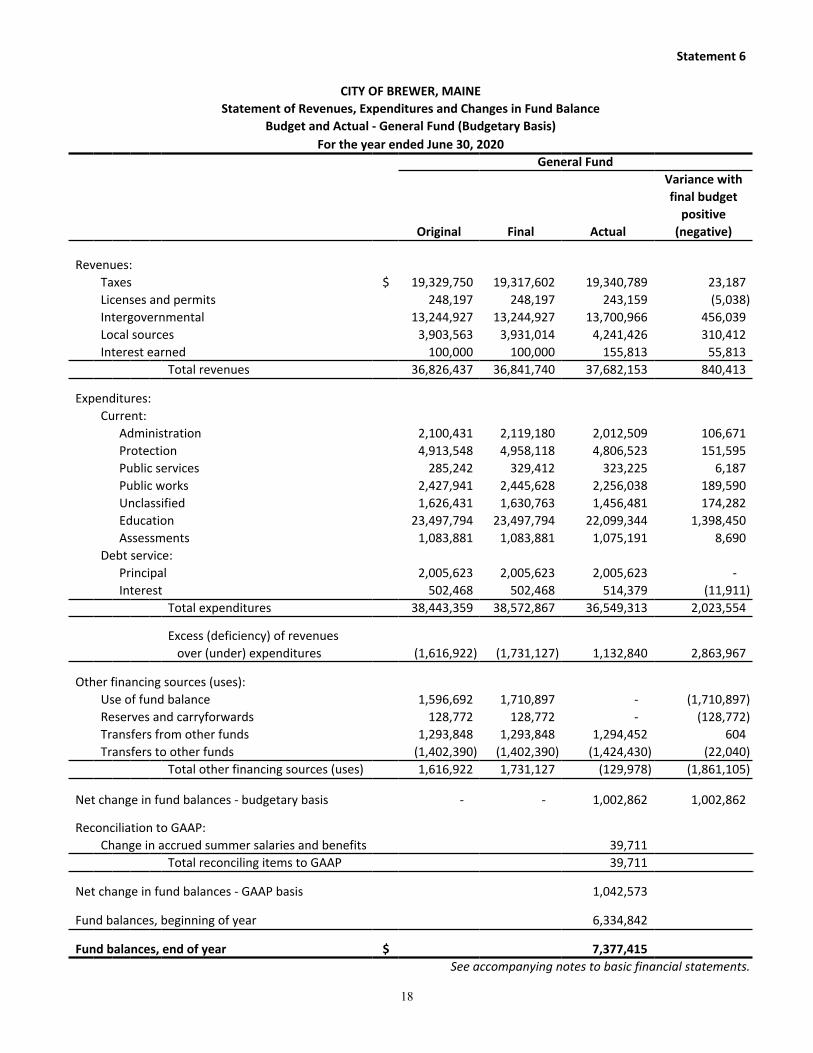
Statement 6
CITY OF BREWER, MAINEStatement of Revenues, Expenditures and Changes in Fund Balance
Budget and Actual - General Fund (Budgetary Basis)For the year ended June 30, 2020
General FundVariance withfinal budget
positiveOriginal Final Actual (negative)
Revenues:Taxes $ 19,329,750 19,317,602 19,340,789 23,187Licenses and permits 248,197 248,197 243,159 (5,038)Intergovernmental 13,244,927 13,244,927 13,700,966 456,039Local sources 3,903,563 3,931,014 4,241,426 310,412Interest earned 100,000 100,000 155,813 55,813
Total revenues 36,826,437 36,841,740 37,682,153 840,413
Expenditures:Current:
Administration 2,100,431 2,119,180 2,012,509 106,671Protection 4,913,548 4,958,118 4,806,523 151,595Public services 285,242 329,412 323,225 6,187Public works 2,427,941 2,445,628 2,256,038 189,590Unclassified 1,626,431 1,630,763 1,456,481 174,282Education 23,497,794 23,497,794 22,099,344 1,398,450Assessments 1,083,881 1,083,881 1,075,191 8,690
Debt service:Principal 2,005,623 2,005,623 2,005,623 - Interest 502,468 502,468 514,379 (11,911)
Total expenditures 38,443,359 38,572,867 36,549,313 2,023,554
Excess (deficiency) of revenues over (under) expenditures (1,616,922) (1,731,127) 1,132,840 2,863,967
Other financing sources (uses):Use of fund balance 1,596,692 1,710,897 - (1,710,897)Reserves and carryforwards 128,772 128,772 - (128,772)Transfers from other funds 1,293,848 1,293,848 1,294,452 604Transfers to other funds (1,402,390) (1,402,390) (1,424,430) (22,040)
Total other financing sources (uses) 1,616,922 1,731,127 (129,978) (1,861,105)
Net change in fund balances - budgetary basis - - 1,002,862 1,002,862
Reconciliation to GAAP:Change in accrued summer salaries and benefits 39,711
Total reconciling items to GAAP 39,711
Net change in fund balances - GAAP basis 1,042,573
Fund balances, beginning of year 6,334,842
Fund balances, end of year $ 7,377,415See accompanying notes to basic financial statements.
19
Statement 7
CITY OF BREWER, MAINEStatement of Net Position
Proprietary FundsJune 30, 2020
Business-type Activities - Enterprise FundsWater Sewer
Department Department Total
ASSETSCurrent assets:
Cash and cash equivalents $ 500 50 550User fees receivable 108,039 640,808 748,847Liens receivable 137 15,611 15,748Interfund loans receivable 2,101,339 - 2,101,339Inventory 32,940 - 32,940Other assets 667,100 - 667,100
Total current assets 2,910,055 656,469 - 3,566,524
Noncurrent assets:Capital assets not being depreciated:
Land and land rights 2,882,525 53,900 2,936,425Organizational costs 121,750 - 121,750Construction in progress 1,022,801 266,004 1,288,805
Total capital assets not being depreciated 4,027,076 319,904 4,346,980
Capital assets being depreciated:Capital assets 31,116,593 37,969,105 69,085,698Accumulated depreciation (11,932,189) (16,779,630) (28,711,819)
Total capital assets being depreciated 19,184,404 21,189,475 40,373,879Total noncurrent assets 23,211,480 21,509,379 44,720,859
Total assets 26,121,535 22,165,848 - 48,287,383
DEFERRED OUTFLOWS OF RESOURCESDeferred outflows of resources related to pensions 113,639 129,873 243,512Deferred outflows of resources related to OPEB 16,723 16,802 33,525
Total deferred outflows of resources 130,362 146,675 - 277,037
LIABILITIES Current liabilities:
Accounts payable 113,996 465,979 579,975Accrued payroll and related benefits 120,538 118,996 239,534Accrued interest payable 97,450 56,153 153,603Unearned revenue 370,885 82,237 453,122Interfund loans payable - 7,145,470 7,145,470Noncurrent liabilities, due in one year 550,874 554,266 - 1,105,140
Total current liabilities 1,253,743 8,423,101 9,676,844
Long-term liabilities:Noncurrent liabilities, due in more than one year 10,559,987 5,560,994 16,120,981
Total long-term liabilities 10,559,987 5,560,994 16,120,981
Total liabilities 11,813,730 13,984,095 - 25,797,825
DEFERRED INFLOWS OF RESOURCESDeferred inflows of resources related to pensions 71,341 81,533 152,874Deferred inflows of resources related to OPEB 51,670 51,913 103,583
Total deferred inflows of resources 123,011 133,446 - 256,457
NET POSITIONNet investment in capital assets 12,498,140 15,832,859 28,330,999Unrestricted 1,817,016 (7,637,877) (5,820,861)
Total net position $ 14,315,156 8,194,982 22,510,138See accompanying notes to basic financial statements.
20
Statement 8
CITY OF BREWER, MAINEStatement of Revenues, Expenses and Changes in Net Position
Proprietary FundsFor the year ended June 30, 2020
Business-type Activities - Enterprise FundsWater Sewer
Department Department Total
Operating revenues:Charges for services $ 2,529,948 2,332,304 4,862,252Other 94,020 320,138 414,158
Total operating revenues 2,623,968 2,652,442 5,276,410
Operating expenses:Operation - salaries and benefits 651,308 656,541 1,307,849Operation - other 1,452,702 1,007,961 2,460,663Administrative expenses - salaries and benefits 205,790 176,845 382,635Administrative expenses - other 129,792 115,932 245,724Depreciation and amortization 538,574 606,535 1,145,109
Total operating expenses 2,978,166 2,563,814 5,541,980
Operating income (loss) (354,198) 88,628 (265,570)
Nonoperating revenues (expenses):Other revenues - 341 341Capital grants and contributions 1,373,589 167,220 1,540,809Interest on debt service (405,004) (174,258) (579,262)Gain (loss) on disposal of capital assets - (18,551) (18,551)
Total nonoperating revenues (expenses) 968,585 (25,248) 943,337
Net income (loss) before transfers 614,387 63,380 677,767
Transfers:Transfers in - 24,488 24,488Transfers to General Fund - administration (103,932) (96,744) (200,676)
Total transfers (103,932) (72,256) (176,188)
Change in net position 510,455 (8,876) 501,579
Net position, beginning of year 13,804,701 8,203,858 22,008,559
Net position, end of year $ 14,315,156 8,194,982 22,510,138See accompanying notes to basic financial statements.
21
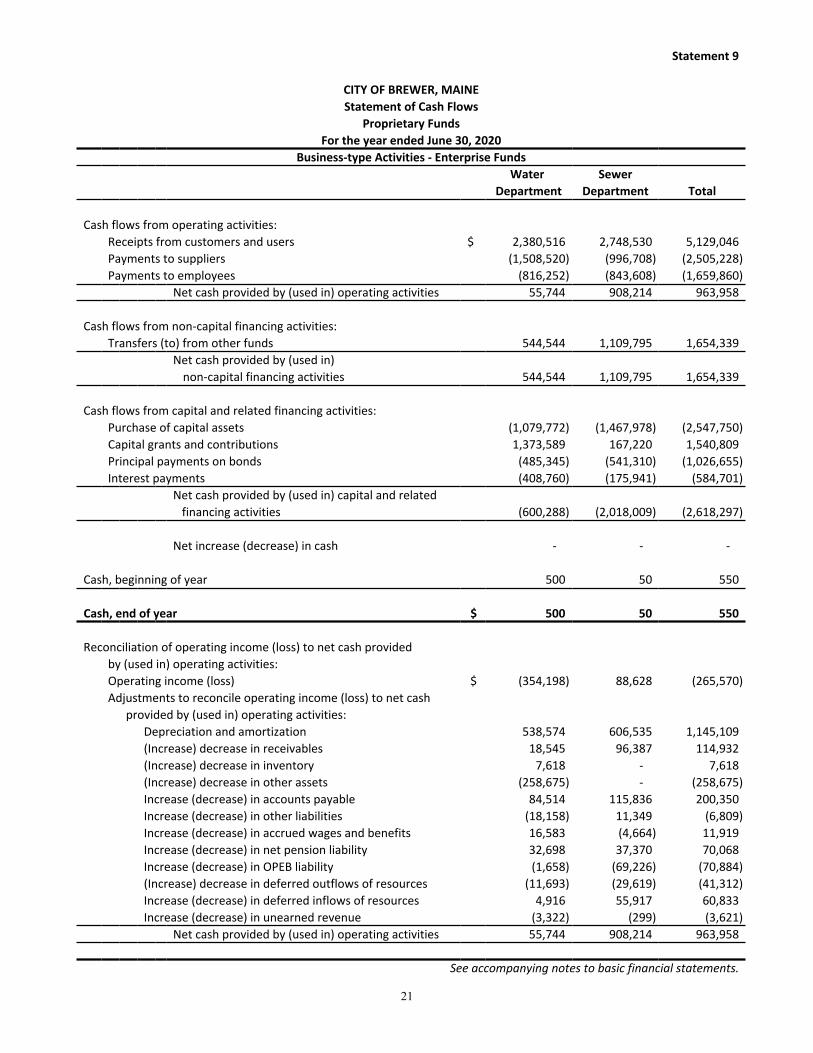
Statement 9
CITY OF BREWER, MAINEStatement of Cash Flows
Proprietary FundsFor the year ended June 30, 2020
Business-type Activities - Enterprise FundsWater Sewer
Department Department Total
Cash flows from operating activities:Receipts from customers and users $ 2,380,516 2,748,530 5,129,046Payments to suppliers (1,508,520) (996,708) (2,505,228)Payments to employees (816,252) (843,608) (1,659,860)
Net cash provided by (used in) operating activities 55,744 908,214 963,958
Cash flows from non-capital financing activities:Transfers (to) from other funds 544,544 1,109,795 1,654,339
Net cash provided by (used in)non-capital financing activities 544,544 1,109,795 1,654,339
Cash flows from capital and related financing activities:Purchase of capital assets (1,079,772) (1,467,978) (2,547,750)Capital grants and contributions 1,373,589 167,220 1,540,809Principal payments on bonds (485,345) (541,310) (1,026,655)Interest payments (408,760) (175,941) (584,701)
Net cash provided by (used in) capital and related financing activities (600,288) (2,018,009) (2,618,297)
Net increase (decrease) in cash - - -
Cash, beginning of year 500 50 550
Cash, end of year $ 500 50 550
Reconciliation of operating income (loss) to net cash providedby (used in) operating activities:Operating income (loss) $ (354,198) 88,628 (265,570)Adjustments to reconcile operating income (loss) to net cash
provided by (used in) operating activities:Depreciation and amortization 538,574 606,535 1,145,109(Increase) decrease in receivables 18,545 96,387 114,932(Increase) decrease in inventory 7,618 - 7,618(Increase) decrease in other assets (258,675) - (258,675)Increase (decrease) in accounts payable 84,514 115,836 200,350Increase (decrease) in other liabilities (18,158) 11,349 (6,809)Increase (decrease) in accrued wages and benefits 16,583 (4,664) 11,919Increase (decrease) in net pension liability 32,698 37,370 70,068Increase (decrease) in OPEB liability (1,658) (69,226) (70,884)(Increase) decrease in deferred outflows of resources (11,693) (29,619) (41,312)Increase (decrease) in deferred inflows of resources 4,916 55,917 60,833Increase (decrease) in unearned revenue (3,322) (299) (3,621)
Net cash provided by (used in) operating activities 55,744 908,214 963,958
See accompanying notes to basic financial statements.
22
Statement 10
CITY OF BREWER, MAINEStatement of Fiduciary Net Position
Fiduciary FundsJune 30, 2020
AgencyFunds Private-
Student purposeActivity TrustFunds Funds
ASSETSCash and cash equivalents $ 277,524 14,976Investments - 736,790Interfund loans receivable - 15,518
Total assets 277,524 767,284
LIABILITIES Due to student groups 277,524 -
- Total liabilities 277,524 -
NET POSITIONHeld in trust $ - 767,284
See accompanying notes to basic financial statements.
23
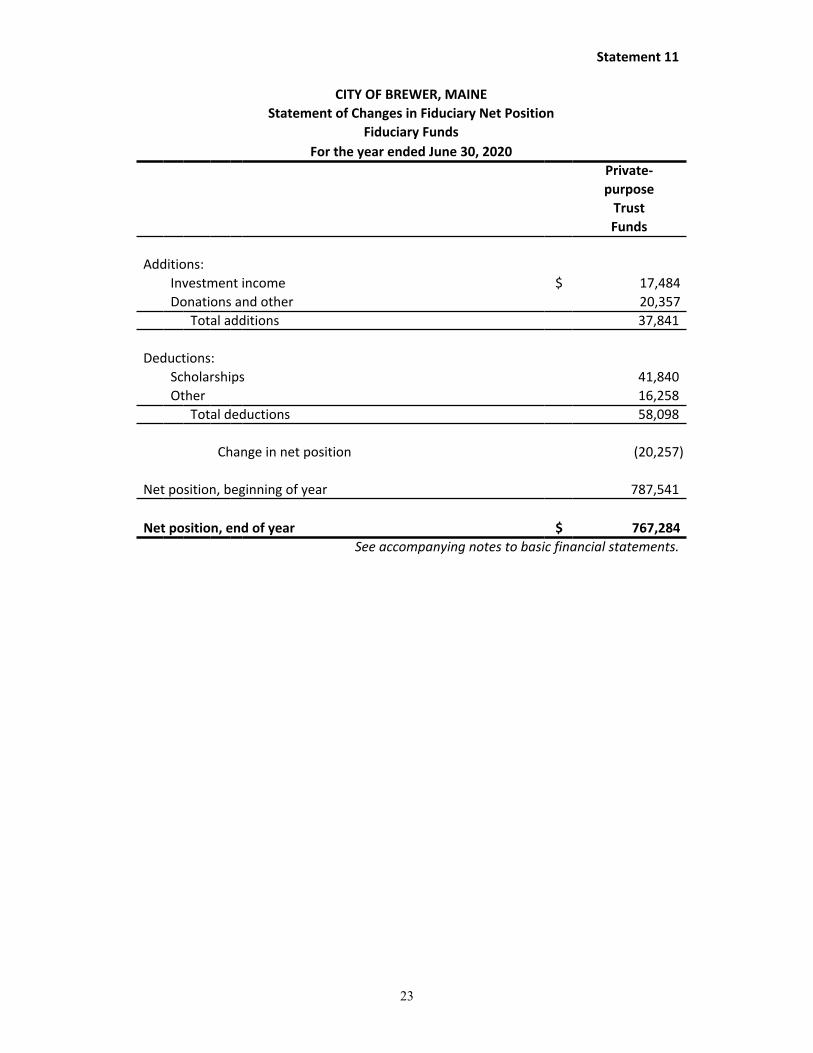
Statement 11
CITY OF BREWER, MAINEStatement of Changes in Fiduciary Net Position
Fiduciary FundsFor the year ended June 30, 2020
Private-purpose
TrustFunds
Additions:Investment income $ 17,484Donations and other 20,357
Total additions 37,841
Deductions:Scholarships 41,840Other 16,258
Total deductions 58,098
Change in net position (20,257)
Net position, beginning of year 787,541
Net position, end of year $ 767,284See accompanying notes to basic financial statements.
CITY OF BREWER, MAINENotes to Basic Financial Statements
24
SUMMARY OF SIGNIFICANT ACCOUNTING POLICIES
The financial statements of the City of Brewer have been prepared in conformity with U.S. generally accepted accounting standards (GAAP) as applied to governmental units. The Governmental Accounting Standards Board is the accepted standard-setting body for establishing governmental accounting and financial reporting principles. The more significant of the government’s accounting policies are described below.
A. Reporting Entity
The City of Brewer operates under an elected City Council and City Manager form of government. TheCity’s School Department operates under an elected School Board. The City’s major operations includewater, sewer, public works, protection, public services, education, and general administrative services.
As required by accounting principles generally accepted in the United States of America, the financialstatements of the reporting entity include those of the City of Brewer, Maine (the primary government)and its component units. The decision to include a potential component unit was made by applying thecriteria set forth in accounting principles generally accepted in the United States of America, which definesthe reporting entity as the primary government and those component units for which the primarygovernment is financially accountable. Financial accountability is defined as appointment of a votingmajority of the component unit's board, and either a) the ability of the primary government to impose itswill on the component unit, or b) the possibility that the component unit will provide a financial benefit toor impose a financial burden on the primary government. Application of this criterion and determinationof type of presentation involves considering whether the activity benefits the government and/or it citizens,or whether the activity is conducted within the geographic boundaries of the government and is generallyavailable to its citizens. Based upon the application of these criteria, there were no potential componentunits required to be included in this report.
B. Government-wide and Fund Financial Statements
The government-wide financial statements (i.e., the statement of net position and the statement ofactivities) report information on all of the nonfiduciary activities of the City. For the most part, the effect ofinterfund activity has been removed from these statements. Governmental activities, which normally aresupported by taxes and intergovernmental revenues, are reported separately from business-type activities,which rely to a significant extent on fees and charges for support.
The statement of activities demonstrates the degree to which the direct expenses of a given function orsegment are offset by program revenues. Direct expenses are those that are clearly identifiable with aspecific function or segment. The City has elected not to allocate indirect costs among the programs,functions, and segments. Program revenues include 1) charges to customers or applicants who purchase,use, or directly benefit from goods, services, or privileges provided by a given function or segment and 2)grants and contributions that are restricted to meeting the operational or capital requirements of aparticular function or segment. Taxes and other items not properly included among program revenuesare reported as general revenues.
CITY OF BREWER, MAINENotes to Basic Financial Statements
25
SUMMARY OF SIGNIFICANT ACCOUNTING POLICIES, CONTINUED
Separate financial statements are provided for governmental funds, proprietary funds, and fiduciary funds, even though the latter are excluded from the government-wide financial statements. Major individual governmental funds and major individual enterprise funds are reported as separate columns in the fund financial statements.
C. Measurement Focus, Basis of Accounting, and Basis of Presentation
The government-wide financial statements are reported using the economic resources measurement focusand the accrual basis of accounting, as are the proprietary fund and fiduciary fund financial statements.Revenues are recorded when earned and expenses are recorded when a liability is incurred, regardless of thetiming of related cash flows. Property taxes are recognized as revenues in the year for which they are levied.Grants and similar items are recognized as revenue as soon as all eligibility requirements imposed by theprovider have been met.
Governmental fund financial statements are reported using the current financial resources measurement focusand the modified accrual basis of accounting. Revenues are recognized as soon as they are both measurableand available. Revenues are considered to be available when they are collectible within the current period orsoon enough thereafter to pay liabilities of the current period. For this purpose, the government considersrevenues to be available if they are collected within 60 days of the end of the current fiscal period forproperty taxes and one year for other revenues. Expenditures generally are recorded when a liability isincurred, as under accrual accounting. However, debt service expenditures, as well as certain compensatedabsences and claims and judgments, are recorded only when the payment is due.
Those revenues susceptible to accrual are property taxes, interest, and charges for services. Other receiptsand taxes become measurable and available when cash is received by the City and are recognized as revenueat that time.
Entitlements and shared revenues are recorded at the time of receipt or earlier if the susceptible to accrualcriteria are met. Expenditure-driven grants are recognized as revenue when the qualifying expenditureshave been incurred and all other grant requirements have been met.
The City reports the following major governmental funds:
The General Fund is the City’s primary operating fund. It accounts for all financial resources of the general government, except those required to be accounted for in another fund.
The Other Capital Projects Fund accounts for resources obtained and expended for the acquisition of major capital facilities other than those employed in the delivery of services accounted for in enterprise funds.
CITY OF BREWER, MAINENotes to Basic Financial Statements
26
SUMMARY OF SIGNIFICANT ACCOUNTING POLICIES, CONTINUED
The City reports the following major proprietary funds:
Water Fund accounts for the operation of the water system in Brewer.
Sewer Fund accounts for the operation of a sewer system in Brewer.
Additionally, the City reports the following fund type:
Fiduciary funds account for assets held by the City in a trustee capacity or as an agent on behalf of others. The City’s fiduciary funds include the following fund types:
Agency funds are custodial in nature and do not present results of operations or have a measurement focus. Agency funds are accounted for using the modified accrual basis of accounting. The funds are used to account for assets that the City holds for others in an agency capacity.
Private-purpose Trust Funds are used to account for resources legally held in trust for school department scholarships.
As a general rule, the effect of interfund activity has been eliminated from the government-wide financial statements. Exceptions to this general rule are charges between the City’s Water and Sewer Funds and various other functions of the government. Elimination of these charges would distort the direct costs and program revenues reported for the various functions concerned.
Amounts reported as program revenues include 1) charges to customers or applicants for goods, services, or privileges provided, 2) operating grants and contributions, and 3) capital grants and contributions, including special assessments. Internally dedicated resources are reported as general revenues rather than as program revenues. Likewise, general revenues include all taxes.
Proprietary funds distinguish operating revenues and expenses from nonoperating items. Operating revenues and expenses generally result from providing services and producing and delivering goods in connection with a proprietary fund’s principal ongoing operations. The principal operating revenues of the City’s proprietary fund is charges to customers for sales and services; operating expenses include the cost of sales and services, administrative expenses, and depreciation on capital assets. All revenues and expenses not meeting this definition are reported as nonoperating revenues and expenses.
CITY OF BREWER, MAINENotes to Basic Financial Statements
27
SUMMARY OF SIGNIFICANT ACCOUNTING POLICIES, CONTINUED
D. Cash and Investments
Cash and cash equivalents are considered to be cash on hand, amounts in demand deposits, savings accounts,and certificates of deposit. State statutes authorize the City to invest in obligations of the U. S. Treasury,commercial paper, corporate bonds, money market mutual funds and repurchase agreements.
Investments are stated at fair value. For the purposes of the statement of cash flows, all highly liquid investmentswith a maturity of three months or less when purchased are considered to be cash equivalents.
E. Short-term Interfund Receivables/Payables
During the course of operations, numerous transactions occur between individual funds for goods provided orservices rendered. These receivables and payables are classified as interfund loans on the balance sheet.
F. Receivables
All receivables are reported at their gross value and, where appropriate, are reduced by the estimated portionthat is expected to be uncollectible. Unbilled revenues from the Water and Sewer Funds are recognized at theend of each fiscal year on a pro rata basis. This amount is based on billings during the months following the closeof the fiscal year.
G. Inventories and Prepaid Expenditures
School Lunch and the Water Fund supply inventories are valued at the lower of cost or market using the first-in,first-out method. The cost of inventories is recorded as expenditures/expenses when consumed rather thanwhen purchased.
Certain payments to vendors reflect costs applicable to future accounting periods and are recorded as prepaidexpenditures in both the government-wide and fund financial statements. The cost of prepaid expenditures isrecorded as expenditures/expenses when consumed rather than when purchased.
H. Capital Assets
Capital assets, which include property, plant, equipment, and infrastructure assets (e.g., roads, bridges,sidewalks, and similar items), are reported in the applicable governmental or business-type activities columns inthe government-wide financial statements. Capital assets are defined by the City as assets with an initial,individual cost of more than $10,000 ($50,000 for infrastructure), and an estimated useful life in excess of twoyears. Such assets are recorded at historical cost or estimated historical cost if purchased or constructed. Donatedcapital assets are recorded at estimated acquisition cost at the date of donation.
The costs of normal repairs and maintenance that do not add to the value of the asset or materially extend assetslives are not capitalized.
CITY OF BREWER, MAINENotes to Basic Financial Statements
28
SUMMARY OF SIGNIFICANT ACCOUNTING POLICIES, CONTINUED
Major outlays for capital assets, improvements and infrastructure are categorized by project or location. For constructed assets they are capitalized as built-in construction in progress, but not depreciated until completed
Property, plant, and equipment of the primary government is depreciated using the straight-line method over the following estimated useful lives:
Buildings, building improvements and land improvements 15-100 years Machinery and equipment 5-30 yearsVehicles 5-30 yearsInfrastructure 50 years
I. Compensated Absences
It is the government’s policy to permit employees to accumulate earned, but unused vacation and sick paybenefits. Long-term accumulated vacation and sick leave is reported only in the entity-wide statement of netposition and in the proprietary funds. A liability for these amounts is reported in governmental funds onlyif they have matured, for example, as a result of employee resignations and retirements.
J. Long-term Obligations
In the government-wide financial statements, and proprietary fund types in the fund financial statements,long-term debt and other long-term obligations are reported as liabilities in the applicable governmentalactivities, business-type activities, or proprietary fund type statement of net position. Bond premiums anddiscounts are deferred and amortized over the life of the bonds using the straight- line method. Bonds payableare reported net of the applicable bond premium or discount.
In the fund financial statements, governmental fund types recognize bond premiums and discounts, as wellas bond issuance costs, during the current period. The face amount of debt is reported as other financingsources. Premiums received on debt issuances are reported as other financing sources while discounts ondebt issuances are reported as other financing uses. Issuance costs, whether or not withheld from the actualdebt proceeds received, are reported as debt service expenditures.
K. Deferred Outflows and Inflows of Resources
In addition to assets and liabilities, the statement of net position and balance sheet will sometimes reportseparate sections for deferred outflows of resources and deferred inflows of resources. These separatefinancial statement elements, deferred outflows of resources and deferred inflows of resources, represent aconsumption or acquisition of net position that applies to a future period(s) and so will not be recognized as anoutflow of resources (expense) or inflow of resources (revenue) until that time. The governmental funds onlyreport one deferred inflow of resources, unavailable revenue from property taxes. These amounts are deferredand recognized as an inflow of resources in the period that the amounts become available.
CITY OF BREWER, MAINENotes to Basic Financial Statements
29
SUMMARY OF SIGNIFICANT ACCOUNTING POLICIES, CONTINUED
The governmental activities have deferred outflows and inflows that relate to the net pension and OPEB liabilities, which include the City’s contributions subsequent to the measurement date, which are recognized as a reduction of the net pension and OPEB liabilities in the subsequent year.
They also include changes in assumptions, differences between expected and actual experience, and changes in proportion and differences between City contributions and proportionate share of contributions, which are deferred and amortized over the average expected remaining service lives of active and inactive members in the plan. They also include the net difference between projected and actual earnings on pension plan investments, which is deferred and amortized over a five-year period.
L. Fund Equity
Governmental fund balance is reported in five classifications that comprise a hierarchy based primarily onthe extent to which the City is bound to honor constraints on the specific purposes for which those fundscan be spent. The five classifications of fund balance for the Governmental Funds are as follows:
• Nonspendable – resources which cannot be spent because they are either a) not in spendable formor; b) legally or contractually required to be maintained intact.
• Restricted – resources with constraints placed on the use of resources which are either a) externallyimposed by creditors (such as through debt covenants), grantors, contributors or laws or regulations ofother governments or; b) imposed by law through constitutional provisions or enabling legislation.
• Committed – resources which are subject to limitations the City imposes on itself at its highest levelof decision-making authority, and that remain binding unless removed in the same manner.
• Assigned – resources that are constrained by the City’s intent to be used for specific purposes, but areneither restricted nor committed.
• Unassigned – resources which have not been assigned to other funds and that have not beenrestricted, committed, or assigned to specific purposes within the General Fund. The General Fundshould be the only fund that reports a positive unassigned fund balance amount.
The City Council has the responsibility for committing fund balance amounts and likewise would be required to modify or rescind those commitments. Likewise, the City Council or a body or official delegated by the City Council may assign unspent budgeted amounts to specific purposes in the General Fund at year end based on Department requests. Although not a formal policy, when both restricted and unrestricted resources are available for use, it is the City’s intent to use restricted resources first, then unrestricted resources as they are needed. When committed, assigned, and unassigned resources are available for use, it is the City’s intent to use committed or assigned resources first, and then unassigned resources as they are needed.
CITY OF BREWER, MAINENotes to Basic Financial Statements
30
SUMMARY OF SIGNIFICANT ACCOUNTING POLICIES, CONTINUED
M. Encumbrances
Encumbrance accounting, under which purchase orders, contracts, and other commitments for the expenditureof funds are recorded in order to reserve that portion of the applicable appropriations, is used in governmentaland business-type funds. All encumbrances, if any, are assigned at year end.
N. Use of Estimates
Preparation of the City’s financial statements requires management to make estimates and assumptionsthat affect the reported amounts of assets and liabilities and disclosure of contingent items at the date of thefinancial statements and the reported amounts of revenues and expenses/expenditures during the reportingperiod. Actual results could differ from those estimates.
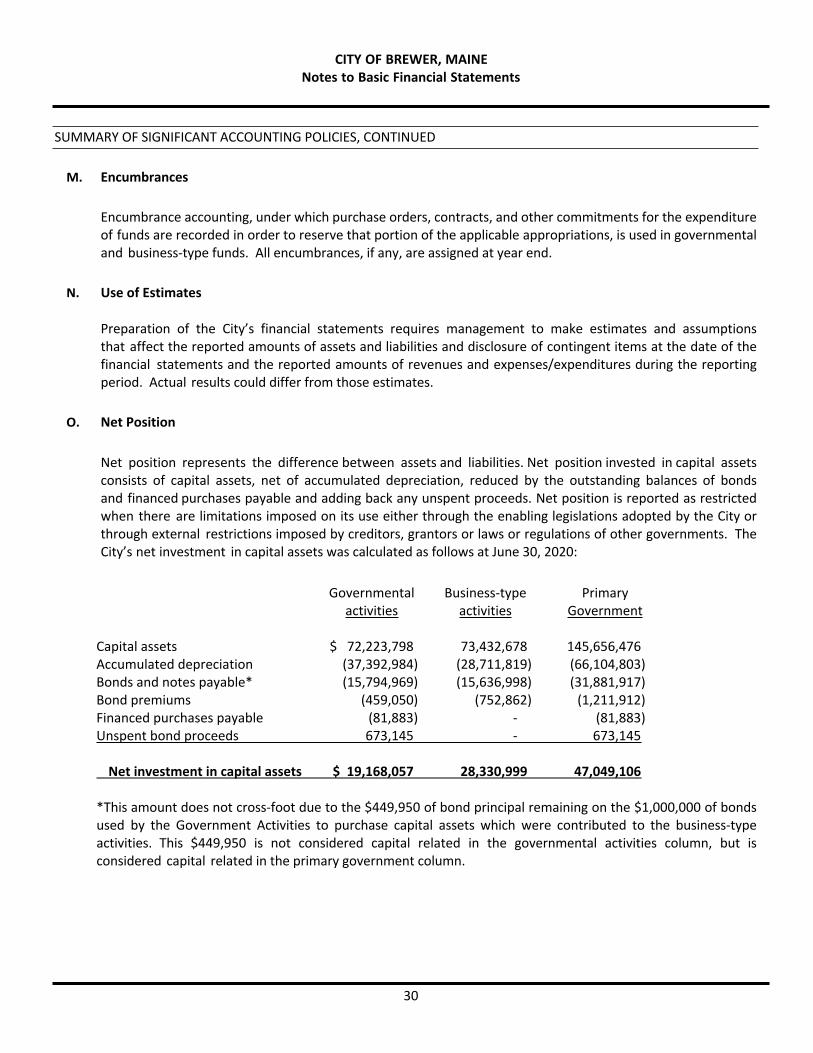
O. Net Position
Net position represents the difference between assets and liabilities. Net position invested in capital assetsconsists of capital assets, net of accumulated depreciation, reduced by the outstanding balances of bondsand financed purchases payable and adding back any unspent proceeds. Net position is reported as restrictedwhen there are limitations imposed on its use either through the enabling legislations adopted by the City orthrough external restrictions imposed by creditors, grantors or laws or regulations of other governments. TheCity’s net investment in capital assets was calculated as follows at June 30, 2020:
Governmental Business-type Primary activities activities Government
Capital assets $ 72,223,798 73,432,678 145,656,476Accumulated depreciation (37,392,984) (28,711,819) (66,104,803)Bonds and notes payable* (15,794,969) (15,636,998) (31,881,917)Bond premiums (459,050) (752,862) (1,211,912)Financed purchases payable (81,883) - (81,883)Unspent bond proceeds 673,145 - 673,145
Net investment in capital assets $ 19,168,057 28,330,999 47,049,106
*This amount does not cross-foot due to the $449,950 of bond principal remaining on the $1,000,000 of bondsused by the Government Activities to purchase capital assets which were contributed to the business-typeactivities. This $449,950 is not considered capital related in the governmental activities column, but isconsidered capital related in the primary government column.

CITY OF BREWER, MAINENotes to Basic Financial Statements
31
SUMMARY OF SIGNIFICANT ACCOUNTING POLICIES, CONTINUED
P. Pensions
For purposes of measuring the net pension liability, deferred outflows of resources and deferred inflows ofresources related to pensions, and pension expense, information about the fiduciary net position of the MainePublic Employees Retirement System Consolidated Plan for Participating Local Districts (PLD Plan) and MainePublic Employees Retirement System State Employee and Teacher Plan (SET Plan) and additions to/deductionsfrom the Plan’s fiduciary net position have been determined on the same basis as they are reported by thePlans. For this purpose, benefit payments (including refunds of employee contributions) are recognized whendue and payable in accordance with the benefit terms. Investments are reported at fair value.
Q. Other Post-Employment Benefits (OPEB)
For purposes of measuring the net OPEB liability, deferred outflows of resources and deferred inflows ofresources related to OPEB, and OPEB expense, information about the fiduciary net position of the OPEB Planand additions to/deductions from the OPEB Plan’s fiduciary net position have been determined based onactuary reports prepared by the OPEB Plan’s actuary. For this purpose, benefit payments (including refundsof employee contributions) are recognized when due and payable in accordance with the benefit terms.Investments are reported at fair value.
R. Comparative Data/Reclassifications
Comparative data for the prior year has been presented only for certain funds in the fund financialstatements in order to provide an understanding of the changes in the financial position and operations of thesefunds. Also, certain amounts presented in the prior year data have been reclassified in order to be consistentwith the current year's presentation.
STEWARDSHIP, COMPLIANCE AND ACCOUNTABILITY
A. Budgetary Information
Budgets are adopted for the General Fund, Capital Improvement Program, Sewer Fund, and Water Fund and areadopted on a basis consistent with accounting principles generally accepted in the United States of Americaexcept, in the case of the General Fund, for teachers’ salaries and benefits which are budgeted on a cashbasis. The level of control (level at which expenditures may not exceed budget) is the Department for thegeneral fund budget. Additionally, Maine Public Employees Retirement System on-behalf payments are notbudgeted. Generally, all unexpended budgetary accounts lapse at the close of the fiscal year except some on-going projects which may be committed or assigned for subsequent year expenditure and some non-lapsingaccounts which are carried forward to the next fiscal year.
For the year ended June 30, 2020, expenditures exceeded appropriations in the following general funddepartments as shown on Exhibit A-2:
City Manager $ 12,793Animal control 2,183Transit system 4,493Solid waste disposal 11,517
CITY OF BREWER, MAINENotes to Basic Financial Statements
32
STEWARDSHIP, COMPLIANCE AND ACCOUNTABILITY, CONTINUED
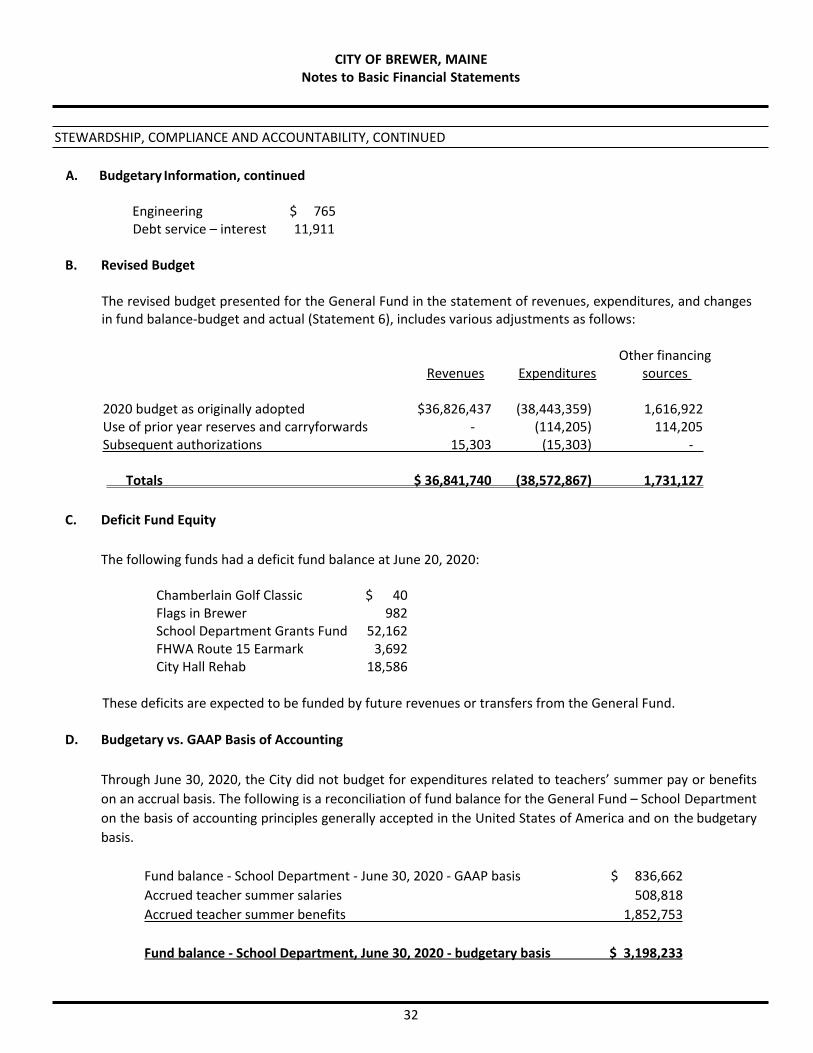
A. Budgetary Information, continued
Engineering $ 765 Debt service – interest 11,911
B. Revised Budget
The revised budget presented for the General Fund in the statement of revenues, expenditures, and changesin fund balance-budget and actual (Statement 6), includes various adjustments as follows:
Other financingRevenues Expenditures sources
2020 budget as originally adopted $36,826,437 (38,443,359) 1,616,922Use of prior year reserves and carryforwards - (114,205) 114,205Subsequent authorizations 15,303 (15,303) -
Totals $ 36,841,740 (38,572,867) 1,731,127
C. Deficit Fund Equity
The following funds had a deficit fund balance at June 20, 2020:
Chamberlain Golf Classic $ 40Flags in Brewer 982School Department Grants Fund 52,162FHWA Route 15 Earmark 3,692City Hall Rehab 18,586
These deficits are expected to be funded by future revenues or transfers from the General Fund.
D. Budgetary vs. GAAP Basis of Accounting
Through June 30, 2020, the City did not budget for expenditures related to teachers’ summer pay or benefitson an accrual basis. The following is a reconciliation of fund balance for the General Fund – School Departmenton the basis of accounting principles generally accepted in the United States of America and on the budgetarybasis.
Fund balance - School Department - June 30, 2020 - GAAP basis $ 836,662Accrued teacher summer salaries 508,818Accrued teacher summer benefits 1,852,753
Fund balance - School Department, June 30, 2020 - budgetary basis $ 3,198,233

CITY OF BREWER, MAINENotes to Basic Financial Statements
33
STEWARDSHIP, COMPLIANCE AND ACCOUNTABILITY, CONTINUED
As required by generally accepted accounting principles (GAAP), the City has recorded a revenue and expenditure for Maine Public Employees Retirement System (MainePERS) contributions made by the State of Maine on behalf of the Brewer School Department. These amounts have not been budgeted and result in a difference in reporting on a budgetary basis of accounting vs. reporting under accounting principles generally accepted in the United States of America of $1,897,741. These amounts have been included as intergovernmental revenues and education expenditures/expenses in the General Fund on statement 4 (GAAP basis) and on the statement of activities (Statement 2). There is no effect on the fund balance/net position at the end of the year.
DEPOSITS AND INVESTMENTS
A. Deposits
Custodial Credit Risk-City Deposits: Custodial credit risk is the risk that in the event of a bank failure, theCity’s deposits may not be returned to it. The City’s policy is that funds can only be invested in financialinstitutions that are insured by the F.D.I.C. Any funds deposited or invested above the $250,000 insurancelimit must be collateralized by the financial institution at 110% of the face value of the deposit or preferablybe fully insured by an independent agent. Any designated collateral shall consist of U.S. Treasury or U.S.Government Agency obligations. As of June 30, 2020, the City reported deposits of $8,691,426 with a bankbalance of $8,897,151. Of the City’s bank balances, all were insured by the F.D.I.C. or collateralized bysecurities held in the City’s name.
Deposits have been reported as follows:
Reported in governmental funds $ 8,398,376 Reported in business-type activities 550Reported in fiduciary funds 292,500
Total deposits $ 8,691,426
B. Investments
At June 30, 2020, the City had the following investments and maturities:
Fair Less than Over Level 1value 1 year 1-5 years 5 years Input
Money market $ 1,042,884 not applicable 1,042,884 U.S. Treasury notes 50,227 50,227 - - 50,227 Corporate bonds 840,495 - 840,495 - 840,495
Total investments $ 1,933,606 50,227 840,495 - 1,933,606
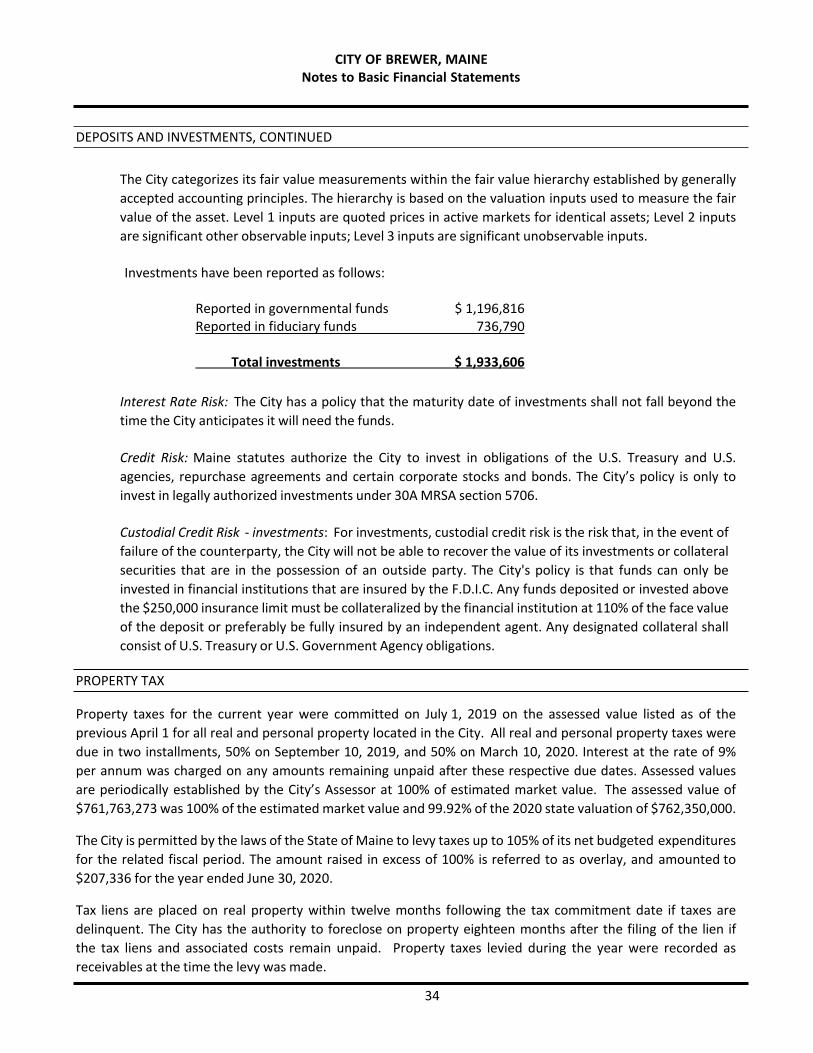
CITY OF BREWER, MAINENotes to Basic Financial Statements
34
DEPOSITS AND INVESTMENTS, CONTINUED
The City categorizes its fair value measurements within the fair value hierarchy established by generally accepted accounting principles. The hierarchy is based on the valuation inputs used to measure the fair value of the asset. Level 1 inputs are quoted prices in active markets for identical assets; Level 2 inputs are significant other observable inputs; Level 3 inputs are significant unobservable inputs.
Investments have been reported as follows:
Reported in governmental funds $ 1,196,816Reported in fiduciary funds 736,790
Total investments $ 1,933,606
Interest Rate Risk: The City has a policy that the maturity date of investments shall not fall beyond the time the City anticipates it will need the funds.
Credit Risk: Maine statutes authorize the City to invest in obligations of the U.S. Treasury and U.S. agencies, repurchase agreements and certain corporate stocks and bonds. The City’s policy is only to invest in legally authorized investments under 30A MRSA section 5706.
Custodial Credit Risk - investments: For investments, custodial credit risk is the risk that, in the event of failure of the counterparty, the City will not be able to recover the value of its investments or collateral securities that are in the possession of an outside party. The City's policy is that funds can only be invested in financial institutions that are insured by the F.D.I.C. Any funds deposited or invested above the $250,000 insurance limit must be collateralized by the financial institution at 110% of the face value of the deposit or preferably be fully insured by an independent agent. Any designated collateral shall consist of U.S. Treasury or U.S. Government Agency obligations.
PROPERTY TAX
Property taxes for the current year were committed on July 1, 2019 on the assessed value listed as of the previous April 1 for all real and personal property located in the City. All real and personal property taxes were due in two installments, 50% on September 10, 2019, and 50% on March 10, 2020. Interest at the rate of 9% per annum was charged on any amounts remaining unpaid after these respective due dates. Assessed values are periodically established by the City’s Assessor at 100% of estimated market value. The assessed value of $761,763,273 was 100% of the estimated market value and 99.92% of the 2020 state valuation of $762,350,000.
The City is permitted by the laws of the State of Maine to levy taxes up to 105% of its net budgeted expenditures for the related fiscal period. The amount raised in excess of 100% is referred to as overlay, and amounted to $207,336 for the year ended June 30, 2020.
Tax liens are placed on real property within twelve months following the tax commitment date if taxes are delinquent. The City has the authority to foreclose on property eighteen months after the filing of the lien if the tax liens and associated costs remain unpaid. Property taxes levied during the year were recorded as receivables at the time the levy was made.
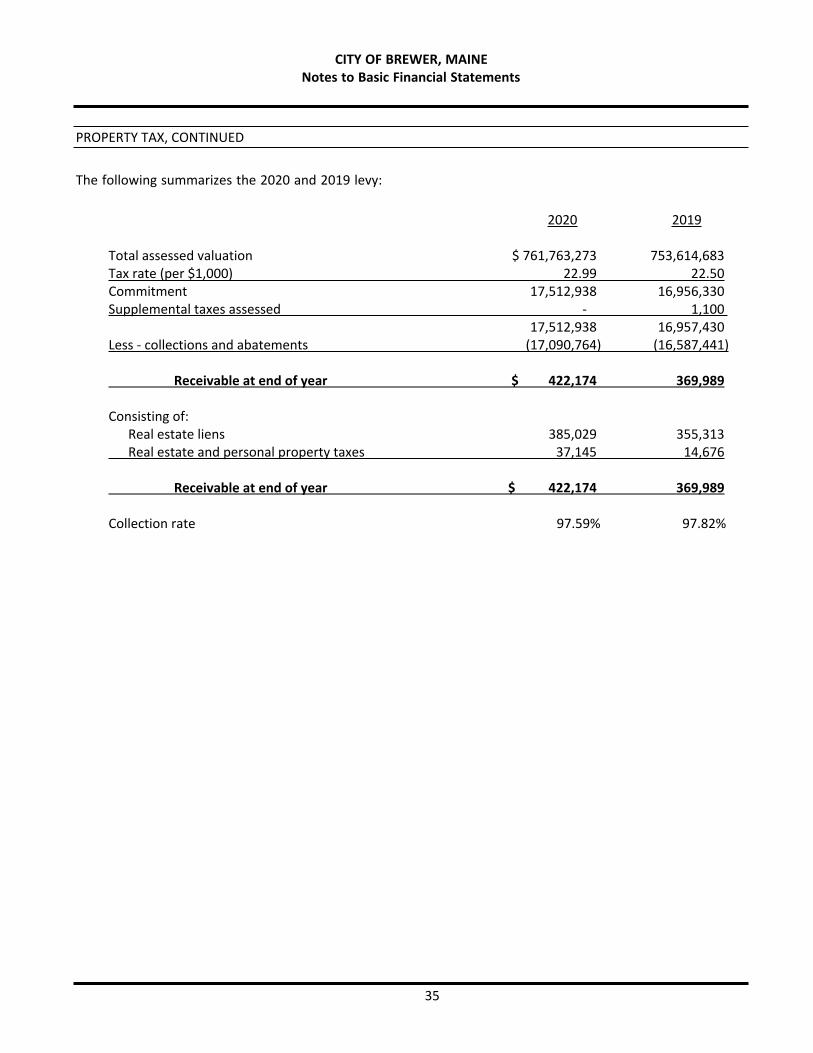
CITY OF BREWER, MAINENotes to Basic Financial Statements
35
PROPERTY TAX, CONTINUED
The following summarizes the 2020 and 2019 levy:
2020 2019
Total assessed valuation $ 761,763,273 753,614,683Tax rate (per $1,000) 22.99 22.50Commitment 17,512,938 16,956,330Supplemental taxes assessed - 1,100
17,512,938 16,957,430Less - collections and abatements (17,090,764) (16,587,441)
Receivable at end of year $ 422,174 369,989
Consisting of:Real estate liens 385,029 355,313Real estate and personal property taxes 37,145 14,676
Receivable at end of year $ 422,174 369,989
Collection rate 97.59% 97.82%
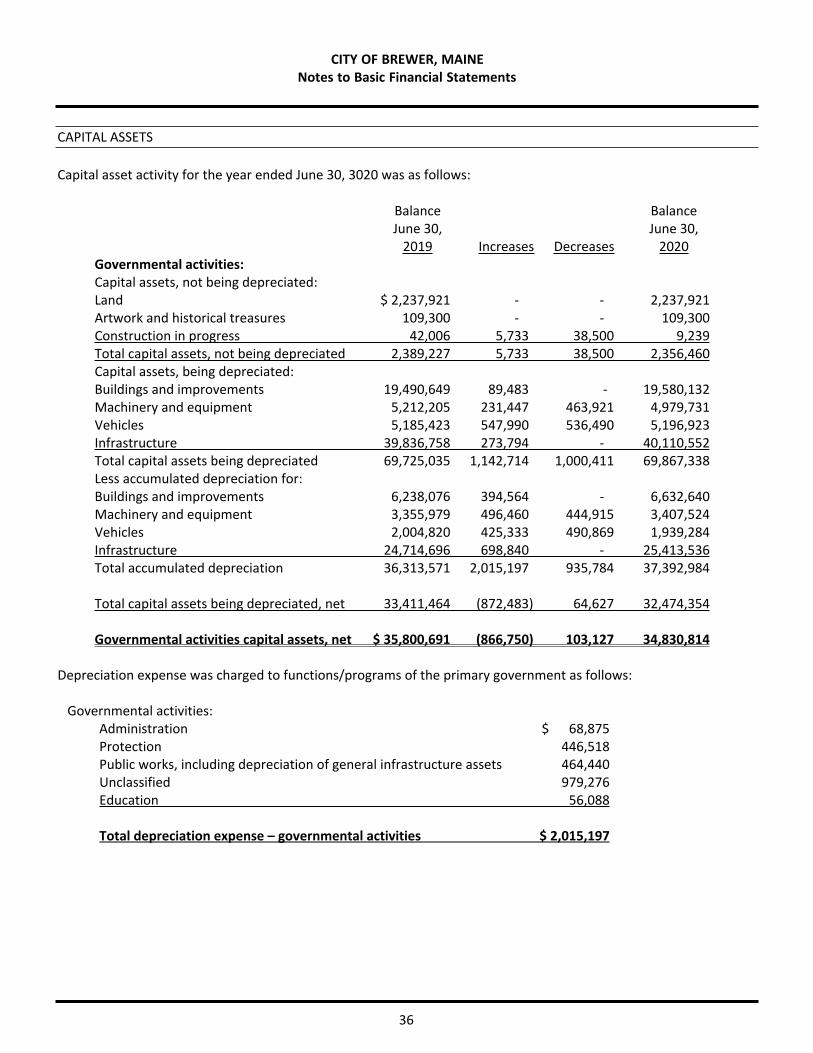
36
CITY OF BREWER, MAINENotes to Basic Financial Statements
CAPITAL ASSETS
Capital asset activity for the year ended June 30, 3020 was as follows:
Balance BalanceJune 30, June 30,
2019 Increases Decreases 2020Governmental activities:Capital assets, not being depreciated:Land $ 2,237,921 - - 2,237,921Artwork and historical treasures 109,300 - - 109,300Construction in progress 42,006 5,733 38,500 9,239Total capital assets, not being depreciated 2,389,227 5,733 38,500 2,356,460Capital assets, being depreciated:Buildings and improvements 19,490,649 89,483 - 19,580,132Machinery and equipment 5,212,205 231,447 463,921 4,979,731Vehicles 5,185,423 547,990 536,490 5,196,923Infrastructure 39,836,758 273,794 - 40,110,552Total capital assets being depreciated 69,725,035 1,142,714 1,000,411 69,867,338Less accumulated depreciation for:Buildings and improvements 6,238,076 394,564 - 6,632,640Machinery and equipment 3,355,979 496,460 444,915 3,407,524Vehicles 2,004,820 425,333 490,869 1,939,284Infrastructure 24,714,696 698,840 - 25,413,536Total accumulated depreciation 36,313,571 2,015,197 935,784 37,392,984
Total capital assets being depreciated, net 33,411,464 (872,483) 64,627 32,474,354
Governmental activities capital assets, net $ 35,800,691 (866,750) 103,127 34,830,814
Depreciation expense was charged to functions/programs of the primary government as follows:
Governmental activities:Administration $ 68,875Protection 446,518Public works, including depreciation of general infrastructure assets 464,440Unclassified 979,276Education 56,088
Total depreciation expense – governmental activities $ 2,015,197
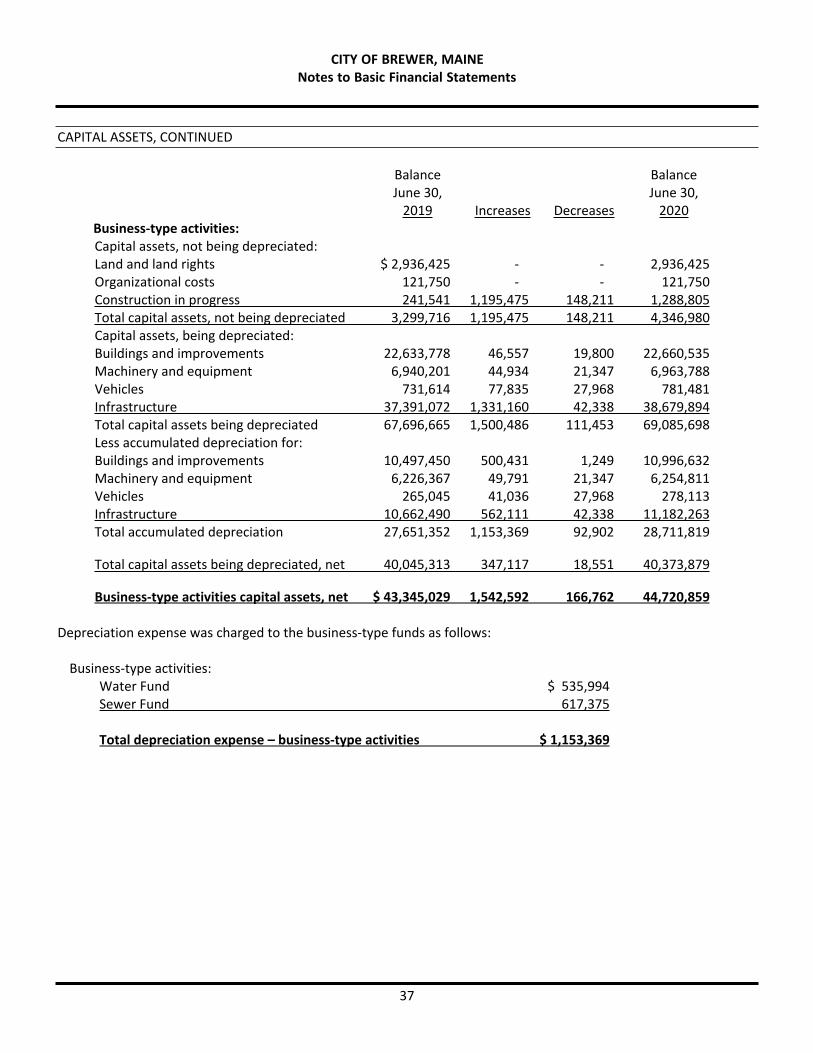
CITY OF BREWER, MAINENotes to Basic Financial Statements
37
CAPITAL ASSETS, CONTINUED
Balance BalanceJune 30, June 30,
2019 Increases Decreases 2020Business-type activities:Capital assets, not being depreciated:Land and land rights $ 2,936,425 - - 2,936,425Organizational costs 121,750 - - 121,750Construction in progress 241,541 1,195,475 148,211 1,288,805Total capital assets, not being depreciated 3,299,716 1,195,475 148,211 4,346,980Capital assets, being depreciated:Buildings and improvements 22,633,778 46,557 19,800 22,660,535Machinery and equipment 6,940,201 44,934 21,347 6,963,788Vehicles 731,614 77,835 27,968 781,481Infrastructure 37,391,072 1,331,160 42,338 38,679,894Total capital assets being depreciated 67,696,665 1,500,486 111,453 69,085,698Less accumulated depreciation for:Buildings and improvements 10,497,450 500,431 1,249 10,996,632Machinery and equipment 6,226,367 49,791 21,347 6,254,811Vehicles 265,045 41,036 27,968 278,113Infrastructure 10,662,490 562,111 42,338 11,182,263Total accumulated depreciation 27,651,352 1,153,369 92,902 28,711,819
Total capital assets being depreciated, net 40,045,313 347,117 18,551 40,373,879
Business-type activities capital assets, net $ 43,345,029 1,542,592 166,762 44,720,859
Depreciation expense was charged to the business-type funds as follows:
Business-type activities:Water Fund $ 535,994 Sewer Fund 617,375
Total depreciation expense – business-type activities $ 1,153,369
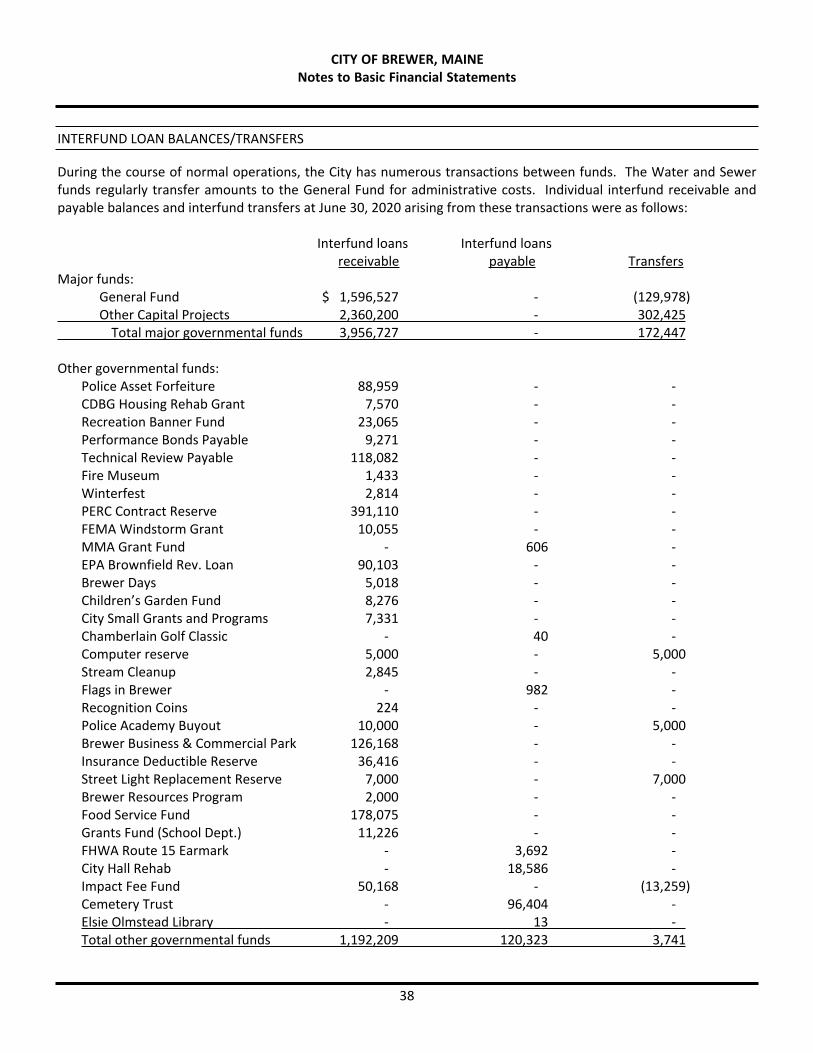
CITY OF BREWER, MAINENotes to Basic Financial Statements
38
INTERFUND LOAN BALANCES/TRANSFERS
During the course of normal operations, the City has numerous transactions between funds. The Water and Sewer funds regularly transfer amounts to the General Fund for administrative costs. Individual interfund receivable and payable balances and interfund transfers at June 30, 2020 arising from these transactions were as follows:
Interfund loans Interfund loansreceivable payable Transfers
Major funds:General Fund $ 1,596,527 - (129,978)Other Capital Projects 2,360,200 - 302,425
Total major governmental funds 3,956,727 - 172,447
Other governmental funds:Police Asset Forfeiture 88,959 - - CDBG Housing Rehab Grant 7,570 - - Recreation Banner Fund 23,065 - - Performance Bonds Payable 9,271 - - Technical Review Payable 118,082 - - Fire Museum 1,433 - - Winterfest 2,814 - - PERC Contract Reserve 391,110 - - FEMA Windstorm Grant 10,055 - - MMA Grant Fund - 606 - EPA Brownfield Rev. Loan 90,103 - - Brewer Days 5,018 - - Children’s Garden Fund 8,276 - - City Small Grants and Programs 7,331 - - Chamberlain Golf Classic - 40 - Computer reserve 5,000 - 5,000Stream Cleanup 2,845 - - Flags in Brewer - 982 - Recognition Coins 224 - - Police Academy Buyout 10,000 - 5,000Brewer Business & Commercial Park 126,168 - - Insurance Deductible Reserve 36,416 - - Street Light Replacement Reserve 7,000 - 7,000Brewer Resources Program 2,000 - - Food Service Fund 178,075 - - Grants Fund (School Dept.) 11,226 - - FHWA Route 15 Earmark - 3,692 - City Hall Rehab - 18,586 - Impact Fee Fund 50,168 - (13,259)Cemetery Trust - 96,404 - Elsie Olmstead Library - 13 - Total other governmental funds 1,192,209 120,323 3,741
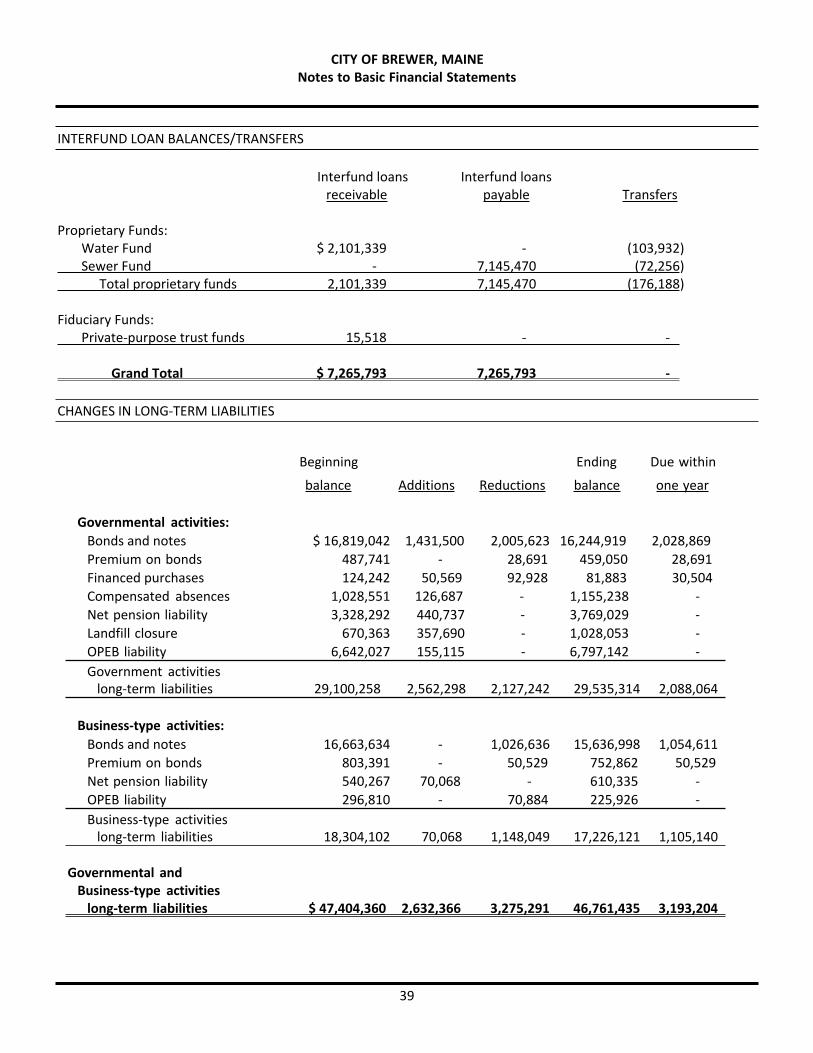
CITY OF BREWER, MAINENotes to Basic Financial Statements
39
INTERFUND LOAN BALANCES/TRANSFERS
Interfund loans Interfund loansreceivable payable Transfers
Proprietary Funds:Water Fund $ 2,101,339 - (103,932)Sewer Fund - 7,145,470 (72,256)
Total proprietary funds 2,101,339 7,145,470 (176,188)
Fiduciary Funds:Private-purpose trust funds 15,518 - -
Grand Total $ 7,265,793 7,265,793 -
CHANGES IN LONG-TERM LIABILITIES
Beginning Ending Due within
balance Additions Reductions balance one year
Governmental activities:Bonds and notes $ 16,819,042 1,431,500 2,005,623 16,244,919 2,028,869Premium on bonds 487,741 - 28,691 459,050 28,691Financed purchases 124,242 50,569 92,928 81,883 30,504Compensated absences 1,028,551 126,687 - 1,155,238 -Net pension liability 3,328,292 440,737 - 3,769,029 -Landfill closure 670,363 357,690 - 1,028,053 -OPEB liability 6,642,027 155,115 -
163,489 6,797,142 -
Government activitieslong-term liabilities 29,100,258 2,562,298 2,127,242 29,535,314 2,088,064
Business-type activities:Bonds and notes 16,663,634 - 1,026,636 15,636,998 1,054,611Premium on bonds 803,391 -
--
50,529 752,862 50,529Net pension liability 540,267 70,068 - 610,335 -OPEB liability 296,810 - 70,884 225,926 -Business-type activities
long-term liabilities 18,304,102 70,068 1,148,049 17,226,121 1,105,140
Governmental and Business-type activities
long-term liabilities $ 47,404,360 2,632,366 3,275,291 46,761,435 3,193,204
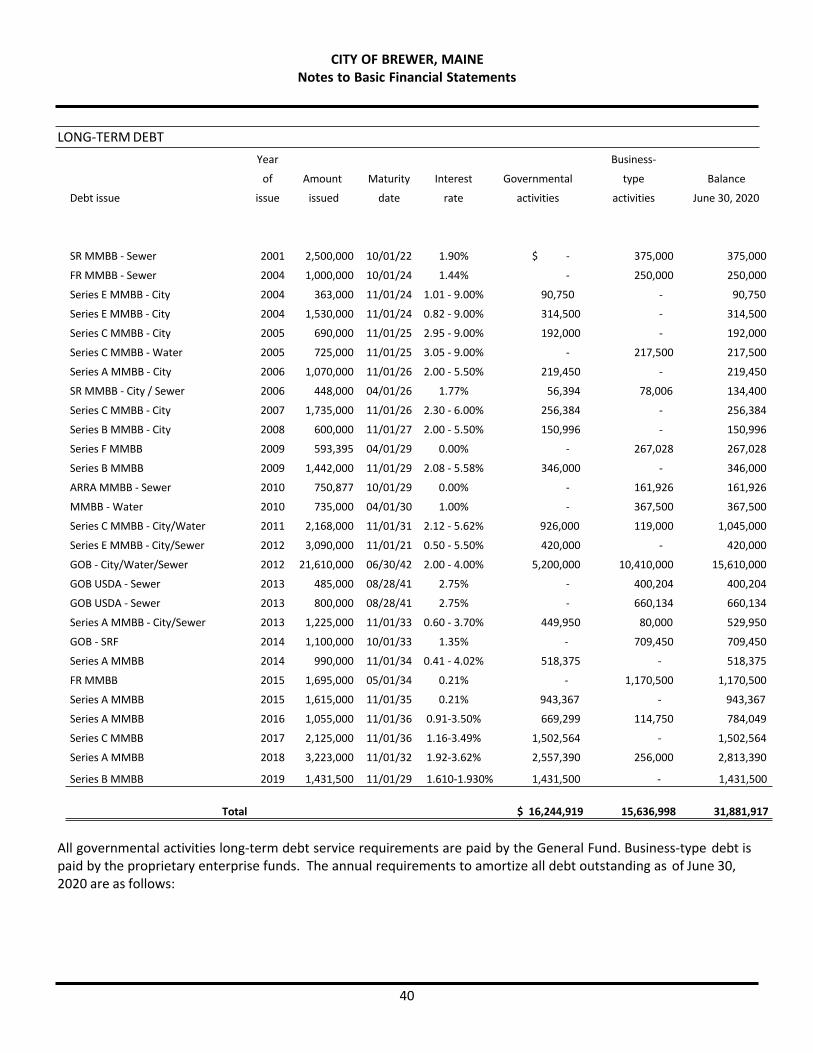
CITY OF BREWER, MAINENotes to Basic Financial Statements
40
LONG-TERM DEBTYear
of
Debt issue issue
Amount
issued
Maturity
date
Interest
rate
Governmental
activities
Business-
type
activities
Balance
June 30, 2020
SR MMBB - Sewer 2001 2,500,000 10/01/22 1.90% $ - 375,000 375,000
FR MMBB - Sewer 2004 1,000,000 10/01/24 1.44% - 250,000 250,000
Series E MMBB - City 2004 363,000 11/01/24 1.01 - 9.00% 90,750 - 90,750
Series E MMBB - City 2004 1,530,000 11/01/24 0.82 - 9.00% 314,500 - 314,500
Series C MMBB - City 2005 690,000 11/01/25 2.95 - 9.00% 192,000 - 192,000
Series C MMBB - Water 2005 725,000 11/01/25 3.05 - 9.00% - 217,500 217,500
Series A MMBB - City 2006 1,070,000 11/01/26 2.00 - 5.50% 219,450 - 219,450
SR MMBB - City / Sewer 2006 448,000 04/01/26 1.77% 56,394 78,006 134,400
Series C MMBB - City 2007 1,735,000 11/01/26 2.30 - 6.00% 256,384 - 256,384
Series B MMBB - City 2008 600,000 11/01/27 2.00 - 5.50% 150,996 - 150,996
Series F MMBB 2009 593,395 04/01/29 0.00% - 267,028 267,028
Series B MMBB 2009 1,442,000 11/01/29 2.08 - 5.58% 346,000 - 346,000
ARRA MMBB - Sewer 2010 750,877 10/01/29 0.00% - 161,926 161,926
MMBB - Water 2010 735,000 04/01/30 1.00% - 367,500 367,500
Series C MMBB - City/Water 2011 2,168,000 11/01/31 2.12 - 5.62% 926,000 119,000 1,045,000
Series E MMBB - City/Sewer 2012 3,090,000 11/01/21 0.50 - 5.50% 420,000 - 420,000
GOB - City/Water/Sewer 2012 21,610,000 06/30/42 2.00 - 4.00% 5,200,000 10,410,000 15,610,000
GOB USDA - Sewer 2013 485,000 08/28/41 2.75% - 400,204 400,204
GOB USDA - Sewer 2013 800,000 08/28/41 2.75% - 660,134 660,134
Series A MMBB - City/Sewer 2013 1,225,000 11/01/33 0.60 - 3.70% 449,950 80,000 529,950
GOB - SRF 2014 1,100,000 10/01/33 1.35% - 709,450 709,450
Series A MMBB 2014 990,000 11/01/34 0.41 - 4.02% 518,375 - 518,375
FR MMBB 2015 1,695,000 05/01/34 0.21% - 1,170,500 1,170,500
Series A MMBB 2015 1,615,000 11/01/35 0.21% 943,367 - 943,367
Series A MMBB 2016 1,055,000 11/01/36 0.91-3.50% 669,299 114,750 784,049
Series C MMBB 2017 2,125,000 11/01/36 1.16-3.49% 1,502,564 - 1,502,564
Series A MMBB 2018 3,223,000 11/01/32 1.92-3.62% 2,557,390 256,000 2,813,390
Series B MMBB 2019 1,431,500 11/01/29 1.610-1.930% 1,431,500 - 1,431,500
Total $ 16,244,919 15,636,998 31,881,917
All governmental activities long-term debt service requirements are paid by the General Fund. Business-type debt is paid by the proprietary enterprise funds. The annual requirements to amortize all debt outstanding as of June 30, 2020 are as follows:
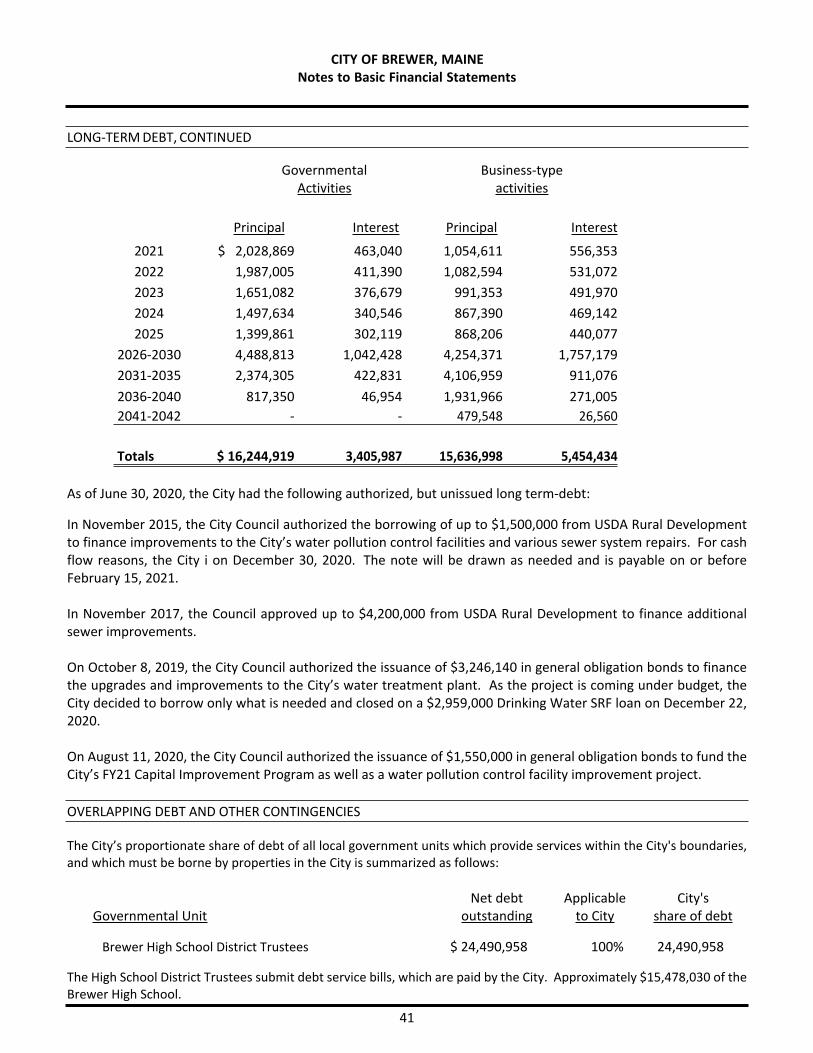
CITY OF BREWER, MAINENotes to Basic Financial Statements
41
LONG-TERM DEBT, CONTINUED
Governmental Business-typeActivities activities
Principal Interest Principal Interest
2021 $ 2,028,869 463,040 1,054,611 556,3532022 1,987,005 411,390 1,082,594 531,0722023 1,651,082 376,679 991,353 491,9702024 1,497,634 340,546 867,390 469,1422025 1,399,861 302,119 868,206 440,077
2026-2030 4,488,813 1,042,428 4,254,371 1,757,1792031-2035 2,374,305 422,831 4,106,959 911,0762036-2040 817,350 46,954 1,931,966 271,0052041-2042 - - 479,548 26,560
Totals $ 16,244,919 3,405,987 15,636,998 5,454,434
As of June 30, 2020, the City had the following authorized, but unissued long term-debt:
In November 2015, the City Council authorized the borrowing of up to $1,500,000 from USDA Rural Development to finance improvements to the City’s water pollution control facilities and various sewer system repairs. For cash flow reasons, the City i on December 30, 2020. The note will be drawn as needed and is payable on or before February 15, 2021.
In November 2017, the Council approved up to $4,200,000 from USDA Rural Development to finance additional sewer improvements.
On October 8, 2019, the City Council authorized the issuance of $3,246,140 in general obligation bonds to finance the upgrades and improvements to the City’s water treatment plant. As the project is coming under budget, the City decided to borrow only what is needed and closed on a $2,959,000 Drinking Water SRF loan on December 22, 2020.
On August 11, 2020, the City Council authorized the issuance of $1,550,000 in general obligation bonds to fund the City’s FY21 Capital Improvement Program as well as a water pollution control facility improvement project.
OVERLAPPING DEBT AND OTHER CONTINGENCIES
The City’s proportionate share of debt of all local government units which provide services within the City's boundaries, and which must be borne by properties in the City is summarized as follows:
Net debt Applicable City'sGovernmental Unit outstanding to City share of debt
Brewer High School District Trustees $ 24,490,958 100% 24,490,958
The High School District Trustees submit debt service bills, which are paid by the City. Approximately $15,478,030 of the Brewer High School.
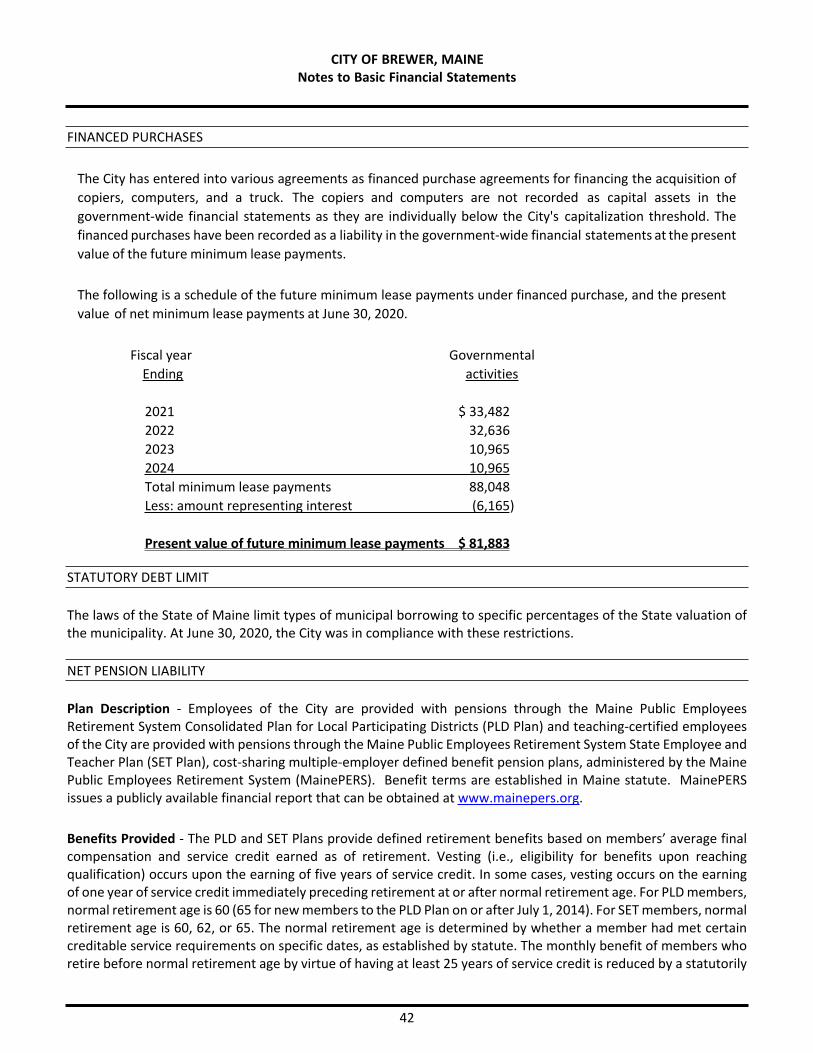
CITY OF BREWER, MAINENotes to Basic Financial Statements
42
FINANCED PURCHASES
The City has entered into various agreements as financed purchase agreements for financing the acquisition of copiers, computers, and a truck. The copiers and computers are not recorded as capital assets in the government-wide financial statements as they are individually below the City's capitalization threshold. The financed purchases have been recorded as a liability in the government-wide financial statements at the present value of the future minimum lease payments.
The following is a schedule of the future minimum lease payments under financed purchase, and the present value of net minimum lease payments at June 30, 2020.
Fiscal year GovernmentalEnding activities
2021 $ 33,4822022 32,6362023 10,9652024 10,965Total minimum lease payments 88,048Less: amount representing interest (6,165)
Present value of future minimum lease payments $ 81,883
STATUTORY DEBT LIMIT
The laws of the State of Maine limit types of municipal borrowing to specific percentages of the State valuation of the municipality. At June 30, 2020, the City was in compliance with these restrictions.
NET PENSION LIABILITY
Plan Description - Employees of the City are provided with pensions through the Maine Public Employees Retirement System Consolidated Plan for Local Participating Districts (PLD Plan) and teaching-certified employees of the City are provided with pensions through the Maine Public Employees Retirement System State Employee and Teacher Plan (SET Plan), cost-sharing multiple-employer defined benefit pension plans, administered by the Maine Public Employees Retirement System (MainePERS). Benefit terms are established in Maine statute. MainePERS issues a publicly available financial report that can be obtained at www.mainepers.org.
Benefits Provided - The PLD and SET Plans provide defined retirement benefits based on members’ average final compensation and service credit earned as of retirement. Vesting (i.e., eligibility for benefits upon reaching qualification) occurs upon the earning of five years of service credit. In some cases, vesting occurs on the earning of one year of service credit immediately preceding retirement at or after normal retirement age. For PLD members, normal retirement age is 60 (65 for new members to the PLD Plan on or after July 1, 2014). For SET members, normal retirement age is 60, 62, or 65. The normal retirement age is determined by whether a member had met certain creditable service requirements on specific dates, as established by statute. The monthly benefit of members who retire before normal retirement age by virtue of having at least 25 years of service credit is reduced by a statutorily

CITY OF BREWER, MAINENotes to Basic Financial Statements
43
NET PENSION LIABILITY, CONTINUED
prescribed factor for each year of age that a member is below her/his normal retirement age at retirement. MPERS also provides disability and death benefits, which are established by contract under applicable statutory provisions (PLD Plan) or by statute (SET Plan).
Contributions - Employee contribution rates are defined by law or Board rule and depend on the terms of the plan under which an employee is covered. Employer contributions are determined by actuarial valuations. The contractually required contribution rates are actuarially determined as an amount that, when combined with employee contributions, is expected to finance the costs of benefits earned by employees during the year, with an additional amount to finance any unfunded accrued liability.
PLD Plan - For the year ended June 30, 2020, the City was required to contribute 10% of employee’s annual pay for the regular plans AC-60 and AC-65, 10.6% for the special 2C plan, and 12.80% for the special 3C plan. The employee’s contractually required contribution rate for the regular plan was 7.35% to 8.1% of their annual pay, 8% for the 2c plan and 9.5% for the special 3C plan. Contributions to the pension plan from the City were $832,731 for the year ended June 30, 2020.
SET Plan - Maine statute requires the State to contribute a portion of the City’s contractually required contributions. Employees are required to contribute 7.65% of their annual pay. The School Unit’s contractually required contribution rate for the year ended June 30, 2020 was 18.49% of annual payroll of which 4.16% of payroll was required from the School Unit and 14.33% was required from the State. Contributions to the pension plan from the City were $432,717 for the year ended June 30, 2020.
Pension Liabilities, Pension Expense, and Deferred Outflows and Deferred Inflows of Resources Related to Pensions
The net pension liabilities were measured as of June 30, 2019, and the total pension liabilities used to calculate the net pension liabilities were determined by actuarial valuations as of that date. The City’s proportion of the net pension liabilities were based on projections of the City’s long-term share of contributions to the pension plans relative to the projected contributions of all participating local districts (PLD Plan) and of all participating School Administrative Units and the State (SET Plan), actuarially determined.
PLD Plan - At June 30, 2020, the City reported a liability of $3,458,556 for governmental activities and $610,335 for business-type activities for its proportionate share of the net pension liability. At June 30, 2019, the City’s proportion of the PLD Plan was 1.3312%.
SET Plan - At June 30, 2020, the City reported a liability for its proportionate share of the net pension liability that reflected a reduction for State pension support provided to the City. The amount recognized by the City as its proportionate share of the net pension liability, the related State support, and the total portion of the net pension liability that was associated with the City were as follows:
City’s proportionate share of the net pension liability $ 310,473 State’s proportionate share of the net pension liability
associated with the City 11,152,874
Total $ 11,463,347
At June 30, 2019, the City’s proportion of the SET Plan was 0.0212%.

CITY OF BREWER, MAINENotes to Basic Financial Statements
44
NET PENSION LIABILITY, CONTINUED
For the year ended June 30, 2020, the City recognized pension expense of $1,051,226 for governmental activities and $185,541 for business-type activities for the PLD Plan and also recognized a pension expense of $1,966,762 and revenue of $1,490,055 for support provided by the State for the SET Plan. At June 30, 2020, the City reported deferred outflows of resources and deferred inflows of resources related to pensions from the following sources:
Governmental Activities Business-type Activities
Deferred Deferred Deferred Deferred Outflows Inflows Outflows Inflows
of Resources of Resources of Resources of Resources
Differences between expected and actual experience $ 433,654 - 72,267 - Changes of assumptions 184,142 - 30,909 - Net difference between projected and actual earnings on pension plan investments - 910,108 - 152,874Changes in proportion and differences between City contributions and proportionate share of contributions 122,346 - 15,426 - City contributions subsequent to the measurement date 1,140,538 - 124,910 -
Total $ 1,880,680 910,108 243,512 152,874
An amount of $1,140,538 for governmental activities and $124,910 for business-type activities is reported as deferred outflows of resources related to pensions resulting from City contributions subsequent to the measurement date and will be recognized as a reduction of the net pension liabilities in the year ended June 30, 2021. Other amounts reported as deferred outflows of resources related to pensions will be recognized in pension expense as follows:
Governmental Business-typeYear Ending June 30, Activities Activities
2021 263,090$ 38,9022022 (373,446) (64,369)2034 (59,193) (8,708)2024 (417) (97)
Actuarial Assumptions - The total pension liability in the June 30, 2019 actuarial valuation was determined using the following actuarial assumptions, applied to all periods included in the measurement:
PLD Plan SET PlanInflation 2.75% 2.75%Salary Increases, per year 2.75% to 9.0% 2.75% to 14.50%Investment return, per annum, compounded annually 6.75% 6.75%Cost of living benefit increases, per annum 1.91% 2.20%

CITY OF BREWER, MAINENotes to Basic Financial Statements
45
NET PENSION LIABILITY, CONTINUED
Mortality rates were based on the RP2014 Total Dataset Healthy Annuitant Mortality Table, for males and females.
The actuarial assumptions used in the June 30, 2019 valuation were based on the results of an actuarial experience study for the period June 30, 2012 to June 30, 2015.
The long-term expected rate of return on pension plan investments was determined using a building-block method in which best-estimate ranges of expected future real rates of return (expected returns, net of pension plan investment expense and inflation) are developed for each major asset class. These ranges are combined to produce the long-term expected rate of return by weighting the expected future real rates of return by the target asset allocation percentage and by adding expected inflation. Best estimates of arithmetic real rates of return for each major asset class included in the pension plan’s target asset allocation as of June 30, 2019 are summarized in the following table:
Long-term ExpectedAsset Class Target Allocation Real Rate of Return
Public equities 30.0% 6.0%US Government 7.5% 2.3%Private equity 15.0% 7.6%Real estate 10.0% 5.2%Infrastructure 10.0% 5.3%Natural resources 5.0% 5.0%Traditional credit 7.5% 3.0%Alternative credit 5.0% 4.2%Diversifiers 10.0% 5.9%
Discount Rate - The discount rate used to measure the total pension liability was 6.75% for the PLD Plan and the SET Plan. The projection of cash flows used to determine the discount rates assumed that employee contributions will be made at the current contribution rate and that contributions from participating local districts will be made at contractually required rates, actuarially determined. Based on these assumptions, the pension plans’ fiduciary net position was projected to be available to make all projected future benefit payments of current active and inactive employees. Therefore, the long-term expected rate of return on pension plan investments was applied to all periods of projected benefit payments to determine the total pension liabilities.
Sensitivity of the City’s Proportionate Share of the Net Pension Liabilities to Changes in the Discount Rate - The following presents the City’s proportionate share of the net pension liability calculated using the discount rate of 6.75% for the PLD Plan and the SET Plan, as well as what the City’s proportionate share of the net pension liability would be if it were calculated using a discount rate that is 1-percentage-point lower (5.75% for PLD Plan and for the SET Plan) or 1 percentage-point higher (7.75% for PLD Plan and for SET Plan) than the current rate:
PLD Plan 1% Current 1%Decrease Discount Rate Increase(5.75%) (6.75%) (7.75%)
City’s proportionate share of the net pension liability $ 9,268,667 4,068,891 (795,006)
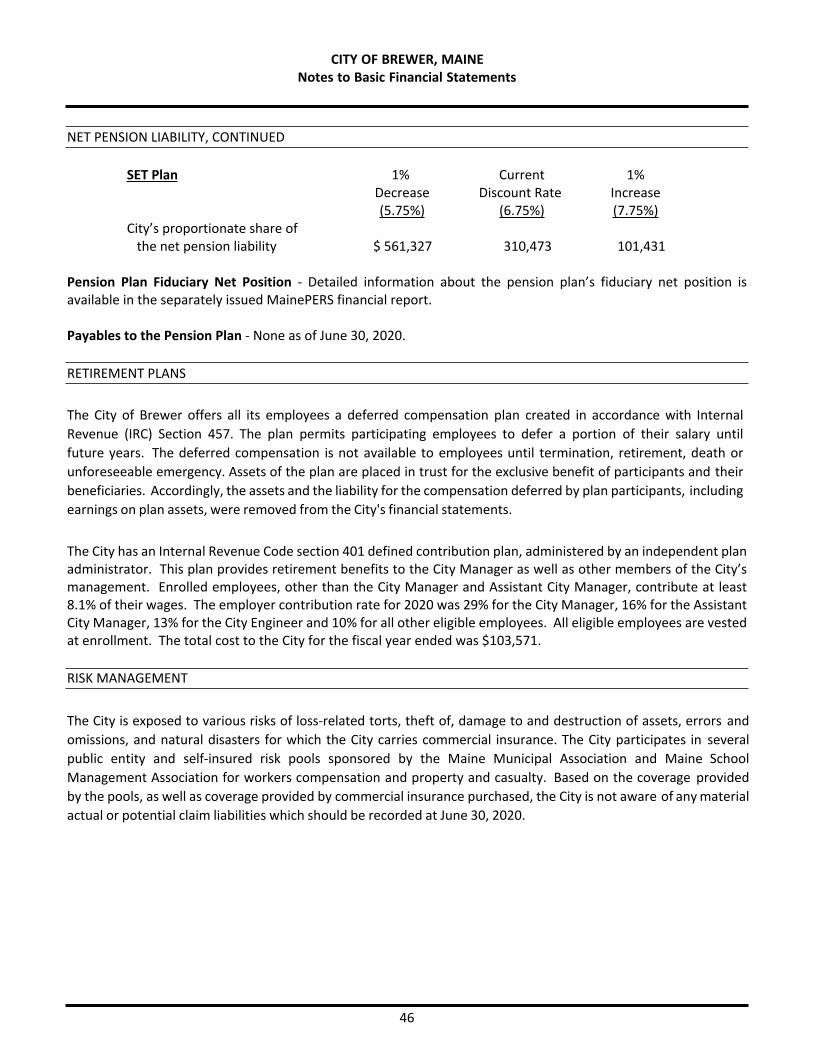
CITY OF BREWER, MAINENotes to Basic Financial Statements
46
NET PENSION LIABILITY, CONTINUED
SET Plan 1% Current 1%Decrease Discount Rate Increase(5.75%) (6.75%) (7.75%)
City’s proportionate share of the net pension liability $ 561,327 310,473 101,431
Pension Plan Fiduciary Net Position - Detailed information about the pension plan’s fiduciary net position is available in the separately issued MainePERS financial report.
Payables to the Pension Plan - None as of June 30, 2020.
RETIREMENT PLANS
The City of Brewer offers all its employees a deferred compensation plan created in accordance with Internal Revenue (IRC) Section 457. The plan permits participating employees to defer a portion of their salary until future years. The deferred compensation is not available to employees until termination, retirement, death or unforeseeable emergency. Assets of the plan are placed in trust for the exclusive benefit of participants and their beneficiaries. Accordingly, the assets and the liability for the compensation deferred by plan participants, including earnings on plan assets, were removed from the City's financial statements.
The City has an Internal Revenue Code section 401 defined contribution plan, administered by an independent plan administrator. This plan provides retirement benefits to the City Manager as well as other members of the City’s management. Enrolled employees, other than the City Manager and Assistant City Manager, contribute at least 8.1% of their wages. The employer contribution rate for 2020 was 29% for the City Manager, 16% for the Assistant City Manager, 13% for the City Engineer and 10% for all other eligible employees. All eligible employees are vested at enrollment. The total cost to the City for the fiscal year ended was $103,571.
RISK MANAGEMENT
The City is exposed to various risks of loss-related torts, theft of, damage to and destruction of assets, errors and omissions, and natural disasters for which the City carries commercial insurance. The City participates in several public entity and self-insured risk pools sponsored by the Maine Municipal Association and Maine School Management Association for workers compensation and property and casualty. Based on the coverage provided by the pools, as well as coverage provided by commercial insurance purchased, the City is not aware of any material actual or potential claim liabilities which should be recorded at June 30, 2020.
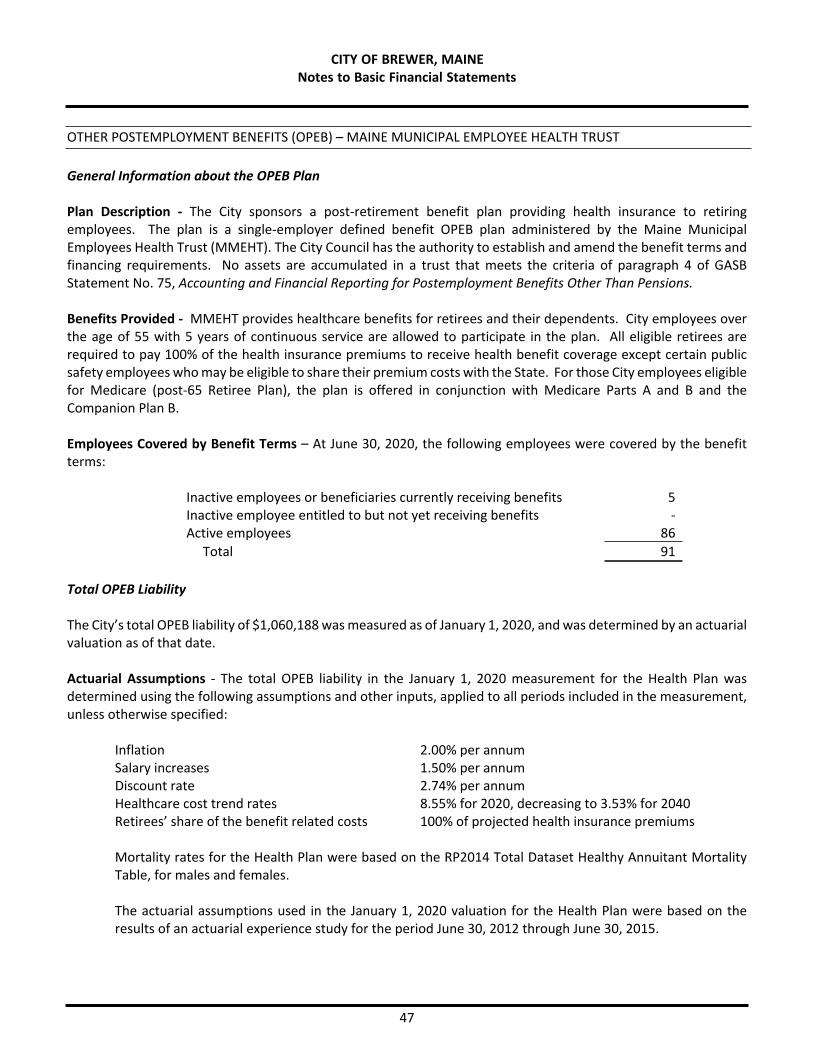
CITY OF BREWER, MAINENotes to Basic Financial Statements
47
OTHER POSTEMPLOYMENT BENEFITS (OPEB) – MAINE MUNICIPAL EMPLOYEE HEALTH TRUST
General Information about the OPEB Plan
Plan Description - The City sponsors a post-retirement benefit plan providing health insurance to retiring employees. The plan is a single-employer defined benefit OPEB plan administered by the Maine Municipal Employees Health Trust (MMEHT). The City Council has the authority to establish and amend the benefit terms and financing requirements. No assets are accumulated in a trust that meets the criteria of paragraph 4 of GASB Statement No. 75, Accounting and Financial Reporting for Postemployment Benefits Other Than Pensions.
Benefits Provided - MMEHT provides healthcare benefits for retirees and their dependents. City employees over the age of 55 with 5 years of continuous service are allowed to participate in the plan. All eligible retirees are required to pay 100% of the health insurance premiums to receive health benefit coverage except certain public safety employees who may be eligible to share their premium costs with the State. For those City employees eligible for Medicare (post-65 Retiree Plan), the plan is offered in conjunction with Medicare Parts A and B and the Companion Plan B.
Employees Covered by Benefit Terms – At June 30, 2020, the following employees were covered by the benefit terms:
Inactive employees or beneficiaries currently receiving benefits 5Inactive employee entitled to but not yet receiving benefits -Active employees 86 Total 91
Total OPEB Liability
The City’s total OPEB liability of $1,060,188 was measured as of January 1, 2020, and was determined by an actuarial valuation as of that date.
Actuarial Assumptions - The total OPEB liability in the January 1, 2020 measurement for the Health Plan was determined using the following assumptions and other inputs, applied to all periods included in the measurement, unless otherwise specified:
Inflation 2.00% per annumSalary increases 1.50% per annumDiscount rate 2.74% per annumHealthcare cost trend rates 8.55% for 2020, decreasing to 3.53% for 2040Retirees’ share of the benefit related costs 100% of projected health insurance premiums
Mortality rates for the Health Plan were based on the RP2014 Total Dataset Healthy Annuitant Mortality Table, for males and females.
The actuarial assumptions used in the January 1, 2020 valuation for the Health Plan were based on the results of an actuarial experience study for the period June 30, 2012 through June 30, 2015.

CITY OF BREWER, MAINENotes to Basic Financial Statements
48
OTHER POSTEMPLOYMENT BENEFITS (OPEB) – MAINE MUNICIPAL EMPLOYEE HEALTH TRUST, CONTINUED
Changes in the Total OPEB Liability
Total OPEB Liability
Balance at June 30, 2019 $ 1,356,532Changes for the year: Service cost 42,058 Interest 56,737 Changed in benefit terms
Difference between expected and actual(21,392)
(548,452) Changes in assumptions or other inputs 204,503 Benefit payments (29,798) Net changes (296,344)Balance at June 30, 2020 $ 1,060,188
At June 30, 2020, the City reported a liability of $834,262 for governmental activities and $225,926 for business-type activities for its proportionate share of the OPEB liability.
Change in assumptions reflects a change in the discount rate from 4.10% to 2.74%.
Sensitivity of the Total OPEB Liability to Changes in the Discount Rate – The following presents the City’s total OPEB liability calculated using the discount rate of 2.74%, as well as what the City’s total OPEB liability would be if it were calculated using a discount rate that is 1 percentage-point lower (1.74%) or 1 percentage-point higher (3.74%) than the current rate:
1% Decrease(1.74%)
Discount Rate(2.74%)
1% Increase(3.74%)
Total OPEB liability $ 1,233,195 1,060,188 918,847
Sensitivity of the Total Health Plan OPEB Liability to Changes in the Healthcare Cost Trend Rates - The following presents the Town’s total OPEB liability related to the Health Plan calculated using the healthcare cost trend rates, as well as what the Town’s total OPEB liability would be if it were calculated using healthcare cost trend rates that are 1 percentage-point lower or 1 percentage-point higher than the current healthcare cost trend rates:
1% DecreaseHealthcare Cost
Trend Rates 1% IncreaseTotal OPEB liability $ 911,935 1,060,188 1,245,138
OPEB Expense and Deferred Outflows of Resources and Deferred Inflows of Resources Related to OPEB
For the year ended June 30, 2020, the City recognized OPEB expense of $4,423. At June 30, 2020, the City reported deferred outflows of resources and deferred inflows of resources related to OPEB from the following sources:
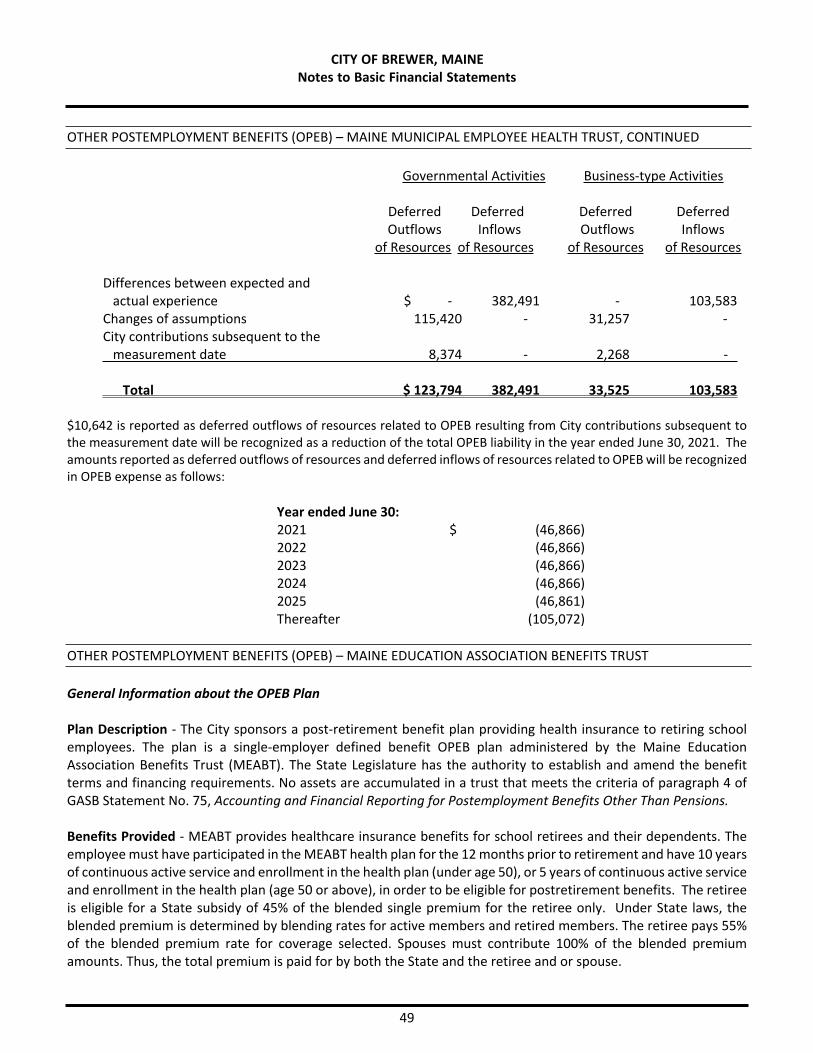
CITY OF BREWER, MAINENotes to Basic Financial Statements
49
OTHER POSTEMPLOYMENT BENEFITS (OPEB) – MAINE MUNICIPAL EMPLOYEE HEALTH TRUST, CONTINUED
Governmental Activities Business-type Activities
Deferred Deferred Deferred Deferred Outflows Inflows Outflows Inflows
of Resources of Resources of Resources of Resources
Differences between expected and actual experience $ - 382,491 - 103,583Changes of assumptions 115,420 - 31,257 - City contributions subsequent to the measurement date 8,374 - 2,268 -
Total $ 123,794 382,491 33,525 103,583
$10,642 is reported as deferred outflows of resources related to OPEB resulting from City contributions subsequent to the measurement date will be recognized as a reduction of the total OPEB liability in the year ended June 30, 2021. The amounts reported as deferred outflows of resources and deferred inflows of resources related to OPEB will be recognized in OPEB expense as follows:
Year ended June 30:2021 $ (46,866)2022 (46,866)2023 (46,866)2024 (46,866)2025 (46,861)Thereafter (105,072)
OTHER POSTEMPLOYMENT BENEFITS (OPEB) – MAINE EDUCATION ASSOCIATION BENEFITS TRUST
General Information about the OPEB Plan
Plan Description - The City sponsors a post-retirement benefit plan providing health insurance to retiring school employees. The plan is a single-employer defined benefit OPEB plan administered by the Maine Education Association Benefits Trust (MEABT). The State Legislature has the authority to establish and amend the benefit terms and financing requirements. No assets are accumulated in a trust that meets the criteria of paragraph 4 of GASB Statement No. 75, Accounting and Financial Reporting for Postemployment Benefits Other Than Pensions.
Benefits Provided - MEABT provides healthcare insurance benefits for school retirees and their dependents. The employee must have participated in the MEABT health plan for the 12 months prior to retirement and have 10 years of continuous active service and enrollment in the health plan (under age 50), or 5 years of continuous active service and enrollment in the health plan (age 50 or above), in order to be eligible for postretirement benefits. The retiree is eligible for a State subsidy of 45% of the blended single premium for the retiree only. Under State laws, the blended premium is determined by blending rates for active members and retired members. The retiree pays 55% of the blended premium rate for coverage selected. Spouses must contribute 100% of the blended premium amounts. Thus, the total premium is paid for by both the State and the retiree and or spouse.
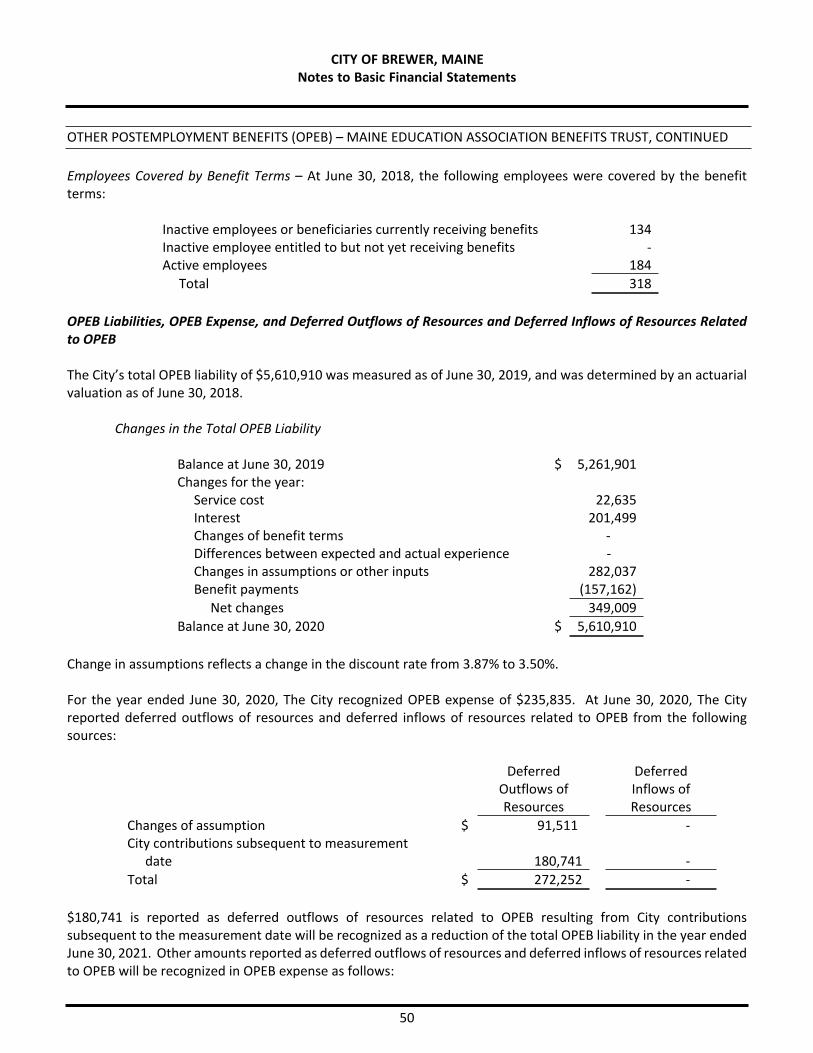
CITY OF BREWER, MAINENotes to Basic Financial Statements
50
OTHER POSTEMPLOYMENT BENEFITS (OPEB) – MAINE EDUCATION ASSOCIATION BENEFITS TRUST, CONTINUED
Employees Covered by Benefit Terms – At June 30, 2018, the following employees were covered by the benefit terms:
Inactive employees or beneficiaries currently receiving benefits 134Inactive employee entitled to but not yet receiving benefits -Active employees 184 Total 318
OPEB Liabilities, OPEB Expense, and Deferred Outflows of Resources and Deferred Inflows of Resources Related to OPEB
The City’s total OPEB liability of $5,610,910 was measured as of June 30, 2019, and was determined by an actuarial valuation as of June 30, 2018.
Changes in the Total OPEB Liability
Balance at June 30, 2019 $ 5,261,901Changes for the year: Service cost 22,635 Interest 201,499 Changes of benefit terms - Differences between expected and actual experience - Changes in assumptions or other inputs 282,037 Benefit payments (157,162) Net changes 349,009Balance at June 30, 2020 $ 5,610,910
Change in assumptions reflects a change in the discount rate from 3.87% to 3.50%.
For the year ended June 30, 2020, The City recognized OPEB expense of $235,835. At June 30, 2020, The City reported deferred outflows of resources and deferred inflows of resources related to OPEB from the following sources:
Deferred Outflows of Resources
Deferred Inflows of Resources
Changes of assumption $ 91,511 -City contributions subsequent to measurement
date 180,741 - Total $ 272,252 -
$180,741 is reported as deferred outflows of resources related to OPEB resulting from City contributions subsequent to the measurement date will be recognized as a reduction of the total OPEB liability in the year ended June 30, 2021. Other amounts reported as deferred outflows of resources and deferred inflows of resources related to OPEB will be recognized in OPEB expense as follows:
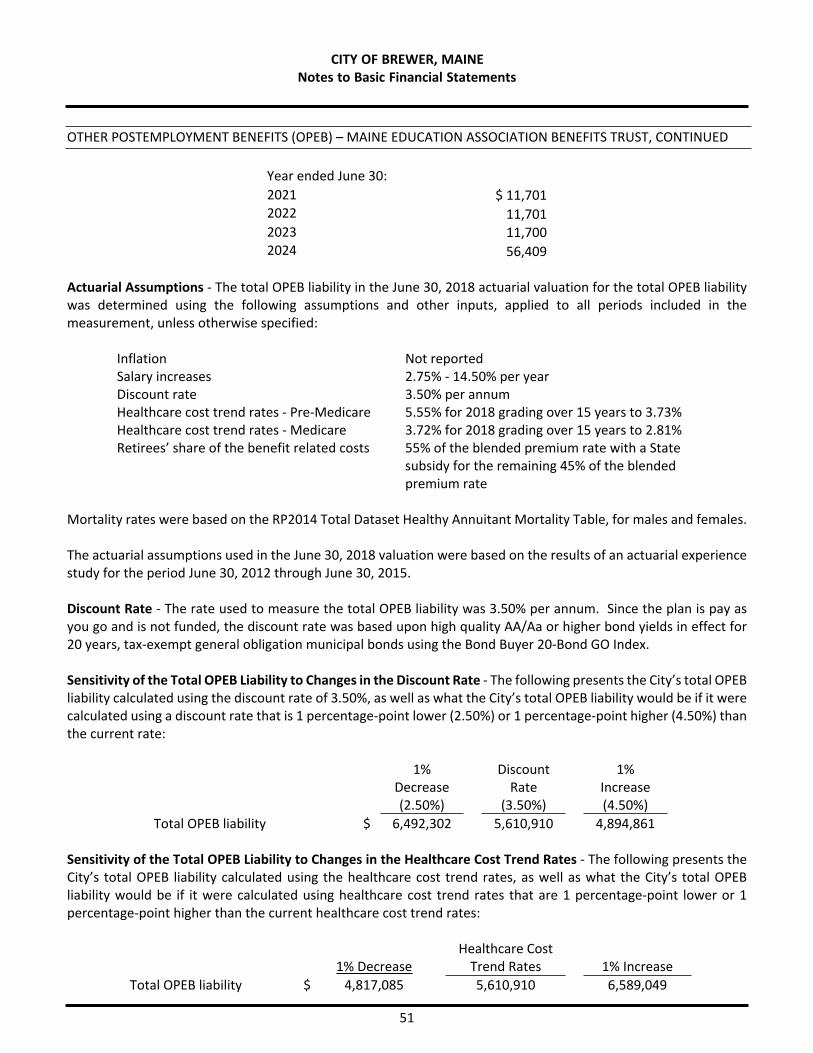
CITY OF BREWER, MAINENotes to Basic Financial Statements
51
OTHER POSTEMPLOYMENT BENEFITS (OPEB) – MAINE EDUCATION ASSOCIATION BENEFITS TRUST, CONTINUED
Year ended June 30:2021 $ 11,7012022 11,7012023 11,7002024 56,409
Actuarial Assumptions - The total OPEB liability in the June 30, 2018 actuarial valuation for the total OPEB liability was determined using the following assumptions and other inputs, applied to all periods included in the measurement, unless otherwise specified:
Inflation Not reportedSalary increases 2.75% - 14.50% per yearDiscount rate 3.50% per annumHealthcare cost trend rates - Pre-MedicareHealthcare cost trend rates - Medicare
5.55% for 2018 grading over 15 years to 3.73%3.72% for 2018 grading over 15 years to 2.81%
Retirees’ share of the benefit related costs 55% of the blended premium rate with a State subsidy for the remaining 45% of the blended premium rate
Mortality rates were based on the RP2014 Total Dataset Healthy Annuitant Mortality Table, for males and females.
The actuarial assumptions used in the June 30, 2018 valuation were based on the results of an actuarial experience study for the period June 30, 2012 through June 30, 2015.
Discount Rate - The rate used to measure the total OPEB liability was 3.50% per annum. Since the plan is pay as you go and is not funded, the discount rate was based upon high quality AA/Aa or higher bond yields in effect for 20 years, tax-exempt general obligation municipal bonds using the Bond Buyer 20-Bond GO Index.
Sensitivity of the Total OPEB Liability to Changes in the Discount Rate - The following presents the City’s total OPEB liability calculated using the discount rate of 3.50%, as well as what the City’s total OPEB liability would be if it were calculated using a discount rate that is 1 percentage-point lower (2.50%) or 1 percentage-point higher (4.50%) than the current rate:
1% Decrease(2.50%)
Discount Rate
(3.50%)
1% Increase(4.50%)
Total OPEB liability $ 6,492,302 5,610,910 4,894,861
Sensitivity of the Total OPEB Liability to Changes in the Healthcare Cost Trend Rates - The following presents the City’s total OPEB liability calculated using the healthcare cost trend rates, as well as what the City’s total OPEB liability would be if it were calculated using healthcare cost trend rates that are 1 percentage-point lower or 1 percentage-point higher than the current healthcare cost trend rates:
1% DecreaseHealthcare Cost
Trend Rates 1% IncreaseTotal OPEB liability $ 4,817,085 5,610,910 6,589,049
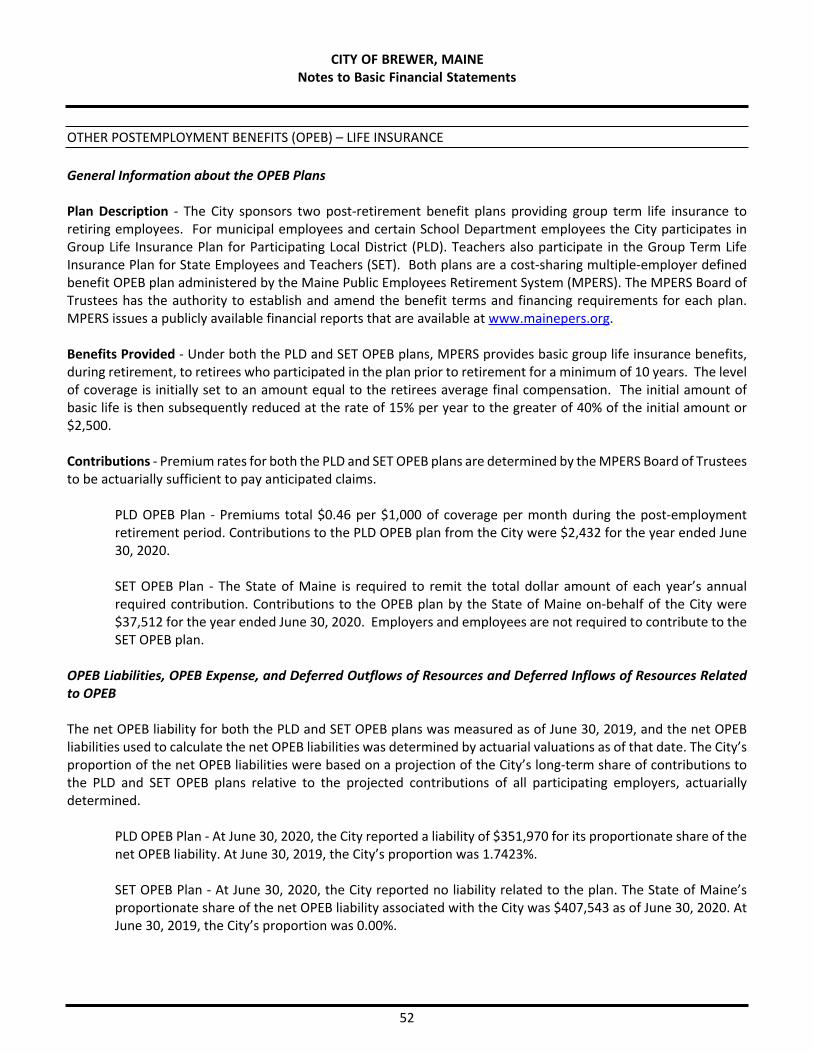
CITY OF BREWER, MAINENotes to Basic Financial Statements
52
OTHER POSTEMPLOYMENT BENEFITS (OPEB) – LIFE INSURANCE
General Information about the OPEB Plans
Plan Description - The City sponsors two post-retirement benefit plans providing group term life insurance to retiring employees. For municipal employees and certain School Department employees the City participates in Group Life Insurance Plan for Participating Local District (PLD). Teachers also participate in the Group Term Life Insurance Plan for State Employees and Teachers (SET). Both plans are a cost-sharing multiple-employer defined benefit OPEB plan administered by the Maine Public Employees Retirement System (MPERS). The MPERS Board of Trustees has the authority to establish and amend the benefit terms and financing requirements for each plan. MPERS issues a publicly available financial reports that are available at www.mainepers.org.
Benefits Provided - Under both the PLD and SET OPEB plans, MPERS provides basic group life insurance benefits, during retirement, to retirees who participated in the plan prior to retirement for a minimum of 10 years. The level of coverage is initially set to an amount equal to the retirees average final compensation. The initial amount of basic life is then subsequently reduced at the rate of 15% per year to the greater of 40% of the initial amount or $2,500.
Contributions - Premium rates for both the PLD and SET OPEB plans are determined by the MPERS Board of Trustees to be actuarially sufficient to pay anticipated claims.
PLD OPEB Plan - Premiums total $0.46 per $1,000 of coverage per month during the post-employment retirement period. Contributions to the PLD OPEB plan from the City were $2,432 for the year ended June 30, 2020.
SET OPEB Plan - The State of Maine is required to remit the total dollar amount of each year’s annual required contribution. Contributions to the OPEB plan by the State of Maine on-behalf of the City were $37,512 for the year ended June 30, 2020. Employers and employees are not required to contribute to the SET OPEB plan.
OPEB Liabilities, OPEB Expense, and Deferred Outflows of Resources and Deferred Inflows of Resources Related to OPEB
The net OPEB liability for both the PLD and SET OPEB plans was measured as of June 30, 2019, and the net OPEB liabilities used to calculate the net OPEB liabilities was determined by actuarial valuations as of that date. The City’s proportion of the net OPEB liabilities were based on a projection of the City’s long-term share of contributions to the PLD and SET OPEB plans relative to the projected contributions of all participating employers, actuarially determined.
PLD OPEB Plan - At June 30, 2020, the City reported a liability of $351,970 for its proportionate share of the net OPEB liability. At June 30, 2019, the City’s proportion was 1.7423%.
SET OPEB Plan - At June 30, 2020, the City reported no liability related to the plan. The State of Maine’s proportionate share of the net OPEB liability associated with the City was $407,543 as of June 30, 2020. At June 30, 2019, the City’s proportion was 0.00%.
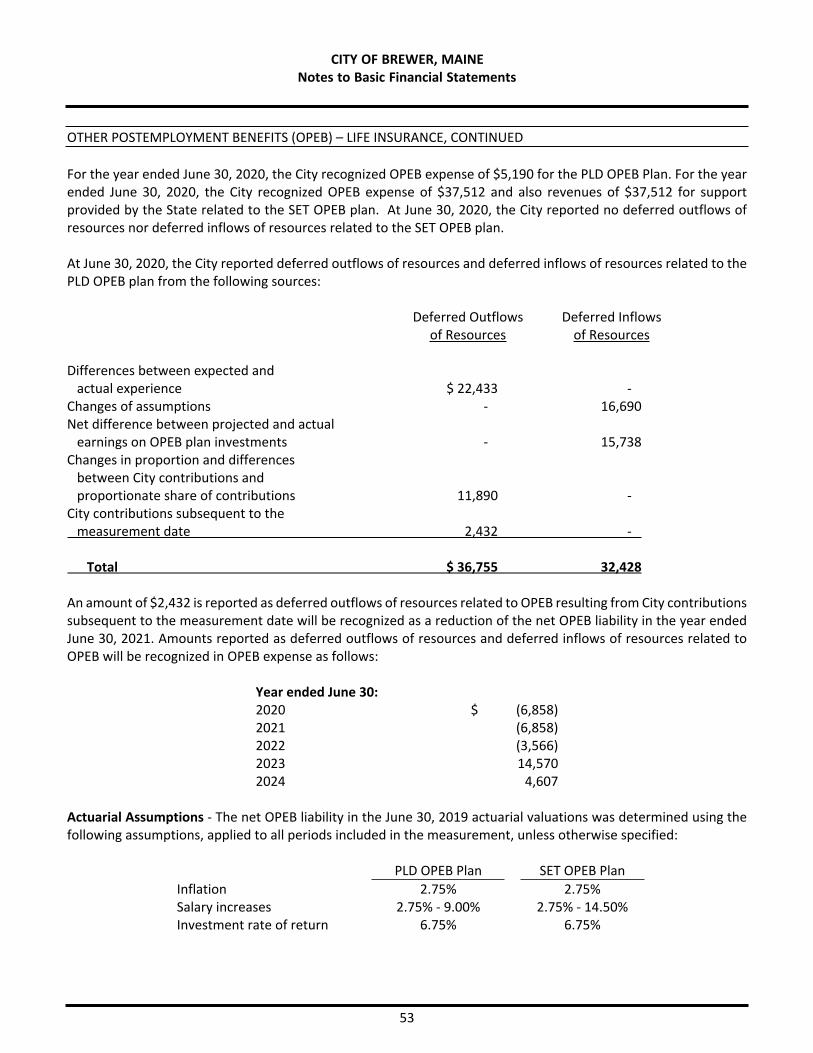
CITY OF BREWER, MAINENotes to Basic Financial Statements
53
OTHER POSTEMPLOYMENT BENEFITS (OPEB) – LIFE INSURANCE, CONTINUED
For the year ended June 30, 2020, the City recognized OPEB expense of $5,190 for the PLD OPEB Plan. For the year ended June 30, 2020, the City recognized OPEB expense of $37,512 and also revenues of $37,512 for support provided by the State related to the SET OPEB plan. At June 30, 2020, the City reported no deferred outflows of resources nor deferred inflows of resources related to the SET OPEB plan.
At June 30, 2020, the City reported deferred outflows of resources and deferred inflows of resources related to the PLD OPEB plan from the following sources:
Deferred Outflows Deferred Inflowsof Resources of Resources
Differences between expected and actual experience $ 22,433 - Changes of assumptions - 16,690Net difference between projected and actual earnings on OPEB plan investments - 15,738Changes in proportion and differences between City contributions and proportionate share of contributions 11,890 - City contributions subsequent to the measurement date 2,432 -
Total $ 36,755 32,428
An amount of $2,432 is reported as deferred outflows of resources related to OPEB resulting from City contributions subsequent to the measurement date will be recognized as a reduction of the net OPEB liability in the year ended June 30, 2021. Amounts reported as deferred outflows of resources and deferred inflows of resources related to OPEB will be recognized in OPEB expense as follows:
Year ended June 30:2020 $ (6,858)2021 (6,858)2022 (3,566)2023 14,5702024 4,607
Actuarial Assumptions - The net OPEB liability in the June 30, 2019 actuarial valuations was determined using the following assumptions, applied to all periods included in the measurement, unless otherwise specified:
PLD OPEB Plan SET OPEB PlanInflation 2.75% 2.75%Salary increases 2.75% - 9.00% 2.75% - 14.50%Investment rate of return 6.75% 6.75%

CITY OF BREWER, MAINENotes to Basic Financial Statements
54
OTHER POSTEMPLOYMENT BENEFITS (OPEB) – LIFE INSURANCE, CONTINUED
Mortality rates for each plan were based on the RP2014 Total Dataset Healthy Annuitant Mortality Table, for males and females.
The actuarial assumptions used in the June 30, 2018 valuations were based on the results of an actuarial experience study conducted for the period June 30, 2012 to June 30, 2015.
The long-term expected rate of return on both PLD and SET OPEB plan investments was determined using a building-block method which best estimates ranges of expected future real rates of return (expected returns, net of investment expense and inflation) are developed for each major class of assets. These ranges are combined to produce long-term expected rate of return by weighting the expected future real rates of return by the target asset allocation percentage and by adding expected inflation. The target allocation and best estimates of arithmetic real rates of return for each major asset class are summarized in the following table:
Asset Class Target Allocation
Long-term Expected Real Rate
of ReturnPublic equities 70.0% 6.0%Real estate 5.0% 5.2%Traditional credit 15.0% 3.0%US government securities 10.0% 2.3%
Discount Rate - The rate used to measure the net OPEB liability for the PLD OPEB plan was 4.98% which is a blend of the assumed long-term expected rate of return of 6.75% and a municipal bond index rate of 3.5%, based on the Bond Buyer GO 20-Year Municipal Bond Index as of June 30, 2018. Projections of the plan’s fiduciary net position indicate that it is not expected to be sufficient to make projected benefit payments for current members beyond 2047. Therefore, the portion of the future projected benefit payments after 2047 are discounted at the municipal bond index rate. The projection of cash flows used to determine the discount rate assumed that employer contributions will be made at contractually required rates, actuarially determined.
The rate used to measure the net OPEB liability for the SET OPEB plan was 6.75%. The projection of cash flows used to determine the discount rate assumed that employer contributions will be made at contractually required rates, actuarially determined. Based on this assumption, the OPEB plans fiduciary net position was projected to be available to make all projected OPEB payments for current and inactive employees. Therefore, the long-term expected rate of return on OPEB plan investments was applied to all periods of projected benefit payments to determine the total OPEB liability.
Sensitivity of the City’s Proportionate Share of the Net OPEB Liability to Changes in the Discount Rate - The following presents the City’s proportionate share of the net PLD OPEB plan liability calculated using the discount rate of 4.98%, as well as what the City’s proportionate share of the net PLD OPEB plan liability would be if it were calculated using a discount rate that is 1 percentage-point lower (3.98%) or 1 percentage-point higher (5.98%) than the current rate:
1% Decrease(3.98%)
Discount Rate
(4.98%)
1% Increase(5.98%)
Net OPEB liability $ 464,810 351,970 263,012

CITY OF BREWER, MAINENotes to Basic Financial Statements
55
OTHER POSTEMPLOYMENT BENEFITS (OPEB) – LIFE INSURANCE, CONTINUED
Sensitivity of the City’s proportionate share of the net SET OPEB plan liability to the changes in the discount rate are not presented as the City does not have any liability related to this plan given that the SET OPEB plan is 100% funded by contributions from the State of Maine.
OPEB Plan Fiduciary Net Position - Detailed information about both the PLD and SET OPEB plan’s fiduciary net positions are available in a separately issued MPERS financial report.
FUND BALANCE
As of June 30, 2020, fund balance components consisted of the following:Other Other
General Capital Govt.Fund Projects Funds
Nonspendable:Inventory $ - - 33,725Principal for permanent funds - - 324,553Prepaid items 235,486 - -
Total nonspendable 235,486 - 358,278
Restricted:Finance and administration - - 165,378Community services - - 398,680Public safety - - 88,959Public works - - 50,045Education 836,662 - 222,493Capital projects - 1,477,021 50,408Permanent funds - - 40,466
Total restricted 836,662 1,477,021 1,016,429
Committed:Finance and administration - - 50,416Community services - - 224Public safety - - 10,000Capital projects - 1,431,798 -
Total committed - 1,431,798 60,640
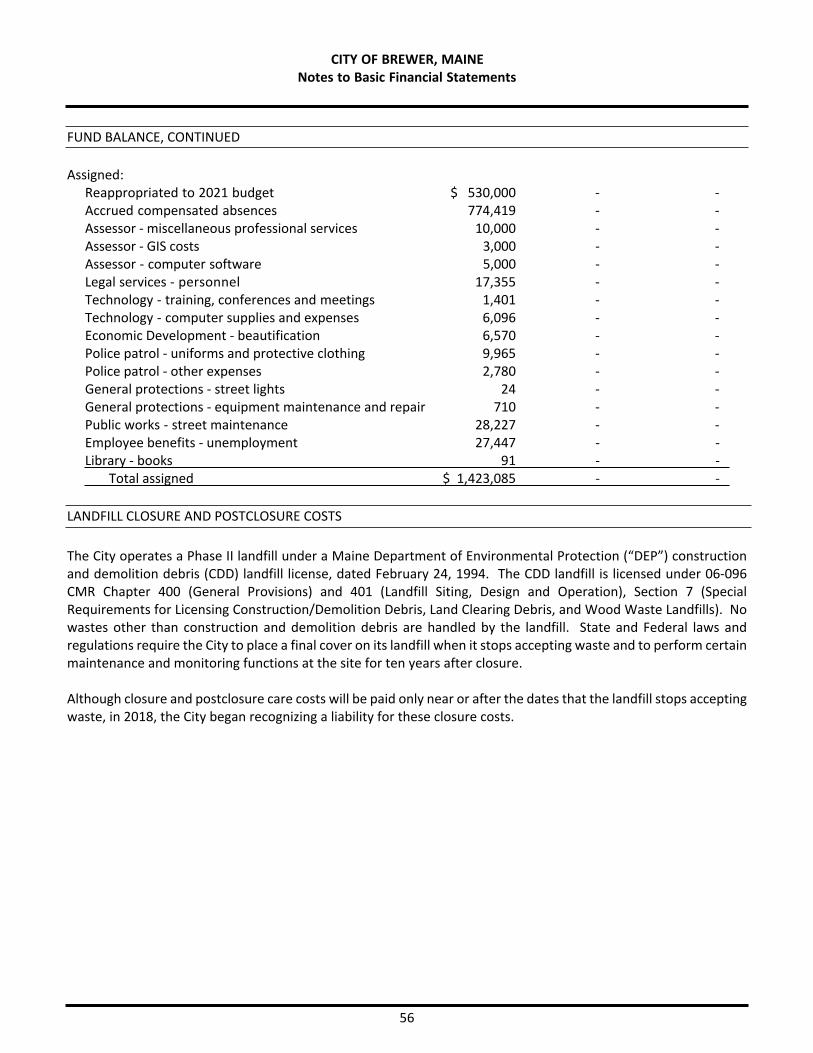
CITY OF BREWER, MAINENotes to Basic Financial Statements
56
FUND BALANCE, CONTINUED
Assigned:Reappropriated to 2021 budget $ 530,000 - -Accrued compensated absences 774,419 - -Assessor - miscellaneous professional services 10,000 - -Assessor - GIS costs 3,000 - -Assessor - computer software 5,000 - -Legal services - personnel 17,355 - -Technology - training, conferences and meetings 1,401 - -Technology - computer supplies and expenses 6,096 - -Economic Development - beautification 6,570 - -Police patrol - uniforms and protective clothing 9,965 - -Police patrol - other expenses 2,780 - -General protections - street lights 24 - -General protections - equipment maintenance and repair 710 - -Public works - street maintenance 28,227 - -Employee benefits - unemployment 27,447 - - Library - books 91 - -
Total assigned $ 1,423,085 - -
LANDFILL CLOSURE AND POSTCLOSURE COSTS
The City operates a Phase II landfill under a Maine Department of Environmental Protection (“DEP”) construction and demolition debris (CDD) landfill license, dated February 24, 1994. The CDD landfill is licensed under 06-096 CMR Chapter 400 (General Provisions) and 401 (Landfill Siting, Design and Operation), Section 7 (Special Requirements for Licensing Construction/Demolition Debris, Land Clearing Debris, and Wood Waste Landfills). No wastes other than construction and demolition debris are handled by the landfill. State and Federal laws and regulations require the City to place a final cover on its landfill when it stops accepting waste and to perform certain maintenance and monitoring functions at the site for ten years after closure.
Although closure and postclosure care costs will be paid only near or after the dates that the landfill stops accepting waste, in 2018, the City began recognizing a liability for these closure costs.
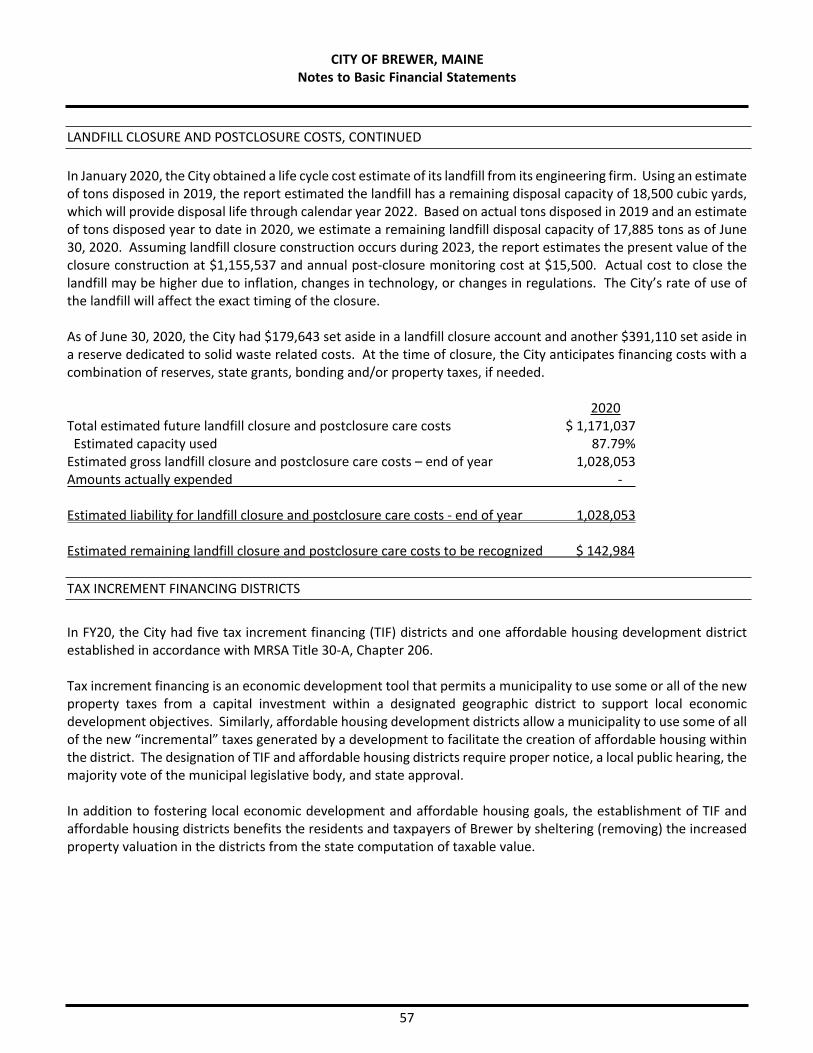
CITY OF BREWER, MAINENotes to Basic Financial Statements
57
LANDFILL CLOSURE AND POSTCLOSURE COSTS, CONTINUED
In January 2020, the City obtained a life cycle cost estimate of its landfill from its engineering firm. Using an estimate of tons disposed in 2019, the report estimated the landfill has a remaining disposal capacity of 18,500 cubic yards, which will provide disposal life through calendar year 2022. Based on actual tons disposed in 2019 and an estimate of tons disposed year to date in 2020, we estimate a remaining landfill disposal capacity of 17,885 tons as of June 30, 2020. Assuming landfill closure construction occurs during 2023, the report estimates the present value of the closure construction at $1,155,537 and annual post-closure monitoring cost at $15,500. Actual cost to close the landfill may be higher due to inflation, changes in technology, or changes in regulations. The City’s rate of use of the landfill will affect the exact timing of the closure.
As of June 30, 2020, the City had $179,643 set aside in a landfill closure account and another $391,110 set aside in a reserve dedicated to solid waste related costs. At the time of closure, the City anticipates financing costs with a combination of reserves, state grants, bonding and/or property taxes, if needed.
2020Total estimated future landfill closure and postclosure care costs $ 1,171,037
Estimated capacity used 87.79%Estimated gross landfill closure and postclosure care costs – end of year 1,028,053Amounts actually expended -
Estimated liability for landfill closure and postclosure care costs - end of year 1,028,053
Estimated remaining landfill closure and postclosure care costs to be recognized $ 142,984
TAX INCREMENT FINANCING DISTRICTS
In FY20, the City had five tax increment financing (TIF) districts and one affordable housing development district established in accordance with MRSA Title 30-A, Chapter 206.
Tax increment financing is an economic development tool that permits a municipality to use some or all of the new property taxes from a capital investment within a designated geographic district to support local economic development objectives. Similarly, affordable housing development districts allow a municipality to use some of all of the new “incremental” taxes generated by a development to facilitate the creation of affordable housing within the district. The designation of TIF and affordable housing districts require proper notice, a local public hearing, the majority vote of the municipal legislative body, and state approval.
In addition to fostering local economic development and affordable housing goals, the establishment of TIF and affordable housing districts benefits the residents and taxpayers of Brewer by sheltering (removing) the increased property valuation in the districts from the state computation of taxable value.
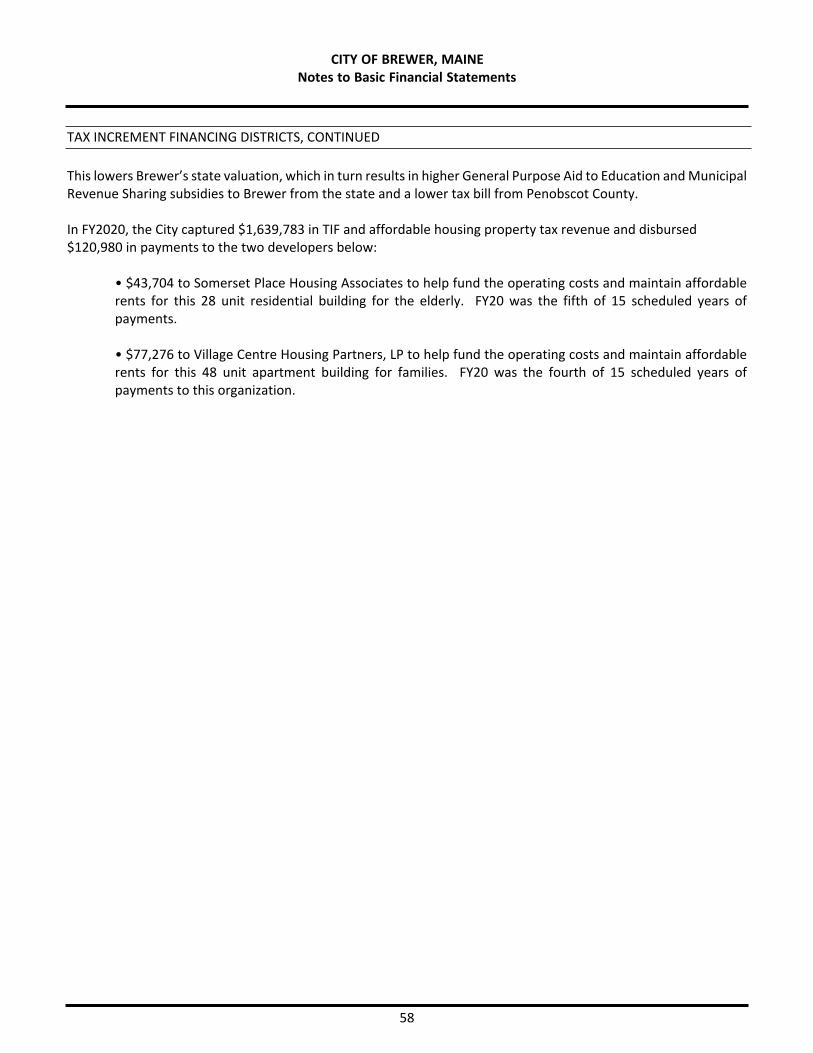
CITY OF BREWER, MAINENotes to Basic Financial Statements
58
TAX INCREMENT FINANCING DISTRICTS, CONTINUED
This lowers Brewer’s state valuation, which in turn results in higher General Purpose Aid to Education and Municipal Revenue Sharing subsidies to Brewer from the state and a lower tax bill from Penobscot County.
In FY2020, the City captured $1,639,783 in TIF and affordable housing property tax revenue and disbursed $120,980 in payments to the two developers below:
• $43,704 to Somerset Place Housing Associates to help fund the operating costs and maintain affordablerents for this 28 unit residential building for the elderly. FY20 was the fifth of 15 scheduled years ofpayments.
• $77,276 to Village Centre Housing Partners, LP to help fund the operating costs and maintain affordablerents for this 48 unit apartment building for families. FY20 was the fourth of 15 scheduled years ofpayments to this organization.
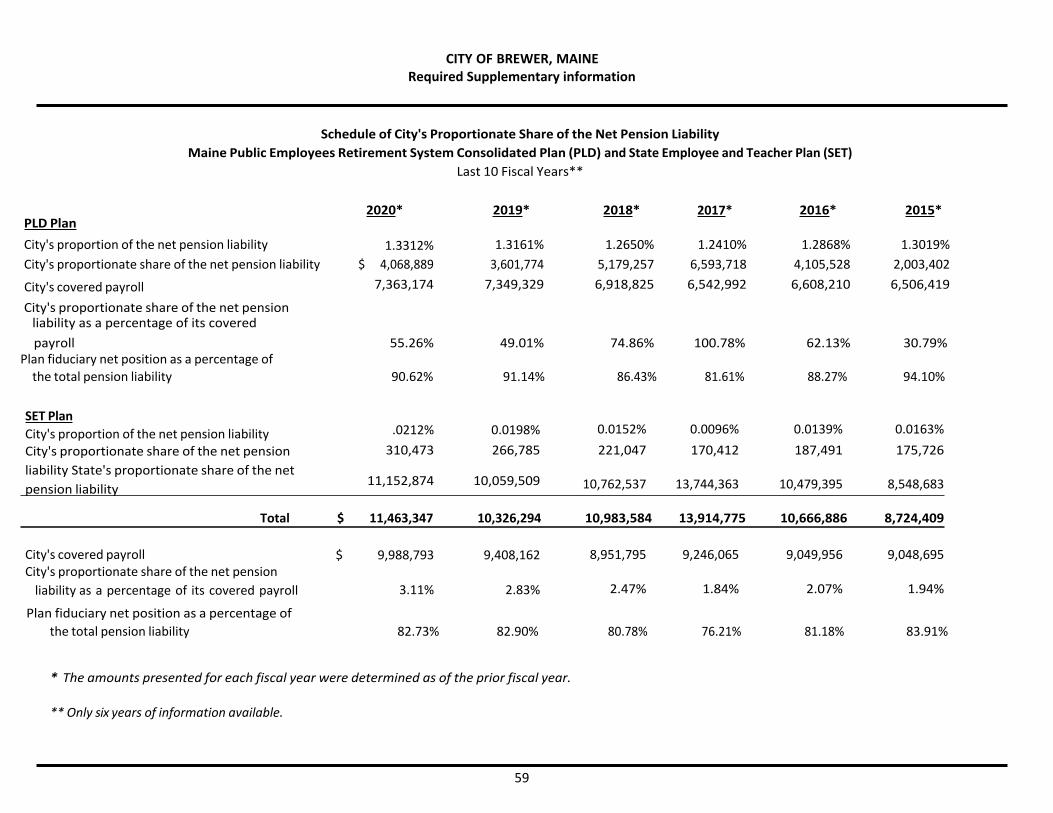
CITY OF BREWER, MAINERequired Supplementary information
59
Schedule of City's Proportionate Share of the Net Pension Liability Maine Public Employees Retirement System Consolidated Plan (PLD) and State Employee and Teacher Plan (SET)
Last 10 Fiscal Years**
PLD Plan2020* 2019* 2018* 2017* 2016* 2015*
City's proportion of the net pension liability 1.3312% 1.3161% 1.2650% 1.2410% 1.2868% 1.3019%City's proportionate share of the net pension liability $ 4,068,889 3,601,774 5,179,257 6,593,718 4,105,528 2,003,402
City's covered payroll 7,363,174 7,349,329 6,918,825 6,542,992 6,608,210 6,506,419
City's proportionate share of the net pension liability as a percentage of its coveredpayroll 55.26% 49.01% 74.86% 100.78% 62.13% 30.79%
Plan fiduciary net position as a percentage ofthe total pension liability 90.62% 91.14% 86.43% 81.61% 88.27% 94.10%
SET PlanCity's proportion of the net pension liability .0212% 0.0198% 0.0152% 0.0096% 0.0139% 0.0163%City's proportionate share of the net pension liability State's proportionate share of the net pension liability
associated with the City
310,473
11,152,874
266,785
10,059,509
221,047
10,762,537
170,412
13,744,363
187,491
10,479,395
175,726
8,548,683
Total $ 11,463,347 10,326,294 10,983,584 13,914,775 10,666,886 8,724,409
City's covered payrollCity's proportionate share of the net pension
liability as a percentage of its covered payroll
$ 9,988,793
3.11%
9,408,162
2.83%
8,951,795
2.47%
9,246,065
1.84%
9,049,956
2.07%
9,048,695
1.94%
Plan fiduciary net position as a percentage ofthe total pension liability 82.73% 82.90% 80.78% 76.21% 81.18% 83.91%
* The amounts presented for each fiscal year were determined as of the prior fiscal year.
** Only six years of information available.

CITY OF BREWER, MAINERequired Supplementary information
60
Schedule of City Pension ContributionsMaine Public Employees Retirement System Consolidated Plan (PLD) and State Employee and Teacher Plan (SET)
Last 10 Fiscal Years*
PLD Plan2020 2019 2018 2017 2016 2015 2014
Contractually required contribution $ 832,731 736,463 730,581 648,372 666,183 526,003 451,334Contributions in relation to the contractually
required contribution (832,731) (736,463) (730,581) (648,372) (666,183) (526,003) (451,334)
Contribution deficiency (excess) $ - - - - - - -
City's covered payroll $ 7,867,423 7,363,174 7,349,329 6,918,825 6,542,992 6,608,210 6,506,419
Contributions as a percentage of coveredpayroll 10.59% 10.00% 9.94% 9.37% 10.18% 7.96% 6.94%
SET PlanContractually required contribution 432,717 396,555 373,596 300,795 310,832 239,824 239,790
Contributions in relation to the contractually required contribution (432,717) (396,555) (373,596) (300,795) (310,832) (239,824) (239,790)
Contribution deficiency (excess) $ - - - - - - -
City's covered payrollContributions as a percentage of covered
payroll
$ 10,398,148
4.16%
9,988,793
3.97%
9,408,162
3.97%
8,951,795
3.36%
9,246,065
3.36%
9,049,956
2.65%
9,048,695
2.65%
* Only seven years of information available.
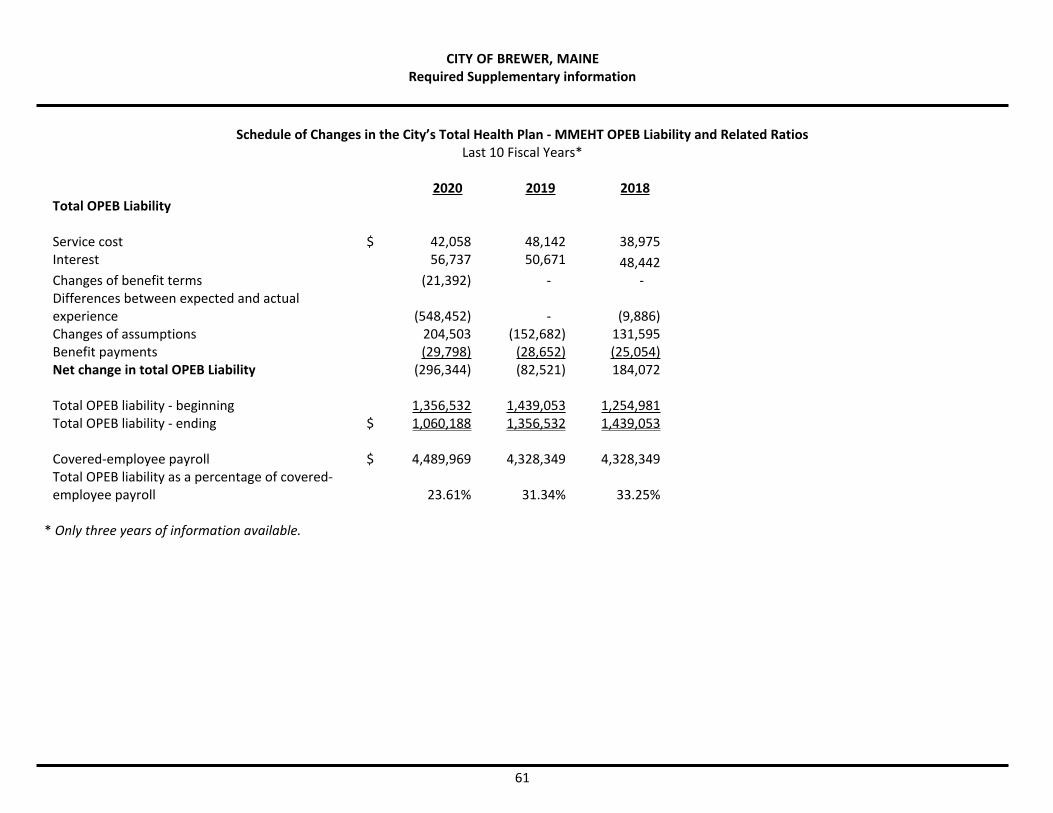
CITY OF BREWER, MAINERequired Supplementary information
61
Schedule of Changes in the City’s Total Health Plan - MMEHT OPEB Liability and Related RatiosLast 10 Fiscal Years*
2020 2019 2018Total OPEB Liability
Service cost $ 42,058 48,142 38,975Interest 56,737 50,671 48,442Changes of benefit terms (21,392) - -Differences between expected and actual experience (548,452) - (9,886)Changes of assumptions 204,503 (152,682) 131,595Benefit payments (29,798) (28,652) (25,054)Net change in total OPEB Liability (296,344) (82,521) 184,072
Total OPEB liability - beginning 1,356,532 1,439,053 1,254,981Total OPEB liability - ending $ 1,060,188 1,356,532 1,439,053
Covered-employee payroll $ 4,489,969 4,328,349 4,328,349Total OPEB liability as a percentage of covered-employee payroll 23.61% 31.34% 33.25%
* Only three years of information available.
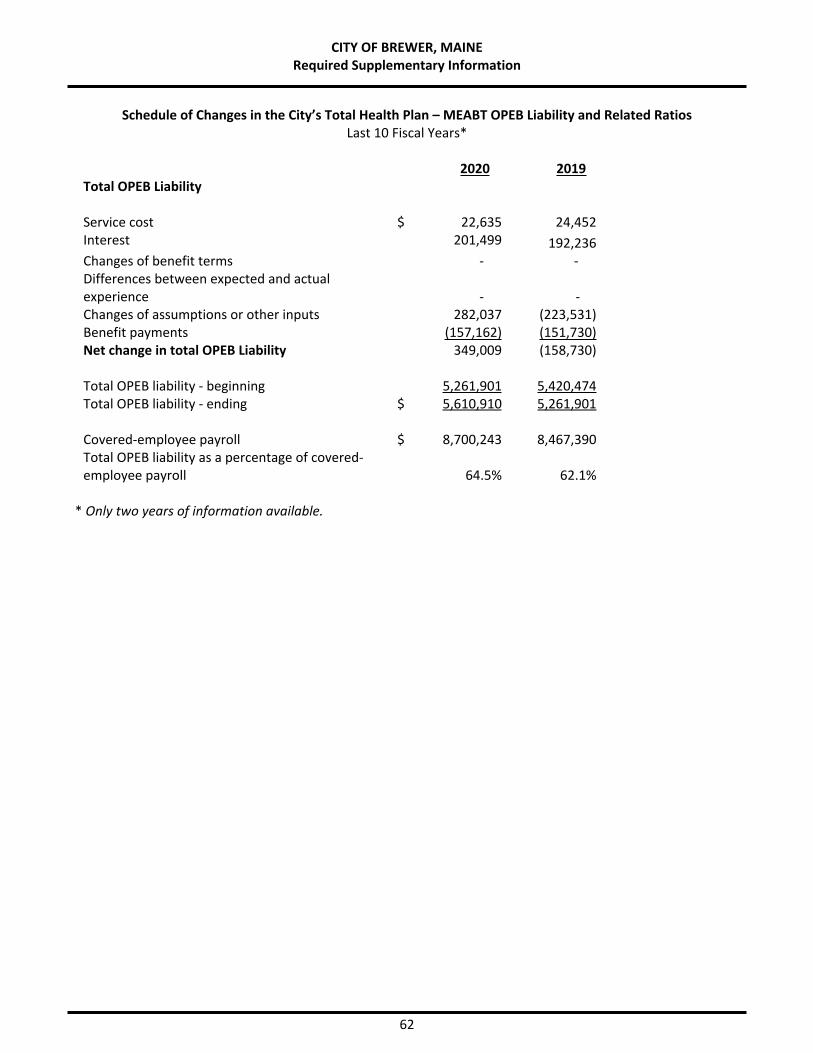
CITY OF BREWER, MAINERequired Supplementary Information
62
Schedule of Changes in the City’s Total Health Plan – MEABT OPEB Liability and Related RatiosLast 10 Fiscal Years*
2020 2019Total OPEB Liability
Service cost $ 22,635 24,452Interest 201,499 192,236Changes of benefit terms - -Differences between expected and actual experience - -Changes of assumptions or other inputs 282,037 (223,531)Benefit payments (157,162) (151,730)Net change in total OPEB Liability 349,009 (158,730)
Total OPEB liability - beginning 5,261,901 5,420,474Total OPEB liability - ending $ 5,610,910 5,261,901
Covered-employee payroll $ 8,700,243 8,467,390Total OPEB liability as a percentage of covered-employee payroll 64.5% 62.1%
* Only two years of information available.
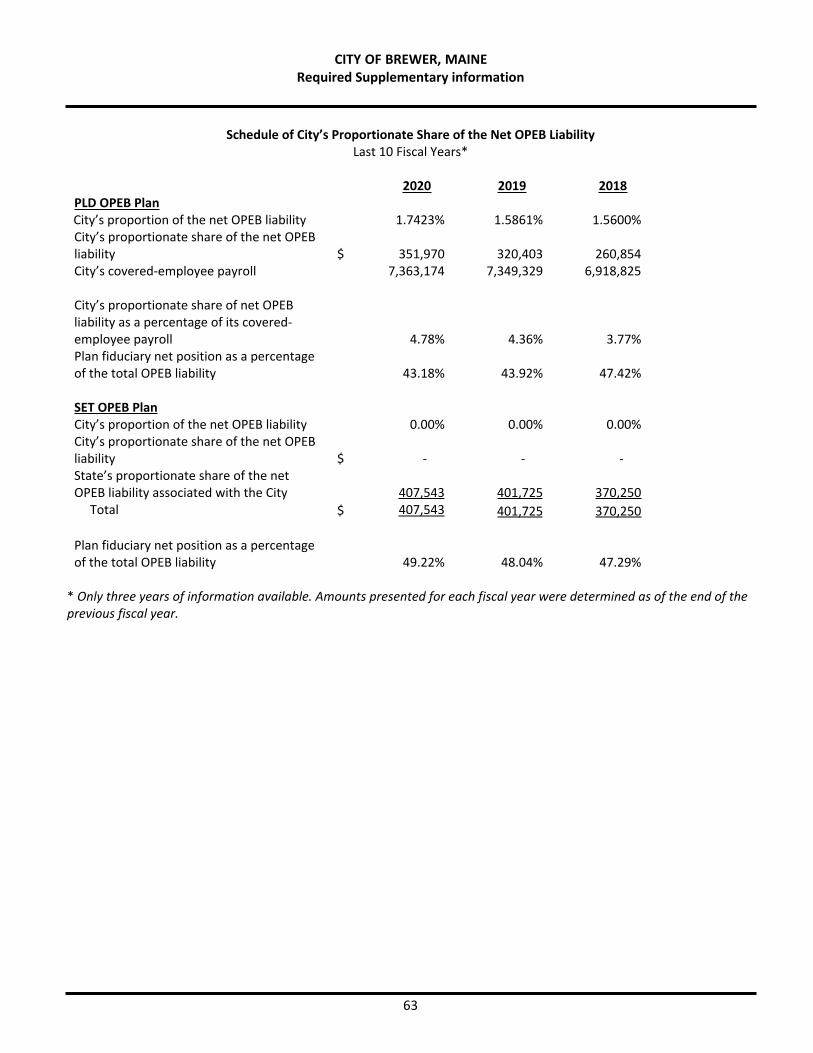
CITY OF BREWER, MAINERequired Supplementary information
63
Schedule of City’s Proportionate Share of the Net OPEB LiabilityLast 10 Fiscal Years*
2020 2019 2018PLD OPEB PlanCity’s proportion of the net OPEB liability 1.7423% 1.5861% 1.5600%City’s proportionate share of the net OPEB liability $ 351,970 320,403 260,854City’s covered-employee payroll 7,363,174 7,349,329 6,918,825
City’s proportionate share of net OPEB liability as a percentage of its covered-employee payroll 4.78% 4.36% 3.77%Plan fiduciary net position as a percentage of the total OPEB liability 43.18% 43.92% 47.42%
SET OPEB PlanCity’s proportion of the net OPEB liability 0.00% 0.00% 0.00%City’s proportionate share of the net OPEB liability $ - - -State’s proportionate share of the net OPEB liability associated with the City 407,543 401,725 370,250 Total $ 407,543 401,725 370,250
Plan fiduciary net position as a percentage of the total OPEB liability 49.22% 48.04% 47.29%
* Only three years of information available. Amounts presented for each fiscal year were determined as of the end of theprevious fiscal year.
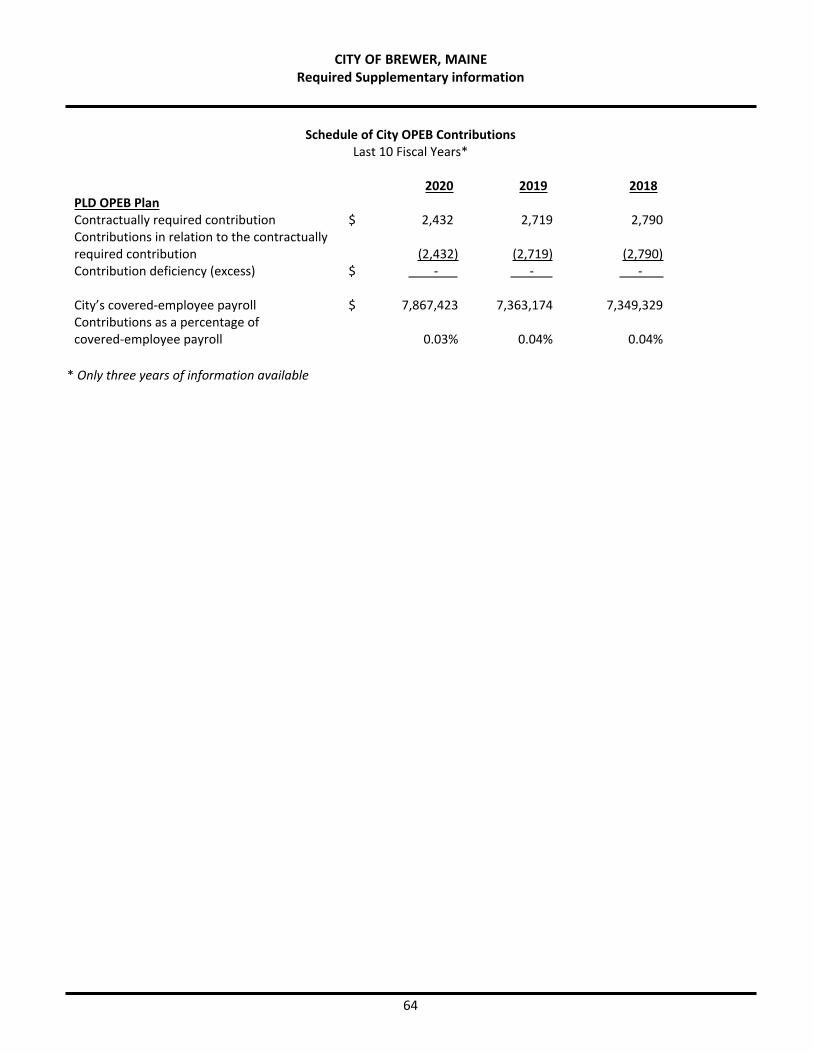
CITY OF BREWER, MAINERequired Supplementary information
64
Schedule of City OPEB ContributionsLast 10 Fiscal Years*
2020 2019 2018PLD OPEB PlanContractually required contribution $ 2,432 2,719 2,790Contributions in relation to the contractually required contribution (2,432) (2,719) (2,790)Contribution deficiency (excess) $ - - -
City’s covered-employee payroll $ 7,867,423 7,363,174 7,349,329Contributions as a percentage of covered-employee payroll 0.03% 0.04% 0.04%
* Only three years of information available
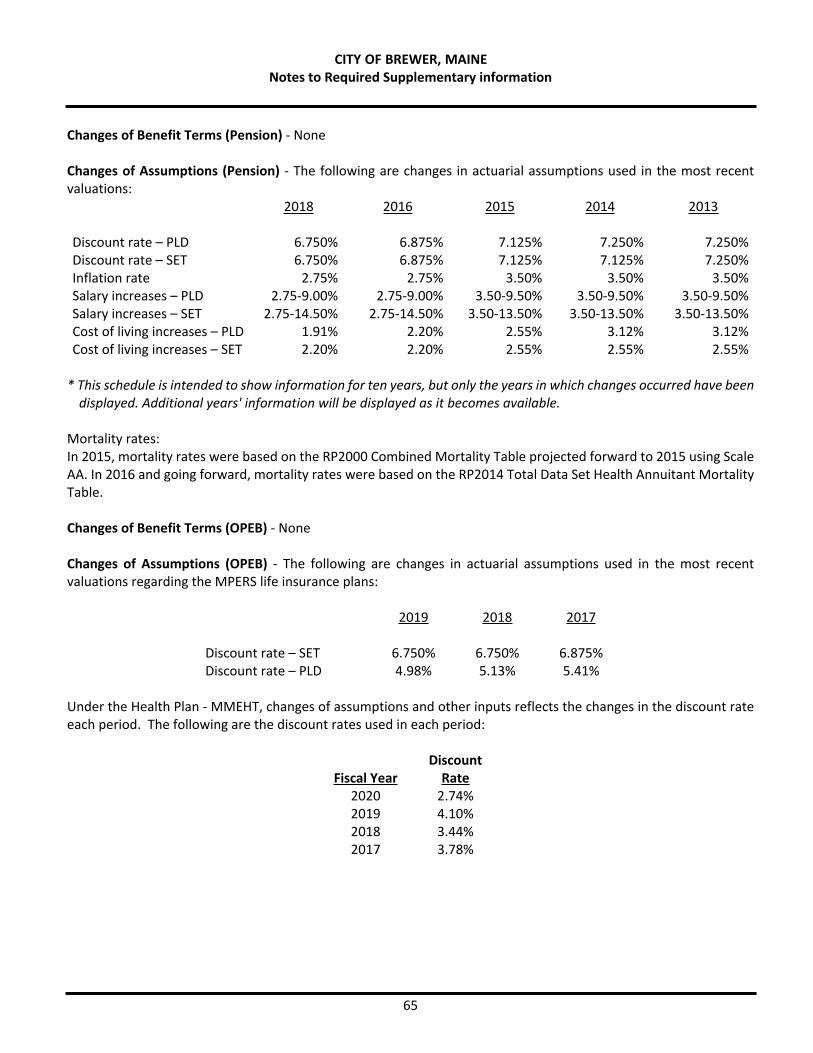
CITY OF BREWER, MAINENotes to Required Supplementary information
65
Changes of Benefit Terms (Pension) - None
Changes of Assumptions (Pension) - The following are changes in actuarial assumptions used in the most recent valuations:
2018 2016 2015 2014 2013
Discount rate – PLD 6.750% 6.875% 7.125% 7.250% 7.250%Discount rate – SET 6.750% 6.875% 7.125% 7.125% 7.250%Inflation rate 2.75% 2.75% 3.50% 3.50% 3.50%Salary increases – PLD 2.75-9.00% 2.75-9.00% 3.50-9.50% 3.50-9.50% 3.50-9.50%Salary increases – SET 2.75-14.50% 2.75-14.50% 3.50-13.50% 3.50-13.50% 3.50-13.50%Cost of living increases – PLD 1.91% 2.20% 2.55% 3.12% 3.12%Cost of living increases – SET 2.20% 2.20% 2.55% 2.55% 2.55%
* This schedule is intended to show information for ten years, but only the years in which changes occurred have beendisplayed. Additional years' information will be displayed as it becomes available.
Mortality rates:In 2015, mortality rates were based on the RP2000 Combined Mortality Table projected forward to 2015 using Scale AA. In 2016 and going forward, mortality rates were based on the RP2014 Total Data Set Health Annuitant Mortality Table.
Changes of Benefit Terms (OPEB) - None
Changes of Assumptions (OPEB) - The following are changes in actuarial assumptions used in the most recent valuations regarding the MPERS life insurance plans:
2019 2018 2017
Discount rate – SET 6.750% 6.750% 6.875%Discount rate – PLD 4.98% 5.13% 5.41%
Under the Health Plan - MMEHT, changes of assumptions and other inputs reflects the changes in the discount rate each period. The following are the discount rates used in each period:
Fiscal YearDiscount
Rate2020 2.74%20192018
4.10%3.44%
2017 3.78%
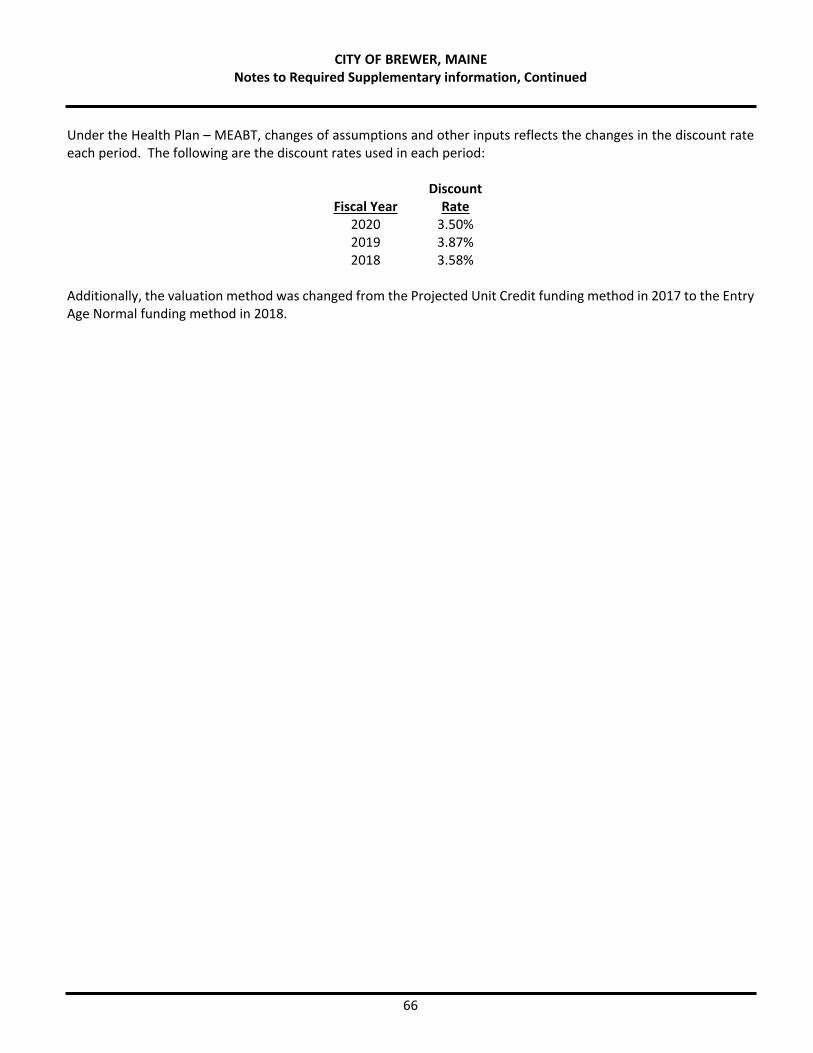
CITY OF BREWER, MAINENotes to Required Supplementary information, Continued
66
Under the Health Plan – MEABT, changes of assumptions and other inputs reflects the changes in the discount rate each period. The following are the discount rates used in each period:
Fiscal YearDiscount
Rate2020 3.50%2019 3.87%2018 3.58%
Additionally, the valuation method was changed from the Projected Unit Credit funding method in 2017 to the Entry Age Normal funding method in 2018.

GENERAL FUNDThe General Fund is the general operating fund of the City. All general tax revenues and other receipts that are not allocated by law or contractual agreement to another fund are accounted for in this fund. From the fund are paid the general operating expenditures, the fixed charges, and the capital improvement costs that are not paid through other funds.
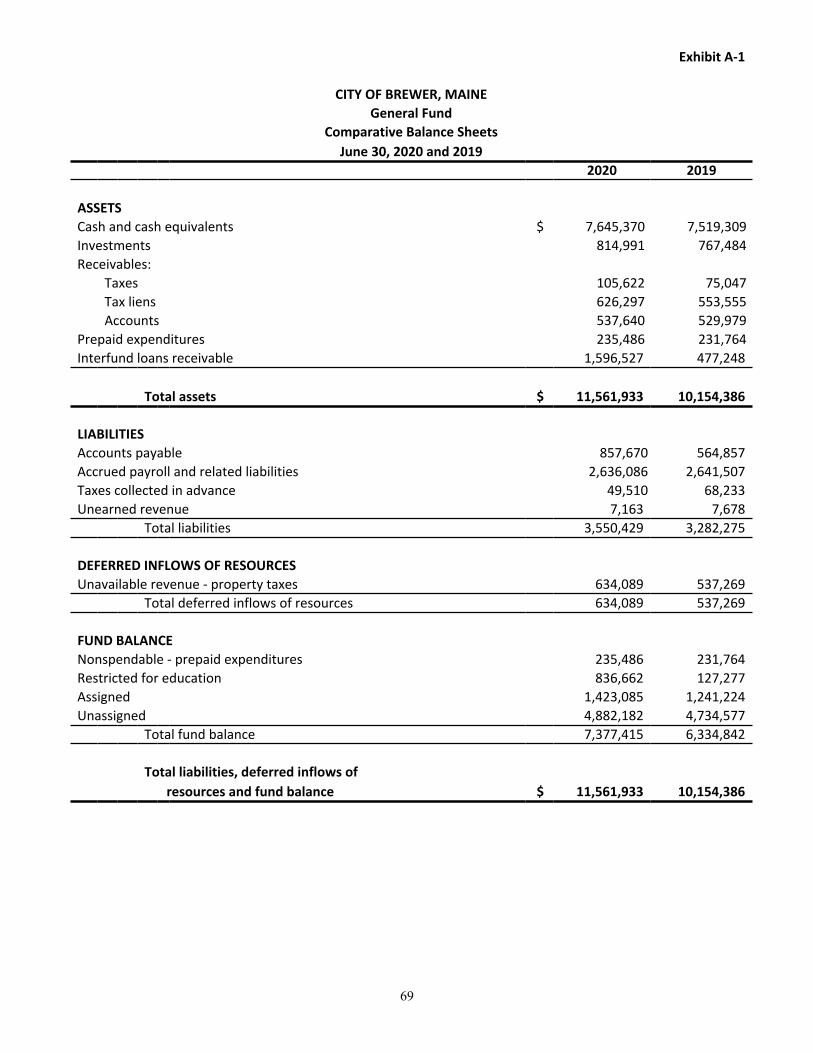
69
Exhibit A-1
CITY OF BREWER, MAINEGeneral Fund
Comparative Balance SheetsJune 30, 2020 and 2019
2020 2019
ASSETSCash and cash equivalents $ 7,645,370 7,519,309Investments 814,991 767,484Receivables:
Taxes 105,622 75,047Tax liens 626,297 553,555Accounts 537,640 529,979
Prepaid expenditures 235,486 231,764Interfund loans receivable 1,596,527 477,248
Total assets $ 11,561,933 10,154,386
LIABILITIESAccounts payable 857,670 564,857Accrued payroll and related liabilities 2,636,086 2,641,507Taxes collected in advance 49,510 68,233Unearned revenue 7,163 7,678
Total liabilities 3,550,429 3,282,275
DEFERRED INFLOWS OF RESOURCESUnavailable revenue - property taxes 634,089 537,269
Total deferred inflows of resources 634,089 537,269
FUND BALANCENonspendable - prepaid expenditures 235,486 231,764Restricted for education 836,662 127,277Assigned 1,423,085 1,241,224Unassigned 4,882,182 4,734,577
Total fund balance 7,377,415 6,334,842
Total liabilities, deferred inflows of resources and fund balance $ 11,561,933 10,154,386
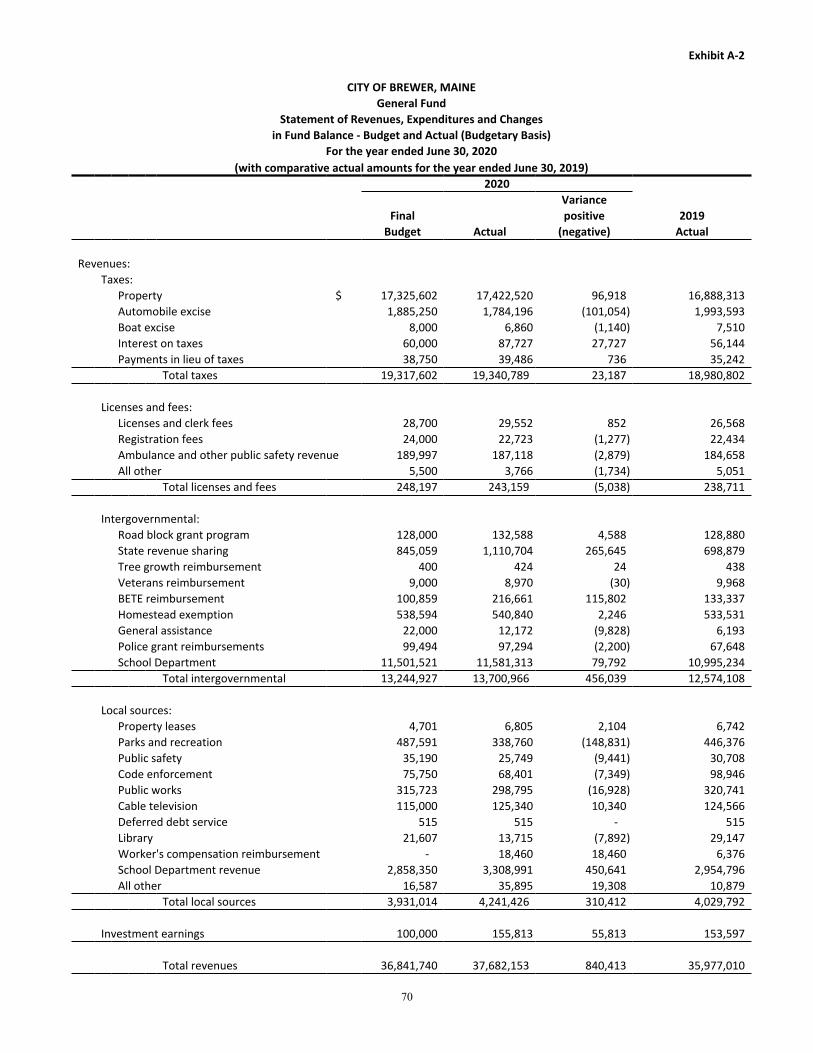
70
Exhibit A-2
CITY OF BREWER, MAINEGeneral Fund
Statement of Revenues, Expenditures and Changesin Fund Balance - Budget and Actual (Budgetary Basis)
For the year ended June 30, 2020(with comparative actual amounts for the year ended June 30, 2019)
2020Variance
Final positive 2019Budget Actual (negative) Actual
Revenues:Taxes:
Property $ 17,325,602 17,422,520 96,918 16,888,313Automobile excise 1,885,250 1,784,196 (101,054) 1,993,593Boat excise 8,000 6,860 (1,140) 7,510Interest on taxes 60,000 87,727 27,727 56,144Payments in lieu of taxes 38,750 39,486 736 35,242
Total taxes 19,317,602 19,340,789 23,187 18,980,802
Licenses and fees:Licenses and clerk fees 28,700 29,552 852 26,568Registration fees 24,000 22,723 (1,277) 22,434Ambulance and other public safety revenue 189,997 187,118 (2,879) 184,658All other 5,500 3,766 (1,734) 5,051
Total licenses and fees 248,197 243,159 (5,038) 238,711
Intergovernmental:Road block grant program 128,000 132,588 4,588 128,880State revenue sharing 845,059 1,110,704 265,645 698,879Tree growth reimbursement 400 424 24 438Veterans reimbursement 9,000 8,970 (30) 9,968BETE reimbursement 100,859 216,661 115,802 133,337Homestead exemption 538,594 540,840 2,246 533,531General assistance 22,000 12,172 (9,828) 6,193Police grant reimbursements 99,494 97,294 (2,200) 67,648School Department 11,501,521 11,581,313 79,792 10,995,234
Total intergovernmental 13,244,927 13,700,966 456,039 12,574,108
Local sources:Property leases 4,701 6,805 2,104 6,742Parks and recreation 487,591 338,760 (148,831) 446,376Public safety 35,190 25,749 (9,441) 30,708Code enforcement 75,750 68,401 (7,349) 98,946Public works 315,723 298,795 (16,928) 320,741Cable television 115,000 125,340 10,340 124,566Deferred debt service 515 515 - 515Library 21,607 13,715 (7,892) 29,147Worker's compensation reimbursement - 18,460 18,460 6,376School Department revenue 2,858,350 3,308,991 450,641 2,954,796All other 16,587 35,895 19,308 10,879
Total local sources 3,931,014 4,241,426 310,412 4,029,792
Investment earnings 100,000 155,813 55,813 153,597
Total revenues 36,841,740 37,682,153 840,413 35,977,010
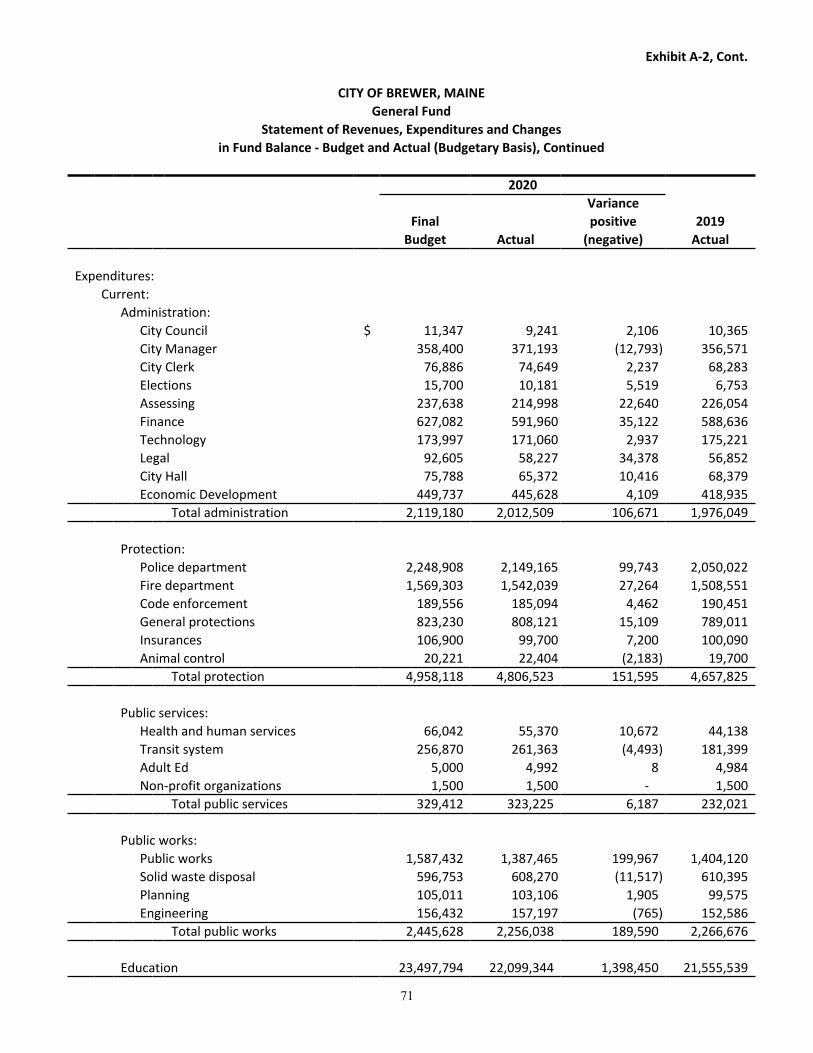
71
Exhibit A-2, Cont.
CITY OF BREWER, MAINEGeneral Fund
Statement of Revenues, Expenditures and Changesin Fund Balance - Budget and Actual (Budgetary Basis), Continued
2020Variance
Final positive 2019Budget Actual (negative) Actual
Expenditures:Current:
Administration:City Council $ 11,347 9,241 2,106 10,365City Manager 358,400 371,193 (12,793) 356,571City Clerk 76,886 74,649 2,237 68,283Elections 15,700 10,181 5,519 6,753Assessing 237,638 214,998 22,640 226,054Finance 627,082 591,960 35,122 588,636Technology 173,997 171,060 2,937 175,221Legal 92,605 58,227 34,378 56,852City Hall 75,788 65,372 10,416 68,379Economic Development 449,737 445,628 4,109 418,935
Total administration 2,119,180 2,012,509 106,671 1,976,049
Protection:Police department 2,248,908 2,149,165 99,743 2,050,022Fire department 1,569,303 1,542,039 27,264 1,508,551Code enforcement 189,556 185,094 4,462 190,451General protections 823,230 808,121 15,109 789,011Insurances 106,900 99,700 7,200 100,090Animal control 20,221 22,404 (2,183) 19,700
Total protection 4,958,118 4,806,523 151,595 4,657,825
Public services:Health and human services 66,042 55,370 10,672 44,138Transit system 256,870 261,363 (4,493) 181,399Adult Ed 5,000 4,992 8 4,984Non-profit organizations 1,500 1,500 - 1,500
Total public services 329,412 323,225 6,187 232,021
Public works:Public works 1,587,432 1,387,465 199,967 1,404,120Solid waste disposal 596,753 608,270 (11,517) 610,395Planning 105,011 103,106 1,905 99,575Engineering 156,432 157,197 (765) 152,586
Total public works 2,445,628 2,256,038 189,590 2,266,676
Education 23,497,794 22,099,344 1,398,450 21,555,539
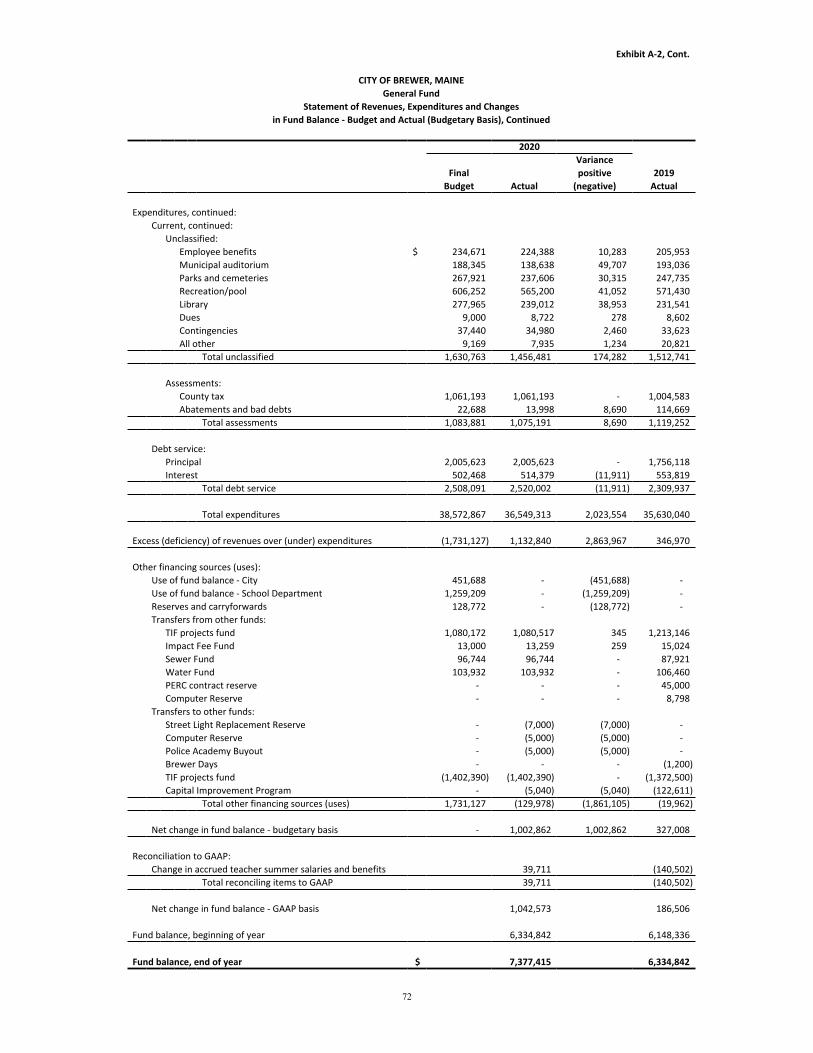
72
Exhibit A-2, Cont.
CITY OF BREWER, MAINEGeneral Fund
Statement of Revenues, Expenditures and Changesin Fund Balance - Budget and Actual (Budgetary Basis), Continued
2020Variance
Final positive 2019Budget Actual (negative) Actual
Expenditures, continued:Current, continued:
Unclassified:Employee benefits $ 234,671 224,388 10,283 205,953Municipal auditorium 188,345 138,638 49,707 193,036Parks and cemeteries 267,921 237,606 30,315 247,735Recreation/pool 606,252 565,200 41,052 571,430Library 277,965 239,012 38,953 231,541Dues 9,000 8,722 278 8,602Contingencies 37,440 34,980 2,460 33,623All other 9,169 7,935 1,234 20,821
Total unclassified 1,630,763 1,456,481 174,282 1,512,741
Assessments:County tax 1,061,193 1,061,193 - 1,004,583Abatements and bad debts 22,688 13,998 8,690 114,669
Total assessments 1,083,881 1,075,191 8,690 1,119,252
Debt service:Principal 2,005,623 2,005,623 - 1,756,118Interest 502,468 514,379 (11,911) 553,819
Total debt service 2,508,091 2,520,002 (11,911) 2,309,937
Total expenditures 38,572,867 36,549,313 2,023,554 35,630,040
Excess (deficiency) of revenues over (under) expenditures (1,731,127) 1,132,840 2,863,967 346,970
Other financing sources (uses):Use of fund balance - City 451,688 - (451,688) - Use of fund balance - School Department 1,259,209 - (1,259,209) - Reserves and carryforwards 128,772 - (128,772) - Transfers from other funds:
TIF projects fund 1,080,172 1,080,517 345 1,213,146Impact Fee Fund 13,000 13,259 259 15,024Sewer Fund 96,744 96,744 - 87,921Water Fund 103,932 103,932 - 106,460PERC contract reserve - - - 45,000Computer Reserve - - - 8,798
Transfers to other funds:Street Light Replacement Reserve - (7,000) (7,000) - Computer Reserve - (5,000) (5,000) - Police Academy Buyout - (5,000) (5,000) - Brewer Days - - - (1,200)TIF projects fund (1,402,390) (1,402,390) - (1,372,500)Capital Improvement Program - (5,040) (5,040) (122,611)
Total other financing sources (uses) 1,731,127 (129,978) (1,861,105) (19,962)
Net change in fund balance - budgetary basis - 1,002,862 1,002,862 327,008
Reconciliation to GAAP:Change in accrued teacher summer salaries and benefits 39,711 (140,502)
Total reconciling items to GAAP 39,711 (140,502)
Net change in fund balance - GAAP basis 1,042,573 186,506
Fund balance, beginning of year 6,334,842 6,148,336
Fund balance, end of year $ 7,377,415 6,334,842

ALL OTHER GOVERNMENTAL FUNDS
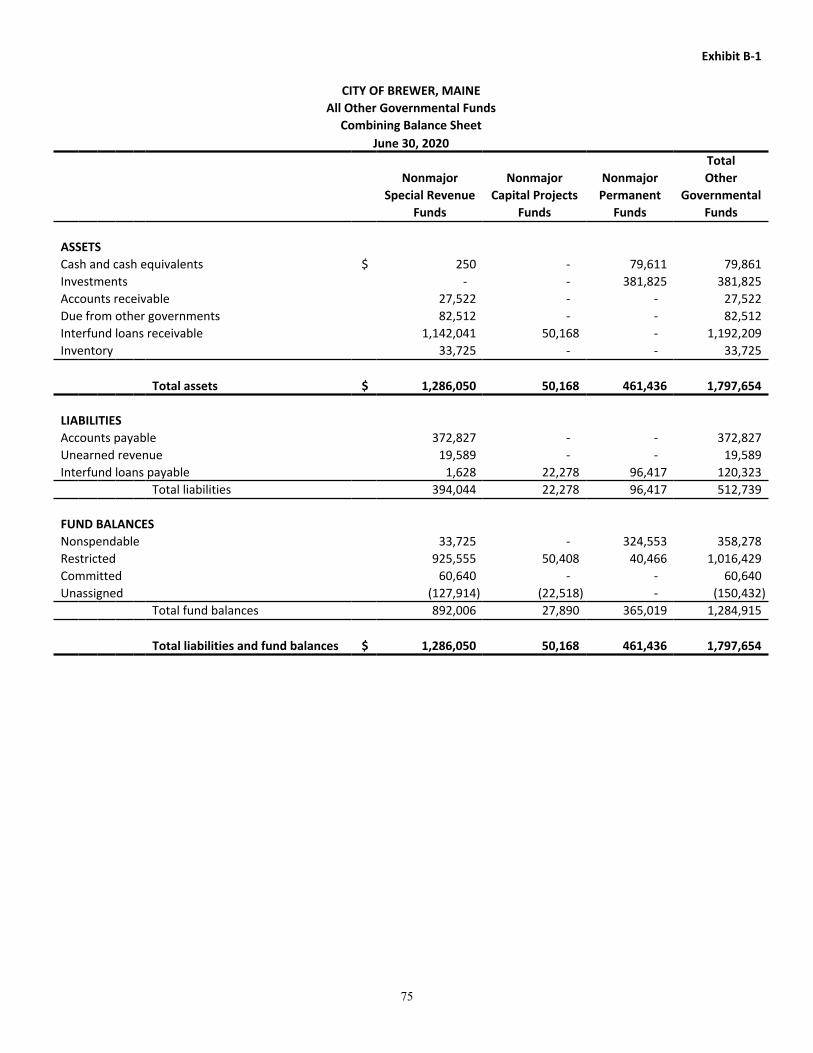
75
Exhibit B-1
CITY OF BREWER, MAINEAll Other Governmental Funds
Combining Balance SheetJune 30, 2020
TotalNonmajor Nonmajor Nonmajor Other
Special Revenue Capital Projects Permanent GovernmentalFunds Funds Funds Funds
ASSETSCash and cash equivalents $ 250 - 79,611 79,861Investments - - 381,825 381,825Accounts receivable 27,522 - - 27,522Due from other governments 82,512 - - 82,512Interfund loans receivable 1,142,041 50,168 - 1,192,209Inventory 33,725 - - 33,725
Total assets $ 1,286,050 50,168 461,436 1,797,654
LIABILITIES Accounts payable 372,827 - - 372,827Unearned revenue 19,589 - - 19,589Interfund loans payable 1,628 22,278 96,417 120,323
Total liabilities 394,044 22,278 96,417 512,739
FUND BALANCESNonspendable 33,725 - 324,553 358,278Restricted 925,555 50,408 40,466 1,016,429Committed 60,640 - - 60,640Unassigned (127,914) (22,518) - (150,432)
Total fund balances 892,006 27,890 365,019 1,284,915
Total liabilities and fund balances $ 1,286,050 50,168 461,436 1,797,654
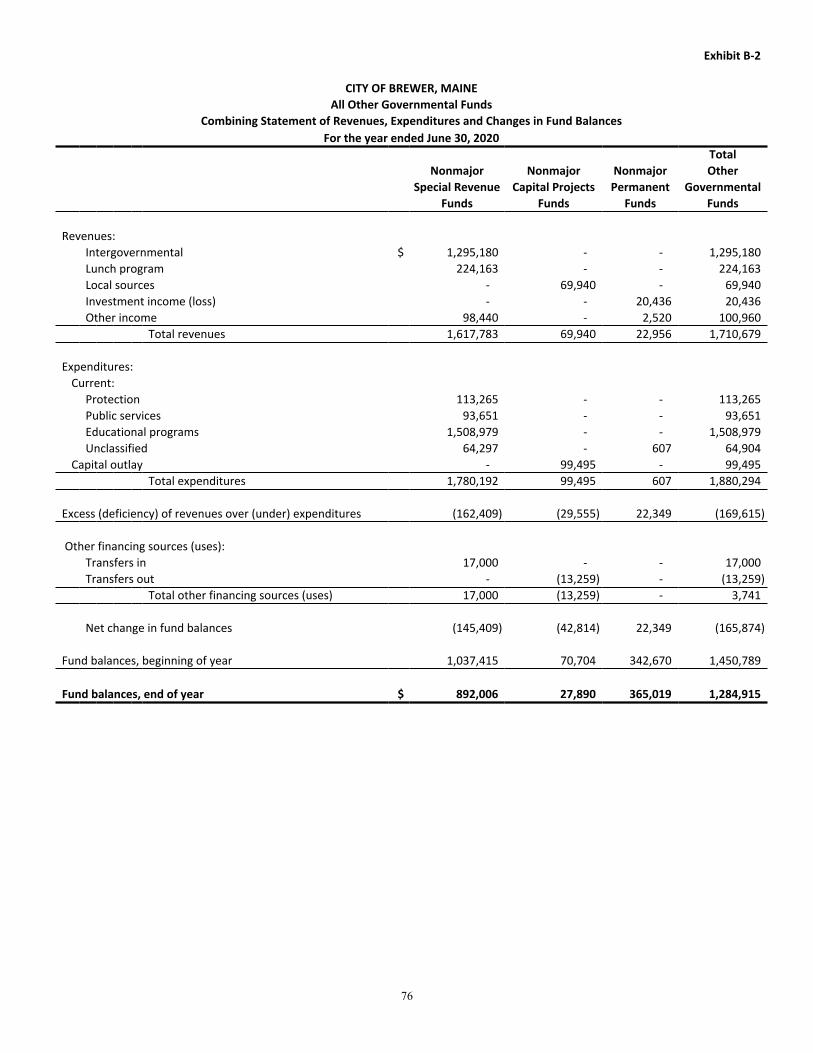
76
Exhibit B-2
CITY OF BREWER, MAINEAll Other Governmental Funds
Combining Statement of Revenues, Expenditures and Changes in Fund BalancesFor the year ended June 30, 2020
TotalNonmajor Nonmajor Nonmajor Other
Special Revenue Capital Projects Permanent GovernmentalFunds Funds Funds Funds
Revenues:Intergovernmental $ 1,295,180 - - 1,295,180Lunch program 224,163 - - 224,163Local sources - 69,940 - 69,940Investment income (loss) - - 20,436 20,436Other income 98,440 - 2,520 100,960
Total revenues 1,617,783 69,940 22,956 1,710,679
Expenditures:Current:
Protection 113,265 - - 113,265Public services 93,651 - - 93,651Educational programs 1,508,979 - - 1,508,979Unclassified 64,297 - 607 64,904
Capital outlay - 99,495 - 99,495Total expenditures 1,780,192 99,495 607 1,880,294
Excess (deficiency) of revenues over (under) expenditures (162,409) (29,555) 22,349 (169,615)
Other financing sources (uses): Transfers in 17,000 - - 17,000Transfers out - (13,259) - (13,259)
Total other financing sources (uses) 17,000 (13,259) - 3,741
Net change in fund balances (145,409) (42,814) 22,349 (165,874)
Fund balances, beginning of year 1,037,415 70,704 342,670 1,450,789
Fund balances, end of year $ 892,006 27,890 365,019 1,284,915
NONMAJOR GOVERNMENTAL FUNDS
SPECIAL REVENUE FUNDS
Special revenue funds account for specific resources, the expenditure of which is restricted by law or administrative action for particular purposes.
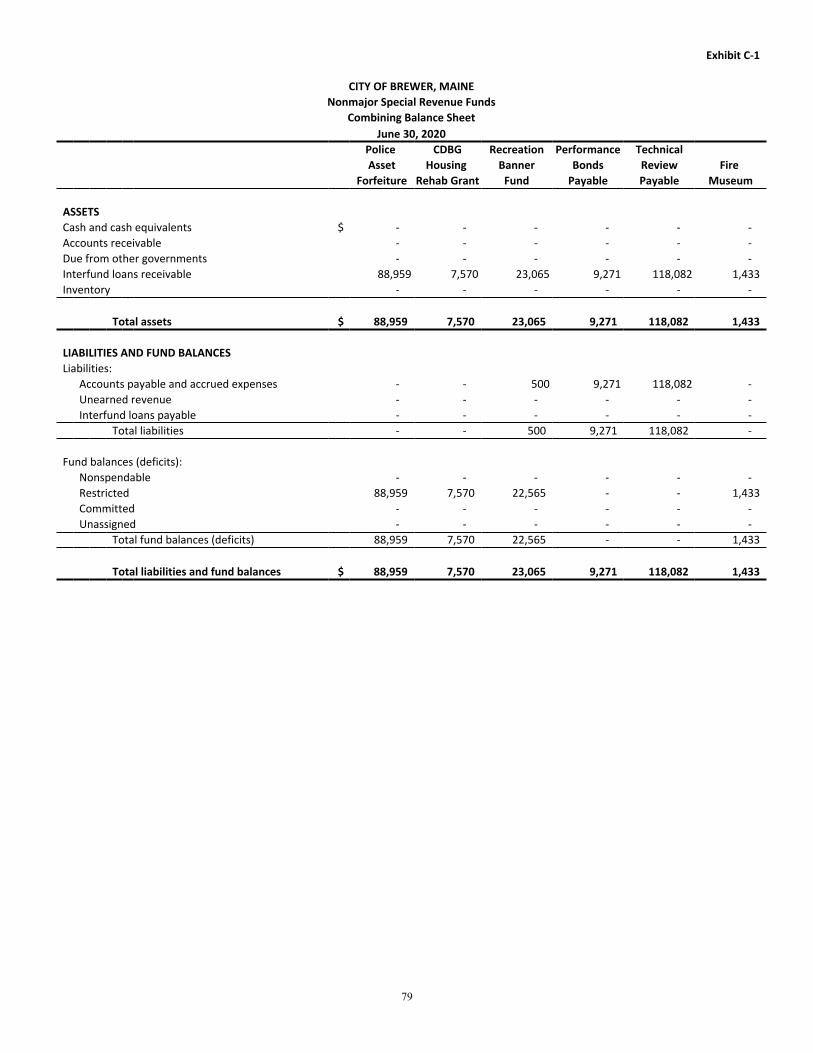
79
Exhibit C-1
CITY OF BREWER, MAINENonmajor Special Revenue Funds
Combining Balance SheetJune 30, 2020
Police CDBG Recreation Performance TechnicalAsset Housing Banner Bonds Review Fire
Forfeiture Rehab Grant Fund Payable Payable Museum
ASSETSCash and cash equivalents $ - - - - - - Accounts receivable - - - - - - Due from other governments - - - - - - Interfund loans receivable 88,959 7,570 23,065 9,271 118,082 1,433Inventory - - - - - -
Total assets $ 88,959 7,570 23,065 9,271 118,082 1,433
LIABILITIES AND FUND BALANCESLiabilities:
Accounts payable and accrued expenses - - 500 9,271 118,082 - Unearned revenue - - - - - - Interfund loans payable - - - - - -
Total liabilities - - 500 9,271 118,082 -
Fund balances (deficits):Nonspendable - - - - - - Restricted 88,959 7,570 22,565 - - 1,433Committed - - - - - - Unassigned - - - - - -
Total fund balances (deficits) 88,959 7,570 22,565 - - 1,433
Total liabilities and fund balances $ 88,959 7,570 23,065 9,271 118,082 1,433
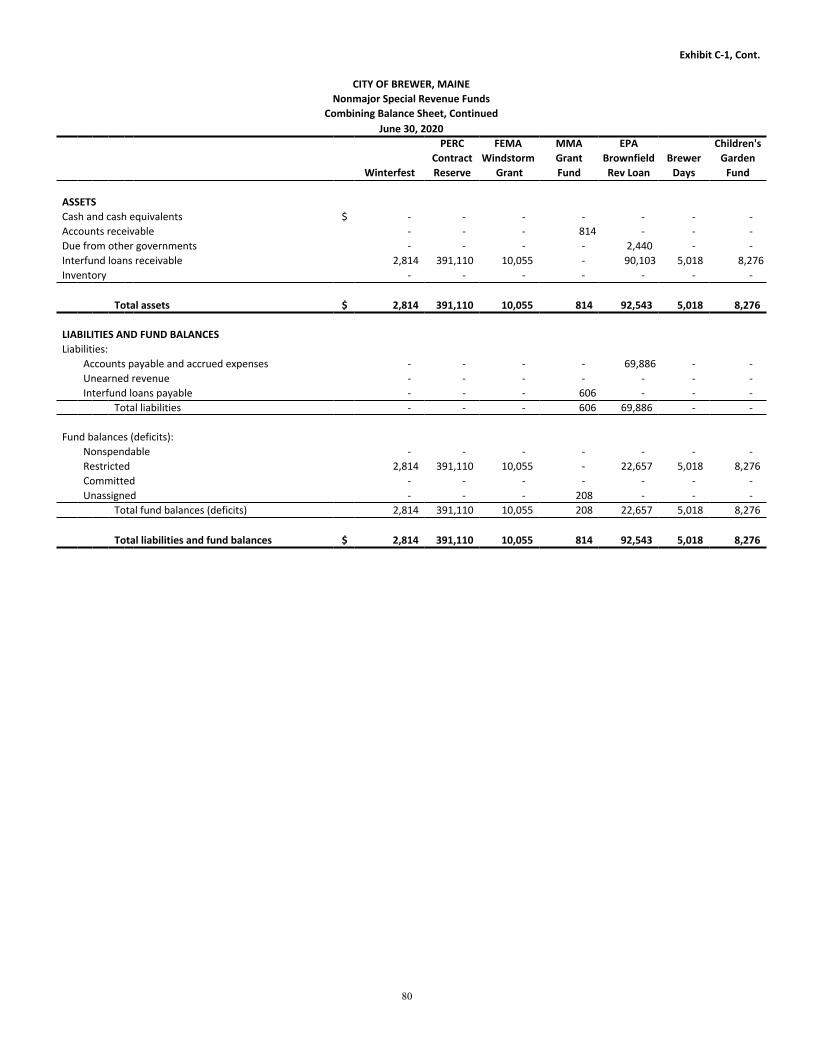
80
Exhibit C-1, Cont.
CITY OF BREWER, MAINENonmajor Special Revenue Funds
Combining Balance Sheet, ContinuedJune 30, 2020
PERC FEMA MMA EPA Children'sContract Windstorm Grant Brownfield Brewer Garden
Winterfest Reserve Grant Fund Rev Loan Days Fund
ASSETSCash and cash equivalents $ - - - - - - - Accounts receivable - - - 814 - - - Due from other governments - - - - 2,440 - - Interfund loans receivable 2,814 391,110 10,055 - 90,103 5,018 8,276Inventory - - - - - - -
Total assets $ 2,814 391,110 10,055 814 92,543 5,018 8,276
LIABILITIES AND FUND BALANCESLiabilities:
Accounts payable and accrued expenses - - - - 69,886 - - Unearned revenue - - - - - - - Interfund loans payable - - - 606 - - -
Total liabilities - - - 606 69,886 - -
Fund balances (deficits):Nonspendable - - - - - - - Restricted 2,814 391,110 10,055 - 22,657 5,018 8,276Committed - - - - - - - Unassigned - - - 208 - - -
Total fund balances (deficits) 2,814 391,110 10,055 208 22,657 5,018 8,276
Total liabilities and fund balances $ 2,814 391,110 10,055 814 92,543 5,018 8,276

81
Exhibit C-1, Cont.
CITY OF BREWER, MAINENonmajor Special Revenue Funds
Combining Balance Sheet, ContinuedJune 30, 2020
City Small Chamberlain Flags PoliceGrants and Golf Computer Stream In Recognition AcademyPrograms Classic Reserve Cleanup Brewer Coins Buyout
ASSETSCash and cash equivalents $ - - - - - - - Accounts receivable 6,313 - - - - - - Due from other governments - - - - - - - Interfund loans receivable 7,331 - 5,000 2,845 - 224 10,000Inventory - - - - - - -
Total assets $ 13,644 - 5,000 2,845 - 224 10,000
LIABILITIES AND FUND BALANCESLiabilities:
Accounts payable and accrued expenses 52 - - - - - - Unearned revenue - - - - - - - Interfund loans payable - 40 - - 982 - -
Total liabilities 52 40 - - 982 - -
Fund balances (deficits):Nonspendable - - - - - - - Restricted 13,592 - - 2,845 - - - Committed - - 5,000 - - 224 10,000Unassigned - (40) - - (982) - -
Total fund balances (deficits) 13,592 (40) 5,000 2,845 (982) 224 10,000
Total liabilities and fund balances $ 13,644 - 5,000 2,845 - 224 10,000
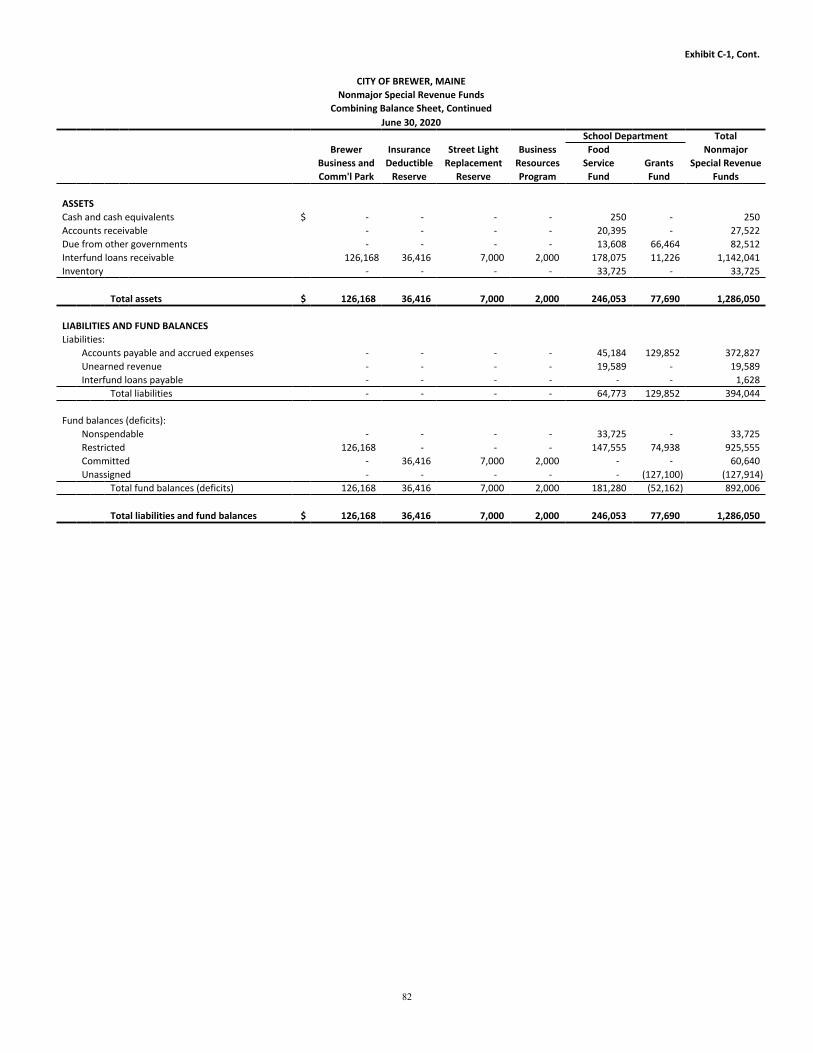
82
Exhibit C-1, Cont.
CITY OF BREWER, MAINENonmajor Special Revenue Funds
Combining Balance Sheet, ContinuedJune 30, 2020
School Department TotalBrewer Insurance Street Light Business Food Nonmajor
Business and Deductible Replacement Resources Service Grants Special RevenueComm'l Park Reserve Reserve Program Fund Fund Funds
ASSETSCash and cash equivalents $ - - - - 250 - 250Accounts receivable - - - - 20,395 - 27,522Due from other governments - - - - 13,608 66,464 82,512Interfund loans receivable 126,168 36,416 7,000 2,000 178,075 11,226 1,142,041Inventory - - - - 33,725 - 33,725
Total assets $ 126,168 36,416 7,000 2,000 246,053 77,690 1,286,050
LIABILITIES AND FUND BALANCESLiabilities:
Accounts payable and accrued expenses - - - - 45,184 129,852 372,827Unearned revenue - - - - 19,589 - 19,589Interfund loans payable - - - - - - 1,628
Total liabilities - - - - 64,773 129,852 394,044
Fund balances (deficits):Nonspendable - - - - 33,725 - 33,725Restricted 126,168 - - - 147,555 74,938 925,555Committed - 36,416 7,000 2,000 - - 60,640Unassigned - - - - - (127,100) (127,914)
Total fund balances (deficits) 126,168 36,416 7,000 2,000 181,280 (52,162) 892,006
Total liabilities and fund balances $ 126,168 36,416 7,000 2,000 246,053 77,690 1,286,050

83
Exhibit C-2
CITY OF BREWER, MAINENonmajor Special Revenue Funds
Combining Statement of Revenues, Expenditures and Changes in Fund BalancesFor the year ended June 30, 2020
Police CDBG Recreation Performance TechnicalAsset Housing Banner Bonds Review Fire
Forfeiture Rehab Grant Fund Payable Payable Museum
Revenues:Intergovernmental $ 63,408 - - - - - Lunch program - - - - - - Other income - - 4700 - - -
Total revenues 63,408 - 4700 - - -
Expenditures:Protection 27,444 - - - - - Public services - 24,062 - - - - Educational programs - - - - - - Unclassified - - 156 - - -
Total expenditures 27,444 24,062 156 - - -
Other financing sources (uses):Transfers in - - - - - -
Other financing sources (uses) - - - - - -
Net change in fund balances 35,964 (24,062) 4544 - - -
Fund balances (deficits), beginning of year 52,995 31,632 18021 - - 1,433
Fund balances (deficits), end of year $ 88,959 7,570 22565 - - 1,433
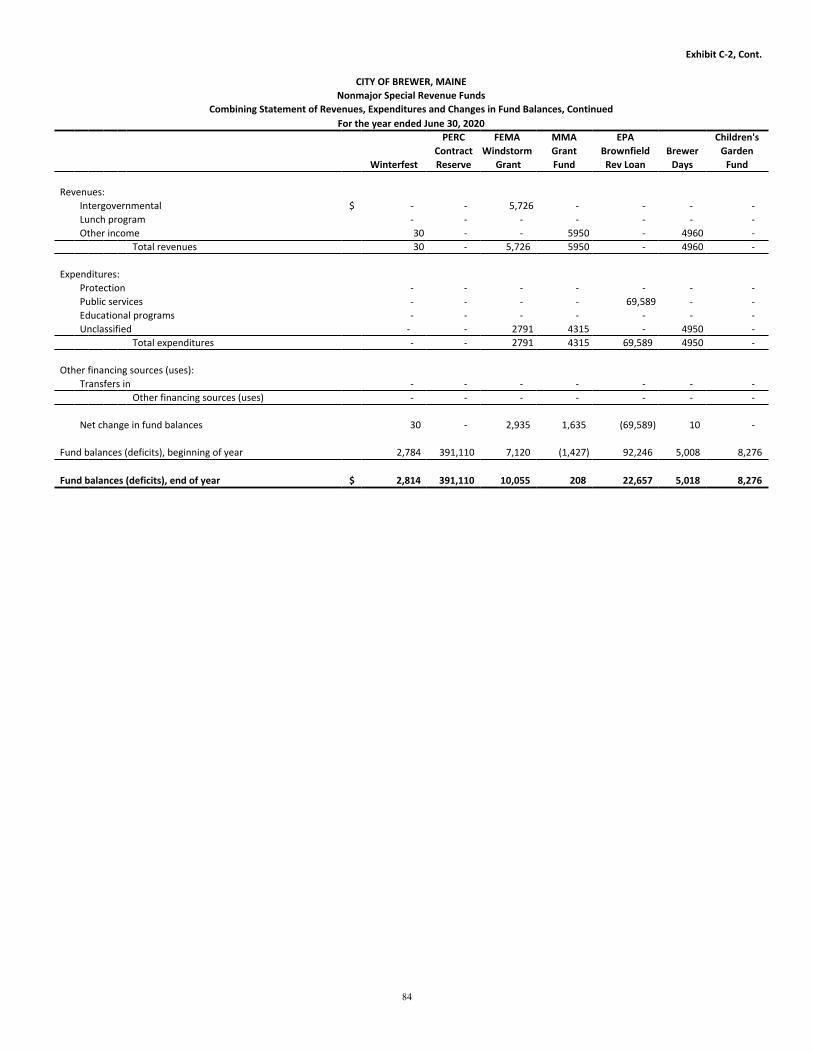
84
Exhibit C-2, Cont.
CITY OF BREWER, MAINENonmajor Special Revenue Funds
Combining Statement of Revenues, Expenditures and Changes in Fund Balances, ContinuedFor the year ended June 30, 2020
PERC FEMA MMA EPA Children'sContract Windstorm Grant Brownfield Brewer Garden
Winterfest Reserve Grant Fund Rev Loan Days Fund
Revenues:Intergovernmental $ - - 5,726 - - - - Lunch program - - - - - - - Other income 30 - - 5950 - 4960 -
Total revenues 30 - 5,726 5950 - 4960 -
Expenditures:Protection - - - - - - - Public services - - - - 69,589 - - Educational programs - - - - - - - Unclassified - - 2791 4315 - 4950 -
Total expenditures - - 2791 4315 69,589 4950 -
Other financing sources (uses):Transfers in - - - - - - -
Other financing sources (uses) - - - - - - -
Net change in fund balances 30 - 2,935 1,635 (69,589) 10 -
Fund balances (deficits), beginning of year 2,784 391,110 7,120 (1,427) 92,246 5,008 8,276
Fund balances (deficits), end of year $ 2,814 391,110 10,055 208 22,657 5,018 8,276
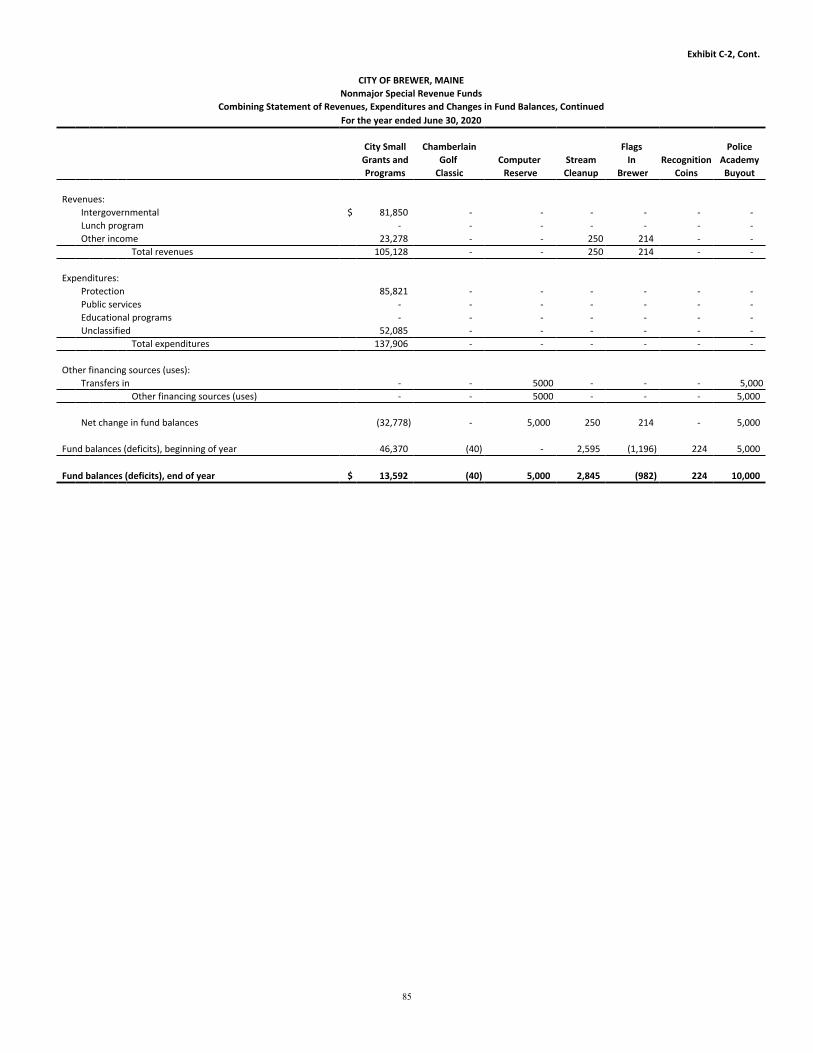
85
Exhibit C-2, Cont.
CITY OF BREWER, MAINENonmajor Special Revenue Funds
Combining Statement of Revenues, Expenditures and Changes in Fund Balances, ContinuedFor the year ended June 30, 2020
City Small Chamberlain Flags PoliceGrants and Golf Computer Stream In Recognition AcademyPrograms Classic Reserve Cleanup Brewer Coins Buyout
Revenues:Intergovernmental $ 81,850 - - - - - - Lunch program - - - - - - - Other income 23,278 - - 250 214 - -
Total revenues 105,128 - - 250 214 - -
Expenditures:Protection 85,821 - - - - - - Public services - - - - - - - Educational programs - - - - - - - Unclassified 52,085 - - - - - -
Total expenditures 137,906 - - - - - -
Other financing sources (uses):Transfers in - - 5000 - - - 5,000
Other financing sources (uses) - - 5000 - - - 5,000
Net change in fund balances (32,778) - 5,000 250 214 - 5,000
Fund balances (deficits), beginning of year 46,370 (40) - 2,595 (1,196) 224 5,000
Fund balances (deficits), end of year $ 13,592 (40) 5,000 2,845 (982) 224 10,000
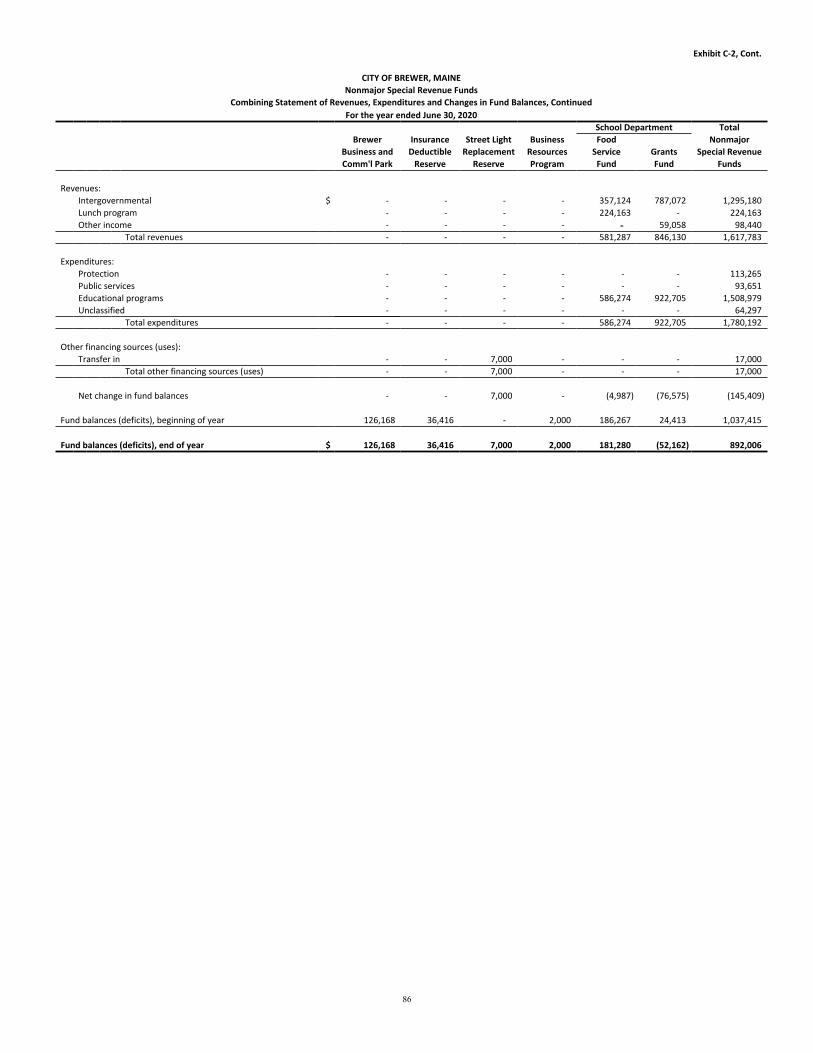
86
Exhibit C-2, Cont.
CITY OF BREWER, MAINENonmajor Special Revenue Funds
Combining Statement of Revenues, Expenditures and Changes in Fund Balances, ContinuedFor the year ended June 30, 2020
School Department TotalBrewer Insurance Street Light Business Food Nonmajor
Business and Deductible Replacement Resources Service Grants Special RevenueComm'l Park Reserve Reserve Program Fund Fund Funds
Revenues:Intergovernmental $ - - - - 357,124 787,072 1,295,180Lunch program - - - - 224,163 - 224,163Other income - - - - - 59,058 98,440
Total revenues - - - - 581,287 846,130 1,617,783
Expenditures:Protection - - - - - - 113,265Public services - - - - - - 93,651Educational programs - - - - 586,274 922,705 1,508,979Unclassified - - - - - - 64,297
Total expenditures - - - - 586,274 922,705 1,780,192
Other financing sources (uses):Transfer in - - 7,000 - - - 17,000
Total other financing sources (uses) - - 7,000 - - - 17,000
Net change in fund balances - - 7,000 - (4,987) (76,575) (145,409)
Fund balances (deficits), beginning of year 126,168 36,416 - 2,000 186,267 24,413 1,037,415
Fund balances (deficits), end of year $ 126,168 36,416 7,000 2,000 181,280 (52,162) 892,006

87
Exhibit C-3
CITY OF BREWER, MAINECity Small Grants and Programs
Statement of Revenues, Expenditures and Changes in Fund BalancesFor the year ended June 30, 2020
Fund balances Revenues Fund balancesbeginning of Other end of
year Intergovernmental miscellaneous Expenditures year
Economic Development:CDBG waltzing matilda grant $ - 50,000 - 50,000 -
Public Safety:Police canine program 1,962 - - - 1,962Safe medicine return box 50 - - - 50MEMA MACTAC equipment and training 3,534 - - - 3,534USDOJ BJA bulletproof vest partnership program - 2,467 2,449 4,916 - Gero vest carrier grant 490 - - - 490Public safety hosted training 3,722 - 10,250 12,719 1,253Body camera grant 5,834 - - 5,834 - Byrne/Jag 2017 grant - 7,866 834 8,700 - FY20 Walmart grant - - 5,000 - 5,000FY19 King Foundation Grant - Turnout Gear 30,000 - - 30,000 - FY19 FEMA afg hoses - 17,371- 761 18,132 - FY20 DHS grant - stabilizers - 2,340- - 2,340 - FY20 ME Forest Service - wld equipment - 1,506- 1,674 3,180 -
Library: Bangor health & wellness grant 314 - - - 314Brewer kiwanis grant 186 - - - 186Rudman book club 260 - 749 524 485ME history records grant 12 - - - 12Greendrinks bike rack grant - - - 1,561 1,561 - ME Arts Commission bicentennial - 300- - - 300In Memoriam Bettie Ann Lawrence 6 - - - 6
Totals $ 46,370 81,850- 23,278 137,906 13,592
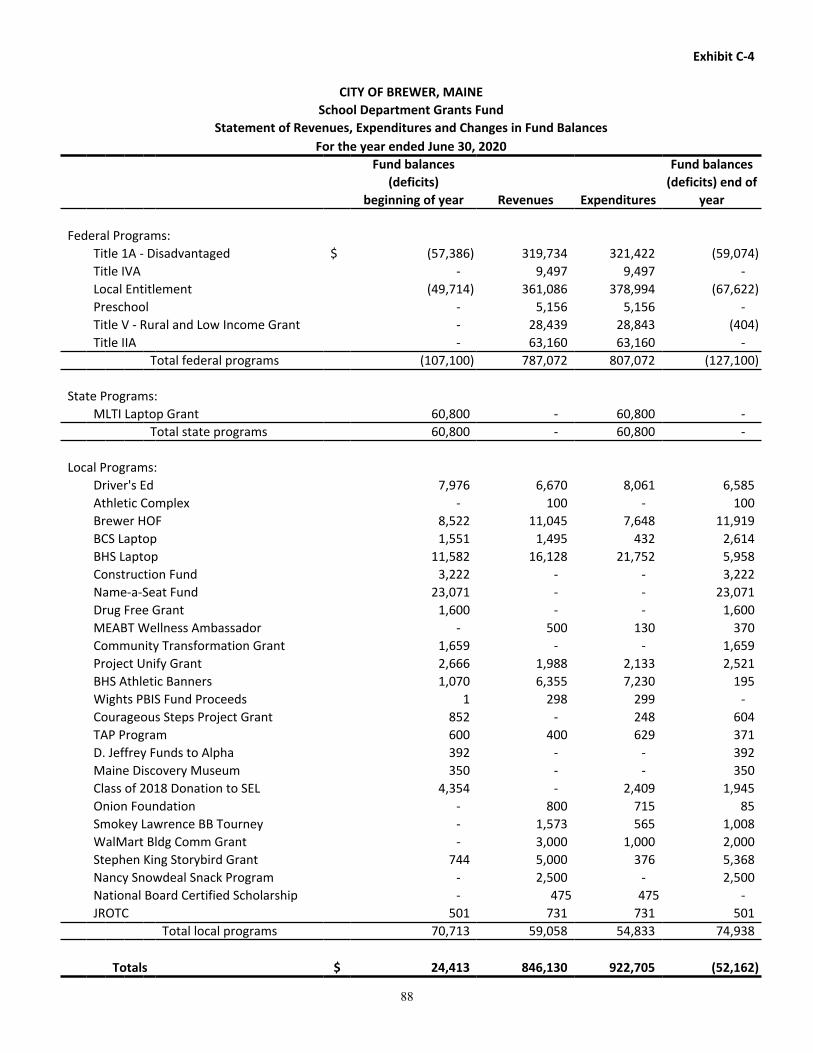
88
Exhibit C-4
CITY OF BREWER, MAINESchool Department Grants Fund
Statement of Revenues, Expenditures and Changes in Fund BalancesFor the year ended June 30, 2020
Fund balances Fund balances(deficits) (deficits) end of
beginning of year Revenues Expenditures year
Federal Programs:Title 1A - Disadvantaged $ (57,386) 319,734 321,422 (59,074)Title IVA - 9,497 9,497 - Local Entitlement (49,714) 361,086 378,994 (67,622)Preschool - 5,156 5,156 - Title V - Rural and Low Income Grant - 28,439 28,843 (404)Title IIA - 63,160 63,160 -
Total federal programs (107,100) 787,072 807,072 (127,100)
State Programs:MLTI Laptop Grant 60,800 - 60,800 -
Total state programs 60,800 - 60,800 -
Local Programs:Driver's Ed 7,976 6,670 8,061 6,585Athletic Complex - 100 - 100Brewer HOF 8,522 11,045 7,648 11,919BCS Laptop 1,551 1,495 432 2,614BHS Laptop 11,582 16,128 21,752 5,958Construction Fund 3,222 - - 3,222Name-a-Seat Fund 23,071 - - 23,071Drug Free Grant 1,600 - - 1,600MEABT Wellness Ambassador - 500 130 370Community Transformation Grant 1,659 - - 1,659Project Unify Grant 2,666 1,988 2,133 2,521BHS Athletic Banners 1,070 6,355 7,230 195Wights PBIS Fund Proceeds 1 298 299 - Courageous Steps Project Grant 852 - 248 604TAP Program 600 400 629 371D. Jeffrey Funds to Alpha 392 - - 392Maine Discovery Museum 350 - - 350Class of 2018 Donation to SEL 4,354 - 2,409 1,945Onion Foundation - 800 715 85Smokey Lawrence BB Tourney - 1,573 565 1,008WalMart Bldg Comm Grant - 3,000 1,000 2,000Stephen King Storybird Grant 744 5,000 376 5,368Nancy Snowdeal Snack Program - 2,500 - 2,500National Board Certified Scholarship - 475 475 - JROTC 501 731 731 501
Total local programs 70,713 59,058 54,833 74,938
Totals $ 24,413 846,130 922,705 (52,162)

NONMAJOR GOVERNMENTAL FUNDS
CAPITAL PROJECT FUNDS
Capital project funds are established to account for resources obtained and expended for the acquisition of major capital facilities other than those employed in the delivery of services accounted for in enterprise funds.
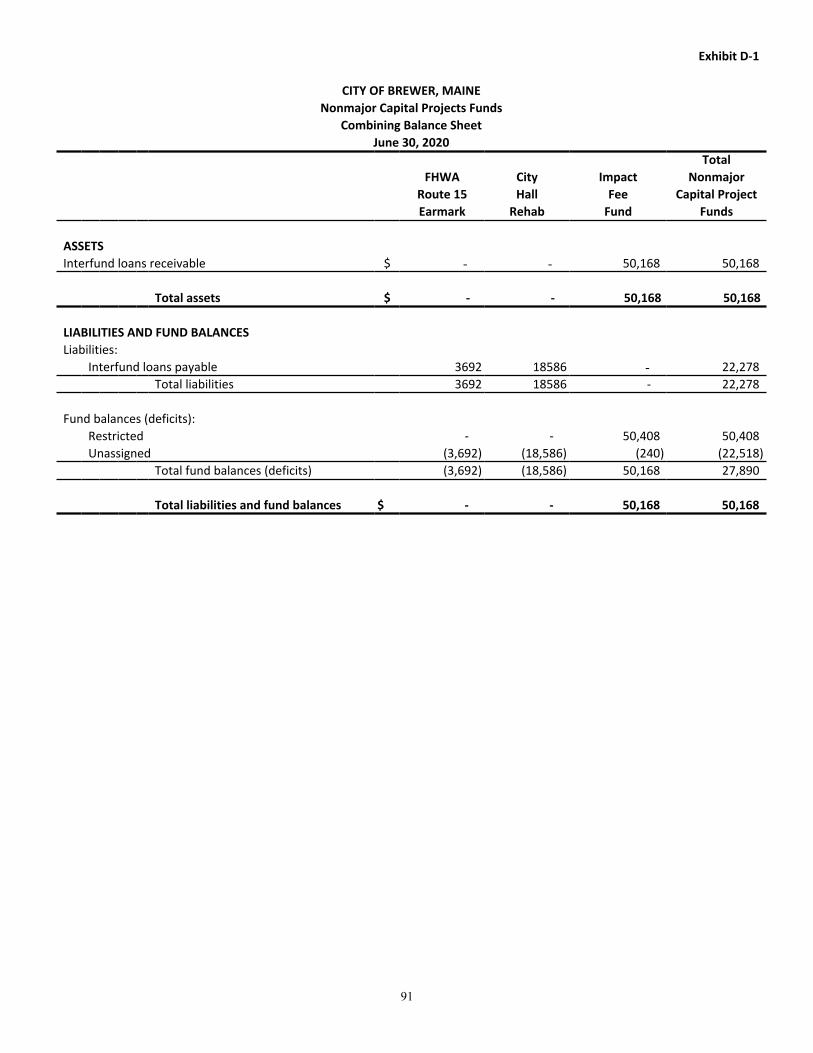
91
Exhibit D-1
CITY OF BREWER, MAINENonmajor Capital Projects Funds
Combining Balance SheetJune 30, 2020
TotalFHWA City Impact Nonmajor
Route 15 Hall Fee Capital ProjectEarmark Rehab Fund Funds
ASSETSInterfund loans receivable $ - - 50,168 50,168
Total assets $ - - 50,168 50,168
LIABILITIES AND FUND BALANCESLiabilities:
Interfund loans payable 3692 18586 - 22,278Total liabilities 3692 18586 - 22,278
Fund balances (deficits):Restricted - - 50,408 50,408Unassigned (3,692) (18,586) (240) (22,518)
Total fund balances (deficits) (3,692) (18,586) 50,168 27,890
Total liabilities and fund balances $ - - 50,168 50,168

92
Exhibit D-2
CITY OF BREWER, MAINENonmajor Capital Projects Funds
Combining Statement of Revenues, Expenditures and Changes in Fund BalancesFor the year ended June 30, 2020
TotalFHWA City Impact Nonmajor
Route 15 Hall Fee Capital ProjectEarmark Rehab Fund Funds
Revenues:Local sources $ - - 69,940 69,940
Total revenues - - 69,940 69,940
Expenditures:Capital outlay - - 99,495 99,495
Total expenditures - - 99,495 99,495
Excess (deficiency) of revenues over (under) expenditures - - (29,555) (29,555)
Other financing sources (uses):Transfer to general fund - - (13,259) (13,259)
Total other financing sources (uses) - - (13,259) (13,259)
Net change in fund balances - - (42,814) (42,814)
Fund balances (deficits), beginning of year (3,692) (18,586) 92,982 70,704
Fund balances (deficits), end of year $ (3,692) (18,586) 50,168 27,890
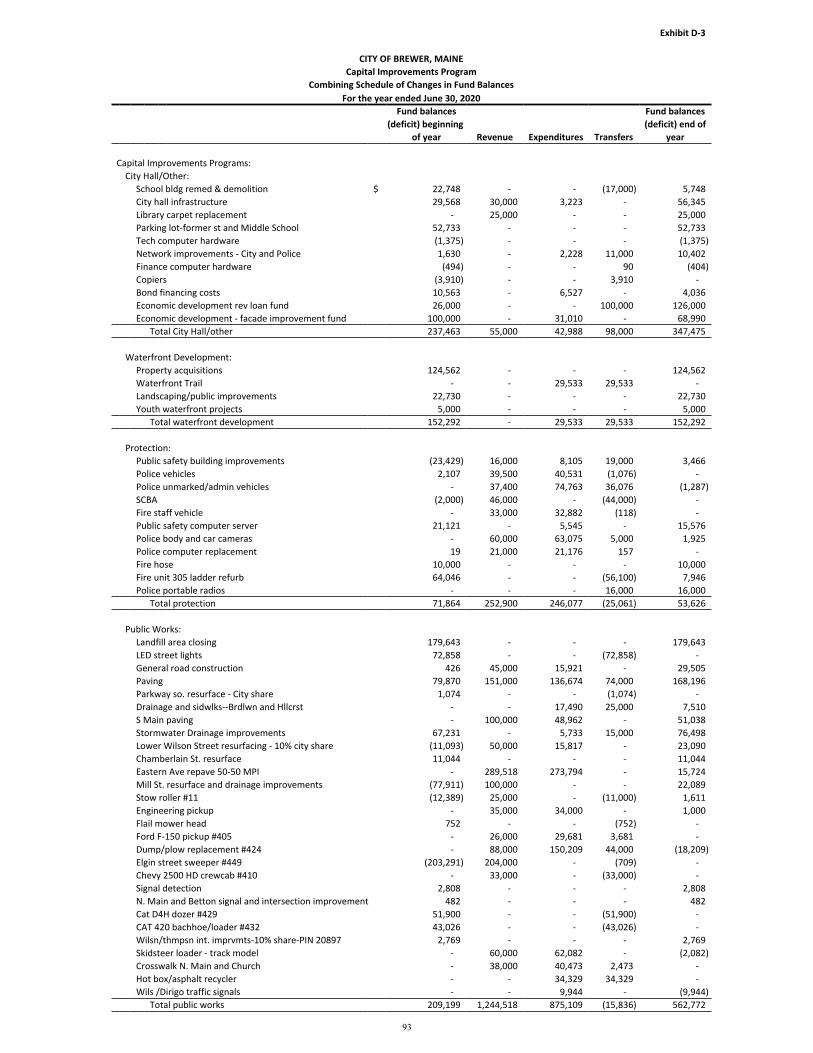
93
Exhibit D-3
CITY OF BREWER, MAINECapital Improvements Program
Combining Schedule of Changes in Fund BalancesFor the year ended June 30, 2020
Fund balances Fund balances(deficit) beginning (deficit) end of
of year Revenue Expenditures Transfers year
Capital Improvements Programs:City Hall/Other:
School bldg remed & demolition $ 22,748 - - (17,000) 5,748City hall infrastructure 29,568 30,000 3,223 - 56,345Library carpet replacement - 25,000 - - 25,000Parking lot-former st and Middle School 52,733 - - - 52,733Tech computer hardware (1,375) - - - (1,375)Network improvements - City and Police 1,630 - 2,228 11,000 10,402Finance computer hardware (494) - - 90 (404)Copiers (3,910) - - 3,910 - Bond financing costs 10,563 - 6,527 - 4,036Economic development rev loan fund 26,000 - - 100,000 126,000Economic development - facade improvement fund 100,000 - 31,010 - 68,990
Total City Hall/other 237,463 55,000 42,988 98,000 347,475
Waterfront Development:Property acquisitions 124,562 - - - 124,562Waterfront Trail - - 29,533 29,533 - Landscaping/public improvements 22,730 - - - 22,730Youth waterfront projects 5,000 - - - 5,000
Total waterfront development 152,292 - 29,533 29,533 152,292
Protection:Public safety building improvements (23,429) 16,000 8,105 19,000 3,466Police vehicles 2,107 39,500 40,531 (1,076) - Police unmarked/admin vehicles - 37,400 74,763 36,076 (1,287)SCBA (2,000) 46,000 - (44,000) - Fire staff vehicle - 33,000 32,882 (118) -Public safety computer server 21,121 - 5,545 - 15,576Police body and car cameras - 60,000 63,075 5,000 1,925Police computer replacement 19 21,000 21,176 157 -Fire hose 10,000 - - - 10,000Fire unit 305 ladder refurb 64,046 - - (56,100) 7,946Police portable radios - - - 16,000 16,000
Total protection 71,864 252,900 246,077 (25,061) 53,626
Public Works:Landfill area closing 179,643 - - - 179,643LED street lights 72,858 - - (72,858) - General road construction 426 45,000 15,921 - 29,505Paving 79,870 151,000 136,674 74,000 168,196Parkway so. resurface - City share 1,074 - - (1,074) - Drainage and sidwlks--Brdlwn and Hllcrst - - 17,490 25,000 7,510S Main paving - 100,000 48,962 - 51,038Stormwater Drainage improvements 67,231 - 5,733 15,000 76,498Lower Wilson Street resurfacing - 10% city share (11,093) 50,000 15,817 - 23,090Chamberlain St. resurface 11,044 - - - 11,044Eastern Ave repave 50-50 MPI - 289,518 273,794 - 15,724Mill St. resurface and drainage improvements (77,911) 100,000 - - 22,089Stow roller #11 (12,389) 25,000 - (11,000) 1,611Engineering pickup - 35,000 34,000 - 1,000Flail mower head 752 - - (752) -Ford F-150 pickup #405 - 26,000 29,681 3,681 - Dump/plow replacement #424 - 88,000 150,209 44,000 (18,209)Elgin street sweeper #449 (203,291) 204,000 - (709) - Chevy 2500 HD crewcab #410 - 33,000 - (33,000) - Signal detection 2,808 - - - 2,808N. Main and Betton signal and intersection improvement 482 - - - 482Cat D4H dozer #429 51,900 - - (51,900) - CAT 420 bachhoe/loader #432 43,026 - - (43,026) - Wilsn/thmpsn int. imprvmts-10% share-PIN 20897 2,769 - - - 2,769Skidsteer loader - track model - 60,000 62,082 - (2,082)Crosswalk N. Main and Church - 38,000 40,473 2,473 - Hot box/asphalt recycler - - 34,329 34,329 - Wils /Dirigo traffic signals - - 9,944 - (9,944)
Total public works 209,199 1,244,518 875,109 (15,836) 562,772
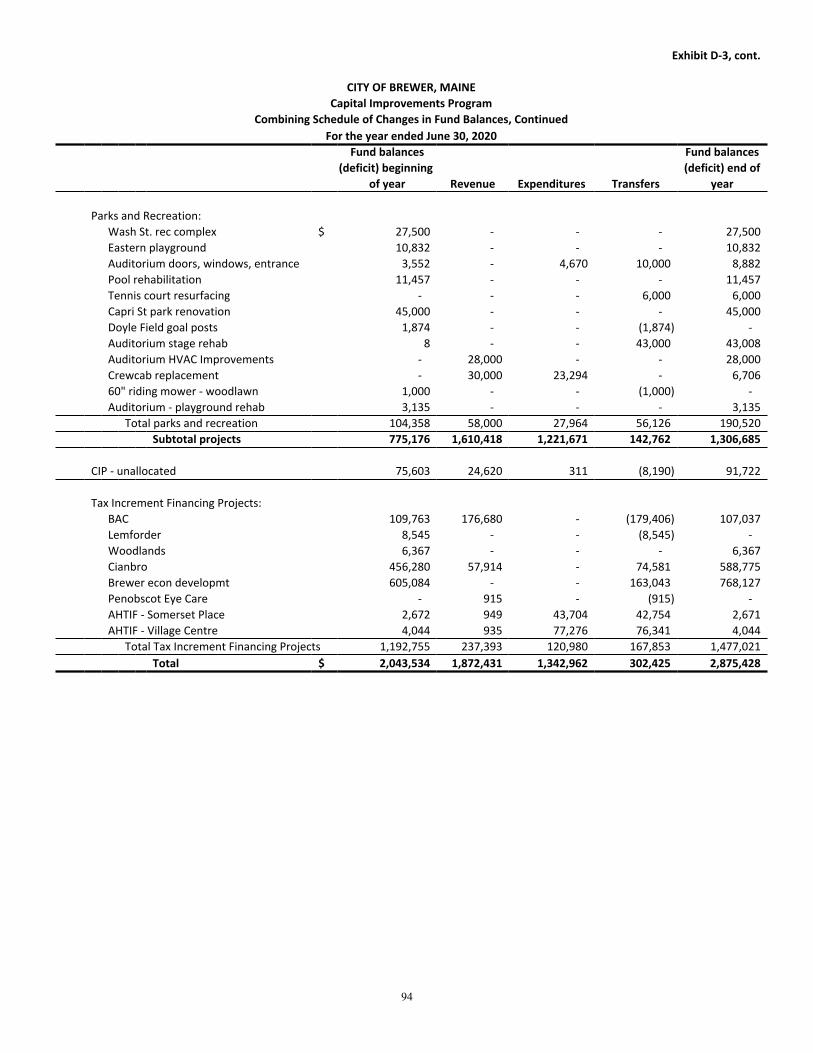
94
Exhibit D-3, cont.
CITY OF BREWER, MAINECapital Improvements Program
Combining Schedule of Changes in Fund Balances, ContinuedFor the year ended June 30, 2020
Fund balances Fund balances(deficit) beginning (deficit) end of
of year Revenue Expenditures Transfers year
Parks and Recreation:Wash St. rec complex $ 27,500 - - - 27,500Eastern playground 10,832 - - - 10,832Auditorium doors, windows, entrance 3,552 - 4,670 10,000 8,882Pool rehabilitation 11,457 - - - 11,457Tennis court resurfacing - - - 6,000 6,000Capri St park renovation 45,000 - - - 45,000Doyle Field goal posts 1,874 - - (1,874) - Auditorium stage rehab 8 - - 43,000 43,008Auditorium HVAC Improvements - 28,000 - - 28,000Crewcab replacement - 30,000 23,294 - 6,70660" riding mower - woodlawn 1,000 - - (1,000) - Auditorium - playground rehab 3,135 - - - 3,135
Total parks and recreation 104,358 58,000 27,964 56,126 190,520Subtotal projects 775,176 1,610,418 1,221,671 142,762 1,306,685
CIP - unallocated 75,603 24,620 311 (8,190) 91,722
Tax Increment Financing Projects:BAC 109,763 176,680 - (179,406) 107,037Lemforder 8,545 - - (8,545) - Woodlands 6,367 - - - 6,367Cianbro 456,280 57,914 - 74,581 588,775Brewer econ developmt 605,084 - - 163,043 768,127Penobscot Eye Care - 915 - (915) - AHTIF - Somerset Place 2,672 949 43,704 42,754 2,671AHTIF - Village Centre 4,044 935 77,276 76,341 4,044
Total Tax Increment Financing Projects 1,192,755 237,393 120,980 167,853 1,477,021Total $ 2,043,534 1,872,431 1,342,962 302,425 2,875,428

95
Exhibit D-4
CITY OF BREWER, MAINEImpact Fee Fund
Combing Schedule of Changes in Fund BalancesFor the year ended June 30, 2020
Fund balances Fund balances(deficit) beginning (deficit) end of
of year Revenue Expenditures Transfers year
Impact Fee Projects:Parallel Road $ 3,815 10,062 - (2,336) 11,541Signal Coordination 6,401 10,062 - (3,228) 13,235Signal Preemption 7,781 - - (202) 7,579Pierce Road relocation and signal 3,377 - - (3,375) 2Wilson/Parkway South intersection 2,330 - - (2,330) - State and Washington intersection 450 - 450 - - City transit bus 62,288 41,898 91,249 - 12,937Set up and administrative costs 4,429 2,473 - (1,788) 5,114Sewer 2,111 5,445 7,796 - (240)
Total impact fee projects $ 92,982 69,940 99,495 (13,259) 50,168

NONMAJOR GOVERNMENTAL FUNDS
PERMANENT FUNDS

99
Exhibit E-1
CITY OF BREWER, MAINENonmajor Permanent Funds
Combining Balance SheetJune 30, 2020
Woodlawn TotalElsie Ministerial Jefferds Wallace Revolving Nonmajor
Cemetery Olmstead and School Educational Witham Cemetery PermanentTrust Library Funds Fund Fund Fund Funds
ASSETSCash and cash equivalents $ 79,611 - - - - - 79,611Investments 362,647 5,881 1,084 5,028 337 6,848 381,825
Total assets $ 442,258 5,881 1,084 5,028 337 6,848 461,436
LIABILITIES AND FUND BALANCESLiabilities:
Interfund loans payable 96404 13 - - - - 96,417Total liabilities 96404 13 - - - - 96,417
Fund balances:Nonspendable 311,881 4,538 939 4,533 275 2,387 324,553Restricted 33,973 1,330 145 495 62 4,461 40,466
Total fund balances 345,854 5,868 1,084 5,028 337 6,848 365,019
Total liabilities and fund balances $ 442,258 5,881 1,084 5,028 337 6,848 461,436
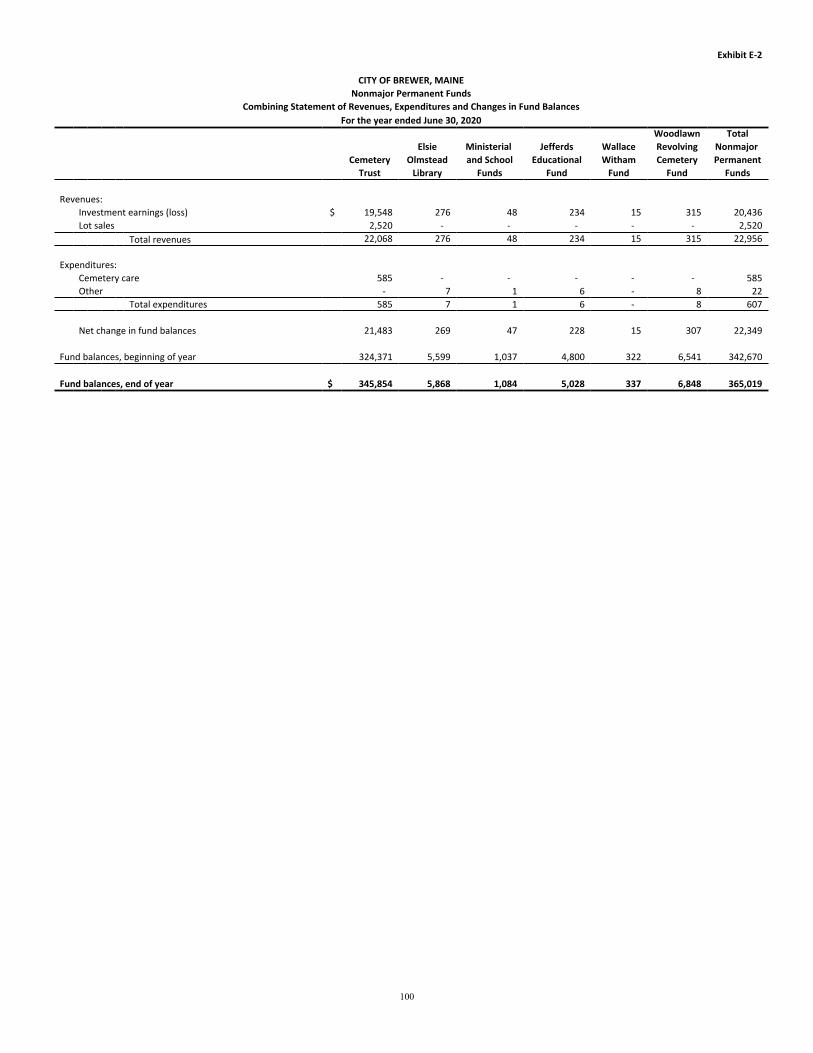
100
Exhibit E-2
CITY OF BREWER, MAINENonmajor Permanent Funds
Combining Statement of Revenues, Expenditures and Changes in Fund BalancesFor the year ended June 30, 2020
Woodlawn TotalElsie Ministerial Jefferds Wallace Revolving Nonmajor
Cemetery Olmstead and School Educational Witham Cemetery PermanentTrust Library Funds Fund Fund Fund Funds
Revenues:Investment earnings (loss) $ 19,548 276 48 234 15 315 20,436Lot sales 2,520 - - - - - 2,520
Total revenues 22,068 276 48 234 15 315 22,956
Expenditures:Cemetery care 585 - - - - - 585Other - 7 1 6 - 8 22
Total expenditures 585 7 1 6 - 8 607
Net change in fund balances 21,483 269 47 228 15 307 22,349
Fund balances, beginning of year 324,371 5,599 1,037 4,800 322 6,541 342,670
Fund balances, end of year $ 345,854 5,868 1,084 5,028 337 6,848 365,019

AGENCY FUNDS
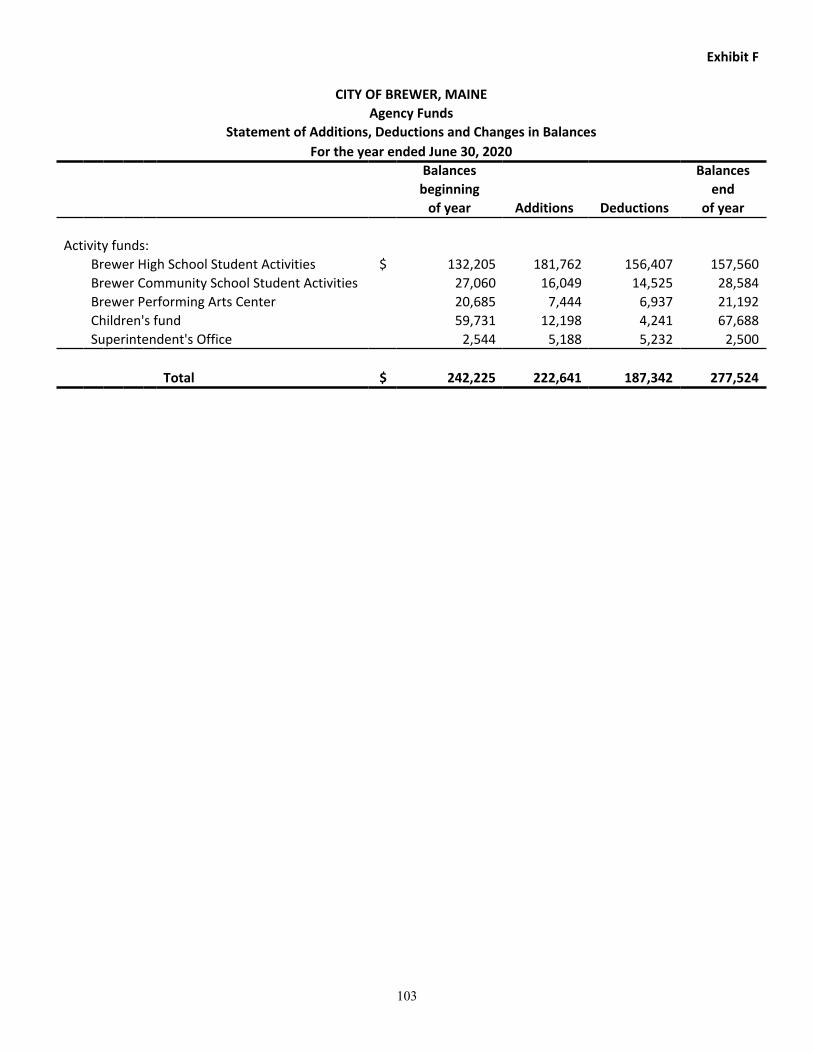
103
Exhibit F
CITY OF BREWER, MAINEAgency Funds
Statement of Additions, Deductions and Changes in BalancesFor the year ended June 30, 2020
Balances Balancesbeginning end
of year Additions Deductions of year
Activity funds:Brewer High School Student Activities $ 132,205 181,762 156,407 157,560Brewer Community School Student Activities 27,060 16,049 14,525 28,584Brewer Performing Arts Center 20,685 7,444 6,937 21,192Children's fund 59,731 12,198 4,241 67,688Superintendent's Office 2,544 5,188 5,232 2,500
Total $ 242,225 222,641 187,342 277,524

SCHEDULE

107
Schedule 1
CITY OF BREWER, MAINEBrewer School Department - General Fund
Schedule of Revenues, Expenditures and Changes in Fund Balance -Budget and Actual - Budgetary Basis
For the year ended June 30, 2020(with comparative actual amounts for the year ended June 30, 2019)
2020Variancepositive 2019
Budget Actual (negative) Actual
Revenues:State education subsidy $ 11,501,521 11,530,172 28,651 10,964,623State agency clients - 12,643 12,643 14,175Mainecare reimbursement - 38,498 38,498 16,436District assessments 2,754,350 3,158,761 404,411 2,842,359Local sources 104,000 150,230 46,230 112,437
Total revenues 14,359,871 14,890,304 530,433 13,950,030
Expenditures:Current:
Regular instruction 9,240,520 8,789,073 451,447 8,668,900Special education instruction 4,314,962 3,875,183 439,779 3,861,833Other instruction 1,151,311 1,021,969 129,342 997,799Student and staff support 1,533,867 1,473,855 60,012 1,480,808System administration 551,215 522,054 29,161 566,431School administration 1,075,827 1,033,445 42,382 976,019Transportation and buses 592,100 524,538 67,562 542,801Facilities maintenance 2,023,441 1,857,826 165,615 1,788,888All other expenditures 7,893 4,822 3,071 9,736
Debt service and other commitments 3,006,658 2,996,579 10,079 2,662,326Total expenditures 23,497,794 22,099,344 1,398,450 21,555,541
Excess (deficiency) of revenues over (under) expenditures (9,137,923) (7,209,040) 1,928,883 (7,605,511)
Other financing sources (uses):City appropriation 7,878,714 7,878,714 - 7,669,309Budgeted use of fund balance 1,259,209 - (1,259,209) -
Total other financing sources (uses) 9,137,923 7,878,714 (1,259,209) 7,669,309
Net change in fund balances - budgetary basis - 669,674 669,674 63,798
Reconciliation to GAAP:Change in accrued summer salaries and benefits 39,711 (140,502)
Net change in fund balances - GAAP basis 709,385 (76,704)
Fund balance, beginning of year 127,277 203,981
Fund balance, end of year $ 836,662 127,277
111
CITY OF BREWEROperating Data
The City of Brewer, Maine (the “City”) was incorporated as a Town in 1812 and incorporated as a City in 1889. The City is located in southern Penobscot County, adjacent to Bangor, Maine, about 140 miles northeast of Portland, Maine and 250 miles northeast of Boston, Massachusetts. The 2010 U.S. Census population is 9,482.
GOVERNMENT
The City operates under a charter initially adopted on September 14, 1931, as amended most recently effective December 1, 2015 (the “Charter”). The Charter provides for a Council-Manager form of government with a five-member City Council, elected at-large for three-year staggered terms. The Council adopts an annual budget, provides for an annual audit, and has the ultimate policy and decision-making power in the City. The City Manager is the chief administrative officer of the City and is appointed by and reports solely to the City Council.
The Brewer public school system is administered by a five-member committee elected at large by the voters of Brewer for three-year staggered terms (the “School Committee”). The School Committee has the responsibility for school policy and hiring department employees, including the Superintendent. Final approval of the school budget lies with the City Council, subject to final budget ratification by the voters of the City. All public-school buildings operated by the City are owned by the City of Brewer High School District.
MUNICIPAL SERVICES
The City provides general governmental services for the territory within its boundaries, including police and fire protection, highways, streets and sidewalks, solid waste transfer, wastewater treatment, water service, social services, parks, recreation areas and a library. Public education is provided for grades pre-Kindergarten (“pre-K”) through 12 with a consolidated pre-K to grade 8 school, opened in 2011, and a high school.
Technology Department
The Brewer Technology Department is dedicated to providing reliable and secure access to information systems and computer technology to support the operations of all the City Departments. The Technology Department strives to provide quality customer service to all city staff and promotes the efficient use of technology through coordinated planning and acquisition of services, while staying current with technology applications and solutions. The Technology Department supports the computer and network needs of 100 plus users/workstations with multiple servers within the city departments. This department is continually expanding as more staff uses computers as a tool in their jobs and as more of their tools run with software and contact to the Internet.
The primary goal of the Technology Department is to ensure that the City computer network operates efficiently and effectively on a daily basis. The City encourages its employees to be independent and responsible users of technology.
The FY2020 priority was upgrading Windows7 computers to Windows10 software. Microsoft no longer supported Windows7 beyond January 2020. This was a very labor intense project. New body cam and cruiser surveillance video systems were installed for the Brewer Police Department.
FY2020 presented new challenges for the Technology Department with the Pandemic of COVID-19. Staff was setup to work remotely from home using the current equipment owned by the City. Payroll and Accounts Payables were processed remotely. Zoom was added to the City’s box of technology tools to enable staff to do public meetings.
112
Public Safety
The Police and Fire Departments are co-housed in a centrally located, state-of-the art-facility, constructed in 2008. In 2012, the City consolidated the leadership of these two departments under a single Public Safety Director. Two full time civilian employees are shared between the Police and Fire Departments. One part time position is available, but went unfilled in FY20.
In addition to the Public Safety Director (Police Chief), the Police Department is staffed by an additional twenty-two sworn officers and one part time civilian court officer. The Police Department roster includes a Deputy Police Chief, a Captain, three patrol sergeants, three corporals assigned to the patrol division, and an additional ten officers, two of whom are assigned as School Resource Officers during the School year. Three officers in total are also assigned to the Detective Division, two of which work at Brewer Police Department and the other is assigned to the Maine Drug Enforcement Agency. In addition to these budgeted positions, the department has two Special Officers that serve as on-call reserve officers.
The Fire Department is operated by the Deputy Fire Chief, two Captains, two Lieutenants, and thirteen full-time fire fighters. The department operates from a single fire station and maintains six vehicles. Through a partnership with Capital Ambulance, the station houses and helps staff an ambulance, which in turn generated $185,634 in FY20 revenue to the City, offsetting approximately 11.84% of the Fire Department’s total annual operating expenses.
The Public Safety roster also includes a contracted, part-time Animal Control Officer and a part-time Harbor Master.
Engineering Department
The Engineering Department provides professional design, project inspection, and other engineering services to various City Departments, including Public Works, Planning, Code, Water, and the Water Pollution Control Facility. The department is staffed with a City Engineer and an Engineering Project Manager, both licensed professional engineers.
Department of Parks & Recreation
The Parks and Recreation Department is comprised of four components: Auditorium, Parks & Cemeteries, Recreation, and Swimming Pool. The Parks and Recreation Department offers approximately 100 programs year-round, a community center that is open 100 hours a week during the cold weather months, and an eight-week swimming program. The department is responsible for mowing and maintaining over 75 acres of municipal and school property, including municipal parks. The department maintains six athletic fields, five playgrounds, along with numerous parks. It is also responsible for administration and care of three cemeteries. The department is staffed with a Director of Parks and Recreation, one Deputy Director of Parks & Recreation, one Parks/Cemetery Supervisor, one Parks/Cemetery Foreman, an After-School Program Coordinator, a Building Custodian, one Program/Facility Assistant, and an Office Manager. The Parks and Recreation Department hires from 50 to 60 part-time personnel throughout the year. The entire department was approximately 36% self-supporting in FY 2020, with the recreation division at almost 61%. This is down from 44% and for recreation division 76% in FY19, due to the coronavirus pandemic.
Brewer Public Library
The Brewer Public Library (the “Library”) was established in 1908. In 2007, the Library moved into a former school building down the street from City Hall. The Library, a department of the City, is governed by the City Council and the City Manager and is operated by a staff comprised of a full-time Library Director, a full-time Children's/Program Librarian, one part-time Cataloging Assistant, and one part-time Inter-Library-Loan Assistant.

113
Volunteers and on-call paid staff round out staffing needs. The City provided approximately $276,000 in FY2020 towards the Library’s operating budget. The Brewer Library Association (the “BLA”) is a private, nonprofit organization that maintains a Board of Trustees who oversee private trust funds that benefit the Library. The BLA typically contributes about $10,000 in funds and in-kind contributions to the Library each year for the purchase of major reference materials, furniture, and equipment.
The main portion of the Library houses the adult collection. The Library also houses important Joshua Chamberlain and City of Brewer memorabilia and primary documents in the Research Room and has children’s and young adult sections, with separate picture book and “story time” areas. The library also contains a meeting room with a 15-20-person capacity, a small reading room, several desks and other seating areas, a public computer lab with printing capabilities, and two handicap accessible restrooms.
Photocopying, faxing, and scanning services are available at the front desk, and the Library is a federally certified passport acceptance facility. The Library’s collection has approximately 33,000 volumes, including large print materials, audiobooks, DVDs, music CDs and subscriptions to over 25 periodicals. Library patrons have free access to the Digital Maine Library databases and Maine InfoNet’s CloudLibrary.
The Library offers special services that include: story time, summer reading, therapy-dog reading programs, interlibrary loan services, author visits, knitting socials, book club, free family and community programs, and an outreach book-delivery program for homebound citizens of Brewer. With over 6,100 cardholders, including 1,000 non-resident patrons, the Library’s circulation for FY2020 was 27,594 physical checkouts and 2,961 digital checkouts.
Due to Covid-19, the library closed to public on March 15th. We kept an online presence throughout the spring, offering story times on Facebook and lectures via Zoom. During this time, we also encouraged digital checkouts through CloudLibrary. Prior to our closure, we averaged about 185 digital checkouts a month. During our closure, we averaged 432 monthly digital checkouts. On June 1st, we opened for curbside pickup, and 791 physical books were checked out during that month.
Public Works
The Public Works Department provides maintenance of approximately 62 miles of roads, 40 miles of sidewalks, along with storm and sanitary drainage systems. Public Works provides construction and manpower support for all City Departments. Public Works constructs minor capital improvement projects including road construction, sidewalk improvements, and storm drainage improvements. On an annual basis the Department also mows roadsides, paints intersections and crosswalks, cleans storm water basins, and trims trees and brush along roadways and sidewalks as needed. Most operations of the CDD landfill are done by the Department, however licensing, permitting and reporting is handled by the Environmental Services Department.
Public Works is responsible for all snow removal on roads, sidewalks, City owned parking lots, and most School facilities. For snow removal activities the department uses two 12-yard dump trucks; six 6-yard dump trucks; two 1-ton dump trucks; and one wheel loader. Each has a designated plow route that takes 3 – 4 hours to cover depending on the intensity of the storm. The plowing of sidewalks is done on a limited basis during storms but the actual cleanup doesn’t start until the conclusion of storms.
The Public Works vehicle maintenance crew, maintains approximately 130 City owned vehicles and equipment, which includes all City Departments.
The Department is staffed with a Public Works Director, one administrative staff, one purchasing agent, one shop foreman, two mechanics, two environmental technicians, one landfill operator, and nine other full-time crew members.
114
The City contracts with a private hauler for curbside collection, processing, and disposal of municipal solid waste (“MSW”) from residential properties of 4 units or less. In January 2011, the City implemented “pay as you throw”, which generated approximately $250,000 in revenue annually. On March 30, 2020, the City temporarily suspended the program in recognition of the economic hardships facing residents as a result of the coronavirus pandemic. In June 2020, the City Council voted to eliminate the pay as you throw program entirely.
The City has a contract through at least 2034 with the nonprofit Municipal Review Committee (“MRC”) to dispose of MSW generated in Brewer at the Coastal Resources of Maine, LLC advanced MSW recycling & processing facility in Hampden, Maine. MSW tipping fees are $71.44 per ton and receive a CPI adjustment annually. Under the public-private partnership that MRC has with Coastal, the City has the potential to share in rebates based on facility profits. Through at least 2021, MRC is using reserve funds to reduce Brewer’s MSW tip fees by $5 per ton if facility profits are not sufficient to generate this level of rebate.
On May 27, 2020, Coastal Resources ran out of funds and was forced to close the plant. The MRC is arranging waste disposal at the same tipping fee in the interim while it works with the parties to re-open the plant.
The City operates a Phase II landfill under a Maine Department of Environmental Protection (“DEP”) construction and demolition debris landfill license, dated February 24, 1994. No wastes other than construction and demolition debris are handled by the landfill. The landfill has approximately 13,000 cubic yards of remaining capacity with a life expectancy of less than 2 years at the current disposal rate. The City has been actively managing and reducing the flow of waste to the landfill to preserve and extend its life for the benefit of Brewer residents and taxpayers. In May 2014, the City reduced the landfill’s hours of operation from 6 days per week to 2 days per month and grass and leaf drop off every Tuesday from 7:00-11:30am. Additionally, the City is considering a CDD Landfill expansion that will give the Brewer residents approximately 20 years of disposal capacity. The City has also begun to set aside funds to help cover the closure costs, which were recently estimated at $1,200,000.
Sewer Department
The City's Sewer Department maintains a Wastewater Treatment Plant (the “Treatment Plant”) that processes flow, total suspended solids, and oxygen depleting organic pollutants (Biochemical Oxygen Demand or “BOD”) from municipal sewers. The sewer system also includes 14 pumping stations and approximately 53 miles of sewer lines. The Sewer Department is staffed by one Superintendent and ten employees. The operation and maintenance of the Brewer Water Pollution Control Facility, the 14 pump stations and the 53 miles of sewer which includes 1400 manholes are all funded by the wastewater budget.
The Treatment Plant was constructed in 1975 and was originally designed to treat 3.03 million gallons per day (“MGD”) of flow. Due to capacity limitations, excessive loadings, worn equipment and outdated original processes, in 1992 the DEP, the City and a former manufacturer entered into a Consent Agreement which required improvements to the Plant's capacity, physical needs and process efficiencies. In complying with its Consent Agreement, the City established a $7,000,000 phased plant remediation approach for its Treatment Plant that started in 1993 and was completed in 1998. After completing the upgrades, the plant was designed for 5.2 MGD flow, engineered for a 20- year growth period and is classified as a Class V treatment operation. An additional 10 MGD can be treated through the storm water bypass during periods of snowmelt, high ground water, and storm water runoff.
In 1994, the City started a very successful 20-year combined sewer overflow (“CSO”) Abatement Program that reduced the volume of untreated water entering the Penobscot River by 99.99%. To achieve this level of success the City’s sewer users have invested over $19,300,000 to date to comply with Federal and State CSO elimination mandates.
The City completed the required combined sewer overflow (“CSO”) abatement upgrades mandated by the 1992 consent agreement in 2012, and in October 2014, it received formal notice from the DEP that the consent

115
agreement had been closed out and conditions met. The separation projects have reduced the number of overflow events from seventy-seven per year to virtually zero. The Sewer Department is established as an Enterprise Fund in that the intent of the City is for the department to provide services on a continuing basis financed entirely through user fees.
Water Department
The former Brewer Water District was formed under Chapter 146 of the Private and Special Laws of Maine (1945), as amended and supplemented by Chapters 111, 134, 64, 60, 44, 61 and 66 of the Private and Special Laws of Maine (1947), (1949), (1957), (1967), (1993), (1993) and (2002), respectively (the “Charter”), established as a quasi-municipal corporation and as a body politic and corporate, whose service area includes the territory constituting most of the City of Brewer and parts of the Towns of Eddington, Holden and Orrington, Maine (the “Water System Territory”), for the purpose of supplying its inhabitants with pure water for domestic, sanitary, commercial, municipal purposes and public and private fire protection.
Chapter 66 of the Private and Special Laws of the State of Maine of 2001 (“An Act Providing for the Supply of Water to the City of Brewer”) (the “Act”) authorized the transfer of the assets and obligations of the Brewer Water District (the “Water District”), including its debt, to the City, subject to the approval of the voters of the City at a referendum election and the affirmative vote of the City Council and the trustees of the Water District. The voters of the City approved the transfer, pursuant to the Act, at a referendum held on June 11, 2002; the City Council voted affirmatively to approve the transfer on July 16, 2002; and the former trustees of the Water District voted to approve the transfer on August 26, 2002. The transfer occurred on December 31, 2002 at which time the operations of the Water District were converted to become a department of the City, operating as an Enterprise Fund, whereby the intent of the City is for the department to provide services on a continuing basis financed entirely through user charges and be self-supporting.
The day-to-day administration, operation and maintenance of the waterworks facility are conducted by ten and a half Water Department employees under the direction of its Superintendent. The Water Department serves approximately 3,606 customers in a territory with communities that have a consolidated population of approximately 18,000 inhabitants. The current source of the Water Department’s water supply is primarily from the 2.92 square mile Hatcase Pond, an estimated daily “dry year” yield of 2 million gallons; with Flood’s Pond as a back-up emergency source. The average daily draft is 755,000 gallons with maximum daily draft of 1,138,000 gallons.
The Water System includes three storage tanks with combined capacity of 2,895,000 gallons (or approximately 3.64 days average 2020 demand). The Water Department’s water transmission and distribution system is comprised of approximately 253,188 feet (almost 48 miles) of transmission and distribution mains. The Water Department provides service to 475 fire hydrants for communities in its territory.
PUBLIC EDUCATION
The City, through its School Department, operates its education program for grades pre-Kindergarten (“pre-K”) through 12 under its own supervision in facilities currently owned by the City of Brewer High School District (described in the section below). Article III of the City’s Charter provides that the public schools for the City be administered by a Superintending School Committee (the “School Committee”) comprised of five members, who are elected by the voters of the City at-large for three-year staggered terms. The School Committee performs all duties and functions in regard to the curriculum; care and management of the public schools of the City; and governs the affairs of the Brewer School Department. The School Committee prepares and submits its budget to the City Manager, who includes it in the budget process. The School’s staff consists of a Superintendent, four full-time principals, and one hundred thirty-four full time equivalent teachers, and various other professional and non-professional staff.
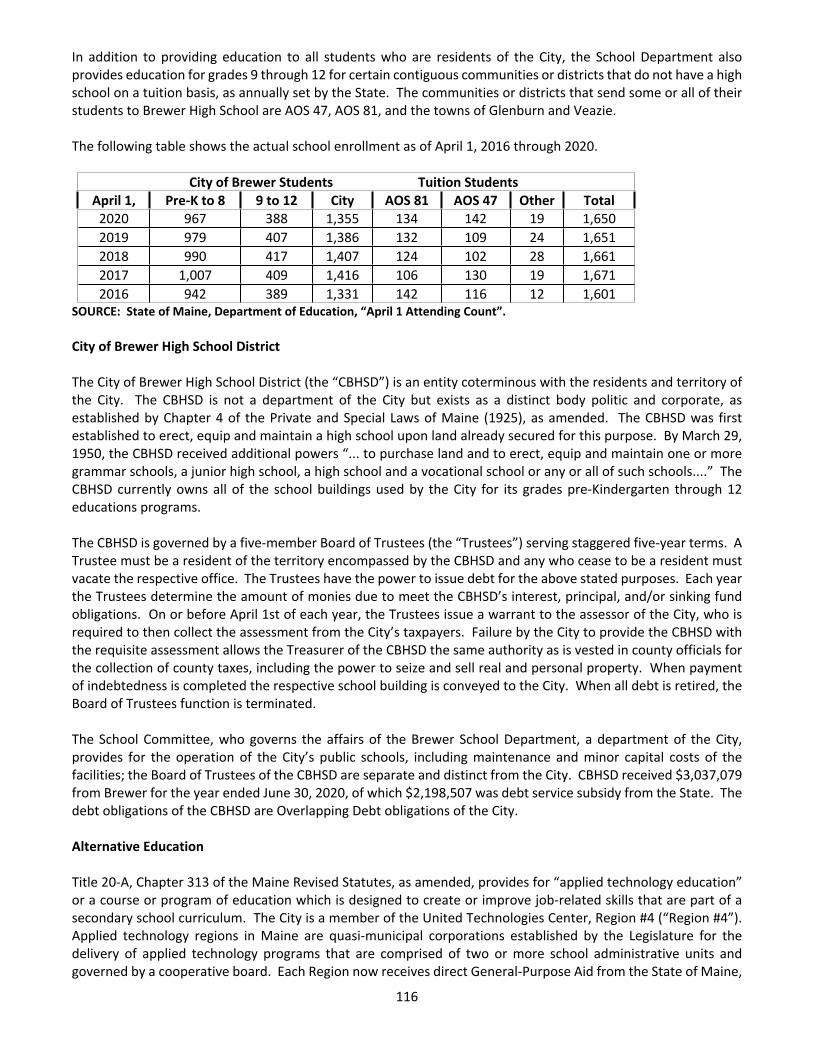
116
In addition to providing education to all students who are residents of the City, the School Department also provides education for grades 9 through 12 for certain contiguous communities or districts that do not have a high school on a tuition basis, as annually set by the State. The communities or districts that send some or all of their students to Brewer High School are AOS 47, AOS 81, and the towns of Glenburn and Veazie.
The following table shows the actual school enrollment as of April 1, 2016 through 2020.
City of Brewer Students Tuition StudentsApril 1, Pre-K to 8 9 to 12 City AOS 81 AOS 47 Other Total
2020 967 388 1,355 134 142 19 1,6502019 979 407 1,386 132 109 24 1,6512018 990 417 1,407 124 102 28 1,6612017 1,007 409 1,416 106 130 19 1,6712016 942 389 1,331 142 116 12 1,601
SOURCE: State of Maine, Department of Education, “April 1 Attending Count”.
City of Brewer High School District
The City of Brewer High School District (the “CBHSD”) is an entity coterminous with the residents and territory of the City. The CBHSD is not a department of the City but exists as a distinct body politic and corporate, as established by Chapter 4 of the Private and Special Laws of Maine (1925), as amended. The CBHSD was first established to erect, equip and maintain a high school upon land already secured for this purpose. By March 29, 1950, the CBHSD received additional powers “... to purchase land and to erect, equip and maintain one or more grammar schools, a junior high school, a high school and a vocational school or any or all of such schools....” The CBHSD currently owns all of the school buildings used by the City for its grades pre-Kindergarten through 12 educations programs.
The CBHSD is governed by a five-member Board of Trustees (the “Trustees”) serving staggered five-year terms. A Trustee must be a resident of the territory encompassed by the CBHSD and any who cease to be a resident must vacate the respective office. The Trustees have the power to issue debt for the above stated purposes. Each year the Trustees determine the amount of monies due to meet the CBHSD’s interest, principal, and/or sinking fund obligations. On or before April 1st of each year, the Trustees issue a warrant to the assessor of the City, who is required to then collect the assessment from the City’s taxpayers. Failure by the City to provide the CBHSD with the requisite assessment allows the Treasurer of the CBHSD the same authority as is vested in county officials for the collection of county taxes, including the power to seize and sell real and personal property. When payment of indebtedness is completed the respective school building is conveyed to the City. When all debt is retired, the Board of Trustees function is terminated.
The School Committee, who governs the affairs of the Brewer School Department, a department of the City, provides for the operation of the City’s public schools, including maintenance and minor capital costs of the facilities; the Board of Trustees of the CBHSD are separate and distinct from the City. CBHSD received $3,037,079 from Brewer for the year ended June 30, 2020, of which $2,198,507 was debt service subsidy from the State. The debt obligations of the CBHSD are Overlapping Debt obligations of the City.
Alternative Education
Title 20-A, Chapter 313 of the Maine Revised Statutes, as amended, provides for “applied technology education” or a course or program of education which is designed to create or improve job-related skills that are part of a secondary school curriculum. The City is a member of the United Technologies Center, Region #4 (“Region #4”). Applied technology regions in Maine are quasi-municipal corporations established by the Legislature for the delivery of applied technology programs that are comprised of two or more school administrative units and governed by a cooperative board. Each Region now receives direct General-Purpose Aid from the State of Maine,
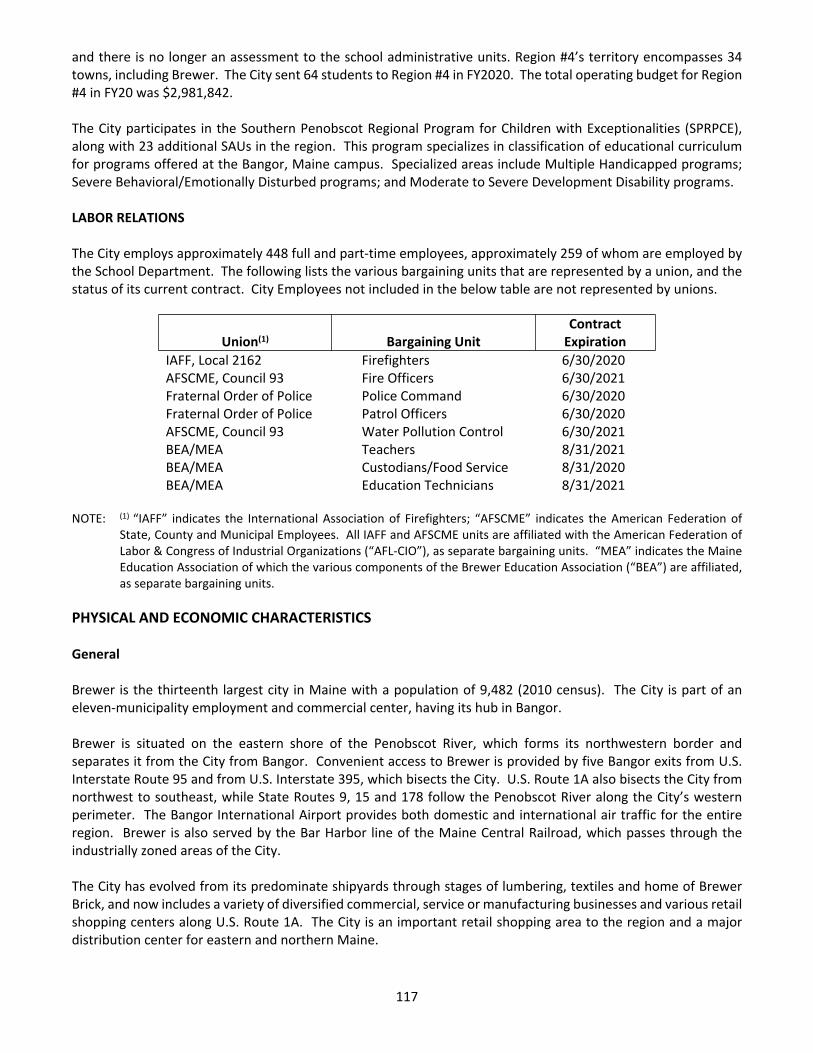
117
and there is no longer an assessment to the school administrative units. Region #4’s territory encompasses 34 towns, including Brewer. The City sent 64 students to Region #4 in FY2020. The total operating budget for Region #4 in FY20 was $2,981,842.
The City participates in the Southern Penobscot Regional Program for Children with Exceptionalities (SPRPCE), along with 23 additional SAUs in the region. This program specializes in classification of educational curriculum for programs offered at the Bangor, Maine campus. Specialized areas include Multiple Handicapped programs; Severe Behavioral/Emotionally Disturbed programs; and Moderate to Severe Development Disability programs.
LABOR RELATIONS
The City employs approximately 448 full and part-time employees, approximately 259 of whom are employed by the School Department. The following lists the various bargaining units that are represented by a union, and the status of its current contract. City Employees not included in the below table are not represented by unions.
Union(1) Bargaining UnitContract
ExpirationIAFF, Local 2162 Firefighters 6/30/2020AFSCME, Council 93 Fire Officers 6/30/2021Fraternal Order of Police Police Command 6/30/2020Fraternal Order of Police Patrol Officers 6/30/2020AFSCME, Council 93 Water Pollution Control 6/30/2021BEA/MEA Teachers 8/31/2021BEA/MEA Custodians/Food Service 8/31/2020BEA/MEA Education Technicians 8/31/2021
NOTE: (1) “IAFF” indicates the International Association of Firefighters; “AFSCME” indicates the American Federation of State, County and Municipal Employees. All IAFF and AFSCME units are affiliated with the American Federation of Labor & Congress of Industrial Organizations (“AFL-CIO”), as separate bargaining units. “MEA” indicates the Maine Education Association of which the various components of the Brewer Education Association (“BEA”) are affiliated, as separate bargaining units.
PHYSICAL AND ECONOMIC CHARACTERISTICS
General
Brewer is the thirteenth largest city in Maine with a population of 9,482 (2010 census). The City is part of an eleven-municipality employment and commercial center, having its hub in Bangor.
Brewer is situated on the eastern shore of the Penobscot River, which forms its northwestern border and separates it from the City from Bangor. Convenient access to Brewer is provided by five Bangor exits from U.S. Interstate Route 95 and from U.S. Interstate 395, which bisects the City. U.S. Route 1A also bisects the City from northwest to southeast, while State Routes 9, 15 and 178 follow the Penobscot River along the City’s western perimeter. The Bangor International Airport provides both domestic and international air traffic for the entire region. Brewer is also served by the Bar Harbor line of the Maine Central Railroad, which passes through the industrially zoned areas of the City.
The City has evolved from its predominate shipyards through stages of lumbering, textiles and home of Brewer Brick, and now includes a variety of diversified commercial, service or manufacturing businesses and various retail shopping centers along U.S. Route 1A. The City is an important retail shopping area to the region and a major distribution center for eastern and northern Maine.
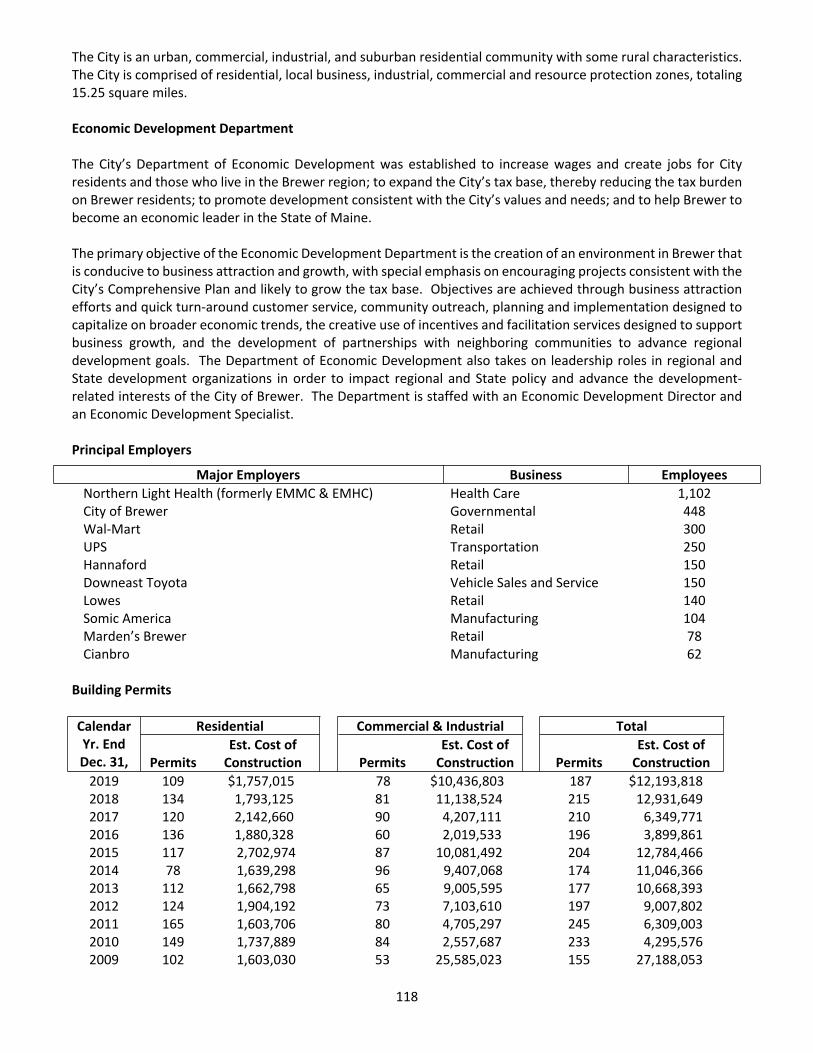
118
The City is an urban, commercial, industrial, and suburban residential community with some rural characteristics. The City is comprised of residential, local business, industrial, commercial and resource protection zones, totaling 15.25 square miles.
Economic Development Department
The City’s Department of Economic Development was established to increase wages and create jobs for City residents and those who live in the Brewer region; to expand the City’s tax base, thereby reducing the tax burden on Brewer residents; to promote development consistent with the City’s values and needs; and to help Brewer to become an economic leader in the State of Maine.
The primary objective of the Economic Development Department is the creation of an environment in Brewer that is conducive to business attraction and growth, with special emphasis on encouraging projects consistent with the City’s Comprehensive Plan and likely to grow the tax base. Objectives are achieved through business attraction efforts and quick turn-around customer service, community outreach, planning and implementation designed to capitalize on broader economic trends, the creative use of incentives and facilitation services designed to support business growth, and the development of partnerships with neighboring communities to advance regional development goals. The Department of Economic Development also takes on leadership roles in regional and State development organizations in order to impact regional and State policy and advance the development-related interests of the City of Brewer. The Department is staffed with an Economic Development Director and an Economic Development Specialist.
Principal Employers
Major Employers Business EmployeesNorthern Light Health (formerly EMMC & EMHC) Health Care 1,102City of Brewer Governmental 448Wal-Mart Retail 300UPS Transportation 250Hannaford Retail 150Downeast Toyota Vehicle Sales and Service 150Lowes Retail 140Somic America Manufacturing 104Marden’s Brewer Retail 78Cianbro Manufacturing 62
Building Permits
Residential Commercial & Industrial TotalCalendarYr. EndDec. 31, Permits
Est. Cost of Construction Permits
Est. Cost of Construction Permits
Est. Cost of Construction
2019 109 $1,757,015 78 $10,436,803 187 $12,193,8182018 134 1,793,125 81 11,138,524 215 12,931,6492017 120 2,142,660 90 4,207,111 210 6,349,7712016 136 1,880,328 60 2,019,533 196 3,899,8612015 117 2,702,974 87 10,081,492 204 12,784,4662014 78 1,639,298 96 9,407,068 174 11,046,3662013 112 1,662,798 65 9,005,595 177 10,668,3932012 124 1,904,192 73 7,103,610 197 9,007,8022011 165 1,603,706 80 4,705,297 245 6,309,0032010 149 1,737,889 84 2,557,687 233 4,295,5762009 102 1,603,030 53 25,585,023 155 27,188,053
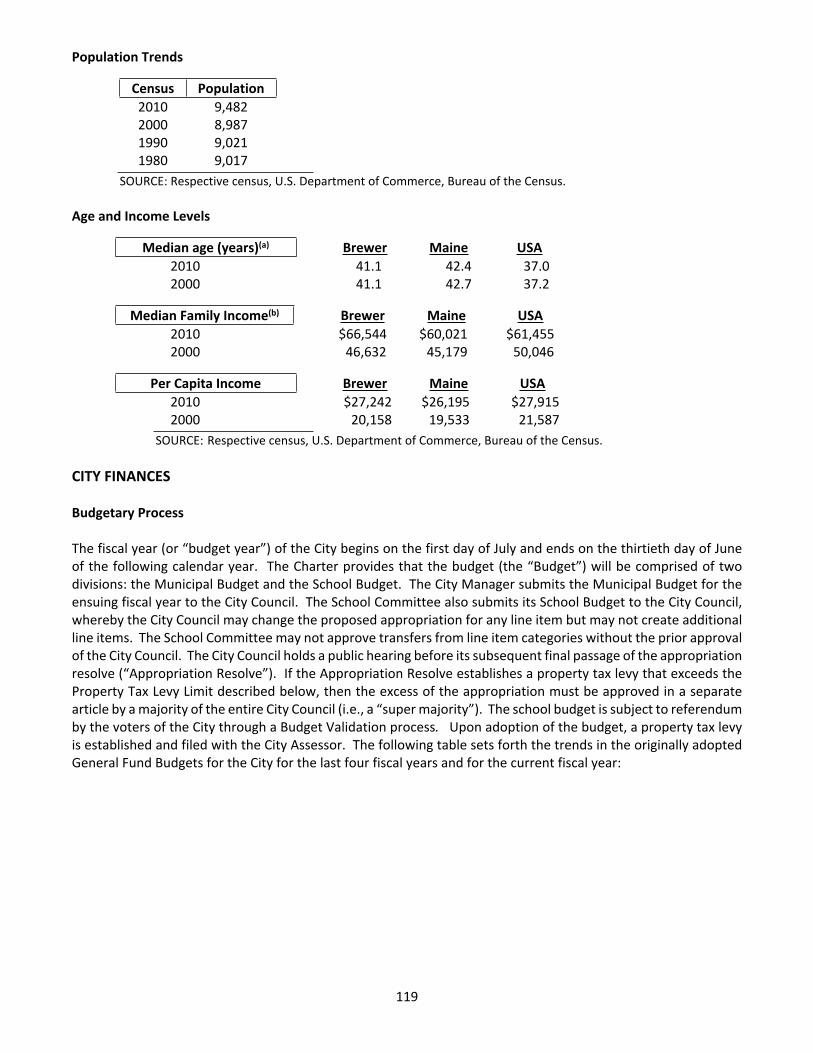
119
Population Trends
Census Population2010 9,4822000 8,9871990 9,0211980 9,017
SOURCE: Respective census, U.S. Department of Commerce, Bureau of the Census.
Age and Income Levels
Median age (years)(a) Brewer Maine USA2010 41.1 42.4 37.02000 41.1 42.7 37.2
Median Family Income(b) Brewer Maine USA2010 $66,544 $60,021 $61,4552000 46,632 45,179 50,046
Per Capita Income Brewer Maine USA2010 $27,242 $26,195 $27,9152000 20,158 19,533 21,587
SOURCE: Respective census, U.S. Department of Commerce, Bureau of the Census.
CITY FINANCES
Budgetary Process
The fiscal year (or “budget year”) of the City begins on the first day of July and ends on the thirtieth day of June of the following calendar year. The Charter provides that the budget (the “Budget”) will be comprised of two divisions: the Municipal Budget and the School Budget. The City Manager submits the Municipal Budget for the ensuing fiscal year to the City Council. The School Committee also submits its School Budget to the City Council, whereby the City Council may change the proposed appropriation for any line item but may not create additional line items. The School Committee may not approve transfers from line item categories without the prior approval of the City Council. The City Council holds a public hearing before its subsequent final passage of the appropriation resolve (“Appropriation Resolve”). If the Appropriation Resolve establishes a property tax levy that exceeds the Property Tax Levy Limit described below, then the excess of the appropriation must be approved in a separate article by a majority of the entire City Council (i.e., a “super majority”). The school budget is subject to referendum by the voters of the City through a Budget Validation process. Upon adoption of the budget, a property tax levy is established and filed with the City Assessor. The following table sets forth the trends in the originally adopted General Fund Budgets for the City for the last four fiscal years and for the current fiscal year:
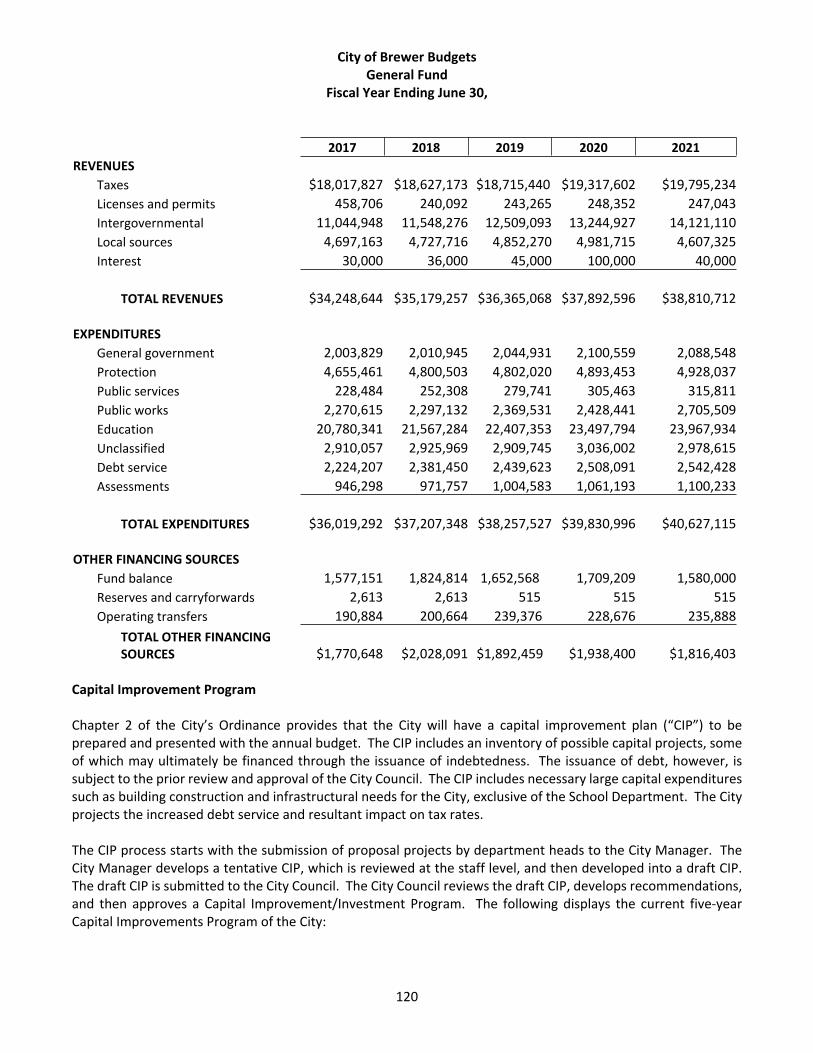
120
City of Brewer BudgetsGeneral Fund
Fiscal Year Ending June 30,
2017 2018 2019 2020 2021REVENUES
Taxes $18,017,827 $18,627,173 $18,715,440 $19,317,602 $19,795,234Licenses and permits 458,706 240,092 243,265 248,352 247,043Intergovernmental 11,044,948 11,548,276 12,509,093 13,244,927 14,121,110Local sources 4,697,163 4,727,716 4,852,270 4,981,715 4,607,325Interest 30,000 36,000 45,000 100,000 40,000
TOTAL REVENUES $34,248,644 $35,179,257
$36,365,068 $37,892,596 $38,810,712
EXPENDITURESGeneral government 2,003,829 2,010,945 2,044,931 2,100,559 2,088,548Protection 4,655,461 4,800,503 4,802,020 4,893,453 4,928,037Public services 228,484 252,308 279,741 305,463 315,811Public works 2,270,615 2,297,132 2,369,531 2,428,441 2,705,509Education 20,780,341 21,567,284 22,407,353 23,497,794 23,967,934Unclassified 2,910,057 2,925,969 2,909,745 3,036,002 2,978,615Debt service 2,224,207 2,381,450 2,439,623 2,508,091 2,542,428Assessments 946,298 971,757 1,004,583 1,061,193 1,100,233
TOTAL EXPENDITURES $36,019,292 $37,207,348 $38,257,527 $39,830,996 $40,627,115
OTHER FINANCING SOURCESFund balance 1,577,151 1,824,814 1,652,568 1,709,209 1,580,000Reserves and carryforwards 2,613 2,613 515 515 515Operating transfers 190,884 200,664 239,376 228,676 235,888
TOTAL OTHER FINANCING SOURCES $1,770,648 $2,028,091 $1,892,459 $1,938,400 $1,816,403
Capital Improvement Program
Chapter 2 of the City’s Ordinance provides that the City will have a capital improvement plan (“CIP”) to be prepared and presented with the annual budget. The CIP includes an inventory of possible capital projects, some of which may ultimately be financed through the issuance of indebtedness. The issuance of debt, however, is subject to the prior review and approval of the City Council. The CIP includes necessary large capital expenditures such as building construction and infrastructural needs for the City, exclusive of the School Department. The City projects the increased debt service and resultant impact on tax rates.
The CIP process starts with the submission of proposal projects by department heads to the City Manager. The City Manager develops a tentative CIP, which is reviewed at the staff level, and then developed into a draft CIP. The draft CIP is submitted to the City Council. The City Council reviews the draft CIP, develops recommendations, and then approves a Capital Improvement/Investment Program. The following displays the current five-year Capital Improvements Program of the City:
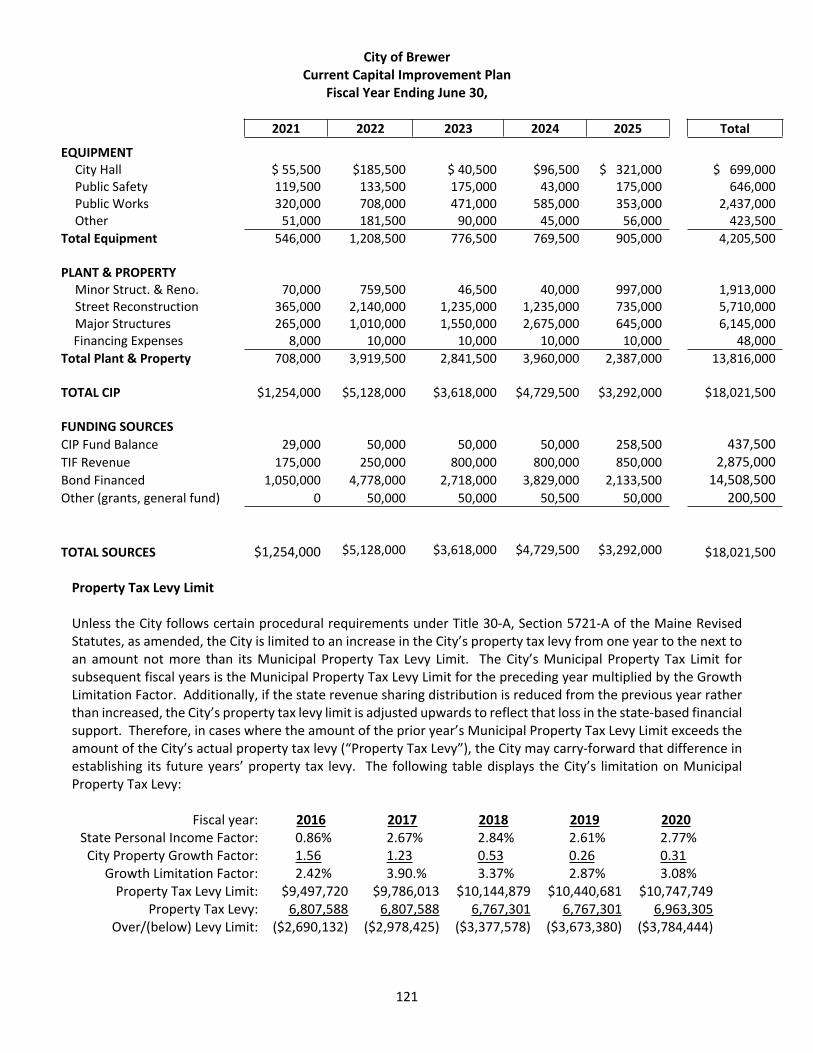
121
City of Brewer Current Capital Improvement Plan
Fiscal Year Ending June 30,
2021 2022 2023 2024 2025 Total
EQUIPMENTCity Hall $ 55,500 $185,500 $ 40,500 $96,500 $ 321,000 $ 699,000Public Safety 119,500 133,500 175,000 43,000 175,000 646,000Public Works 320,000 708,000 471,000 585,000 353,000 2,437,000Other 51,000 181,500 90,000 45,000 56,000 423,500
Total Equipment 546,000 1,208,500 776,500 769,500 905,000 4,205,500
PLANT & PROPERTYMinor Struct. & Reno. 70,000 759,500 46,500 40,000 997,000 1,913,000Street Reconstruction 365,000 2,140,000 1,235,000 1,235,000 735,000 5,710,000Major Structures 265,000 1,010,000 1,550,000 2,675,000 645,000 6,145,000
Financing Expenses 8,000 10,000 10,000 10,000 10,000 48,000Total Plant & Property 708,000 3,919,500 2,841,500 3,960,000 2,387,000 13,816,000
TOTAL CIP $1,254,000 $5,128,000 $3,618,000 $4,729,500 $3,292,000 $18,021,500
FUNDING SOURCESCIP Fund Balance 29,000 50,000 50,000 50,000 258,500 437,500TIF Revenue 175,000 250,000 800,000 800,000 850,000 2,875,000Bond Financed 1,050,000 4,778,000 2,718,000 3,829,000 2,133,500 14,508,500Other (grants, general fund) 0 50,000 50,000 50,500 50,000 200,500
TOTAL SOURCES $1,254,000 $5,128,000 $3,618,000 $4,729,500 $3,292,000
$18,021,500
Property Tax Levy Limit
Unless the City follows certain procedural requirements under Title 30-A, Section 5721-A of the Maine Revised Statutes, as amended, the City is limited to an increase in the City’s property tax levy from one year to the next to an amount not more than its Municipal Property Tax Levy Limit. The City’s Municipal Property Tax Limit for subsequent fiscal years is the Municipal Property Tax Levy Limit for the preceding year multiplied by the Growth Limitation Factor. Additionally, if the state revenue sharing distribution is reduced from the previous year rather than increased, the City’s property tax levy limit is adjusted upwards to reflect that loss in the state-based financial support. Therefore, in cases where the amount of the prior year’s Municipal Property Tax Levy Limit exceeds the amount of the City’s actual property tax levy (“Property Tax Levy”), the City may carry-forward that difference in establishing its future years’ property tax levy. The following table displays the City’s limitation on Municipal Property Tax Levy:
Fiscal year: 2016 2017 2018 2019 2020State Personal Income Factor: 0.86% 2.67% 2.84% 2.61% 2.77%
City Property Growth Factor: 1.56 1.23 0.53 0.26 0.31Growth Limitation Factor: 2.42% 3.90.% 3.37% 2.87% 3.08%
Property Tax Levy Limit: $9,497,720 $9,786,013 $10,144,879 $10,440,681 $10,747,749Property Tax Levy: 6,807,588 6,807,588 6,767,301 6,767,301 6,963,305
Over/(below) Levy Limit: ($2,690,132) ($2,978,425) ($3,377,578) ($3,673,380) ($3,784,444)
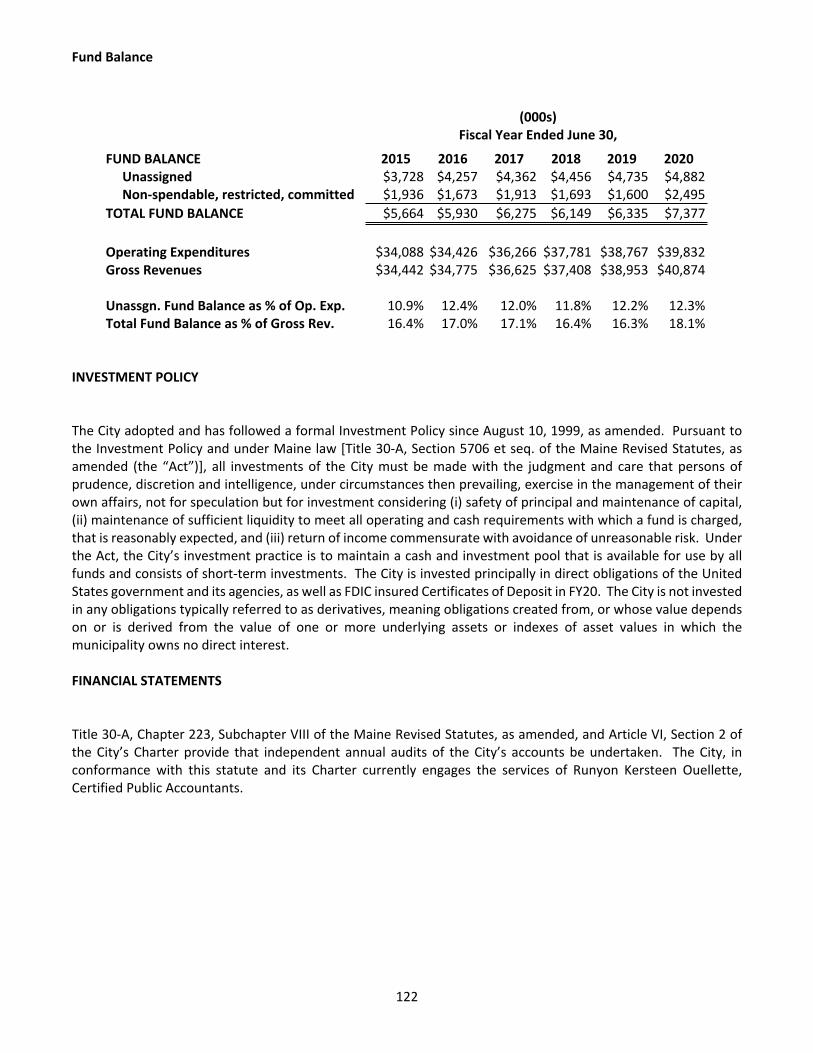
122
Fund Balance
(000s)Fiscal Year Ended June 30,
FUND BALANCE 2015 2016 2017 2018 2019 2020 Unassigned $3,728 $4,257 $4,362 $4,456 $4,735 $4,882 Non-spendable, restricted, committed $1,936 $1,673 $1,913 $1,693 $1,600 $2,495TOTAL FUND BALANCE $5,664 $5,930 $6,275 $6,149 $6,335 $7,377
Operating Expenditures $34,088 $34,426 $36,266 $37,781 $38,767 $39,832Gross Revenues $34,442 $34,775 $36,625 $37,408 $38,953 $40,874
Unassgn. Fund Balance as % of Op. Exp. 10.9% 12.4% 12.0% 11.8% 12.2% 12.3%Total Fund Balance as % of Gross Rev. 16.4% 17.0% 17.1% 16.4% 16.3% 18.1%
INVESTMENT POLICY
The City adopted and has followed a formal Investment Policy since August 10, 1999, as amended. Pursuant to the Investment Policy and under Maine law [Title 30-A, Section 5706 et seq. of the Maine Revised Statutes, as amended (the “Act”)], all investments of the City must be made with the judgment and care that persons of prudence, discretion and intelligence, under circumstances then prevailing, exercise in the management of their own affairs, not for speculation but for investment considering (i) safety of principal and maintenance of capital, (ii) maintenance of sufficient liquidity to meet all operating and cash requirements with which a fund is charged, that is reasonably expected, and (iii) return of income commensurate with avoidance of unreasonable risk. Under the Act, the City’s investment practice is to maintain a cash and investment pool that is available for use by all funds and consists of short-term investments. The City is invested principally in direct obligations of the United States government and its agencies, as well as FDIC insured Certificates of Deposit in FY20. The City is not invested in any obligations typically referred to as derivatives, meaning obligations created from, or whose value depends on or is derived from the value of one or more underlying assets or indexes of asset values in which the municipality owns no direct interest.
FINANCIAL STATEMENTS
Title 30-A, Chapter 223, Subchapter VIII of the Maine Revised Statutes, as amended, and Article VI, Section 2 of the City’s Charter provide that independent annual audits of the City’s accounts be undertaken. The City, in conformance with this statute and its Charter currently engages the services of Runyon Kersteen Ouellette, Certified Public Accountants.
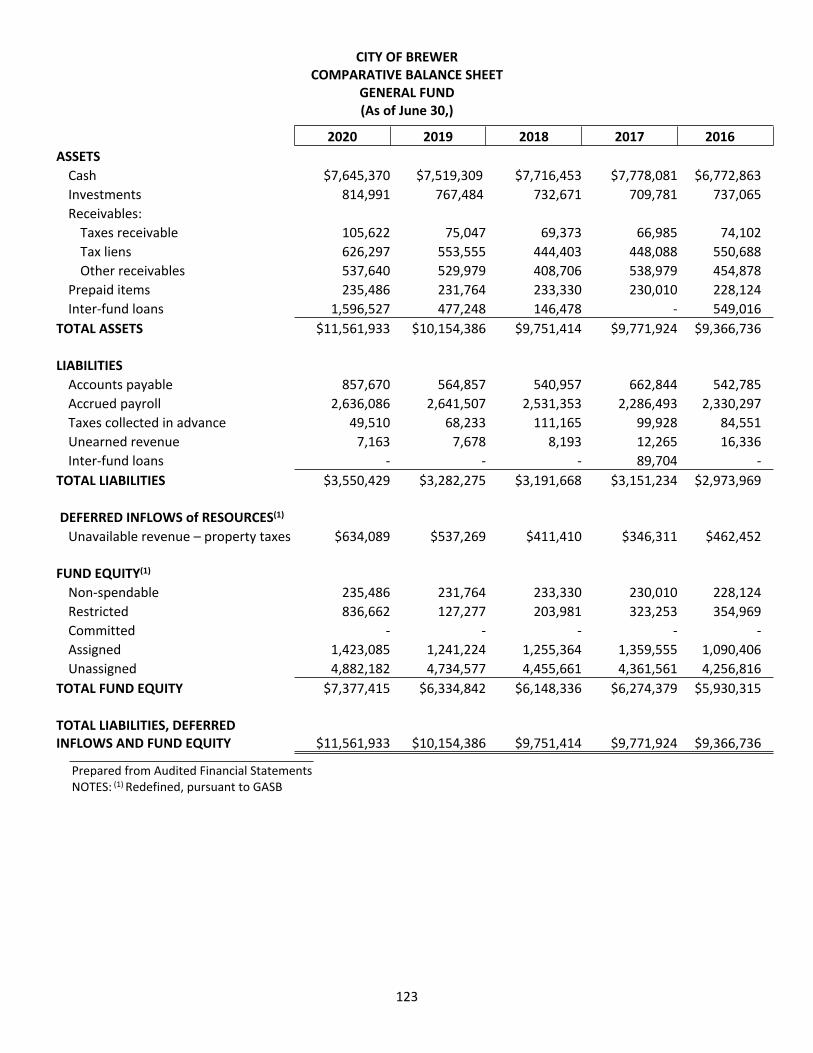
123
CITY OF BREWERCOMPARATIVE BALANCE SHEET
GENERAL FUND(As of June 30,)
2020 2019 2018 2017 2016ASSETS
Cash $7,645,370 $7,519,309 $7,716,453 $7,778,081 $6,772,863Investments 814,991 767,484 732,671 709,781 737,065Receivables:
Taxes receivable 105,622 75,047 69,373 66,985 74,102Tax liens 626,297 553,555 444,403 448,088 550,688Other receivables 537,640 529,979 408,706 538,979 454,878
Prepaid items 235,486 231,764 233,330 230,010 228,124Inter-fund loans 1,596,527 477,248 146,478 - 549,016
TOTAL ASSETS $11,561,933 $10,154,386 $9,751,414 $9,771,924 $9,366,736
LIABILITIESAccounts payable 857,670 564,857 540,957 662,844 542,785 Accrued payroll 2,636,086 2,641,507 2,531,353 2,286,493 2,330,297 Taxes collected in advance 49,510 68,233 111,165 99,928 84,551 Unearned revenue 7,163 7,678 8,193 12,265 16,336Inter-fund loans - - - 89,704 -
TOTAL LIABILITIES $3,550,429 $3,282,275 $3,191,668 $3,151,234 $2,973,969
DEFERRED INFLOWS of RESOURCES(1)
Unavailable revenue – property taxes $634,089 $537,269 $411,410 $346,311 $462,452
FUND EQUITY(1)
Non-spendable 235,486 231,764 233,330 230,010 228,124Restricted 836,662 127,277 203,981 323,253 354,969Committed - - - - -Assigned 1,423,085 1,241,224 1,255,364 1,359,555 1,090,406Unassigned 4,882,182 4,734,577 4,455,661 4,361,561 4,256,816
TOTAL FUND EQUITY $7,377,415 $6,334,842 $6,148,336 $6,274,379 $5,930,315
TOTAL LIABILITIES, DEFERRED INFLOWS AND FUND EQUITY $11,561,933 $10,154,386 $9,751,414 $9,771,924 $9,366,736
Prepared from Audited Financial StatementsNOTES: (1) Redefined, pursuant to GASB
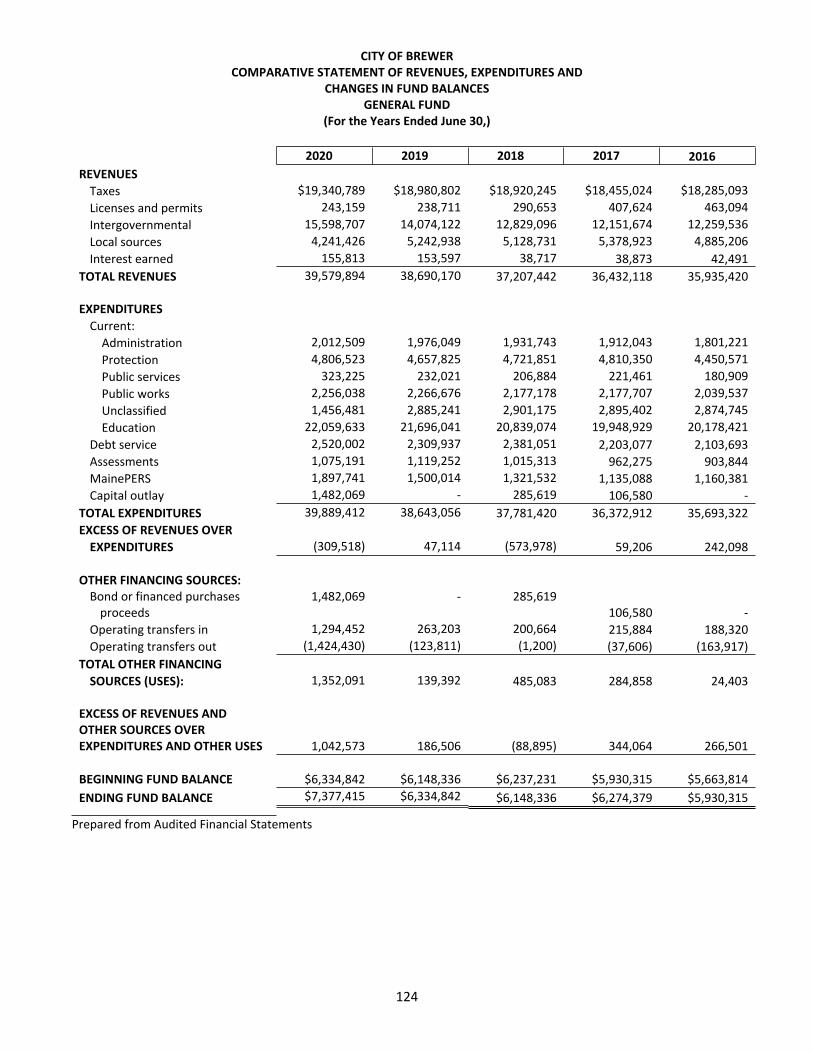
124
CITY OF BREWERCOMPARATIVE STATEMENT OF REVENUES, EXPENDITURES AND
CHANGES IN FUND BALANCESGENERAL FUND
(For the Years Ended June 30,)
2020 2019 2018 2017 2016REVENUES
Taxes $19,340,789 $18,980,802 $18,920,245 $18,455,024 $18,285,093 Licenses and permits 243,159 238,711 290,653 407,624 463,094 Intergovernmental 15,598,707 14,074,122 12,829,096 12,151,674 12,259,536 Local sources 4,241,426 5,242,938 5,128,731 5,378,923 4,885,206 Interest earned 155,813 153,597 38,717 38,873 42,491
TOTAL REVENUES 39,579,894 38,690,170 37,207,442 36,432,118 35,935,420
EXPENDITURESCurrent:
Administration 2,012,509 1,976,049 1,931,743 1,912,043 1,801,221 Protection 4,806,523 4,657,825 4,721,851 4,810,350 4,450,571 Public services 323,225 232,021 206,884 221,461 180,909 Public works 2,256,038 2,266,676 2,177,178 2,177,707 2,039,537 Unclassified 1,456,481 2,885,241 2,901,175 2,895,402 2,874,745 Education 22,059,633 21,696,041 20,839,074 19,948,929 20,178,421
Debt service 2,520,002 2,309,937 2,381,051 2,203,077 2,103,693Assessments 1,075,191 1,119,252 1,015,313 962,275 903,844MainePERS 1,897,741 1,500,014 1,321,532 1,135,088 1,160,381Capital outlay 1,482,069 - 285,619 106,580 -
TOTAL EXPENDITURES 39,889,412 38,643,056 37,781,420 36,372,912 35,693,322EXCESS OF REVENUES OVER
EXPENDITURES (309,518) 47,114 (573,978) 59,206 242,098
OTHER FINANCING SOURCES:Bond or financed purchases
proceeds1,482,069 - 285,619
106,580 -Operating transfers in 1,294,452 263,203 200,664 215,884 188,320Operating transfers out (1,424,430) (123,811) (1,200) (37,606) (163,917)
TOTAL OTHER FINANCING SOURCES (USES): 1,352,091 139,392 485,083 284,858 24,403
EXCESS OF REVENUES AND OTHER SOURCES OVER EXPENDITURES AND OTHER USES 1,042,573 186,506 (88,895) 344,064 266,501
BEGINNING FUND BALANCE $6,334,842 $6,148,336 $6,237,231 $5,930,315 $5,663,814ENDING FUND BALANCE $7,377,415 $6,334,842 $6,148,336 $6,274,379 $5,930,315
Prepared from Audited Financial Statements
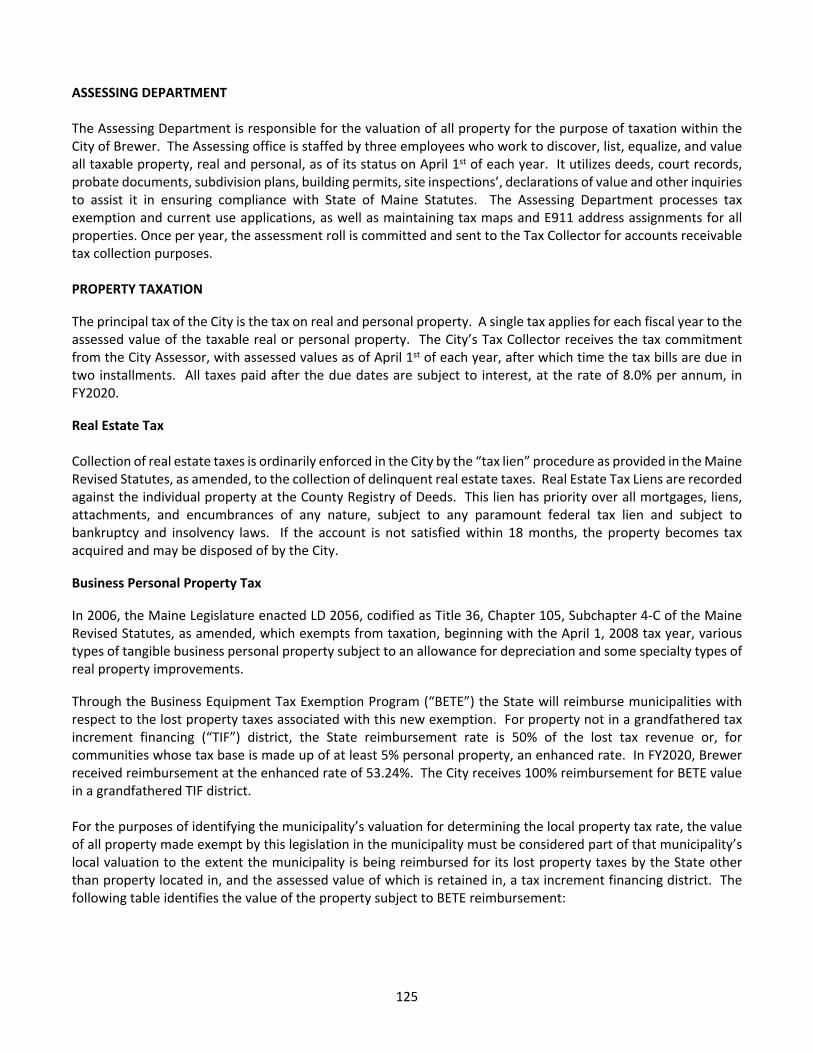
125
ASSESSING DEPARTMENT
The Assessing Department is responsible for the valuation of all property for the purpose of taxation within the City of Brewer. The Assessing office is staffed by three employees who work to discover, list, equalize, and value all taxable property, real and personal, as of its status on April 1st of each year. It utilizes deeds, court records, probate documents, subdivision plans, building permits, site inspections’, declarations of value and other inquiries to assist it in ensuring compliance with State of Maine Statutes. The Assessing Department processes tax exemption and current use applications, as well as maintaining tax maps and E911 address assignments for all properties. Once per year, the assessment roll is committed and sent to the Tax Collector for accounts receivable tax collection purposes.
PROPERTY TAXATION
The principal tax of the City is the tax on real and personal property. A single tax applies for each fiscal year to the assessed value of the taxable real or personal property. The City’s Tax Collector receives the tax commitment from the City Assessor, with assessed values as of April 1st of each year, after which time the tax bills are due in two installments. All taxes paid after the due dates are subject to interest, at the rate of 8.0% per annum, in FY2020.
Real Estate Tax
Collection of real estate taxes is ordinarily enforced in the City by the “tax lien” procedure as provided in the Maine Revised Statutes, as amended, to the collection of delinquent real estate taxes. Real Estate Tax Liens are recorded against the individual property at the County Registry of Deeds. This lien has priority over all mortgages, liens, attachments, and encumbrances of any nature, subject to any paramount federal tax lien and subject to bankruptcy and insolvency laws. If the account is not satisfied within 18 months, the property becomes tax acquired and may be disposed of by the City.
Business Personal Property Tax
In 2006, the Maine Legislature enacted LD 2056, codified as Title 36, Chapter 105, Subchapter 4-C of the Maine Revised Statutes, as amended, which exempts from taxation, beginning with the April 1, 2008 tax year, various types of tangible business personal property subject to an allowance for depreciation and some specialty types of real property improvements.
Through the Business Equipment Tax Exemption Program (“BETE”) the State will reimburse municipalities with respect to the lost property taxes associated with this new exemption. For property not in a grandfathered tax increment financing (“TIF”) district, the State reimbursement rate is 50% of the lost tax revenue or, for communities whose tax base is made up of at least 5% personal property, an enhanced rate. In FY2020, Brewer received reimbursement at the enhanced rate of 53.24%. The City receives 100% reimbursement for BETE value in a grandfathered TIF district.
For the purposes of identifying the municipality’s valuation for determining the local property tax rate, the value of all property made exempt by this legislation in the municipality must be considered part of that municipality’s local valuation to the extent the municipality is being reimbursed for its lost property taxes by the State other than property located in, and the assessed value of which is retained in, a tax increment financing district. The following table identifies the value of the property subject to BETE reimbursement:
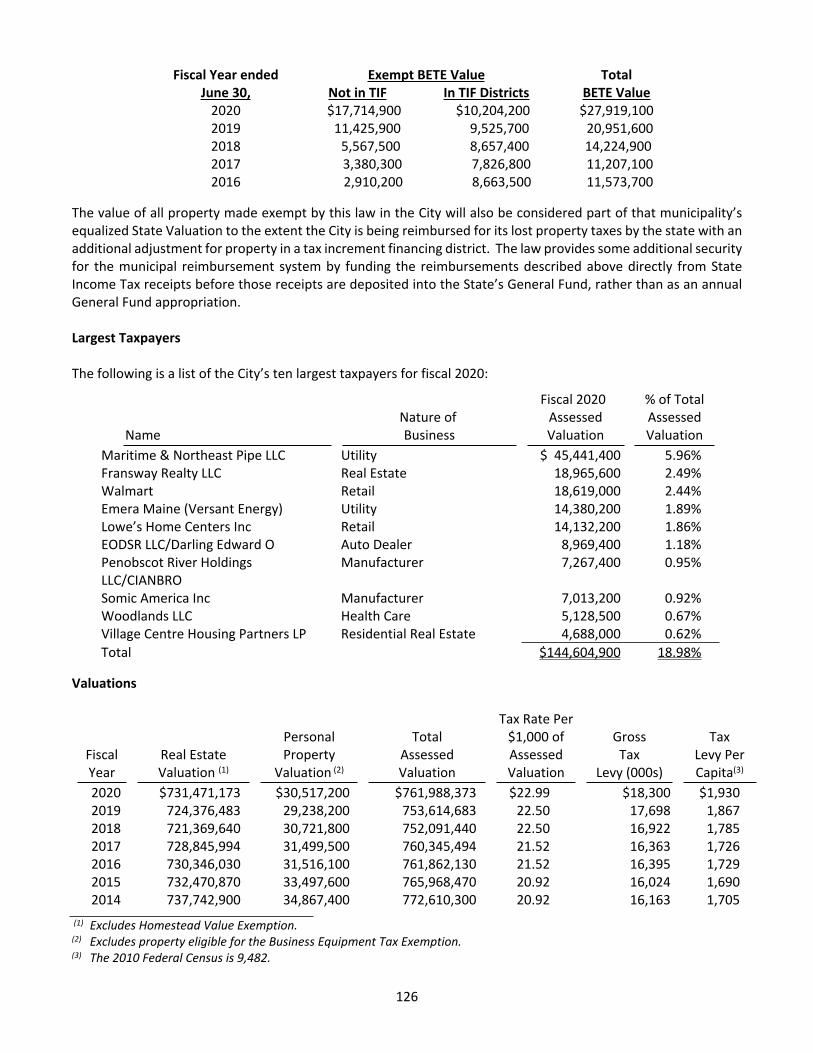
126
Fiscal Year ended Exempt BETE Value TotalJune 30, Not in TIF In TIF Districts BETE Value
2020 $17,714,900 $10,204,200 $27,919,1002019 11,425,900 9,525,700 20,951,6002018 5,567,500 8,657,400 14,224,9002017 3,380,300 7,826,800 11,207,1002016 2,910,200 8,663,500 11,573,700
The value of all property made exempt by this law in the City will also be considered part of that municipality’s equalized State Valuation to the extent the City is being reimbursed for its lost property taxes by the state with an additional adjustment for property in a tax increment financing district. The law provides some additional security for the municipal reimbursement system by funding the reimbursements described above directly from State Income Tax receipts before those receipts are deposited into the State’s General Fund, rather than as an annual General Fund appropriation.
Largest Taxpayers
The following is a list of the City’s ten largest taxpayers for fiscal 2020:
Fiscal 2020 % of TotalNature of Assessed Assessed
Name Business Valuation ValuationMaritime & Northeast Pipe LLC Utility $ 45,441,400 5.96%Fransway Realty LLC Real Estate 18,965,600 2.49%Walmart Retail 18,619,000 2.44%Emera Maine (Versant Energy) Utility 14,380,200 1.89%Lowe’s Home Centers Inc Retail 14,132,200 1.86%EODSR LLC/Darling Edward O Auto Dealer 8,969,400 1.18%Penobscot River Holdings LLC/CIANBRO
Manufacturer 7,267,400 0.95%
Somic America Inc Manufacturer 7,013,200 0.92%Woodlands LLC Health Care 5,128,500 0.67%Village Centre Housing Partners LP Residential Real Estate 4,688,000 0.62%Total $144,604,900 18.98%
Valuations
Fiscal Real EstatePersonalProperty
TotalAssessed
Tax Rate Per$1,000 ofAssessed
GrossTax
TaxLevy Per
Year Valuation (1) Valuation (2) Valuation Valuation Levy (000s) Capita(3)
2020 $731,471,173 $30,517,200 $761,988,373 $22.99 $18,300 $1,9302019 724,376,483 29,238,200 753,614,683 22.50 17,698 1,8672018 721,369,640 30,721,800 752,091,440 22.50 16,922 1,7852017 728,845,994 31,499,500 760,345,494 21.52 16,363 1,7262016 730,346,030 31,516,100 761,862,130 21.52 16,395 1,7292015 732,470,870 33,497,600 765,968,470 20.92 16,024 1,6902014 737,742,900 34,867,400 772,610,300 20.92 16,163 1,705
(1) Excludes Homestead Value Exemption.(2) Excludes property eligible for the Business Equipment Tax Exemption.(3) The 2010 Federal Census is 9,482.
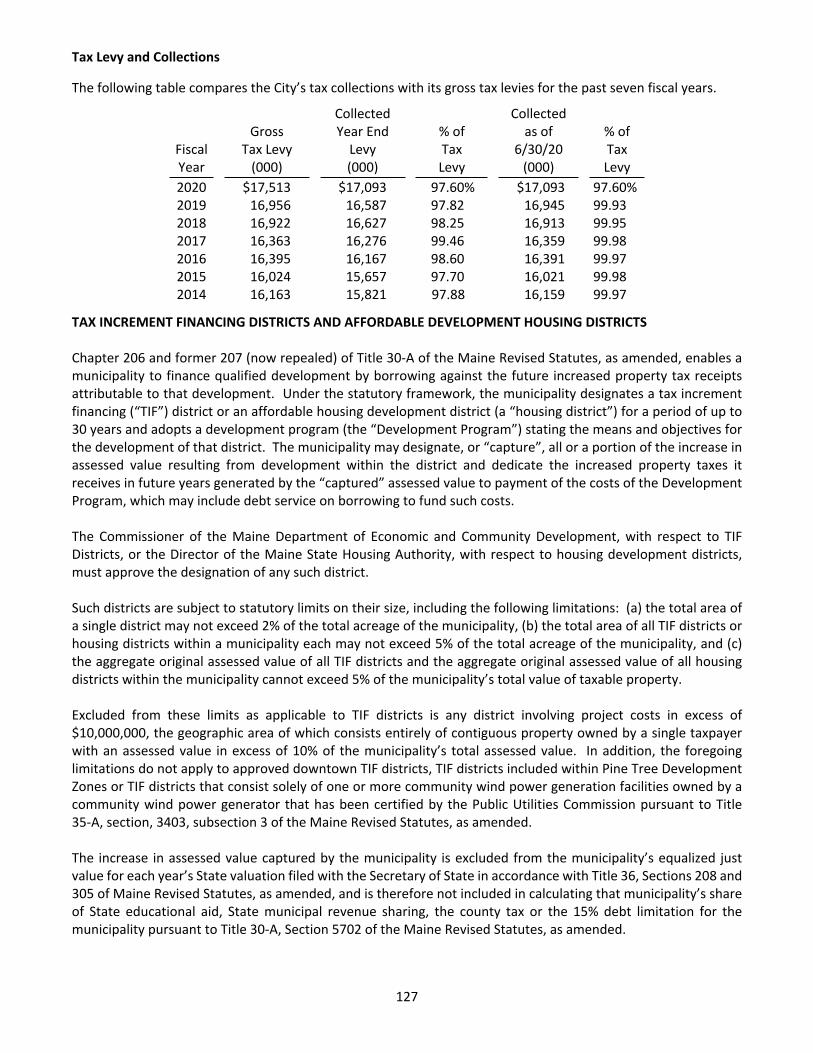
127
Tax Levy and Collections
The following table compares the City’s tax collections with its gross tax levies for the past seven fiscal years.
FiscalGross
Tax Levy
CollectedYear End
Levy% ofTax
Collectedas of
6/30/20% ofTax
Year (000) (000) Levy (000) Levy2020 $17,513 $17,093 97.60% $17,093 97.60%2019 16,956 16,587 97.82 16,945 99.932018 16,922 16,627 98.25 16,913 99.952017 16,363 16,276 99.46 16,359 99.982016 16,395 16,167 98.60 16,391 99.972015 16,024 15,657 97.70 16,021 99.982014 16,163 15,821 97.88 16,159 99.97
TAX INCREMENT FINANCING DISTRICTS AND AFFORDABLE DEVELOPMENT HOUSING DISTRICTS
Chapter 206 and former 207 (now repealed) of Title 30-A of the Maine Revised Statutes, as amended, enables a municipality to finance qualified development by borrowing against the future increased property tax receipts attributable to that development. Under the statutory framework, the municipality designates a tax increment financing (“TIF”) district or an affordable housing development district (a “housing district”) for a period of up to 30 years and adopts a development program (the “Development Program”) stating the means and objectives for the development of that district. The municipality may designate, or “capture”, all or a portion of the increase in assessed value resulting from development within the district and dedicate the increased property taxes it receives in future years generated by the “captured” assessed value to payment of the costs of the Development Program, which may include debt service on borrowing to fund such costs.
The Commissioner of the Maine Department of Economic and Community Development, with respect to TIF Districts, or the Director of the Maine State Housing Authority, with respect to housing development districts, must approve the designation of any such district.
Such districts are subject to statutory limits on their size, including the following limitations: (a) the total area of a single district may not exceed 2% of the total acreage of the municipality, (b) the total area of all TIF districts or housing districts within a municipality each may not exceed 5% of the total acreage of the municipality, and (c) the aggregate original assessed value of all TIF districts and the aggregate original assessed value of all housing districts within the municipality cannot exceed 5% of the municipality’s total value of taxable property.
Excluded from these limits as applicable to TIF districts is any district involving project costs in excess of $10,000,000, the geographic area of which consists entirely of contiguous property owned by a single taxpayer with an assessed value in excess of 10% of the municipality’s total assessed value. In addition, the foregoing limitations do not apply to approved downtown TIF districts, TIF districts included within Pine Tree Development Zones or TIF districts that consist solely of one or more community wind power generation facilities owned by a community wind power generator that has been certified by the Public Utilities Commission pursuant to Title 35-A, section, 3403, subsection 3 of the Maine Revised Statutes, as amended.
The increase in assessed value captured by the municipality is excluded from the municipality’s equalized just value for each year’s State valuation filed with the Secretary of State in accordance with Title 36, Sections 208 and 305 of Maine Revised Statutes, as amended, and is therefore not included in calculating that municipality’s share of State educational aid, State municipal revenue sharing, the county tax or the 15% debt limitation for the municipality pursuant to Title 30-A, Section 5702 of the Maine Revised Statutes, as amended.
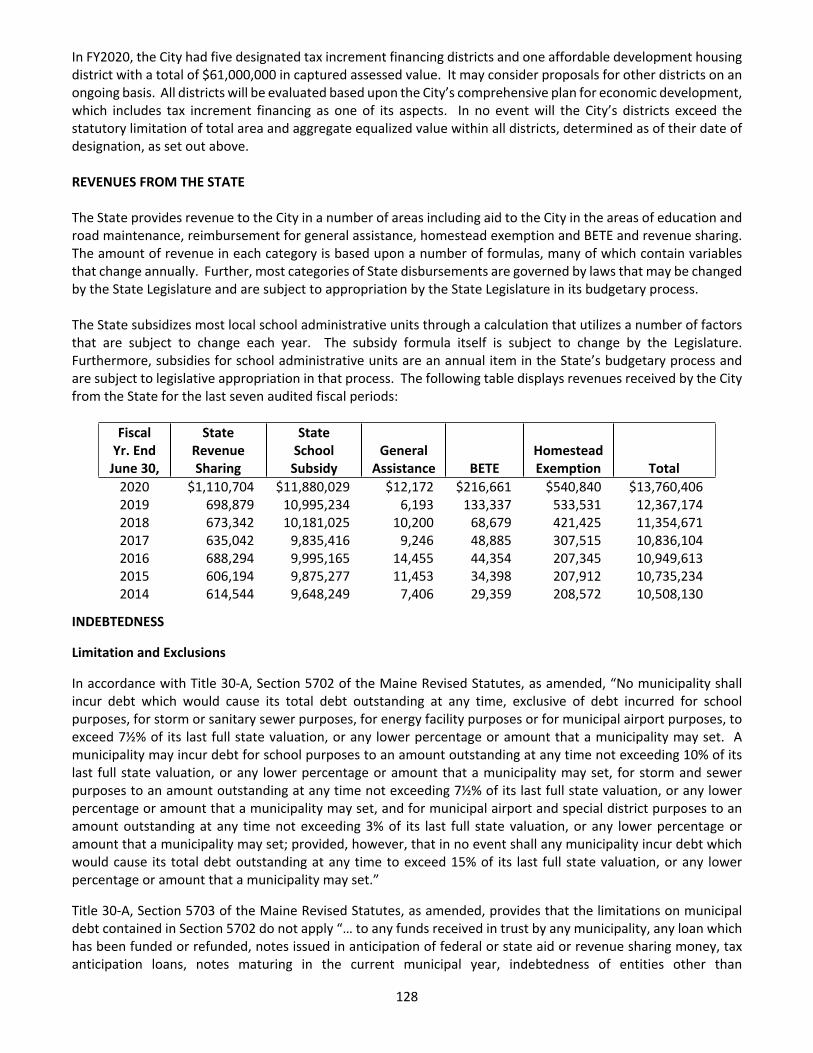
128
In FY2020, the City had five designated tax increment financing districts and one affordable development housing district with a total of $61,000,000 in captured assessed value. It may consider proposals for other districts on an ongoing basis. All districts will be evaluated based upon the City’s comprehensive plan for economic development, which includes tax increment financing as one of its aspects. In no event will the City’s districts exceed the statutory limitation of total area and aggregate equalized value within all districts, determined as of their date of designation, as set out above.
REVENUES FROM THE STATE
The State provides revenue to the City in a number of areas including aid to the City in the areas of education and road maintenance, reimbursement for general assistance, homestead exemption and BETE and revenue sharing. The amount of revenue in each category is based upon a number of formulas, many of which contain variables that change annually. Further, most categories of State disbursements are governed by laws that may be changed by the State Legislature and are subject to appropriation by the State Legislature in its budgetary process.
The State subsidizes most local school administrative units through a calculation that utilizes a number of factors that are subject to change each year. The subsidy formula itself is subject to change by the Legislature. Furthermore, subsidies for school administrative units are an annual item in the State’s budgetary process and are subject to legislative appropriation in that process. The following table displays revenues received by the City from the State for the last seven audited fiscal periods:
FiscalYr. End
June 30,
StateRevenueSharing
StateSchool
SubsidyGeneral
Assistance BETEHomesteadExemption Total
2020 $1,110,704 $11,880,029 $12,172 $216,661 $540,840 $13,760,4062019 698,879 10,995,234 6,193 133,337 533,531 12,367,1742018 673,342 10,181,025 10,200 68,679 421,425 11,354,6712017 635,042 9,835,416 9,246 48,885 307,515 10,836,1042016 688,294 9,995,165 14,455 44,354 207,345 10,949,6132015 606,194 9,875,277 11,453 34,398 207,912 10,735,2342014 614,544 9,648,249 7,406 29,359 208,572 10,508,130
INDEBTEDNESS
Limitation and Exclusions
In accordance with Title 30-A, Section 5702 of the Maine Revised Statutes, as amended, “No municipality shall incur debt which would cause its total debt outstanding at any time, exclusive of debt incurred for school purposes, for storm or sanitary sewer purposes, for energy facility purposes or for municipal airport purposes, to exceed 7½% of its last full state valuation, or any lower percentage or amount that a municipality may set. A municipality may incur debt for school purposes to an amount outstanding at any time not exceeding 10% of its last full state valuation, or any lower percentage or amount that a municipality may set, for storm and sewer purposes to an amount outstanding at any time not exceeding 7½% of its last full state valuation, or any lower percentage or amount that a municipality may set, and for municipal airport and special district purposes to an amount outstanding at any time not exceeding 3% of its last full state valuation, or any lower percentage or amount that a municipality may set; provided, however, that in no event shall any municipality incur debt which would cause its total debt outstanding at any time to exceed 15% of its last full state valuation, or any lower percentage or amount that a municipality may set.”
Title 30-A, Section 5703 of the Maine Revised Statutes, as amended, provides that the limitations on municipal debt contained in Section 5702 do not apply “… to any funds received in trust by any municipality, any loan which has been funded or refunded, notes issued in anticipation of federal or state aid or revenue sharing money, tax anticipation loans, notes maturing in the current municipal year, indebtedness of entities other than

129
municipalities, indebtedness of any municipality to the Maine School Building Authority, debt issued under Chapter 235 and Title 10, chapter 110, subchapter IV, obligations payable from revenues of the current municipal year or from other revenues previously appropriated by or committed to the municipality, and the state reimbursable portion of school debt.”
The City’s 2020 equalized state valuation (“equalized State Valuation”) is $762,350,000. The 15% debt limit is $114,352,500. As of June 30, 2020, the City’s long-term debt outstanding was $31,881,917, or 4.18% of the equalized State Valuation.
Outstanding Debt
The following table sets forth the City’s bonded debt, including bond anticipation notes and net debt as percentages of the City’s state equalized valuation as of the end of the current fiscal year and the most recently completed fiscal years.
Total Bonded Levy SupportedFiscal Year
G.O. BondedDebt
Total StateEqualized Bonded Debt
Debt as % of State Equalized
Debt as a % of State Equalized
End Outstanding Valuation(2) Per Capita(1) Valuation Valuation2020 $31,881,917 $762,350,000 $3,362 4.18% 2.13%2019 33,482,695 732,700,000 3,531 4.57 2.312018 36,409,536 721,000,000 3,840 5.00 2.352017 36,309,839 718,900,000 3,829 5.05 2.452016 37,081,743 721,350,000 3,911 5.10 2.382015 38,790,111 707,400,000 4,091 5.48 2.512014 39,975,865 715,750,000 4,216 5.59 2.482013 40,561,352 716,000,000 4,278 5.66 2.55
(1) The 2010 Federal Census is 9,482.(2) As determined by the State of Maine.
Debt Service Component of Operating Expenses
2016 2017 2018 2019 2020Gross Current Debt Service: $4,021,957 $4,091,727 $4,266,923 $4,092,529 $4,136,228
(less Self Support Enterprise): (1,918,264) (1,889,023) (1,885,474) (1,782,847) (1,617,689)Tax Backed Current Debt Svc: 2,103,693 2,202,704 2,381,449 2,309,682 2,518,539
Operating Expense: $34,426,000 $36,266,332 $37,495,801 $38,643,056 $39,831,773
Debt Service as % Oper. Exp: 6.11% 6.07% 6.35% 5.98% 6.32%
Debt Ratios
The following table sets forth the ratio of bonded debt to equalized State Valuation and per capita debt ratios for the end of the seven most recent audited fiscal years:
FY EndJune 30,
TotalDebt
Eq. State Val. (000)
Assessed Val. (000)
Debt as % Eq. Val.
Per CapitaDebt
2020 $31,881,917 $762,350 $761,988 4.2% $3,5312019 33,482,695 732,700 753,615 4.6 3,5312018 36,409,536 721,000 752,091 5.0 3,8402017 36,309,839 718,900 760,345 5.1 3,8292016 37,081,743 721,350 761,862 5.1 3,9112015 38,790,111 707,400 765,968 5.5 4,0912014 39,975,865 715,750 772,610 5.6 4,216
130
Future Financing
The City Manager develops a formal five-year Capital Improvement Plan (“CIP”), which includes an inventory of possible capital projects, some of which may ultimately be included in the annually approved CIP, and is an indication of future projects that may be financed through the issuance of indebtedness. The issuance of debt, however, is subject to the prior review and approval of the City Council.
In November 2015, the City Council authorized the borrowing of up to $1,500,000 from USDA Rural Development to finance improvements to the City’s water pollution control facilities, and various sewer system repairs. The loan is expected to close in the spring of 2021.
In November 2017, the City Council approved up to $4,200,000 from USDA Rural Development to finance additional sewer improvements. This loan is not expected to close until 2021 or later and will require some level of interim financing.
On October 9, 2019, the City Council authorized the issuance of up to $3,246,140 in general obligation bonds to finance ozone generation and application system replacement and other upgrades, improvements, machinery and equipment to and for the City’s Water Treatment Plant. This is planned to occur in December of 2020, dependent on the availability of potential grant funds that could be used to supplement borrowing.
In August 2020, the City Council authorized the issuance of up to $1,550,000 in general obligation bonds to finance planned capital improvements approved as part of the FY2021 budget process, which is planned to occur in the spring of 2021.