OMI UV validation at an urban environment
27
ACPD 8, 17467–17493, 2008 OMI UV validation at an urban environment S. Kazadzis et al. Title Page Abstract Introduction Conclusions References Tables Figures Back Close Full Screen / Esc Printer-friendly Version Interactive Discussion Atmos. Chem. Phys. Discuss., 8, 17467–17493, 2008 www.atmos-chem-phys-discuss.net/8/17467/2008/ © Author(s) 2008. This work is distributed under the Creative Commons Attribution 3.0 License. Atmospheric Chemistry and Physics Discussions This discussion paper is/has been under review for the journal Atmospheric Chemistry and Physics (ACP). Please refer to the corresponding final paper in ACP if available. Ozone Monitoring Instrument spectral UV irradiance products: comparison with ground based measurements at an urban environment S. Kazadzis 1,2 , A. Bais 2 , A. Arola 3 , N. Krotkov 4 , N. Kouremeti 2 , and C. Meleti 2 1 Finnish Meteorological Institute, Research and Development, Helsinki, Finland 2 Laboratory of Atmospheric Physics, Aristotle University Thessaloniki, Thessaloniki, Greece 3 Finnish Meteorological Institute, Research and Development, Kuopio, Finland 4 Goddard Earth Sciences and Technology Center, University of Maryland, Baltimore County, Baltimore, MD, USA Received: 8 July 2008 – Accepted: 27 August 2008 – Published: 24 September 2008 Correspondence to: S. Kazadzis (stylianos.kazantzis@fmi.fi) Published by Copernicus Publications on behalf of the European Geosciences Union. 17467
-
Upload
khangminh22 -
Category
Documents
-
view
1 -
download
0
Transcript of OMI UV validation at an urban environment

ACPD8, 17467–17493, 2008
OMI UV validation atan urban
environment
S. Kazadzis et al.
Title Page
Abstract Introduction
Conclusions References
Tables Figures
J I
J I
Back Close
Full Screen / Esc
Printer-friendly Version
Interactive Discussion
Atmos. Chem. Phys. Discuss., 8, 17467–17493, 2008www.atmos-chem-phys-discuss.net/8/17467/2008/© Author(s) 2008. This work is distributed underthe Creative Commons Attribution 3.0 License.
AtmosphericChemistry
and PhysicsDiscussions
This discussion paper is/has been under review for the journal Atmospheric Chemistryand Physics (ACP). Please refer to the corresponding final paper in ACP if available.
Ozone Monitoring Instrument spectral UVirradiance products: comparison withground based measurements at an urbanenvironmentS. Kazadzis1,2, A. Bais2, A. Arola3, N. Krotkov4, N. Kouremeti2, and C. Meleti2
1Finnish Meteorological Institute, Research and Development, Helsinki, Finland2Laboratory of Atmospheric Physics, Aristotle University Thessaloniki, Thessaloniki, Greece3Finnish Meteorological Institute, Research and Development, Kuopio, Finland4Goddard Earth Sciences and Technology Center, University of Maryland, Baltimore County,Baltimore, MD, USA
Received: 8 July 2008 – Accepted: 27 August 2008 – Published: 24 September 2008
Correspondence to: S. Kazadzis ([email protected])
Published by Copernicus Publications on behalf of the European Geosciences Union.
17467

ACPD8, 17467–17493, 2008
OMI UV validation atan urban
environment
S. Kazadzis et al.
Title Page
Abstract Introduction
Conclusions References
Tables Figures
J I
J I
Back Close
Full Screen / Esc
Printer-friendly Version
Interactive Discussion
Abstract
We have compared spectral ultraviolet overpass irradiances from the Ozone Monitor-ing Instruments (OMI) against ground-based Brewer measurements at Thessaloniki,Greece from September 2004 to December 2007. It is demonstrated that OMI overes-timates UV irradiances by 30%, 17% and 13% for 305 nm, 324 nm, and 380 nm respec-5
tively and 20% for erythemally weighted irradiance. The bias between OMI and Brewerincreases with increasing aerosol absorption optical thickness. We present methodolo-gies that can be applied for correcting this bias based on experimental results derivedfrom the comparison period and also theoretical approaches using radiative transfermodel calculations. All correction approaches minimize the bias and the standard de-10
viation of the ratio OMI versus Brewer ratio. According to the results, the best correctionapproach suggests that the OMI UV product has to be multiplied by a correction factorCA(λ) are in the order of 0.8, 0.88 and 0.9 for 305 nm, 324 nm and 380 nm respectively.Limitations and possibilities for applying such methodologies in a global scale are alsodiscussed.15
1 Introduction
During the past decades a lot of effort has been put into composing global UV irra-diance climatology datasets using ground based (GB) measurements from differentlocations (WMO, 2007). However, due to the limited availability of long term UV dataseries, combined with the fact that GB measurements cover a small fraction of the20
Earth’s surface, satellite sensors are widely used for estimating UV irradiance reachingthe ground from ozone and reflectivity measurements, have gained particular atten-tion. The development of satellite UV estimation techniques have been among themost important scientific issues within the UV community during the previous years(e.g. Krotkov et al., 2002). Following the many successful years that Total Ozone Map-25
ping Spectrometer (TOMS) has been providing global UV irradiance measurements,
17468

ACPD8, 17467–17493, 2008
OMI UV validation atan urban
environment
S. Kazadzis et al.
Title Page
Abstract Introduction
Conclusions References
Tables Figures
J I
J I
Back Close
Full Screen / Esc
Printer-friendly Version
Interactive Discussion
the Ozone Monitoring Instrument started providing global UV data since September2004 (Tanskanen et al., 2007).
OMI is a Dutch-Finnish instrument that flies on NASA’s Aura Mission as part of theEarth Observation System (EOS) launched in July 2004. AURA is part of a constel-lation of satellites known as the A-Train. OMI is a contribution of the Netherlands’s5
Agency for Aerospace Programs (NIVR) in collaboration with the Finnish Meteorologi-cal Institute (FMI) to the EOS Aura mission and provides information on various atmo-spheric parameters (Levelt et al., 2006), such as ozone, aerosols, clouds, surface UVirradiance and other trace gasses. OMI is a wide swath, nadir viewing, near-UV andvisible spectrograph that measures solar ultraviolet and visible reflected and backscat-10
tered radiation in the range 270–500 nm (Levelt et al., 2006). The spatial resolution ofthe measurements is 13×24 km2 in nadir and larger towards the edges of the swath.
One of the goals of OMI is the investigation of changes in global surface UV irra-diance. Surface UV estimates based on satellite data have been used extensively inthe last decade to establish global UV climatologies and to examine possible long-term15
changes in surface UV (WMO, 2007 and references therein). The OMI surface UValgorithm consists of a calculation for clear sky cases extended with corrections in thecase of cloudy pixels (or ones containing non-absorbing aerosols) (Tanskanen et al.,2006). In the real atmosphere, provided that cloud screening procedures are accu-rately taken into account, the accuracy of the UV product is limited by the imperfect20
knowledge of aerosol properties and pollutants mainly in the boundary layer. Cloudeffects have also a large impact in the UV retrieval from OMI and in addition they needto be accurately detected for reliable OMI aerosol retrieval. The small pixel-size ofOMI, as compared with TOMS, is a major advantage for cloud screening. The valida-tion of satellite-derived UV products against GB measurements is an essential task in25
order to assess their accuracy. Several validation studies with heritage TOMS satelliteinstrument (e.g. Herman et al., 1999; Fioletov et al., 2002; Kazantzidis et al., 2006)revealed a positive bias in many locations, with the satellite derived UV being higher.It was also observed that satellite UV agrees much better with the GB measurements
17469

ACPD8, 17467–17493, 2008
OMI UV validation atan urban
environment
S. Kazadzis et al.
Title Page
Abstract Introduction
Conclusions References
Tables Figures
J I
J I
Back Close
Full Screen / Esc
Printer-friendly Version
Interactive Discussion
at pristine sites (Lauder, in New Zealand (McKenzie et al., 2001), or Canadian Westcoast (Fioletov et al., 2002) than in more polluted European and North-American sites(Kazantzidis et al., 2006). Therefore, it was suggested that at least part of the biascould be attributed to the boundary layer aerosol absorption, not accounted for in thecurrent satellite UV algorithm (Krotkov et al., 2002; Arola et al., 2005).5
Lately, Tanskanen et al. (2008) focused on the validation of the widely used daily ery-themally weighted irradiance. The satellite-derived erythemal daily doses were com-pared with those derived from the ground-based measurements at 17 sites and 18instruments. The main objectives of this study were to discuss the applicability of theOMI data for surface UV monitoring and to establish a more accurate cloud correction10
method for UV retrieval. One of their conclusions, confirmed also by Ialongo et al.,2008, is that the OMI UV aerosol absorption plays an important role in the UV radiationlevels reaching the ground and for such cases OMI overestimates the calculated sur-face UV irradiance levels, especially at urban areas, by 20% to 40%. With regard to thespectral aspect, Wuttke et al. (2003) emphasized the importance of spectral compar-15
isons within validation studies as a mean to provide possible hints about the sourcesof uncertainties.
In this study we focus on comparing OMI and GB UV spectral measurements atdifferent wavelengths at the urban aerosol environment of Thessaloniki, Greece. Thedifference at each wavelength is quantified and categorized according to the presence20
of clouds or aerosols in the area. Furthermore, we investigate possible off-line correc-tion formulas in order to take into account aerosol absorption effects that influence theOMI UV.
17470

ACPD8, 17467–17493, 2008
OMI UV validation atan urban
environment
S. Kazadzis et al.
Title Page
Abstract Introduction
Conclusions References
Tables Figures
J I
J I
Back Close
Full Screen / Esc
Printer-friendly Version
Interactive Discussion
2 Materials and methods
2.1 Ground based measurements
At the Laboratory of Atmospheric Physics, Aristotle University of Thessaloniki (AUTH),a monitoring program for spectral solar irradiance measurements has been in opera-tion since 1989, using a Brewer MK III (290–365 nm, 0.5 nm step) spectroradiometer5
(Garane et al., 2006). In addition, direct irradiance spectra under cloud-free conditionsand total ozone measurements have been used to derive aerosol optical thickness(AOT) (Kazadzis et al., 2007). The monitoring program includes a suite of other ra-diometric measurements and observations that are used for the characterization of theatmospheric conditions during the measurements. These ancillary measurements in-10
clude: solar irradiance at 302, 312, 320, 340 and 380 nm and erythemal irradiancefrom two NILU-UV multi-filter radiometers, erythemal irradiance from a YES UVB-1 ra-diometer, shortwave solar irradiance from a Kipp & Zonnen CM 21 pyranometer andsky images sampled every 5 min. These data sets have been used to compare irradi-ance measurements at the surface with the overpass irradiance data calculated from15
OMI measurements.The monitoring station is located at the center of the city of Thessaloniki which is
the second largest city in Greece, with a population of 1.2 million, and is bounded tothe north by the Balkan countries and to the south by the Aegean Sea. Thessaloniki isaffected by both anthropogenic and natural emission sources (Kazadzis et al., 2007).20
Local emissions and regional pollution transport contribute to the poor air quality of thecity which is reflected mostly in particulate matter (PM) concentrations. The 24 h limitvalues for PM10 (50µgr/m3) are exceeded for more than half of the days during a year inthe city centre’s environmental monitoring sites. The amount of aerosols in this locationis quite high, with a annual mean AOT at 340 nm equal to 0.45 and monthly values25
ranging between 0.3 and 0.7, for winter and summer months, respectively (Kazadzis etal., 2007).
Comparisons of GB data with OMI products were conducted for the spectral irra-17471
ACPD8, 17467–17493, 2008
OMI UV validation atan urban
environment
S. Kazadzis et al.
Title Page
Abstract Introduction
Conclusions References
Tables Figures
J I
J I
Back Close
Full Screen / Esc
Printer-friendly Version
Interactive Discussion
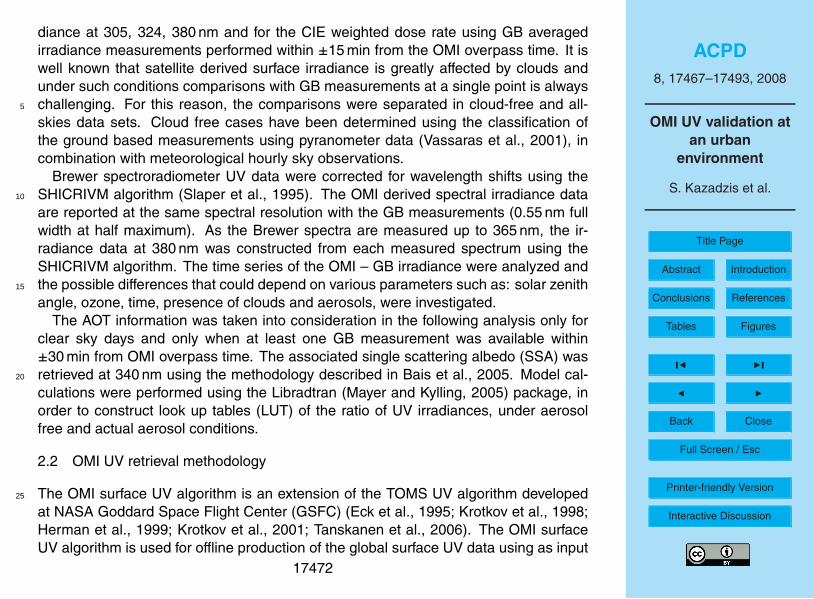
diance at 305, 324, 380 nm and for the CIE weighted dose rate using GB averagedirradiance measurements performed within ±15 min from the OMI overpass time. It iswell known that satellite derived surface irradiance is greatly affected by clouds andunder such conditions comparisons with GB measurements at a single point is alwayschallenging. For this reason, the comparisons were separated in cloud-free and all-5
skies data sets. Cloud free cases have been determined using the classification ofthe ground based measurements using pyranometer data (Vassaras et al., 2001), incombination with meteorological hourly sky observations.
Brewer spectroradiometer UV data were corrected for wavelength shifts using theSHICRIVM algorithm (Slaper et al., 1995). The OMI derived spectral irradiance data10
are reported at the same spectral resolution with the GB measurements (0.55 nm fullwidth at half maximum). As the Brewer spectra are measured up to 365 nm, the ir-radiance data at 380 nm was constructed from each measured spectrum using theSHICRIVM algorithm. The time series of the OMI – GB irradiance were analyzed andthe possible differences that could depend on various parameters such as: solar zenith15
angle, ozone, time, presence of clouds and aerosols, were investigated.The AOT information was taken into consideration in the following analysis only for
clear sky days and only when at least one GB measurement was available within±30 min from OMI overpass time. The associated single scattering albedo (SSA) wasretrieved at 340 nm using the methodology described in Bais et al., 2005. Model cal-20
culations were performed using the Libradtran (Mayer and Kylling, 2005) package, inorder to construct look up tables (LUT) of the ratio of UV irradiances, under aerosolfree and actual aerosol conditions.
2.2 OMI UV retrieval methodology
The OMI surface UV algorithm is an extension of the TOMS UV algorithm developed25
at NASA Goddard Space Flight Center (GSFC) (Eck et al., 1995; Krotkov et al., 1998;Herman et al., 1999; Krotkov et al., 2001; Tanskanen et al., 2006). The OMI surfaceUV algorithm is used for offline production of the global surface UV data using as input
17472

ACPD8, 17467–17493, 2008
OMI UV validation atan urban
environment
S. Kazadzis et al.
Title Page
Abstract Introduction
Conclusions References
Tables Figures
J I
J I
Back Close
Full Screen / Esc
Printer-friendly Version
Interactive Discussion
the OMI TOMS total column ozone (Bhartia and Wellemeyer, 2002) and reflectanceat non-absorbing wavelength (360 nm). The common approach involves estimation ofthe clear-sky surface irradiance Eclear which is adjusted to actual surface irradiance byusing a satellite derived cloud/aerosol transmittance factor CT :
Ecloud = EclearCT (1)5
The a-priori surface albedo information required for modeling of the surface UV ir-radiance is not point-wise surface albedo but rather a regional quantity, referred toas effective albedo, and describes the overall effect of the surface albedo of the sur-rounding area on the surface UV irradiance. The radiative transfer model involves aclimatological set of latitude-dependent ozone and temperature profiles. Krotkov et10
al. (1998) describe the details of the model and assumptions used in determination ofthe clear-sky irradiance. They conclude that in the absence of clouds, aerosols, andsnow cover, the satellite estimates of the surface UV can have accuracies comparableto the GB measurements. Additional information on clear sky modeling approachescan be found in Tanskanen et al. (2008). For the calculation of CT , Krotkov et al. (2001)15
presented two alternative cloud correction methods: (1) based on modified LambertianEquivalent Reflectivity (LER) model (Eck et al., 1995) and (1) based on homogeneousplane-parallel C1 cloud layer. LER is determined by solving a simple form of the radia-tive transfer equation that assumes a pure Rayleigh scattering atmosphere boundedby an isotropically scattering Lambertian surface (e.g., Bhartia et al., 1993) at terrain20
pressure, and CT is estimated from equation:
CT =1 − LER1 − Rs
(2)
where Rs is surface albedo.Absorbing aerosols (e.g., organic carbon, smoke, and dust) or trace gases (e.g.,
NO2, SO2) are known to lead to systematic overestimation of the surface UV irradiance25
(Krotkov et al., 1998; Arola et al., 2005; Chubarova, 2004). The current OMI surfaceUV algorithm assumes no aerosol absorption. In this work we introduce an additional
17473

ACPD8, 17467–17493, 2008
OMI UV validation atan urban
environment
S. Kazadzis et al.
Title Page
Abstract Introduction
Conclusions References
Tables Figures
J I
J I
Back Close
Full Screen / Esc
Printer-friendly Version
Interactive Discussion
aerosol absorption correction factor CA that can be applied to post-correct operationalOMI UV data as follows:
Ecorr = CA ∗ Ecloud = CA ∗ EclearCT (3)
The CA is defined to be equal unity in case of non-absorbing aerosols (sulfate, seasalt) and less than unity in case of absorpbing aerosols (i.e. dust, carbonaceous, pollu-5
tion). In this paper we provide and compare several algorithms for estimating CA, whichcan be later applied for a post correction of the operational OMI UV data according toEq. (3) to account for aerosol absorption effects.
3 Results
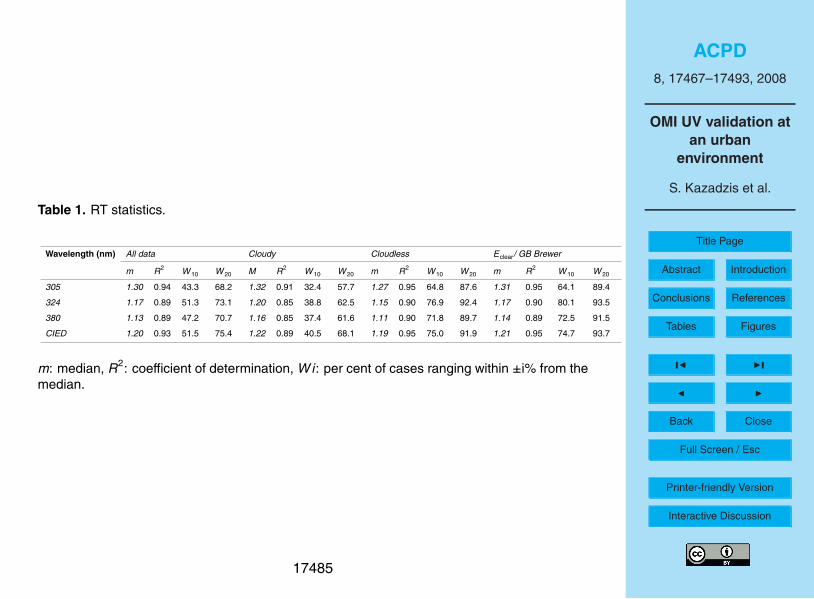
3.1 Validation statistics10
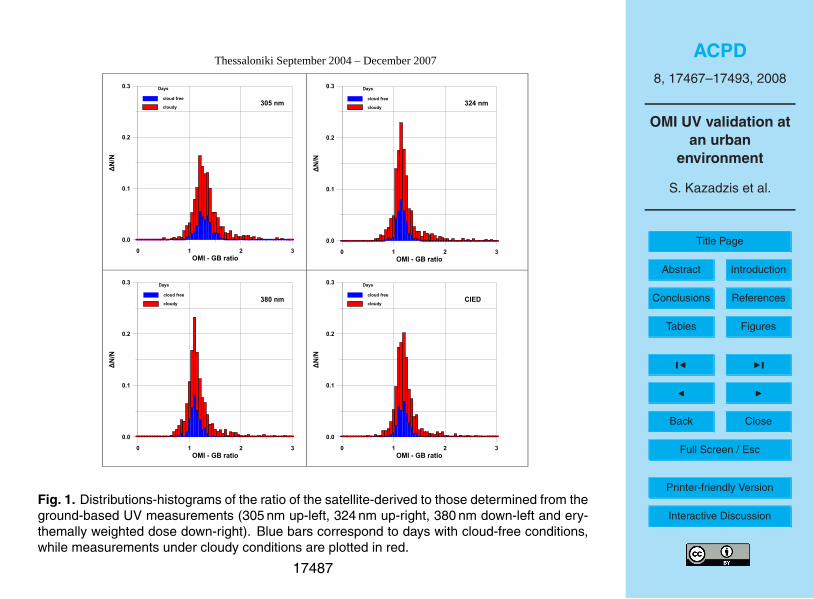
The comparison of the Brewer spectroradiometer GB measurements and OMI standardUV product (Ecloud) was assessed by studying the OMI/GB ratio (RT). The histogramsof RT are plotted for each of the three wavelengths and the CIE dose rate separately.The distributions were analyzed by calculating the median value of RT (m). Additionallywe have determined the percentage of the satellite-derived data that agrees within ±1015
and ±20% with the reference data (denoted as W10 and W20, respectively). Cloudlesscases statistics are also presented. In addition, and only for cloudless cases, GBmeasurements are compared with Eclear to assess the calculated CT that for this casesincludes only aerosol scattering correction.
The validation statistics are presented in Table 1. Together with the median and the20
W10 and W20 the coefficient of determination (R2) is presented.Results of Fig. 1 and Table 1 show an overall overestimation of the Ecloud compared
with the GB measurements. The bias is larger for shorter wavelengths. The biasslightly increases (10%–15%) for all sky (cloudless or cloudy) conditions compared tothe clear sky cases (Table 1). Also, the W10 and W20 percentages are dropped by25
17474

ACPD8, 17467–17493, 2008
OMI UV validation atan urban
environment
S. Kazadzis et al.
Title Page
Abstract Introduction
Conclusions References
Tables Figures
J I
J I
Back Close
Full Screen / Esc
Printer-friendly Version
Interactive Discussion
approximately 10%. For the cloud free cases the coefficient of determination is higherthan 0.9, while W20 percentages reach 90% for all cases. It has to be mentionedthat total number of cases (days) analyzed was 810 while 267 of them were cloudfree. Concerning the comparison (shown last column of Table 1) with the Eclear modelcalculations from OMI algorithm (1), it has to be noted that differences among Eclear and5
Brewer GB on cloudless conditions are in the order of 2–3% which are the levels of thecorrection that is included in the OMI UV algorithm for non-absorbing aerosol effects. Inorder to evaluate additional correction methodologies for absorbing aerosols we havebeen using the above dataset and measured results for the area of Thessaloniki.
4 Aerosol effects10
4.1 UV attenuation due to aerosols
The Thessaloniki area is characterized by strongly aerosol load, with particularly ab-sorbing aerosols and increased air pollution (Bais et al., 2005; Koukouli et al., 2006;Amiridis et al., 2005). Thus it can easily be argued that the degree of overestimation ofthe Thessaloniki OMI surface UV irradiance under cloudless conditions is mainly due15
to the aerosol absorbing layers not taken into account in the OMI UV algorithm.Three year monthly mean AOT and total ozone climatological data from Thessaloniki
have been used as inputs to the Libradtran radiative transfer model to calculate theattenuation of UV irradiance at 324 nm due to aerosols (Fig. 2). The SSA used forthese calculations was set to 0.90 at 340 nm. Figure 2 also shows the bias between20
operational OMI UV (Ecloud) and GB measurements, under cloud free conditions.According to the statistics presented in Table 1, 77% of the measurements are within
the ±10% range shown in the right part of Fig. 2. Figure 2 shows just an example ofcomparing the magnitude of the UV attenuation due to aerosols with the OMI–GBdifferences. The deviation of the two curves during the winter months is most probably25
due to the constant SSA used in the model calculations. Arola et al. (2005) have shown
17475

ACPD8, 17467–17493, 2008
OMI UV validation atan urban
environment
S. Kazadzis et al.
Title Page
Abstract Introduction
Conclusions References
Tables Figures
J I
J I
Back Close
Full Screen / Esc
Printer-friendly Version
Interactive Discussion
that for the Thessaloniki area and during the period 1997–2003 SSA in the UV is lower,hence signifying higher absorption, during wintertime.
4.2 Investigation of possible post-correction methods
Based in the above results, in this section we investigate various methodologies thatcould probably be used for correcting this aerosol absorption effect on the OMI retrieved5
UV products and to calculate CA. For this purpose the Aerosol Absorption OpticalThickness (Ta) as is defined from the following formula, was used:
AAOT(λ) = AOT(λ) ∗ [1 − SSA(340 nm)] (4)
The methodologies shown below are based on the dependence of RT to AAOT andcan be: (a) experimental, using the results of GB and OMI measurements and (b)10
theoretical, using radiative transfer model calculations.The experimental method is based on the investigation of a similar TOMS to GB bias
presented in Arola et al. (2005) which here is performed by comparing GB and OMIdata under clear sky conditions. In Fig. 3 the ratio OMI versus GB measurements at324 nm under clear sky conditions is shown against AAOT.15
The AOT is measured within ±30 min from the OMI overpass at 324 nm and the SSAis derived from Brewer irradiance measurements based on the methodology by Baiset al. (2005). The calculated slope was found equal with 2.1 per unit of AAOT andwith an intercept of 1.07. Using this slope we investigated if such a correction couldimprove the observed bias showed in Table 1. In addition, results presented by Krotkov20
et al. (2005), that calculated RT through AOT, and SSA measurements at Washingtonarea for TOMS satellite, proposed a similar correction using the formula:
CA = [1 + 3 ∗ AAOT(λ)]−1 (5)
The method presented above is solar zenith angle independent. However, the effectsof an aerosol absorbing layer will lead to higher UV attenuation at higher solar zenith25
17476

ACPD8, 17467–17493, 2008
OMI UV validation atan urban
environment
S. Kazadzis et al.
Title Page
Abstract Introduction
Conclusions References
Tables Figures
J I
J I
Back Close
Full Screen / Esc
Printer-friendly Version
Interactive Discussion
angles due to the increased optical path of the solar photons through this layer. Forthat purpose we tried to eliminate the solar zenith angle effect on aerosol absorptionfollowing an idea of Garcia et al. (2006). We used slant absorption optical thickness(AAOTS) instead of AAOT, which is defined as:
AAOTS = AAOT/cos(sza) (6)5
where sza is the solar zenith angle. Using the same dataset presented in Fig. 3 wecalculated the RT dependence on AAOTS, shown in Fig. 4.
This method provides a new slope of 1.6 per unit of aerosol slant column absorptionoptical thickness and an intercept of 1.06. The solar zenith angle impact on the effectof aerosol in the UV irradiance is crucial especially for locations with annual AOT and10
SSA variations. As an example, the case of Thessaloniki where AOT measurementsshow a summer AOD maximum with mean values almost double than those observedduring the winter months (Kazadzis et al., 2007). However, measurements over thecity show enhanced SSA in wintertime leading to the increase of AAOT accordingto formula 1 which results in an almost constant AAOT during the year (Arola et al.,15
2005). In addition, as the OMI overpass time is almost constant throughout the year,wintertime measurements are performed at higher solar zenith angles than the onesin summertime. All the above are not taken into consideration in the first method andcould lead to comparable UV attenuation due to aerosols in winter and in summerdespite the fact that AOT is higher in summertime.20
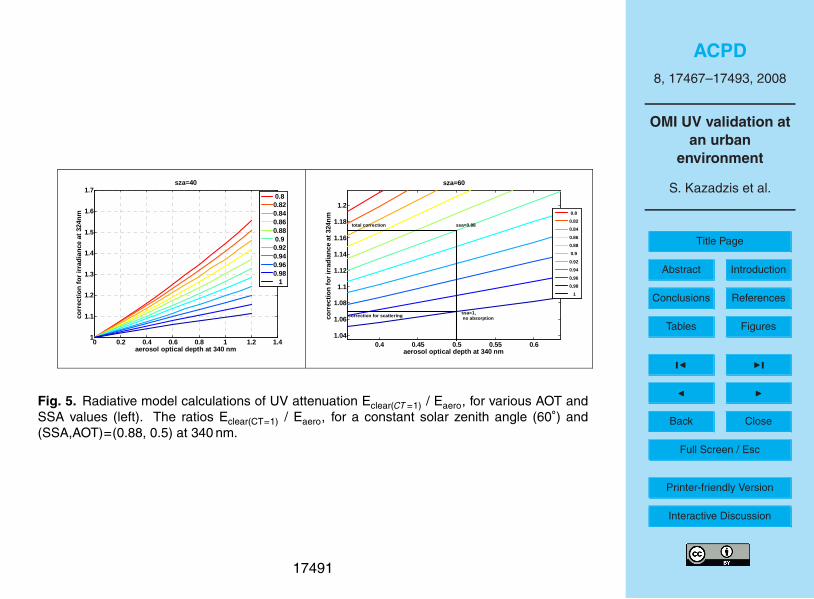
Another approach that was investigated was to calculate CA with the use of modelcalculations. The absorbing aerosol layers that are “invisible” for the OMI instrumentlead to the underestimation of the attenuation of UV irradiance reaching the ground.With the help of the Libradtran radiative transfer model we constructed look up tables(LUT) quantifying aerosol scattering and absorption due to an aerosol layer. An ex-25
ample is shown in Figs. 5a and 5b: Lines in Fig. 5a represent the UV irradiance ratioEclear(CT=1)/Eaero, where Eaero is the UV irradiance calculated with the help of the LUT’sfor various SSA,and AOT cases. This ratio is presented here as a function of AOT
17477

ACPD8, 17467–17493, 2008
OMI UV validation atan urban
environment
S. Kazadzis et al.
Title Page
Abstract Introduction
Conclusions References
Tables Figures
J I
J I
Back Close
Full Screen / Esc
Printer-friendly Version
Interactive Discussion
and SSA for a constant solar zenith angle of 40◦ and total column ozone of 340 DU.As expected the higher the AOT and the lower the SSA, lead to higher correction fac-tors calculated. For a certain case of SSA (0.88 at 340 nm) and AOT of 0.5 at 340 nmthe correction factor shown in Fig. 5b is ∼17%. While ∼6.5% of this is due to aerosolscattering (that is already taken into account on the OMI correction through CT ) and5
∼10.5% due to aerosol absorption, for UV irradiance at 324 nm.All the above methods include the premise that various parameters like AOT and
SSA in the UV (preferably) or in the visible (through AERONET data) have to be knownin order to be used for calculating CA on a global scale. We have used Thessalonikidata to investigate how the CA statistics derived from the theoretical method are al-10
tered when using a constant (climatological) AOT and SSA. For this purpose we haveused synchronous AOT Brewer measurements at 340 nm and a mean SSA (0.91) at440 nm for the 2004–2007 period (Kazadzis et al., 2007), derived from a CIMEL sun-photometer. Through the calculated LUT’s we have retrieved CA using cloud-free daysonly. The results of the statistics for all of the above correction methods are provided15
in the following Table 2:The results presented in Table 2 are the OMI–GB ratios after applying each method’s
calculated CA’s. All methods presented here lead to an improvement of the OMI–GBbias. Especially method #3 (shown in this table), that is described by formula (5), pro-vides the best correction approach. The use of either of the aforementioned methods20
by any ground-based measuring station depends on the availability of independentaerosol optical properties data (AOT, SSA).
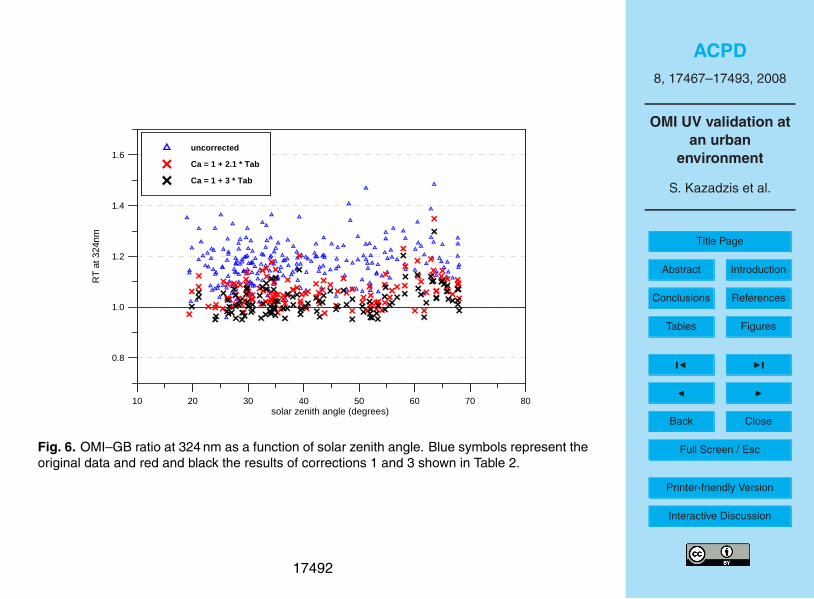
We have tried to investigate possible dependence of solar zenith angle, aerosol op-tical thickness, absorption optical thickness, ozone or time to the original and correc-tion applied datasets. No systematic dependence of CA to the above parameters was25
found. As an example, the results of the application of the above methods to the timeseries of RT measurements are shown in the following Fig. 6.
Using the CA’s retrieved by method #3 (on Table 2) we have calculated correctedOMI UV irradiances for 305 nm, 324 nm and 380 nm which are presented in Fig. 7:
17478

ACPD8, 17467–17493, 2008
OMI UV validation atan urban
environment
S. Kazadzis et al.
Title Page
Abstract Introduction
Conclusions References
Tables Figures
J I
J I
Back Close
Full Screen / Esc
Printer-friendly Version
Interactive Discussion
Confirming further the results of Table 2, the coefficients of determination calculatedafter applying the corrections are much improved. It has to be mentioned that thenumber of the original cases shown in Fig. 7 is 267 (cloudless cases over 3.5 yearsperiod), while the corrected ones are only 201 due to the absence of coincident aerosoloptical thickness measurements within one hour from the OMI overpass.5
5 Discussion and conclusions
Three and a half years of the operational OMI UV data and Brewer UV irradiancemeasurements were compared for the area of Thessaloniki, Greece. Lergest positiveOMI biases were found at 305 nm that reach 32% and 27% for cloudy and cloudlessmeasurements. Smaller biases were found for UVA wavelengths: 20% and 16% at10
324 nm and 16% and 11% at 380 nm, respectively. The biases were attributed to theabsorption of aerosols not taken into account from the OMI algorithm.
Various methods have been tested in order to investigate the possibility of an OMIUV data post correction for absorbing aerosols. All methods presented here lead toimproved OMI-GB comparisons. Using AOT measurements at the exact wavelengths15
analyzed and SSA measurements at 340 nm the correction methodologies were com-pared. Results showed that for 305 nm the averaged correction CA is compensatingfor most of the observed overestimation while for 324 nm and for 380 nm the correctionmethods eliminate most of the observed biases.
The post correction factors, CA calculated for Thessaloniki area using formula 5 are20
in the order of 0.8, 0.88 and 0.9 for 305 nm, 324 nm and 380 nm, respectively. Suchvalues can be used for urban areas with similar or measured aerosol optical properties.Using the slopes of RT as a function of AAOT, measured at Thessaloniki, there remainsa 9%, 6% and 4% positive OMI bias not related to aerosol absorption. A possible expla-nation for this could be the fact that in cloudless cases, absorbing aerosols attenuate25
also the reflected irradiance from the ground. That could lead to a small underesti-mation of LER resulting to a small CT overestimation (see Eq. 2). The final estimated
17479

ACPD8, 17467–17493, 2008
OMI UV validation atan urban
environment
S. Kazadzis et al.
Title Page
Abstract Introduction
Conclusions References
Tables Figures
J I
J I
Back Close
Full Screen / Esc
Printer-friendly Version
Interactive Discussion
surface irradiance from OMI will be overestimated especially at low SSA cases. On thecontrary, using formula (5) which introduces a larger slope than the one measured, ina way, this effect is eliminated. Spectral differences of methods 1 and 2 presented inTable 2 can be also a result of spectral dependence of the SSA.
Comparing total column ozone values retrieved from OMI and GB measurements we5
found a small OMI ozone under-estimation in the order of 1.2% (mean), which can bealso have a (smal) effect to all OMI–GB comparisons, especially at 305 nm.
Model calculations using measurements of a CIMEL sun-photometer were intro-duced because of the availability of such measurements (especially SSA) from thespecific instruments worldwide. The method retrieves larger CA and the corrected RT’s10
still show OMI overestimation especially for lower wavelengths. One possible explana-tion for the above results could be the spectral dependence of SSA. Previous works(Krotkov et al., 2005) indicated that SSA could be less in UVB than in the visible wave-length range especially at the urban area under investigation. This SSA effect becomesmore complicated when considering seasonal variations of absorbing aerosol proper-15
ties. As the mean SSA at 440 nm for the area is 0.91 using a value of 0.88 for correctionat 380 nm, leads to a few per cent differences among the corrected OMI irradiances andthe GB ones. However, an SSA value that could be used for achieving similar resultsfor the 305nm irradiance would be approximately 0.84. Measurements of SSA in theUVB are still uncertain especially when AOT is low and further investigation on the20
absorbing aerosol and gaseous (NO2, SO2) properties at these wavelengths is still anintriguing scientific future issue.
The standard deviation for all cloudless OMI vs Brewer ratios were found to be rea-sonable, taking into account possible OMI sub-pixel variability of AOT and thus UVirradiances. Results of OMI sub-pixel UV variability showed that for pixels that include25
urban areas UV variability can be as high as 20% even for cloudless conditions. Whilea similar campaign in a non urban environment (Weihs et al., 2008) showed that forcloudy conditions UV variability can reach 50%. The above results show the limitationswhen comparing satellite with single point GB measurements.
17480

ACPD8, 17467–17493, 2008
OMI UV validation atan urban
environment
S. Kazadzis et al.
Title Page
Abstract Introduction
Conclusions References
Tables Figures
J I
J I
Back Close
Full Screen / Esc
Printer-friendly Version
Interactive Discussion
For the case of cloudy conditions the OMI–Brewer ratios showed approximately 5%higher values than the cloud-free ones and in addition higher standard deviation. Forthe higher values the explanation is the high UV irradiance variability under cloudy con-ditions and the absence of information on the amount of the direct sun attenuation foreach individual measurement. An additional reason is the fact that OMI overpasses5
and GB spectral measurements are not exactly synchronous, which is important issuecomparing UV measurements under a variable radiation field. The absolute level dif-ferences and their spectral dependence indicate that similar CA’s have to be applied incloudy cases too. However, the UV attenuation due to aerosol absorption under cloudyconditions is more difficult to be studied theoretically, as more information about the10
clouds and the aerosol layer height are necessary. In addition, aerosol absorption isdifficult to be quantified as sun-photometric measurements fail under cloudy conditions.In this case, the calculated CA’s can be used, or other possible correction procedureshave to be considered.
Post processing algorithms for OMI-UV products have to be employed when using15
OMI data for regions with high aerosol load. Simple parameters for public use (e.g. UVIndex) can be overestimated by more than 20% if using OMI overpass data for urbanareas such as Thessaloniki. The use of climatological mean values of AOT and ab-sorption (SSA) aerosol quantities in a global scale could be used based in one of themethodologies presented in this work. Finally, when it is possible, the spectral depen-20
dence of AOT and SSA has to be taken into account in order to include a correction forthe spectral dependence of UV attenuation reaching the ground, in the presence of anaerosol layer.
Acknowledgements. The Dutch-Finnish built OMI instrument is part of the NASA EOS Aurasatellite payload. The OMI project is managed by NIVR and KNMI in the Netherlands. We25
thank the OMI International Science Team for the satellite data used in this study.
Stelios Kazadzis would like to acknowledge the Marie Curie Intra European fellowship “Vali-dation of Aerosol optical Properties and surface Irradiance measured from Ozone MonitoringInstrument on board of AURA satellite” VAP-OMI, AOR A/119693 - PIEF-GA-2008-219908.
17481

ACPD8, 17467–17493, 2008
OMI UV validation atan urban
environment
S. Kazadzis et al.
Title Page
Abstract Introduction
Conclusions References
Tables Figures
J I
J I
Back Close
Full Screen / Esc
Printer-friendly Version
Interactive Discussion
References
Arola, A., Kazadzis, S., Krotkov, N., Bais, A., Grobner, J., and Herman, J. R.: Assessment ofTOMS UV bias due to absorbing aerosols, J. Geophys. Res.-Atmos., 110 (23), 1–7, 2005.
Amiridis, V., Balis, D. S., Kazadzis, S., Bais, A., Giannakaki, E., Papayannis, A., and Zerefos, C.:Four-year aerosol observations with a Raman lidar at Thessaloniki, Greece, in the framework5
of European aerosol Research Lidar Network (EARLINET), J. Geophys. Res., 110 (D21),D21203, doi:10.1029/2005JD006190, 2005.
Bais, A. F., Kazantzidis, A., Kazadzis, S., Balis, D. S., Zerefos, C. S., and Meleti, C.: Deriving aneffective aerosol single scattering albedo from spectral surface UV irradiance measurements,Atmos. Environ., 39 (6), 1093–1102, 2005.10
Bhartia, P. K., J. Herman, R. D. McPeters, and Torres, O.: Effect of Mount Pinatubo aerosolson total ozone measurements from backscatter ultraviolet (BUV) experiments, J. Geophys.Res., 98 (D10), 18 547–18 554, 1993.
Bhartia, P. K. and Wellemeyer, C. W.: TOMS-V8 total O3 algorithm, in OMI Algorithm Theoreti-cal Basis Document, NASA Goddard Space Flight Cent., Greenbelt, Md., 1–91, 2002.15
Chubarova N.: Influence of Aerosol and Atmospheric Gases on Ultraviolet Radiation in DifferentOptical Conditions Including Smoky Mist of 2002, Doklady Earth Sciences, 394, 1, 2004, 62–67, Translated from Doklady Akademii Nauk, 394, 1, 105–111, 2004.
Eck, T. F., Holben, B. N., Dubovik, O., Smirnov, A., Goloub, P., Chen, H. B., Chatenet, B.,Gomes, L., Zhang, X. Y., Tsay, S. C., Ji, Q., Giles, D., and Slutsker, I.: Columnar aerosol20
optical properties at AERONET sites in central eastern Asia and aerosol transport to thetropical mid-Pacific, J. Geophys. Res.-Atmos., 110 (6), 1–18, 2005.
Fioletov, V. E., Kerr, J. B., Wardle, D. I., Krotkov, N., and Herman, J. R.: Comparison ofBrewer ultraviolet irradiance measurements with total ozone mapping spectrometer satel-lite retrievals, Opt. Eng., 41 (12), 3051–3061, 2002.25
Garane, K., Bais, A. F., Kazadzis, S., Kazantzidis, A., and Meleti, C.: Monitoring of UV spectralirradiance at Thessaloniki (1990–2005): Data re-evaluation and quality control, Ann. Geo-phys., 24 (12), 3215–3228, 2006.
Garcıa, O. E., Dıaz, A. M., Exposito, F. J., Dıaz, J. P., Grobner, J., and Fioletov, V. E.: Cloud-less aerosol forcing efficiency in the UV region from AERONET and WOUDC databases,30
Geophys. Res. Lett., 33, L23803, doi:10.1029/2006GL026794, 2006.Herman, J. R., Krotkov, N., Celarier, E., Larko, D., and Labow, G.: Distribution of UV radiation
17482

ACPD8, 17467–17493, 2008
OMI UV validation atan urban
environment
S. Kazadzis et al.
Title Page
Abstract Introduction
Conclusions References
Tables Figures
J I
J I
Back Close
Full Screen / Esc
Printer-friendly Version
Interactive Discussion
at the Earth’s surface from TOMS-measured UV-backscattered radiances, J. Geophys. Res.-Atmos., 104 (D10), 12 059–12 076, 1999.
Ialongo, I., Casale, G. R., and Siani, A. M.: Comparison of total ozone and erythemal UVdata from OMI with ground-based measurements at Rome station, Atmos. Chem. Phys., 8,3283–3289, 2008, http://www.atmos-chem-phys.net/8/3283/2008/.5
Kazadzis, S., Bais, A., Amiridis, V., Balis, D., Meleti, C., Kouremeti, N., Zerefos, C. S., Rapso-manikis, S., Petrakakis, M., Kelesis, A., Tzoumaka, P., and Kelektsoglou, K.: Nine years ofUV aerosol optical depth measurements at Thessaloniki, Greece, Atmos. Chem. Phys., 7,2091–2101, 2007, http://www.atmos-chem-phys.net/7/2091/2007/.
Kazantzidis, A., Bais, A. F., Grobner, J., Herman, J. R., Kazadzis, S., Krotkov, N., Kyro, E., den10
Outer, P. N., Garane, K., Gorts, P., Lakkala, K., Meleti, C., Slaper, H., Tax, R. B., Turunen,T., and Zerefos, C. S.: Comparison of satellite-derived UV irradiances with ground-basedmeasurements at four European stations, J. Geophys. Res.-Atmos., 111 (13), D13207,doi:10.1029/2005JD006672, 2006.
Koukouli, M. E., Balis, D. S., Amiridis, V., Kazadzis, S., Bais, A., Nickovic, S., and Torres, O.:15
Aerosol variability over Thessaloniki using ground based remote sensing observations andthe TOMS aerosol index, Atmos. Environ., 40, 5367–5378, 2006.
Krotkov, N. A., Bhartia, P. K., Herman, J. R., Fioletov, V., and Kerr, J.: Satellite estimation ofspectral surface UV irradiance in the presence of tropospheric aerosols 1. Cloud-free case,J. Geophys. Res.-Atmos., 103 (D8), 8779–8793, 1998.20
Krotkov, N. A., Herman, J. R., Bhartia, P. K., Fioletov, V., and Ahmad, Z.: Satellite estimationof spectral surface UV irradiance 2. Effects of homogeneous clouds and snow, J. Geophys.Res.-Atmos., 106 (D11), 11 743–11 759, 2001.
Krotkov, N., Herman, J., Bhartia, P. K., Seftor, C., Arola, A., Kaurola, J., , Kalliskota, S., Taalas,P., and Geogdzhaev, I. V.: Version 2 total ozone mapping spectrometer ultraviolet algorithm:25
Problems and enhancements, Opt. Eng., 41 (12), 3028–3039, 2002.Krotkov, N., Bhartia, P. K., Herman, J., Slusser, J., Scott, G., Labow, G., Vasilkov, A. P., Eck, T.
F., Dubovik, O., and Holben, B. N.: Aerosol ultraviolet absorption experiment (2002 to 2004),part 2: Absorption optical thickness, refractive index, and single scattering albedo, Opt. Eng.,44 (4), 1–17, 2005.30
Levelt, P. F., Hilsenrath, E., Leppelmeier, G. W., Van Den Oord, G. H. J., Bhartia, P. K., Tam-minen, J., De Haan, J. F., and Veefkind, J. P.: Science objectives of the ozone monitoringinstrument, IEEE T. Geosci. Remote, 44 (5), 1199–1207, 2006.
17483

ACPD8, 17467–17493, 2008
OMI UV validation atan urban
environment
S. Kazadzis et al.
Title Page
Abstract Introduction
Conclusions References
Tables Figures
J I
J I
Back Close
Full Screen / Esc
Printer-friendly Version
Interactive Discussion
Marenco, F., Santacesaria, V., Bais, A. F., Balis, D., Di Sarra, A., Papayannis, A., and Zerefos,C.: Optical properties of tropospheric aerosols determined by lidar and spectrophotomet-ric measurements (Photochemical Activity and Solar Ultraviolet Radiation Campaign), Appl.Optics, 36 (27), 6875–6886, 1997.
Mayer, B. and Kylling, A.: Technical note: The libRadtran software package for radiative transfer5
calculations – Description and examples of use, Atmos. Chem. Phys., 5, 1855–1877, 2005,http://www.atmos-chem-phys.net/5/1855/2005/.
McKenzie, R. L., Seckmeyer, G., Bais, A. F., Kerr, J. B., and Madronich, S.: Satellite retrievals oferythemal UV dose compared with ground-based measurements at northern and southernmidlatitudes, J. Geophys. Res.-Atmos., 106 (D20), 24 051–24 062, 2001.10
Slaper, H., Reinen, H. A. J. M., Blumthaler, M., Huber, M., and Kuik, F.: Comparing ground-levelspectrally resolved solar UV measurements using various instruments: a technique resolvingeffects of wavelength shift and slit width, Geophys. Res. Lett., 22 (20), 2721–2724, 1995.
Tanskanen, A., Krotkov, N. A., Herman, J. R., and Arola, A.: Surface ultraviolet irradiance fromOMI, IEEE T. Geosci. Remote, 44 (5), 1267–1271, 2006.15
Tanskanen, A., Lindfors, A., Maatta, A., Krotkov, N., Herman, J., Kaurola, J., Koskela, T.,Lakkala, K., Fioletov, V., Bernhard, G., McKenzie, R., Kondo, Y., O’Neill, M., Slaper, H.,DenOuter, P., Bais, A. F., and Tamminen, J.: Validation of daily erythemal doses from ozoneMonitoring Instrument with ground-based UV measurement data, J. Geophys. Res., 5, 112,D24S44, doi:10.1029/2007JD008830, 2008.20
Vasaras, A., Bais, A. F., Feister, U., and Zerefos, C. S.: Comparison of two methods for cloudflagging of spectral UV measurements, Atmos. Res., 57 (1), 31–42, 2001.
Weihs, P., Blumthaler, M., Rieder, H. E., Kreuter, A., Simic, S., Laube, W., Schmalwieser,A. W., Wagner, J., and Tanskanen, A.: Measurements of UV irradiance within the area ofone satellite pixel, Atmos. Chem. Phys., 8, 5615–5626, 2008,25
http://www.atmos-chem-phys.net/8/5615/2008/.Wuttke, S., Verdebout, J., and Seckmeyer, G.: An Improved Algorithm for Satellite-derived UV
Radiation, Photochem. Photobiol., 77 (1), 52–57, 2003.World Meteorological Organization (WMO): Scientific Assessment of Ozone Depletion: 2006,
Global Ozone Research and Monitoring Project, WMO Rep. N, 47, Geneva, 2007.30
17484
ACPD8, 17467–17493, 2008
OMI UV validation atan urban
environment
S. Kazadzis et al.
Title Page
Abstract Introduction
Conclusions References
Tables Figures
J I
J I
Back Close
Full Screen / Esc
Printer-friendly Version
Interactive Discussion
Table 1. RT statistics.
Wavelength (nm) All data Cloudy Cloudless Eclear/ GB Brewer
m R2 W 10 W 20 M R2 W 10 W 20 m R2 W 10 W 20 m R2 W 10 W 20
305 1.30 0.94 43.3 68.2 1.32 0.91 32.4 57.7 1.27 0.95 64.8 87.6 1.31 0.95 64.1 89.4
324 1.17 0.89 51.3 73.1 1.20 0.85 38.8 62.5 1.15 0.90 76.9 92.4 1.17 0.90 80.1 93.5
380 1.13 0.89 47.2 70.7 1.16 0.85 37.4 61.6 1.11 0.90 71.8 89.7 1.14 0.89 72.5 91.5
CIED 1.20 0.93 51.5 75.4 1.22 0.89 40.5 68.1 1.19 0.95 75.0 91.9 1.21 0.95 74.7 93.7
m: median, R2: coefficient of determination, Wi : per cent of cases ranging within ±i% from themedian.
17485

ACPD8, 17467–17493, 2008
OMI UV validation atan urban
environment
S. Kazadzis et al.
Title Page
Abstract Introduction
Conclusions References
Tables Figures
J I
J I
Back Close
Full Screen / Esc
Printer-friendly Version
Interactive Discussion
Table 2. Results of the methodologies investigated.
# Method 305 nmRT (1σ)
324 nmRT (1σ)
380 nmRT (1σ)
No correction 1.27 (0.15) 1.15 (0.10) 1.11 (0.12)
1 [1 + 2.1 * AAOT (λ)]−1 1.09 (0.11) 1.06 (0.07) 1.04 (0.09)
2 [1 + 1.6 * AAOTS (λ)] −1 1.08 (0.11) 1.05 (0.10) 1.03 (0.13)
3 [1 + 3 * AAOT (λ)] −1 1.04 (0.11) 1.02 (0.07) 1.00 (0.10)
4 Constant SSA at 440nm 1.14 (0.13) 1.06 (0.09) 1.03 (0.10)
17486
ACPD8, 17467–17493, 2008
OMI UV validation atan urban
environment
S. Kazadzis et al.
Title Page
Abstract Introduction
Conclusions References
Tables Figures
J I
J I
Back Close
Full Screen / Esc
Printer-friendly Version
Interactive Discussion
Thessaloniki September 2004 – December 2007
0 1 2 3OMI - GB ratio
0.0
0.1
0.2
0.3
ΔΝ
/Ν305 nm
Days
cloud free
cloudy
0 1 2 3
OMI - GB ratio
0.0
0.1
0.2
0.3
ΔΝ
/Ν
324 nm
Days
cloud free
cloudy
0 1 2 3OMI - GB ratio
0.0
0.1
0.2
0.3
ΔΝ
/Ν
380 nm
Days
cloud free
cloudy
0 1 2 3
OMI - GB ratio
0.0
0.1
0.2
0.3
ΔΝ
/Ν
CIED
Days
cloud free
cloudy
Figure 1
1
Fig. 1. Distributions-histograms of the ratio of the satellite-derived to those determined from theground-based UV measurements (305 nm up-left, 324 nm up-right, 380 nm down-left and ery-themally weighted dose down-right). Blue bars correspond to days with cloud-free conditions,while measurements under cloudy conditions are plotted in red.
17487

ACPD8, 17467–17493, 2008
OMI UV validation atan urban
environment
S. Kazadzis et al.
Title Page
Abstract Introduction
Conclusions References
Tables Figures
J I
J I
Back Close
Full Screen / Esc
Printer-friendly Version
Interactive Discussion
Jan Feb Mar Apr May Jun Jul Aug Sep Oct Nov DecMonths
-35
-30
-25
-20
-15
-10
-5
0
% U
V at
tenu
atio
n du
e to
aer
osol
at (
324
nm)
UV attenuation Ground based - OMI % bias
100 * (GB
- OM
I) / GB
77% of cases
Figure 2.
1
Fig. 2. Calculated UV attenuation due to aerosols (Black line) and OMI-GB UV bias at 324 nmat Thessaloniki Greece (red line). Dash lines represent the 1σ AOT variability due to the useof the monthly mean aerosol optical thickness values. Black error bars represent the 1σ of thecalculated monthly mean UV attenuation. Red line represents the mean % GB – OMI differenceand red dashed lines the range that 77% of all OMI-GB compared cases lie within.
17488

ACPD8, 17467–17493, 2008
OMI UV validation atan urban
environment
S. Kazadzis et al.
Title Page
Abstract Introduction
Conclusions References
Tables Figures
J I
J I
Back Close
Full Screen / Esc
Printer-friendly Version
Interactive Discussion
0.00 0.02 0.04 0.06 0.08 0.10Absorption optical depth at 340 nm
0.6
0.8
1.0
1.2
1.4
1.6
RT
at 3
24 n
m
Slope = 2.1 per unit of Absorption optical depthIntercept = 1.07
Figure 3
1
Fig. 3. OMI–GB ratio at 324 nm for cloudless cases as a function of AAOT. The blue line is alinear regression on the data. The correction of Krotkov et al. (2005) is also shown (red line).
17489

ACPD8, 17467–17493, 2008
OMI UV validation atan urban
environment
S. Kazadzis et al.
Title Page
Abstract Introduction
Conclusions References
Tables Figures
J I
J I
Back Close
Full Screen / Esc
Printer-friendly Version
Interactive Discussion
0.00 0.04 0.08 0.12 0.16Slant absorption optical depth at 340 nm
0.6
0.8
1.0
1.2
1.4
1.6
RT
at 3
24 n
m
Slope = 1.6 per unit of Absorption optical depthIntercept = 1.06
Figure 4
1
Fig. 4. OMI–GB ratio at 324 nm for cloudless cases as a function of AAOTS. The black line isa linear regression on the data.
17490
ACPD8, 17467–17493, 2008
OMI UV validation atan urban
environment
S. Kazadzis et al.
Title Page
Abstract Introduction
Conclusions References
Tables Figures
J I
J I
Back Close
Full Screen / Esc
Printer-friendly Version
Interactive Discussion
0 0.2 0.4 0.6 0.8 1 1.2 1.41
1.1
1.2
1.3
1.4
1.5
1.6
1.7
aerosol optical depth at 340 nm
corr
ectio
n fo
r irr
adia
nce
at 3
24nm
sza=40
0.80.820.840.860.88 0.90.920.940.960.98 1
0.4 0.45 0.5 0.55 0.61.04
1.06
1.08
1.1
1.12
1.14
1.16
1.18
1.2
aerosol optical depth at 340 nm
corr
ectio
n fo
r irr
adia
nce
at 3
24nm
sza=60
0.80.820.84
0.860.88
0.9
0.920.94
0.960.98
1
ssa=0.88
ssa=1, no absorption
total correction
correction for scattering
Figure 5
1
Fig. 5. Radiative model calculations of UV attenuation Eclear(CT=1) / Eaero, for various AOT andSSA values (left). The ratios Eclear(CT=1) / Eaero, for a constant solar zenith angle (60◦) and(SSA,AOT)=(0.88, 0.5) at 340 nm.
17491
ACPD8, 17467–17493, 2008
OMI UV validation atan urban
environment
S. Kazadzis et al.
Title Page
Abstract Introduction
Conclusions References
Tables Figures
J I
J I
Back Close
Full Screen / Esc
Printer-friendly Version
Interactive Discussion
10 20 30 40 50 60 70 80solar zenith angle (degrees)
0.8
1.0
1.2
1.4
1.6
RT
at 3
24nm
uncorrected
Ca = 1 + 2.1 * Tab
Ca = 1 + 3 * Tab
Figure 6
1
Fig. 6. OMI–GB ratio at 324 nm as a function of solar zenith angle. Blue symbols represent theoriginal data and red and black the results of corrections 1 and 3 shown in Table 2.
17492

ACPD8, 17467–17493, 2008
OMI UV validation atan urban
environment
S. Kazadzis et al.
Title Page
Abstract Introduction
Conclusions References
Tables Figures
J I
J I
Back Close
Full Screen / Esc
Printer-friendly Version
Interactive Discussion
0 20 40 60 8Brewer (mW.m-2.nm-1)
0
0
20
40
60
80
OM
I (m
W.m
-2.n
m-1
)
irradiance at 305 nm
original R2 = 0.95
correct. R2 = 0.97
0 100 200 300 400 500
Brewer (mW.m-2.nm-1)
0
100
200
300
400
500
OM
I (m
W.m
-2.n
m-1
)
irradiance at 324 nm
original R2 = 0.92
correct. R2 = 0.97
0 200 400 600 800 1000Brewer (mW.m-2.nm-1)
0
200
400
600
800
1000
OM
I (m
W.m
-2.n
m-1
)
irradiance at 380 nm
original R2 = 0.86
correct. R2 = 0.92
Figure 7
1
Fig. 7. OMI and Brewer spectral irradiance measurements for 305 nm (upper left), 324 nm(upper right) and 380 nm (down) under cloudless skies. Blue symbols represent the originaldata and red the OMI corrected ones.
17493