Effect of eutrophication on mercury, selenium, and essential fatty acids in bighead carp...
11
Effect of eutrophication on mercury, selenium, and essential fatty acids in Bighead Carp (Hypophthalmichthys nobilis) from reservoirs of eastern China N. Roxanna Razavi a, ⁎, Michael T. Arts b , Mingzhi Qu a , Binsong Jin c , Wenwei Ren d , Yuxiang Wang a , Linda M. Campbell e a Department of Biology, Queen's University, Kingston, Ontario K7L 3N6, Canada b Department of Chemistry and Biology, Ryerson University, Toronto, Ontario M5B 2K3, Canada c Center for Watershed Ecology, Institute of Life Science and Key Laboratory of Poyang Lake Environment and Resource Utilization, Ministry of Education, Nanchang University, Nanchang, Jiangxi, 330031, China d Key Laboratory of Yangtze River Water Environment, Ministry of Education, College of Environmental Science and Engineering, Tongji University, Shanghai 200092, China e Environmental Science, Saint Mary's University, Halifax, Nova Scotia B3H 3C3, Canada HIGHLIGHTS • Hg, Se and fatty acids were measured in Bighead Carp from subtropical reservoirs. • Concentrations and risk–benefit values were compared to degree of eutrophication. • Se:Hg molar ratios and algal species composition were a function of total phosphorous. • Eicosapentaenoic acid (EPA) was negatively correlated with chlorophyll-a. • Changes in Se and EPA with eutrophication may increase risk of exposure to MeHg. abstract article info Article history: Received 28 April 2014 Received in revised form 1 August 2014 Accepted 8 August 2014 Available online xxxx Editor: Daniel A. Wunderlin Keywords: Methylmercury Selenium:mercury molar ratios Asian carp Fatty acids Risk–benefit Hazard quotient Analyses of the risks and benefits of consuming fish assess the content of beneficial fatty acids found in fish rel- ative to harmful pollutants such as methylmercury (MeHg). Quantifying the effect of eutrophication on mercury (Hg), selenium (Se) and essential fatty acids (EFAs) in fish is necessary to determine how measures of risk vary with productivity. Total Hg and MeHg, Se and fatty acids, including the EFA eicosapentaenoic acid (EPA, 20:5n −3) and docosahexaenoic acid (DHA, 22:6n −3), were analyzed in Bighead Carp (Hypophthalmichthys nobilis) dorsal muscle tissue from seven subtropical reservoirs of eastern China. Individual elements and fatty acids, as well as derived measures of risk (Se:Hg and hazard quotient, HQ EFA ) were regressed against indicators of eutrophication, including total phosphorous (TP), chlorophyll-a (chl-a) and phytoplankton species composi- tion. We found low MeHg concentrations (range = 0.018–0.13 μg/g ww) and Se concentrations (range = 0.12–0.28 μg/g ww), and Se:Hg molar ratios that were well above 1.0, indicating a low risk of Hg toxicity. Bighead Carp had a high content of total polyunsaturated fatty acids (∑PUFAs = 44.2–53.6%), which included both EPA (6.9–12.5%) and DHA (16.1–23.2%). However, fish had significantly lower Se:Hg molar ratios in reservoirs with high TP, and lower EPA content with increasing plankton density (i.e. higher chl-a). Phytoplankton species com- position predicted Se concentrations, but not Hg concentrations or EFA content. Overall, Hg concentrations in Big- head Carp were very low relative to consumption guidelines, and Se concentrations were adequate to confer protective benefits against MeHg toxicity. Our findings suggest that changes to plankton species composition and density with eutrophication may result in fish of lower nutritional value and thus increase risks to fish con- sumers by changing the availability of Se and EPA relative to MeHg. © 2014 Elsevier B.V. All rights reserved. 1. Introduction Balancing the benefits and the risks of fish consumption has become difficult (FAO/WHO, 2011). Fish contain omega-3 (n −3) long chain (≥20 carbons) polyunsaturated fatty acids (PUFAs) that humans cannot Science of the Total Environment 499 (2014) 36–46 ⁎ Corresponding author. Tel.: +1 613 533 6000x77503; fax: +1 613 533 6090. E-mail address: [email protected] (N.R. Razavi). http://dx.doi.org/10.1016/j.scitotenv.2014.08.019 0048-9697/© 2014 Elsevier B.V. All rights reserved. Contents lists available at ScienceDirect Science of the Total Environment journal homepage: www.elsevier.com/locate/scitotenv
Transcript of Effect of eutrophication on mercury, selenium, and essential fatty acids in bighead carp...

Science of the Total Environment 499 (2014) 36–46
Contents lists available at ScienceDirect
Science of the Total Environment
j ourna l homepage: www.e lsev ie r .com/ locate /sc i totenv
Effect of eutrophication onmercury, selenium, and essential fatty acids inBighead Carp (Hypophthalmichthys nobilis) from reservoirs ofeastern China
N. Roxanna Razavi a,⁎, Michael T. Arts b, Mingzhi Qu a, Binsong Jin c, Wenwei Ren d,Yuxiang Wang a, Linda M. Campbell e
a Department of Biology, Queen's University, Kingston, Ontario K7L 3N6, Canadab Department of Chemistry and Biology, Ryerson University, Toronto, Ontario M5B 2K3, Canadac Center for Watershed Ecology, Institute of Life Science and Key Laboratory of Poyang Lake Environment and Resource Utilization, Ministry of Education, Nanchang University, Nanchang, Jiangxi,330031, Chinad Key Laboratory of Yangtze River Water Environment, Ministry of Education, College of Environmental Science and Engineering, Tongji University, Shanghai 200092, Chinae Environmental Science, Saint Mary's University, Halifax, Nova Scotia B3H 3C3, Canada
H I G H L I G H T S
• Hg, Se and fatty acids were measured in Bighead Carp from subtropical reservoirs.• Concentrations and risk–benefit values were compared to degree of eutrophication.• Se:Hg molar ratios and algal species composition were a function of total phosphorous.• Eicosapentaenoic acid (EPA) was negatively correlated with chlorophyll-a.• Changes in Se and EPA with eutrophication may increase risk of exposure to MeHg.
⁎ Corresponding author. Tel.: +1 613 533 6000x77503E-mail address: [email protected] (N.R. Raza
http://dx.doi.org/10.1016/j.scitotenv.2014.08.0190048-9697/© 2014 Elsevier B.V. All rights reserved.
a b s t r a c t
a r t i c l e i n f oArticle history:Received 28 April 2014Received in revised form 1 August 2014Accepted 8 August 2014Available online xxxx
Editor: Daniel A. Wunderlin
Keywords:MethylmercurySelenium:mercury molar ratiosAsian carpFatty acidsRisk–benefitHazard quotient
Analyses of the risks and benefits of consuming fish assess the content of beneficial fatty acids found in fish rel-ative to harmful pollutants such as methylmercury (MeHg). Quantifying the effect of eutrophication on mercury(Hg), selenium (Se) and essential fatty acids (EFAs) in fish is necessary to determine how measures of risk varywith productivity. Total Hg and MeHg, Se and fatty acids, including the EFA eicosapentaenoic acid (EPA,20:5n−3) and docosahexaenoic acid (DHA, 22:6n−3), were analyzed in Bighead Carp (Hypophthalmichthysnobilis) dorsal muscle tissue from seven subtropical reservoirs of eastern China. Individual elements and fattyacids, as well as derived measures of risk (Se:Hg and hazard quotient, HQEFA) were regressed against indicatorsof eutrophication, including total phosphorous (TP), chlorophyll-a (chl-a) and phytoplankton species composi-tion. We found low MeHg concentrations (range = 0.018–0.13 μg/g ww) and Se concentrations (range =0.12–0.28 μg/gww), and Se:Hgmolar ratios thatwerewell above 1.0, indicating a low risk of Hg toxicity. BigheadCarp had a high content of total polyunsaturated fatty acids (∑PUFAs= 44.2–53.6%), which included both EPA(6.9–12.5%) and DHA (16.1–23.2%). However, fish had significantly lower Se:Hg molar ratios in reservoirs withhigh TP, and lower EPA content with increasing plankton density (i.e. higher chl-a). Phytoplankton species com-position predicted Se concentrations, but not Hg concentrations or EFA content. Overall, Hg concentrations in Big-head Carp were very low relative to consumption guidelines, and Se concentrations were adequate to conferprotective benefits against MeHg toxicity. Our findings suggest that changes to plankton species compositionand density with eutrophication may result in fish of lower nutritional value and thus increase risks to fish con-sumers by changing the availability of Se and EPA relative to MeHg.
© 2014 Elsevier B.V. All rights reserved.
; fax: +1 613 533 6090.vi).
1. Introduction
Balancing the benefits and the risks of fish consumption has becomedifficult (FAO/WHO, 2011). Fish contain omega-3 (n−3) long chain(≥20 carbons) polyunsaturated fatty acids (PUFAs) that humans cannot

37N.R. Razavi et al. / Science of the Total Environment 499 (2014) 36–46
synthesize in amounts necessary to maintain optimal health and devel-opment (Arts et al., 2001). Specifically, fish are important sources ofeicosapentaenoic acid (EPA, 20:5n−3) and docosahexaenoic acid(DHA, 22:5n−3) referred to as essential fatty acids (EFAs) because oftheir role in neurological development. Current widespread pollution,especially from mercury (Hg), threatens the benefits imparted by fishto humans andwildlife (NWF, 2006;Mahaffey et al., 2011). Fish speciesvary in their EFA and Hg contents and consumers are advised to eat fishwith higher EFA content relative to Hg tomaximize their health benefitswhile simultaneously minimizing their exposure to the neurotoxicantmethylmercury (MeHg; Mahaffey et al., 2011). The toxicity of MeHgmay be reduced in the presence of selenium (Se), an essential trace el-ement, with protective effects expected when molar ratios of Se to Hg(Se:Hg) exceed 1 (Ralston, 2008). To provide a balanced risk–benefitanalysis of a given fish species, it is useful to quantify EFA and Se contentrelative to Hg concentrations. For example, in addition to comparingfish Hg concentrations to consumption guidelines, risk can be assessedusing the Se:Hg molar ratio, or measures of MeHg relative to beneficialEFA (EPA + DHA) content (such as the hazard quotient, HQEFA, pro-posed byGladyshev et al., 2009). Studies that determinewhat factors af-fect how measures of risk vary in aquatic organisms provide criticalpublic health information (Neff et al., 2014).
Cultural eutrophication, the excessive plant growth observed due tonutrient enrichment from human activities, is one of the primarystressors facing aquatic ecosystems (Smith and Schindler, 2009). Eutro-phication is likely to impact the outcome of risk–benefit analyses in fish,because primary producers play a key role in determining fatty acid, Hg,and Se availability in aquatic systems. Algae and, to a lesser extent fungi,are the only organisms capable of inserting the n−3 and omega-6(n−6) double bond in fatty acids. Animals cannot synthesize alpha-linolenic acid (ALA; 18:3n−3) or linoleic acid (LIN; 18:2n−6) and, al-though they can convert these fatty acids to their long chain PUFA ana-logs (EPA, DHA and arachidonic acid, ARA, 20:4n−6), they do so withvariable efficiency.
Not all phytoplankton and zooplanktonmake the same amounts andkinds of fatty acids. For example, EPA is used as a biomarker of diatomsand cryptophytes due to their high content of this essential fatty acid(Ahlgren et al., 1992). Within the cyanobacteria, some groups havehigher amounts of n−3 fatty acids (e.g. Oscillatoria and Microcystis)compared to others (e.g. Anabaena and Spirulina; Ahlgren et al., 1992).Plankton biomass is also important to estimate EPA content (Hartwichet al., 2012), and eutrophic conditions showed reduced EPA and DHAcontent in seston and zooplankton in both field and experimental set-tings (Müller-Navarra et al., 2004; Ravet et al., 2012). Thus changes inalgal species composition and density with eutrophication affect theavailability of fatty acids to higher trophic level consumers. If eutrophi-cation did not affect fish contaminant burden, we expect that the mea-sures of risk posed by contaminants relative to beneficial fatty acids (e.g.HQEFA, Gladyshev et al., 2009) would increase.
However, eutrophication can also affect the availability of Hg and Seto upper trophic levels because phytoplankton biomass and speciescomposition affect bioaccumulation of these elements from water.Algae can bioconcentrate both Hg (104 to 105; Pickhardt and Fisher,2007) and Se (up to 106; Stewart et al., 2010). This process involves pas-sive uptake for both inorganic Hg andMeHg (Mason et al., 1996), but isnon-passive and also species specific for Se (Stewart et al., 2010). Higherplankton biomass present in eutrophic conditions can reduce Hgbiomagnification, a process known as algal biodilution, resulting inlower Hg concentrations in fish (Chen and Folt, 2005). It has yet to befully determined how Se and eutrophication interact (Young et al.,2010). To date, Se availability in freshwater appears to be a function ofhabitat type. Lentic habitats enhance the availability and transfer of Seto fish relative to lotic habitats (Orr et al., 2006). This is due to the longerwater retention times andmore reducing conditions found in lentic en-vironments, which enhance the production of bioavailable (i.e. organicforms) Se (Orr et al., 2006; Stewart et al., 2010). Overall we predict
fish Hg concentrations to be lower with increasing eutrophication. IfSe concentrations stay constant, this should result in lower risk to fishconsumers with increasing eutrophication, as indicated by higher Se:Hg molar ratios. However, given that algal species composition, andthus Se availability, change with eutrophication, we expect these differ-ences to also be reflected in the Se:Hg molar ratios of higher trophiclevel consumers, such as planktivorous fish.
The main objective of this study was to assess howmeasures of riskfrom fish consumption vary with eutrophication. We selected BigheadCarp (Hypophthalmichthys nobilis) as a sentinel species because it re-mains planktivorous at all life stages and therefore directly reflects ele-ment and fatty acid accumulation from phytoplankton. Bighead Carpwere sampled in subtropical reservoirs of eastern China, a region facingrapid eutrophication, and where Bighead Carp are widely distributedand frequently consumed. The concentrations of total Hg (THg),MeHg, Se and fatty acids were measured, and these concentrations, aswell asmeasures of risk (Se:Hg andHQEFA)were compared to indicatorsof eutrophication, specifically total phosphorous (TP), chlorophyll-a(chl-a), and changes in phytoplankton species composition. Weassessed overall risk versus benefit by considering, 1)fishHg concentra-tions relative to Hg consumption guidelines and a calculation based ontolerable weekly intakes, 2) Se:Hg molar ratios (Se:THg and Se:MeHg), and 3) hazard quotients based on EFA and MeHg (HQEFA;Gladyshev et al., 2009).
2. Material and methods
2.1. Reservoir descriptions
We sampled Bighead Carp (n = 34) from 7 reservoirs of easternChina in June andAugust 2011 (Fig. 1, Table 1). Further details regardingthese reservoirs are available in Razavi (2014). These reservoirswere ol-igotrophic to eutrophic (based on chl-a), with algal growth limited bydiffering factors among reservoirs such that no correlation was ob-served between chl-a and TP (Razavi, 2014). Hydrogeomorphic features(e.g. water retention time) were an important determinant of nutrientand Hg concentrations in these reservoirs (Razavi, 2014). This causedtwo clear groupings among reservoirs, those with shorter water reten-tion times that are more lotic-like (high TP reservoirs) and those withlonger water retention times that are more lentic-like (low TP reser-voirs). Although our indicators of eutrophication, TP and chl-a, werenot correlated, we used both of these indicators to represent eutrophi-cation because the lack of correlation between TP and chl-a may be acommon occurrence in Chinese subtropical reservoirs (Xu et al.,2010). Furthermore, often studies only use one of these indicators torepresent eutrophication sowe present both for comparison to the liter-ature. Bioavailability of MeHg and THg from surface water are given inRazavi (2014); determining Hg concentrations in sediments was be-yond the scope of this study.
2.2. Field sampling
Bighead Carp were selected for this study because they areplanktivorous, a ubiquitous species in Chinese reservoirs, and areamong the most frequently consumed fish in the region (Li and Xu,1995; Zhou et al., 2009; Fang et al., 2012). Bighead Carp are stocked asfingerlings (~13 cm) in reservoirs and then consume natural planktonresources within the reservoir (Li and Xu, 1995). Fish were collectedlive from fishermen or local markets. We attempted to sample individ-uals of varying lengths at each reservoir, but inmost cases only a narrowrange of lengths were available (Table 2). In the field, total length andweight of individual fish were recorded (Table 2), a sample of dorsalmuscle tissue taken for Hg and Se analyses, and a separate sample forfatty acid analyses. Tissue samples were immediately frozen in thefield, and upon return to the lab those for fatty acid analyseswere storedat−80 °C.

Fig. 1. Location of reservoirs sampled in eastern China. Dark gray indicates reservoir catchment areas. See Table 1 for reservoir codes.
38 N.R. Razavi et al. / Science of the Total Environment 499 (2014) 36–46
Chlorophyll-a and TP were measured at each reservoir as in Razavi(2014). Briefly, separate surface water samples (1 m depth) takenusing a 1-L van Dorn were dispensed into clean brown polyethylenebottles for chl-a analyses and acid-cleaned clear polyethylene bottlesfor TP analyses. Samples for chl-a were filtered through 1.2 μmGF/C fil-ters in the field and the filters frozen in tin foil. Water samples for TPwere frozen in the field until analysis within 1-week of collection. Thechl-a analyses were carried out at McMaster University (Ontario,Canada) following Chow-Fraser (2006); sample analyses for TP follow-ed the ammonium molybdenum spectrophotometric method with UVspectrophotometry following a potassium persulfate digestion (StateEnvironmental Protection of China, 1990) at the Shanghai Environmen-tal Monitoring Center (http://www.semc.gov.cn/home/english.aspxShanghai, China).
2.3. Metal analyses
Total Hg andMeHg concentrations in fish samples were analyzed bythe Laboratory for the Analysis of Natural and Synthetic EnvironmentalToxins (LANSET) at the University of Ottawa (Ontario, Canada). Fishdorsalmuscle samples (~1 g) were oven-dried at 60 °C for 48 h and ho-mogenized using a mortar and pestle. Percent water loss was later usedto convert individual dry weight (dw) concentrations to wet weight(ww; mean (±standard deviation, SD) of 81.5 ± 4.1% water, n = 34).
Table 1Characteristics of reservoirs sampled in eastern China (see Fig. 1 for locations). Surface area (Selevation) and water retention time (WRT) were taken from published Chinese literature. Totstudy.
Reservoir Reservoircode
Closesttown/city
Population densityin catchment(per km2)a
SA(km2)
CA:SA Volume(×109m3)
E(
Foziling F Foziling 15 20 92.0 0.364 1Hengshan H Yixing 158 4.5 34.4 0.112Longhekou L Wanfohu 45 50 22.2 0.516Meishan M Meishan 78 62.9 31.3 1.245 1Qiandao Q Chun'an 149 580 18.1 17.84Siming S Lianglong 324 5.5 18.7 0.0795Tianmu T Tianmuhu 423 6.7 22.2 0.109
a Total population in the watershed/catchment area.b WRT = reservoir volume/mean outflow rate.c Mean of 2 samples TP range = 0.067–0.71.d All samples represent means of replicate samples.e Determined using trophic status index based on chl-a (Razavi, 2014).f Determined using deviations of trophic state indices (Razavi, 2014).
Total Hg concentrations were measured in samples (~1 mg) using adirect thermal decomposition Hg analyzer, with a method detectionlimit of 0.012 ng/g. Duplicates had a relative percent difference (the dif-ference between two duplicates divided by the mean) of 4% (n = 24).Quality assurance included National Research Council of Canada certi-fied reference materials (CRM, reported as mean ± SD) DORM-4 (fishprotein; 96.5 ± 5.0% recovery, n = 7), DOLT-4 (dogfish liver; 97.3 ±0.4% recovery, n = 3), and TORT-2 (lobster hepatopancreas; 93.5–99.4% recovery, n= 2). Fish MeHgwas extracted into dichloromethaneand subsequently quantified by capillary gas chromatography coupledwith cold vapor atomic fluorescence spectrometry (GC CVAFS; Caiet al., 1997). Recovery of MeHg in CRM was 95.5 ± 2.7% for DORM-4(n= 4), 92.6 ± 3.7% for DOLT-4 (n= 3) and 99.8% for TORT-2 (lobsterhepatopancreas; n = 1). The method detection limit for MeHg was0.016 ng/g.
2.4. Selenium analysis
Selenium concentrations were measured following CALA accreditedmethods at the Analytical Services Unit at Queen's University (Ontario,Canada). Briefly, 0.5 g of tissue was brought to a final volume of12.5 mL using a hotplate aqua regia digestion method. After digestionand filtration, the samples were analyzed using hydride generationatomic absorption spectroscopy (HG-AAS) on a Varian VGA-77 (Varian
A), catchment area to surface area ratio (CA:SA), reservoir volume, mean water level (i.e.al phosphorous (TP), secchi depth (SD), and chlorophyll-a (chl-a) were measured in this
levationm)
WRT(days)b
TP(mg/L)
SD(m)
Chl-a(μg/L)d
Trophicstatee
Evidence of P limitationof algal growthf
24 100 0.069c 5.0 1.9 Oligotrophic No32 460 0.017 4.0 2.9 Oligotrophic No68 335 0.078 2.0 8.2 Mesotrophic Yes26 323 0.087 3.5 1.8 Oligotrophic No37 700 0.018 5.5 1.5 Oligotrophic No16 484 0.012 1.4 6.5 Mesotrophic Yes19 580 0.020 1.1 23.7 Eutrophic Yes

Table 2Mean (±SE) and range of total length (cm), weight (kg), total mercury (THg), methylmercury (MeHg) and selenium (Se) concentrations (μg/g ww), and molar ratios of Se:THg and Se:MeHg in Bighead carp by reservoir. The Se:THg and Se:MeHg molar ratios presented here were calculated on each individual sample and then averaged by location. Letters indicate sig-nificant differences among reservoirs in Bighead carp total length using analysis of variance. See Table 1 for reservoir codes.
Reservoir code n Total length Weight THg MeHg Se Se:THg Se:MeHg
F 5 45.5 ± 1.2a 1.0 ± 0.1 0.14 ± 0.03 0.13 ± 0.03 0.14 ± 0.01 3.07 ± 0.61 3.41 ± 0.6641.4–48.7 0.8–1.3 0.086–0.25 0.086–0.23 0.08–0.16
H 5 57.6 ± 2.3a,b 2.1 ± 0.2 0.028 ± 0.002 0.024 ± 0.001 0.26 ± 0.01 23.92 ± 2.19 30.28 ± 3.3953.5–64.0 1.4–2.8 0.023–0.032 0.020–0.027 0.23–0.28
L 5 69.9 ± 5.9b 4.4 ± 1.2 0.059 ± 0.01 0.053 ± 0.01 0.12 ± 0.01 5.26 ± 0.40 6.45 ± 0.7259.6–86.2 2.4–8.4 0.036–0.072 0.031–0.069 0.08–0.16
M 5 73.2 ± 2.7b,c 4.8 ± 0.5 0.073 ± 0.01 0.070 ± 0.01 0.14 ± 0.01 5.61 ± 1.16 6.43 ± 1.4264.0–80.0 3.0–5.9 0.049–0.12 0.045–0.12 0.09–0.18
Q 5 88.2 ± 5.1c 9.2 ± 1.1 0.052 ± 0.01 0.043 ± 0.01 0.28 ± 0.01 14.27 ± 1.43 19.38 ± 2.5373.5–102.0 6.5–12.2 0.035–0.063 0.029–0.061 0.26–0.30
S 4 44.8 ± 3.7a 1.1 ± 0.3 0.024 ± 0.004 0.018 ± 0.004 0.15 ± 0.01 17.76 ± 2.89 25.15 ± 4.3139.0–55.0 0.7–1.8 0.018–0.035 0.013–0.030 0.13–0.18
T 5 50.2 ± 0.9a 1.4 ± 0.1 0.055 ± 0.01 0.050 ± 0.01 0.22 ± 0.02 11.40 ± 2.61 13.54 ± 3.0048.0–53.2 1.2–1.7 0.032–0.079 0.030–0.075 0.16–0.27
39N.R. Razavi et al. / Science of the Total Environment 499 (2014) 36–46
Australia Pty. Ltd,Mulgrave, Victoria, Australia). Recovery of CRMDOLT-4 (88± 6% recovery, n= 4) and TORT-2 (82–98% recovery, n= 2), andthe relative percent difference of duplicates (average=24%, n=6)metquality control criteria. The detection limit was b0.2 μg/g dw.We reportSe concentrations as ww, using moisture content for individual fish asdescribed above.
2.5. Lipid and fatty acid analyses
Fish samples stored at−80 °Cwere freeze-dried andweighed usinga microbalance precise to 1 μg (dry weight of sample range = 23.615–47.896 mg; mean ± SD = 37.317 ± 8.068 mg). Lipids were extractedfrom tissues by first homogenizing the samples in 2 mL of 2:1choloroform:methanol (Folch et al., 1957). The lipid extract wasbrought to a final volume of 8 mL with 2:1 chloroform:methanol.Next, 1.6 mL of NaCl (0.9%) was added, the phases were mixed, centri-fuged (2300 rpm at 4 °C), and the upper layer removed. The solventlayer was evaporated under nitrogen gas, redissolved in 2 mL of 2:1chloroform:methanol, and the % total lipid (on a dw tissue basis) wasdetermined gravimetrically. Fatty acid methyl esters were quantifiedby adding sulfuric acid in methanol (1:100mixture), flushing the head-space with nitrogen gas, and incubating 16 h in a water bath at 50 °C.Once the samples had cooled, potassium hydrogen carbonate, hexane:diethyl ether (1:1), and butylated hydroxyl toluene (0.01%) wereadded, and the vials then vortexed and centrifuged. The upper organiclayer was transferred to another centrifuge tube; hexane:diethyl ether(1:1) was added to the original tube, which was shaken, vortexed andcentrifuged. Fatty acid methyl esters were evaporated under nitrogengas, dissolved in hexane, and transferred to amber glass GC vials. Anal-ysis was carried out by gas chromatography equipped with a flame-ionization detector (GC-FID; Agilent HP6890, Agilent Technologies,Inc., Wilmington, Delaware, USA) as described previously (Kim et al.,2014; Neff et al., 2014). We reported any individual fatty acid thatexceeded 3% (N1 μg/mg) of total lipids. We were especially interestedin the EFA eicosapentaenoic acid (EPA; 20:5n−3), docosahexaenoicacid (DHA;22:6n−3), and arachidonic acid (ARA; 20:4n−6) andtheir precursors linoleic acid (LIN;18:2n−6c), γ-linolenic acid (GLA;18:3n−6), and α-linoleic acid (ALA; 18:3n−3). The total saturatedfatty acids (∑SAFAs), total monounsaturated fatty acids (∑MUFAs)and total polyunsaturated fatty acids (∑PUFAs), as well as totalomega-3 (∑n−3) and omega-6 (∑n−6) and the ratio of totalomega-3 to omega-6 (n−3:n−6) were also reported.
2.6. Statistical analysis
All statistical analyses were performed using JMP (Version 11.0; SASInstitute Inc., Cary, North Carolina, USA). Where necessary, variables
were log-transformed to meet assumptions of normality for parametrictests. An analysis of variance (ANOVA) revealed significant differencesin fish total length among sites (ANOVA, F = 20.6, p b 0.0001, n =34). Due to non-overlap in fish total length among reservoirs, no directamong-site comparisons (i.e. ANOVA) of Hg or fatty acids were made.One individual fish had a fatty acid profile determined to be an outlier(all fatty acid concentrations an order of magnitude higher than allother individuals) andwas removed fromall analyses and summary sta-tistics of fatty acids. However, this individual fish was not an outlier forHg or Se andwas included in data for those elements. The fatty acid con-centrations of Bighead Carp dorsal muscle tissue are presented as μgfatty acid/mg dry tissue (abbreviated as μg/mg dw) and as relative pro-portions compared to the total fatty acid (expressed as %).
Selenium:mercury molar ratios (Se:THg and Se:MeHg) of individualfish were calculated (by dividing Se, THg and MeHg concentrations (μg/g) by 78.96, 200.59 and 215.63, respectively) and then averaged to get amean Se:Hg value for each reservoir. Sample sizeswere too small forwith-in reservoir comparisons of Se:Hg molar ratios and fish length, and whenall fish from all reservoirs were combined no significant effect of fishtotal length was found for either Se:THg or Se:MeHg (p N 0.05). This lackof correlation could be possibly due to differences in growth rates amongreservoirs, but we do not have growth rates to test this assumption.
Risk from fish consumption was calculated taking into account theprovisional tolerable weekly intake, an endpoint used for food contam-inants with cumulative effects (WHO, 2004). Using this endpoint, theamount of fish that can be safely consumed was calculated as inOuédraogo and Amyot (2013) as follows:
A ¼ W� I=C
where A= the amount (g) of a fish that can be safely eaten on a weeklybasis,W= average bodyweight (65 or 70 kg for an adultwomanorman,respectively), I = tolerable weekly intake of MeHg (1.6 μg/kg bodyweight, WHO, 2004) and C =MeHg concentration in fish (μg/g ww).
A measure of risk vs. benefit was calculated following Gladyshevet al. (2009). The hazard quotient (HQEFA) for fish consumption takesinto account the recommended dose of EFA as follows:
HQEFA ¼ REFA � CMeHg
CEFA � RfD� AW
where REFA= a recommended dose of 500 mg/day of EFA (EPA+DHA;Kris-Etherton et al., 2009), CMeHg = metal content in a given fish (μg/gww), CEFA= EPA+DHA content in a given fish (mg/g ww), RfD= ref-erence dose forMeHg of 0.1 μg/kg/day (U.S. EPA, 2001a) and AW= av-erage weight of an adult individual (kg), set to 70 kg. An HQEFA b 1indicates no risk (Gladyshev et al., 2009). For this calculation only, we
40 N.R. Razavi et al. / Science of the Total Environment 499 (2014) 36–46
used EPA and DHA concentrations on a ww basis for consistency withthe literature, converted using individual fish moisture content as de-scribed above for Hg and Se.
To test for differences with eutrophication, THg and MeHg, Se, fattyacid and Se:Hg molar ratios and HQEFA were plotted against log chl-aand log TP using linear regression analyses. Phytoplankton communitycomposition was quantified from species presence/absence data(Table S1 and Fig. S1) using principal component analysis (PCA) oncovariances. We then took the PC1 axis score and used it as a predictorvariable to test for an effect of changes in species composition on Hg, Se,fatty acid content and Se:Hg molar ratios and HQEFA. The significancelevel for all tests was set at p b 0.05.
3. Results
3.1. Mercury, selenium and fatty acid content
Mean THg concentrations in Bighead Carp dorsal muscle tissue var-ied from0.024 to 0.14 μg/g, andmeanMeHg concentrations varied from0.018 to 0.13 μg/g. This representsmore than a 7-fold variation inMeHgconcentrations among reservoirs (Table 2). Within reservoir variation(i.e. the range in Hg concentrations among individuals from a given res-ervoir) varied from ~1.5 to 3-fold for both THg andMeHg.Mean%MeHgranged between 77 and 96% among reservoirs. All individuals sampledwere well below the FAO/WHO (2007) limit of 0.5 μg/g THg and theU.S. EPA (2001b) consumption guideline of 0.3 μg/g THg.
Bighead Carpmean Se concentrations ranged from 0.12 to 0.28 μg/g,with among and within site variation ranging from ~3-fold to up to a 2-fold difference, respectively (Table 2). The mean molar ratios of Se:Hgamong sites ranged from 3.07 to 23.92 for Se:THg and 3.41 to 30.28for Se:MeHg (Table 2); only one individual fish had Se:Hg b 1.
Table 3Fatty acid composition (±SE) of Bighead Carp by reservoir, presented as a. concentration (μg/m
Fatty acid common name and molecular formula Reservoir code
F (n = 5) H (n = 4)
a.Hexadecanoic acid (16:0)a 2.92 ± 0.24 2.99 ± 0.34Octadecanoic acid (18:0) 1.37 ± 0.06 1.60 ± 0.17∑SAFAs 4.9 ± 0.3 5.4 ± 0.6Palmitoleic acid (16:1) 0.44 ± 0.05 0.50 ± 0.12Elaidic and Oleic acid (18:1)b 1.68 ± 0.07 2.32 ± 0.28∑MUFAs 2.4 ± 0.2 3.1 ± 0.4Arachidonic acid (ARA; 20:4n−6) 2.13 ± 0.12 2.17 ± 0.24Eicosapentaenoic acid (EPA; 20:5n−3) 2.30 ± 0.09 1.55 ± 0.20Docosahexaenoic acid (DHA; 22:6n−3) 4.01 ± 0.32 3.49 ± 0.36∑PUFAs 9.9 ± 0.4 8.9 ± 1.1∑omega-3 (n−3)c 7.2 ± 0.3 6.0 ± 0.7∑omega-6 (n−6)d 2.7 ± 0.1 2.9 ± 0.3n−3:n−6 2.7 ± 0.2 2.1 ± 0.0Total lipid 18.4 ± 0.6 18.8 ± 2.2
b.Hexadecanoic acid (16:0)a 15.8 ± 0.9 16.1 ± 0.2Octadecanoic acid (18:0) 7.5 ± 0.2 8.9 ± 0.4∑SAFAs 26.6 ± 0.7 29.0 ± 0.5Palmitoleic acid (16:1) 2.4 ± 0.3 2.5 ± 0.3Elaidic and Oleic acid (18:1)b 9.1 ± 0.4 11.8 ± 0.6∑MUFAs 13.2 ± 0.9 15.4 ± 1.0Arachidonic acid (ARA; 20:4n−6) 11.6 ± 0.6 12.1 ± 0.5Eicosapentaenoic acid (EPA; 20:5n−3) 12.5 ± 0.5 8.5 ± 0.3Docosahexaenoic acid (DHA; 22:6n−3) 21.7 ± 1.3 19.9 ± 1.2∑PUFAs 53.6 ± 0.6 49.1 ± 1.9∑omega-3 (n−3) 38.9 ± 0.7 33.1 ± 1.3∑omega-6 (n−6) 14.7 ± 0.6 16.0 ± 0.5
a Sum of 16:0 and 16:0i.b Sum of 18:1n−9t, 18:1n−9c and 18:1n−7.c Sum of 18:3n−3, 20:3n−3, 20:5n−3, 22:5n−3c, 22:6n−3, 18:4n−3.d Sum of 18:2n−6t, 18:2n−6c, 18:3n−6, 20:3n−6, 20:4n−6, 22:4n−6, 22:5n−6, 20:2n
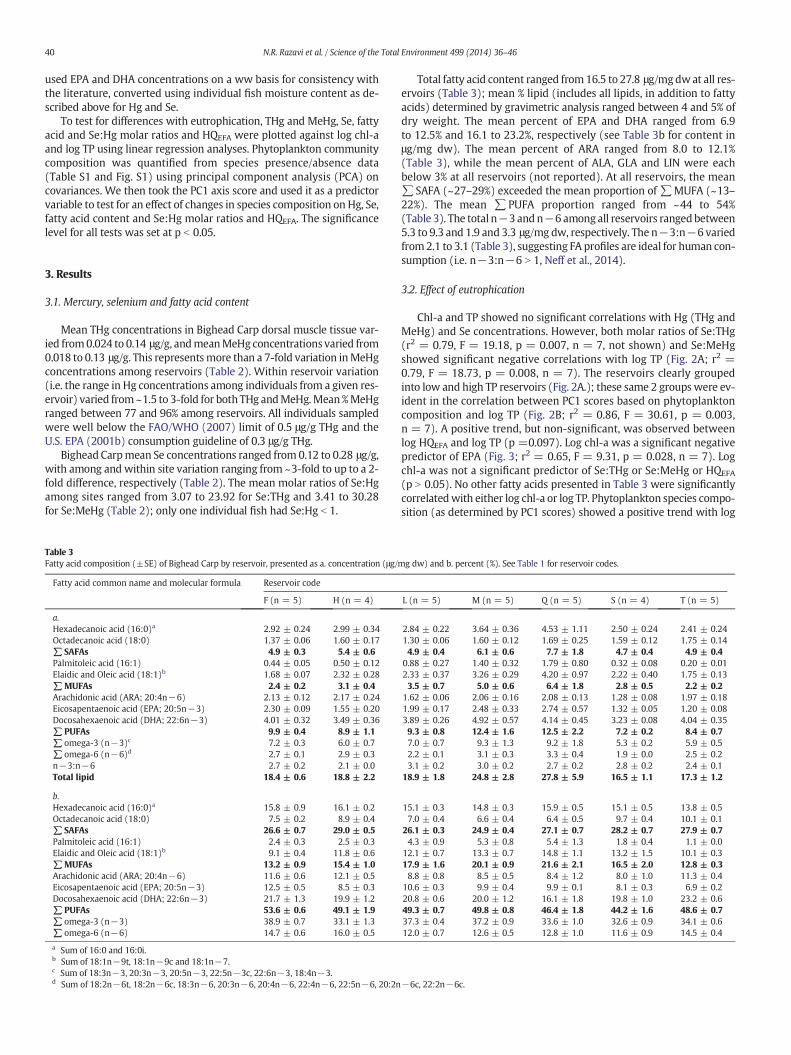
Total fatty acid content ranged from16.5 to 27.8 μg/mgdwat all res-ervoirs (Table 3); mean % lipid (includes all lipids, in addition to fattyacids) determined by gravimetric analysis ranged between 4 and 5% ofdry weight. The mean percent of EPA and DHA ranged from 6.9to 12.5% and 16.1 to 23.2%, respectively (see Table 3b for content inμg/mg dw). The mean percent of ARA ranged from 8.0 to 12.1%(Table 3), while the mean percent of ALA, GLA and LIN were eachbelow 3% at all reservoirs (not reported). At all reservoirs, the mean∑SAFA (~27–29%) exceeded the mean proportion of ∑MUFA (~13–22%). The mean ∑PUFA proportion ranged from ~44 to 54%(Table 3). The total n−3 andn−6 among all reservoirs rangedbetween5.3 to 9.3 and 1.9 and 3.3 μg/mg dw, respectively. The n−3:n−6 variedfrom2.1 to 3.1 (Table 3), suggesting FA profiles are ideal for human con-sumption (i.e. n−3:n−6 N 1, Neff et al., 2014).
3.2. Effect of eutrophication
Chl-a and TP showed no significant correlations with Hg (THg andMeHg) and Se concentrations. However, both molar ratios of Se:THg(r2 = 0.79, F = 19.18, p = 0.007, n = 7, not shown) and Se:MeHgshowed significant negative correlations with log TP (Fig. 2A; r2 =0.79, F = 18.73, p = 0.008, n = 7). The reservoirs clearly groupedinto low and high TP reservoirs (Fig. 2A.); these same 2 groupswere ev-ident in the correlation between PC1 scores based on phytoplanktoncomposition and log TP (Fig. 2B; r2 = 0.86, F = 30.61, p = 0.003,n = 7). A positive trend, but non-significant, was observed betweenlog HQEFA and log TP (p =0.097). Log chl-a was a significant negativepredictor of EPA (Fig. 3; r2 = 0.65, F = 9.31, p = 0.028, n = 7). Logchl-a was not a significant predictor of Se:THg or Se:MeHg or HQEFA
(p N 0.05). No other fatty acids presented in Table 3 were significantlycorrelatedwith either log chl-a or log TP. Phytoplankton species compo-sition (as determined by PC1 scores) showed a positive trend with log
g dw) and b. percent (%). See Table 1 for reservoir codes.
L (n = 5) M (n = 5) Q (n = 5) S (n = 4) T (n = 5)
2.84 ± 0.22 3.64 ± 0.36 4.53 ± 1.11 2.50 ± 0.24 2.41 ± 0.241.30 ± 0.06 1.60 ± 0.12 1.69 ± 0.25 1.59 ± 0.12 1.75 ± 0.144.9 ± 0.4 6.1 ± 0.6 7.7 ± 1.8 4.7 ± 0.4 4.9 ± 0.4
0.88 ± 0.27 1.40 ± 0.32 1.79 ± 0.80 0.32 ± 0.08 0.20 ± 0.012.33 ± 0.37 3.26 ± 0.29 4.20 ± 0.97 2.22 ± 0.40 1.75 ± 0.133.5 ± 0.7 5.0 ± 0.6 6.4 ± 1.8 2.8 ± 0.5 2.2 ± 0.2
1.62 ± 0.06 2.06 ± 0.16 2.08 ± 0.13 1.28 ± 0.08 1.97 ± 0.181.99 ± 0.17 2.48 ± 0.33 2.74 ± 0.57 1.32 ± 0.05 1.20 ± 0.083.89 ± 0.26 4.92 ± 0.57 4.14 ± 0.45 3.23 ± 0.08 4.04 ± 0.359.3 ± 0.8 12.4 ± 1.6 12.5 ± 2.2 7.2 ± 0.2 8.4 ± 0.77.0 ± 0.7 9.3 ± 1.3 9.2 ± 1.8 5.3 ± 0.2 5.9 ± 0.52.2 ± 0.1 3.1 ± 0.3 3.3 ± 0.4 1.9 ± 0.0 2.5 ± 0.23.1 ± 0.2 3.0 ± 0.2 2.7 ± 0.2 2.8 ± 0.2 2.4 ± 0.1
18.9 ± 1.8 24.8 ± 2.8 27.8 ± 5.9 16.5 ± 1.1 17.3 ± 1.2
15.1 ± 0.3 14.8 ± 0.3 15.9 ± 0.5 15.1 ± 0.5 13.8 ± 0.57.0 ± 0.4 6.6 ± 0.4 6.4 ± 0.5 9.7 ± 0.4 10.1 ± 0.1
26.1 ± 0.3 24.9 ± 0.4 27.1 ± 0.7 28.2 ± 0.7 27.9 ± 0.74.3 ± 0.9 5.3 ± 0.8 5.4 ± 1.3 1.8 ± 0.4 1.1 ± 0.0
12.1 ± 0.7 13.3 ± 0.7 14.8 ± 1.1 13.2 ± 1.5 10.1 ± 0.317.9 ± 1.6 20.1 ± 0.9 21.6 ± 2.1 16.5 ± 2.0 12.8 ± 0.38.8 ± 0.8 8.5 ± 0.5 8.4 ± 1.2 8.0 ± 1.0 11.3 ± 0.4
10.6 ± 0.3 9.9 ± 0.4 9.9 ± 0.1 8.1 ± 0.3 6.9 ± 0.220.8 ± 0.6 20.0 ± 1.2 16.1 ± 1.8 19.8 ± 1.0 23.2 ± 0.649.3 ± 0.7 49.8 ± 0.8 46.4 ± 1.8 44.2 ± 1.6 48.6 ± 0.737.3 ± 0.4 37.2 ± 0.9 33.6 ± 1.0 32.6 ± 0.9 34.1 ± 0.612.0 ± 0.7 12.6 ± 0.5 12.8 ± 1.0 11.6 ± 0.9 14.5 ± 0.4
−6c, 22:2n−6c.

B
A
Fig. 2. A. Mean (±SE) of selenium to methylmercury (Se:MeHg) molar ratio in Bighead Carp dorsal muscle tissue vs. log total phosphorous (TP). Molar ratios above 1 are expected to beprotective againstMeHg toxicity B. Principal component analysis axis 1 scores (PC1) based on phytoplankton species composition (see text and Supplementary information for details) vs.log TP. See Table 1 for reservoir codes.
41N.R. Razavi et al. / Science of the Total Environment 499 (2014) 36–46
Se concentrations (Fig. 4; r2 = 0.57, F = 6.28, p = 0.054, n = 7). Thisrelationship was significant when PC1 scores were derived using func-tional groups (Table S1) as opposed to species (r2 = 0.61, F = 7.78,p = 0.038, n = 7, not shown) which gives weight to the relationshipobserved in Fig. 4. PC1 scores (using phytoplankton species) were notsignificant predictors of Hg concentrations, Se:Hg molar ratios, HQEFA
or any fatty acid presented in Table 3.
3.3. Risk–benefit analyses
Two of the three risk–benefit analyses of Bighead Carp fish con-sumption suggested that the overall risk was low. None of the BigheadCarp Hg concentrations exceeded consumption guidelines set by theU.S. EPA (2001b) or the FAO/WHO (2007). Considering the risk relative
to the provisional tolerableweekly intake forMeHg, themean allowablefish consumption amount for Bighead Carp was N2500 g/week for bothan average adult woman and man (Table 4). When considering the ef-fect of Se as well as Hg, all the reservoirs had Se:Hg ratios that exceededthe protective ratio of 1, while Se concentrations remained below toxic-ity thresholds. Only the third measure of risk, HQEFA, which takes intoaccount the fish consumption required to achieve a daily-required EFA(EPA + DHA) dose of 500 mg/day, exceeded the risk threshold in all 7reservoirs (Table 4).
4. Discussion
While many studies report Hg, Se and fatty acid content of fish,fewer studies report these concentrations simultaneously, and fewer

Fig. 3.Mean (±SE) concentration of eicosapentaenoic acid (EPA) in Bighead Carp dorsal muscle tissue vs. log chlorophyll-a (chl-a). See Table 1 for reservoir codes.
42 N.R. Razavi et al. / Science of the Total Environment 499 (2014) 36–46
still report how eutrophication affects these concentrations and derivedmeasures of risk. Ourfirst two objectiveswere to characterize the Hg, Seand fatty acid content of a ubiquitous planktivore from subtropical res-ervoirs, and then to determine the effect of eutrophication (throughchanges in chl-a, TP and phytoplankton species composition) on thoseconcentrations. Eastern China has among the highest Hg emission anddeposition rates in theworld (Fu et al., 2012), yet themuscle of BigheadCarp in our study contained low Hg concentrations. Selenium
Fig. 4.Mean (±SE) concentration of selenium (Se) in Bighead Carp dorsal muscle tissue vs. thesition (see text and Supplementary information for details). See Table 1 for reservoir codes.
concentrations were adequate against MeHg toxicity (i.e. high Se:Hgmolar ratios), but were not themselves at toxic concentrations. BigheadCarp containedmoderately high EFA content (average EPA+DHAof allBighead Carp in this study = 119 mg/100 g) compared to terrestrialmeats (EPA + DHA range = 5–30 mg/100 g, Hibbeln et al., 2006), andsimilar EFA content to other Cypriniformes (EPA + DHA range = 70–214 mg/100 g, Gladyshev et al., 2012). Overall, these findings demon-strate that Bighead Carp from eastern Chinese reservoirs are a source
principal component analysis axis 1 scores (PC1) based on phytoplankton species compo-

Table 4Estimates for 1) allowable Bighead Carp consumption based on methylmercury (MeHg) concentrations in dorsal muscle tissue. Calculations use average weights for an adult woman(65 kg) and man (70 kg), see text for details on calculations; 2) a risk–benefit ratio expressed as hazard quotient (HQEFA), calculated using essential fatty acids (EFAs), i.e. the sum ofeicosapentaenoic acid (EPA; 20:5n−3) and docosahexaenoic acid (DHA; 22:6n−3) relative toMeHg concentrations. Hazard quotientswere first calculated for individualfish. See Table 1for reservoir codes.
Reservoir code n MeHg concentrations(μg/g ww) ± SE
Allowable consumption Hazard quotient
Amount per week(g)
Ratio of consumptiona EPA + DHA (mg/g ww) ± SE HQEFA
Mean ± SE
Woman Man Village City
F 5 0.13 ± 0.03 800 862 4.7–5.1 1.8–2.0 1.19 ± 0.13 9.2 ± 3.5H 5b 0.024 ± 0.001 4374 4710 25.7–27.7 9.9–10.7 1.03 ± 0.13 1.7 ± 0.2L 5 0.053 ± 0.01 1972 2124 11.6–12.5 4.5–4.8 1.12 ± 0.09 3.4 ± 0.4M 5 0.070 ± 0.01 1484 1598 8.7–9.4 3.4–3.6 1.57 ± 0.30 3.3 ± 0.4Q 5 0.043 ± 0.01 2422 2608 14.2–15.3 5.5–5.9 1.31 ± 0.20 2.5 ± 0.5S 4 0.018 ± 0.004 5649 6084 33.2–35.8 12.8–13.8 0.90 ± 0.03 1.5 ± 0.3T 5 0.050 ± 0.01 2091 2252 12.3–13.2 4.8–5.1 0.93 ± 0.08 4.0 ± 0.7
a Amount allowable/amount consumed. Fish consumption estimates (170 g/week for a village; 440 g/week for a city) are based on the most recent national survey data in Zhai andYang (2006).
b Sample size is n = 4 for the EPA + DHA concentrations and the hazard quotient calculations as described in the text.
43N.R. Razavi et al. / Science of the Total Environment 499 (2014) 36–46
of EFAs that presents a low risk of MeHg exposure. These results will bediscussed with respect to Bighead Carp diet and physiology, and fishingpressure in Chinese reservoirs.
4.1. Mercury concentrations
Bighead Carp are known to feed on phytoplankton and zooplanktonand thus occupy a low trophic level (Zhou et al., 2009). The lowHg con-centrations observed here are consistent with low Hg accumulation inlow trophic level fish compared to top predators (Cabana et al., 1994).Furthermore, Bighead Carp grow quickly and as such may experiencegrowth dilution that can further reduce Hg burden in fish (Simoneauet al., 2005). Fast growth rates are thought to account for low Hg con-centrations in tropical lake fishes, despite elevated Hg in water from in-dustrial pollution (Poste et al., 2012). Total Hg concentrations reportedhere were within the range found for Bighead Carp in many studies ofsubtropical reservoirs from southwestern China (e.g. THg range =0.007–0.315 μg/g,mean= 0.069 μg/g; Yan et al., 2010) butwere higherthan a hypereutrophic subtropical lake in eastern China (THg range =0.003–0.023 μg/g, mean = 0.011 μg/g; Wang et al., 2012). The captureof Bighead Carp at a young age by intense fisheries (Li and Xu, 1995)may explain these low Hg concentrations, as age is also a well-knownpredictor of Hg accumulation in fishes (Lange et al., 1994).
4.2. Effect of eutrophication on Hg concentrations
We expected to find a negative relationship between Hg concentra-tions in Bighead Carp and chl-a, as found for other fishes (Simonin et al.,2008). Lower fish Hg concentrations with chl-a are often attributed toalgal biodilution, whereby a constant amount of MeHg is distributedin a larger biomass of algae, resulting in reduced Hg biomagnification(Chen and Folt, 2005). Although the effects of eutrophication on MeHgbioavailability are complex, and can also potentially increase bioavail-ability (Razavi, 2014), evidence for algal biodilutionwas previously doc-umented within the planktonic food web of a subtropical Chinesereservoir (Wang et al., 2011), and THg concentrations in both zooplank-ton and top predators in the same reservoirs as the present study werenegatively predicted by chl-a (Razavi, 2014). The lack of relationship be-tween Bighead Carp THg (or MeHg concentrations) and chl-a (or zoo-plankton density, Razavi, 2014) may be due to differences in growthrates among reservoirs, as accumulated Hg is ‘diluted’ in fish thatgrow faster (Simoneau et al., 2005). Further research is needed to un-derstand how factors such as growth rate and age determine Hg accu-mulation in Bighead Carp from reservoirs in Eastern China.
4.3. Selenium concentrations
As with Hg, diet is also the primary exposure route for Se in fish. Seconcentrations reflect algal species composition because of interspecificvariation in Se content in primary producers (Stewart et al., 2010). Wefound that phytoplankton species composition differed between highand lowTP reservoirs, and that Bighead Carp Se concentrations reflectedthis change in species composition. Organisms such as Bighead Carpthat remain planktivorous at all life stages are ideal sentinels of Se avail-ability (Ponton and Hare, 2013). The Se concentrations found here sug-gest no general risk towildlife or human consumers due to Se toxicity inthese reservoirs.We are unaware of any previouswork on Se concentra-tions in reservoir fish fromChina. Our results are congruentwith Se con-centrations (0.30 μg/g) reported for the planktivorous Silver Carp(Hypophthalmichthys molitrix) collected in markets frommajor Chinesecities (Du et al., 2012). A study of a eutrophic lake in the Yangtze Riverwatershed impacted by a chlor-alkali plant found high Se concentra-tions (Se range= 0.4–1.5; Jin et al., 2006) in Silver Carp. Higher Hg con-centrations were also found in fish from that impacted lake (Jin et al.,2006). This suggests the reservoirs studied here are not impacted direct-ly by industrial pollution.
4.4. Effect of eutrophication on Se concentrations
In addition to diet, Se availability is affected by hydrology (Stewartet al., 2010). Our previous work on the reservoirs studied here showedthat TP concentrations were higher in reservoirs with short water reten-tion times (i.e.more lotic; Razavi, 2014).We showhere that phytoplank-ton species composition reflects differences in hydrology amongreservoirs (as inferred from Fig. 2B), with high TP reservoirs (i.e. morelotic) exhibiting a different phytoplankton species composition com-pared to low TP reservoirs (i.e. more lentic). We also find that phyto-plankton species composition is a predictor of Se concentrations inBighead Carp. These lines of evidence suggest that Se availability, as in-ferred from fish Se tissue concentrations (Orr et al., 2006), is a functionof hydrology and phytoplankton species composition in subtropical res-ervoirs. These results are consistent with findings from a temperate wa-tershed, where fish from lentic habitats had higher Se concentrationsthan fish from lotic habitats (Orr et al., 2006). The temperate studyfound that lentic habitats showed a greater formation of organoseleniumand Se bioaccumulation in fish relative to lotic habitats (Orr et al., 2006).Under controlled conditions, phosphorous was found to limit Se accu-mulation by a freshwater alga and subsequent Se transfer to zooplank-ton (Yu and Wang, 2004). Thus, interactions among nutrients, algalspecies composition and Se availability with habitat may explain our

44 N.R. Razavi et al. / Science of the Total Environment 499 (2014) 36–46
observation of significant decreases in Se:Hgmolar ratios in high TP (i.e.short water retention time) reservoirs.
4.5. Fatty acid concentrations
Fish diet also determines, in part, EFA content in fish because algaeare the primary organisms capable of inserting the n−3 and n−6 dou-ble bond in fatty acids. The overall lipid content of Bighead Carp sug-gests these are low fat fish (lipids comprised 4–5% dry weight). Lipidcontent of Bighead Carp did not vary widely, in contrast to the tropicalplanktivore Tilapia (Oreochromis niloticus) whose % lipid (dry weight)varied by up to 12-fold (Zenebe et al., 1998). This large variation,which was greater than omnivorous species in that study, was hypoth-esized to be due to differences in phytoplankton species consumed(Zenebe et al., 1998). Thus, our results suggest that there is little varia-tion in total lipid of plankton among reservoirs.
In contrast, the fatty acid composition of planktonmay differ amongreservoirs. We found that n−3:n−6 ranged between 2.1 and 3.1(mean (±SE) = 2.7 ± 0.1, n = 33), in good agreement with themean n−3:n−6 of 2.8 ± 1.1 for temperate lake fishes (Ahlgren et al.,2009). Significant differenceswere observed in n−3:n−6 among feed-ing guilds in temperate lake fishes, with herbivorous–omnivorous fishcontaining the lowest n−3:n−6 (2.0) compared to carnivorous–pi-scivorous (2.5) and carnivorous–benthivorous fish (3.7); Ahlgren et al.(2009). The n−3:n−6we found fell within the range of all the feedinggroups described by Ahlgren et al. (2009), despite Bighead Carp's con-sistent diet of zooplankton and phytoplankton. High n−3 fatty acids(calculated in the sameway as our study) in Bighead Carp dorsalmuscletissue were also found in the hypereutrophic Lake Taihu (Zhang et al.,2012a), which the authors proposed could be due to varying propor-tions of Microcystis availability in Bighead Carp diet. This algal groupshowed a highly variable n−3:n−6 ranging between 2 and 5(Hayakawa et al., 2002). Thus our fatty acid results for Bighead Carpsuggest these fish are eating different species or different proportionsof phytoplankton species among reservoirs.
4.6. Effect of eutrophication on fatty acids
Changes in phytoplankton species composition with eutrophicationcan affect fatty acid availability due to interspecific differences in phyto-plankton fatty acid content. For example, diatoms, cryptophytes and cil-iates contain high amounts of EPA relative to other algal groups(Hartwich et al., 2012). We observed that EPA content of Bighead Carpdecreased with increasing chl-a (i.e. phytoplankton density). Althoughthis requires further investigation with larger sample sizes, this resultis consistent with a decrease of EPA in seston with increasing lake pro-ductivity (as indicated by TP in Müller-Navarra et al., 2004). We wereunable to show that phytoplankton species composition (based onpresence/absence data) was correlated with EPA or DHA content in Big-head Carp. Plankton biomass and species composition were successfullyused to reconstruct past seston EPA content in Lake Constance(Hartwich et al., 2012). Future studies that account for abundances orbiomass of certain plankton groups, especially of ciliates and diatoms,may provide further insight into the differences responsible for the vary-ing EPA content of Bighead Carp found herewith phytoplankton density.
4.7. Implications for human health
Our third objective was to measure the overall risk of consumptionof Bighead Carp. Considering Hg concentrations alone relative to con-sumption guidelines (U.S. EPA, 2001b; FAO/WHO, 2007), we found noevidence for risk to human health. TheMeHg concentrations in BigheadCarp were low, such that large amounts of Bighead Carp dorsal muscle(g/week; Table 4) could be safely consumed by adults without exceed-ing the MeHg tolerable weekly intake of 1.6 μg/kg body mass (WHO,2004). This is in agreement with a risk–benefit analysis of freshwater
and marine fish species from coastal city markets in China that foundlow risk due to Hg contamination, and large allowable daily consump-tion amounts for Silver Carp, a similar species to the Bighead Carp (Duet al., 2012). The average daily consumption from the most recent na-tional survey (Zhai and Yang, 2006) is estimated to be 23.7 g and 62.3g in villages and large cities, respectively. This is equivalent to about170–440 g of aquatic products per week. A study conducted in themain village of one of our reservoirs (Qiandao), foundmost respondents(~46%) estimated they ate between 50 and 100 g of fish per week,while~17% of respondents estimated they ate N250 g per week (Fang et al.,2012). These consumption values are 2-fold to more than 10-foldlower than the amount of Bighead Carp we calculated could be safelyconsumed (Table 4). The observation that hair THg concentrations inwomen (17–46 years) were below thresholds in the Qiandao study(Fang et al., 2012), suggests that Hg may not be a contaminant of con-cern for women with similar fish consumption patterns in easternChina. Further studies of human populations living near reservoirs areneeded to confirm this finding.
ConsideringHg concentrationswithout accounting for Se concentra-tions can produce overly cautious risk assessments (Ouédraogo andAmyot, 2013). The low Bighead Carp Hg concentrations found in thepresent study were further mitigated by the presence of Se. The Se:Hgmolar ratios indicated no concern for any individual fish consumed (ex-cept one fish from Foziling). All mean ratios, irrespective of reservoir,remained above 1, accepted as the protective threshold (Ralston,2008). We did observe a high variation in Se:Hg, typical for freshwaterfishes (Burger et al., 2012). Larger intraspecific than interspecific differ-ences make it difficult to use Se:Hg values for risk assessment purposes,such that the overall usefulness of Se:Hg ratios is still debated and re-quires further research (Burger et al., 2012). Attempts, for example, tofind a pattern between fish size and Se:Hg molar ratios may work formarine fish (larger fish generally have lower Se:Hg molar ratios), butthis has not been clearly shown for freshwater species (Burger et al.,2012). At lower latitudes, low trophic level fish like Bighead Carp canoften be very large, such that Se:Hg remains high despite their largesize. Overall, it appears that there is sufficient, but not excessive, Se rel-ative to Hg to protect against the toxicity of MeHg in fish in the reser-voirs studied here. Evidence of sufficient Se to Hg concentrations wasalso found in a human hair study of women from one of our study res-ervoirs (Fang et al., 2012).
Unlike the other two risk analyses, the third calculation that consid-eredMeHg relative to EFAs (EPA+ DPA) concluded that among all res-ervoirs, the amount of Bighead consumption needed to achieve theadequate EFA dose (500 mg/day) would exceed the risk threshold (i.e.HQEFA N 1). The reason for these high hazard quotients is because Big-head Carp have only moderate EFA concentrations. Freshwater fish ingeneral are found to have lower EFA content relative to marine species(Gladyshev et al., 2012). This result illustrates that even a low level of Hgcontamination, as found here for Bighead Carp, can compromise this re-source if it is the sole source of beneficial EFAs. Our findings suggest thateutrophication may further decrease the EFA content (by reducing EPAconcentrations), thereby requiring higher consumption to achieve agiven EFA requirement. This would mean a greater exposure to MeHgin a eutrophic reservoir to achieve the same dietary EFA requirementas an oligotrophic reservoir. However, it is important to note that con-sumers most likely derive EFA from other dietary sources in additionto Bighead Carp. Thus a full assessment of the MeHg exposure from alldietary EFA sources is needed to achieve a complete understanding ofthe risk of MeHg exposure to eastern Chinese populations.
The risk assessments presentedherewere completed on dorsalmus-cle samples alone. Future studies should consider among-tissue varia-tion to better inform Chinese Bighead Carp consumers. In China, thisspecies is most often prepared as a soup, where the dorsal muscle tissueas well as brain and skin are eaten. Both Hg and Se can vary by tissue,and brain tissues were found to contain the lowest Hg and Se values rel-ative to other tissues for a marine top predator (Burger et al., 2013).

45N.R. Razavi et al. / Science of the Total Environment 499 (2014) 36–46
Bighead Carp were found to have higher EPA and DHA content in dorsalmuscle compared to ventral and tail tissue (Zhang et al., 2012b) but nodata are available on EFAs, Hg or Se concentrations in brain tissues orskin of Bighead Carp. Understanding the among-tissue variation in Hg,Se, Se:Hgmolar ratios and EFAswill help further improve fish consump-tion advisories.
5. Conclusions
This study addresses an important and still largely untested questionregarding changes in risk based on measures such as Se:Hg and HQEFA
with eutrophication. In reservoirs of eastern China, Bighead Carp appearto be a source of EPA and DHA that also have a low overall Hg contentand sufficient Se to confer protective benefits against MeHg toxicity(i.e. high Se:Hg molar ratios). However, eutrophication may reduce Seand EPA content through changes to phytoplankton species composi-tion and plankton biomass, respectively, decreasing the overall nutri-tional value of these fish relative to Hg content. Future research needsinclude expanding sample sizes and the eutrophication gradient, aswell as assessing the Hg, Se and fatty acid content of other subtropicalreservoir species, especially higher trophic level fish that can accumu-late greater Hg burdens.
Acknowledgments
We thank the School of Life Sciences at Fudan University (Shanghai,China) for field support and lab space; Drs. E Yumvihoze and A Poulain(University of Ottawa) forMeHg analyses, and J Chao and A Kling (Envi-ronment Canada) for assistance with fatty acid analyses. We also thankDrs. R Lavoie and P Hodson (Queen's University), L Campagna (CornellUniversity), and two anonymous reviewers for providing commentson earlier versions of thismanuscript. Funding for thisworkwas provid-ed by an International Doctoral Research Award from the InternationalDevelopment Research Centre (105407-99906075-087), Ontario Grad-uate Scholarships and the Department of Biology at Queen's Universityto NR Razavi, and by aNatural Sciences and Engineering Research Coun-cil of Canada Discovery Grant and a Queen's University (RGPIN/311786(2005–2010, 2010, 2012–2017)) Chancellor Award to LM Campbell.
Appendix A. Supplementary data
Supplementary data to this article can be found online at http://dx.doi.org/10.1016/j.scitotenv.2014.08.019.
References
Ahlgren G, Gustafsson I-B, Boberg M. Fatty acid content and chemical composition offreshwater microalgae. J Phycol 1992;28:37–50.
Ahlgren G, Vrede T, Goedkoop W. Fatty acid ratios in freshwater fish, zooplankton andzoobenthos — are there specific optima? In: Arts MT, et al, editors. Lipids in aquaticecosystems. Springer Science + Business Media; 2009. p. 147–78.
Arts MT, Ackman RG, Holub BJ. “Essential fatty acids” in aquatic ecosystems: a crucial linkbetween diet and human health and evolution. Can J Fish Aquat Sci 2001;58(1):122–37.
Burger J, Gochfeld M, Jeitner C, Donio M, Pittfield T. Selenium:mercury molar ratios infreshwater fish from Tennessee: individual, species, and geographical variationshave implications for management. Ecohealth 2012;9(2):171–82.
Burger J, Jeitner C, Donio M, Pittfield T, Gochfeld M. Mercury and selenium levels, and se-lenium:mercury molar ratios of brain, muscle and other tissues in bluefish(Pomatomus saltatrix) from New Jersey, USA. Sci Total Environ 2013;443:278–86.
Cabana G, Tremblay A, Kalff J, Rasmussen JB. Pelagic food chain structure in Ontario lakes:a determinant of mercury levels in lake trout (Salvelinus namaycush). Can J Fish AquatSci 1994;51(2):381–9.
Cai Y, Tang G, Jaffé R, Jones R. Evaluation of some isolation methods for organomercurydetermination in soil and fish samples by capillary gas chromatography—atomic fluo-rescence spectrometry. Int J Environ Anal Chem 1997;68(3):331–45.
Chen CY, Folt CL. High plankton densities reduce mercury biomagnification. Environ SciTechnol 2005;39:115–21.
Chow-Fraser P. Development of theWater Quality Index (WQI) to assess effects of basin-wide land-use alteration on coastal marshes of the Laurentian Great Lakes. In: Simon
TP, Stewart PM, editors. Coastal wetlands of the Laurentian Great Lakes: health, hab-itat, and indicatorsIndiana Biological Survey; 2006. p. 137–66.
Du Z-Y, Zhang J, Wang C, Li L, Man Q, Lundebye A-K, et al. Risk–benefit evaluation of fishfrom Chinese markets: nutrients and contaminants in 24 fish species from five bigcities and related assessment for human health. Sci Total Environ 2012;416:187–99.
Fang T, Aronson KJ, Campbell LM. Freshwater fish–consumption relations with total hairmercury and selenium amongwomen in Eastern China. Arch Environ Contam Toxicol2012;62(2):323–32.
FAO/WHO. Evaluation of certain food additives and contaminants. Sixty-seventh report ofthe Joint FAO/WHO Expert Committee on Food AdditivesWHO Technical Report Se-ries 940; 2007. [http://whqlibdoc.who.int/trs/WHO_TRS_940_eng.pdf Accessed 24April 2014].
FAO/WHO. Report of the Joint FAO/WHO expert consultation on the risks and benefits offish consumption. Rome: Food and Agriculture Organization of the United Nations;2011 [Geneva, World Health Organization, 50 pages].
Folch J, Lees M, Sloane Stanley GH. A simple method for the isolation and purification oftotal lipides from animal tissues. J Biol Chem 1957;226(1):497–509.
Fu X, Feng X, Sommar J,Wang S. A review of studies on atmosphericmercury in China. SciTotal Environ 2012;421–422:73–81.
Gladyshev MI, Sushchik NN, Anishchenko OV, Makhutova ON, Kalachova GS, GribovskayaIV. Benefit–risk ratio of food fish intake as the source of essential fatty acids vs. heavymetals: a case study of Siberian grayling from the Yenisei River. Food Chem 2009;115(2):545–50.
Gladyshev MI, Lepskaya EV, Sushchik NN, Makhutova ON, Kalachova GS, MalyshevskayaKK, et al. Comparison of polyunsaturated fatty acids content in filets of anadromousand landlocked Sockeye salmon Oncorhynchus nerka. J Food Sci 2012;77(12):C1306–10.
Hartwich M, Straile D, Gaedke U, Wacker A. Use of ciliate and phytoplankton taxonomiccomposition for the estimation of eicosapentaenoic acid concentration in lakes.Freshwat Biol 2012;57(7):1385–98.
Hayakawa K, Tsujimura S, Napolitano GE, Nakano S-I, Kumagai M, Nakajima T, et al. Fattyacid composition as an indicator of physiological condition of the cyanobacteriumMicrocystis aeruginosa. Limnology 2002;3(1):29–35.
Hibbeln JR, Nieminen LRG, Blasbalg TL, Riggs JA, LandsWEM. Healthy intakes of n−3 andn−6 fatty acids: estimations considering worldwide diversity. Am J Clin Nutr 2006;83:1483S–93S. [Suppl.].
Jin L, Liang L, Jiang G, Xu Y. Methylmercury, total mercury and total selenium in four com-mon freshwater fish species from Ya-Er Lake, China. Environ Geochem Health 2006;28(5):401–7.
Kim N, Arts MT, Yan ND. Eicosapentaenoic acid limitation decreases weight and fecundityof the invading predator Bythotrephes longimanus. J Plankton Res 2014;36(2):567–77.
Kris-Etherton PM, Grieger JA, Etherton TD. Dietary reference intakes for DHA and EPA.Prostaglandins Leukot Essent Fatty Acids 2009;81(2–3):99–104.
Lange TR, Royals HE, Connor LL. Mercury accumulation in Largemouth Bass (Micropterussalmoides) in a Florida lake. Arch Environ Contam Toxicol 1994;27:466–71.
Li S, Xu S. Culture and capture of fish in Chinese reservoirs. Ottawa: International Devel-opment Research Centre and Southbound Sdn. Bhd; 1995 [http://idl-bnc.idrc.ca/dspace/bitstream/10625/16132/1/103048.pdf Accessed 24 April 2014].
Mahaffey KR, Sunderland EM, Chan HM, Choi AL, Grandjean P, Mariën K, et al. Balancingthe benefits of n−3 polyunsaturated fatty acids and the risks of methylmercury ex-posure from fish consumption. Nutr Rev 2011;69(9):493–508.
Mason RP, Reinfelder JR, Morel FM. Uptake, toxicity, and trophic transfer of mercury in acoastal diatom. Environ Sci Technol 1996;30(6):1835–45.
Müller-Navarra DC, Brett MT, Park S, Chandra S, Ballantyne AP, Zorita E, et al. Unsaturatedfatty acid content in seston and tropho-dynamic coupling in lakes. Nature 2004;427(6969):69–72.
National Wildlife Federation. Poisoning wildlife: the reality of mercury pollution. Reston,Virginia: National Wildlife Federation; 2006 [24 pages].
Neff MR, Bhavsar SP, Ni FJ, Carpenter DO, Drouillard K, Fisk AT, et al. Risk–benefit of con-suming Lake Erie fish. Environ Res 2014;134:57–65.
Orr PL, Guiguer KR, Russel CK. Food chain transfer of selenium in lentic and lotic habitatsof a western Canadian watershed. Ecotoxicol Environ Saf 2006;63(2):175–88.
Ouédraogo O, Amyot M. Mercury, arsenic and selenium concentrations in water and fishfrom sub-Saharan semi-arid freshwater reservoirs (Burkina Faso). Sci Total Environ2013;444:243–54.
Pickhardt PC, Fisher NS. Accumulation of inorganic and methylmercury by freshwaterphytoplankton in two contrasting water bodies. Environ Sci Technol 2007;41(1):125–31.
Ponton DE, Hare L. Relating selenium concentrations in a planktivore to selenium specia-tion in lakewater. Environ Pollut 2013;176:254–60.
Poste AE, Muir DCG, Mbabazi D, Hecky RE. Food web structure and mercurytrophodynamics in two contrasting embayments in northern Lake Victoria. J GreatLakes Res 2012;38(4):699–707.
Ralston NVC. Selenium health benefit values as seafood safety criteria. Ecohealth 2008;5(4):442–55.
Ravet JL, Persson J, Brett MT. Threshold dietary polyunsaturated fatty acid concentrationsfor Daphnia pulex growth and reproduction. Inland Waters 2012;2:199–209.
Razavi NR. Mercury biomagnification in subtropical reservoirs of eastern China. PhD the-sis Kingston, Ontario, Canada: Queen's University; 2014 [207 pages].
Simoneau M, Lucotte M, Garceau S, Laliberté D. Fish growth rates modulate mercury con-centrations in walleye (Sander vitreus) from eastern Canadian lakes. Environ Res2005;98(1):73–82.
Simonin HA, Loukmas JJ, Skinner LC, Roy KM. Lake variability: key factors controllingmer-cury concentrations in New York State fish. Environ Pollut 2008;154(1):107–15.
Smith VH, Schindler DW. Eutrophication science: where dowe go from here? Trends EcolEvol 2009;24(4):201–7.

46 N.R. Razavi et al. / Science of the Total Environment 499 (2014) 36–46
State Environmental Protection of China. Water quality-determination of total phospho-rus: ammonium molybdate spectrophotometric method; 1990 [GB 11893-89.Beijing].
Stewart R, Groswell M, Buchwalter D, Fisher N, Luoma S, Matthews T, et al. Bioaccumula-tion and trophic transfer of selenium. In: Chapman PM, et al, editors. Ecological as-sessment of selenium in the aquatic environment. Boca Raton, Florida: CRC Press;2010. p. 93–139.
U.S. EPA. Integrated risk information system methylmercury (MeHg) (CASRN 22967-92-6. http://www.epa.gov/ncea/iris/subst/0073.htm, 2001. [Accessed 24 April 2014].
U.S. EPA. Water quality criterion for the protection of human health: methylmercury.Washington, DC: Office of Science and Technology Office of Water; 2001b [EPA-823-R-01-001].
Wang Q, Feng X, Yang Y, Yan H. Spatial and temporal variations of total and methyl-mercury concentrations in plankton from a mercury-contaminated and eutro-phic reservoir in Guizhou Province, China. Environ Toxicol Chem 2011;30(12):2739–47.
Wang S, Li B, Zhang M, Xing D, Jia Y, Wei C. Bioaccumulation and trophic transfer of mer-cury in a food web from a large, shallow, hypereutrophic lake (Lake Taihu) in China.Environ Sci Pollut Res 2012;19(7):2820–31.
WHO. Evaluation of certain food additives and contaminants: sixty-first report of the JointFAO/WHO expert committee on food additives. WHO technical report series, 922. ;2004. [http://whqlibdoc.who.int/trs/WHO_TRS_922.pdf Accessed 24 April 2014].
Xu Y, Cai Q, Han X, Shao M, Liu R. Factors regulating trophic status in a large subtropicalreservoir, China. Environ Monit Assess 2010;169(1–4):237–48.
Yan H, Rustadbakken A, Yao H, Larssen T, Feng X, Liu T, et al. Total mercury in wild fish inGuizhou reservoirs, China. J Environ Sci 2010;22(8):1129–36.
Young TF, Finley K, AdamsWJ, Besser J, Hopkins D, Jolley D, et al. What you need to knowabout selenium. In: Chapman PM, et al, editors. Ecological assessment of selenium inthe aquatic environment. Boca Raton, Florida: CRC Press; 2010. p. 7–45.
Yu R-Q, Wang W-X. Biokinetics of cadmium, selenium, and zinc in freshwater algaScenedesmus obliquus under different phosphorus and nitrogen conditions andmetal transfer to Daphnia magna. Environ Pollut 2004;129(3):443–56.
Zenebe T, Ahlgren G, Boberg M. Fatty acid content of some freshwater fish of commercialimportance from tropical lakes in the Ethiopian Rift Valley. J Fish Biol 1998;53(5):987–1005.
Zhai FY, Yang XG. China nutrition and health survey in 2002, book II— foods and nutrientsintake. Beijing: People's Medical Publishing House; 2006.
Zhang D-P, Zhang X-Y, Yu Y-X, Li J-L, Yu Z-Q,Wang D-Q, et al. Intakes of omega-3 polyun-saturated fatty acids, polybrominated diphenyl ethers and polychlorinated biphenylsvia consumption of fish from Taihu Lake, China: a risk–benefit assessment. FoodChem 2012a;132(2):975–81.
Zhang D-P, Zhang X-Y, Yu Y-X, Li J-L, Yu Z-Q,WuM-H, et al. Tissue-specific distribution offatty acids, polychlorinated biphenyls and polybrominated diphenyl ethers in fishfrom Taihu Lake, China, and the benefit–risk assessment of their co-ingestion. FoodChem Toxicol 2012b;50(8):2837–44.
Zhou Q, Xie P, Xu J, Ke Z-X, Guo L-G, Cao T. Seasonal variations in stable isotope ratios oftwo biomanipulation fishes and seston in a large pen culture in hypereutrophicMeiliang Bay, Lake Taihu. Ecol Eng 2009;35:1603–9.