Set Membership Approach to Identification and Prediction of Lake Eutrophication
10
WATER RESOURCES RESEARCH, VOL. 26, NO. 11, PAGES 2643-2652, NOVEMBER 1990 Set Membership Approach to Identification and Prediction of Lake Eutrophication KAREL KEESMAN AND GERRIT VAN STRATEN Department of Chemical Engineering, University of Twente, Enschede, The Netherlands Generally, ecosystems modeling is obstructed by the problem of sparse and unreliable data, and lack of knowledge about processes dominating the system. Under these circumstances,set theoretic uncertainty modelsare an appropriatealternative to probabilistic models. The only requirement is that the uncertainty is pointwise bounded. A newly developed set membershipidentification procedure is presentedand demonstrated by an application to the modeling of shallow lake eutrophication. First, a set of parameter vectors is identified. Analysis of the set reveals a dominant direction spanned by four algal growth and death parameters. Second, on the basis of additional fuzzy set theoretic assumptions, a formal min-max estimation is performed to obtain information about the model validity. If the model appears to be (partially) invalid, the degree of invalidity, affecting the model prediction uncertainty, can be represented by an estimate of the model structure error in addition to the uncertainty contained in the identified set of parameter vectors. INTRODUCTION An important problem in lake water quality management is eutrophication. Due to excessive nutrient loadings from point sources (sewage plants, inlets, and so forth) and nonpoint sources (from agriculture), algae blooms occur in spring and summer. From the viewpoint of recreation, fisheries, and drinking water supply, these blooms must be prevented. Lake Veluwe, created in 1956/1957 during the reclamation of Eastern Flevoland in the Netherlands, is an example of a lake that has suffered from excessive algae blooms since 1970. The restoration of the lake started in 1972, when phosphates were removed from the effluent of one of the sewage plants. This pollution control activity aimed at diminishing the external phosphorous load. In addition, since 1979 phosphorus-poor and calcium-richwater from the polder was used to flush the lake during the winter periods. Without mathematical modeling, it is virtually impossible to predict the effects of this kind of human interference in a system. In model building, a balance must be found between the complexity needed to mimic the systems behavior and the practical requirement of identifiability [Beck, 1981]. Only relatively simple modelscan be calibratedby formal param- eter estimation against field data. The calibration process should not merely result in "op- timal" parameter estimates, but also in an analysis of the associated residuals in order to obtain information on model validity. In addition, it is also desirable to properly identify the uncertainty in parameter estimates and model structure from the field data. Uncertainties are of major importance in model predictions, because predicting effects just from a single trajectory associated with an "optimal" parameter vector can be quite misleading. Even when the model and the associated uncertainties are identified from the data, the results will still contain some subjective elements. Against this background, Fedra et al. [1981] proposed a method (based on the work of Spear and Hornberger [1980]) that explicitly takes into account the Copyright 1990 by the American Geophysical Union. Paper number 90WR00974. 0043-1397/90/90WR-00974505. O0 2643 assumptions made with respect to the uncertainties. The key idea behind this method is that the uncertainty in observed systembehavior can be expressed in terms of deterministic constraints in the observation space. Parameter identifica- tion is performed by running Monte Carlo simulations on the basis of physically feasible ranges of initial conditions and parameter estimates, assuming independent uniform distri- butions. Fedra et al. interpreted their results (model re- sponses,two subsetsof parameter vectors, and associated predictions) in probabilistic terms. Apart from the observed system behavior, their analysis was therefore completely performed within a statistical setting. In previous papers, Keesman and van Straten [ 1987, 1988] (see also Keesman [ 1989a, b]) too have stressed the need for adequate uncertainty models for ill-defined natural (water quality) systems. Due to the presence of inevitable nonran- dom model structure error, resulting from model simplifica- tions and obscurity of the processes, the choice of stochastic uncertainty models, however, is questionable. Reinforcing this concern is the limited information on measurement uncertainty resulting from sparsemeasurementswhich does not allow for a detailed error characterization in terms of probability density functions. Under these circumstances, the results of, for instance, the popular maximum likelihood approach for estimating parameters and associated uncer- tainty could be quite misleading. As an alternative to a stochastic approach, we therefore adopted a set theoretic way of modeling uncertainty, as defined by Schweppe [1973]. Suppose that a number of measurements are available for a process, which is approximately represented by the model •t(t) = fix(t), u(t), p] (1) Yk= h[xk] + ek, (k = 1,... , N) (2) where x state vector; u input vector; p parameter vector; y measurement vector; e noise vector;
Transcript of Set Membership Approach to Identification and Prediction of Lake Eutrophication

WATER RESOURCES RESEARCH, VOL. 26, NO. 11, PAGES 2643-2652, NOVEMBER 1990
Set Membership Approach to Identification and Prediction of Lake Eutrophication
KAREL KEESMAN AND GERRIT VAN STRATEN
Department of Chemical Engineering, University of Twente, Enschede, The Netherlands
Generally, ecosystems modeling is obstructed by the problem of sparse and unreliable data, and lack of knowledge about processes dominating the system. Under these circumstances, set theoretic uncertainty models are an appropriate alternative to probabilistic models. The only requirement is that the uncertainty is pointwise bounded. A newly developed set membership identification procedure is presented and demonstrated by an application to the modeling of shallow lake eutrophication. First, a set of parameter vectors is identified. Analysis of the set reveals a dominant direction spanned by four algal growth and death parameters. Second, on the basis of additional fuzzy set theoretic assumptions, a formal min-max estimation is performed to obtain information about the model validity. If the model appears to be (partially) invalid, the degree of invalidity, affecting the model prediction uncertainty, can be represented by an estimate of the model structure error in addition to the uncertainty contained in the identified set of parameter vectors.
INTRODUCTION
An important problem in lake water quality management is eutrophication. Due to excessive nutrient loadings from point sources (sewage plants, inlets, and so forth) and nonpoint sources (from agriculture), algae blooms occur in spring and summer. From the viewpoint of recreation, fisheries, and drinking water supply, these blooms must be prevented.
Lake Veluwe, created in 1956/1957 during the reclamation of Eastern Flevoland in the Netherlands, is an example of a lake that has suffered from excessive algae blooms since 1970. The restoration of the lake started in 1972, when phosphates were removed from the effluent of one of the sewage plants. This pollution control activity aimed at diminishing the external phosphorous load. In addition, since 1979 phosphorus-poor and calcium-rich water from the polder was used to flush the lake during the winter periods.
Without mathematical modeling, it is virtually impossible to predict the effects of this kind of human interference in a system. In model building, a balance must be found between the complexity needed to mimic the systems behavior and the practical requirement of identifiability [Beck, 1981]. Only relatively simple models can be calibrated by formal param- eter estimation against field data.
The calibration process should not merely result in "op- timal" parameter estimates, but also in an analysis of the associated residuals in order to obtain information on model
validity. In addition, it is also desirable to properly identify the uncertainty in parameter estimates and model structure from the field data. Uncertainties are of major importance in model predictions, because predicting effects just from a single trajectory associated with an "optimal" parameter vector can be quite misleading.
Even when the model and the associated uncertainties are
identified from the data, the results will still contain some subjective elements. Against this background, Fedra et al. [1981] proposed a method (based on the work of Spear and Hornberger [1980]) that explicitly takes into account the
Copyright 1990 by the American Geophysical Union.
Paper number 90WR00974. 0043-1397/90/90WR-00974505. O0
2643
assumptions made with respect to the uncertainties. The key idea behind this method is that the uncertainty in observed system behavior can be expressed in terms of deterministic constraints in the observation space. Parameter identifica- tion is performed by running Monte Carlo simulations on the basis of physically feasible ranges of initial conditions and parameter estimates, assuming independent uniform distri- butions. Fedra et al. interpreted their results (model re- sponses, two subsets of parameter vectors, and associated predictions) in probabilistic terms. Apart from the observed system behavior, their analysis was therefore completely performed within a statistical setting.
In previous papers, Keesman and van Straten [ 1987, 1988] (see also Keesman [ 1989a, b]) too have stressed the need for adequate uncertainty models for ill-defined natural (water quality) systems. Due to the presence of inevitable nonran- dom model structure error, resulting from model simplifica- tions and obscurity of the processes, the choice of stochastic uncertainty models, however, is questionable. Reinforcing this concern is the limited information on measurement
uncertainty resulting from sparse measurements which does not allow for a detailed error characterization in terms of
probability density functions. Under these circumstances, the results of, for instance, the popular maximum likelihood approach for estimating parameters and associated uncer- tainty could be quite misleading. As an alternative to a stochastic approach, we therefore adopted a set theoretic way of modeling uncertainty, as defined by Schweppe [1973].
Suppose that a number of measurements are available for a process, which is approximately represented by the model
•t(t) = fix(t), u(t), p] (1)
Yk = h[xk] + ek, (k = 1,... , N) (2)
where
x state vector;
u input vector; p parameter vector; y measurement vector; e noise vector;

2644 KEESMAN AND VAN STRATEN' SET MEMBERSHIP APPROACH TO ECOSYSTEM MODELING
k measurement index; f, h vector functions
The only assumption with respect to a priori parameteric uncertainty and noise is that they are bounded (unknown but bounded uncertainty models). The assumption that the noise vector (ek) belongs to a set implies also that the measure- ments (Y0 belong to a set. The series of bounded measure- ments then span the so-called behavior space. Note that the "output error" (e0 represents both errors in the measure- ments and in the model structure (errors in f and h).
These assumptions do not allow the identification of an "optimal" parameter estimate. Instead of a single "optimal" parameter vector, a set of (equally) acceptable parameter vectors (p) is identified. This set of parameter vectors spans the posterior parameter space (f/p) that is consistent with the presumed model structure, the predefined parameter bounds (defining the prior parameter space lip), and the noise bounds.
The purpose of this paper is to illustrate the set member- ship approach by using it to identify a eutrophication model. Lake eutrophication is an example of an ill-defined problem with complex nonlinear interactive processes. In the model description, we adopted a set of fairly "classical" equations. This choice was motivated by the intended objective (control of biomass levels), the data availability, and the existing knowledge about dominant processes. Also, prior informa- tion about measurement uncertainty and parameter ranges is specified. Next, the algorithm developed for identifying the parameter space lip in the set theoretic sense is presented, and applied to the model. Interpretation of the results in terms of parameter sensitivities revealed that only a few parameters were dominant in controlling system behavior. Inspection of the model response spaces relative to the data, and analysis of identified dominant subprocesses offered information for possible model improvements. In order to obtain information on subspaces and on the center of lip, the set theoretic approach was extended toward a fuzzy set theoretic approach. Finally, the results are used to generate model predictions for the period in which human interfer- ence took place by means of flushing during the winter period.
MODELING LAKE EUTROPHICATION
Modeling eutrophication of shallow lakes (in contrast to deep lakes) has only recently been a subject of research (see, for instance, Brinkman and van Raaphorst [1986], J•rgensen [1976], and Somly6dy and van Straten [1986]). The choice of an appropriate model structure is not straightforward, be- cause of the lack of a solid theoretical basis due to the
complexity of the system. Besides model complexity, spatial and temporal differences also contribute to the wide variety of possible model formulations.
It is clear that a priori model selection based solely on prior system knowledge is inappropriate. An additional criterion for model choice is the availability of data. For Lake Veluwe, measurements of temperature, pH, dissolved oxygen, biochemical oxygen demand (BOD), organic car-
models with single phytoplankton species without zooplank- ton. This, however, is not a strong limitation because the lake is dominated by a single species, Oscillatoria aghardii, which is not grazed by zooplankton.
A priori knowledge and available information already limit the size of the feasible model class. A further reduction is
obtained by examining the intended purpose. Of course, at this stage, or in fact anywhere in the modeling procedure, it could appear that none of the models is suitable for our application. In that case we can either choose to collect additional data or to incorporate speculative modeling as- pects [van Straten and Keesman, 1990].
In the particular case of Lake Veluwe, the intended use of the eutrophication model is to predict the effects of flushing during winter periods to avoid excessive algae blooms in spring and summer. The key idea behind this flushing experiment was that by refreshing the phosphorous-rich lake water with phosphorus-poor polder water, phosphorus- limited algal growth would be initiated. Therefore besides phosphorus uptake in living algae, changes in phosphorus content in detritus (including dead algae) and ortho-P are incorporated in the model. In order to describe the spatially aggregated effect of flushing, we assume complete mixing. The model consists, then, of a set of ordinary differential equations which emphasize the chemical, biological, and ecological aspects of the problem.
We decided to describe the functional relationships be- tween the state variables in a more or less "classical" way [see Likens, 1972; Park et al., 1974], because it was not our intention to design a "new" eutrophication model. The rate of change of living algae results from algal growth, death, and outflow. Algal growth is determined by its species- dependent maximum growth rate, corrected for tempera- ture-, light-, and nutrient-limiting factors. These limiting factors contribute to a great extent to the nonlinear character of the algal dynamics. Similarly, changes in detritus result from algal death, mineralization, sedimentation, inflows, and outflows. The rate of change in ortho-P stems from uptake of ortho-P for algal growth, mineralization of detritus, release from sediments in certain periods of the year (internal source), and inflows and outflows. The complete set of state equations, expressed in terms of P, is presented in the appendix.
The model deviates from the classical approach with respect to the modeling of the internal source term. The exchange is driven by the difference in P concentration in the water and in the sediment. There is no measurement infor-
mation that could support the formulation of the sediment P concentration as a separate state variable. However, sedi- ment research [Brinkman and van Raaphorst, 1986] suggests that the effective interstitial P concentration (Peq) consists of a chemical adsorption/desorption contribution, and a contri- bution due to mineralization of detritus in the sediment. We
took, as a working assumption, the chemical contribution (Pchem) to be constant, whereas the mineralization term (R) is determined by the instantaneous sedimentation of detritus
bon, chlorophyll a, nitrogen, phosphorus, calcium, chloride, P and a temperature control function. sulphate, and silicate are available for a number of sampling Data from April 1978 to November 1979 are selected for points twice a month. In addition, similar data from tribu- the identification of the model. The model is then verified for taries have been collected. The information in the data set the period between November 1979, when the flushing forces us to restrict the set of possible models to the class of experiment started, and April 1981.

KEESMAN AND VAN STRATEN: SET MEMBERSHIP APPROACH TO ECOSYSTEM MODELING 2645
INITIALIZATION
After defining the model equations and collecting the necessary data, the initial uncertainties are specified. Both parameter uncertainty as well as measurement noise are expressed in terms of allowable ranges. The prior parametric uncertainty, resulting from literature and engineering judg- ment, is represented in Table A1 of the appendix.
The data uncertainty is accounted for by expressing the observed system behavior in terms of lower and upper bounds for each measurement. Before this can be done, we need to relate the state variables A, D, and P to the available measurements. Assuming a constant cell stoichiometry, phosphorus in algae (A) and measured chlorophyll a are related by a constant ratio (Ypa = 0.95 mg P/mg chlorophyll a). The nonmeasured detritus fraction is expressed as total P concentration minus P in algae and dissolved inorganic P. In this way, all state variables are linked to the measurement variables chlorophyll a, ortho-P and total P [van Straten, 1981] (see the appendix).
A first estimate of the associated measurement uncertainty can be obtained from engineering experience and residual analysis from Fourier filtering. The results of this indicated that the maximum measurement error of chlorophyll a and ortho-P is approximately 60 mg/m 3 and for total P approxi- mately 100 mg/m 3. Note that no statistical assumptions on the uncertainties have been made so far.
The objective is to identify a set of feasible parameter vectors, which is consistent with the system behavior as represented by the measurements and associated uncer- tainty (equation (2)), the assumed model structure (see the appendix), and the predefined parameter ranges (Table A1). In order to prevent a situation in which no feasible parameter vectors will be found due to outliers, the data series is smoothed by Fourier filtering [see Keesman and van Straten, 1989].
Even now, with the bounds already specified, there is still a chance that no feasible parameter vectors will be found because of the presence of model structure error. This error is due to, for instance, incomplete knowledge of dominant processes. Therefore it is better to specify initially wider noise bounds to start the procedure. In this study, large initial noise bounds for all measurements (_+250 mg/m 3) ensure that at least some parameter vectors are found which then may serve as a starting point for further analysis.
SET MEMBERSHIP IDENTIFICATION
Monte Carlo Set Membership Algorithm
In previous papers [Keesman and van Straten, 1987, 1988] (see also Keesman [ 1990]), a robust set membership estima- tion algorithm using random scanning and principal compo- nent analysis has been presented. The key idea behind this algorithm is to obtain realizations from the prior parameter space by Monte Carlo sampling which are able to describe the system behavior within the given bounds (see also Fedra et al. [1981]). Principal component analysis (see, for in- stance, [Bard, 1974]) of the feasible realizations, which simply results in a rotation of the original coordinate system, is performed to improve the computational efficiency (see Figure 1).
The algorithm can be summarized as follows: 1. Define the system behavior in terms of (smoothed)
P2
Fig. 1. Schematic representation of the Monte Carlo set member- ship algorithm.
measurements with associated noise bounds (called the behavior space).
2. Specify admissible ranges for each parameter (repre- sented by 11p in Figure la).
3. Transform the model parameters to the [-1, 1] inter- val (represented by 110 in Figure lb) in order to increase the computational robustness of the method.
4. Perform a number of model simulations with parame- ter vectors selected by a Monte Carlo technique (assuming rectangular "distributions") from the prior parameter space (defined initially in step 2 and in later loops modified accord- ing to step 6). Classify each parameter vector as feasible or nonfeasible according to the criterion of step 1.
5. Rotate the transformed coordinate system according to the principal axes of 110 resulting from eigenvalue decom- position of the dispersion matrix • of the set of feasible parameter vectors (resulting in the r coordinate system in Figure lb).
6. Extend the parameter intervals in this r coordinate system (resulting in the new prior parameter space 11•, see Figure lb), in order to avoid loss of parametric information induced by the Monte Carlo approach near the bounds of the parameter space.
7. Go to step 4 if the stopping rule (for example, number of acceptable parameter vectors required) is not satisfied.
Set Membership Estimation Results
On the basis of the initial parametric information (Table A1) and the specified noise bounds (_+250 mg/m3), we performed two iterations of 1000 Monte Carlo simulations each. Rotation (step 5 above), performed after the first 1000 simulations, increased the percentage of feasible vectors found from 6.6% in the first to 23.8% in the second iteration.
This is because, after rotation, realizations are obtained by sampling linear combinations of parameters instead of indi- vidual parameters. In the second iteration, parameter vec- tors are taken again from rectangular "distributions," be- cause sets are the object of interest. Apart from rotation, translation of the prior parameter Space for the second iteration (see Figure 1) contributed to the increase as well.
The results will now be interpreted in terms of parameter sensitivities and model validity.
In addition to the vectors contained in the posterior parameter space, the orientation of this space is also impor- tant, because it gives information about parameter sensitiv- ities [Keesman, 1989b].

2646 KEESMAN AND VAN STRATEN.' SET MEMBERSHIP APPROACH TO ECOSYSTEM MODELING
TABLE 1. Eigenmatrix and Eigenvalues Associated With the Posterior Parameter Space
Eigen- Eigen- vector value Kg m T c To •o 13 io i l P!•
1 0.079* 0.41t 0.30 -0.45 -0.05 -0.16 -0.02 0.01 -0.00 2 0.253 0.08 -0.08 0.21 0.09 -0.08 0.02 0.07 0.10 3 0.363 0.17 -0.16 0.09 0.25 -0.57 -0.06 -0.07 -0.01 4 1.400 -0.23 -0.11 -0.43 -0.24 -0.14 -0.27 0.27 -0.04
5 1.309 0.03 -0.24 0.04 -0.02 -0.04 0.06 0.23 0.51 6 0.584 -0.42 0.22 -0.31 0.48 0.01 -0.12 -0.02 0.55 7 1.265 0.08 -0.04 0.14 -0.36 -0.35 -0.36 0.30 0.14 8 1.242 0.01 -0.01 -0.02 -0.04 -0.51 0.44 -0.10 0.06 9 0.675 0.01 -0.02 0.10 0.02 0.10 -0.08 -0.41 0.16
10 0.923 0.07 0.35 0.04 0.18 -0.06 -0.59 -0.10 -0.22 11 0.983 -0.37 -0.29 -0.10 0.17 -0.21 -0.03 -0.34 -0.42 12 1.020 -0.36 -0.33 0.03 -0.08 -0.13 -0.27 0.10 -0.02 13 0.825 -0.24 0.52 0.49 0.11 -0.29 0.03 0.13 0.01 14 1.065 0.17 -0.30 0.02 0.57 0.02 0.08 0.40 -0.14 15 0.719 -0.37 0.27 -0.10 -0.10 0.04 0.35 0.40 -0.30 16 0.755 -0.17 0.03 -0.12 -0.25 -0.18 0.16 -0.34 0.19 17 1.156 0.17 0.13 -0.39 0.15 -0.22 0.08 0.02 -0.09
Eigen- Eigen- vector value K d 0 d Km Ks •/ K 1 Or • Pchem
1 0.079 -0.48 0.49 -0.01 -0.11 -0.01 0.04 -0.01 -0.07 0.16 2 0.253 -0.31 -0.43 0.15 -0.39 -0.09 -0.10 -0.01 -0.54 0.38 3 0.363 -0.22 -0.26 -0.30 0.15 -0.22 0.21 0.37 0.28 -0.05 4 1.400 0.02 -0.24 0.12 0.03 0.32 -0.29 0.27 0.25 0.37 5 1.309 -0.09 0.10 -0.21 -0.50 -0.00 -0.31 -0.18 0.34 -0.26 6 0.584 0.06 0.04 -0.01 0.19 -0.21 0.01 0.04 -0.19 0.04 7 1.265 0.38 0.27 0.13 -0.00 -0.28 0.05 0.17 -0.33 -0.15 8 1.242 0.25 0.04 0.20 0.17 -0.13 -0.17 -0.48 0.13 0.33 9 0.675 0.30 0.21 0.10 -0.43 -0.02 0.32 0.27 0.26 0.45
10 0.923 0.01 -0.20 0.25 -0.18 -0.23 -0.13 -0.37 0.28 -0.11 11 0.983 -0.01 0.32 -0.12 -0.24 -0.07 -0.39 0.09 -0.22 -0.12 12 1.020 -0.26 0.13 -0.07 0.00 0.18 0.56 -0.46 -0.02 0.10 13 0.825 -0.08 0.19 -0.05 -0.04 0.50 -0.08 0.12 0.02 0.02 14 1.065 0.06 0.21 0.53 -0.02 0.13 0.08 0.10 0.08 -0.05 15 0.719 -0.04 -0.04 -0.02 -0.30 -0.45 0.24 0.11 0.16 0.00 16 0.755 -0.24 -0.14 0.59 -0.09 0.11 0.14 0.15 0.02 -0.45 17 1.156 0.43 -0.25 -0.22 -0.34 0.36 0.26 -0.11 -0.22 -0.22
Noise bounds are 250 mg/m 3. *Italicized eigenvalue indicates a dominant direction. ?Bold elements indicate a major contribution of the associated parameter (Kgm, To, Kd, and Or) to the dominant direction.
Let us assume an ellipsoidal posterior parameter space, with center at 0c,
•0: {0:(0 - Oc)T•-l(o -- Oc) •< 1} (3)
where • is a positive definite matrix. Then, from eigenvalue decomposition of the inverse dispersion matrix •-•, an eigenvector with associated small eigenvalue denotes a well-determined (small variance) direction in the trans- formed parameter space. It appears that a combination of the parameters Karo, To, Kd, and Od (see Table 1) spans a well-determined direction. This combination is dominant in
controlling the system behavior under the condition that the noise bounds equal +250 mg/m 3. These parameters, associ- ated with the temperature-dependent growth and death processes of the algae (see the appendix), indicate the existence of subprocesses on which further research can be focused in order to improve the model.
obtained by inspection of the resulting model response spaces of chlorophyll a, ortho-P, and total P associated with the set of feasible parameter vectors.
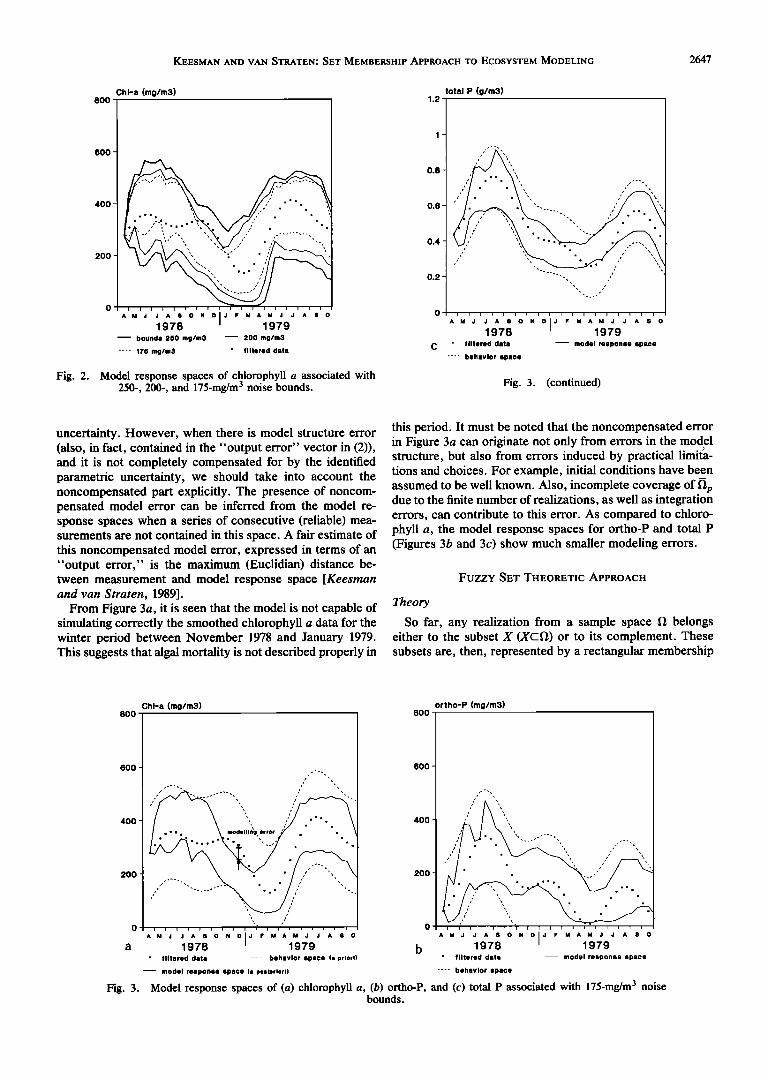
In order to examine the degree of correspondence be- tween data and model, we further delimited the noise bounds to -+ 175 mg/m 3. The effect of shrinking the noise bounds from 250 to 200 and further to 175 mg/m 3 on the model response space of chlorophyll a can be seen in Figure 2. The bounds shown are those for the simulated values obtained
from the sampled feasible parameter set. It appeared from eigenvalue decomposition of the dispersion matrices, that smaller noise bounds do not affect the dominant direction in
the parameter space significantly. The behavior and associated model response spaces for
chlorophyll a, ortho-P and total P are shown in Figure 3 for noise bounds equal to -+ 175 mg/m 3. We observe that the model response spaces cover only a fraction of the specified
Because of the close relationship between parameter behavior space (measurements +175 mg/m3). In other estimation and model validation (see, for instance, Beck and words, the posterior parametric uncertainty, explicitly rep- Young [1976] and Keesman and van $traten [1987], the set resented by 11t,, does not completely reflect the specified membership estimation results were also viewed from the uncertainty in the measurement equation (equation (2)). This perspective of model validity. A first indication can be situation is acceptable if it merely concerns measurement
KEESMAN AND VAN STRATEN: SET MEMBERSHIP APPROACH TO ECOSYSTEM MODELING 2647
Chl-a (mg/m3) 800
600
400 -
200
0
A M J J A 8 O N D[J F M A M J J A 8 O 1978 1979 -- bounds 250 rag/m3 200 rag/m3
.... 175 rag/m3 ' filtered data
total P (g/m3) 1.2
I -
0.8-
0.6-
0.4-
0.2-
__
A M J J A 8 O N D[J F M A M J J A 8 O 1978 1979 ß filtered data model response space
.... behavior spaoe
Fig. 2. Model response spaces of chlorophyll a associated with 250-, 200-, and 175-mg/m 3 noise bounds. Fig. 3. (continued)
uncertainty. However, when there is model structure error (also, in fact, contained in the "output error" vector in (2)), and it is not completely compensated for by the identified parametric uncertainty, we should take into account the noncompensated part explicitly. The presence of noncom- pensated model error can be inferred from the model re- sponse spaces when a series of consecutive (reliable) mea- surements are not contained in this space. A fair estimate of this noncompensated model error, expressed in terms of an "output error," is the maximum (Euclidian) distance be- tween measurement and model response space [Keesrnan and van Straten, 1989].
From Figure 3a, it is seen that the model is not capable of simulating correctly the smoothed chlorophyll a data for the winter period between November 1978 and January 1979. This suggests that algal mortality is not described properly in
this period. It must be noted that the noncompensated error in Figure 3a can originate not only from errors in the model structure, but also from errors induced by practical limita- tions and choices. For example, initial conditions have been assumed to be well known. Also, incomplete coverage of fl e due to the finite number of realizations, as well as integration errors, can contribute to this error. As compared to chloro- phyll a, the model response spaces for ortho-P and total P (Figures 3b and 3c) show much smaller modeling errors.
Fuzzy SET THEORETIC APPROACH
Theory
So far, any realization from a sample space 12 belongs either to the subset X (XC12) or to its complement. These subsets are, then, represented by a rectangular membership
400
200
Chl-a (mg/m3) 8OO
600
/ ,
,
A M J J A 8 O N DiJ F M A M J J a 1978 1979 ß filtered data .... behavior space
model response space {. polterlorl)
ortho-P (mg/m3) 8OO
600
4OO
2OO
[ i ! ! ! i ! i i i ! i i ! [ ! ! A M J J A $ O N D J F M & M J J & $ O
1978 1979 ß filtered data model response space
.... behavior space
Fig. 3. Model response spaces of (a) chlorophyll a, (b) ortho-P, and (c) total P associated with 175-mg/m 3 noise bounds.

2648 KE• ....... AND VAN STRATEN.' SET MEMBERSHIP APPROACH TO ECOSYSTEM MODELING
0.6
0.4
0.2
0.8
0.6
0.4
0.2
Yk- ek Yk Yk* e k
Fig. 4. (a) Rectangular membership function for parameter p and (b) triangular membership function associated with measure- ment Yk and noise bound ek at instant k.
function. An example of this is presented in Figure 4a for the uncertain parameter p.
However, a more general approach is possible by intro- ducing the concept of fuzzy sets [Zadeh, 1965]. A fuzzy set is represented by a membership function (uy: X--•[0, 1]) that is no longer restricted to a rectangular form. The values
uy(x) give the grade of membership of an element x in the fuzzy set X. In the present application (see also Keesman and van $traten [1987]), a triangular membership function (see Figure 4b) for the uncertain measurement Yk, has been
chosen. This function expresses the diminishing possibility of occurrence of the noise-free measurement away from the actual measurement.
In order to determine the grade of membership of a realization in the parameter space, we have to specify a criterion function in the measurement space. Each realiza- tion of the parameter vector defines a sequence of instanta- neous model outputs which intersect the fuzzy sets of the individual measurements (Figure 5). The criterion function must, therefore, express the overall degree of intersection. According to fuzzy set theory, the min-operator is suitable for defining the degree of intersection [Bellman and Giertz, 1973]. Thus a min-operator membership criterion function is taken, i.e.,
Mrn(P) = min uy(yk; p) (4) l_<k_<N
where p is a parameter vector and uy is the (triangular) membership function according to fuzzy set theory, centered around the measurement y•. In the argument of uy, p is a shorthand notation for the model output at instant k given parameter vector p, i.e., h[x•(p)] (see equations (1) and (2)).
The effect of incorporating fuzzy set theoretic assump- tions in the parameter space identification procedure is twofold. First, additional information about feasible sub- spaces is obtained. Second, it offers a possibility of combin- ing the identification algorithm described before with more efficient search methods for parameter optimization.
The additional information provided by including fuzzy set theoretic concepts in the procedure can be summarized as follows. By assigning triangular or more complex shaped membership functions, in addition to a posterior parameter space consistent with the specified noise bounds (i.e., M m > 0.0), information about subspaces, associated with a speci- fied value of M m larger than zero, is also obtained. This information can be used in subsequent steps in the procedure when smaller noise bounds are imposed. For instance, with triangular membership functions (see Figure 4b), the set of parameter vectors that spans a subspace with a membership value (equation (4)) larger than an arbitrary value M*m leads
Uy
tk
Yk
Fig. 5. Schematic representation of the intersection of triangular membership functions as a function of p.

KEESMAN AND VAN STRATEN: SET MEMBERSHIP APPROACH TO ECOSYSTEM MODELING 2649
to a smaller model response space. This response space then is bounded by a behavior space with noise bounds that are (1-M*,n) times the initial noise bounds. This means that it is not necessary to repeat all calculations if the bounds are squeezed from the large values selected initially, to avoid the problem of empty parameter sets, back to more "realistic" values.
The second aspect of the introduction of fuzzy sets is the ability to use search methods. Within the fuzzy set theoretic context each parameter vector is now associated with a membership value, so that formal optimization can be per- formed by maximizing the intersection of the instantaneous fuzzy measurement sets. The pattern search technique of Hooke and Jeeves [1961] is suitable for this purpose. In our case, the objective is to maximize the membership criterion function Mm(P) (equation (4)), so that the estimator is a maxi-min. We will use the term min-max estimator, well- known in estimation theory, because the estimate can also be interpreted as the estimate that minimizes the maximum distance between measurement and model response, assum- ing triangular membership functions (Figure 4b). Note that in some applications (such as ours), the criterion function Mm(p) of (4) is more complex due to multiple outputs. We choose to weight the output sequences equally by defining a mean value of Mm.
Results
Only the dominant parameters could have been selected for optimization [see Whitehead and Hornberger, t984], but we choose to calibrate all 17 parameters. An initial estimate was taken from the space identified by the Monte Carlo set membership algorithm. Searching was performed within the rotated coordinate system spanned by the principal axes of the feasible subspace. Especially in the presence of strong parameter correlations, which is known as the "ridge" problem in optimization, searching along these axes (i.e., the approximated ridge or valley) is highly etficient [Bekey, 1970]. The resulting min-max estimate can be viewed as the center of f•, [Schweppe, 1973]. The "optimal" min-max estimates for the dominant parameters are Kg m = 0.6; T O = 23.7; K d = 0.07 and 0,t = 1.13. The values ofKg m and K d are rather small (see Table A1).
Let us now examine the advantages of obtaining the min-max estimate in addition to the set of feasible parameter vectors. First, the min-max estimates of the dominant pa- rameters can indicate that the predefined parameter ranges might have been erroneous. This occurs if the optimal (dominant) parameter value is on one of the bounds. For instance, it appeared from min-max estimation that the value of Pchem equaled tOO mg/m 3 , which was the lower bound of this parameter (see Table At). Second, the min-max residual sequence can reveal "hard" information about the discrep- ancy between data and model. The maxima of the residual sequence of chlorophyll a, ortho-P, and total P with respect to the smoothed data series were 102, 105, and 72 mg/m 3, respectively. These results indicate the presence of nonneg- ligible model structure error for chlorophyll a and ortho-P, because the deviation is larger than the assumed measure- ment error of 60 mg/m 3. From this, we must conclude that the model (see the appendix) is not able to describe the global changes in chlorophyll a and ortho-P in all respects. Third, the residual sequence can be correlated to the ob-
served system inputs in order to improve the model. Fourth, by (computational) experimentation on dominant subpro- cesses, insight could be obtained on how to adjust the model's equations to improve its predictive performance.
The actual improvement of the presented eutrophication model is beyond the scope of this study. The results indicate that efforts should preferably be directed to the dominant processes of algal growth and mortality and their tempera- ture functions, as well as to the chemical adsorption/ desorption process.
SET MEMBERSHIP PREDICTION
Preferably, a valid model should be used for prediction. However, in the set membership approach, the use of a partially invalid model can still be tolerated. This is because the error induced by an incorrect model will, at least partially, be reflected in a larger size of the posterior parameter space f•p. This, in turn, will result in wider prediction error bounds. This property of the set member- ship approach is quite attractive because, in practice, there is not always time or money for further model improvement. In addition to the effect of parametric uncertainty, the presence of modeling error must also be incorporated in the predictions. Because the modeling error (see Figure 3a) is expressed as an "output error" (equations (1) and (2)) it can simply be added to the model responses in prediction space.
The results of the prediction (200 -mg/m 3 noise bounds and no explicit modeling error, see Figure 2) for the verifi- cation period from November 1979, when the flushing ex- periment was started, until April 1981 are presented in Figure 6. Despite large uncertainty bounds the predictions deviate considerably from the actual observations. In order to explain this discrepancy, it must be noted that processes dominating the model behavior during the identification period were extrapolated directly via the identified parame- ter space to the period in which environmental changes had taken place by means of the flushing experiment. Under these circumstances, extrapolations are most likely invalid (see Figures 6a-6c) and so additional (speculative) informa- tion about internal changes in the model structure must be incorporated to account for these environmental changes (this kind of prediction is sometimes called "projective forecast" [van Straten, 1986]).
In this case, we may assume that flushing is directly affecting the internal load, i.e., the release of phosphate from the sediment. Investigations have indicated that the equilib- rium phosphate concentration in the sediment after flushing diminishes to approximately 25% of the original concentra- tions [see van Straten, 1986]. When this information is used to modify the value of parameter Pchem (which represents the background P concentration in the sediment), then the predictive power of the model improves significantly, as can be seen from Figure 7. However, the problem remains how to obtain this kind of speculative information in advance.
CONCLUSIONS
Within the context of (fuzzy) set theoretic uncertainty modeling, the identification of a complex environmental system, containing highly nonlinear algal-nutrient interac- tions can be performed in a rather simple and robust way using an algorithm based on Monte Carlo simulation. This

2650 KEESMAN AND VAN STRATEN' SET MEMBERSHIP APPROACH TO ECOSYSTEM MODELING
800
600
Chl-a (mg/m3) Prediction
_
,
i i i [D i i i i i i i I I i O i i AIM did AI$ OIN d FIM AIM did AI$O N[DIj FIM AIM dlj AI$1oIN d FIM A I
400
200
1978 ß observations
1979 1980 198 model response space ..... rain-max trajectory I
total P (g/m3) Prediction
ß
i i i i D i i i i i i i i i i i AIM jIj AI$ OIN J FIM AIMIjIj AI$O N D]J FIM AIM JIj•AI$ OIN D]J FIM A I 1978 1979 1980 1981
ß observations -- model response space
800
600
ortho-P (mg/m3) Prediction
_
! i i i i i i i i i • i i i i i[) i i AIM jIj AI$ OIN D]J FIM AIM jIj AI$O N DIJ FIM AIM jIj AI$ OIN j FIM A I
400
200
b 1978 ß observations 1979 1980 1981
model response space ..... rain-max trajectory
1.2
0.8
total P (g/m3) Prediction
_
,•....1%. ß ,.. i i i i i • ! i i i i i i i i i i
AIM jIj AI$ OIN DIJ FlU AIM jIj AI$O N DIJ Flu AIM'jIj AIS OIN DIJ FlU A I
0.6
0.4
0.2
1978 C ' observations
1979 1980 _ 1981 -- model response space .... rain-max trajectory
Fig. 6. Model predictions of (a) chlorophyll a, (b) ortho-P, and (c) total P on the basis of the posterior parameter space (period: April 1978 to April 1981).
Fig. 7. Model projection of total P on the basis of the posterior parameter space and speculative information about changes in model structure (period: April 1978 to April 1981).
algal growth, temperature limitation parameter, algal death, and associated temperature parameter). In spite of partial model invalidity indicated by the presence of nonnegligible model structure error, predictions can still be made, but it is demonstrated that this will lead to large prediction uncer- tainties.
APPENDIX
The eutrophication model is represented in the following state space form according to (1) and (2). The P cycle state equations are as follows:
•l = KamfrflfNA -- KdTA -- (Q/V)A
J•) = KdTA -- KmD - KsD + LD/V- (Q/V)D
P= -Kamfrf•f•vA + Kind + Lint + L•,/V- (Q/V)P
T -> Tc
• exp 1 - T < Tc fr=rc-ro rc-ro eA
J• = •-• {[1 - exp (-I/exp (eH))]exp (ell) - 1 + exp (-I)} where
e = eo + fiA I = Im/Ior
unconventional way of uncertainty modeling assumes that the different uncertainties can be expressed in terms of bounds. In this application, large noise bounds had to be specified in order to obtain parameter vectors consistent with the presumed model structure and the predefined pa- rameter ranges. Large noise bounds indicate the presence of model structure error, which is further confirmed from a formal rain-max estimation minimizing the maximum dis- tance between measurement and model response. Analysis of the posterior parameter space tip, wherein the the min- max estimate can be viewed as the center, showed that only four of the 17 model parameters are dominant (maximum
I m = 2R/A Ior = io exp (ilT)
P
Pk+P
T- 20 Kdr = KdO d
Ld-- (1 - 7)L
Lp = 7L
Kex
Lint = -•- (Peq -- P)

KEESMAN AND VAN STRATEN.' SET MEMBERSHIP APPROACH TO ECOSYSTEM MODELING 2651
TABLE AI. A Priori Parameter Information
Parameter Definition Range
•m
io
Pk Kd Od Km Ks
K1 Or
Pchem
maximum algal growth rate critical temperature for algal growth optimum temperature for algal growth extinction coefiScient of the water
self-shading coefiScient basic optimal light intensity for algae optimal light intensity temperature
coefiScient Monod coefi%ient
mortality rate of algae mortality rate temperature coefi%ient mineralization rate of detritus sedimentation rate of detritus fraction ortho-P load of total P load
exchange transport coefiScient exchange rate temperature coefi%ient thickness of active sediment layer background P concentration in sediment
0.5-2 1/d 28-35øC 18-25øC
1-1.5 1/m
0.015-0.025 m2/mg P 35-50 W/m 2 0.035-0.045 1/øC
5-10 mg/m 3 0.05-0.30 1/d 1.02-1.20
0.1-1.00 1/d 0.01-0.50 1/d 0.4-0.6 100-300 1/d 1.05-1.20
1E-4-1E-3 m
100-300 mg/m 3
Here, IE-4 denotes 1 x 10 -4.
Kex = tx(K1Deff)1/2
Peq = Pchem + R/K1
R = KsDOr T- 2øH/•5 State variables
A algae P; D detritus P; P ortho-P.
Input functions and constants
T temperature; R radiation; A day length; Q outflow; v volume; H depth; L external load of P;
L D detritus fraction of P load; Le dissolved inorganic fraction of P load;
Lint internal load of P; /x porosity;
Def t effective diffusion coefficient of P. Growth-limiting functions
fT temperature limiting function; J• light limiting function;
f•v nutrient limiting function.
The parameters are given in Table A1. The measurement equations are given as
ortho-P / = 0 total P / 1
Acknowledgments. We are grateful to M. B. Beck for his detailed comments on a first version of the paper. This research is supported by the Netherlands Technology Foundation (STW).
REFERENCES
Bard, Y., Nonlinear Parameter Estimation, chap. 7, Academic, San Diego, Calif., 1974.
Beck, M. B., Hard or soft environmental systems?, Ecol. Modell., 11,233-251, 1981.
Beck, M. B., and P. C. Young, Systematic identification of DO- BOD model structure, J. Environ. Eng. Div. Am. $oc. Civ. Eng., 102(EE5), 909-927, 1976.
Bekey, G. A., System identification--An introduction and a survey, Simulation, 151-166, 1970.
Bellman, R., and M. Giertz, On the analytic formalism of the theory of fuzzy sets, Inf. $ci. N.Y., 5, 149-156, 1973.
Brinkman, A. G., and W. van Raaphorst, De fosfaathuishouding in het Veluwemeer (English summary), Ph.D. thesis, Dep. of Chem. Eng., Univ. of Twente, Enschede, The Netherlands, 1986.
Fedra, K., G. van Straten, and M. B. Beck, Uncertainty and arbitrariness in ecosystems modelling: A lake modelling example, Ecol. Modell., 13, 87-110, 1981.
Hooke, R., and T. A. Jeeves, "Direct search" solution of numerical and statistical problems, J. Assoc. Comput. Mach., 8, 212-229, 1961.
J0rgensen, S. E., An eutrophication model for a lake, Ecol. Modell., 2, 147-165, 1976.
Keesman, K. J., A set-membership approach to the identification and prediction of ill-defined systems: Application to a water quality system, Ph.D. thesis, Univ. of Twente, Enschede, The Netherlands, 1989a.
Keesman, K. J., On the dominance of parameters in structural models of ill-defined systems. Appl. Math Comput., 30, 133-147, 1989b.
Keesman, K. J., Membership-set estimation using random scanning and principal component analysis, Math Comput. $imul., in press, 1990.
Keesman, K. J., and G. van Straten, Modified set-theoretic identi- fication of ill-defined water quality system from poor data, in Proceedings of IAWPRC Symposium on Systems Analysis in Water Quality Management, pp. 297-308, Pergamon, New York, 1987.
Keesman, K. J., and G. van Straten, Embedding of random scan- ning and principal component analysis in set-theoretic approach to parameter estimation, paper presented at 12th, International Association for Mathematics and Computers in Simulation (IMACS) World Congress on Scientific Computation, Paris, 1988.
Keesman, K. J., and G. van Straten, Identification and prediction propagation of uncertainty in models with bounded noise, Int. J. Control, 49(6), 2259-2269, 1989.

2652 KEESMAN AND VAN STRATEN.' SET MEMBERSHIP APPROACH TO ECOSYSTEM MODELING
Likens, G. E. (Ed.), Nutrients and Eutrophication: The Limiting Nutrient Controversy, 328 pp., American Society of Limnology and Oceanography, Lawrence, Kans., 1972.
Park, R. A., et al., A generalized model for simulating lake ecosys- tems, Simulation, 23(2), 33-50, 1974.
Schweppe, F. C., Uncertain Dynamic Systems, Prentice-Hall, 563 pp., Englewood Cliffs, N.J., 1973.
Somly6dy, L., and G. van Straten, Modeling and Managing Shal- low Lake Eutrophication: With Application to Lake Balaton, 386 pp., Springer-Verlag, New York, 1986.
Spear, R. C., and G. M. Hornberger, Eutrophication in Peel Inlet, II, Identification of critical uncertainties via generalized sensitiv- ity analysis, Water Res., 14, 43-49, 1980.
van Straten, G., Analysis of model and parameter uncertainty in simple phytoplankton models for Lake Balaton, paper presented at 2nd ISEM Conference on the State-of-the-Art in Ecological Modelling, Li6ge, Belgium, 1981.
van Straten, G., Identification, uncertainty assessment and predic-
tion in lake eutrophication, Ph.D. thesis, Univ. of Twente, Enschede, The Netherlands, 1986.
van Straten, G., and K. J. Keesman, Uncertainty propagation and speculation in projective forecasts of environmental change--A lake eutrophication example, J. Forecasting, in press, 1990.
Whitehead, P. G., and G. M. Hornberger, Modeling algal behavior in the river Thames, Water Res., 18, 945-953, 1984.
Zadeh, L. A., Fuzzy sets, Inf. Control, 8, 338-353, 1965.
K. J. Keesman and G. van Straten, Department of Chemical Engineering, University of Twente, P.O. Box 217, 7500 AE Ens- chede, The Netherlands.
(Received September 8, 1988' revised December 21, 1989'
accepted March 1, 1990.)