Sets within sets: The influence of set membership on numerical estimates.
13
Journal of Experimental Psychology: Human Perception and Performance Sets Within Sets: The Influence of Set Membership on Numerical Estimates Sara Cordes, Alison Goldstein, and Elizabeth Heller Online First Publication, August 26, 2013. doi: 10.1037/a0034131 CITATION Cordes, S., Goldstein, A., & Heller, E. (2013, August 26). Sets Within Sets: The Influence of Set Membership on Numerical Estimates. Journal of Experimental Psychology: Human Perception and Performance. Advance online publication. doi: 10.1037/a0034131
Transcript of Sets within sets: The influence of set membership on numerical estimates.

Journal of Experimental Psychology: HumanPerception and Performance
Sets Within Sets: The Influence of Set Membership onNumerical EstimatesSara Cordes, Alison Goldstein, and Elizabeth HellerOnline First Publication, August 26, 2013. doi: 10.1037/a0034131
CITATIONCordes, S., Goldstein, A., & Heller, E. (2013, August 26). Sets Within Sets: The Influence ofSet Membership on Numerical Estimates. Journal of Experimental Psychology: HumanPerception and Performance. Advance online publication. doi: 10.1037/a0034131

Sets Within Sets: The Influence of Set Membership onNumerical Estimates
Sara Cordes, Alison Goldstein, and Elizabeth HellerBoston College
Navigating the world requires attention to number; however, sets in real-world contexts are rarelyhomogeneous or presented in isolation, thus the task of determining what constitutes a relevant set forenumeration can be a difficult one. This contextual ambiguity increases the likelihood that irrelevant setsmay bias our ability to accurately track number. In the current study, we investigated whether numericalestimates are influenced by irrelevant set information, such as the size of other present subsets or thenumber of subsets composing the set. Adult observers were shown brief arrays of dots containing 1 or2 intermixed subsets, differentiated by color, and were asked to estimate the number of either: (1) 1 ofthe subsets or (2) the superset (total number of dots). When estimating the size of a subset, numericalestimates were greatly influenced by the size of the other, irrelevant subset, suggesting that the presenceof extraneous sets may hinder accurate number judgments. Furthermore, when asked to judge the totalnumber of items (the superset), observers judged supersets comprising 2 subsets as more numerouscompared to those comprising only a single subset. Importantly, both trends were apparent even whenobservers had prior information about the identity of the target set, suggesting adults preattentively parsethe world into sets, causing numerical biases that are not under conscious control. Potential explanationsfor this pattern of results, including simultaneous numerical contrast effects and superset summation, arediscussed.
Keywords: numerical estimation, set membership, numerical perception, subset, superset, enumeration
The ability to keep track of number has been shown to be criticalfor basic functioning (e.g., decision-making, foraging; Gallistel,1990; Gallistel, Gelman, & Cordes, 2006) as well as mathematicaldevelopment (e.g., Geary, 2013; Halberda, Mazzocco, & Feigen-son, 2008; Siegler & Booth, 2004). However, the task of knowingwhat constitutes a relevant set for enumeration is rarely simple.Stepping outside, you can count the number of people on the streetor the number of trees you pass, among other things. Likewise, youcan count the number of living things you encounter. Despite thevariety and hierarchical nature of sets one may encounter in thereal world (e.g., trees and people are subsets of the superset, livingthings), numerical estimation research has almost exclusively fo-cused on observer’s abilities to estimate the size of a singlehomogeneous set presented in isolation. We know nothing, how-ever, of how the presence of multiple sets may affect our abilitiesto make accurate numerical estimations. Does the size of irrelevantsets influence numerical judgments of a target set such that, forexample, the number of boys in a classroom affects estimates ofthe number of girls (and vice versa)? In that same vein, does the
makeup of the superset play a role in set size estimation such that,for example, coed and single-sex classes are perceived as differentin size simply because of their make-up?
In theory, the presence of other irrelevant sets and/or themake-up of the set in question should not play a role in numericaljudgments—number is an abstract quantity, independent of setattributes (Cantlon, Cordes, Libertus, & Brannon, 2009; Cordes,Williams, & Meck, 2007; Jordan & Brannon, 2006). But in prac-tice, our perception of number may behave otherwise. Evidencereveals perceptual, affective, and social factors regularly bias ourperception of number (e.g., Baker, Rodzon, & Jordan, in press;Durgin, 1995, 2008; Redden & Hoch, 2009; Young & Cordes,2013a, 2013b). For example, adults estimate highly dense arrays(i.e., with small inter-item distances) as being more numerous(Durgin, 1995, 2008; but see Allik & Tuulmets, 1991), and bothchildren and adults perceive homogeneous arrays (e.g., all redcircles) as being more numerous than heterogeneous arrays (e.g., amix of red circles, blue squares, green triangles, etc.; Posid, Hu-guenel, & Cordes, 2013; Redden & Hoch, 2009). Further, theidentity of the items to be enumerated also matters; adults reportseeing fewer items when arrays are composed of threateningstimuli (spiders) compared to neutral items (flowers; Young &Cordes, 2013b). While the underlying mechanisms driving thesenumerical biases necessarily differ, these findings do suggest that,at least in some cases, perceptual information may be processedprior to enumeration, leading to subconscious influences on oursubsequent perception of number. The current study investigates:Does set information operate at this preattentive level, leading tosystematic numerical estimation biases?
Sara Cordes, Alison Goldstein, and Elizabeth Heller, Department ofPsychology, Boston College.
Funding was provided by an Alfred P. Sloan Foundation fellowship toSara Cordes.
Correspondence concerning this article should be addressed to SaraCordes, Boston College, Department of Psychology, 300 McGuinn Hall,140 Commonwealth Avenue, Chestnut Hill, MA 02467. E-mail:[email protected]
Thi
sdo
cum
ent
isco
pyri
ghte
dby
the
Am
eric
anPs
ycho
logi
cal
Ass
ocia
tion
oron
eof
itsal
lied
publ
ishe
rs.
Thi
sar
ticle
isin
tend
edso
lely
for
the
pers
onal
use
ofth
ein
divi
dual
user
and
isno
tto
bedi
ssem
inat
edbr
oadl
y.
Journal of Experimental Psychology:Human Perception and Performance
© 2013 American Psychological Association
2013, Vol. 39, No. 5, 0000096-1523/13/$12.00 DOI: 10.1037/a0034131
1

Work by Halberda, Sires, and Feigenson (2006) suggests setmembership is likely processed prior to enumeration. In their task,adult observers were presented with arrays of dots composed of1–6 colors and asked either to estimate the total number of dots inthe display (the superset) or the size of one of the subsets (e.g.,only the red dots). On some trials (probe-before trials), observersknew which set to enumerate prior to seeing the display, and onother trials (probe-after trials), observers did not learn this infor-mation until after the display disappeared. Results revealed thatwhen judging the size of an individual subset, error rates in theprobe-before and probe-after trials did not differ when arrayscontained one or two subsets for the majority of observers, sug-gesting observers were able to simultaneously enumerate bothsubsets and the superset. Once the display contained more thantwo subsets, however, the adults’ abilities to enumerate individualsubsets deteriorated in the probe-after trials, as they were unable totrack set size information for more than two subsets simultane-ously. In contrast, when estimating the size of the superset, thenumber of subsets presented did not matter; estimates in theprobe-before and probe-after conditions were similar regardless ofthe number of colors in the display. The authors suggested thattogether their results reveal adults are limited to being able to trackthe numerosity of a total of three sets in parallel1—that is, twoindependent subsets and the superset containing those sets (al-though there was some variability in this limit across observers).Further, the similar error rates observed across the probe-after andprobe-before conditions led Halberda et al. to posit “the notion ofa set may operate prior to enumeration” (p. 576). If true, then setinformation may lead to observable and predictable biases innumerical estimation data.
In the current study, adult observers were presented arrays ofdots composed of either a single set or two intermixed sets (setsdefined by color). Similar to Halberda et al. (2006), observers wereasked across trials to estimate the number of dots belonging eitherto a particular subset (e.g., number of red dots) or to the superset(e.g., total number of dots, regardless of color). To explore the roleof attention, on some trials participants were informed beforehandwhich set to attend to (probe-before trials) and on other trials, theidentity of the target set was only available after the displaypresentation (probe-after trials). Importantly, we were interested inthe influence of two specific types of irrelevant set information: (1)Subset Effects: When enumerating a subset, does the size of othersubsets impact judgments (e.g., does the number of blue dotsinfluence estimates of the number of red dots), and if so, how?And, (2) Superset Effects: When enumerating a superset, how doesthe composition of the set affect numeric estimates (e.g., aresupersets composed of two subsets perceived as more or lessnumerous than those composed of a single subset)?
Subset Effect Hypotheses
Objectively, the size of one set is completely independent of thesize of another. However, it is possible that, subjectively, these twovariables interact. If sets are attended to automatically and prior toenumeration, then it is reasonable to assume that information aboutother nearby sets may impact our perception of number. Given thatadults can store the size of two subsets simultaneously (Halberdaet al., 2006), then one possibility is that estimates of the size of onesubset may positively correlate with size of other present, yet
irrelevant, subsets. Similar positive correlations between subjec-tive estimates of quantity have been observed in the interval timingliterature, such that when more than one duration is stored inmemory, estimates are inadvertently combined in memory (“mem-ory mixing”) resulting in a temporal distortions (Penney, Allan,Meck, & Gibbon, 1998). While memory mixing has not beendocumented in the domain of number, work has shown a slightpositive correlation between an individual’s tendency to under- oroverestimate the numerical size of two independent sequential sets(Cordes, Gallistel, Gelman, & Latham, 2007). Thus, it is notunlikely that memory mixing may cause estimates of the size ofone subset to be skewed in the direction of the size of anothersubset, such that observers may perceive more red dots when thereare many blue dots, and perceive fewer red dots when there are notas many blue dots.
Alternatively, evidence of simultaneous contrast effects in sub-jective magnitude estimates suggests that the presence of largersubsets may lead to smaller subset estimates. Contrast effects,demonstrated for many non-numerical quantities (e.g., weights,durations, loudness; Preston, 1936; Melamed & Thurlow, 1971;Mo, 1971), result in the underestimation (or overestimation) of astimulus magnitude as a result of exposure to a greater (or lesser)magnitude in the same dimension (e.g., a weight is perceived aslighter when held at the same time as another very heavy weight).Although contrast effects have yet to be documented in the domainof number, there is no reason to assume numerical contrast effectsare any less likely or prevalent than other magnitude contrasteffects. If so, then in contrast to predictions of memory mixing, asimultaneous numerical contrast should result in a negative corre-lation between subset estimates (e.g., estimates of the number ofred dots should be lower as the number of blue dots increases). Thecurrent study provides a direct test of these opposing Subset Effecthypotheses.
Superset Effect Hypotheses
Is there any reason to suspect that the make-up of the supersetaffects numerical estimates? Perhaps there is. As mentioned ear-lier, evidence suggests that set membership appears to be animportant attribute adults attend to even prior to basic enumeration(Halberda et al., 2006). Thus, when set membership is made salient(such as when color identifies subsets), adults may be unable tofocus on the superset without first preattentively parsing the setinto its component subsets. This preattentive parsing may lead tothe employment of alternative strategies for enumeration, such asa “group and add” process (e.g., Trick & Pylyshyn, 1994), inwhich subsets are enumerated individually and added together toform a superset size estimate. Studies of approximate numericalarithmetic indicate that both infants and adults overestimate sums(“operational momentum”; Knops, Viarouge, & Dehaene, 2009;McCrink, Dehaene, & Dehaene-Lambertz, 2007; McCrink &Wynn, 2009). If so, then this implicit summing should result inhigher set size estimates for supersets comprising two subsetscompared to those comprising a single subset.
1 Recent work by Levinthal and Franconeri (2011), however, suggeststhat this tracking may not be a parallel process—such that each set isinstead enumerated in sequence.
Thi
sdo
cum
ent
isco
pyri
ghte
dby
the
Am
eric
anPs
ycho
logi
cal
Ass
ocia
tion
oron
eof
itsal
lied
publ
ishe
rs.
Thi
sar
ticle
isin
tend
edso
lely
for
the
pers
onal
use
ofth
ein
divi
dual
user
and
isno
tto
bedi
ssem
inat
edbr
oadl
y.
2 CORDES, GOLDSTEIN, AND HELLER

On the other hand, subset composition may affect supersetestimates, but not because set membership is preattentively pro-cessed, but because in order to delineate multiple subsets, super-sets must be perceptually heterogeneous (i.e., composed of dots oftwo colors, e.g., red and blue dots, as opposed to only a singlecolor for a single subset, e.g., all red dots). Both children andadults perceive perceptually heterogeneous sets as being less nu-merous than homogeneous ones (possibly due to facilitated itemindividuation; Posid et al., 2013; Redden & Hoch, 2009). Thus, ifperceptual variability, as opposed to set membership, is the criticalfactor, then supersets composed of multiple subsets may be per-ceived as being less numerous than those composed of a singlesubset.
In five experiments, we perform the first evaluation of theeffects of irrelevant sets and/or set information on adults’ numer-ical estimates. In our first experiment, we provide the first evi-dence that (1) the presence of other subsets impact estimates of asingle subset (Subset Effect) and (2) that set composition of asuperset affects superset size estimates (Superset Effect). In furtherexperiments, we explore the mechanisms responsible for theseeffects. Together, results provide robust evidence to suggest thatour subjective perceptions of number are inherently biased byirrelevant set information.
Experiment 1: Subset and Superset Effect
In Experiment 1, we provide the first test of the Subset andSuperset Effects. In this study (modeled after Halberda et al.,2006), adult observers were presented with arrays of dots com-posed of a single subset (all the same color) or of two subsets (eachdot was either e.g., red or blue). On some trials, observers wereasked to estimate the number of dots contained within a singlesubset (e.g., the number of red dots) and on other trials, they wereasked to estimate the size of the superset (i.e., the total number ofdots on the screen, regardless of their color). As in Halberda et al.(2006), on 50% of trials, observers were told beforehand which setthey would be asked to enumerate (Probe-Before trials); on theother 50% of trials, they were not told until after the display haddisappeared (Probe-After trials).
Method
Participants. Thirty undergraduate students participated inthis a single 1-hr session (M � 19.9 years, range 18–22 years; 19females) for course credit.2
Procedure. The experiment was run in a quiet room in thelaboratory. Participants sat approximately 41.5 cm from a 22”computer screen (resolution 1440 � 900) and indicated theirresponses on a keyboard. Each participant wore JVC noise can-celling headphones (HA-NC80).
Participants were instructed not to attempt to count. Each Probe-After trial began with the participant viewing a fixation cross (20pts in diameter) on a black background (500 ms), followed by avisual mask (500 ms), the stimulus display (500 ms), and anothervisual mask (500 ms—see Figure 1). Stimuli consisted of a dotarray of either a single color (e.g., all red dots), or of two inter-leaved dot arrays (e.g., some red and some blue).
After the second visual mask, participants were prompted with“How many [target set] dots were there?” in the center of the
screen. On subset trials, the target set referred to the color of oneof the subset arrays from the stimulus display (e.g., “How manyred dots were there?”). On superset trials, the target set included alldots on the screen (i.e., “How many total dots were there?”). Thequestion stayed on the screen until the participants typed in aresponse and selected “next” to proceed to the next trial. If theparticipant missed seeing the array presentation, they were in-structed to type “xxx.” These trials were excluded from analyses.
Probe-Before trials (50% of trials) were identical to Probe-Aftertrials except the identity of the target set was displayed during theinitial fixation cross presentation at the beginning of the trial. Thisled to four trial types (Probe-Before Superset, Probe-After Super-set, Probe-Before Subset, and Probe-After Subset), randomly in-termixed throughout the session. Subjects participated in fourpractice trials followed by a total of 252 trials (144 subset and 108superset trials).
Stimuli. All displays were arranged on a black background.Stimulus array colors were randomly chosen from the following:red, yellow, blue, brown, purple, green, orange, and white, with theexception that certain color combinations (orange and red; orangeand brown; orange and yellow; yellow and green) were not pre-sented together to ensure the two subsets were maximally discern-ible. Each color was equally likely to be chosen for the Targetarray as it was to be chosen for the Distractor array, and all colorshad an equal probability of being chosen on any trial.
All dots were 60 pixels in diameter, approximately 2.1 degreesin visual angle. The computer program generated dot arrays oneach trial by randomly placing dots within an invisible 13 � 8 gridcentered on the screen (each box on the grid was 100 � 100 pixel2
(3.65 � 3.65 degrees) taking up a majority of the 1440 � 900screen). To maximize the appearance of randomness, columns inadjacent rows were offset slightly by adding random jitter to thehorizontal placement of the columns in each row and the locationof the 60-pixel diameter dot within the 100 � 100 pixel2 box onthe grid was also randomly determined. Following the array pre-sentation, the visual mask consisted of a single array of multicol-ored overlapping dots of varying sizes. The same visual mask wasused on all trials.
Subset trials. The number of dots in the target subset arraywas chosen from one of six logarithmically spaced set sizes (12,15, 18, 22, 28, or 34). The size of the other subset (the nontargetarray or “distractor” array) was randomly chosen from one of fourset sizes: (1) 0 (No Distractor trials), (2) 50% fewer than targetsubset (Small Distractor trials), (3) Same number as target (EqualDistractor trials), or (4) 50% larger than target subset (LargeDistractor trials). This led to a total of 6 (target size) � 4 (distrac-tor size) � 2 (probe order) types of Subset trials, each presentedthree times each for a total of 144 subset trials.
Superset trials. The number of dots on Superset trials waschosen from one of six logarithmically spaced set sizes (24, 32, 42,54, 72, or 94 dots). There were three types of Superset trials, basedupon the division of the superset, in which participants saw either:(1) a single array of the same color (100/0 trials), (2) two subsetsof equal size (50/50 trials), or (3) two subsets of unequal size, withthe superset divided up as 75%/25% between the two subsets
2 Two additional subjects were excluded due to computer error.
Thi
sdo
cum
ent
isco
pyri
ghte
dby
the
Am
eric
anPs
ycho
logi
cal
Ass
ocia
tion
oron
eof
itsal
lied
publ
ishe
rs.
Thi
sar
ticle
isin
tend
edso
lely
for
the
pers
onal
use
ofth
ein
divi
dual
user
and
isno
tto
bedi
ssem
inat
edbr
oadl
y.
3SET MEMBERSHIP AND NUMERICAL ESTIMATES

(75/25 trials; e.g., 8 red dots and 24 yellow dots).3 Each of the 6(set size) � 3 (division) trials � 2 (probe order) trials waspresented three times each for a total of 108 Superset trials.
Data analyses. Across all experiments reported in this paper,responses greater than three standard deviations from the mean,“xxx” responses, and inordinately small response (five or fewer forSuperset trials; three or fewer for Subset trials4) were excludedfrom analyses (�2%). Subset and Superset trials were analyzedindependently.
Results5
Subset trials. Mean estimates from Subset trials were sub-jected to a 6 (target set size) � 4 (distractor size) � 2 (probe order)repeated measures ANOVA and follow-up LSD post hoc tests. Notsurprisingly, a significant effect of target, F(2.4, 70.2) � 308.9,
p � .00 revealed mean estimates increased with the size of thetarget subset, indicating that subjects were engaged in the numer-ical estimation task. Interestingly, a significant main effect ofdistractor size was found, F(3, 87) � 41.0, p � .00, such that targetsize estimates were highest when it was the only set presented (NoDistractor trials, M � 18.03, SE � .40), and decreased systemat-ically as the distractor set size increased (Small Distractor M �
3 The two different divisions were included so as to ensure subjects didnot invoke strategies such as attending to only a single subset and doublingtheir estimate, and so forth.
4 We used different allowable minimum responses for Subset comparedto Superset trials based on the minimum set sizes presented in each of thesetypes of trials.
5 For all data analyses reported, when assumptions of sphericity wereviolated, Greenhouse-Geisser adjustments are reported.
Figure 1. (A) Depiction of events in a Probe-Before Subset trial. In Probe-After trials, the initial screen wasleft blank. (B) Example arrays from Experiment 3 (target set size 18), in which the size of the background waschanged in order to keep dot density constant across the Large Distractor (left, target � orange dots), SmallDistractor (middle, target � purple dots), and No Distractor (right, target � green dots) arrays. (C) Example ofa spatially separated array from Experiment 5.
Thi
sdo
cum
ent
isco
pyri
ghte
dby
the
Am
eric
anPs
ycho
logi
cal
Ass
ocia
tion
oron
eof
itsal
lied
publ
ishe
rs.
Thi
sar
ticle
isin
tend
edso
lely
for
the
pers
onal
use
ofth
ein
divi
dual
user
and
isno
tto
bedi
ssem
inat
edbr
oadl
y.
4 CORDES, GOLDSTEIN, AND HELLER

16.59, SE � .46; Equal Distractor M � 15.86, SE � .37; LargeDistractor M � 14.81, SE � .35; all differences p � .02). Fur-thermore, a target � distractor size interaction, F(6.7, 193.4) �6.4, p � .001 revealed that as target set sizes increased, so did themagnitude of this distractor effect (see Figure 2). No other signif-icant effects or interactions were obtained (p � .05). Importantly,probe order did not interact with distractor (p � .25), indicatingthat the size of the distractor set had the same effect regardless ofwhether the participants knew which set to attend to beforehand(Probe Before: No Distractor M � 17.7, SE � .41; Small Distrac-tor M � 16.4, SE � .41; Equal Distractor M � 15.8, SE � .33;Large Distractor M � 14.4, SE � .33; Probe After: No DistractorM � 18.2, SE � .43; Small Distractor M � 16.4, SE � .43; EqualDistractor M � 15.9, SE � .51; Large Distractor M � 15.0, SE �.49; see Figure 3).
Superset trials. Superset trial mean responses were subjectedto a 6 (superset size) � 3 (division) � 2 (probe order) repeatedmeasures ANOVA and follow-up t tests. A significant supersetsize effect, F(1.2, 36.0) � 175.7, p � .001 revealed mean esti-mates increased as a function of set size as expected. Additionally,a main effect of division, F(1.6, 46.9) � 7.2, p � .01 indicatedestimates of supersets comprised of a single subset (100/0 trials;M � 35.5; SE � 1.1) were significantly lower than those of twosubsets (50/50 trials: M � 36.8, SE � 1.2 t(29) � 2.8, p � .01;75/25 trials: M � 36.9, SE � 1.3, t(29) � 3.0, p � .01; Figure 4).There was no difference in estimates between the 50/50 and 75/25division trials, t(29) � .12, p � .9. Lastly, a superset size �division interaction, F(6.5, 188.7) � 2.11, p � .049 indicated thatthese numerical biases decreased as a function of the size of thesuperset. No other significant main effects or interactions werefound. Again, the probe order � division interaction was notsignificant (p � .4), revealing that prior knowledge that partici-pants should attend to the superset and ignore the subsets did notdiminish the impact of set composition on estimates (Probe Be-fore: 100/0 M � 35.6, SE � 1.2; 50/50 M � 36.7, SE � 1.3; 75/25M � 37.1, SE � 1.3; Probe After: 100/0 M � 35.3, SE � 1.1;
10
12
14
16
18
20
22
24
26
28
10 15 20 25 30 35
Mea
n E
stim
ate
Subset Size
No Distractor
Small Distractor
Equal Distractor
Large Distractor
Figure 2. Mean estimates of subset sizes as a function of both set size andthe size of the distractor subset from Experiment 1. Error bars depictstandard errors.
Figure 3. The ratio of mean subset size estimates to the actual size of thesubset as a function of the size of the Distractor set for Experiments 1, 2,3, and 5. Although none of the experiments revealed a Distractor size �Probe-Order interaction, graphs depict data from the Probe-Beforeand Probe-After trials separately for Experiments 1–3 to illustrate thesimilar patterns were obtained in both condition. The bottom graph (Ex-periment 5) presents the data from the spatially intermixed and separatedtrials separately (all trials are Probe-After). Asterisks indicate a significantSubset Effect and error bars depict standard errors.
Thi
sdo
cum
ent
isco
pyri
ghte
dby
the
Am
eric
anPs
ycho
logi
cal
Ass
ocia
tion
oron
eof
itsal
lied
publ
ishe
rs.
Thi
sar
ticle
isin
tend
edso
lely
for
the
pers
onal
use
ofth
ein
divi
dual
user
and
isno
tto
bedi
ssem
inat
edbr
oadl
y.
5SET MEMBERSHIP AND NUMERICAL ESTIMATES
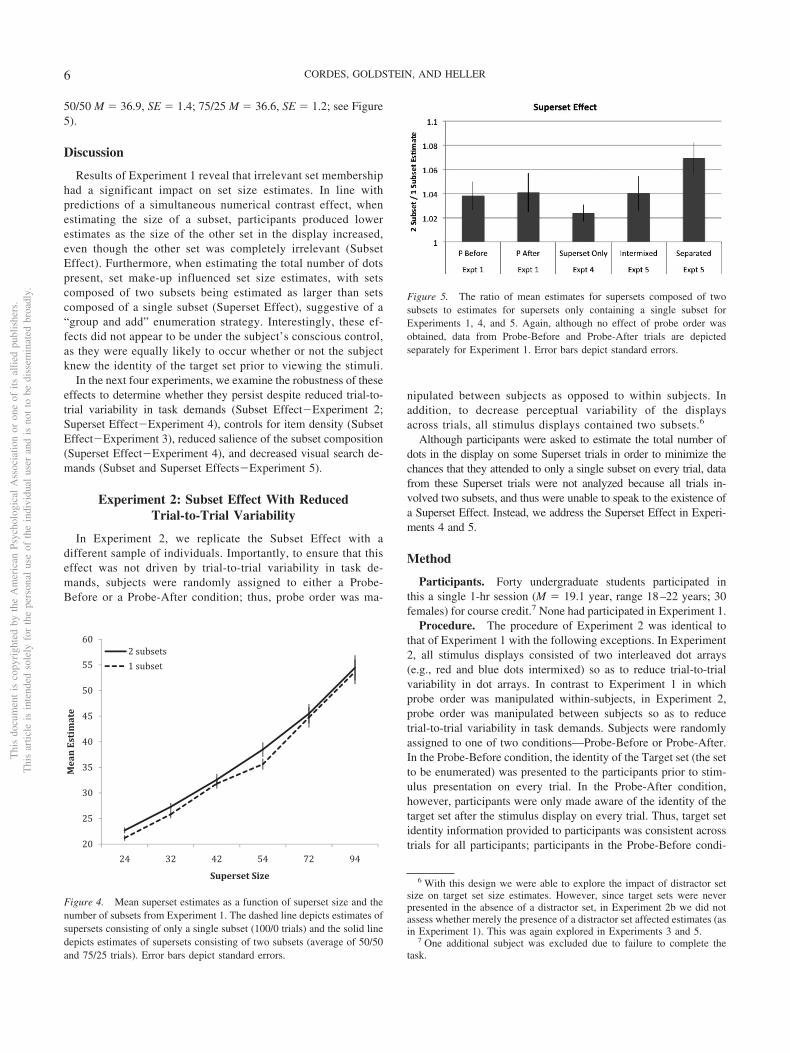
50/50 M � 36.9, SE � 1.4; 75/25 M � 36.6, SE � 1.2; see Figure5).
Discussion
Results of Experiment 1 reveal that irrelevant set membershiphad a significant impact on set size estimates. In line withpredictions of a simultaneous numerical contrast effect, whenestimating the size of a subset, participants produced lowerestimates as the size of the other set in the display increased,even though the other set was completely irrelevant (SubsetEffect). Furthermore, when estimating the total number of dotspresent, set make-up influenced set size estimates, with setscomposed of two subsets being estimated as larger than setscomposed of a single subset (Superset Effect), suggestive of a“group and add” enumeration strategy. Interestingly, these ef-fects did not appear to be under the subject’s conscious control,as they were equally likely to occur whether or not the subjectknew the identity of the target set prior to viewing the stimuli.
In the next four experiments, we examine the robustness of theseeffects to determine whether they persist despite reduced trial-to-trial variability in task demands (Subset Effect�Experiment 2;Superset Effect�Experiment 4), controls for item density (SubsetEffect�Experiment 3), reduced salience of the subset composition(Superset Effect�Experiment 4), and decreased visual search de-mands (Subset and Superset Effects�Experiment 5).
Experiment 2: Subset Effect With ReducedTrial-to-Trial Variability
In Experiment 2, we replicate the Subset Effect with adifferent sample of individuals. Importantly, to ensure that thiseffect was not driven by trial-to-trial variability in task de-mands, subjects were randomly assigned to either a Probe-Before or a Probe-After condition; thus, probe order was ma-
nipulated between subjects as opposed to within subjects. Inaddition, to decrease perceptual variability of the displaysacross trials, all stimulus displays contained two subsets.6
Although participants were asked to estimate the total number ofdots in the display on some Superset trials in order to minimize thechances that they attended to only a single subset on every trial, datafrom these Superset trials were not analyzed because all trials in-volved two subsets, and thus were unable to speak to the existence ofa Superset Effect. Instead, we address the Superset Effect in Experi-ments 4 and 5.
Method
Participants. Forty undergraduate students participated inthis a single 1-hr session (M � 19.1 year, range 18–22 years; 30females) for course credit.7 None had participated in Experiment 1.
Procedure. The procedure of Experiment 2 was identical tothat of Experiment 1 with the following exceptions. In Experiment2, all stimulus displays consisted of two interleaved dot arrays(e.g., red and blue dots intermixed) so as to reduce trial-to-trialvariability in dot arrays. In contrast to Experiment 1 in whichprobe order was manipulated within-subjects, in Experiment 2,probe order was manipulated between subjects so as to reducetrial-to-trial variability in task demands. Subjects were randomlyassigned to one of two conditions—Probe-Before or Probe-After.In the Probe-Before condition, the identity of the Target set (the setto be enumerated) was presented to the participants prior to stim-ulus presentation on every trial. In the Probe-After condition,however, participants were only made aware of the identity of thetarget set after the stimulus display on every trial. Thus, target setidentity information provided to participants was consistent acrosstrials for all participants; participants in the Probe-Before condi-
6 With this design we were able to explore the impact of distractor setsize on target set size estimates. However, since target sets were neverpresented in the absence of a distractor set, in Experiment 2b we did notassess whether merely the presence of a distractor set affected estimates (asin Experiment 1). This was again explored in Experiments 3 and 5.
7 One additional subject was excluded due to failure to complete thetask.
20
25
30
35
40
45
50
55
60
24 32 42 54 72 94
Mea
n E
stim
ate
Superset Size
2 subsets
1 subset
Figure 4. Mean superset estimates as a function of superset size and thenumber of subsets from Experiment 1. The dashed line depicts estimates ofsupersets consisting of only a single subset (100/0 trials) and the solid linedepicts estimates of supersets consisting of two subsets (average of 50/50and 75/25 trials). Error bars depict standard errors.
Figure 5. The ratio of mean estimates for supersets composed of twosubsets to estimates for supersets only containing a single subset forExperiments 1, 4, and 5. Again, although no effect of probe order wasobtained, data from Probe-Before and Probe-After trials are depictedseparately for Experiment 1. Error bars depict standard errors.
Thi
sdo
cum
ent
isco
pyri
ghte
dby
the
Am
eric
anPs
ycho
logi
cal
Ass
ocia
tion
oron
eof
itsal
lied
publ
ishe
rs.
Thi
sar
ticle
isin
tend
edso
lely
for
the
pers
onal
use
ofth
ein
divi
dual
user
and
isno
tto
bedi
ssem
inat
edbr
oadl
y.
6 CORDES, GOLDSTEIN, AND HELLER

tion always knew the identity of the target set prior to stimuluspresentation, whereas those in the Probe-After condition did nothave this information until after the stimulus display had disap-peared.
Again, Subset and Superset trials were randomly intermixedthroughout the session. Subjects participated in three practice trialsfollowed by a total of 288 trials (192 Subset and 96 Supersettrials). However, because all Superset trials contained two subtestsand thus were not specifically designed to explore the SupersetEffect, data from these trials were not analyzed and will not bediscussed.
Stimuli. The number of dots in the Target subset array waschosen from one of six logarithmically spaced set sizes (6, 8, 11,14, 19, 26). The size of the other subset (the Nontarget array or“Distractor” array) was randomly chosen from one of four possibleset sizes (6, 8, 14, 26).8 This led to a total of 6 (target size) � 4(distractor size) types of Subset trials, each presented eight timeseach for a total of 192 subset trials.
Results
Mean estimates from Subset trials were subjected to a 6 (Targetset size) � 4 (Distractor size) � 2 (Probe Condition) mixedmeasures ANOVA and follow-up LSD post hoc tests. Not surpris-ingly, a significant effect of Target, F(1.8, 69.2) � 457.0, p � .00revealed mean estimates increased with the size of the Targetsubset, indicating that subjects were engaged in the numericalestimation task. Importantly, a significant main effect of Distractorsize was found, F(2.4, 92) � 17.5, p � .00, such that Target sizeestimates generally decreased as the Distractor set size increased(Distractor Size 6: M � 12.0, SE � .32; Size 8: M � 12.12, SE �.32; Size 14: M � 11.87, SE � .34; Size 26: M � 11.36, SE � .28;Figure 3). In addition, a main effect of Probe Condition,F(1, 38) � 8.1, p � .007 revealed that participants in the Probe-Before condition (M � 12.7, SE � .44) produced higher estimatesoverall compared to those in the Probe-After condition (M � 11.0,SE � .44), and a Probe-Condition � Target set size interaction,F(5, 190) � 10.1, p � .000 revealed that the difference in esti-mates across the two conditions was most dramatic for the largestTarget set sizes. Importantly, however, Probe Order did not inter-act with Distractor (p � .6), indicating that the size of the Dis-tractor set had the same effect regardless of whether the partici-pants knew which set to attend to beforehand. No other significanteffects or interactions were obtained (p � .1).
Discussion
Results from Experiment 2 mimic those of Experiment 1. Inparticular, despite reduced variability in task demands, set sizeestimates decreased systematically as a function of the size ofother present subsets such that, for example, the number of reddots influenced the perception of the number of blue dots. Fur-thermore, this Subset Effect was found when participants knewbeforehand which subset to attend to, and data patterns wereidentical to those found when participants did not have priorknowledge of the identity of the target set. The lack of a significantProbe-Order � Distractor interaction in either Experiment 1 or 2provide strong evidence to suggest that the size of other setsimpacts target set estimates at a preattentive level. That is, the
Subset Effect does not appear to be under the subject’s consciouscontrol.
Experiment 3: Subset Effect With Density Control
Results of Experiments 1 and 2 reveal that larger extraneoussubsets lead to lower estimates of the target subset. These resultsare consistent with predictions of a simultaneous numerical con-trast, suggesting that the size of the distractor set contrasted withestimates of the target subset. There is an alternative explanation,however, that has yet to be addressed. Because the previousexperiments did not control for dot density, then as the number ofdistractor dots increased, so did the item density of the display.Studies suggest that numerical estimates are greatly influenced bydensity; although numerical estimates have typically been shownto positively correlate with density (that is, as density increases,estimates generally increase too; Durgin, 1995, 2008), in somecases, estimates have been shown to decrease as dot occupancyincreases (Allik & Tuulmets, 1991). If our Subset Effect is bestaccounted for by a perceptual bias brought on by increased dotoccupancy, then keeping dot density constant across displaysshould make this effect disappear. Alternatively, if a simultaneousnumerical contrast effect more accurately described the observedpattern of results, then a Subset Effect should still be observeddespite density controls. To test this hypothesis, in Experiment 3,the background size of each display varied as a function of the totalnumber of dots in the display. In doing so, item density was heldconstant across varying Distractor subset sizes, eliminating dotdensity as a potential cue for estimation.
Method
Participants. Twenty-one undergraduate students partici-pated in this a single 1-hr session (M � 20.1 year, range 18–22years; 14 females) for course credit or $5 compensation.
Procedure. The procedure of Experiment 3 was identical tothat of Experiment 1 with the following exceptions. To reduce taskdemands, no Superset trials were presented—all trials requiredparticipants to estimate the size of one of the subsets in the array.As in Experiment 1, half of the trials were Probe-Before, while theother half were Probe-After (randomly intermixed). Subjects par-ticipated in four practice trials followed by a total of 150 trials.
Stimuli. The number of dots in the target subset array waschosen from one of six logarithmically spaced set sizes (12, 15, 18,22, or 28). The size of the distractor subset was randomly chosenfrom one of three set sizes: (1) 0 (No Distractor trials), (2) 50%fewer than target subset (Small Distractor trials), or (4) 50% largerthan target subset (Large Distractor trials). This led to a total of 5(target size) � 3 (distractor size) � 2 (probe order) types of Subsettrials, each presented 5 times each for a total of 150 subset trials.
To control for density, the size of the background on which thedots were placed varied on every trial based on the total number ofdots in the display (total of target � distractor). Large Distractortrials were randomly placed within the same 13 � 8 invisiblebackground grid as in Experiment 1. However, because the total
8 Note, in contrast to Experiment 1, distractor set sizes were chosen asone of four absolute set sizes, and did not vary as a function of a proportionof the target set size.
Thi
sdo
cum
ent
isco
pyri
ghte
dby
the
Am
eric
anPs
ycho
logi
cal
Ass
ocia
tion
oron
eof
itsal
lied
publ
ishe
rs.
Thi
sar
ticle
isin
tend
edso
lely
for
the
pers
onal
use
ofth
ein
divi
dual
user
and
isno
tto
bedi
ssem
inat
edbr
oadl
y.
7SET MEMBERSHIP AND NUMERICAL ESTIMATES

number of dots in Small Distractor trials was 60% that of LargeDistractor trials, the size of the grid was reduced by 60% on SmallDistractor trials to a 9 � 7 grid (thus keeping the ratio of thenumber of dots to background size constant). Similarly, the grid onNo Distractor trials was reduced by 40% (compared to LargeDistractor) to 7 � 6. All grids were centered on the screen. Thus,although density continued to covary with target set size (becausethe number of dots in the display increased with target set size yetthe size of the grids did not), within each target size, density washeld constant across No Distractor, Small Distractor, and LargeDistractor trials (see Figure 3).
Results
Mean responses were subjected to a Target set size (5) �Distractor Size (3) � Probe-Order (2) repeated measures ANOVA.In addition to the main effect of Target Set Size, F(1.4, 30.0) �153.6, p � .00, an effect of the size of the Distractor set, F(1.5,30.1) � 18.14, p � .00 and a Target x Distractor interaction, F(4.6,92.5) � 7.2, p � .00 were again found (see Figure 3). Despitecontrols for dot density, just as in Experiments 1 and 2, targetsubset size estimates decreased as the size of the Distractor subsetincreased (No Distractor: M � 16.75, SE � .69; Small Distractor:M � 16.27, SE � .84; Large Distractor M � 14.78, SE � .79) andthe interaction revealed that this Subset Effect was most exagger-ated for the largest set sizes. As in Experiment 1, Probe Order didnot affect estimates (p � .3), nor did it interact with any othervariables (p’s�.1).
Discussion
Again, data reveal that subset estimates are affected by thepresence and size of other irrelevant subsets. Findings held despitestrict controls for dot density, suggesting that a simple perceptualexplanation based upon increased dot occupancy cannot accuratelyaccount for the observed Subset Effect. Instead, evidence of anegative correlation between Distractor set sizes and mean esti-mates are consistent with claims of a simultaneous numericalcontrast effect, such that numerical information subjectively con-trasts with numerical percepts. Lastly, in all three experiments, thetiming of when observers learned the identity of the target set didnot affect data patterns, providing strong support that these simul-taneous numerical contrasts are not under the observer’s consciousawareness.
Experiment 4: Superset Effect With Reduced SetMembership Saliency
In Experiment 4, we return to the Superset Effect to explore therobustness of the finding that supersets comprising two subsets areperceived as larger than those comprising a single subset. Notably,although participants in Experiment 1 could have ignored thecomposition of the Superset on Probe-Before Superset trials, datasuggest that they did not do so. Again, this finding may have beendriven by an inability to attend to or process the informationprovided in the first probe due to exorbitant trial-to-trial variabilityin task demands (i.e., ignoring the Probe-Before information).Thus, in Experiment 4, we simplified task demands by makingsubset membership (as defined by color) completely irrelevant to
the task, thereby reducing trial-to-trial variability in task demandsas well as eliminating dot color as an informative or relevant cuein the task. A second group of naïve adult observers were asked toestimate the total number of dots presented on the screen on everytrial (identical to Probe-Before Superset trials of main experiment).Critically, participants were never asked to enumerate sets basedupon color, and were always asked to estimate the total number ofdots presented. Thus observers knew to ignore the composition ofthe set (the colors of the dots) and only attend to the total number.
Method
Participants. Thirty undergraduate students (M � 19.6 years;range 18–22 years; 15 females) participated in a single 1-hoursession for course credit.9 None of the observers from the otherexperiments participated in this experiment.
Materials and procedure. The materials and procedure wereidentical to Experiment 1 with the following exceptions. All trialsconsisted of Probe-Before Superset Trials. That is, on every trial,participants were asked to indicate the total number of dots pre-sented, regardless of the number of subsets. Thus, the color of thedots (and thus subset membership) was never relevant to taskdemands.
Superset sizes were chosen from eight possible values (18,24, 30, 38, 46, 60, 76, or 96). Again, there were three types ofset divisions: 100/0 (single subset), 50/50 (dots evenly dividedamong 2 colors), and 75/25 (25% of dots were a differentcolor). After three practice trials, each superset size � divisioncombination was presented six times each for a total of 144trials.
Data analyses. Data analyses focused on the comparison ofestimates for supersets containing a single subset versus twosubsets. Thus, for both Experiments 4 and 5, estimates on 75/25division and 50/50 division trials were averaged to create a TwoSubset mean response for each superset size, for each subject.
Results
Mean responses were subjected to a Superset size (8) �Number of Subsets (2) repeated measures ANOVA. Again, amain effect of set size was found, with mean estimates increas-ing in direct proportion to set size, F(1.3, 37.4) � 181.9, p �.00 indicating adults were engaged in the task. Importantly, justas in Experiment 1, the number of subsets affected estimates,F(1, 29) � 7.3, p � .02 indicating that even when color wascompletely irrelevant to the task and participants knew only totrack the total number of dots in the display, participantsestimated sets containing two subsets (M � 40.0, SE � 1.6) ashaving more elements than sets containing only a single set
9 Two additional subjects were excluded for failing to follow taskdirections, as their mean estimates were inordinately large (estimating �50for the smallest superset size of 18) and did not increase monotonicallywith set size.
Thi
sdo
cum
ent
isco
pyri
ghte
dby
the
Am
eric
anPs
ycho
logi
cal
Ass
ocia
tion
oron
eof
itsal
lied
publ
ishe
rs.
Thi
sar
ticle
isin
tend
edso
lely
for
the
pers
onal
use
ofth
ein
divi
dual
user
and
isno
tto
bedi
ssem
inat
edbr
oadl
y.
8 CORDES, GOLDSTEIN, AND HELLER

(M � 39.1, SE � 1.6; Figure 5). No other significant maineffects or interactions were found (p � .05).10
Discussion
Experiment 4 results replicate the Superset Effect of Experiment1, revealing that set membership has robust impacts on numericalestimates. Participants systematically estimated supersets contain-ing two subsets as greater in size than supersets containing only asingle subset. Importantly, set composition affected estimates evenwhen subset membership (i.e., dot color) was completely irrelevantto the task at hand, providing strong evidence to suggest thatidentification of set membership occurs automatically, prior tobasic numerical processing.
Experiment 5: Reduced Visual Search Demands
In our last experiment, we explored what role, if any, the task ofset delineation played in our observed Subset and Superset Effectsby varying the spatial arrangement of the two subsets. In ourprevious experiments, when displays contained more than onesubset, the subsets were always intermixed throughout the dis-plays, requiring observers to first visually search through thedisplay in order to identify all members of a given subset (e.g.,search through all the red dots to find the blue dots and vice versa).It is unclear whether this visual search contributed to the pattern ofresults. In Experiment 5, we presented some trials in which subsetswere spatially separated, such that one subset was presented en-tirely on the left side of the screen and the other subset waspresented entirely on the right side (Figure 1C). In doing so, spatialseparation of the subsets facilitated set individuation, highlightingsubset membership, thereby reducing visual search demands. Itwas expected that highlighting subset membership in this waywould enhance the impact of set membership on superset esti-mates—that is, we expected a magnified Superset Effect. On theother hand, highlighting set membership could make it easier forobservers to keep subset size estimates independent in memory,thereby reducing the likelihood of numerical contrast effects onsubset trials. If so, then this would predict a reduction or elimina-tion of the Subset Effect. We explored these distinct hypotheses inExperiment 5.
Method
Participants. Twenty-two undergraduate students (M � 19.8years; range 18–22 years; 13 females) participated in a single-halfhour session for course credit.11 None of the observers from theprior experiments participated in this experiment.
Materials, stimuli, and procedure. The materials, stimuli,and procedure were identical to Experiment 1 with the followingexceptions. All trials consisted of Probe-After Trials. On half ofthe trials, dot arrays were randomly intermixed across the com-puter screen, as in previous experiments. On the other half of trials,however, arrays were spatially separated on the left and right sideof the computer screen such that, for example, all red dots ap-peared on the left side and all blue dots appeared on the right side.Spatially intermixed and spatially separated trials were randomlyintermixed throughout the session. To accommodate the differentspacing on spatially separated trials, the size of all individual dots
was reduced slightly to approximately 1.7 degrees of visual angle.After six practice trials, subjects participated in a total of 264 trials(144 subset and 120 superset).
Subset trials. The number of dots in the target subset arraywas chosen from one of four logarithmically spaced set sizes (16,18, 22, 28). The size of the distractor array was randomly chosenfrom one of three set sizes: (1) 0 (No Distractor trials), (2) 50%fewer than target subset (Small Distractor trials), or (3) 50% largerthan target subset (Large Distractor trials). This led to a total of 4(Target size) � 3 (Distractor size) � 2 (Spatial arrangement—together or separate) types of Subset trials, each presented sixtimes each for a total of 144 subset trials.
Superset trials. Superset sizes were chosen from four possiblevalues (24, 32, 42, 54). Again, there were three types of setdivisions: 100/0, 50/50, and 75/25. On half of all trials involvingtwo subsets (50/50 and 75/25 conditions), subsets were spatiallyseparated, and on the other half, subsets were randomly intermixedacross the screen. Because the design of spatially intermixed 100/0trials (involving a single subset) was identical to that of spatiallyseparated 100/0 trials (making these trials indistinguishable), par-ticipants were only presented half as many 100/0 trials and datawere used as a baseline measure in both the spatially separate andspatially intermixed analyses. Thus, subjects experienced 24 100/0trials (four superset sizes presented six times each), 48 50/50 trialsand 48 75/25 trials (four superset sizes � two spatial arrangementspresented six times each) randomly intermixed, for a total of 120trials.
Results
Subset trials.Spatially intermixed trials. Mean responses to all spatially
intermixed subset trials were subjected to a 4 (Target set size) �3 (Distractor set size) repeated measures ANOVA. A main effectof Target set size, F(3, 63) � 93.4, p � .000, a main effect ofDistractor set size, F(2, 42) � 8.1, p � .001, and a significantinteraction, F(6, 126) � 7.9, p � .000 were found, again revealingthat the size of the Distractor had a greater impact as the size of theTarget set increased. Importantly, the pattern of results from thespatially intermixed subset trials replicated those of Experiments1–3, with larger Distractor set sizes resulting in lower Target setsize estimates (No Distractor: M � 18.0, SE � .55; Small Dis-tractor: M � 16.6, SE � .72; Large Distractor: M � 16.2, SE �.85; Figure 3).
Spatially separated trials. An identical ANOVA on data fromthe spatially separated trials revealed a main effect of Target setsize, F(1.6, 34.2) � 91.9, p � .000 and no other significant maineffects or interactions (p � .4). It is important to note that the
10 Although not significant, the target set size � division interactionapproached significance, F(5.0, 143.7) � 2.0, p � .08 but this interactionwas in the opposite direction as that found in Experiment 1, such that theeffect of set division was most evident for the largest set sizes. Althoughit is not clear why results differed across the two experiments, it is likelythat the lack of inclusion of subset trials in the design of Experiment 4 mayhave contributed to the direction of this effect.
11 Two additional subjects were excluded for failing to follow taskdirections (n � 1), and for providing a large number (9) of mean estimatesthat were higher than the mean of all responses by more than three standarddeviations (n � 1).
Thi
sdo
cum
ent
isco
pyri
ghte
dby
the
Am
eric
anPs
ycho
logi
cal
Ass
ocia
tion
oron
eof
itsal
lied
publ
ishe
rs.
Thi
sar
ticle
isin
tend
edso
lely
for
the
pers
onal
use
ofth
ein
divi
dual
user
and
isno
tto
bedi
ssem
inat
edbr
oadl
y.
9SET MEMBERSHIP AND NUMERICAL ESTIMATES
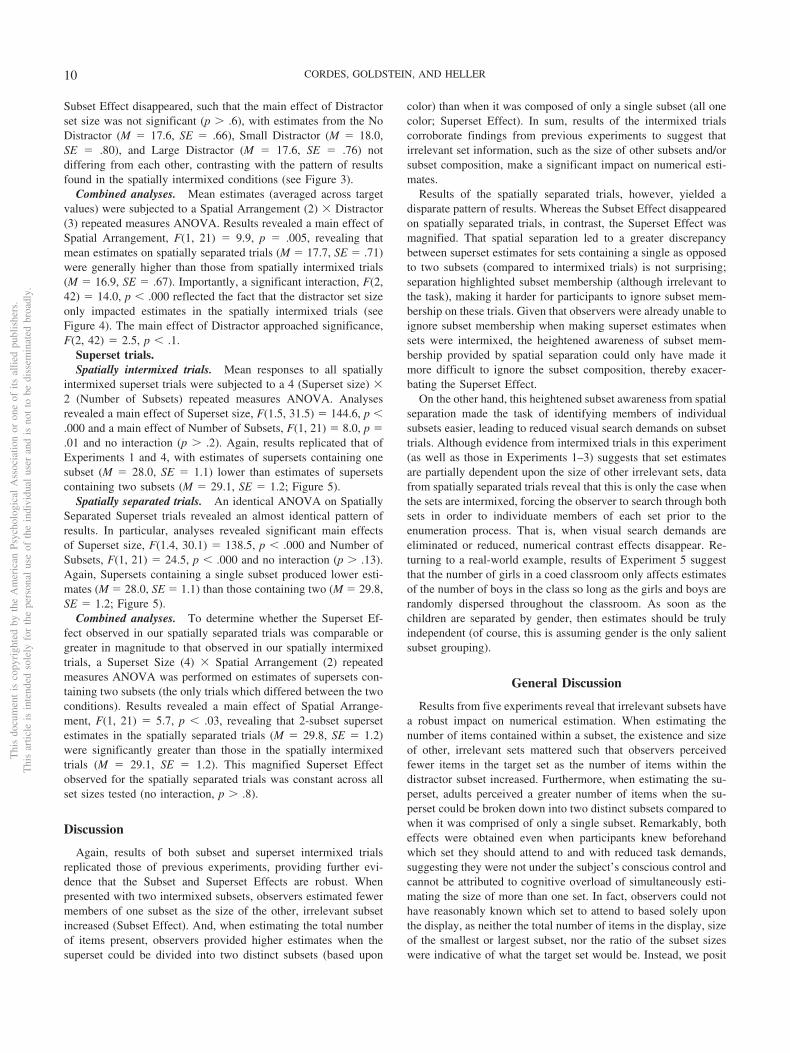
Subset Effect disappeared, such that the main effect of Distractorset size was not significant (p � .6), with estimates from the NoDistractor (M � 17.6, SE � .66), Small Distractor (M � 18.0,SE � .80), and Large Distractor (M � 17.6, SE � .76) notdiffering from each other, contrasting with the pattern of resultsfound in the spatially intermixed conditions (see Figure 3).
Combined analyses. Mean estimates (averaged across targetvalues) were subjected to a Spatial Arrangement (2) � Distractor(3) repeated measures ANOVA. Results revealed a main effect ofSpatial Arrangement, F(1, 21) � 9.9, p � .005, revealing thatmean estimates on spatially separated trials (M � 17.7, SE � .71)were generally higher than those from spatially intermixed trials(M � 16.9, SE � .67). Importantly, a significant interaction, F(2,42) � 14.0, p � .000 reflected the fact that the distractor set sizeonly impacted estimates in the spatially intermixed trials (seeFigure 4). The main effect of Distractor approached significance,F(2, 42) � 2.5, p � .1.
Superset trials.Spatially intermixed trials. Mean responses to all spatially
intermixed superset trials were subjected to a 4 (Superset size) �2 (Number of Subsets) repeated measures ANOVA. Analysesrevealed a main effect of Superset size, F(1.5, 31.5) � 144.6, p �.000 and a main effect of Number of Subsets, F(1, 21) � 8.0, p �.01 and no interaction (p � .2). Again, results replicated that ofExperiments 1 and 4, with estimates of supersets containing onesubset (M � 28.0, SE � 1.1) lower than estimates of supersetscontaining two subsets (M � 29.1, SE � 1.2; Figure 5).
Spatially separated trials. An identical ANOVA on SpatiallySeparated Superset trials revealed an almost identical pattern ofresults. In particular, analyses revealed significant main effectsof Superset size, F(1.4, 30.1) � 138.5, p � .000 and Number ofSubsets, F(1, 21) � 24.5, p � .000 and no interaction (p � .13).Again, Supersets containing a single subset produced lower esti-mates (M � 28.0, SE � 1.1) than those containing two (M � 29.8,SE � 1.2; Figure 5).
Combined analyses. To determine whether the Superset Ef-fect observed in our spatially separated trials was comparable orgreater in magnitude to that observed in our spatially intermixedtrials, a Superset Size (4) � Spatial Arrangement (2) repeatedmeasures ANOVA was performed on estimates of supersets con-taining two subsets (the only trials which differed between the twoconditions). Results revealed a main effect of Spatial Arrange-ment, F(1, 21) � 5.7, p � .03, revealing that 2-subset supersetestimates in the spatially separated trials (M � 29.8, SE � 1.2)were significantly greater than those in the spatially intermixedtrials (M � 29.1, SE � 1.2). This magnified Superset Effectobserved for the spatially separated trials was constant across allset sizes tested (no interaction, p � .8).
Discussion
Again, results of both subset and superset intermixed trialsreplicated those of previous experiments, providing further evi-dence that the Subset and Superset Effects are robust. Whenpresented with two intermixed subsets, observers estimated fewermembers of one subset as the size of the other, irrelevant subsetincreased (Subset Effect). And, when estimating the total numberof items present, observers provided higher estimates when thesuperset could be divided into two distinct subsets (based upon
color) than when it was composed of only a single subset (all onecolor; Superset Effect). In sum, results of the intermixed trialscorroborate findings from previous experiments to suggest thatirrelevant set information, such as the size of other subsets and/orsubset composition, make a significant impact on numerical esti-mates.
Results of the spatially separated trials, however, yielded adisparate pattern of results. Whereas the Subset Effect disappearedon spatially separated trials, in contrast, the Superset Effect wasmagnified. That spatial separation led to a greater discrepancybetween superset estimates for sets containing a single as opposedto two subsets (compared to intermixed trials) is not surprising;separation highlighted subset membership (although irrelevant tothe task), making it harder for participants to ignore subset mem-bership on these trials. Given that observers were already unable toignore subset membership when making superset estimates whensets were intermixed, the heightened awareness of subset mem-bership provided by spatial separation could only have made itmore difficult to ignore the subset composition, thereby exacer-bating the Superset Effect.
On the other hand, this heightened subset awareness from spatialseparation made the task of identifying members of individualsubsets easier, leading to reduced visual search demands on subsettrials. Although evidence from intermixed trials in this experiment(as well as those in Experiments 1–3) suggests that set estimatesare partially dependent upon the size of other irrelevant sets, datafrom spatially separated trials reveal that this is only the case whenthe sets are intermixed, forcing the observer to search through bothsets in order to individuate members of each set prior to theenumeration process. That is, when visual search demands areeliminated or reduced, numerical contrast effects disappear. Re-turning to a real-world example, results of Experiment 5 suggestthat the number of girls in a coed classroom only affects estimatesof the number of boys in the class so long as the girls and boys arerandomly dispersed throughout the classroom. As soon as thechildren are separated by gender, then estimates should be trulyindependent (of course, this is assuming gender is the only salientsubset grouping).
General Discussion
Results from five experiments reveal that irrelevant subsets havea robust impact on numerical estimation. When estimating thenumber of items contained within a subset, the existence and sizeof other, irrelevant sets mattered such that observers perceivedfewer items in the target set as the number of items within thedistractor subset increased. Furthermore, when estimating the su-perset, adults perceived a greater number of items when the su-perset could be broken down into two distinct subsets compared towhen it was comprised of only a single subset. Remarkably, botheffects were obtained even when participants knew beforehandwhich set they should attend to and with reduced task demands,suggesting they were not under the subject’s conscious control andcannot be attributed to cognitive overload of simultaneously esti-mating the size of more than one set. In fact, observers could nothave reasonably known which set to attend to based solely uponthe display, as neither the total number of items in the display, sizeof the smallest or largest subset, nor the ratio of the subset sizeswere indicative of what the target set would be. Instead, we posit
Thi
sdo
cum
ent
isco
pyri
ghte
dby
the
Am
eric
anPs
ycho
logi
cal
Ass
ocia
tion
oron
eof
itsal
lied
publ
ishe
rs.
Thi
sar
ticle
isin
tend
edso
lely
for
the
pers
onal
use
ofth
ein
divi
dual
user
and
isno
tto
bedi
ssem
inat
edbr
oadl
y.
10 CORDES, GOLDSTEIN, AND HELLER

that these numerical biases are the result of a preattentive percep-tual process, such that adults could not help but enumerate bothsubsets within a display, even when not necessary. Thus, not onlycan adults attend to two subsets simultaneously (Halberda et al.,2006), our findings indicate that they do so automatically andunintentionally.
Subset Enumeration
There is still the open question of why this preattentive enumer-ation yielded the particular pattern of results observed. Why didlarger distractor sets result in smaller target subset estimates?Results of Experiment 3 rule out the simple perceptual explanationof density accounting for these results. Alternatively, we suggestfindings are indicative of a simultaneous contrast effect for num-ber, similar to those found for other magnitudes such as weight,duration, and loudness (e.g., Preston, 1936; Melamed & Thurlow,1971; Mo, 1971). Across four experiments, participants estimatedfewer items in the target set as the number of distractor itemsincreased, consistent with a simultaneous contrast effect for num-ber. Thus, these data provide the first evidence that estimates ofnumber subjectively contrast with our percepts of number.
It is interesting that the Subset Effect disappeared on spatiallyseparated trials of Experiment 5 when visual search demands wereeliminated. Why might this be? One possibility is that by spatiallyseparating the sets and reducing visual search demands, observerswere able to enumerate each set sequentially. In contrast, whensets are intermixed, both sets may be enumerated in parallel asobservers visually search through the array. This sequential enu-meration may have allowed observers to keep counts of the twoarrays independent in memory, eliminating the impact of contrasteffects. Future research should explore this hypothesis, possiblyusing eye-tracking procedures to determine whether, when pre-sented with intermixed arrays, adults attempt to fixate on dots ofall one color first followed by the other (in sequence) or if instead,as hypothesized, fixation patterns are independent of dot color.
Superset Enumeration
Findings of a Superset Effect reveal that, despite seeing thesame number of dots, observers estimated the size of setscomposed of two subsets as larger than those composed of asingle subset. Halberda et al. (2006) reported that, on average,adults were capable of simultaneously enumerating three dif-ferent sets—two subsets and the superset— however, their anal-yses did not explore whether the composition of the supersetresulted in different estimates. Although our data align withHalberda et al.’s overall findings—that subset and supersetestimates were unaffected by probe order (so long as the num-ber of subsets was two or fewer)— our analyses suggest that theconclusion that observers were simultaneously enumeratingsubsets and the superset may not be accurate. In contrast, ourdata are consistent with the idea that observers did not, in fact,enumerate the superset, but instead enumerated each individualsubset and performed an approximate summation of the twoestimates. Previous investigations into the responses to approx-imate addition and subtraction of numerical estimates havereported infants and adults overestimate sums and underesti-mate differences (McCrink et al., 2007; McCrink & Wynn,
2009). Our data are consistent with this “operational momen-tum,” such that observers likely estimated the sizes of the twoindividual subsets and added the estimates together, with theresulting sum larger than estimates of a single set of the samesize.
It should be noted that Halberda et al. (2006) did address thepossibility of a summation account but ruled it out based upon twoarguments. First, they suggested that flat RTs, regardless of thenumber of subsets in the array, were inconsistent with a summationaccount that would predict higher RTs for more summations. Butgiven that observers typed in their responses using a computerkeyboard (as they did in our task), RTs on their task would not bea sensitive enough measure to reflect the minute differences pre-dicted by mental summations. Second, they pointed to the fact thatsubjects in their study were able to estimate the superset evenwhen it contained as many as six subsets, despite being unable toenumerate six sets simultaneously. While true, this finding alonedoes not necessarily preclude a summation account. It is plausiblethat when presented with more subsets than can be simultaneouslyenumerated, adults shift from tracking the size of individual sub-sets to tracking the size of the superset as a whole. As posited byHalberda et al. (2006), set membership may be processed prior tonumerical tracking. When presented with a small number of sub-sets (e.g., two), set membership is easily identified, and thussubsets are enumerated separately. When presented with a largenumber of subsets (e.g., six) that are less easily parsed, on the otherhand, observers may be unable to keep track of the sizes of allsubsets, and thus set membership may be ignored.
Regardless, results of our study strongly suggest that despitebeing asked to attend to the superset, adults ignored the supersetand instead simultaneously enumerated the individual subsets andsummed these estimates, resulting in slightly larger estimates forsupersets composed of two subsets than for those composed withonly a single subset (the superset). This clearly was a subconsciousprocess, as the Superset Effect was observed even when observersknew beforehand to attend to the superset (Experiments 1, 4, and5) and when subset membership was not relevant in any way to thetask (Experiment 4), and was magnified when subset membershipwas highlighted (Experiment 5). Further, this finding contradictsHalberda et al.’s conclusions, and instead suggests that, at leastunder these circumstances, adult observers will only enumeratetwo sets, not three, at a time.
Conclusion
In sum, our numerical perception abilities are far from perfect.When presented with multiple sets of items, we monitor thenumber of items within each of these individual subsets, but ourestimates of the size of one set depend heavily upon the size of theother set. Furthermore, even when we only need to attend to the setas a whole and subset membership is irrelevant, we still deal withthe set in a piecemeal-wise manner, attending to each individualsubset, judging supersets composed of two subsets as larger thanthose with only a single subset. Combined, our findings reveal thatset composition and extraneous numerical information reliablyaffect our perceptions of number, a finding with serious implica-tions for our ability to accurately estimate number in real-worldcontexts.
Thi
sdo
cum
ent
isco
pyri
ghte
dby
the
Am
eric
anPs
ycho
logi
cal
Ass
ocia
tion
oron
eof
itsal
lied
publ
ishe
rs.
Thi
sar
ticle
isin
tend
edso
lely
for
the
pers
onal
use
ofth
ein
divi
dual
user
and
isno
tto
bedi
ssem
inat
edbr
oadl
y.
11SET MEMBERSHIP AND NUMERICAL ESTIMATES

References
Allik, J., & Tuulmets, T. (1991). Occupancy model of perceived numer-osity. Perception & Psychophysics, 49, 303–314. doi:10.3758/BF03205986
Baker, J. M., Rodzon, K., & Jordan, K. (in press). The impact of emotionon numerosity estimation. Frontiers in Psychology.
Cantlon, J. F., Cordes, S., Libertus, M. E., & Brannon, E. M. (2009).Numerical abstraction: It ain’t broke. Behavioral and Brain Sciences, 32,331–332. doi:10.1017/S0140525X09990513
Cordes, S., Gallistel, C. R., Gelman, R., & Latham, P. (2007). Nonverbalarithmetic in humans: Light from noise. Perception & Psychophysics,69, 1185–1203. doi:10.3758/BF03193955
Cordes, S., Williams, C. L., & Meck, W. H. (2007). Common representa-tions of abstract quantities. Current Directions in Psychological Science,16, 156–161. doi:10.1111/j.1467-8721.2007.00495.x
Durgin, F. H. (1995). Texture density adaptation and the perceived numer-osity and distribution of texture. Journal of Experimental Psychology:Human Perception and Performance, 21, 149–169. doi:10.1037/0096-1523.21.1.149
Durgin, F. H. (2008). Texture density adaptation and visual number revis-ited. Current Biology, 18, R855–R856. doi:10.1016/j.cub.2008.07.053
Gallistel, C. R. (1990). The organization of learning. Cambridge, MA:MIT Press.
Gallistel, C. R., Gelman, R., & Cordes, S. (2006). The cultural andevolutionary history of the real numbers. In S. Levinson & P. Jaisson(Eds.), Evolution and culture: A Fyssen Foundation symposium (pp.247–274). Cambridge, MA: MIT Press.
Geary, D. C. (2013). Early foundations for mathematics learning and theirrelations to learning disabilities. Current Directions in PsychologicalScience, 22, 23–27. doi:10.1177/0963721412469398
Halberda, J., Mazzocco, M. M. M., & Feigenson, L. (2008). Individualdifferences in non-verbal number acuity correlate with maths achieve-ment. Nature, 455, 665–668. doi:10.1038/nature07246
Halberda, J., Sires, S. F., & Feigenson, L. (2006). Multiple spatially-overlapping sets can be enumerated in parallel. Psychological Science,17, 572–576. doi:10.1111/j.1467-9280.2006.01746.x
Jordan, K. E., & Brannon, E. M. (2006). The multisensory representationof number in infancy. PNAS: Proceedings of the National Academy ofSciences of the United States of America, 103, 3486–3489. doi:10.1073/pnas.0508107103
Knops, A., Viarouge, A., & Dehaene, S. (2009). Dynamic representationsunderlying symbolic and nonsymbolic calculation: Evidence from theoperational momentum effect. Attention, Perception, & Psychophysics,71, 803–821. doi:10.3758/APP.71.4.803
Levinthal, B. R., & Franconeri, S. L. (2011). Common-fate grouping asfeature selection. Psychological Science, 22, 1132–1137. doi:10.1177/0956797611418346
McCrink, K., Dehaene, S., & Dehaene-Lambertz, G. (2007). Moving alongthe number line: Operational momentum in nonsymbolic arithmetic.Perception & Psychophysics, 69, 1324–1333. doi:10.3758/BF03192949
McCrink, K., & Wynn, K. (2009). Operational momentum in large-numberaddition and subtraction by 9-month-olds. Journal of ExperimentalChild Psychology, 103, 400–408. doi:10.1016/j.jecp.2009.01.013
Melamed, L. E., & Thurlow, W. R. (1971). Analysis of contrast effects inloudness judgments. Journal of Experimental Psychology, 90, 268–274.doi:10.1037/h0031548
Mo, S. S. (1971). Judgment of temporal duration as a function of numer-osity. Psychonomic Science, 24, 71–72.
Penney, T. B., Allan, L. G., Meck, W. H., & Gibbon, J. (1998). Memorymixing in duration bisection. In D. A. Rosenbaum & C. E. Collyer(Eds.), Timing of behavior: Neural, psychological, and computationalperspectives (pp. 165–193). Cambridge, MA: MIT Press.
Posid, T., Huguenel, B., & Cordes, S. (2013). Stimulus heterogeneityfacilitates difficult number judgments in preschoolers. Manuscript inpreparation.
Preston, M. G. (1936). Contrast effects and the psychometric judgments.The American Journal of Psychology, 48, 389 – 402. doi:10.2307/1415884
Redden, J. P., & Hoch, S. J. (2009). The presence of variety reducesperceived quantity. Journal of Consumer Research, 36, 406–417. doi:10.1086/598971
Siegler, R. S., & Booth, J. L. (2004). Development of numerical estimationin young children. Child Development, 75, 428–444. doi:10.1111/j.1467-8624.2004.00684.x
Trick, L. M., & Pylyshyn, Z. W. (1994). Why are small and large numbersenumerated differently? A limited-capacity preattentive stage in vision.Psychological Review, 101, 80–102. doi:10.1037/0033-295X.101.1.80
Young, L. N., & Cordes, S. (2013a). Fewer things, lasting longer: Theeffects of emotional stimuli on quantity judgments. Psychological Sci-ence, 24, 1057–1059. doi:10.1177/0956797612465294
Young, L. N., & Cordes, S. (2013b). Quantifying a threat: Numericprocessing bias in panic-prone individuals. Manuscript submitted forpublication.
Received August 23, 2012Revision received June 11, 2013
Accepted July 18, 2013 �
Thi
sdo
cum
ent
isco
pyri
ghte
dby
the
Am
eric
anPs
ycho
logi
cal
Ass
ocia
tion
oron
eof
itsal
lied
publ
ishe
rs.
Thi
sar
ticle
isin
tend
edso
lely
for
the
pers
onal
use
ofth
ein
divi
dual
user
and
isno
tto
bedi
ssem
inat
edbr
oadl
y.
12 CORDES, GOLDSTEIN, AND HELLER