
Assessment of the eutrophication status of the Great Barrier Reef lagoon (Australia
22
Assessment of the eutrophication status of the Great Barrier Reef lagoon (Australia) J. E. Brodie • M. Devlin • D. Haynes • J. Waterhouse Received: 17 November 2009 / Accepted: 22 October 2010 Ó Springer Science+Business Media B.V. 2010 Abstract Current scientific consensus is that inshore regions of the central and southern Great Barrier Reef, Australia, are at risk of impacts from increased nutrient (as well as sediment and pesticide) loads delivered to Reef waters. Increases in the discharge of water quality contaminants to the Reef are largely a consequence of the expansion of agricultural practices in northern Queensland catch- ments following European settlement in the 1850s. In particular, the presence of elevated chlorophyll a and nutrient concentrations in many parts of the inshore Great Barrier Reef together with intense and exten- sive phytoplankton blooms following the discharge of nutrient-rich river flood waters suggest that the central and southern inshore area of the Great Barrier Reef is likely to be significantly impacted by elevated nutrient loads. The biological consequences of this are not fully quantified, but are likely to include changes in reef condition including hard and soft coral biodiversity, macroalgal abundance, hard coral cover and coral recruitment, as well as change in seagrass distribution and tissue nutrient status. Con- temporary government policy is centered around promotion and funding of better catchment manage- ment practices to minimize the loss of catchment nutrients (both applied and natural) and the mainte- nance of a Reef wide water quality and ecosystem monitoring program. The monitoring program is designed to assess trends in uptake of management practice improvements and their associated impacts on water quality and ecosystem status over the next 10 years. A draft set of quantitative criteria to assess the eutrophication status of Great Barrier Reef waters is outlined for further discussion and refinement. Keywords Eutrophication Á Great Barrier Reef Á Nutrients Á Water quality management Introduction The Great Barrier Reef (GBR), the world’s largest coral reef ecosystem, is situated on the north-east coast of Australia (Fig. 1). It has the status of a Marine Park under joint Australian and Queensland State Government arrangements and has been a declared World Heritage Area since 1981. The ‘‘Reef’’ is globally recognised as a managed (for multiple uses) J. E. Brodie (&) Á M. Devlin Á J. Waterhouse Catchment to Reef Research Group, Australian Centre for Tropical Freshwater Research, James Cook University, Townsville 4811, Australia e-mail: [email protected] D. Haynes Great Barrier Reef Marine Park Authority, P.O. Box 1379 Townsville 4810, Australia Present Address: D. Haynes SPREP (Secretariat of the Pacific Regional Environment Programme), P.O. Box 240, Apia, Samoa 123 Biogeochemistry DOI 10.1007/s10533-010-9542-2
Transcript of Assessment of the eutrophication status of the Great Barrier Reef lagoon (Australia

Assessment of the eutrophication status of the Great BarrierReef lagoon (Australia)
J. E. Brodie • M. Devlin • D. Haynes •
J. Waterhouse
Received: 17 November 2009 / Accepted: 22 October 2010
� Springer Science+Business Media B.V. 2010
Abstract Current scientific consensus is that
inshore regions of the central and southern Great
Barrier Reef, Australia, are at risk of impacts from
increased nutrient (as well as sediment and pesticide)
loads delivered to Reef waters. Increases in the
discharge of water quality contaminants to the Reef
are largely a consequence of the expansion of
agricultural practices in northern Queensland catch-
ments following European settlement in the 1850s. In
particular, the presence of elevated chlorophyll a and
nutrient concentrations in many parts of the inshore
Great Barrier Reef together with intense and exten-
sive phytoplankton blooms following the discharge of
nutrient-rich river flood waters suggest that the
central and southern inshore area of the Great Barrier
Reef is likely to be significantly impacted by elevated
nutrient loads. The biological consequences of this
are not fully quantified, but are likely to include
changes in reef condition including hard and soft
coral biodiversity, macroalgal abundance, hard coral
cover and coral recruitment, as well as change in
seagrass distribution and tissue nutrient status. Con-
temporary government policy is centered around
promotion and funding of better catchment manage-
ment practices to minimize the loss of catchment
nutrients (both applied and natural) and the mainte-
nance of a Reef wide water quality and ecosystem
monitoring program. The monitoring program is
designed to assess trends in uptake of management
practice improvements and their associated impacts
on water quality and ecosystem status over the next
10 years. A draft set of quantitative criteria to assess
the eutrophication status of Great Barrier Reef waters
is outlined for further discussion and refinement.
Keywords Eutrophication � Great Barrier Reef �Nutrients � Water quality management
Introduction
The Great Barrier Reef (GBR), the world’s largest
coral reef ecosystem, is situated on the north-east
coast of Australia (Fig. 1). It has the status of a Marine
Park under joint Australian and Queensland State
Government arrangements and has been a declared
World Heritage Area since 1981. The ‘‘Reef’’ is
globally recognised as a managed (for multiple uses)
J. E. Brodie (&) � M. Devlin � J. Waterhouse
Catchment to Reef Research Group, Australian Centre for
Tropical Freshwater Research, James Cook University,
Townsville 4811, Australia
e-mail: [email protected]
D. Haynes
Great Barrier Reef Marine Park Authority, P.O. Box 1379
Townsville 4810, Australia
Present Address:D. Haynes
SPREP (Secretariat of the Pacific Regional Environment
Programme), P.O. Box 240, Apia, Samoa
123
Biogeochemistry
DOI 10.1007/s10533-010-9542-2
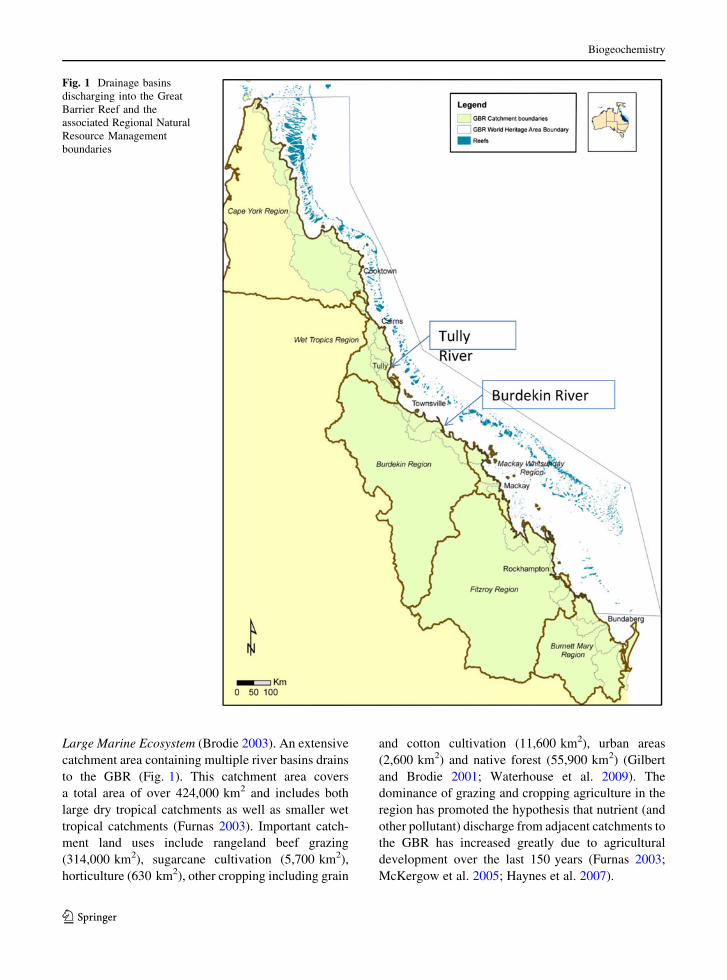
Large Marine Ecosystem (Brodie 2003). An extensive
catchment area containing multiple river basins drains
to the GBR (Fig. 1). This catchment area covers
a total area of over 424,000 km2 and includes both
large dry tropical catchments as well as smaller wet
tropical catchments (Furnas 2003). Important catch-
ment land uses include rangeland beef grazing
(314,000 km2), sugarcane cultivation (5,700 km2),
horticulture (630 km2), other cropping including grain
and cotton cultivation (11,600 km2), urban areas
(2,600 km2) and native forest (55,900 km2) (Gilbert
and Brodie 2001; Waterhouse et al. 2009). The
dominance of grazing and cropping agriculture in the
region has promoted the hypothesis that nutrient (and
other pollutant) discharge from adjacent catchments to
the GBR has increased greatly due to agricultural
development over the last 150 years (Furnas 2003;
McKergow et al. 2005; Haynes et al. 2007).
Fig. 1 Drainage basins
discharging into the Great
Barrier Reef and the
associated Regional Natural
Resource Management
boundaries
Biogeochemistry
123
Examination of a growing collection of data from
GBR waters prompted discussion and debate about
the status of GBR waters in the 1990s and helped
elevate the perception of importance of management
of water quality (Kinsey 1991). Preliminary conclu-
sions at the time varied widely of the scale and the
severity of the problems. One side of the debate
claimed no evidence of large scale or severe effects
of terrestrial runoff of sediments and nutrients
(Walker 1991) while the opposing view presented
evidence of widespread nutrient enrichment, eutro-
phication and related undesirable impacts in the GBR
(Bell 1991). In a series of papers, Bell and colleagues
postulated that nearshore waters of the GBR were
already eutrophic based on comparisons of GBR
waters with those elsewhere (particularly the Carib-
bean), as nutrient concentrations, drawn from historic
studies as well as their own current studies, exceeded
nutrient threshold guidelines for coral reefs (Bell
1991, 1992; Bell and Elmetri 1995). Bell’s conclu-
sions were not completely accepted by the scientific
community at the time due to disagreements over the
validity of the nutrient threshold guidelines used, as
well as concerns around the relatively small data sets
available for analysis. However, as more data was
subsequently accumulated, there was eventual con-
sensus that inshore regions of the GBR adjacent to
catchments south of Cooktown (refer Fig. 1) were at
risk of eutrophication (Brodie 1997) and from land-
sourced sediment and pesticide impacts (Haynes et al.
2007).
In more recent times, a series of studies have
linked terrestrial runoff with degraded GBR health. In
a pioneering study in the Whitsunday Islands, van
Woesik and co-workers determined that corals were
recruiting into localities close to the mouths of major
rivers, but recruits were failing to survive. This was
in contrast to reefs at larger distances from riverine
and terrigenous influences in the same region which
were actively accreting (van Woesik et al. 1999).
Similar gradients in a range of water quality param-
eters were detectable in the region 10 years later,
with water clarity believed to play a critical role in
structuring the reef matrix (Cooper et al. 2007). Udy
et al. (1999) concluded that a pattern of gradual
increase in seagrass distribution at Green Island (in
the northern Wet Tropics Region) since the 1950s
was most likely caused by a regional increase in
nutrient availability due to anthropogenic activity.
Data collected along the north Queensland coast also
suggests that the tissue nutrient status of the seagrass
Halophila ovalis has increased over a 20 year period
in concert with increasing fertiliser usage by the local
agricultural industry, and that this seagrass species
could be a good bioindicator of local nutrient
conditions (Mellors et al. 2005). Differences in reef
condition including hard and soft coral biodiversity
and algal abundance have been attributed to water
quality differences between reefs in Princess Char-
lotte Bay which is adjacent to relatively pristine
rivers, and reefs in the Wet Tropics Region adjacent
to polluted rivers (Fabricius and De’ath 2004;
Fabricius et al. 2005). Comparative studies on a
wider set of reefs in the northern GBR concluded that
reduced hard coral species diversity and cover in the
region between Cardwell and Cape Flattery (15� to
18�S) was due to elevated terrestrial pollutant input
into this region (Devantier et al. 2006). All five
studies implicated elevated concentrations of terres-
trial pollutants (suspended sediment, nutrients and
pesticides) as factors in observed reef degradation,
but (except for Mellors et al. 2005), could not
specifically link which of the pollutants was the
primary causal agent.
Overall, reefs of the GBR are considered to be in
relatively ‘good’ condition compared to other reefs
around the world, but are declining due to stress from
fishing, water quality impacts and climate change
(Pandolfi et al. 2003; Fabricius et al. 2005; Wilkinson
2008). Whether this relatively good condition is
related to good management through institution of the
Great Barrier Reef Marine Park Authority, or is a
consequence of relatively low adjacent human pop-
ulation pressures and distance from the coast com-
pared to South East Asian and Caribbean reefs, is not
proven (Bruno and Selig 2007). What is known is that
the current water quality management regime for
catchments adjacent to the GBR has not been
effective in improving catchment or Reef water
quality (Brodie et al. 2008a).
The purpose of this paper is to consider the
influences of nutrients on ecosystems in the GBR,
and to propose a set of criteria to assess whether the
GBR is eutrophic given the spatial variability of the
water body and the temporal variability in nutrient
delivery. These draft criteria are modelled on those
developed and used for assessment in European and
United States waters (Bricker et al. 2003; Devlin
Biogeochemistry
123
et al. 2007; Foden et al. 2010), but adapted for the
very different climatic conditions and ecosystems of
the GBR. The second purpose is to assess current
management response to these conditions and its
effectiveness. The paper presents an overview of the
effects of elevated nutrients on coral ecosystems in a
global setting, then with a focus on the GBR, reviews
the primary sources of nutrients, the current nutrient
status, fate and transformation of nutrients in the
lagoon, impacts on Reef ecosystems and evidence of
eutrophication in the GBR. Based on this informa-
tion, a set of preliminary criteria for assessing
eutrophication in the GBR are proposed. Finally,
the options for management of nutrient enrichment in
the GBR including an overview of the current setting
and shortfalls are discussed.
Influences of nutrients on reef ecosystems
Contemporary disturbances of coral reefs are caused
by a complex combination of stressors including
those arising from climate change, disturbance and
degraded water quality. Land sourced runoff con-
taining elevated nutrient concentrations may result in
a range of impacts on coral communities (Tomascik
and Sander 1985; Grigg 1995; Ward and Harrison
1997; Koop et al. 2001; Fabricius and De’ath 2004;
Loya et al. 2004; Fabricius et al. 2005, Fabricius
2007) and under extreme situations, can result in
coral reef community collapse (Smith et al. 1981).
Impacts can include reduced coral recruitment (Loya
1976; Babcock and Davies 1991; Loya et al. 2004),
modified trophic structures (Lapointe 1997; Fabricius
2005), altered biodiversity (van Woesik et al. 1999)
and coral mortality (Ward and Harrison 2000;
Harrison and Ward 2001; Kline et al. 2006). Inter-
actions between increased coral bioerosion and
nutrient enrichment have been postulated over many
years (e.g. Hallock 1988) with a number of studies
showing a correlation between bioerosion and the
nutrient gradient across the GBR shelf (Sammarco
and Risk 1990; Risk et al. 1995), as well as under
experimental conditions (Kiene and Hutchings 1994;
Kiene 1997; Hutchings et al. 2005).
The role of increased nutrient regimes on coral
reefs and macroalgal structuring is a complex, and as
yet, not completely resolved interaction between
herbivoury and nutrient limitation (McCook 1999,
2001; McCook et al. 2001; Hughes et al. 2007; Jompa
and McCook 2002, 2003; Bellwood et al. 2004,
2006), with grazing pressure typically the dominant
controlling factor (Sotka and Hay 2009).
Further complicating these coral—algal—water
quality interactions are results which indicate that
organic compounds released by algae enhance micro-
bial activity on coral surfaces cause coral mortality
and algal overgrowth (Smith et al. 2006). Other water
quality factors such as dissolved organic carbon
concentrations and increased rates of bioerosion have
also been shown to be important in reef degradation
(Tribollet and Golubic 2005; Hutchings et al. 2005;
Kline et al. 2006).
Elevated nutrient concentrations can also be
deleterious to seagrasses by lowering ambient light
levels via the proliferation of local light absorbing
algae (including water column phytoplankton, ben-
thic macro algae or algal epiphytes). This loss of light
can reduce the amount of photosynthesis in seagrass-
es, particularly in deeper water (Walker et al. 1999).
Elevated nutrient concentrations can also cause
deleterious disruptions to nitrogen and phosphorus
metabolism in seagrass (Touchette and Burkholder
2000), although Australian seagrasses are generally
regarded as being nitrogen-limited.
Critically, more recent research shows that direct
interactions between nutrients species such as nitrate
and enhanced coral bleaching susceptibility will be
important as a clear example of direct synergy
between climate change stress and nutrient enrich-
ment stress (Wooldridge 2009a, b; Wooldridge and
Done 2009).
Eutrophication and coral reefs
The consequences of enhanced nutrient loading on
coral reefs, and hence ‘eutrophication’, have been
extensively studied following the well known case in
Kaneohe Bay, Hawaii (Smith et al. 1981). Large scale
sewage effluent inputs into Kaneohe Bay, which has
limited oceanic flushing, led to blooms of phyto-
plankton (Caperon et al., 1971), increased benthic
macroalgae biomass (Smith et al. 1981), increased
filter and deposit feeders (tube worms, sponges)
biomass (Kinsey 1988) and cryptofauna biomass
(Brock and Smith 1983) and consequent loss of live
coral (Smith et al. 1981). Removal of outfalls allowed
Biogeochemistry
123
an improvement in water quality (Laws and Allen
1996) and some regeneration of the reef (Hunter and
Evans 1995), although there had not been a complete
return to pre-outfall conditions by 2001 (Stimson
et al. 2001). Subsequently, macroalgae abundance in
the Bay may have declined permanently (Stimson
and Conklin 2008).
The Relative Dominance Model (RDM) (Littler
and Littler 1984) was derived from the Kaneohe
situation and numerous laboratory and field studies of
the effects of nutrients on coral reefs. In this model,
coral reefs respond to changing nutrient status and
grazing pressure to move to alternative states. These
alternative states include coralline algal dominance
with high grazing and high nutrients; fleshy macro-
alagal dominance with low grazing and high nutri-
ents; and turf algal dominance with low nutrients and
low grazing. The model has been tested many times
since its development in controlled field situations
(Smith et al. 2001; Lapointe et al. 2004; Littler et al.
2006), but its uniform applicability is still in dispute
(Hughes et al. 1999; Aronson and Precht 2000;
McClanahan and Graham 2005). One criticism of the
RDM is that the model ignores other consequences of
nutrient enrichment in coral reef ecosystems such as
increased phytoplankton biomass (blooms) and sub-
sequent benthic species composition shifts towards
filter feeders (such as sponges, tube worms and
ascidians) which can take advantage of increased
food supplies. In addition, the consequences of
changes in phytoplankton species composition result-
ing from nutrient enrichment such as population
shifts in organisms dependent on phytoplankton type
and biomass (including crown-of-thorns starfish
(Acanthaster planci) (Brodie et al. 2005, 2007)) are
not reflected in the model.
Eutrophication and the Great Barrier Reef
For the purposes of this paper, the term eutrophica-
tion refers to situations where nutrient enrichment,
increased algal growth and/or increased organic
production rates have resulted in change in benthic
community structure This definition is derived from
Bell et al. (2007) and international eutrophication
assessments (Foden et al. 2010). Recent discussions
and legal rulings within the uptake of European
directives have identified that eutrophication is a
multi-step process and therefore management focus is
on the detection of the potential undesirable ecolog-
ical consequences of nutrient enrichment rather than
the confirmation of desirable attributes of a well-
balanced naturally enriched system (Tett et al. 2007;
Foden et al. 2010). Thus the following discussion
presents examples of enrichment, increased produc-
tion and ecological disturbance as measured within
GBR waters.
Nutrient supply to GBR marine waters
Nutrient supply to the GBR includes a range of
sources including river discharges (Mitchell et al.
1997); urban stormwater and wastewater run-off
(Brodie 1995; Mitchell and Furnas 1997); atmo-
spheric inputs following rainfall events (Furnas et al.
1995); planktonic and microphytobenthic nitrogen
fixation (Furnas and Brodie 1996); deeper ocean
supply following Coral Sea upwelling (Furnas and
Mitchell 1986); deposition of dust from storms
generated in the interior of Australia (Shaw et al.
2008) and wind resuspension of nearshore sediments
and their associated nutrients (Walker and O’Donnell
1981; Gagan et al. 1987). However of these, riverine
discharge is the single largest source of nutrients to
inshore areas of the GBR (Furnas et al. 1997). This
nutrient increase is largely driven by the application
of fertilizer to crops grown in adjacent GBR catch-
ments. A proportion of the applied nutrients are
subsequently lost to surface and groundwaters and
eventually to the GBR (Rayment 2003). Additional
losses of particulate bound nutrients occur from
agricultural catchments where soil tillage, vegetation
clearing and reduced pasture cover leads to the loss of
natural nitrogen and phosphorus from the soil to
catchment waterways (Brodie and Mitchell 2005;
McKergow et al. 2005).
Contemporary estimates suggest that the total
nitrogen discharge to the GBR has increased from
14,000 tonnes year-1 in pre-development times
(prior to 1850) to a current discharge of 58,000 ton-
nes year-1; a four-fold increase (Brodie et al. 2009a).
The predominant form of the nitrogen that is
delivered to the GBR has also changed. Discharge
of nitrogen from natural landscapes is predominantly
in the form of dissolved organic nitrogen (DON)
(Harris 2001; Brodie and Mitchell 2005). This is still
Biogeochemistry
123

the case in undisturbed forest stream runoff in the
GBR catchment area (Brodie and Mitchell 2006),
however, nitrogen discharge from agricultural and
urban lands is dominated by dissolved inorganic
nitrogen (DIN = nitrate ? nitrite ? ammonium)
derived from fertiliser and sewage wastes, and
particulate nitrogen (PN) derived from soil erosion
(Brodie and Mitchell 2005). The shift from a
predominantly DON discharge in pre-1850 times to
a predominantly (bioavailable) PN and DIN dis-
charge in modern times has important consequences
for the effects of discharged nitrogen (Fabricius
2005). Change in land use has also led to the increase
in nitrate discharge in some individual catchments
being much larger relative to the increase in total
nitrogen discharge (e.g. in the Wet Tropics Region, it
is estimated to be 6 times in the Johnstone River
(Hunter and Walton 2008) and 10 times in Tully
River (Armour et al. 2009)). The larger increases in
the inorganic nitrogen fraction are associated with
intensive fertiliser use on sugarcane and banana crops
in these catchments.
Discharge of nutrients to the GBR, both particulate
and dissolved, occurs overwhelmingly during the
large river flood flows of the wet season (Mitchell
et al. 1997, 2005; Packett et al. 2009). More than 90%
of the nutrients sourced from the land enter the GBR
lagoon during this time as waterway concentrations
of the different forms of nitrogen and phosphorus
peak, and waterway flows are maximised (Mitchell
et al. 1997, 2005). At other times there is minimal
nutrient discharge from the land. High river flows
occur at a frequency of 0.25 per year for dry tropics
rivers including the Fitzroy and Burdekin Rivers to 3
Fig. 2 Hydrographs for the Burdekin River (top panel) and
Tully River (bottom panel) from 1989 to 2009 showing large
infrequent and variable events in the Burdekin River (dry
tropics) versus annual, comparatively smaller, similar sized
events in the Tully River (wet tropics)
Biogeochemistry
123
flows per year for wet tropics rivers such as the Tully.
These differences are evident in the hydrographs
shown in Fig. 2. High flow periods last only a few
weeks per year in all GBR rivers. During this period,
more than 80% of the nutrient load is discharged
from the Tully River and more than 98% of the
nutrient load from the Burdekin River. Strong
patterns of nutrient concentration within the high
flow periods are also obvious with high concentra-
tions in small first flush events at the beginning of the
wet season, high concentrations on the rising limb of
the hydrograph in major flows and lower concentra-
tions on the falling limb, and higher concentrations in
general in early wet season flows compared to late
wet season flows (Furnas 2003). All these factors
make nutrient loading to the GBR from rivers a
highly temporally variable process.
Fate and transformation of nutrients
in the GBR lagoon
Flooding river discharges into the GBR lagoon
typically form extensive plumes (Devlin et al.
2001), images of which are now regularly captured
by a wide variety of satellite sensors including
SeaWiFS, MODIS and MERIS (Brodie et al. 2010;
Devlin and Schaffelke 2009). Short-term concentra-
tions of both particulate and dissolved nutrients are
extreme (in the range 2–30 lM nitrogen and
0.1–1 lM phosphorus) (Devlin and Brodie 2005).
Particulate nutrients are initially transported only
short distances from the river mouth before ‘settling
out’ from the plume through gravity controlled
processes, as well as through flocculation of fine
particles into larger ones which then also settle out
(Lewis et al. 2006). In contrast, dissolved nutrients
from the river discharge disperse widely in the GBR
lagoon before being taken up as biomass in phyto-
plankton blooms which are transported across the
shelf and into the Coral Sea. Figure 3 shows the
progression of a plume arising from multiple rivers in
the Wet Tropics region into the Coral Sea over about
6 days. The plume is initially dominated by terrestrial
particulate matter which settles out and the plume
becomes defined by a dissolved nutrient driven
phytoplankton bloom. The plume is visible due to
the presence of suspended sediment, phytoplankton
and Coloured Dissolved Organic Matter (CDOM).
Inner-shelf reefs of the Wet Tropics region are
exposed regularly (one to three times per year) to a
mixture of land sourced particulate and dissolved
inorganic nutrients. Reefs situated a greater distance
offshore in the same region are exposed less
frequently to particulate nutrient fluxes, However,
they are exposed regularly to nutrients derived
mainly from secondary algal growth driven by
terrestrially sourced dissolved nutrients (Devlin and
Schaffelke 2009). In contrast, mid and outer shelf
reefs in the drier southern part of the GBR are rarely
exposed to terrestrial nutrients due to larger distances
from the coast and lower ambient rainfall regimes.
Effects of elevated nutrients in the GBR
The waters of the GBR are characterised by high
ambient light intensities and water temperatures and
as a consequence, available nutrients are rapidly
converted to organic matter by phytoplankton, par-
ticularly in inter-reef regions (Furnas et al. 2005).
These recycled and transformed nutrients largely
determine the (nutrient) water quality status of these
waters and any impacts on benthic organisms.
Phytoplankton biomass measured as chlorophyll
a concentrations are 2–3 times higher in inshore
waters of the central and southern GBR
(0.3–0.7 lg l-1) compared to areas in the northern
GBR (0.2 lg l-1) (Brodie et al. 2007). In addition,
phytoplankton biomass measured as chlorophyll
a concentrations in the central and southern GBR in
flood plume conditions are typically in the range of
1–20 lg l-1 (Devlin and Brodie 2005; Devlin and
Schaffelke 2009; Brodie et al. 2010). These values
are believed to reflect nutrient enrichment, attribut-
able to terrestrial nutrient discharge from central and
southern rivers associated with large scale activities.
Increases in land sourced nitrogen and phosphorus
flux and the bioavailable nutrient species in the GBR
lagoon drive the proliferation of extensive phyto-
plankton blooms following flood discharge (Fig. 3)
(Brodie and Mitchell 2005, 2006).
A change in the speciation of phytoplankton has
also probably occurred in GBR waters, although this
is a relatively new research area. The ‘normal’
phytoplankton community of the lagoon is dominated
by picoplankton, specifically the cyanobacteria Syn-
echococcus and Prochlorococcus (Crosbie and
Biogeochemistry
123

Furnas 2001; Furnas et al. 2005). The larger cyano-
bacteria Trichodesmium sp. are also common in
slicks at certain times of the year. It is postulated that
nitrogen fixation by Trichodesmium could be stimu-
lated by increases in river borne nutrients such as
phosphorus and iron thus leading to even greater
inputs of ‘new’ nitrogen to the system (Bell et al.
1999). It has been clearly shown that Trichodesmium
blooms follow nitrogen and phosphorus enrichment
events and temperatures above 26�C in Pacific
lagoons (Rodier and Le Borgne 2008). In the past,
low concentrations of bioavailable nitrogen and
phosphorus in river discharges would have had
minimal impact on phytoplankton speciation shifts.
Increased contemporary concentrations of DIN and
sometimes dissolved inorganic phosphorus (DIP) in
flood plumes tend to promote phytoplankton species
shifts to larger species of diatoms and dinoflagellates
(Furnas et al. 2005; Heimann pers com). This nutrient
induced shift which is most obviously seen and
documented in flood plume conditions is similar to
that noted in similar situations in tropical locations
including Singapore (Gin et al. 2000), Japan (Tada
et al. 2003), Curacao (van Duyl et al. 2002), New
Caledonia (Jacquet et al. 2006; Tenorio et al. 2005),
Hawaii (Cox et al. 2006), Moorea (Delesalle et al.
1993) and in experimental studies (Hopcroft and Roff
2003). The shift in phytoplankton species composi-
tion under nutrient enriched conditions has implica-
tions for other trophic levels, the most important in
the GBR is likely to be the promotion of crown of
thorns starfish larval survival (Brodie et al. 2005;
Fabricius et al. 2010).
Increased delivery of nutrients to the GBR is also
believed to have enriched the central and southern
sections of the Marine Park. This is shown most
clearly by chlorophyll a concentrations (Brodie et al.
2007) where the more ‘pristine’ coastal waters
Fig. 3 Progression (a–c) of a multiple river plume in the Wet
Tropics (Feb, 2007) extending from the coast to beyond the
outer reef. The lines show the outer edge of the plume made
visible due to Coloured Dissolved Organic Matter and
phytoplankton. Images (a–c) show the transformation from a
plume dominated by terrestrial particulate matter into a plume
dominated by a dissolved nutrient driven phytoplankton bloom.
Image courtesy of CSIRO
Biogeochemistry
123

adjacent to the Northern Cape York catchment have
similar relatively low mean chlorophyll a concentra-
tions in both inshore and offshore waters
(0.2 lg l-1). In contrast, inshore areas south of
Cooktown have elevated mean chlorophyll a concen-
trations (0.3–0.7 lg l-1). Other indicators using
direct nutrient concentrations (Nutrient Threshold
Criteria) also suggest much of the inshore GBR is
nitrified (Bell et al. 2007) and that chlorophyll
a concentrations normally exceed water quality
guideline values across large areas of the GBR
(Fig. 4) (De’ath and Fabricius 2008; Great Barrier
Reef Marine Park Authority 2009). It is estimated
that the area of the GBR that exceeds the guideline
value of 0.45 lg l-1 for chlorophyll a is 10–15%
(approximately 50,000 km2) of the total area of the
Marine Park and 40–50% of the defined inshore area.
Currently macroalgal abundance is high on many
inshore reefs of the GBR in the monitored area south
of Cooktown, (Thompson et al. 2010; Schaffelke
et al. 2009; De’ath and Fabricius 2008; Wismer et al.
2009) but controversy still exists as to its cause. This
includes areas within the Wet Tropics (offshore from
the Tully and Herbert Rivers) and Burdekin Regions
Fig. 4 Chlorophyll
concentrations in reference
to the GBR Water Quality
Guideline. Locations that
are presently at less than
(green/dark grey) or exceed
(orange/light grey and red/black) the guideline trigger
value of a maximum annual
mean of 0.45 lg l-1
chlorophyll. Orange/lightgrey zones show areas that
exceed the guideline trigger
values, having chlorophyll
values of 0.45–0.8 lg l-1.
Red/black zones show areas
of greatest concern with
[0.8 lg l-1 chlorophyll.
The level of fading (rightpanel) indicates the level of
confidence in the estimates
with faded areas being more
uncertain. Extracted from
De’ath and Fabricius (2008)
(Color figure online)
Biogeochemistry
123

where high levels of macroalgal cover and low coral
cover (and coral biodiversity) dominates inshore reefs
and water quality is characterised by high chlorophyll
values and sporadic high turbidity due to wind-driven
resuspension (Thompson et al. 2010). This contrasts
with inshore reefs off Cape York in a lower nutrient
environment which typically have low macroalgal
cover and higher coral cover (Fabricius et al. 2005;
Devantier et al. 2006). In the Mackay Whitsunday
region reefs typically have higher macroalgal cover
in areas of river sourced high nutrient status (but low
river sourced suspended sediment status) in compar-
ison to reefs further offshore not strongly affected by
river sourced nutrients (Jupiter et al. 2008; Thompson
et al. 2010). An analysis of macroalgal cover versus
fish herbivore biomass on transects across the central
and north-central GBR showed that macroalgal cover
was high inshore and lower offshore in contrast to
fish herbivore biomass which was lower on inshore
reefs (Wismer et al. 2009). The range of opinions as
to why high macroalgal cover exists on inshore reefs
in some areas south of Cooktown include (a)
represents a natural state, (b) a result of nutrient
enrichment (Bell et al. 2007), (c) a result of reduced
grazing fish populations, (d) a combination of nutri-
ent enrichment and reduced grazing fish populations,
or (e) a more complex situation involving combined
effects of acute coral mortality following cyclone
damage, bleaching and COTs outbreaks followed by
rapid macro and turf algal growth and subsequent
failure of coral recovery due to poor water quality
(Thompson et al. 2010; Schaffelke et al. 2009;
Fabricius et al. 2005).
Assessing eutrophication in the GBR
A more complete analysis of the complex effects of
nutrient loading in coral reef ecosystems has been
reviewed by Fabricius (2005) and includes other
confounding terrestrial pollutants such as suspended
sediments. Overall it is clear that nutrification and
subsequent eutrophication present quite different
symptoms and consequences in tropical coral reef
ecosystems compared with temperate marine ecosys-
tems (Rabalais 2002). This has to be considered when
looking for ‘traditional’ (i.e. temperate) indicators of
eutrophication e.g. dissolved oxygen sags, in a
tropical coral reef system versus the known indicators
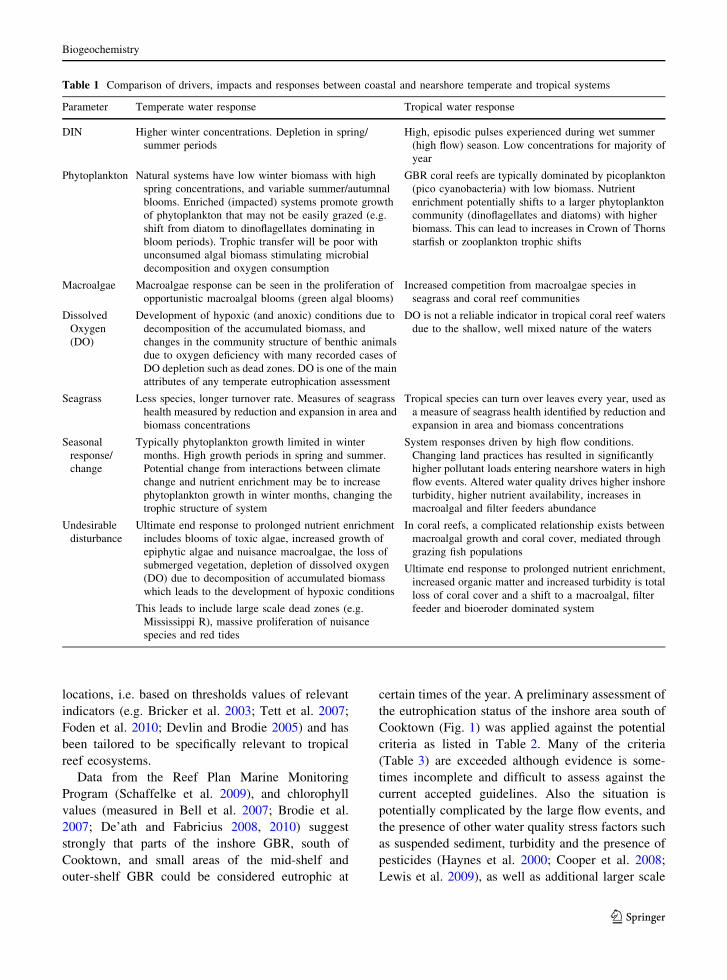
of coral reef response. A number of parameters that
can indicate eutrophication are presented in Table 1
and demonstrate the difference between temperate
and tropical systems. This list is not exhaustive but
presents the most well known and visible symptoms
of nutrient enrichment.
Eutrophication in temperate marine waters is a
distinctly different phenomenon than in tropical coral
reef waters with a strong seasonal influence. Tem-
perate waters experience strong spring and summer
growth periods and lower production in the colder
shorter days. Tropical monsoonal climates are
strongly influenced by the change from dry to wet
seasons. These climatic differences have a substan-
tive impact on the eutrophication process and the
changes that may occur. These differences have been
analysed to identify appropriate indicators for the
assessment of eutrophication in coral reef waters.
The problems of defining exactly when a system is
‘eutrophic’ remain, especially in tropical and coral
reef systems where a different set of criteria need to
be used compared to temperate systems. Bell et al.
(2007) defines eutrophication from the Nutrient
Threshold Criteria (NTC) as ‘a situation where
nutrient enrichment increases algal growth/organic
production rates to the extent that changes in the
benthic community structure have begun e.g.,
replacement of hermatypic corals with coralline
algae, filamentous algae, macroalgae, and/or a variety
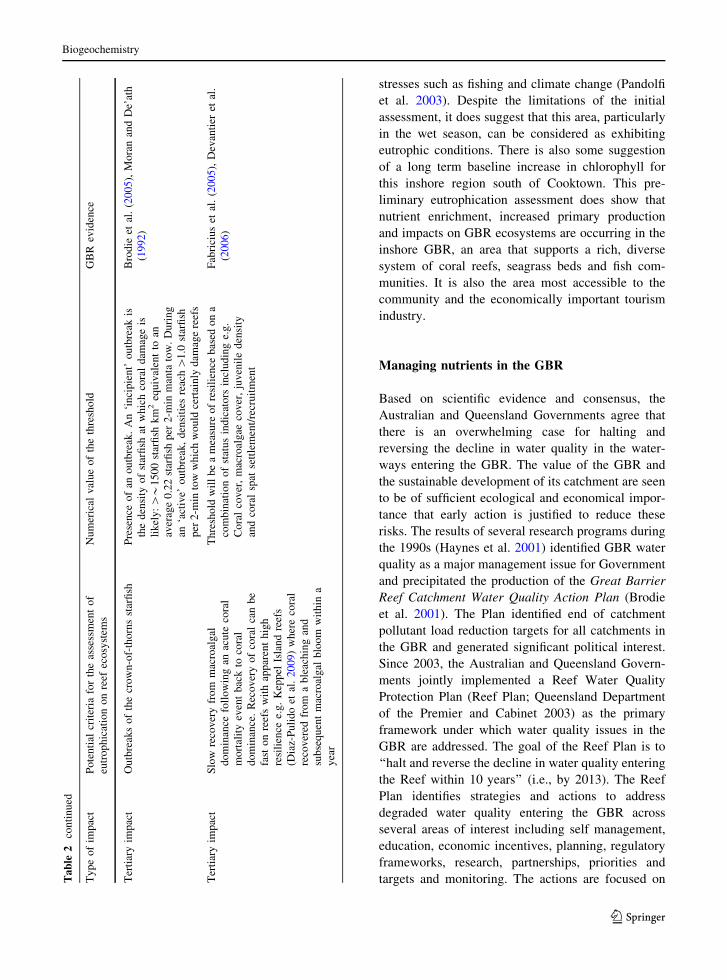
of filter feeders’. Given the proposed link between
nutrient enrichment and crown-of-thorns starfish
outbreaks (Brodie et al. 2005, 2007; Fabricius et al.
2010), and nutrient enrichment and increases in some
forms of bioerosion (Hutchings et al. 2005) it is
possible to collate a list of coral reefs eutrophication
criteria (Table 2). These preliminary criteria provide
a first assessment of the characteristics of eutrophi-
cation in the GBR. Preliminary thresholds have been
defined and included, and are based on reliability of
measurement, strong correlative link with nutrient
enrichment and where possible, are linked to indica-
tors that are measured in current research programs
(e.g. Cooper et al. 2007, 2008), such as the Reef
Rescue Marine Monitoring Program (Schaffelke et al.
2009; McKenzie and Unsworth 2009) and the Great
Barrier Reef Long Term Monitoring Program (Sweat-
man et al. 2005). The proposed thresholds are
preliminary and will be refined over time. The
approach is comparable to assessments in other
Biogeochemistry
123
locations, i.e. based on thresholds values of relevant
indicators (e.g. Bricker et al. 2003; Tett et al. 2007;
Foden et al. 2010; Devlin and Brodie 2005) and has
been tailored to be specifically relevant to tropical
reef ecosystems.
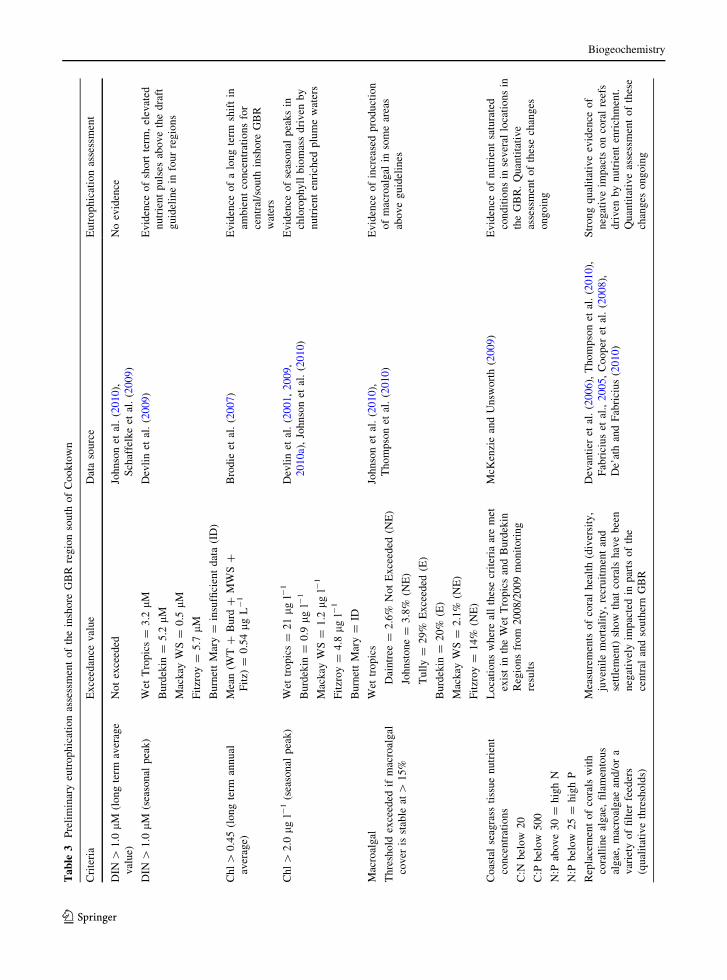
Data from the Reef Plan Marine Monitoring
Program (Schaffelke et al. 2009), and chlorophyll
values (measured in Bell et al. 2007; Brodie et al.
2007; De’ath and Fabricius 2008, 2010) suggest
strongly that parts of the inshore GBR, south of
Cooktown, and small areas of the mid-shelf and
outer-shelf GBR could be considered eutrophic at
certain times of the year. A preliminary assessment of
the eutrophication status of the inshore area south of
Cooktown (Fig. 1) was applied against the potential
criteria as listed in Table 2. Many of the criteria
(Table 3) are exceeded although evidence is some-
times incomplete and difficult to assess against the
current accepted guidelines. Also the situation is
potentially complicated by the large flow events, and
the presence of other water quality stress factors such
as suspended sediment, turbidity and the presence of
pesticides (Haynes et al. 2000; Cooper et al. 2008;
Lewis et al. 2009), as well as additional larger scale
Table 1 Comparison of drivers, impacts and responses between coastal and nearshore temperate and tropical systems
Parameter Temperate water response Tropical water response
DIN Higher winter concentrations. Depletion in spring/
summer periods
High, episodic pulses experienced during wet summer
(high flow) season. Low concentrations for majority of
year
Phytoplankton Natural systems have low winter biomass with high
spring concentrations, and variable summer/autumnal
blooms. Enriched (impacted) systems promote growth
of phytoplankton that may not be easily grazed (e.g.
shift from diatom to dinoflagellates dominating in
bloom periods). Trophic transfer will be poor with
unconsumed algal biomass stimulating microbial
decomposition and oxygen consumption
GBR coral reefs are typically dominated by picoplankton
(pico cyanobacteria) with low biomass. Nutrient
enrichment potentially shifts to a larger phytoplankton
community (dinoflagellates and diatoms) with higher
biomass. This can lead to increases in Crown of Thorns
starfish or zooplankton trophic shifts
Macroalgae Macroalgae response can be seen in the proliferation of
opportunistic macroalgal blooms (green algal blooms)
Increased competition from macroalgae species in
seagrass and coral reef communities
Dissolved
Oxygen
(DO)
Development of hypoxic (and anoxic) conditions due to
decomposition of the accumulated biomass, and
changes in the community structure of benthic animals
due to oxygen deficiency with many recorded cases of
DO depletion such as dead zones. DO is one of the main
attributes of any temperate eutrophication assessment
DO is not a reliable indicator in tropical coral reef waters
due to the shallow, well mixed nature of the waters
Seagrass Less species, longer turnover rate. Measures of seagrass
health measured by reduction and expansion in area and
biomass concentrations
Tropical species can turn over leaves every year, used as
a measure of seagrass health identified by reduction and
expansion in area and biomass concentrations
Seasonal
response/
change
Typically phytoplankton growth limited in winter
months. High growth periods in spring and summer.
Potential change from interactions between climate
change and nutrient enrichment may be to increase
phytoplankton growth in winter months, changing the
trophic structure of system
System responses driven by high flow conditions.
Changing land practices has resulted in significantly
higher pollutant loads entering nearshore waters in high
flow events. Altered water quality drives higher inshore
turbidity, higher nutrient availability, increases in
macroalgal and filter feeders abundance
Undesirable
disturbance
Ultimate end response to prolonged nutrient enrichment
includes blooms of toxic algae, increased growth of
epiphytic algae and nuisance macroalgae, the loss of
submerged vegetation, depletion of dissolved oxygen
(DO) due to decomposition of accumulated biomass
which leads to the development of hypoxic conditions
This leads to include large scale dead zones (e.g.
Mississippi R), massive proliferation of nuisance
species and red tides
In coral reefs, a complicated relationship exists between
macroalgal growth and coral cover, mediated through
grazing fish populations
Ultimate end response to prolonged nutrient enrichment,
increased organic matter and increased turbidity is total
loss of coral cover and a shift to a macroalgal, filter
feeder and bioeroder dominated system
Biogeochemistry
123

Ta
ble
2P
reli
min
ary
ind
icat
ors
and
thre
sho
lds
for
esta
bli
shin
ga
set
of
crit
eria
toas
sess
eutr
op
hic
atio
nin
the
GB
R
Ty
pe
of
imp
act
Po
ten
tial
crit
eria
for
the
asse
ssm
ent
of
eutr
op
hic
atio
no
nre
efec
osy
stem
s
Nu
mer
ical
val
ue
of
the
thre
sho
ldG
BR
evid
ence
Dri
ver
Nu
trie
nt
con
cen
trat
ion
sab
ov
eth
e
Nu
trie
nt
Th
resh
old
Co
nce
ntr
atio
n
(NT
C)
DIN
1lM
DIP
0.2
lM
Bel
let
al.
(20
07
),L
apo
inte
(19
97
)
Pri
mar
yim
pac
tA
nn
ual
aver
age
(am
bie
nt
and
pu
lsed
)
chlo
rop
hy
lla
con
cen
trat
ion
sab
ov
eth
e
NT
Can
dfo
rth
eG
BR
abo
ve
the
GB
R
wat
erq
ual
ity
gu
idel
ines
(ev
iden
ceo
f
lon
gte
rmre
gim
esh
ift)
Ch
l0
.5lg
l-1
(NT
C)
0.4
5l
gl-
1(G
BR
MP
Ag
uid
elin
es)
Bel
let
al.
(20
07
),B
rod
ieet
al.
(20
05
),
GB
RM
PA
(20
09
),D
e’at
han
dF
abri
ciu
s
(20
08
,2
01
0)
Pri
mar
yim
pac
tS
easo
nal
pea
kco
nce
ntr
atio
ns:
inte
nse
and
exte
nsi
ve
ph
yto
pla
nk
ton
blo
om
s
foll
ow
ing
nu
trie
nt
enri
ched
riv
er
dis
char
ge
even
tsw
ith
chlo
rop
hy
ll
aco
nce
ntr
atio
ns
4–
10
0ti
mes
abo
ve
the
GB
Rw
ater
qu
alit
yg
uid
elin
es.
Mea
sure
men
to
fse
ver
ity
of
exce
edan
ce
(th
resh
old
un
der
dev
elo
pm
ent)
Ch
l2
.0lg
l-1
(dra
ftg
uid
elin
eu
nd
erd
evel
op
men
t)
Are
aan
dp
erio
do
fex
po
sure
wil
lb
ed
evel
op
edfr
om
on
go
ing
spat
ial
asse
ssm
ents
of
terr
estr
ial
infl
uen
ce.
De’
ath
and
Fab
rici
us
(20
10
),D
evli
nan
d
Bro
die
(20
05
),B
rod
ieet
al.
(20
10)
Pri
mar
yim
pac
tE
xce
ssiv
em
acro
alg
alab
un
dan
ceo
nre
efs
wit
hh
igh
nu
trie
nt
inp
uts
Th
resh
old
exce
eded
ifm
acro
alg
alco
ver
isst
able
at
[1
5%
or
cov
erin
crea
sed
fro
mth
ep
rev
iou
sy
ear,
or
cov
erd
ecre
ased
fro
ma
cov
er[
20
%
Sch
affe
lke
etal
.(2
00
9),
Th
om
pso
net
al.
(20
10
),D
e’at
han
dF
abri
ciu
s(2
00
8),
Jup
iter
etal
.(2
00
8),
Wis
mer
etal
.
(20
09
)
Sec
on
dar
yim
pac
tC
oas
tal
seag
rass
tiss
ue
nu
trie
nt
con
cen
trat
ion
s—B
urd
ekin
and
Wet
Tro
pic
sR
egio
ns
(ref
erF
ig.
1fo
r
loca
tio
ns)
C:N
bel
ow
20
(lo
wli
gh
t)
C:P
bel
ow
50
0(l
arg
eP
po
ol)
N:P
abo
ve
30
=h
igh
N
N:P
bel
ow
25
=h
igh
P
Mel
lors
etal
.(2
00
5),
McK
enzi
ean
d
Un
swo
rth
(20
09
)
Sec
on
dar
yim
pac
tR
epla
cem
ent
of
cora
lsw
ith
cora
llin
e
alg
ae,
fila
men
tou
sal
gae
,m
acro
alg
ae
and
/or
av
arie
tyo
ffi
lter
feed
ers
Th
ese
thre
sho
lds
con
sist
ing
of
mea
sure
dco
ral
cov
er
and
spec
ies
div
ersi
tyv
ersu
sal
gal
cov
erv
ersu
s
filt
erfe
eder
abu
nd
ance
are
stil
lu
nd
erd
evel
op
men
t
van
Wo
esik
etal
.(1
99
9),
Co
op
eret
al.
(20
07
),F
abri
ciu
set
al.
(20
05),
Dev
anti
eret
al.
(20
06
),S
chaf
felk
eet
al.
(20
09
),T
ho
mp
son
etal
.(2
01
0)
Ter
tiar
yim
pac
tB
ioer
osi
on
of
cora
lin
nu
trie
nt
enri
ched
area
s
To
tal
inte
rnal
bio
ero
sio
no
fA
cro
po
rah
igh
ly
var
iab
lew
ith
dif
fere
nce
sb
etw
een
nea
rsh
ore
(4%
),
mid
-sh
elf
(12
%)
Inte
rnal
bio
ero
sio
nin
liv
ing
Po
rite
s1
1%
on
nea
rsh
ore
reef
s,1
.3%
on
ou
ter
reef
s
Th
resh
old
sco
uld
be
dev
elo
ped
bas
edo
nth
ese
val
ues
Ris
ket
al.(1
99
5),
Hu
tch
ing
set
al.(2
00
5),
Sam
mar
coan
dR
isk
(19
90
)
Biogeochemistry
123
stresses such as fishing and climate change (Pandolfi
et al. 2003). Despite the limitations of the initial
assessment, it does suggest that this area, particularly
in the wet season, can be considered as exhibiting
eutrophic conditions. There is also some suggestion
of a long term baseline increase in chlorophyll for
this inshore region south of Cooktown. This pre-
liminary eutrophication assessment does show that
nutrient enrichment, increased primary production
and impacts on GBR ecosystems are occurring in the
inshore GBR, an area that supports a rich, diverse
system of coral reefs, seagrass beds and fish com-
munities. It is also the area most accessible to the
community and the economically important tourism
industry.
Managing nutrients in the GBR
Based on scientific evidence and consensus, the
Australian and Queensland Governments agree that
there is an overwhelming case for halting and
reversing the decline in water quality in the water-
ways entering the GBR. The value of the GBR and
the sustainable development of its catchment are seen
to be of sufficient ecological and economical impor-
tance that early action is justified to reduce these
risks. The results of several research programs during
the 1990s (Haynes et al. 2001) identified GBR water
quality as a major management issue for Government
and precipitated the production of the Great Barrier
Reef Catchment Water Quality Action Plan (Brodie
et al. 2001). The Plan identified end of catchment
pollutant load reduction targets for all catchments in
the GBR and generated significant political interest.
Since 2003, the Australian and Queensland Govern-
ments jointly implemented a Reef Water Quality
Protection Plan (Reef Plan; Queensland Department
of the Premier and Cabinet 2003) as the primary
framework under which water quality issues in the
GBR are addressed. The goal of the Reef Plan is to
‘‘halt and reverse the decline in water quality entering
the Reef within 10 years’’ (i.e., by 2013). The Reef
Plan identifies strategies and actions to address
degraded water quality entering the GBR across
several areas of interest including self management,
education, economic incentives, planning, regulatory
frameworks, research, partnerships, priorities and
targets and monitoring. The actions are focused onTa
ble
2co
nti
nu
ed
Ty
pe
of
imp
act
Po
ten
tial
crit
eria
for
the
asse
ssm
ent
of
eutr
op
hic
atio
no
nre
efec
osy
stem
s
Nu
mer
ical
val
ue
of
the
thre
sho
ldG
BR
evid
ence
Ter
tiar
yim
pac
tO
utb
reak
so
fth
ecr
ow
n-o
f-th
orn
sst
arfi
shP
rese
nce
of
ano
utb
reak
.A
n‘i
nci
pie
nt’
ou
tbre
akis
the
den
sity
of
star
fish
atw
hic
hco
ral
dam
age
is
lik
ely
:[*
15
00
star
fish
km
2eq
uiv
alen
tto
an
aver
age
0.2
2st
arfi
shp
er2
-min
man
tato
w.
Du
rin
g
an‘a
ctiv
e’o
utb
reak
,d
ensi
ties
reac
h[
1.0
star
fish
per
2-m
into
ww
hic
hw
ou
ldce
rtai
nly
dam
age
reef
s
Bro
die
etal
.(2
00
5),
Mo
ran
and
De’
ath
(19
92
)
Ter
tiar
yim
pac
tS
low
reco
ver
yfr
om
mac
roal
gal
do
min
ance
foll
ow
ing
anac
ute
cora
l
mo
rtal
ity
even
tb
ack
toco
ral
do
min
ance
.R
eco
ver
yo
fco
ral
can
be
fast
on
reef
sw
ith
app
aren
th
igh
resi
lien
cee.
g.
Kep
pel
Isla
nd
reef
s
(Dia
z-P
uli
do
etal
.2
00
9)
wh
ere
cora
l
reco
ver
edfr
om
ab
leac
hin
gan
d
sub
seq
uen
tm
acro
alg
alb
loo
mw
ith
ina
yea
r
Th
resh
old
wil
lb
ea
mea
sure
of
resi
lien
ceb
ased
on
a
com
bin
atio
no
fst
atu
sin
dic
ato
rsin
clu
din
ge.
g.
Co
ral
cov
er,
mac
roal
gae
cov
er,
juv
enil
ed
ensi
ty
and
cora
lsp
atse
ttle
men
t/re
cru
itm
ent
Fab
rici
us
etal
.(2
00
5),
Dev
anti
eret
al.
(20
06
)
Biogeochemistry
123
Ta
ble
3P
reli
min
ary
eutr
op
hic
atio
nas
sess
men
to
fth
ein
sho
reG
BR
reg
ion
sou
tho
fC
oo
kto
wn
Cri
teri
aE
xce
edan
cev
alu
eD
ata
sou
rce
Eu
tro
ph
icat
ion
asse
ssm
ent
DIN
[1
.0lM
(lo
ng
term
aver
age
val
ue)
No
tex
ceed
edJo
hn
son
etal
.(2
01
0),
Sch
affe
lke
etal
.(2
00
9)
No
evid
ence
DIN
[1
.0lM
(sea
son
alp
eak
)W
etT
rop
ics
=3
.2l
M
Bu
rdek
in=
5.2
lM
Mac
kay
WS
=0
.5lM
Fit
zro
y=
5.7
lM
Bu
rnet
tM
ary
=in
suffi
cien
td
ata
(ID
)
Dev
lin
etal
.(2
00
9)
Ev
iden
ceo
fsh
ort
term
,el
evat
ed
nu
trie
nt
pu
lses
abo
ve
the
dra
ft
gu
idel
ine
info
ur
reg
ion
s
Ch
l[0
.45
(lo
ng
term
ann
ual
aver
age)
Mea
n(W
T?
Bu
rd?
MW
S?
Fit
z)=
0.5
4lg
L-
1B
rod
ieet
al.
(20
07)
Ev
iden
ceo
fa
lon
gte
rmsh
ift
in
amb
ien
tco
nce
ntr
atio
ns
for
cen
tral
/so
uth
insh
ore
GB
R
wat
ers
Ch
l[2
.0l
gl-
1(s
easo
nal
pea
k)
Wet
tro
pic
s=
21
lg
l-1
Bu
rdek
in=
0.9
lgl-
1
Mac
kay
WS
=1
.2lg
l-1
Fit
zro
y=
4.8
lg
l-1
Bu
rnet
tM
ary
=ID
Dev
lin
etal
.(2
00
1,
20
09
,
20
10
a),
Joh
nso
net
al.
(20
10)
Ev
iden
ceo
fse
aso
nal
pea
ks
in
chlo
rop
hy
llb
iom
ass
dri
ven
by
nu
trie
nt
enri
ched
plu
me
wat
ers
Mac
roal
gal
Wet
tro
pic
s
Dai
ntr
ee=
2.6
%N
ot
Ex
ceed
ed(N
E)
Joh
nst
on
e=
3.8
%(N
E)
Tu
lly
=2
9%
Ex
ceed
ed(E
)
Bu
rdek
in=
20
%(E
)
Mac
kay
WS
=2
.1%
(NE
)
Fit
zro
y=
14
%(N
E)
Joh
nso
net
al.
(20
10
),
Th
om
pso
net
al.
(20
10
)
Ev
iden
ceo
fin
crea
sed
pro
du
ctio
n
of
mac
roal
gal
inso
me
area
s
abo
ve
gu
idel
ines
Th
resh
old
exce
eded
ifm
acro
alg
al
cov
eris
stab
leat
[1
5%
Co
asta
lse
agra
ssti
ssu
en
utr
ien
t
con
cen
trat
ion
s
C:N
bel
ow
20
C:P
bel
ow
50
0
N:P
abo
ve
30
=h
igh
N
N:P
bel
ow
25
=h
igh
P
Lo
cati
on
sw
her
eal
lth
ese
crit
eria
are
met
exis
tin
the
Wet
Tro
pic
san
dB
urd
ekin
Reg
ion
sfr
om
20
08
/20
09
mo
nit
ori
ng
resu
lts
McK
enzi
ean
dU
nsw
ort
h(2
00
9)
Ev
iden
ceo
fn
utr
ien
tsa
tura
ted
con
dit
ion
sin
sev
eral
loca
tio
ns
in
the
GB
R.
Qu
anti
tati
ve
asse
ssm
ent
of
thes
ech
ang
es
on
go
ing
Rep
lace
men
to
fco
rals
wit
h
cora
llin
eal
gae
,fi
lam
ento
us
alg
ae,
mac
roal
gae
and
/or
a
var
iety
of
filt
erfe
eder
s
(qu
alit
ativ
eth
resh
old
s)
Mea
sure
men
tso
fco
ral
hea
lth
(div
ersi
ty,
juv
enil
em
ort
alit
y,
recr
uit
men
tan
d
sett
lem
ent)
sho
wth
atco
rals
hav
eb
een
neg
ativ
ely
imp
acte
din
par
tso
fth
e
cen
tral
and
sou
ther
nG
BR
Dev
anti
eret
al.
(20
06
),T
ho
mp
son
etal
.(2
01
0),
Fab
rici
us
etal
.,2
00
5,
Co
op
eret
al.
(20
08),
De’
ath
and
Fab
rici
us
(20
10
)
Str
on
gq
ual
itat
ive
evid
ence
of
neg
ativ
eim
pac
tso
nco
ral
reef
s
dri
ven
by
nu
trie
nt
enri
chm
ent.
Qu
anti
tati
ve
asse
ssm
ent
of
thes
e
chan
ges
on
go
ing
Biogeochemistry
123

sediment, nutrient and pesticide management in the
GBR catchments. As the Reef Plan approached its
five-year (half-way) mark there was recognition of
the need to begin to implement land management
actions rather than just further planning. This was
proposed to be done through improved partnership
arrangements and an injection of significant funding.
In late 2007, the Australian Government committed
A$200 million over 5 years for a Reef Rescue
program ‘to tackle climate change and improve water
quality in the Great Barrier Reef’ (Australian Gov-
ernment 2007). This package included substantial
funding (A$146 million) for a Water Quality Grants
Scheme (for improved land management practices),
and supporting monitoring, reporting and research
programs, with additional funding to build partner-
ships. Many of the land management practices
supported through the program are targeted at
reducing nutrient runoff to the GBR.
In 2009 the Reef Plan was revised and updated
(DPC 2009). This was supported by a scientific
discussion paper, which updated current consensus of
the status of water quality in the GBR (Brodie et al.
2008a, b). The statement reiterated the importance of
water quality to ensure long term resilience of the
GBR, particularly in the face of climate change, and
presented evidence of the need to increase efforts to
reduce the amount of nutrients, sediments and
pesticides entering the GBR. In response to this
evidence, the 2009 Reef Plan includes an additional
long term goal to ensure that by 2020 the quality of
water quality entering the GBR from adjacent
catchments has no detrimental impact on the health
and resilience of the GBR. Achievement of the Reef
Plan goals will be assessed against quantitative
targets established for land management and water
quality outcomes (defined as end of catchment
pollutant load reductions). These are largely compli-
mentary to a set of targets designed to assess
performance of the Reef Rescue investment and set
a 50% reduction in nitrogen and phosphorus loads at
end of catchments by 2013 (relative to the flow
normalized loads estimated in 2009). The Reef
Rescue targets specify different reductions for dis-
solved and particulate nutrients (25 and 10% respec-
tively) to reflect management priorities. Within GBR
waters, water quality guidelines that have been
defined to sustain the health of GBR ecosystems
have been developed included regionally specific andTa
ble
3co
nti
nu
ed
Cri
teri
aE
xce
edan
cev
alu
eD
ata
sou
rce
Eu
tro
ph
icat
ion
asse
ssm
ent
Bio
ero
sio
no
fco
ral
inn
utr
ien
t
enri
ched
area
s
No
on
go
ing
asse
ssm
ent
dat
aR
isk
etal
.(1
99
5),
Hu
tch
ing
set
al.
(20
05
)S
om
eq
ual
itat
ive
evid
ence
of
bio
ero
sio
no
ccu
rrin
gin
cen
tral
GB
Rre
efs
Ou
tbre
aks
of
the
cro
wn
-of-
tho
rns
star
fish
Mu
ltip
leo
utb
reak
so
ccu
rred
bet
wee
n
Liz
ard
Isla
nd
and
Mac
kay
inth
eth
ird
wav
eo
fC
OT
So
utb
reak
s(1
99
3–
20
08
)
Bro
die
etal
.(2
00
5),
Mo
ran
and
De’
ath
(19
92
),
Sw
eatm
anet
al.
(20
08)
Str
on
gev
iden
ceo
nth
ein
crea
sein
ph
yto
pla
nk
ton
bio
mas
san
dth
e
shif
tb
etw
een
smal
ler
pic
op
lan
kto
nco
mm
un
ity
to
larg
erp
hy
top
lan
kto
n(d
iato
ms
and
din
ofl
agel
late
s)re
sult
ing
in
incr
ease
sin
pre
fere
nti
alfo
od
for
CO
TS
larv
ae
Slo
wre
cov
ery
fro
mm
acro
alg
al
do
min
ance
foll
ow
ing
anac
ute
cora
lm
ort
alit
yev
ent
bac
kto
cora
ld
om
inan
ce
On
go
ing
asse
ssm
ent
of
reco
ver
yu
nd
er
Mar
ine
Mo
nit
ori
ng
pro
gra
m.
No
t
qu
anti
fied
and
pu
bli
shed
asy
et
Cri
teri
aar
eta
ken
fro
mth
ep
ote
nti
alC
rite
ria
list
edfo
rth
eas
sess
men
to
feu
tro
ph
icat
ion
on
reef
eco
syst
ems
(Tab
le2
)
Biogeochemistry
123
cross shelf guidelines for nutrients and chlorophyll
(Great Barrier Reef Marine Park Authority 2009).
As part of the revision of the Reef Plan, the
Queensland Government pursued the development of
regulation for the management of agriculture in GBR
catchments, with a focus on sugar cane and grazing
land management practices. The Reef Protection Act
has now been passed through the Queensland Parlia-
ment and implementation of the Regulations which
accompany the Act are now underway.
Monitoring and evaluation
Several monitoring programs have been operating in
the GBR to measure the presence and fate of nutrients
in the ecosystem, coupled with measurements of the
source and delivery of nutrients to the GBR. Contin-
uations of these programs are critical to evaluate the
outcomes of Reef Plan implementation and Reef
Rescue investment, and are critical for the long term
assessment of the eutrophication status of the GBR.
Catchment based programs measure nutrient con-
centrations and loads delivered to the GBR and
include catchment and end of catchment load water
quality monitoring with sampling in major runoff
events, when these exports predominantly occur
(Hunter and Walton 2008), and several smaller scale
regionally specific monitoring programs to support
natural resource management plans (e.g. Bainbridge
et al. 2007; Rohde et al. 2008; Packett et al. 2009).
Many of these programs encourage community
participation. These programs are critical for esti-
mating the load of nutrients delivered to the GBR,
however, an inadequacy of sampling sites in some
locations and application of inconsistent methods
over time (and between programs) has resulted in
highly uncertain estimates to date. To demonstrate
these limitations, specific examples are highlighted
here. In the Tully River catchment Wallace et al.
(2008, 2009) showed that a large proportion (up to
30%) of the total load of nitrogen and suspended
sediment was present in waters in overbank flow on
the floodplain and this was not included in load
calculation made at the lowest gauging station in the
river channel. Similarly it is clear that much of the
nitrate lost from sugarcane fertiliser in many coastal
catchments reaches the GBR via small stream
discharge and possibly groundwater discharge and
is thus not included in loads measured at the gauging
station near the end of the river (Brodie and
Bainbridge 2008; Rohde et al. 2008). Similarly, there
is poor understanding of the role of, or impact of,
discharges of contaminants from the coastal flood-
plain in dry season conditions. These chronic dis-
charges are likely to include natural stream discharge
and drainage from irrigation, and may contribute to
nutrient enriched conditions in the GBR. The conse-
quence of these shortfalls in nutrient load estimations
is that management interventions cannot be fully
evaluated, and quantification of the relationship
between the delivery of nutrients to the GBR and
ecosystem response is highly uncertain.
Other challenges in measurement and evaluation of
nutrient management techniques, and transport, fate
and impact of nutrients in the GBR, are related to
geographic scales, temporal variability and system
noise (Haynes et al. 2007; Bainbridge et al. 2009). A
major limitation in detecting improvements in prac-
tices and measurable outcomes in GBR ecosystem
health is the ability to detect the signal of change in the
system and the effects of time lags (Bainbridge et al.
2009). Noise in the signal is due to system variability,
natural occurrence of nutrients and sediments in the
system and limitations of the capacity to monitor and
model material transport and fate (Waterhouse et al.
2009). A good example of demonstrated time lags in
system response to management changes is recorded in
the Tully River catchment. The Tully River catchment
is the least variable river in the GBR catchments, and
yet very large increases in fertiliser use took 14 years to
be robustly manifest (i.e. be detectable) as increasing
nitrogen levels in the lower Tully River (Mitchell et al.
2001, 2009). This highlights the importance of the need
for innovative monitoring and modelling techniques,
and an improved understanding of the system dynam-
ics to inform management decisions relating to eutro-
phication in the GBR.
Some of the limitations outlined above are being
addressed through a new, comprehensive monitoring,
modeling and reporting program to assess the
progress of the Reef Plan and Reef Rescue initiatives
(outlined above). The program uses a combination of
monitoring and modeling techniques to inform pro-
gress on achieving load reduction targets by 2013.
Specifically, monitoring and modelling results are
used to report end-of-catchment loads of key pollu-
tants (including dissolved and particulate nutrients)
Biogeochemistry
123
for each catchment in the GBR for current condition
(2009) and changes relative to this condition every
year thereafter (2010–2013). The program, known as
the Reef Plan Paddock to Reef Integrated Monitor-
ing, Modelling and Reporting Program, incorporates
activities across geographic regions and scales—from
paddock scale to sub catchment and catchment scale,
to coastal and inshore reef environments. It involves
monitoring and modelling a range of attributes
ultimately relevant to the assessment of the status
of the GBR, including management practices for
reducing nutrient runoff and runoff water quality at
the paddock, sub catchment, catchment and marine
scales, and GBR ecosystem status. This approach
relies on linking monitoring and modelling outputs at
each scale and then across scales, and is described in
further detail in Bainbridge et al. (2009). It is
anticipated that this program could provide a large
proportion of the information required to undertake
an eutrophication assessment of the GBR based on
the criteria proposed in Table 2 in the coming years.
Conclusions
The presence of elevated chlorophyll a concentrations
are indicative of elevated phytoplankton biomass in the
inshore GBR lagoon south of Cooktown with chloro-
phyll a concentrations exceeding GBR water quality
guidelines over this area (Table 3). Nutrient concen-
trations are above the Nutrient Threshold Criteria
(Lapointe 1997; Bell et al. 2007) during high flow
conditions in many parts of the inshore GBR. In
addition, intense and extensive phytoplankton blooms
follow nutrient-rich river discharge associated with
agricultural activities with chlorophyll a regularly
exceeding guidelines. Secondary impacts include
shifts to macroalgal dominance on some inshore reefs
and more intense COTS outbreaks.
From this preliminary assessment (Table 3) of
eutrophication status of the inshore GBR south of
Cook town, based on the suggested criteria, we
conclude that this area is significantly enriched and
possibly eutrophic at certain times of the year. Ongoing
spatial risk assessments (e.g. Devlin et al. 2010),
exposure maps (e.g. Maughan and Brodie 2009), water
quality gradients and spatial mapping of impact (e.g.
Cooper et al. 2008; De’ath and Fabricius 2010) all
show an area of enrichment, higher production and
changes in benthos and fish distribution.
This assessment is preliminary and based on data
that was not collected to assess eutrophication status,
however they are based on the current best available
knowledge and incorporate the outcomes of many
years of research related to nutrient status and impact
in the GBR. Further effort to develop these criteria in
collaboration with other scientific experts will gen-
erate a highly valuable tool for managers of the GBR.
Given the major management response to this risk
has been commenced, it is still unclear as to whether
the correct pollutants (i.e. between sediments, nitro-
gen, phosphorus and pesticides) are being prioritized
for appropriate management in individual catch-
ments. Analysis to be able to better prioritized across
catchments and regions continues (Brodie and Water-
house 2009, Brodie et al. 2009b) but further work in a
risk analysis framework is required. It is also unclear
as to whether the Reef Plan 2009 targets for reduced
nutrient inputs (50% reduction in Nitrogen and
Phosphorus discharge by 2013) or the Reef Rescue
targets (25% reduction in dissolved nitrogen and
phosphorus and 10% reduction in particulate nitrogen
and phosphorus by 2013) will be enough to achieve
the desired end point for the GBR. One of the
possible end points for reducing the probability of
eutrophication occurring would be that all GBR
waters meet water quality guidelines for chlorophyll
(Brodie et al. 2009a, b). Further research on the
validity of the current targets is planned.
The next 10 years will be vital for the protection
and rehabilitation of the inshore reef system from the
detrimental impacts of poor water quality. Continued
monitoring and assessment are essential in the
evaluation of these ongoing management actions
and the delivery of a ‘‘cleaner’’ GBR in respect to
water quality and associated impacts. A more robust
GBR may be more resilient to the combined impacts
and increasing climate change stresses.
References
Armour JD, Hateley LR, Pitt GL (2009) Catchment modelling
of sediment, nitrogen and phosphorus nutrient loads with
SedNet/ANNEX in the Tully-Murray basin. Mar Freshw
Res 60:1091–1096
Biogeochemistry
123

Aronson RB, Precht WF (2000) Herbivory and algal dynamics
on the coral reef at Discovery Bay, Jamaica. Limnol
Oceanogr 45:251–255
Australian Government (2007) Labour’s reef rescue plan.
Election 2007 Policy Document. http://www.alp.org.au/
download/071028___labors_reef_rescue_plan.pdf
Babcock R, Davies P (1991) Effects of sedimentation on set-
tlement of Acropora millepora. Coral Reefs 9:204–208
Bainbridge Z, Lewis S, Brodie J (2007) Sediment and nutrient
exports for the Burdekin River catchment, NQ: a com-
parison of monitoring and modelling data. In: MODSIM
2007. International congress on modelling and simulation.
Modelling and Simulation Society of Australia and New
Zealand, 10–13th December 2007, pp 874–880
Bainbridge ZT, Brodie JE, Lewis SE, Waterhouse J, Wilkinson
SN (2009) Utilising catchment modelling as a tool for
monitoring Reef Rescue outcomes in the Great Barrier
Reef catchment area. In: Amderssen B et al (eds) 18th
IMACS world congress—MODSIM international con-
gress on modelling and simulation, 13–17 July 2009,
Cairns, Australia. ISBN: 978-0-9758400-7-8. http://
mssanz.org.au/modsim09
Bell PRF (1991) The status of eutrophication in the Great
Barrier Reef lagoon. Mar Pollut Bull 23:89–93
Bell PRF (1992) Eutrophication and coral reefs—some
examples in the Great Barrier Reef lagoon. Water Res
28:553–568
Bell PRF, Elmetri I (1995) Ecological indicators of large-scale
eutrophication in the Great Barrier Reef lagoon. Ambio
24:208–215
Bell PRF, Elmetri I, Uwins P (1999) Nitrogen fixation by
Trichodesmium spp. in the Central and Northern Great
Barrier Reef Lagoon: relative importance of the fixed-
nitrogen load. Mar Ecol Prog Ser 186:119–126
Bell PRF, Lapointe BR, Elmetri I (2007) Re-evaluation of
ENCORE: support for the eutrophication threshold model
for coral reefs. Ambio 36:416–424
Bellwood DR, Hughes TP, Folke C, Nystrom M (2004) Con-
fronting the coral reef crises. Nature 429:827–833
Bellwood DR, Hoey AS, Ackerman JL, Depczynski M (2006)
Coral bleaching, reef fish community phase shifts and
the resilience of coral reefs. Glob Chang Biol 12(9):
1587–1594
Bricker SB, Ferreira JG, Simas T (2003) An integrated meth-
odology for assessment of estuarine trophic status. Ecol
Modell 169:39–60
Brock RE, Smith SV (1983) Response of coral reef cryptofa-
unal communities to food and space. Coral Reefs 1:
179–183
Brodie JE (1995) Nutrients and eutrophication in the Australian
marine environment. In: Zann L, Sutton DC (eds) The
State of the Marine Environment Report for Australia,
technical annex 2, DEST report, Canberra, pp 1–29
Brodie JE (1997) Nutrients in the Great Barrier Reef region. In:
Cosser P (ed) Nutrients in marine and estuarine environ-
ments. Australia: State of the Environment technical paper
series (Estuaries and the Sea). Environment Australia,
Canberra, pp 7–28
Brodie JE (2003) The Great Barrier Reef: 25 years of man-
agement as a large marine ecosystem. In: Hempel G,
Sherman K (eds) Large marine ecosystems of the world:
trends in exploration, protection, and research.
pp 313–336
Brodie J, Bainbridge Z (2008) Water quality targets for the
Burdekin WQIP. Australian Centre for Marine and
Tropical Freshwater research report no. 08/05. James
Cook University, Townsville
Brodie JE, Mitchell AW (2005) Nutrients in Australian tropical
rivers: changes with agricultural development and impli-
cations for receiving environments. Mar Freshw Res
56(3):279–302
Brodie JE, Mitchell AW (2006) Sediments and nutrients in
north Queensland tropical streams: changes with agricul-
tural development and pristine condition status. CRC Reef
Research Centre technical report no. 62. CRC Reef
Research Centre, Townsville, 140 pp
Brodie JE, Waterhouse J (2009). Assessment of the relative
risk of impacts of broad-scale agriculture on the Great
Barrier Reef and priorities for investment under the Reef
Protection Package. Stage 1 Report: April 2009. ACTFR
technical report 09/17. Australian Centre for Tropical
Freshwater Research, Townsville
Brodie J, Furnas M, Ghonim S, Haynes D, Mitchell A, Morris
S, Waterhouse J, Yorkston H, Audas D, Lowe D, Ryan M
(2001) Great Barrier Reef catchment water quality action
plan. Great Barrier Reef Marine Park Authority, Towns-
ville, 116 pp
Brodie J, Fabricius K, De’ath G, Okaji K (2005) Are increased
nutrient inputs responsible for more outbreaks of crown-
of-thorns starfish? An appraisal of the evidence. Mar
Pollut Bull 51:266–278
Brodie J, De’ath G, Devlin M, Furnas M, Wright M (2007)
Spatial and temporal patterns of near-surface chlorophyll
a in the Great Barrier Reef lagoon. Mar Freshw Res
58:342–353
Brodie J, Binney J, Fabricius K, Gordon I, Hoegh-Guldberg O,
Hunter H, O’Reagain P, Pearson R, Quirk M, Thorburn P,
Waterhouse J, Webster I, Wilkinson S (2008a) Scientific
consensus statement on water quality in the Great Barrier
Reef. The State of Queensland (Department of Premier
and Cabinet), Brisbane
Brodie J, Binney J, Fabricius K, Gordon I, Hoegh-Guldberg O,
Hunter H, O’Reagain P, Pearson R, Quirk M, Thorburn P,
Waterhouse J, Webster I, Wilkinson S (2008b) Synthesis
of evidence to support the Scientific Consensus Statement
on Water Quality in the Great Barrier Reef. The State of
Queensland (Department of Premier and Cabinet),
Brisbane
Brodie JE, Lewis SE, Bainbridge ZT, Mitchell A, Waterhouse
J, Kroon F (2009a) Target setting for pollutant discharge
management of rivers in the Great Barrier Reef catchment
area. Mar Freshw Res 60:1141–1149
Brodie JE, Mitchell A, Waterhouse J (2009b) Regional
assessment of the relative risk of the impacts of broad-
scale agriculture on the Great Barrier Reef and priorities
for investment under the Reef Protection Package. Stage 2
Report, July 2009. ACTFR technical report 09/30.
Australian Centre for Tropical Freshwater Research,
Townsville
Brodie J, Schroeder T, Rohde K, Faithful J, Masters B, Dekker
A, Brando V, Maughan M (2010) Dispersal of suspended
sediments and nutrients in the Great Barrier Reef lagoon
Biogeochemistry
123
during river discharge events: conclusions from satellite
remote sensing and concurrent flood plume sampling. Mar
Freshw Res 61:651–664
Bruno JF, Selig ER (2007). Regional decline of coral cover in
the Indo-Pacific: timing, extent and subregional compar-
isons. PLoS ONE 2:e711
Caperon J, Cattell SA, Krasnick G (1971) Phytoplankton
kinetics in a subtropical estuary: eutrophication. Limnol
Oceanogr 16:599–607
Cooper TF, Uthicke S, Humphrey C, Fabricius KE (2007)
Gradients in water column nutrients, sediment parameters,
irradiance and coral reef development in the Whitsunday
Region, central Great Barrier Reef. Estuar Coast Shelf Sci
74:458–470
Cooper TF, Ridd PV, Ulstrup KE, Humphrey C, Slivkoff M,
Fabricius K (2008) Temporal dynamics in coral bioindi-
cators for water quality on coastal coral reefs of the Great
Barrier Reef. Mar Freshw Res 59(8):703–716
Cox EF, Ribes M, Kinzie RA (2006) Temporal and spatial
scaling of planktonic responses to nutrient inputs into a
subtropical embayment. Mar Ecol Prog Ser 324:19–35
Crosbie ND, Furnas MJ (2001) Abundance, distribution and
flowcytometric characterization of picophytoprokaryote
populations in central (17_S) and southern (20_S) shelf
waters of the Great Barrier Reef. J Plankton Res 23:
809–828
De’ath G, Fabricius KE (2008) Water quality of the Great
Barrier Reef: distributions, effects on reef biota and trig-
ger values for the conservation of ecosystem health.
Research publication no. 89. Great Barrier Marine Park
Authority, Report to the Great Barrier Reef Marine Park
Authority and published by the Great Barrier Reef Marine
Park Authority, Townsville, 104 pp
De’ath G, Fabricius KE (2010) Water quality as regional driver
of coral biodiversity and macroalgal cover on the Great
Barrier Reef. Ecol Appl 20:840–850
Delesalle B, Pichon M, Frankignoulle M, Gattuso J-P (1993)
Effects of a cyclone on coral reef phytoplankton biomass,
primary production and composition (Moorea Island,
French Polynesia). J Plankton Res 15:1413–1423
Devantier LM, De’ath G, Turak E, Done TJ, Fabricius KE
(2006) Species richness and community structure of reef-
building corals on the nearshore Great Barrier Reef. Coral
Reefs 25:329–340
Devlin M, Brodie J (2005) Terrestrial discharge into the Great
Barrier Reef lagoon: nutrient behaviour in coastal waters.
Mar Pollut Bull 51:9–22
Devlin M, Schaffelke B (2009) Extent and exposure of riverine
flood plumes in the Tully coastal region. Mar Freshw Res
60:1109–1122
Devlin M, Waterhouse J, Taylor J, Brodie J (2001) Flood
plumes in the Great Barrier Reef: spatial and temporal
patterns in composition and distribution. Great Barrier
Reef Marine Park Authority research publication no. 68.
Great Barrier Reef Marine Park Authority, Townsville
Devlin MJ, Best M, Haynes D (eds) (2007) Implementation of
the Water Framework Directive in European Waters
(special edition). Mar Pollut Bull 55:1–6
Devlin M, Brodie J, Lewis S, Bainbridge Z (2009) Reef
rescue marine monitoring program: flood plumes in the
GBR—case studies for marine monitoring program, Tully
and Burdekin. Final report for 2008/2009 activities
JCU. ACTFR Catchment to Reef Group, James Cook
University, Townsville. http://www.rrrc.org.au/mmp/mmp_
pubs.html
Devlin M, Harkness P, Waterhouse J (2010) Mapping of risk and
exposure of Great Barrier Reef ecosystems to anthropo-
genic water quality. A review and synthesis of current sta-
tus. ACTFR report number 10/12. James Cook University
Diaz-Pulido G, McCook LJ, Dove S, Berkelmans R, Roff G,
Kline DI, Weeks S, Evans RD, Williamson DH, Hoegh-
Guldberg O (2009) Doom and boom on a resilient reef:
climate change, algal overgrowth and coral recovery.
PLoS One 4(4):e5239
Fabricius KE (2005) Effects of terrestrial runoff on the ecology
of corals and coral reefs: Review and synthesis. Mar
Pollut Bull 50:125–146
Fabricius KE (2007) Conceptual model of the effects of ter-
restrial runoff on the ecology of corals and coral reefs of
the GBR. Report to the Australian Government’s Marine
and Tropical Sciences Research Facility (MTSRF), 24 pp
Fabricius KE, De’ath G (2004) Identifying ecological change
and its cause: a case study on coral reefs. Ecol Appl
14(5):1448–1465
Fabricius K, De’ath G, McCook L, Turak E, Williams D (2005)
Changes in algal, coral and fish assemblages along water
quality gradients on the inshore Great Barrier Reef. Mar
Pollut Bull 51:384–398
Fabricius KE, Okaji K, De’ath G (2010) Three lines of evi-
dence to link outbreaks of the crown-of-thornsseastar
Acanthaster planci to the release of larval food limitation.
Coral Reefs 29:593–605
Foden J, Devlin M, Malcolm SJ, Mills D (2010) Searching for
undesirable disturbance: an application of the OSPAR
eutrophication assessment method to marine waters
of England and Wales. Biogeochemistry. doi:10.1007/
s10533-010-9475-9
Furnas MJ (2003) Catchments and corals: terrestrial runoff to
the Great Barrier Reef. Australian Institute of Marine
Science and Reef CRC, Townsville
Furnas MJ, Brodie J (1996) Current status of nutrient levels
and other water quality parameters in the Great Barrier
Reef. In: Hunter H, Eyles AG, Rayment GE (eds)
Downstream effects of land use. Department of Natural
Resources, Brisbane, pp 9–23
Furnas MJ, Mitchell AW (1986) Phytoplankton dynamics in
the central Great Barrier Reef—I. Seasonal changes in
biomass and community structure and their relations to
intrusive activity. Cont Shelf Res 6:363–384
Furnas MJ, Mitchell AW, Skuza M (1995) Nitrogen and
phosphorus budgets for the central Great Barrier Reef.
Research report no. 36, Great Barrier Reef Marine Park
Authority, Townsville
Furnas MJ, Mitchell A, Skuza M (1997) Shelf scale nitrogen
and phosphorus budgets for the Central Great Barrier Reef
(16�–19� S). In: Lessios HA, Macintyre IG (eds) Pro-
ceedings of the 8th international coral reef symposium,
vol 1, Panama City, Panama, pp 809–814
Furnas MJ, Mitchell A, Skuza M, Brodie J (2005) The other 90
percent: phytoplankton responses to enhanced nutrient
availability in the Great Barrier Reef lagoon. Mar Pollut
Bull 51:253–265
Biogeochemistry
123
Gagan MK, Sandstrom MW, Chivas AR (1987) Restricted
terrestrial carbon input to the continental shelf during
cyclone Winifred: implications for terrestrial run-off to
the Great Barrier Reef province. Coral Reefs 6:113–119
Gilbert M, Brodie J (2001) Population, major land use in the
Great Barrier Reef catchment area: spatial and temporal
trends. Great Barrier Reef Marine Park Authority,
Townsville
Gin KY-H, Lin X, Zhang S (2000) Dynamics and size structure
of phytoplankton in the coastal waters of Singapore.
J Plankton Res 22(8):1465–1484
Great Barrier Reef Marine Park Authority (2009) Water quality
guidelines for the Great Barrier Reef Marine Park. Great
Barrier Reef Marine Park Authority, Townsville, 99 pp
Grigg RW (1995) Coral reefs in an urban embayment in
Hawaii: a complex case history controlled by natural and
anthropogenic stress. Coral Reefs 14(4):253–266
Hallock P (1988) The role of nutrient availability in bioerosion:
consequences to carbonate buildups. Palaeogeogr Palae-
oclimatol Palaeoecol 63:275–291
Harris GP (2001) Biogeochemistry of nitrogen and phosphorus
in Australian catchments, rivers and estuaries: effects of
land use and flow regulation and comparisons with global
patterns. Mar Freshw Res 52(1):139–149
Harrison PL, Ward S (2001) Elevated levels of nitrogen and
phosphorus reduce fertilisation success of gametes from
scleractinian reef corals. Mar Biol 139:1057–1068
Haynes D, Ralph P, Prange J, Dennison B (2000) The impact
of the herbicide diuron on photosynthesis in three species
of tropical seagrass. Mar Pollut Bull 41:288–293
Haynes D, Brodie J, Christie C, Devlin M, Michalek-Wagner
K, Morris S, Ramsay M, Storrie J, Waterhouse J, York-
ston H (2001) Great Barrier Reef water quality current
issues. Great Barrier Reef Marine Park Authority,
Townsville
Haynes D, Brodie J, Waterhouse J, Bainbridge Z, Bass D, Hart
B (2007) Assessment of the water quality and ecosystem
health of the Great Barrier Reef (Australia): conceptual
models. Environ Manage 40:993–1003
Hopcroft RR, Roff JC (2003) Response of tropical marine
phytoplankton communities to manipulations of nutrient
concentration and grazing pressure. Bull Mar Sci 73:
397–420
Hughes TP, Szmant AM, Stenek R, Carpenter R, Miller S
(1999) Algal blooms on coral reefs: what are the causes?
Limnol Oceanogr 44:1583–1586
Hughes TP, Rodrigues MJ, Bellwood DR, Ceccerelli D, Hoe-
gh-Guldberg O, McCook L, Moltchaniwskyj N, Pratchett
MS, Steneck RS, Willis BL (2007) Regime-shifts, her-
bivory and the resilience of coral reefs to climate change.
Curr Biol 17:360–365
Hunter CL, Evans CW (1995) Coral reefs in Kaneohe Bay,
Hawaii: two centuries of western influence and two dec-
ades of data. Bull Mar Sci 57(2):501–515
Hunter HM, Walton RS (2008) Land-use effects on fluxes of
suspended sediment, nitrogen and phosphorus from a river
catchment of the Great Barrier Reef, Australia. J Hydrol
356:131–146
Hutchings P, Peyrot-Clausade M, Osnorno A (2005) Influence
of land runoff on rates and agents of bioerosion of coral
substrates. Mar Pollut Bull 51:438–447
Jacquet S, Delesalle B, Torreton J, Blanchot J (2006) Response
of phytoplankton communities to increased anthropogenic
influences (southwestern lagoon, New Caledonia). Mar
Ecol Prog Ser 320:65–78
Johnson JE, Waterhouse J, Maynard JA, Morris S (Writing
Team) (2010) Reef rescue marine monitoring program:
2008/2009 synthesis report. Report prepared by the Reef
and Rainforest Research Centre Consortium of monitoring
providers for the Great Barrier Reef Marine Park Authority.
Reef and Rainforest Research Centre Limited, Cairns,
160 pp. http://www.rrrc.org.au/mmp/mmp_pubs.html
Jompa J, McCook LJ (2002) The effect of herbivory on com-
petition between a macroalgae and a hard coral. J Exp
Mar Biol Ecol 271:25–39
Jompa J, McCook LJ (2003) Contrasting effects of turf algae
on corals: massive Porites spp. are unaffected by mixed-
species turfs, but killed by the red alga Anotrichium tenue.
Mar Ecol Prog Ser 258:29–86
Jupiter S, Roff G, Marion G, Henderson M, Schrameyer V,
McCulloch M, Hoegh-Guldberg O (2008) Linkages
between coral assemblages and coral proxies of terrestrial
exposure along a cross-shelf gradient on the southern
Great Barrier Reef. Coral Reefs 27:887–903
Kiene WE (1997) Enriched nutrients and their impact on
bioerosion: results from ENCORE. In: Proceedings of the
eighth international coral reef symposium
Kiene WE, Hutchings PA (1994) Bioerosion experiments at
Lizard Island, Great Barrier Reef. Coral Reefs 13:91–98
Kinsey DW (1988) Coral reef system response to some natural
and anthropogenic stresses. Galaxea 7:113–128
Kinsey DW (1991) Can we resolve the nutrient issue for the
Reef? Search 22:119–121
Kline DI, Kuntz NM, Breitbart M, Knowlton N, Rohwer F (2006)
Role of elevated organic carbon levels and microbial
activity in coral mortality. Mar Ecol Prog Ser 314:119–125
Koop K, Booth D, Broadbent A, Brodie J, Bucher D, Capone
D, Coll J, Dennison W, Erdmann M, Harrison P, Hoegh-
Guldberg O, Hutchings P, Jones GB, Larkum AWD,
O’Neil J, Steven A, Tentori E, Ward S, Williamson J,
Yellowlees D (2001) ENCORE: the effect of nutrient
enrichment on coral reefs. Synthesis of results and con-
clusions. Mar Pollut Bull 42:91–120
Lapointe BE (1997) Nutrient thresholds for bottom-up control
of macroalgal blooms on coral reefs in Jamaica and
southeast Florida. Limnol Oceanogr 42(5–2):1119–1131
Lapointe BE, Barile PJ, Yentsch CS, Littler MM, Littler DS,
Kakuk B (2004) The relative importance of nutrient
enrichment and herbivory on macroalgal communities
near Norman’s Pond Cay, Exumas Cays, Bahamas: a
‘‘natural’’ enrichment experiment. J Exp Mar Biol Ecol
298(2):275–301
Laws EA, Allen CB (1996) Water quality in a subtropical
embayment more than a decade after diversion of sewage
discharges. Pac Sci 50(2):194–210
Lewis SE, Brodie J, Ledee E, Alewijnse M (2006) The spatial
extent of delivery of terrestrial materials from the Burd-
ekin region of the Great Barrier Reef lagoon. ACTFR
report no. 06/02, Australian Centre for Tropical Fresh-
water Research, James Cook University, Townsville
Lewis SE, Brodie JE, Bainbridge ZT, Rohde KW, Davis AM,
Masters BL, Maughan M, Devlin MJ, Mueller JF,
Biogeochemistry
123
Schaffelke B (2009) Herbicides: a new threat to the Great
Barrier Reef. Environ Pollut 157:2470–2484
Littler MM, Littler DS (1984) Models of tropical reef, biogen-
esis: the contribution of algae. Prog Phycol Res 3:323–364
Littler MM, Littler DS, Brooks BL (2006) Harmful algae on
tropical coral reefs: bottom-up eutrophication and top-
down herbivory. Harmful Algae 5:1–23
Loya Y (1976) Recolonisation of Red Sea corals affected by
natural catastrophes and man-made perturbations. Ecol-
ogy 57:278–289
Loya Y, Lubinevsky H, Rosenfeld M, Kramarsky-Winter E
(2004) Nutrient enrichment caused by in situ fish farms at
Eilat, Red Sea is detrimental to coral reproduction. Mar
Pollut Bull 49(4):344–353
Maughan M, Brodie JE (2009) Reef exposure to river-borne
contaminants: a spatial model. Mar Freshw Res 60:
1132–1140
McClanahan TR, Graham NAJ (2005) Recovery trajectories of
coral reef fish assemblages within Kenyan marine pro-
tected areas. Mar Ecol Prog Ser 294:241–248
McCook LJ (1999) Macroalgae, nutrients and phase shifts on
coral reefs: scientific issues and management consequences
for the Great Barrier Reef. Coral Reefs 18(4):357–367
McCook LJ (2001) Competition between coral and algal turfs
along a water quality gradient in the nearshore central
Great Barrier Reef. Coral Reefs 19:419–425
McCook LJ, Jompa J, Diaz-Pulido G (2001) Competition
between corals and algae on coral reefs: a review of
evidence and mechanisms. Coral Reefs 19:400–417
McKenzie L, Unsworth R (2009) Reef rescue marine moni-
toring program: intertidal seagrass. Final report for the
sampling period 1 September 2008 to 31 May 2009.
Fisheries Queensland, Cairns. http://www.rrrc.org.au/
mmp/mmp_pubs.html
McKergow L, Prosser IP, Hughes AO, Brodie JE (2005) Regional
scale nutrient modelling: exports to the Great Barrier Reef
World Heritage Area. Mar Pollut Bull 51:186–199
Mellors JE, Waycott M, Marsh H (2005) Variation in bio-
geochemical parameters across intertidal seagrass mead-
ows in the central Great Barrier Reef region. Mar Pollut
Bull 51:335–342
Mitchell AW, Furnas M (1997) Terrestrial inputs of nutrients
and suspended sediments to the Great Barrier Reef
lagoon. The Great Barrier Reef: science, use and man-
agement, a national conference. James Cook University,
Townsville, pp 59–71
Mitchell AW, Bramley RGV, Johnson AKL (1997) Export of
nutrients and suspended sediment during a cyclone-med-
iated flood event in the Herbert River catchment, Aus-
tralia. Mar Freshw Res 48:79–88
Mitchell A, Reghenzani J, Furnas M (2001) Nitrogen levels in
the Tully River—a long-term view. Water Sci Technol
43:99–105
Mitchell C, Brodie J, White I (2005) Sediments, nutrients and
pesticide residues in event flow conditions in streams of the
Mackay Whitsunday Region, Australia. Mar Pollut Bull
51:23–36
Mitchell A, Reghenzani J, Faithful J, Furnas M, Brodie J (2009)
Relationships between land use and nutrient concentra-
tions in streams draining a ‘wet-tropics’ catchment in
northern Australia. Mar Freshw Res 60:1097–1108
Moran PJ, De’ath G (1992) Estimates of the abundance of the
crown-of-throns starfish Acanthaster planci in outbreaking
and non-outbreaking populations on reefs within the Great
Barrier Reef. Mar Biol 113:509–515. doi:10.1007/
BF00349178
Packett R, Dougall C, Rohde K, Noble R (2009) Agricultural
lands are hot-spots for annual runoff polluting the southern
Great Barrier Reef lagoon. Mar Pollut Bull 58:976–985
Pandolfi JM, Bradbury RH, Sala E, Hughes TP et al (2003)
Global trajectories of the long-term decline of coral reef
ecosystems. Science 301:955–958
Queensland Department of Premier and Cabinet (2009) Reef
Water Quality Protection Plan 2009. For the Great Barrier
Reef World Heritage Area and adjacent catchments.
Queensland Department of Premier and Cabinet, Bris-
bane. http://www.reefplan.qld.gov.au/about/rwqpp.shtm
Rabalais NN (2002) Nitrogen in aquatic ecosystems. Ambio
31(2):102–112
Rayment GE (2003) Water quality in sugar catchments in
Queensland. Water Sci Technol 48(7):35–47
Risk MJ, Sammarco PW, Edinger EN (1995) Bioerosion in
Acropora across the continental shelf of the Great Barrier
Reef. Coral Reefs 14:79–86
Rodier M, Le Borgne R (2008) Population dynamics and
environmental conditions affecting Trichodesmium spp.
(filamentous cyanobacteria) blooms in the south–west
lagoon of New Caledonia. J Exp Mar Biol Ecol
358:20–32
Rohde K, Masters B, Fries N, Noble R, Carroll C (2008) Fresh
and marine water quality in the Mackay Whitsunday
region 2004–05 to 2006–07. Queensland Department of
Natural Resources and Water for the Mackay Whitsunday
Natural Resource Management Group, Australia
Sammarco PW, Risk M (1990) Large-scale patterns in internal
bioerosion of Porites: cross continental shelf trends on the
Great Barrier Reef. Mar Ecol Prog Ser 59:145–156
Schaffelke B, Thompson A, Carleton J, Davidson J, Doyle J,
Furnas M, Gunn K, Skuza M, Wright M, Zagorskis I (2009)
Reef rescue marine monitoring program. Final report of
AIMS activities 2008/2009. Report submitted to the Reef
and Rainforest Research Centre. Australian Institute of
Marine Science, Townsville. http://www.rrrc.org.au/mmp/
mmp_pubs.html
Shaw EC, Gabric AJ, McTainsh GH (2008) Impacts of Aeolian
dust deposition on phytoplankton dynamics in Queensland
coastal waters. Mar Freshw Res 59(11):951–962. doi:
10.1071/MF08087
Smith VS, Kimmerer WJ, Laws EA, Brock RE, Walsh TW
(1981) Kaneohe Bay sewage diversion experiment: per-
spectives on ecosystem responses to nutritional perturba-
tion. Pac Sci 35:279–340
Smith JE, Smith CM, Hunter CL (2001) An experimental
analysis of the effects of herbivory and nutrient enrich-
ment on benthic community dynamics on a Hawaiian reef.
Coral Reefs 19:332–342
Smith JE, Shaw M, Edwards RA, Obura D, Pantos O et al
(2006) Indirect effects of algae on coral: algae-mediated,
microbe-induced coral mortality. Ecol Lett 9:835–845
Sotka EE, Hay ME (2009) Effects of herbivores, nutrient
enrichment, and their interactions on macroalgal prolif-
eration and coral growth. Coral Reefs 28:555–568
Biogeochemistry
123
Stimson J, Conklin E (2008) Potential reversal of a phase shift:
the rapid decrease in the cover of the invasive green
macroalga Dictyosphaeria cavernosa (Forsskal) on coral
reefs in Kaneohe Bay, Oahu, Hawaii. Coral Reefs 27:
717–726
Stimson J, Larned ST, Conklin E (2001) Effects of herbivory,
nutrient levels, and introduced algae on the distribution
and abundance of the invasive macroalga Dictyosphaeriacavernosa in Kaneohe Bay, Hawaii. Coral Reefs 19:
343–357
Sweatman H, Burgess S, Cheal AJ, Coleman G, Delean S,
Emslie M, Miller I, Osborne K, McDonald A, Thompson
A (2005) Long-term monitoring of the Great Barrier Reef.
Status report no. 7. CDRom. Australian Institute of Mar-
ine Science, Townsville
Sweatman HPA, Cheal AJ, Coleman GJ, Emslie MJ, Johns K,
Jonker M, Miller IR, Osborne K (2008) Long-term
Monitoring of the Great Barrier reef, Status Report. 8.
Australian Institute of Marine Science, 369 pp
Tada K, Sakai K, Nakano Y, Takemura A, Montani S (2003)
Size-fractionated phytoplankton biomass in coral reef
waters off Sesoko Island, Okinawa, Japan. J Plankton Res
25(8):991–997
Tenorio MMB, Le Borgne R, Rodier M, Neveux J (2005) The
impact of terrigeneous inputs on the Bay of Ouinne (New
Caledonia) phytoplankton communities: a spectrofluoro-
metric and microscopic approach. Estuar Coast Shelf Sci
64:531–545
Tett P, Gowen R, Mills D, Fernandes T, Gilpin L, Huxham M,
Kennington K, Read P, Service M, Wilkinson M, Mal-
colm S (2007) Defining and detecting undesirable dis-
turbance in the context of eutrophication. Mar Pollut Bull
53:282–297
Thompson A, Schaffelke B, De’ath G, Cripps E, Sweatman H
(2010) Water quality and ecosystem monitoring pro-
gramme-reef water quality protection plan. Synthesis and
spatial analysis of inshore monitoring data 2005-08.
Report to the Great Barrier Reef Marine Park Authority.
Australian Institute of Marine Science, Townsville, 78 pp.
http://www.rrrc.org.au/mmp/mmp_pubs.html
Tomascik T, Sander F (1985) Effects of eutrophication on reef-
building corals. I. Growth rates of the reef-building coral
Montastera annularis. Mar Biol 87:143–155
Touchette BW, Burkholder JM (2000) Overview of the phys-
iological ecology of carbon metabolism in seagrasses.
J Exp Mar Biol Ecol 250:169–205
Tribollet A, Golubic S (2005) Cross-shelf differences in the
pattern and pace of bioerosion of experimental carbonate
substrates exposed for 3 years on the northern Great
Barrier Reef, Australia. Coral Reefs 24:422–434
Udy JW, Dennison WC, Lee Long W, McKenzie LJ (1999)
Responses of seagrass to nutrients in the Great Barrier
Reef, Australia. Mar Ecol Prog Ser 185:257–271
Van Duyl FC, Gast GJ, Steinhoff W, Kloff S, Veldhius MJW,
Bak RPM (2002) Factors influencing the short-term var-
iation in phytoplankton composition and biomass in coral
reef waters. Coral Reefs 21:293–306
van Woesik R, Tomascik T, Blake S (1999) Coral assemblages
and physico-chemical characteristics of the Whitsunday
Islands: evidence of recent community changes. Mar
Freshw Res 50:427–440
Walker TA (1991) Is the Reef really suffering from chronic
pollution? Search 22:115–117
Walker TA, O’Donnell G (1981) Observations on nitrate,
phosphate and silicate in Cleveland Bay, Northern
Queensland. Aust J Mar Freshw Res 32:877–887
Walker D, Dennison W, Edgar G (1999) Status of Australian
seagrass research and knowledge, Chap 1. In: Walker D,
Dennison W, Edgar G (eds) Seagrass in Australia. CSIRO
Australia, Collingwood
Wallace J, Stewart L, Hawdon A, Keen R (2008) The role of
coastal floodplains in generating sediment, nutrient fluxes
to the Great Barrier Reef Lagoon in Australia. Ecohy-
drological processes, sustainable floodplain management
opportunities, concepts for water hazard mitigation, eco-
logical, socio-economic sustainability. 19–23 May 2008
Lodz, Poland. Int J Ecohydrol Hydrobiol 8:183–194
Wallace J, Stewart L, Hawdon A, Keen R, Karim F, Kemei J
(2009) Flood water quality and marine sediment and
nutrient loads from the Tully and Murray catchments
in north Queensland, Australia. Mar Freshw Res 60:
1123–1131
Ward S, Harrison PL (1997) The effect of elevated nutrient
levels on the settlement of coral larvae during the
ENCORE experiment, Great Barrier Reef, Australia. In:
Lessios HA, McIntyre IG (eds) Proceedings of the eighth
international coral reef symposium, pp 890–896
Ward S, Harrison PL (2000) Changes in gametogenic patterns
and fecundity of acroporid reef corals that were exposed
to elevated nitrogen and phosphorus during the ENCORE
experiment. J Exp Mar Biol Ecol 246:179–221
Waterhouse J, Grundy M, Brodie J, Gordon I, Yorkston H,
Eberhard R (2009) Flagship basin study—Great Barrier
Reef. In: Ferrier R, Jenkins J (eds) Handbook of catchment
management. Blackwell Publishing, United Kingdom
Wilkinson C (2008) Status of coral reefs of the world: 2008.
Global Coral Reef Monitoring Network and Reef and
Rainforest Research Centre, Townsville
Wismer S, Hoey AS, Bellwood DR (2009) Cross-shelf benthic
community structure on the Great Barrier Reef: relation-
ships between macroalgal cover and herbivore biomass.
Mar Ecol Prog Ser 376:45–54
Wooldridge SA (2009a) A new conceptual model for the
warm-water breakdown of the coral-algae endosymbiosis.
Mar Freshw Res 60:483–496
Wooldridge SA (2009b) Water quality and coral bleaching
thresholds: Formalising the linkage for the inshore reefs of
the Great Barrier Reef, Australia. Mar Pollut Bull 58:
745–751
Wooldridge SA, Done TJ (2009) Improved water quality can
ameliorate effects of climate change on corals. Ecol Appl
19:1492–1499
Biogeochemistry
123


![Ke'e Lagoon and Reef Flat Users Baseline Study (1999) [updated 2015]](https://static.fdokumen.com/doc/165x107/633f0e72053842363002ce96/kee-lagoon-and-reef-flat-users-baseline-study-1999-updated-2015.jpg)

