Spatio-temporal variability in suspended particulate matter concentration and the role of...
13
Spatio-temporal variability in suspended particulate matter concentration and the role of aggregation on size distribution in a coral reef lagoon Aymeric Jouon a,b, ⁎, Sylvain Ouillon a,c , Pascal Douillet a , Jean Pierre Lefebvre a , Jean Michel Fernandez a , Xavier Mari a , Jean-Marie Froidefond b a IRD, BP A5, 98848 Nouméa cedex, New Caledonia b Université de Bordeaux, CNRS, UMR 5805, Bordeaux, F-33000, France c LEGOS/OMP, Université de Toulouse, UMR 5566,14 avenue Edouard Belin, 31400 Toulouse, France abstract article info Article history: Received 30 January 2008 Received in revised form 16 September 2008 Accepted 28 September 2008 Keywords: suspended particles optical backscattering beam attenuation particle size distribution flocs marine aggregates coral reef New Caledonia This paper presents the concentration and size distribution of suspended particles in the South-West Coral reef lagoon of the island of New Caledonia. Data are provided by filtration techniques, Optical BackScattering (OBS) measurements and in situ laser diffraction particle sizing. The concentration of suspended particles increased from reef to land. A bottom nepheloïd layer occurred over the entire lagoon, and was more distinct on the nearshore area. Small particles were more abundant in the bottom nepheloïd layer than in the overlying water column. The concentration of suspended particles showed more variability over space than over time. Conversely, the particle size distribution of suspended particles showed more variability at a given location over a month (time variability) than at a given moment over the lagoon (space variability). Analysis showed that aggregates represented a large fraction of suspended particles. Microscope visualization and chemical analysis of a sample suggest the inclusion of a transparent exopolymeric matrix. The relative abundance of aggregates over suspended particle volume concentration was found to increase as the quantity of suspended particle decreased. The spatial distribution of the relative abundance of aggregates suggests more aggregates proximal to coral reefs. The high concentration of aggregates at low turbidity and the spatial distribution of the relative abundance, infer that aggregation is induced by the presence of organic ligands. Unlike optical backscattering and light attenuation measurements that are size sensitive measurements of suspended particle concentration, in situ laser diffraction particle sizing provides a relevant optical measurement of suspended particulate matter in such an aggregate-dominated system. © 2008 Elsevier B.V. All rights reserved. 1. Introduction Suspended particulate matter (SPM) is a key vector for minerals, organic matter, nutrients and pollutants cycling in aquatic ecosystems. The amount, variability and fate of SPM force many biological processes. High turbidity modifies coral reef development by limiting light penetration by compressing the depth range over which coral can flourish (Hayward, 1982; Rogers, 1990; Hopley, 1994; Hoitink, 2004), and sedimentation inhibits coral recruitment (Babcock and Davies, 1991; Fabricius et al., 2003). On the other hand, coral abundance also induces changes in the SPM field characteristics. For example, on Eniwetok Atoll, Johannes (1967) observed a marked increase in the concentration of suspended particulate organic aggregates when oceanic waters crossed the windward coral reef and entered the lagoon. Benson and Muscatine (1974) highlighted the importance of coral mucus within SPM. By mixing turbid plume water with unfiltered coral reef water in equivalent ratio, Wolanski et al. (2003a) observed a rapid aggregation of particles leading to the formation of large aggregates. Wild et al. (2004) reported the occurrence of specific aggregation processes related to the production of mucus by corals, defining coral mucus as “a trap for particles” and as “an efficient energy carrier”. The concentration of SPM is usually assessed by measuring the dry weight of particles. In numerous studies (e.g. Creed et al., 2001; Fugate and Friedrichs, 2002; Hoitink, 2004; Voulgaris and Meyers, 2004), turbidity measurements and mass concentration of SPM are directly linked, thus providing an estimate of naturally occurring SPM concentration. However, characterization of the SPM field also requires the determination of particle size distributions (PSD). Measuring the natural effective particle size distribution (EPSD) and the absolute particle size distribution (APSD, after disaggregation), is required in order to assess the importance of aggregation processes (Williams et al., 2007). APSD can be measured in the laboratory by Marine Geology 256 (2008) 36–48 ⁎ Corresponding author. Université de Bordeaux, CNRS, UMR 5805, Bordeaux, F- 33000, France. Tel.: +33 5 61 33 29 02. E-mail addresses: [email protected] (A. Jouon), [email protected] (S. Ouillon), [email protected] (P. Douillet), [email protected] (J.P. Lefebvre), [email protected] (J.M. Fernandez), [email protected] (X. Mari), [email protected] (J.-M. Froidefond). 0025-3227/$ – see front matter © 2008 Elsevier B.V. All rights reserved. doi:10.1016/j.margeo.2008.09.008 Contents lists available at ScienceDirect Marine Geology journal homepage: www.elsevier.com/locate/margeo
Transcript of Spatio-temporal variability in suspended particulate matter concentration and the role of...

Marine Geology 256 (2008) 36–48
Contents lists available at ScienceDirect
Marine Geology
j ourna l homepage: www.e lsev ie r.com/ locate /margeo
Spatio-temporal variability in suspended particulate matter concentration and therole of aggregation on size distribution in a coral reef lagoon
Aymeric Jouon a,b,⁎, Sylvain Ouillon a,c, Pascal Douillet a, Jean Pierre Lefebvre a, Jean Michel Fernandez a,Xavier Mari a, Jean-Marie Froidefond b
a IRD, BP A5, 98848 Nouméa cedex, New Caledoniab Université de Bordeaux, CNRS, UMR 5805, Bordeaux, F-33000, Francec LEGOS/OMP, Université de Toulouse, UMR 5566, 14 avenue Edouard Belin, 31400 Toulouse, France
⁎ Corresponding author. Université de Bordeaux, CN33000, France. Tel.: +33 5 61 33 29 02.
E-mail addresses: [email protected] (A. J(S. Ouillon), [email protected] (P. Douillet), [email protected] (J.M. Fernandez), [email protected]@epoc.u-bordeaux1.fr (J.-M. Froidefond).
0025-3227/$ – see front matter © 2008 Elsevier B.V. Adoi:10.1016/j.margeo.2008.09.008
a b s t r a c t
a r t i c l e i n f oArticle history:
This paper presents the con Received 30 January 2008Received in revised form 16 September 2008Accepted 28 September 2008Keywords:suspended particlesoptical backscatteringbeam attenuationparticle size distributionflocsmarine aggregatescoral reefNew Caledonia
centration and size distribution of suspended particles in the South-West Coralreef lagoon of the island of New Caledonia. Data are provided by filtration techniques, Optical BackScattering(OBS) measurements and in situ laser diffraction particle sizing. The concentration of suspended particlesincreased from reef to land. A bottom nepheloïd layer occurred over the entire lagoon, and was more distincton the nearshore area. Small particles were more abundant in the bottom nepheloïd layer than in theoverlying water column. The concentration of suspended particles showed more variability over space thanover time. Conversely, the particle size distribution of suspended particles showed more variability at a givenlocation over a month (time variability) than at a given moment over the lagoon (space variability). Analysisshowed that aggregates represented a large fraction of suspended particles. Microscope visualization andchemical analysis of a sample suggest the inclusion of a transparent exopolymeric matrix. The relativeabundance of aggregates over suspended particle volume concentration was found to increase as thequantity of suspended particle decreased. The spatial distribution of the relative abundance of aggregatessuggests more aggregates proximal to coral reefs. The high concentration of aggregates at low turbidity andthe spatial distribution of the relative abundance, infer that aggregation is induced by the presence of organicligands. Unlike optical backscattering and light attenuation measurements that are size sensitivemeasurements of suspended particle concentration, in situ laser diffraction particle sizing provides arelevant optical measurement of suspended particulate matter in such an aggregate-dominated system.
© 2008 Elsevier B.V. All rights reserved.
1. Introduction
Suspended particulate matter (SPM) is a key vector for minerals,organicmatter, nutrients and pollutants cycling in aquatic ecosystems.The amount, variability and fate of SPM force many biologicalprocesses. High turbidity modifies coral reef development by limitinglight penetration by compressing the depth range over which coralcan flourish (Hayward, 1982; Rogers, 1990; Hopley, 1994; Hoitink,2004), and sedimentation inhibits coral recruitment (Babcock andDavies, 1991; Fabricius et al., 2003). On the other hand, coralabundance also induces changes in the SPM field characteristics. Forexample, on Eniwetok Atoll, Johannes (1967) observed a markedincrease in the concentration of suspended particulate organic
RS, UMR 5805, Bordeaux, F-
ouon), [email protected]@noumea.ird.nc (J.P. Lefebvre),.ird.nc (X. Mari),
ll rights reserved.
aggregates when oceanic waters crossed the windward coral reefand entered the lagoon. Benson and Muscatine (1974) highlighted theimportance of coral mucus within SPM. By mixing turbid plumewaterwith unfiltered coral reef water in equivalent ratio, Wolanski et al.(2003a) observed a rapid aggregation of particles leading to theformation of large aggregates. Wild et al. (2004) reported theoccurrence of specific aggregation processes related to the productionof mucus by corals, defining coral mucus as “a trap for particles” and as“an efficient energy carrier”.
The concentration of SPM is usually assessed by measuring the dryweight of particles. In numerous studies (e.g. Creed et al., 2001; Fugateand Friedrichs, 2002; Hoitink, 2004; Voulgaris and Meyers, 2004),turbidity measurements and mass concentration of SPM are directlylinked, thus providing an estimate of naturally occurring SPMconcentration. However, characterization of the SPM field alsorequires the determination of particle size distributions (PSD).Measuring the natural effective particle size distribution (EPSD) andthe absolute particle size distribution (APSD, after disaggregation), isrequired in order to assess the importance of aggregation processes(Williams et al., 2007). APSD can be measured in the laboratory by
37A. Jouon et al. / Marine Geology 256 (2008) 36–48
sieving methods, Coulter Counter, and laser sizer technology. Onanother hand, EPSD measurements, which require aggregates toremain intact during analysis (Gibbs, 1982), have to be performed insitu. Laser-based technology devices, such as Cilas and Sequoia LISSTinstruments, use the principle of diffraction of a laser by particles toperform a non intrusive measurement of the volume concentration ofsuspended particles according to their size. The EPSD can thus bemonitored. The straightforward innovation brought in this study is themeasurement of EPSD in a coral reef lagoon.
The objectives of this study are: (1) to compare in situ parametersderived from LISST-100X to other parameters used to describe SPM,such as turbidity and light attenuation; (2) to describe time, space anddepth variability of SPM and EPSD; (3) to estimate the amount ofaggregates from the comparison between APSD and EPSD; and, (4) todiscuss the importance of aggregation processes in a coral reef lagoon.Suspended aggregates have been described in various marineenvironments (Gentien et al., 1995; Fugate and Friedrichs, 2003),and are a major constituent of suspended particles (Gibbs andWolanski, 1992; Droppo, 2001). However, to our knowledge, nopaper has reported the use of an in situ laser particle sizer nor thedescription of effective particle size distribution in a coral reefenvironment.
2. Study area
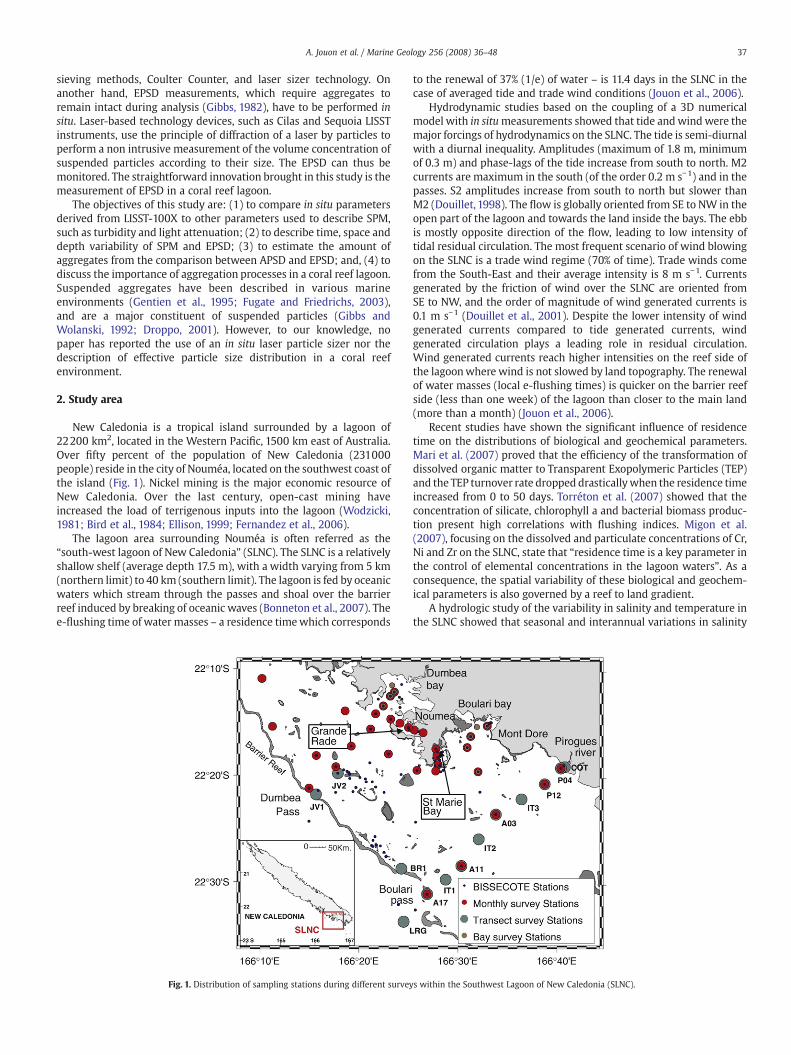
New Caledonia is a tropical island surrounded by a lagoon of22200 km2, located in the Western Pacific, 1500 km east of Australia.Over fifty percent of the population of New Caledonia (231000people) reside in the city of Nouméa, located on the southwest coast ofthe island (Fig. 1). Nickel mining is the major economic resource ofNew Caledonia. Over the last century, open-cast mining haveincreased the load of terrigenous inputs into the lagoon (Wodzicki,1981; Bird et al., 1984; Ellison, 1999; Fernandez et al., 2006).
The lagoon area surrounding Nouméa is often referred as the“south-west lagoon of New Caledonia” (SLNC). The SLNC is a relativelyshallow shelf (average depth 17.5 m), with a width varying from 5 km(northern limit) to 40 km (southern limit). The lagoon is fed by oceanicwaters which stream through the passes and shoal over the barrierreef induced by breaking of oceanic waves (Bonneton et al., 2007). Thee-flushing time of water masses – a residence timewhich corresponds
Fig. 1. Distribution of sampling stations during different survey
to the renewal of 37% (1/e) of water – is 11.4 days in the SLNC in thecase of averaged tide and trade wind conditions (Jouon et al., 2006).
Hydrodynamic studies based on the coupling of a 3D numericalmodel with in situmeasurements showed that tide andwindwere themajor forcings of hydrodynamics on the SLNC. The tide is semi-diurnalwith a diurnal inequality. Amplitudes (maximum of 1.8 m, minimumof 0.3 m) and phase-lags of the tide increase from south to north. M2currents are maximum in the south (of the order 0.2 m s−1) and in thepasses. S2 amplitudes increase from south to north but slower thanM2 (Douillet, 1998). The flow is globally oriented from SE to NW in theopen part of the lagoon and towards the land inside the bays. The ebbis mostly opposite direction of the flow, leading to low intensity oftidal residual circulation. The most frequent scenario of wind blowingon the SLNC is a trade wind regime (70% of time). Trade winds comefrom the South-East and their average intensity is 8 m s−1. Currentsgenerated by the friction of wind over the SLNC are oriented fromSE to NW, and the order of magnitude of wind generated currents is0.1 m s−1 (Douillet et al., 2001). Despite the lower intensity of windgenerated currents compared to tide generated currents, windgenerated circulation plays a leading role in residual circulation.Wind generated currents reach higher intensities on the reef side ofthe lagoonwhere wind is not slowed by land topography. The renewalof water masses (local e-flushing times) is quicker on the barrier reefside (less than one week) of the lagoon than closer to the main land(more than a month) (Jouon et al., 2006).
Recent studies have shown the significant influence of residencetime on the distributions of biological and geochemical parameters.Mari et al. (2007) proved that the efficiency of the transformation ofdissolved organic matter to Transparent Exopolymeric Particles (TEP)and the TEP turnover rate dropped drasticallywhen the residence timeincreased from 0 to 50 days. Torréton et al. (2007) showed that theconcentration of silicate, chlorophyll a and bacterial biomass produc-tion present high correlations with flushing indices. Migon et al.(2007), focusing on the dissolved and particulate concentrations of Cr,Ni and Zr on the SLNC, state that “residence time is a key parameter inthe control of elemental concentrations in the lagoon waters”. As aconsequence, the spatial variability of these biological and geochem-ical parameters is also governed by a reef to land gradient.
A hydrologic study of the variability in salinity and temperature inthe SLNC showed that seasonal and interannual variations in salinity
s within the Southwest Lagoon of New Caledonia (SLNC).

38 A. Jouon et al. / Marine Geology 256 (2008) 36–48
are amplified nearshore. The temperaturewas proved to be warmer inbays than in the open lagoon during summer, this thermal gradient isreversed during winter (Ouillon et al., 2005).
The spatial variability of benthic cover roughly coincides to a reefto land gradient of biogenic to terrigenous sediments (Clavier et al.,1995). While terrigenous silicate mud is dominant on the land side ofthe lagoon, biogenic calcareous sediment is almost exclusively on thebarrier reef side of the SLNC.
Despite terrestrial runoffs, which episodically affect the near-shoreareas of the SLNC, the concentration of SPM is low (ca. 1 mg L−1). TheSPM encompasses particles such as bacteria, phytoplankton, organicdetritus, zooplankton, aggregates and inorganic particles. The relativeabundance of solid particles and of particulate organic matter in theSPM strongly varies (3 to 65%) in the SLNC (Mari et al., 2007). Thecomparison of sediment transport modeling and remotely senseddata showed that the major feature of the turbidity distribution onthe SLNC is a barrier reef to land positive gradient (Ouillon et al.,2004).
3. Material and methods
3.1. Material
In this paper, a highly sensitive new generation instrument (LISST-100X) was used in situ to quantify SPM and EPSD in low SPM waters(down to ca. 0.2 mg L−1). This study uses approximately 500 in situmeasurements (i.e. LISST and Conductivity-Temperature-Depth-CTD-profiles). The LISST-100X was also used in laboratory to determine theAPSD on a few characteristic sampling locations (11 APSD).
3.1.1. Lisst-100xAn in situ Laser Scattering and Transmissometry device (LISST-
100X; Sequoia Scientific Inc.) was used. The LISST-100X provides thedistribution of particle volume concentration in 32 size classeslogarithmically spaced within the range 1.25–250 µm (LISST type B)and the beam attenuation coefficient (c at 670 nm, hereafter denotedc670 and expressed in m−1) over an optical pathlength (l) of 5 cm.
The particle size distribution (PSD) is derived from the laserdiffraction technology. The measurement principle used by LISST-100X is based on the application of Mie's theory. Measurementprinciples, calibration and validation procedures of LISST are detailedin Traykovski et al. (1999) and Agrawal and Pottsmith (2000).
3.1.2. Optical backscattering sensor (OBS)Numerous studies have used optical backscattering sensors to
assess total SPM concentration through turbidity measurements (e.g.Creed et al., 2001; Fugate and Friedrichs, 2002; Hoitink, 2004;Voulgaris and Meyers, 2004). In this study, a Seapoint OBS sensor(λ=880 nm) connected to a Seabird SBE19 CTD probe was used. Thesensor was factory-adjusted for consistent response to FormazinTurbidity Standard. The calibration of backscattered light intensity tothe mass concentration of SPM is done experimentally and is usuallydescribed by a linear relationship (Hoitink, 2004). OBS sensitivity wasshown to be around 1 FTU for 1 mg L−1 in some coastal environments(Larcombe et al., 1995; Wass et al., 1997; Bunt et al., 1999; Jin et al.,2001) but requires a calibration per site and per OBS.
3.1.3. Mass concentration determined by filtrationWater sampling was performed using a 6-L Niskin bottle at 3 m
depth, and the in situ data were considered to correspond to theaverage of coincident optical probe data recorded from 1 m above to1 m below this sampling depth. Seawater was filtered in thelaboratory on pre-weighted 1-µm Nuclepore polycarbonate filters inorder to fit the LISST-100X sensing window (i.e., N1.25 µm). Weightmeasurements of filters were performed using a balance with aprecision of ±0.001 mg.
3.1.4. Disaggregation and individual particlesAPSD measurements were performed as follows: the material
retained on filters was resuspended in a solution of 0.01 M Na4P2O7
and sonicated for two minutes in a Sonifier, following Mikkelsen andPejrup (2000); the resulting solutionwas channeled in a closed circuitentrained by a peristaltic pump through the LISST-100Xmeasurementchamber. Water flow rate was adjusted to prevent settling and theproduction of bubbles, and a magnetic stirrer was activated in thesampling chamber to prevent particle settlement.
3.2. Sampling strategy
The data collection consisted of LISST-100X profiles in the watercolumn (at 1 Hz) and Seapoint OBS profiles (4 Hz) connected to aSeabird CTD. Only the downcast data were considered to avoiddisturbance caused by resuspension of particles when instrumentsreach the seabed.
The data considered in this study were collected over a series ofthree surveys (Fig. 1):
1. A monthly 30-hour survey was conducted fromMarch to September2005 and in February 2006. This survey offered a quasi-synopticselection of 31 stationswithin the SLNC. The collected datawere usedto assess the time and space variability of SPM and EPSD.
2. Transects focusing on open water to coast gradients wereperformed simultaneously to the monthly surveys as well as inDecember 2005 and March 2006. The data collected were used toassess the importance of aggregates in the EPSDbycomparingAPSDand EPSD.
3. 158 coincident CTD and LISST profiles were performed on asubstrate variability strategy in January and February 2006(Bissecote and “bay survey” stations in Fig. 1). These data wereused to map the mean SPM and EPSD distribution on the SLNC.
Water was sampled at approximately one out of every threesampling stations during these cruises. Filtering and weighting wereperformed at 137 stations.
3.3. Data analysis
3.3.1. SPM volume concentration (SPMVC)LISST software provides the volume concentration per size class.
The total SPM volume concentration (SPMVC, expressed in µL L−1) iscalculated using the relationship described by Traykovski et al. (1999):
SPMVC = ∑iCvol;i ð1Þ
where Cvol,i is the volume concentration in the ith LISST size class.Despite the smoothing parameter used to compute the particle
volume concentration distribution (Traykovski et al., 1999), LISST-100X derived data was highly variable on classes #1 and #32 evenwhen measuring continuously the same sample. Using anotherversion of LISST (sensing range of 1.25 to 500 µm) Traykovski et al.(1999) reported a lack of accuracy of the instrument for the biggest(N250 µm) and the smallest (b5 µm) particles of the sensing range.This high variability of the signal is likely due to the presence ofparticles smaller and coarser than the measured size range, whichaffects the estimated size distribution (Traykovski et al., 1999; Agrawaland Pottsmith, 2000; Mikkelsen and Pejrup, 2000; Fugate andFriedrichs, 2002; Voulgaris and Meyers, 2004; Mikkelsen et al.,2005). Due to this uncertainty, these two bins were excluded in theSPMVC calculation (i ranges from 2 to 31 in Eq. (1)). This exclusionmaylead to an underestimation of the SPMVC by not taking into accountthe volume concentration of particles in the size range of excludedbins. However, excluding some bins from the computation is asolution that has already been used in Curran et al. (2007) inwhich theexclusion concerns 6 bins of their LISST-100 data.
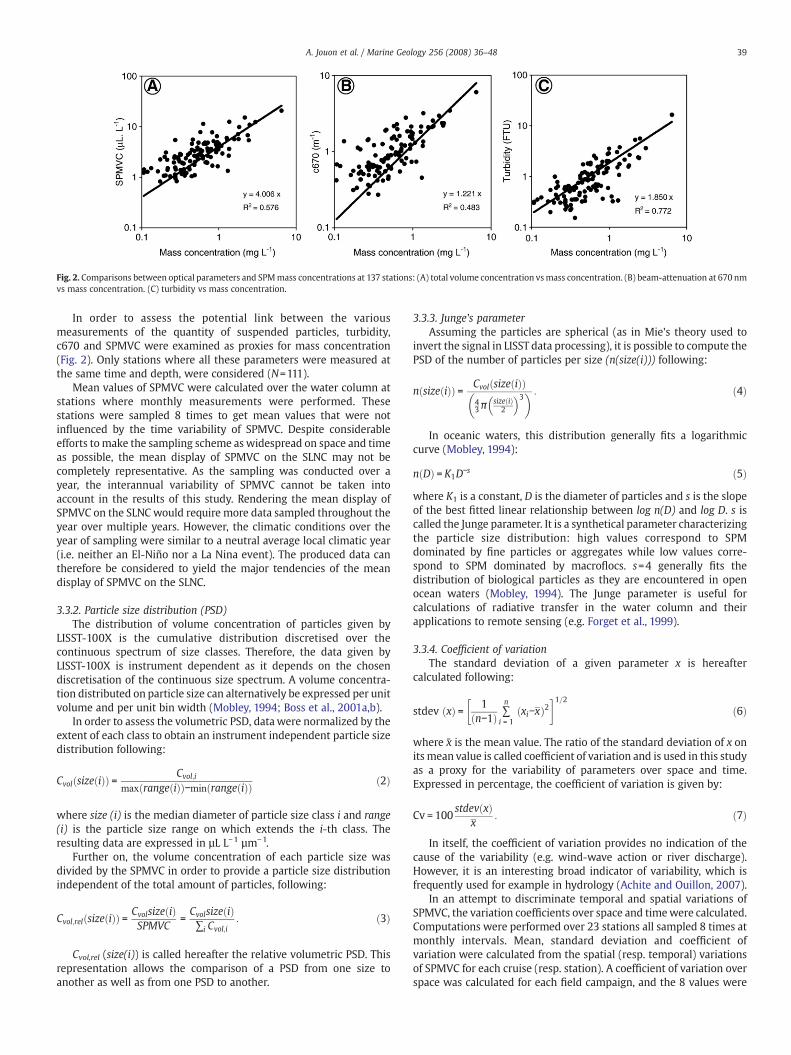
Fig. 2. Comparisons between optical parameters and SPMmass concentrations at 137 stations: (A) total volume concentration vsmass concentration. (B) beam-attenuation at 670 nmvs mass concentration. (C) turbidity vs mass concentration.
39A. Jouon et al. / Marine Geology 256 (2008) 36–48
In order to assess the potential link between the variousmeasurements of the quantity of suspended particles, turbidity,c670 and SPMVC were examined as proxies for mass concentration(Fig. 2). Only stations where all these parameters were measured atthe same time and depth, were considered (N=111).
Mean values of SPMVC were calculated over the water column atstations where monthly measurements were performed. Thesestations were sampled 8 times to get mean values that were notinfluenced by the time variability of SPMVC. Despite considerableefforts tomake the sampling scheme as widespread on space and timeas possible, the mean display of SPMVC on the SLNC may not becompletely representative. As the sampling was conducted over ayear, the interannual variability of SPMVC cannot be taken intoaccount in the results of this study. Rendering the mean display ofSPMVC on the SLNC would require more data sampled throughout theyear over multiple years. However, the climatic conditions over theyear of sampling were similar to a neutral average local climatic year(i.e. neither an El-Niño nor a La Nina event). The produced data cantherefore be considered to yield the major tendencies of the meandisplay of SPMVC on the SLNC.
3.3.2. Particle size distribution (PSD)The distribution of volume concentration of particles given by
LISST-100X is the cumulative distribution discretised over thecontinuous spectrum of size classes. Therefore, the data given byLISST-100X is instrument dependent as it depends on the chosendiscretisation of the continuous size spectrum. A volume concentra-tion distributed on particle size can alternatively be expressed per unitvolume and per unit bin width (Mobley, 1994; Boss et al., 2001a,b).
In order to assess the volumetric PSD, data were normalized by theextent of each class to obtain an instrument independent particle sizedistribution following:
Cvol size ið Þð Þ = Cvol;i
max range ið Þð Þ−min range ið Þð Þ ð2Þ
where size (i) is the median diameter of particle size class i and range(i) is the particle size range on which extends the i-th class. Theresulting data are expressed in µL L−1 µm−1.
Further on, the volume concentration of each particle size wasdivided by the SPMVC in order to provide a particle size distributionindependent of the total amount of particles, following:
Cvol;rel size ið Þð Þ = Cvolsize ið ÞSPMVC
=Cvolsize ið Þ∑i Cvol;i
: ð3Þ
Cvol,rel (size(i)) is called hereafter the relative volumetric PSD. Thisrepresentation allows the comparison of a PSD from one size toanother as well as from one PSD to another.
3.3.3. Junge's parameterAssuming the particles are spherical (as in Mie's theory used to
invert the signal in LISST data processing), it is possible to compute thePSD of the number of particles per size (n(size(i))) following:
n size ið Þð Þ = Cvol size ið Þð Þ43 π
size ið Þ2
� �3� � : ð4Þ
In oceanic waters, this distribution generally fits a logarithmiccurve (Mobley, 1994):
n Dð Þ = K1D−s ð5Þwhere K1 is a constant, D is the diameter of particles and s is the slopeof the best fitted linear relationship between log n(D) and log D. s iscalled the Junge parameter. It is a synthetical parameter characterizingthe particle size distribution: high values correspond to SPMdominated by fine particles or aggregates while low values corre-spond to SPM dominated by macroflocs. s=4 generally fits thedistribution of biological particles as they are encountered in openocean waters (Mobley, 1994). The Junge parameter is useful forcalculations of radiative transfer in the water column and theirapplications to remote sensing (e.g. Forget et al., 1999).
3.3.4. Coefficient of variationThe standard deviation of a given parameter x is hereafter
calculated following:
stdev xð Þ = 1n−1ð Þ ∑
n
i = 1xi−xð Þ2
� �1=2ð6Þ
where x̄ is the mean value. The ratio of the standard deviation of x onits mean value is called coefficient of variation and is used in this studyas a proxy for the variability of parameters over space and time.Expressed in percentage, the coefficient of variation is given by:
Cv = 100stdev xð Þ
x: ð7Þ
In itself, the coefficient of variation provides no indication of thecause of the variability (e.g. wind-wave action or river discharge).However, it is an interesting broad indicator of variability, which isfrequently used for example in hydrology (Achite and Ouillon, 2007).
In an attempt to discriminate temporal and spatial variations ofSPMVC, the variation coefficients over space and timewere calculated.Computations were performed over 23 stations all sampled 8 times atmonthly intervals. Mean, standard deviation and coefficient ofvariation were calculated from the spatial (resp. temporal) variationsof SPMVC for each cruise (resp. station). A coefficient of variation overspace was calculated for each field campaign, and the 8 values were

40 A. Jouon et al. / Marine Geology 256 (2008) 36–48
then averaged. A coefficient of variation over time was calculated foreach station, and these 23 values were then averaged providing amean coefficient of variation over time.
We do not claim to capture the complete time variability with 8dates. Such an attempt would require more sampled data, notablyduring stormepisodes. However, the concerned variation coefficient canbe consideredasan indicator of the timevariability of SPMVCfieldunderrecurrent and unexceptionalweather conditions. Furthermore, comput-ing a variability indicator over space should strictly use data sampledsynchronously over space. Unfortunately, this pre-requisite is notrealizable, as it would require as many LISST probes as the number ofstations that were considered. Thus, the variation coefficient computedover space inevitably includes a small amount of time variability, thescale of which is assessed in the results of this study.
3.3.5. State of aggregation indicatorThe state of aggregation of SPM was described through the ratio of
the volume concentration contained in aggregates over SPMVC, thetotal volume concentration. While all sizes in the EPSD probablyinclude a certain amount of aggregates, only a fraction of the particlesizes are proved to be entirely composed of aggregates. The ratio of thevolume concentration contained in these “all aggregate sizes” to theSPMVC, which is used in this study, is thus a low estimate of the realstate of aggregation.
4. Results
4.1. Suspended particulate matter volumetric concentration
4.1.1. Regressions between measurements
4.1.1.1. Optical measurements and mass concentration. 111 stationswith concurrent measurements of turbidity, c670 and SPMVC,correspond to values in the ranges of 0.2 to 16.2 FTU for turbidity,0.12–6.0 m−1 for c670, 0.48–20.5 µL L−1 for SPMVC and 0.01–6.48 mg L−1 for mass concentration.
The determination coefficient between turbidity and mass con-centration (r2=0.77, Fig. 2A) was better than the one obtained forvolume concentration (r2=0.58, Fig. 2B) and c670 (r2=0.48, Fig. 2C).Fig. 2 shows dispersed patches of points for low mass concentrationvalues (b1 mg L−1).
Fig. 3. Correlations of and mass concentration (N=111), turbidity and c670 (N
4.1.1.2. Measurements per LISST size class versus other parameters. Thecorrelations between turbidity, c670 and mass concentration, and thevolume concentration Cvol,i in each LISST-100X size class are shown inFig. 3.
Cvol,i showed a higher correlation to mass concentration than toturbidity and c670 for each particle size. The relation between volumeconcentration and mass concentration is more straightforward thanthe relations between volume concentration and other opticalmeasurements of SPM. Correlation coefficient between Cvol,i andmass concentration was over 0.7 for all size classes except for the sizeclass #1, and for size class #26 (~86 µm) and above. Cvol,i was globallybetter correlated with turbidity than with c670.
Interestingly, the correlation between volume concentration andany optical parameter decreased with increasing diameter above class#26.
The volume concentration of particles b3 µm (below class #6) wasnot as strongly correlated to any optical parameter than particles fromsize classes #6 to #15. The highest correlations between turbidity andvolume concentration were found for classes #6 to #18, i.e. forparticles with equivalent diameters between 3 and 23 µm. The highestcorrelations between c670 and volume concentration were found attwo intervals, which extend from classes #6 to #9 (ca. 3 to 5 µm) andfrom #22 to #26 (ca. 40 to 100 µm). Further observations concerningthe second size range showing stronger correlation to the beamattenuation are given in section 5 below.
4.1.2. Mean spatial distribution of suspended particulate mattervolumetric concentration
Mean SPMVC values were low (b7.5 µL L−1, Fig. 4). A reef-to-landgradient is visible. The volume concentrationwas highest at the head ofbays, and peaked in a bay strongly impacted by urban inputs, i.e. the bayof Sainte-Marie (see location in Fig. 1). SPMVC was also high in theDumbeaBay. InsideDumbeaBay, theBayofGrandeRade is characterizedby intense industrial activity, leading to industrial inputs of particles tothe SLNC (e.g. polder constructionwith scoria, penetration offlying ashesfrom blast-furnace by deposition at the sea surface). The third zonewithrelatively high SPMVC was the bay of Boulari, which receives terrestrialinputs from La Coulée River (Fernandez et al., 2006).
The analysis of vertical profiles shows that SPMVC, turbidity andbeam attenuation coefficient tend to increase within the benthicbottom layer (a typical example is given in Fig. 5).
=36043) with SPM volume concentration per LISST size class in the SLNC.
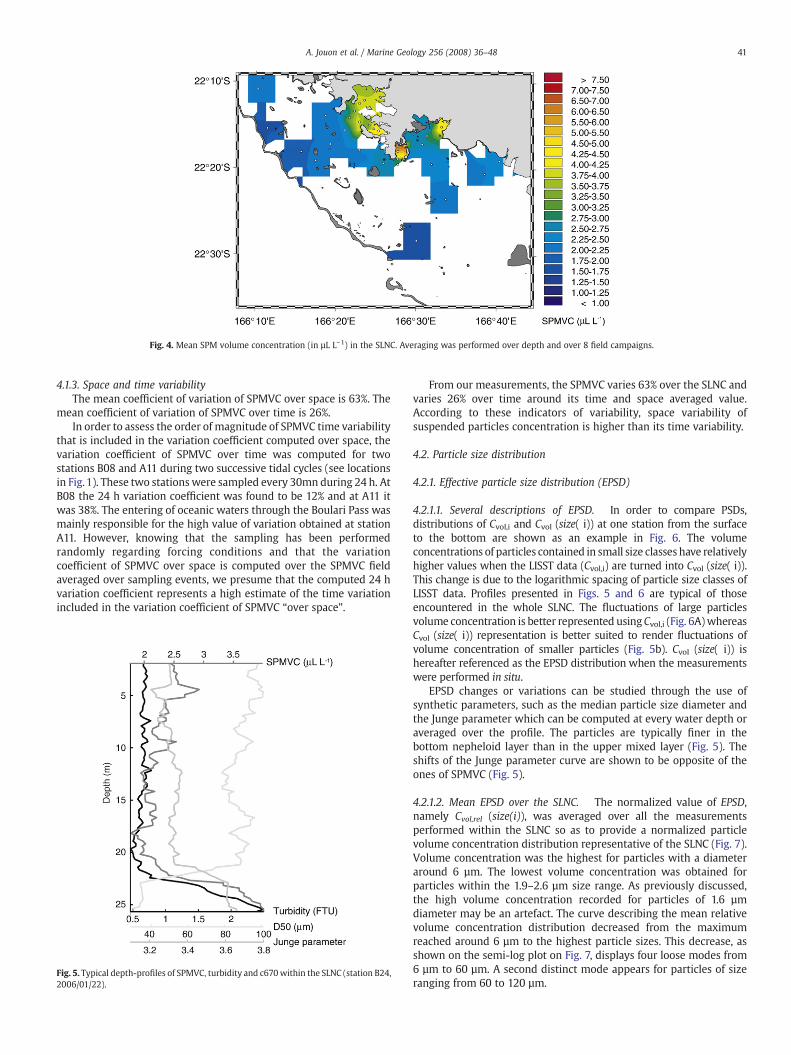
Fig. 4. Mean SPM volume concentration (in µL L−1) in the SLNC. Averaging was performed over depth and over 8 field campaigns.
41A. Jouon et al. / Marine Geology 256 (2008) 36–48
4.1.3. Space and time variabilityThe mean coefficient of variation of SPMVC over space is 63%. The
mean coefficient of variation of SPMVC over time is 26%.In order to assess the order of magnitude of SPMVC time variability
that is included in the variation coefficient computed over space, thevariation coefficient of SPMVC over time was computed for twostations B08 and A11 during two successive tidal cycles (see locationsin Fig.1). These two stations were sampled every 30mn during 24 h. AtB08 the 24 h variation coefficient was found to be 12% and at A11 itwas 38%. The entering of oceanic waters through the Boulari Pass wasmainly responsible for the high value of variation obtained at stationA11. However, knowing that the sampling has been performedrandomly regarding forcing conditions and that the variationcoefficient of SPMVC over space is computed over the SPMVC fieldaveraged over sampling events, we presume that the computed 24 hvariation coefficient represents a high estimate of the time variationincluded in the variation coefficient of SPMVC “over space”.
Fig. 5. Typical depth-profiles of SPMVC, turbidity and c670within the SLNC (station B24,2006/01/22).
From our measurements, the SPMVC varies 63% over the SLNC andvaries 26% over time around its time and space averaged value.According to these indicators of variability, space variability ofsuspended particles concentration is higher than its time variability.
4.2. Particle size distribution
4.2.1. Effective particle size distribution (EPSD)
4.2.1.1. Several descriptions of EPSD. In order to compare PSDs,distributions of Cvol,i and Cvol (size( i)) at one station from the surfaceto the bottom are shown as an example in Fig. 6. The volumeconcentrations of particles contained in small size classes have relativelyhigher values when the LISST data (Cvol,i) are turned into Cvol (size( i)).This change is due to the logarithmic spacing of particle size classes ofLISST data. Profiles presented in Figs. 5 and 6 are typical of thoseencountered in the whole SLNC. The fluctuations of large particlesvolume concentration is better represented usingCvol,i (Fig. 6A)whereasCvol (size( i)) representation is better suited to render fluctuations ofvolume concentration of smaller particles (Fig. 5b). Cvol (size( i)) ishereafter referenced as the EPSD distribution when the measurementswere performed in situ.
EPSD changes or variations can be studied through the use ofsynthetic parameters, such as the median particle size diameter andthe Junge parameter which can be computed at every water depth oraveraged over the profile. The particles are typically finer in thebottom nepheloid layer than in the upper mixed layer (Fig. 5). Theshifts of the Junge parameter curve are shown to be opposite of theones of SPMVC (Fig. 5).
4.2.1.2. Mean EPSD over the SLNC. The normalized value of EPSD,namely Cvol,rel (size(i)), was averaged over all the measurementsperformed within the SLNC so as to provide a normalized particlevolume concentration distribution representative of the SLNC (Fig. 7).Volume concentration was the highest for particles with a diameteraround 6 µm. The lowest volume concentration was obtained forparticles within the 1.9–2.6 µm size range. As previously discussed,the high volume concentration recorded for particles of 1.6 µmdiameter may be an artefact. The curve describing the mean relativevolume concentration distribution decreased from the maximumreached around 6 µm to the highest particle sizes. This decrease, asshown on the semi-log plot on Fig. 7, displays four loose modes from6 µm to 60 µm. A second distinct mode appears for particles of sizeranging from 60 to 120 µm.
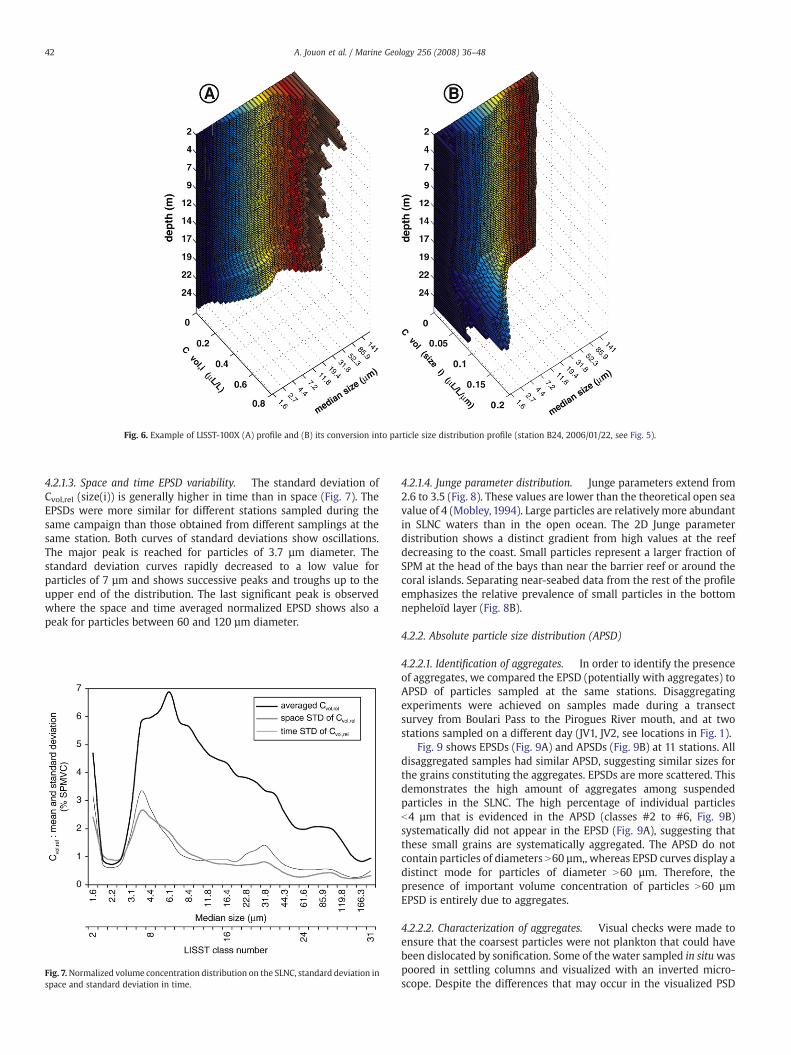
Fig. 6. Example of LISST-100X (A) profile and (B) its conversion into particle size distribution profile (station B24, 2006/01/22, see Fig. 5).
42 A. Jouon et al. / Marine Geology 256 (2008) 36–48
4.2.1.3. Space and time EPSD variability. The standard deviation ofCvol,rel (size(i)) is generally higher in time than in space (Fig. 7). TheEPSDs were more similar for different stations sampled during thesame campaign than those obtained from different samplings at thesame station. Both curves of standard deviations show oscillations.The major peak is reached for particles of 3.7 µm diameter. Thestandard deviation curves rapidly decreased to a low value forparticles of 7 µm and shows successive peaks and troughs up to theupper end of the distribution. The last significant peak is observedwhere the space and time averaged normalized EPSD shows also apeak for particles between 60 and 120 µm diameter.
Fig. 7.Normalized volume concentration distribution on the SLNC, standard deviation inspace and standard deviation in time.
4.2.1.4. Junge parameter distribution. Junge parameters extend from2.6 to 3.5 (Fig. 8). These values are lower than the theoretical open seavalue of 4 (Mobley, 1994). Large particles are relatively more abundantin SLNC waters than in the open ocean. The 2D Junge parameterdistribution shows a distinct gradient from high values at the reefdecreasing to the coast. Small particles represent a larger fraction ofSPM at the head of the bays than near the barrier reef or around thecoral islands. Separating near-seabed data from the rest of the profileemphasizes the relative prevalence of small particles in the bottomnepheloïd layer (Fig. 8B).
4.2.2. Absolute particle size distribution (APSD)
4.2.2.1. Identification of aggregates. In order to identify the presenceof aggregates, we compared the EPSD (potentially with aggregates) toAPSD of particles sampled at the same stations. Disaggregatingexperiments were achieved on samples made during a transectsurvey from Boulari Pass to the Pirogues River mouth, and at twostations sampled on a different day (JV1, JV2, see locations in Fig. 1).
Fig. 9 shows EPSDs (Fig. 9A) and APSDs (Fig. 9B) at 11 stations. Alldisaggregated samples had similar APSD, suggesting similar sizes forthe grains constituting the aggregates. EPSDs are more scattered. Thisdemonstrates the high amount of aggregates among suspendedparticles in the SLNC. The high percentage of individual particlesb4 µm that is evidenced in the APSD (classes #2 to #6, Fig. 9B)systematically did not appear in the EPSD (Fig. 9A), suggesting thatthese small grains are systematically aggregated. The APSD do notcontain particles of diameters N60 µm,, whereas EPSD curves display adistinct mode for particles of diameter N60 µm. Therefore, thepresence of important volume concentration of particles N60 µmEPSD is entirely due to aggregates.
4.2.2.2. Characterization of aggregates. Visual checks were made toensure that the coarsest particles were not plankton that could havebeen dislocated by sonification. Some of the water sampled in situwaspoored in settling columns and visualized with an inverted micro-scope. Despite the differences that may occur in the visualized PSD
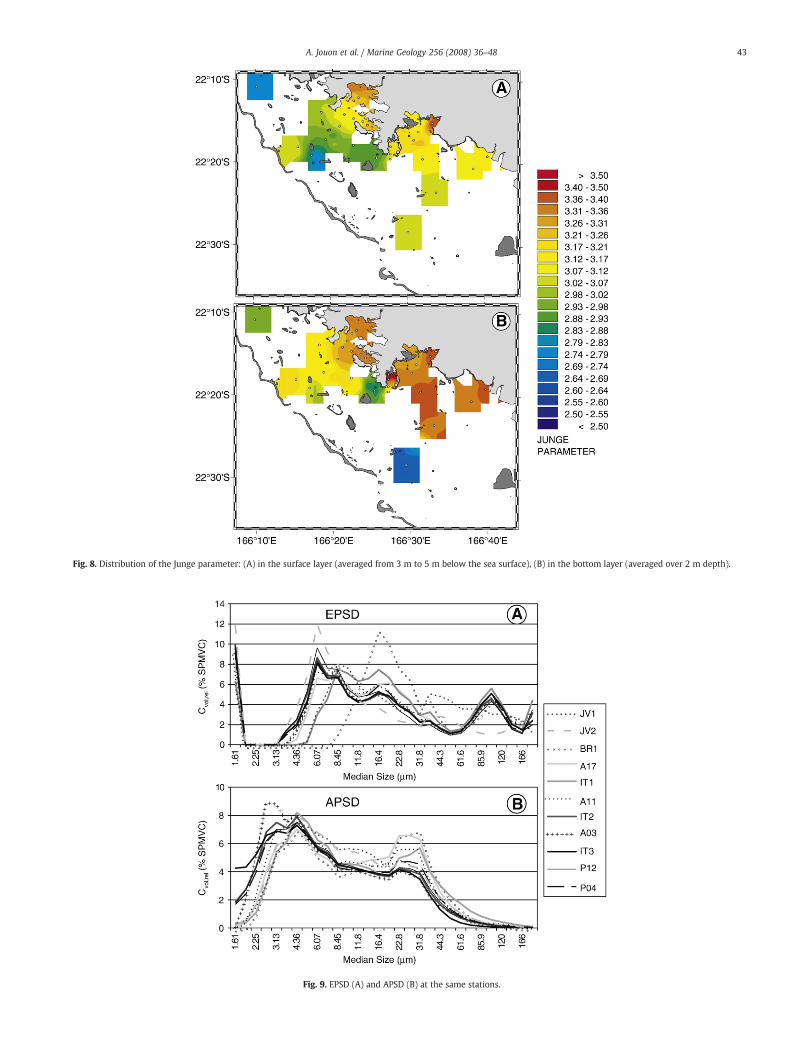
Fig. 8. Distribution of the Junge parameter: (A) in the surface layer (averaged from 3 m to 5 m below the sea surface), (B) in the bottom layer (averaged over 2 m depth).
Fig. 9. EPSD (A) and APSD (B) at the same stations.
43A. Jouon et al. / Marine Geology 256 (2008) 36–48
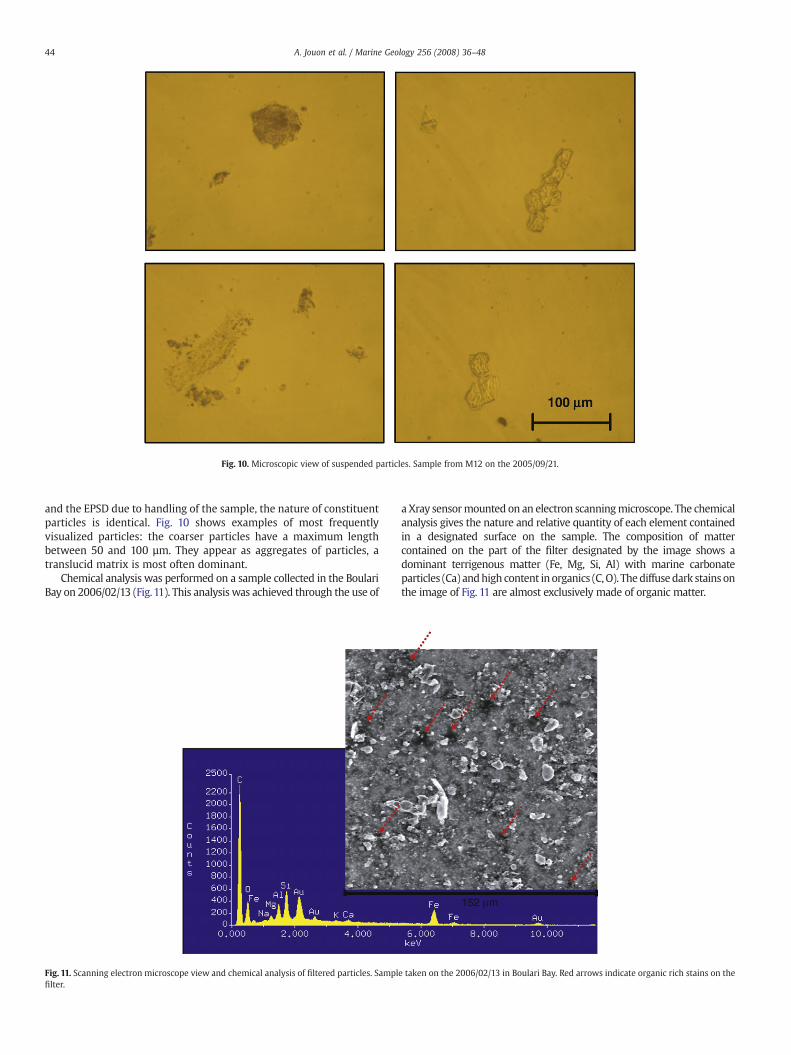
Fig. 10. Microscopic view of suspended particles. Sample from M12 on the 2005/09/21.
44 A. Jouon et al. / Marine Geology 256 (2008) 36–48
and the EPSD due to handling of the sample, the nature of constituentparticles is identical. Fig. 10 shows examples of most frequentlyvisualized particles: the coarser particles have a maximum lengthbetween 50 and 100 µm. They appear as aggregates of particles, atranslucid matrix is most often dominant.
Chemical analysis was performed on a sample collected in the BoulariBay on 2006/02/13 (Fig.11). This analysis was achieved through the use of
Fig. 11. Scanning electron microscope view and chemical analysis of filtered particles. Samplfilter.
a Xray sensormounted on an electron scanningmicroscope. The chemicalanalysis gives the nature and relative quantity of each element containedin a designated surface on the sample. The composition of mattercontained on the part of the filter designated by the image shows adominant terrigenous matter (Fe, Mg, Si, Al) with marine carbonateparticles (Ca) andhigh content inorganics (C,O). Thediffusedark stains onthe image of Fig. 11 are almost exclusively made of organic matter.
e taken on the 2006/02/13 in Boulari Bay. Red arrows indicate organic rich stains on the

Fig. 12. Percentage of SPM volume concentration in aggregates of diameter N60 µm.
45A. Jouon et al. / Marine Geology 256 (2008) 36–48
4.2.2.3. Aggregates' contribution to suspended particulate mattervolumetric concentration. The percentage of SPMVC contained inaggregates N60 µm always exceeded 38% on the SLNC (Fig. 12). Highervalues of relative abundance of large aggregates (~70%) were found inthe surroundings of the barrier reef and coral islands. The percentageof volume concentration contained in aggregates N60 µm was higherthan 45% all along the transect survey stations (Fig. 13). While theSPMVC increased from the reef to the coast, the percentage ofsuspended particles in aggregates N60 µm decreased.
5. Discussion
5.1. Suspended particulate matter volumetric concentration
The mean distribution of SPMVC on the SLNC is characterized by amajor reef to coast gradient (Fig. 4) which is in fair agreement withturbidity distributions obtained from satellite data, field measure-ments and modeling exercises conducted in October 2002 (Ouillonet al., 2004). The variability of SPMVC is significant over space andtime. The computed coefficient of variability over space includes someshort-term variability. An estimate of the scale of this short-termvariability showed that it could be neglected. Results have shown thatthe quantity of suspended particles on the SLNC was relatively morevariable throughout the lagoon at a given moment than at a specificlocation throughout time in usual weather conditions (i.e. exceptduring storms that were not sampled). Within the water depth, alloptical measurements showed a net increase of SPM in the bottomnepheloïd layer, especially high in the bays around the Nouméa
Fig. 13. SPMVC and Percentage of SPM volume concentration in aggregates of diameterN60 µm along a coast-large transect.
Peninsula (Fig. 5). Although the quantity of particle inputs to the SLNChave increased during the past century, the extent and volume of thisnepheloïd layer is much smaller than in the GBR located 1500 kmWest from New Caledonia (Wolanski et al., 2003b).
In the SLNC, benthic sediments are the main source of suspendedparticles through resuspension (Clavier et al., 1995). Resuspension isgoverned by the availability of particles at the seabed, their erodibilityproperties, and the bottom shear stress whose variability is mainlyconstrained by the bathymetry variations (Douillet et al., 2001). In anoptimization exercise involving a numerical model and turbiditymeasurements, Ouillon et al. (2004) showed that terrigenoussediments were more easily erodible than biogenic carbonate sedi-ments in the SLNC. In her study on sewage muds, Tixier (2003)demonstrated that carbonates are more cohesive than terrigenoussilicate particles of same diameter. As the terrigenous sedimentsdominates in the vicinity of rivermouths (Debenay,1987; Chardy et al.,1988), the mean distribution of SPMVC show the highest values inDumbea Bay and in Boulari Bay were sediments that are more easilyeroded. In areas of higher residence time, as in Grande Rade and in theSainte-Marie Bay, Mari et al. (2007) proved that aggregates includedolder organic matter leading to a lower density of aggregates. The highvalues of SPMVC inside these bays could also be due to a slower settlingof particles than in other parts of the lagoon where residence time islower (Jouon et al., 2006).
5.2. Variability of EPSD: aggregation processes
Even if it bears some of the short-term variability of EPSD, thestandard deviation of relative EPSD over space can be considered as asignificant index of space variability of EPSD. It was found to be lowerthan the standard deviation of relative EPSD over time suggesting that,contrary to the volume concentration of particles, long term(monthly) variability of the effective particle size distribution washigher than its spatial variability.
The disaggregating experiments showed that in situ particles withdiameter over 60 µm were aggregates. The particles smaller than60 µm observed during field measurements were composed of anundetermined fraction of aggregates. Considering that particles ofdiameter N60 µm represent all aggregates gives us a low estimate ofthe state of aggregation of EPSD. This low estimation still represents asignificant fraction of the volume concentration (40 to 90%, Fig. 12).
The comparisons of dispersed APSDs to EPSDs show that particlesb4 µm are systematically aggregated. The highest values of standarddeviations over space and time in the EPSD (class #7, see Fig. 7)
46 A. Jouon et al. / Marine Geology 256 (2008) 36–48
coincide with the upper size limit of the single particles showing astrong propensity to be aggregated (Fig. 9). These high standarddeviations are encountered for the particle sizes at the boundarybetween the most abundant (6 µm) and the most rare (b3 µm)effective natural particle sizes, suggesting a shift from small particles(b3 µm) to larger due to aggregation. Moreover, as APSDs show thatthere were no individual grains N60 µm in SPM (Fig. 9b), the peaks instandard deviation of PSD over space and time for size ~100 µm (Fig. 7)concern aggregates and are likely due to aggregation/disaggregationprocesses. These two points suggest that aggregation significantlyinfluences the variability of EPSD.
Figs. 5 and 6 indicate that, the proportion of large particles(aggregates) is higher in the upper and less turbid waters.
5.3. Quantifying SPM from optical measurements
The obtained values of determination coefficient are low, whichindicates that the relationship between mass concentration and bulkoptical measurements of SPM is not straightforward.
The slope of the linear regression relationship between turbidityand mass concentration is about 85% higher than that usually used inturbid estuaries (e.g. Jin et al., 2001). This slope was shown to bestrongly dependent of the particle diameter and gets steeper withdecreasing diameter (Bunt et al., 1999).
The comparison of correlation between OBS signal and each class ofthe EPSD highlights that turbidity is more sensitive to the smallestparticles (between 2 and 22 µm, see Fig. 3) (Bunt et al.,1999; Creed et al.,2001). This result supports previous results suggesting a correction ofOBS signal to derive SPM concentration by taking into account themedian diameter of EPSD (e.g. Lynch et al., 1994). Aggregation increasesthe mean diameter of particles and was already shown to beresponsible for lowering the turbidity signal at an equal massconcentration (Gibbs and Wolanski, 1992). The variability of thepercentage of aggregates (Fig. 12) thus likely explains the lowdetermination coefficient obtained between turbidity and mass con-centration (Fig. 2) as compared to determination coefficient reported insome other coastal zones.
The highest correlations between beam attenuation at 670 nm andvolume concentration were found at two intervals of LISST data EPSD(Fig. 3). The first size range to which c670 is more sensitive (3 to 5 µm)is in accordance with previously published results: beam attenuationincreases with decreasing mean grain size at the same SPM up to 14-fold (Baker and Lavelle, 1984; Boss et al., 2001a,b). A second interval ofeven better correlation between c670 and LISST data EPSD concernsparticles in classes #22 to #26 (~40 to 100 µm). These size classescorrespond approximately to the smallest particles identified asaggregates: these particles may not be too large to efficientlyattenuate light and they are also well represented in the SPM pool.
However, the present correlations show that, contrary to theprevious version of LISST, the LISST-100X provides reliable measure-ments between 2 and 5 µm.
The lowering of correlation for the large bin sizes of LISST can beinterpreted as a negligible contribution of the coarse particles toturbidity and mass concentration. This suggests that coarser particlesbackscatter light less efficiently and have a lower density.
Unlike turbidity and beam attenuation signals, LISST measure-ments of volume concentration are not dependent upon the particlesize distribution but they are restricted to particles with diametercomprised between 1.48 and 213 µm, whereas mass concentration isdetermined for all particles N1 µm.
The imprecision of LISST at extreme values and the exclusion ofthese values from the analysis is a potential source of error. Creed et al.(2001) used another version of LISST-100which has a sensing windowthat extends from 1.25 to 500 µm. They reported the inability of theinstrument to correctly measure sediment of grain size N250 µm(which included the top four bins of their LISST's version) and b5 µm.
Furthermore, the contribution of noise to the measurement limits toabout 10-12 the number of sizes classes that may be resolved throughthe 200:1 size range observable by this instrument (Sequoia ScientificInc., 2001). Each size class measurement is thus not entirelyindependent from the adjacent size class value. As a result, morethan a single size class could be excluded from computations at theboundaries of LISST-100X sensing range.
In the present study, extremely weak correlations were obtainedfor the outlying size classes which supports our decision to excludethese bins from other computations.
Another potential source of discrepancy in the determinationcoefficient betweenmass and volume concentrationsmay be linked tothe LISST data processing. A unique constant is used to calculate thevolume concentration of particles from the intensity of diffracted lightin every size class. This constant is determined experimentally by themanufacturer. First studies which used LISST with a single volumeconversion constant underlined the accuracy of such processing(Traykovski et al., 1999; Agrawal and Pottsmith, 2000). However,Gartner et al. (2001) demonstrated that the instrument dependentconstant was also class dependent. The results displayed in Mikkelsenet al. (2005) also suggest the class dependency of the volumeconversion constant.
The variability of density of sensed particles could also explaindiscrepancies in the mass to volume concentration ratio. Biogenic andterrigenous particles do not strictly have the same density. Given theabundance of aggregates in the study area, the variation of densitycould be mainly attributed to the variability of aggregate density andto the variability of the state of aggregation of EPSD.
Results show that aggregates are dominant constituents of SPM.Under the conditions of having a much larger volume of watercompared to the volume of solid grains in the aggregates, Mikkelsenand Pejrup (2001) proposed the following relation to determine themean density of suspended aggregates:
Δρ = ρF−ρW≈TSM
SPMVCð8Þ
where Δρ is the aggregate's effective mean density, ρW is the waterdensity (ρW=1.02 kg L−1 is considered in the calculation), ρF is thedensity of aggregates, and TSM is Total Suspended Matter massconcentration. The linear regression between SPMVC and massconcentration yields a slope coefficient equal to 4.0 µL mg−1 (Fig. 2a).Considering for this computation that all sensedparticles are aggregates,the corresponding Δρ is thus 0.25 kg L−1, which provides mean densityof equivalent aggregates over the sampling scheme ρF=1.27 kg L−1. Thecomputed value of mean particle density is lower than terrigenousgrain's density, but higher than the high range of aggregates densitiesgiven in Mikkelsen and Pejrup (2001) (ρF=1.037 to 1.194 kg L−1).
5.4. An insight into aggregation process regulation
Although the suspended particle concentrationwas very low in thecoral reef lagoon of New Caledonia, aggregation was shown to besignificant.
The size, density and strength of aggregates are dependent on thetotal amount of suspended sediments, suspension residence time,turbulence, salinity, temperature, coatings on particles surfaces,dissolved organic substances, and biological organisms (Voulgarisand Meyers, 2004). The amount of aggregates over total SPM and thesize of the aggregates are continuously changing and determined byaggregation and disaggregation processes (Chaignon et al., 2002). Thetime scale of aggregation is generally considered to be short (Gibbsand Wolanski, 1992; Wolanski et al., 2003a). Gratiot and Manning(2004) show that it takes about 30min for a dense suspension to reachthe equilibrium under turbulent conditions in a laboratory. Since thistime scale of aggregation was not inferred from our measurements in

47A. Jouon et al. / Marine Geology 256 (2008) 36–48
the SLNC, we may only consider as a first step that the state ofaggregation is in equilibrium with the surrounding parameters.
Two fundamental conditions must be fulfilled for aggregation totake place: first, particles must collide and second, they must adhere(van Leussen, 1994). The frequency of collisions increases when theconcentration of suspended particles is high. Working on activatedsludge, Chaignon et al. (2002) demonstrated a linear relation betweenthe mass concentration of sludge and the mean aggregate size. In thisstudy, the depth-profile of EPSD showed a lesser percentage ofaggregates in the bottom nepheloïd layer, which is somewhatcontradictory to the dependency of aggregation processes on theSPM mass concentration (Fig. 5). This result is also in opposition withthe tendency observed in the Mid-Atlantic Bight where the spectralshape of EPSD is steeper when distance to the bottom increases (Bosset al., 2001b). The observed increase of volume concentration andlowering of the relative quantity of aggregates on a reef to coasttransect also seems paradoxical with the dependency of aggregationprocesses on the SPM concentration (Fig. 13).
Amongmechanisms known to promote collision (Brownianmotion,turbulence, and differential sedimentation) and to induce breaking ofaggregates (Alldredge et al., 1990; van Leussen, 1994; Chaignon et al.,2002), turbulence is a key hydrodynamic parameter. As turbulence wasnot measured during our field campaigns, we explored the sensitivitiesof EPSD to sea level speedof variation (as proxyof turbulence inducedbythe tide) and to wind velocity (as a proxy of turbulence induced by thewind), but found no significant relationships.
The “stickiness” of aggregates is another important parameter todetermine the aggregate size. The stickiness of a single particle isdetermined by two primary mechanisms: electrostatic forces, con-sidered to be the most common interaction responsible for inorganicparticle coagulation (Voulgaris and Meyers, 2004), and biologicalactivity (van Leussen, 1994).
Having shown that SPMVC is low on the barrier reef side of thelagoon and that the percentage of aggregates is higher in these areas,this study suggests that stickiness is a contributing factor for the stateof aggregation of EPSD on the SLNC.
Organic matter improves the stickiness of aggregates (Gratiot andManning, 2004). Many studies focusing on biologically aggregatedflocs (i.e. organic aggregates) emphasize the importance of exopoly-meric substances as the main floc forming constituent (Chaignonet al., 2002; Mikkelsen and Keiding, 2002a,b; Thornton, 2002; Tixier,2003; Wolanski et al., 2003a; Sheng et al., 2006). Exopolymericsubstances originate from marine life metabolism or cell lyses.Transparent Exopolymeric Particles (TEP) are formed by coagulationof exopolymeric substances, and are positively buoyant particles thathave been shown to regulate the buoyancy of aggregates (Azetsu-Scott, 2004). On the SLNC, Mari et al. (2007) show that aggregatesremain in suspension after prolonged steady calm conditions andexplain their low fall velocity by the inclusion of TEP in the aggregates.The visualization of aggregates through a microscope showed that animportant volume of aggregates was filled with a translucid matrix.The result of chemical analysis supports that carbon is a majorconstituent of suspended particles on the SLNC. These two observa-tions support the conclusions of Mari et al. (2007) regarding thepresence of TEP inside the SPM pool. In a system dominated bymineral particles, aggregation is often associated with an increase insettling velocity (van Leussen, 1994; Winterwerp, 2002; Gratiot et al.,2005). The low settling velocity observed by Mari et al. (2007)discredit the assumption used in previous studies of particle transporton the SLNC of an inorganic particle dominated environment.Furthermore, the estimated aggregate density (1.27 g cm−3) is inaccordance with the range of measured densities for solid matter oflarge aggregates cited in Mari et al. (2007) (i.e., from 1.095 to 1.497 gcm−3, values given in a review by Azetsu-Scott and Johnson, 1992).
The monthly variability of EPSD computed in this study was higherthan their 24 hour-variability or spatial variability. The time scale
variations of EPSD does not seem to be connected to the time scales ofthe major physical forcings which take place on the SLNC.
Spatially, the higher percentage of aggregates in the SLNC are found inthe surroundings of the barrier reef and around coral islands. Coralecosystems are known to release large amounts of exopolymericsubstances (i.e., up to 4.8 L of mucus per day per square meter of coralreef, Wild et al., 2004). The abundance of exopolymeric substances incorals environments may enhance overall sticking properties of sus-pended particles and, thus, raise the critical level of turbulence necessaryto break aggregates apart. This assumption is consistent with previousobservations of enhanced aggregation and reduced settling velocityaround coral reefs: Wolanski et al. (2003a) brought to light low settlingvelocities for aggregates occurring in a reef fringed bay and argued thatthese low settling velocitieswere best explained by the inclusion of TEP inthe composition of aggregates; theflocculation catalyzed by the proximityof a coral reefwasalsoaplausible explanation for the conclusionsobtainedin Hoitink (2004): “Coral reefs create a distinct sedimentary regime intheir surroundings, sediments transported towards coral reef environ-ments do not address local turbidity variation”.
Finally, all these elements bring up the hypothesis of biologicalaggregation as an important process in suspended particle transportin coral environments.
6. Conclusion
The dependence of the beam attenuation coefficient and turbidity tothe particle size distributionwas highlighted. Both parameters increasewithdecreasingmeangrain size (Baker and Lavelle,1984;MikkelsenandPejrup, 2000; Boss et al., 2001b). As the state of aggregation may bealtered during sample handling, the calibrations of beam attenuationmeasuring devices and OBS have to be done in situ. Even then, theimportance and the variability of the state of aggregation of EPSD lead toimportant fluctuations in the signal to mass ratio for both devices. OBSand c670measurementsmaynot be suitable to properly quantify SPM inenvironments where large particles and/or aggregates dominate (Creedet al., 2001). As OBS are less sensitive to large aggregates than toindividual grains, disaggregation can potentially lead to increasedturbidity (Mikkelsen and Keiding, 2002b), and may lead to misinter-pretation of functioning of studied systems (Ellis et al., 2004).
Although inputs of sediments to the SLNC have increased over the lastcentury, SPM exhibits very low concentration (0.1 to 8 mg L−1). A highpercentage of aggregates (45 to 75%) compose the SPM. This percentagevaries significantly, with higher variations at a monthly-scale than overspace as well as over 24 h in non-extreme weather conditions. Knowingthat OBS devices and beam attenuation factors are particle size sensitive,the dynamic of the state of aggregation can lead to variations in themeasurement of suspended particle load. Standing on previouslypublished observations (Mari et al., 2007) and relying on visualobservations of the aggregates as well as an analysis of the chemicalcomposition of one sample, biological aggregation seems to have adominant impacton theEPSD in theSLNC.Despite a lackofmeasurementsof physical forcings such as turbulence, the spatial extent of our studyallowed us to identify an increase of aggregate percentage in thesurroundings of coral reefs. The hypothesis is offered that aggregationcould be catalyzed by the proximity of coral ecosystems. The catalyzationof biological aggregation in the surroundings of a coral ecosystemwouldaffect the fateof all suspendedparticulatematter inall coral environments.
Acknowledgments
This work was supported by the New Caledonian ‘‘ZoNéCo'’ program,by the French BISSECOTE program (“ACI Observation de la Terre”), and bythe French ‘‘Programme National Environnement Côtier’’. The authorswarmly thank Jean-Pierre Lamoureux who measured dry weight ofparticles, SamTereua, NapoléonColombani,Miguel Clarke and the crewofN.O. Alis for their contribution to the field measurements.

48 A. Jouon et al. / Marine Geology 256 (2008) 36–48
References
Achite, M., Ouillon, S., 2007. Suspended sediment transport in a semiarid watershed,Wadi Abd, Algeria (1973–1995). J. Hydrol. 343, 187–202.
Agrawal, Y.C., Pottsmith, H.C., 2000. Instrument for particle size and settling velocityobservations in sediment transport. Mar. Geol. 16, 89–114.
Alldredge, A.L., Granata, T.C., Golschalk, C.C., Dickey, T.D., 1990. The physical strength ofmarine snow and its implications for particle disaggregation in the ocean. Limnol.Oceanogr. 35, 1415–1428.
Azetsu-Scott, K., 2004. Ascending marine particles: Significance of transparentexopolymer particles (TEP) in the upper ocean. Limnol. Oceanogr. 49, 741–748.
Azetsu-Scott, K., Johnson, B.D., 1992. Measuring physical characteristics of particles: anewmethod of simultaneous measurement for size, settling velocity and density ofconstituent matter. Deep-Sea Res. 39, 1057–1066.
Babcock, R., Davies, P., 1991. Effects of sedimentation on settlement of Acroporamillepora. Coral Reefs 9, 205–208.
Baker, E.T., Lavelle, J.W., 1984. The effect of particle size on the light attenuationcoefficient of natural suspensions. J. Geophys. Res. 89, 8197–8203.
Benson, A.A., Muscatine, L., 1974. Wax in coral mucus: Energy transfer from coral tofishes. Limnol. Oceanogr. 19, 810–814.
Bird, E.F.C., Dubois, J.P., Iltis, J.A., 1984. The Impacts of Opencast Mining on the Rivers andCoasts of New Calodonia. United Nations University, Tokyo.
Bonneton, P., Lefebvre, J.P., Bretel, P., Ouillon, S., Douillet, P., 2007. Tidal modulation ofwave-setup and wave-induced currents on the Aboré coral reef, New Caledonia.J. Coast. Res. 50 (SI), 762–766.
Boss, E., Twardowski, M.S., Herring, S., 2001a. Shape of the particulate beam attenuationspectrum and its inversion to obtain the shape of the particulate size distribution.Appl. Opt. 40, 4885–4893.
Boss, E., Pegau, W.S., Gardner, W.D., Zaneveld, J.R.V., Barnard, A.H., Twardowski, M.S.,Chang, G.C., Dickey, T.D., 2001b. Spectral particulate attenuation and particle sizedistribution in the bottom boundary layer of a continental shelf. J. Geophys. Res.106, 9509–9516.
Bunt, J.A.C., Larcombe, P., Jago, C.F., 1999. Quantifying the response of optical backscatterdevices and transmissometers to variations in suspended particulate matter. Cont.Shelf Res. 19, 1199–1220.
Chaignon, V., Lartigues, B.S., El Samrani, A., Mustin, C., 2002. Evolution of sizedistribution and transfer of mineral particles between flocs in activated sludges: aninsight into floc exchange dynamics. Water Res. 36, 676–684.
Chardy, P., Chevillon, C., Clavier, J., 1988. Major benthic communities of the south-westlagoon of New Caledonia. Coral Reefs 7, 69–75.
Clavier, J., Chardy, P., Chevillon, C., 1995. Sedimentation of particulate matter in thesouth-west lagoon of New Caledonia: spatial and temporal patterns. Estuar. Coast.Shelf Sci. 40, 281–294.
Creed, E.L., Pence, A.M., Rankin, K.L., 2001. Inter-comparison of turbidity and sedimentconcentration measurements from an ADP, an OBS-3, and a LISST. Oceans 2001,Proc. MTS/IEEE conf. 3, pp. 1750–1754.
Curran, K.J., Hill, P.S., Milligan, T.G., Mikkelsen, O.A., Law, B.A., Durrieu de Madron, X.,Bourrin, F., 2007. Settling velocity, effective density, and mass composition ofsuspended sediment in a coastal bottom boundary layer, Gulf of Lions, France. Cont.Shelf Res. 27, 1408–1421.
Debenay, J.P., 1987. Sedimentology in the south-west lagoon of New Caledonia, SWPacific. J. Coast. Res. 3, 77–91.
Douillet, P., 1998. Tidal dynamics of the south-west lagoon of New Caledonia:observations and 2D numerical modelling. Oceanol. Acta 21 (1), 69–79.
Douillet, P., Ouillon, S., Cordier, E., 2001. A numerical model for fine suspended sedimenttransport in the southwest lagoon of New Caledonia. Coral Reefs 20, 361–372.
Droppo, I.G., 2001. Rethinking what constitutes suspended sediments. Hydrol. Proced.15, 1551–1564.
Ellis, K.M., Bowers, D.G., Jones, S.E., 2004. A study of temporal variability in particle sizein a high-energy regime. Estuar. Coast. Shelf Sci. 61, 311–315.
Ellison, J.C., 1999. Impacts of sediment burial on mangroves. Mar. Pollut. Bull. 37 (8-12),420–426.
Fabricius, K.E., Wild, C., Wolanski, E., Abele, D., 2003. Effects of transparent exopolymerparticles and muddy terrigenous sediments on the survival of hard coral recruits.Estuar. Coast. Shelf Sci. 57, 613–621.
Fernandez, J.M., Ouillon, S., Chevillon, C., Douillet, P., Fichez, R., Le Gendre, R., 2006. Acombined modelling and geochemical study of the fate of terrigenous inputs frommixed natural and mining sources in a coral reef lagoon (New Caledonia). Mar. Poll.Bulletin 52, 320–331.
Forget, P., Ouillon, S., Lahet, F., Broche, P., 1999. Inversion of reflectance spectra ofnonchlorophyllous turbid coastal waters. Rem. Sensing Env. 68, 264–272.
Fugate, D.C., Friedrichs, C.T., 2002. Determining concentration and fall velocity of estuarineparticle populations using ADV, OBS and LISST. Cont. Shelf Res. 22, 1867–1888.
Fugate, D.C., Friedrichs, C.T., 2003. Controls on suspended aggregate size in partiallymixed estuaries. Estuar. Coast. Shelf Sci. 58, 389–404.
Gartner, J.W., Cheng, R.T., Wang, P.F., Richter, K., 2001. Laboratory and field evaluations ofthe LISST-100 instrument for suspended particle size distributions, Mar. Geol. 175(1-4), 199–219.
Gentien, P., Lunven, M., Lehaître, M., Duvent, J.L., 1995. In-situ depth profiling of particlesizes. Deep-Sea Res. 42, 1297–1312.
Gibbs, R.J., 1982. Floc stability during Coulter-Counter size analysis. J. Sediment. Petrol.52, 657–660.
Gibbs, R.J., Wolanski, E., 1992. The effect of flocs on optical backscattering measure-ments of suspended material concentration. Mar. Geol. 107 (4), 289–291.
Gratiot, N., Manning, A.J., 2004. An experimental investigation of floc characteristics in adiffusive turbulent flow. J. Coast. Res. SI41, 105–113.
Gratiot, N., Michallet, H., Mory, M., 2005. On the determination of the settling flux ofcohesive sediments in a turbulent fluid. J. Geophys. Res. 110, C06004.
Hayward, A.B., 1982. Coral reefs in a clastic sedimentary environment: fossils (Miocene,SW Turkey) and modern recent (Red Sea) analogues. Coral Reefs 1, 109–114.
Hoitink, A.J.F., 2004. Tidally-induced clouds of suspended sediment connected toshallow-water coral reefs. Mar. Geol. 208, 13–31.
Hopley, D., 1994. Continental reef systems. In: Carter, R.W.G., Woodroffe, C.D. (Eds.),Coastal Evolution: Late quaternary shoreline Morphodynamics. Cambridge Univ.Press, Cambridge, pp. 303–340.
Jin, J.Y., Lee, D.Y., Park, J.S., Park, K.S., Yum, K.D., 2001.Monitoring of suspended sedimentconcentration using vessels and remote sensing. In: McAnally, W.H., Mehta, A.J.(Eds.), Coastal and Estuarine Fine Sediment Processes. Elsevier, Amsterdam, TheNetherlands, pp. 287–299.
Johannes, R.E., 1967. Ecology of organic aggregates in the vicinity of a coral reef. Limnol.Oceanogr. 12, 189–195.
Jouon, A., Douillet, P., Ouillon, S., Fraunié, P., 2006. Calculations of hydrodynamic timeparameters in a semi-opened coastal zone using a 3D hydrodynamic model. Cont.Shelf Res. 26, 1395–1415.
Larcombe, P., Ridd, P.V., Prytz, A., Wilson, B., 1995. Factors controlling suspendedsediment on innershelf coral reefs, Townsville, Australia. Coral Reefs 14, 163–171.
Lynch, J.F., Irish, J.D., Sherwood, C.R., Agrawal, Y.C., 1994. Determining suspendedsediment particle size information from acoustical and optical backscattermeasurements. Cont. Shelf Res. 14, 1139–1165.
Mari, X., Rochelle-Newall, E., Torréton, J.P., Pringault, O., Jouon, A., Migon, C., 2007.Water residence time: a regulatory factor of the DOM to POM transfer efficiency.Limnol. Oceanogr. 52, 808–819.
Migon, C., Ouillon, S., Mari, X., Nicolas, E., 2007. Geochemical and hydrologicalconstraints on the distribution of trace metal concentrations in the lagoon ofNoumea, New Caledonia. Est. Coastal Shelf Sci. 74 (4), 657–666.
Mikkelsen, O.A., Pejrup, M., 2000. In situ particle size spectra and density of particleaggregates in a dredging plume. Mar. Geol. 170, 443–459.
Mikkelsen, O.A., Pejrup, M., 2001. The use of LISST-100 in-situ laser particle sizer forestimates of floc size, density and settling velocity. Geo Mar. Lett. 20, 187–195.
Mikkelsen, L.H., Keiding, K., 2002a. Physico-chemical characteristics of full scale sewagesludges with implication to dewatering. Water Res. 36, 2451–2462.
Mikkelsen, L.H., Keiding, K., 2002b. The shear sensitivity of activated sludges: an evaluationof the possibility for a standardised floc strength test. Water Res. 36, 2931–2940.
Mikkelsen, O.A., Hill, P.S., Milligan, T.G., Chant, R.J., 2005. In situ particle sizedistributions and volume concentrations from a LISST-100 laser particle sizer anda digital floc camera. Cont. Shelf Res. 25, 1959–1978.
Mobley, C.D., 1994. Light and Water Radiative Transfer in Natural Water. AcademicPress, San Diego. 592 pp.
Ouillon, S., Douillet, P., Andréfouët, S., 2004. Coupling satellite data with in situmeasurements and numerical modeling to study fine suspended sedimenttransport: a study for the lagoon of New Caledonia. Coral Reefs 23, 109–122.
Ouillon, S., Douillet, P., Fichez, R., Panché, J.Y., 2005. Enhancement of regional variationsin salinity and temperature in a lagoon, New Caledonia. CR Geosci. 337, 1509–1517.
Rogers, C.S., 1990. Responses of coral reefs and reef organisms to sedimentation. Mar.Ecol. Prog. Ser. 62, 185–202.
Sequoia Scientific Inc., 2001. The Size Resolution of the LISST Series of Instruments,Application note L008. 2 pp.
Sheng, G.P., Yu, H.Q., Li, X.Y., 2006. Stability of sludge flocs under shear conditions: roleof extracellular polymeric substances (EPS). Biotech. Bioeng. 93, 1095–1102.
Thornton, D.C.O., 2002. Diatom aggregation in the sea: mechanism and ecologicalimplications. Eur. J. Phycol. 37, 149–161.
Tixier, N., 2003. Approche des propriétés rhéologiques de suspensions biologiquesfloculées. Ph.D. Thesis. Univ. Limoges, France.
Torréton, J.-P., Rochelle-Newall, E., Jouon, A., Faure, V., Jacquet, S., Douillet, P., 2007.Correspondence between the distribution of hydrodynamic time parameters andthe distribution of biological and chemical variables in a semi-enclosed coral reeflagoon. Estuar. Coast. Shelf Sci. 74 (4), 667–677.
Traykovski, P., Latter, R., Irish, J.D., 1999. A Laboratory Evaluation of the LISST InstrumentUsing Natural Sediments. Mar. Geol. 159, 355–367.
van Leussen, W., 1994. Estuarine Macroflocs and their role in fine grained sedimenttransport. PhD Thesis, University of Utrecht.
Voulgaris, G., Meyers, S.T., 2004. Temporal variability of hydrodynamics, sedimentconcentration and sediment settling velocity in a tidal creek. Cont. Shelf Res. 24,1659–1683.
Wass, P.D., Marks, S.D., Finch, J.W., Leeks, G.J.L., Ingram, J.K., 1997. Monitoring andpreliminary interpretation of in-river turbidity and remote sensing imagery forsuspended sediment transport studies in the Humber catchment. Sci. Total Environ.194/195, 263–283.
Wild, C., Huettel, M., Klueter, A., Kremb, S.G., Rasheed, M.Y.M., Jorgensen, B.B., 2004. Coralmucus as an energy carrier and particle trap in the reef ecosystem. Nature 428, 66–70.
Williams, N.D., Walling, D.E., Leeks, G.J.L., 2007. High temporal resolution in situmeasurement of the effective particle size characteristics of fluvial suspendedsediment. Water Res. 41 (5), 1081–1093.
Winterwerp, J.C., 2002. On the flocculation and settling velocity of estuarine mud. Cont.Shelf Res. 22, 1339–1360.
Wodzicki, K., 1981. Some nature conservation problems in the South Pacific. Biol.Conserv. 21, 5–18.
Wolanski, E., Richmond, R.H., Davis, G., Bonito, V., 2003a. Water fine sediment dynamicsin a transient river plumes in a small, reef-fringed bay, Guam. Estuar. Coast. ShelfSci. 56, 1029–1040.
Wolanski, E., Marshall, K., Spagnol, S., 2003b. Nepheloid layer dynamics in coastalwaters of the Great Barrier Reef, Australia. J. Coast. Res. 19 (3), 748–752.