POPULATION GEOGRAPHY - HS Elspark -Germiston South ...
34
POPULATION GEOGRAPHY GRADE 10
-
Upload
khangminh22 -
Category
Documents
-
view
5 -
download
0
Transcript of POPULATION GEOGRAPHY - HS Elspark -Germiston South ...

POPULATION GEOGRAPHY
GRADE 10

CONCEPTS:
■ POPULATION GEOGRAPHY: The study of the size, distribution,
composition, migration and growth of a population.
■ POPULATION DENSITY: Number of people living in a particular
area, expressed as people per 𝑘𝑚2.
■ POPULATION DISTRIBUTION: Where people live, or how they are
spread out around the world.


FACTORS AFFECTING DISTRIBUTION AND DENSITY:
PHYSICAL FACTORS:
■ Climate: People settle where the climate is moderate and where the area receive enough rainfall to practise farming activities;
■ Water: People settle near water resources as water is essential for life and human/farming activities;
■ Soil: The soil must be fertile to ensure that people will settle there. The more fertile the soil, the bigger the yield.
■ Relief: People tend to settle on flat areas where there is enough space.
■ Natural vegetation: People need vegetated areas for grazing land.
■ Resources: People settle where there is enough resources like coal, fish, wood and minerals. The mining of minerals help with job opportunities and lead to the development of settlements.

SOCIAL FACTORS:
■ Economy: Economic developed areas attract businesses and
industries and can support a bigger population;
■ Political: People prefer to live in political stable areas. Laws can
restrict certain race groups to live in a specific area.
■ Technology: Improved technology improve the development of
secondary and tertiary sectors. This will cause a increase in the
population density;
■ Transport and communication: A good transport and
communication network will attract people to live in that area.
■ Infrastructure: Areas with good infrastructure like water supply,
electricity, sewage systems and access to internet will increase the
population density.
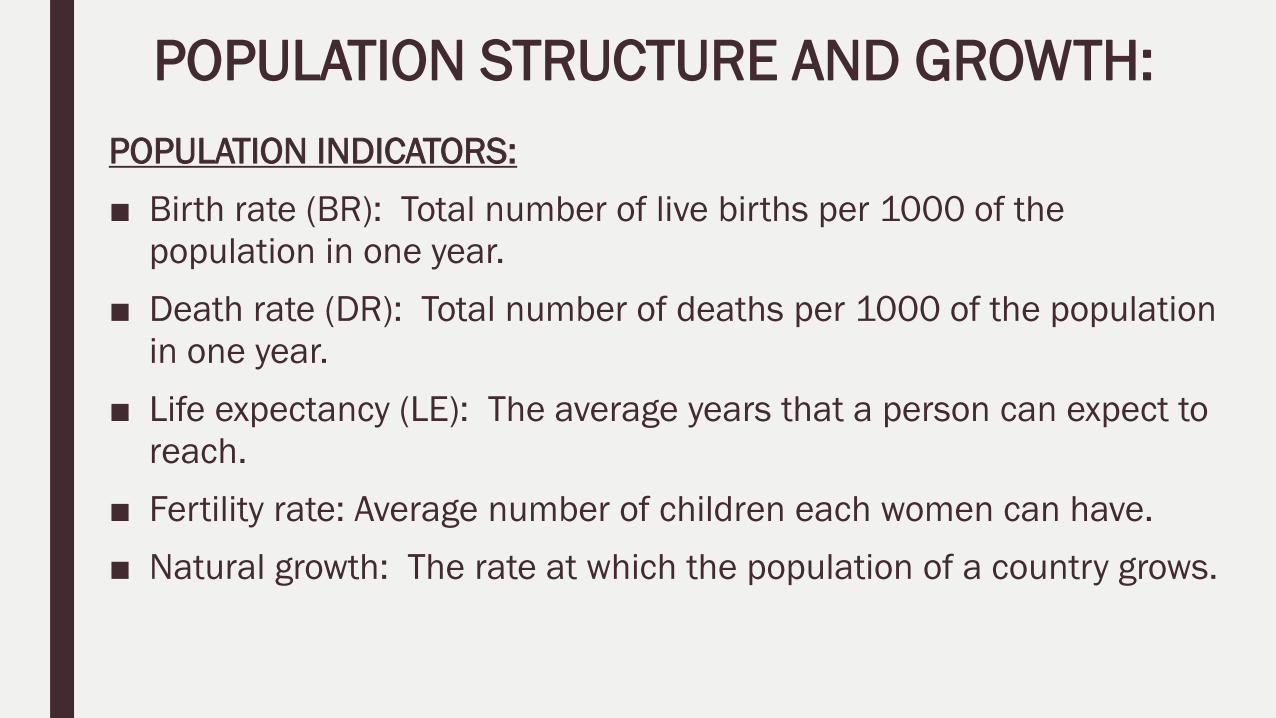
POPULATION STRUCTURE AND GROWTH:
POPULATION INDICATORS:
■ Birth rate (BR): Total number of live births per 1000 of the
population in one year.
■ Death rate (DR): Total number of deaths per 1000 of the population
in one year.
■ Life expectancy (LE): The average years that a person can expect to
reach.
■ Fertility rate: Average number of children each women can have.
■ Natural growth: The rate at which the population of a country grows.
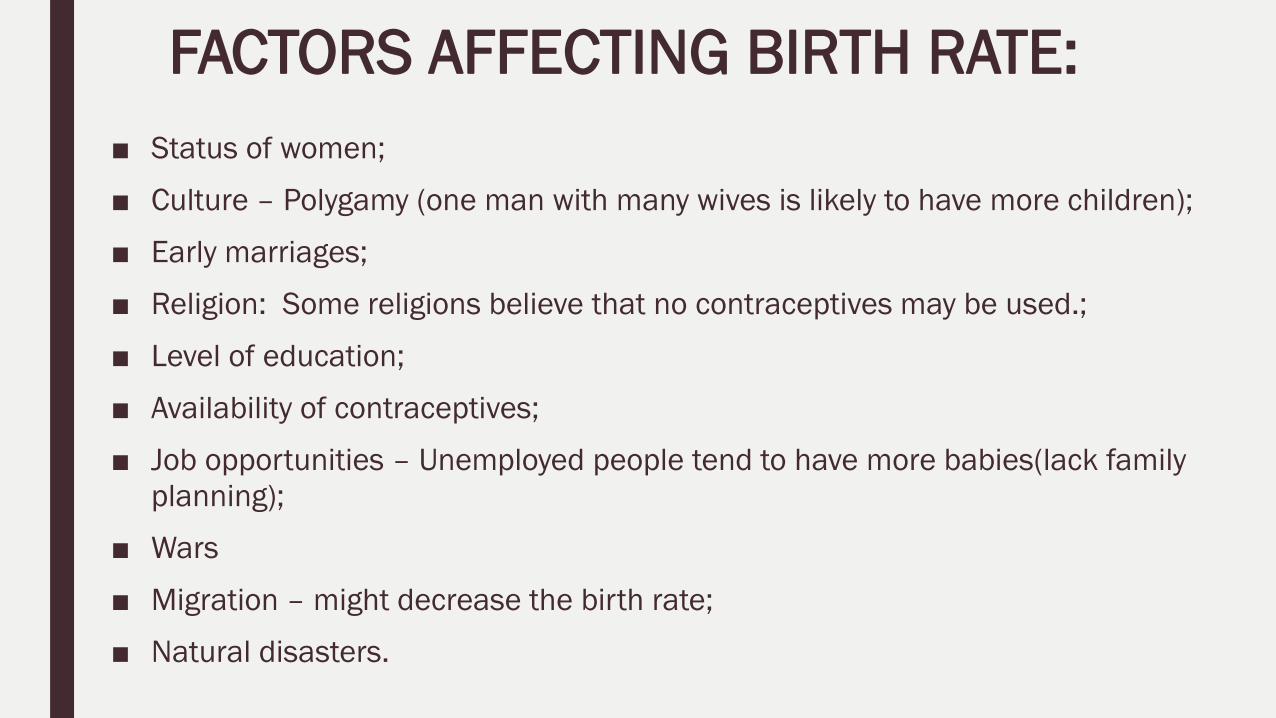
FACTORS AFFECTING BIRTH RATE:
■ Status of women;
■ Culture – Polygamy (one man with many wives is likely to have more children);
■ Early marriages;
■ Religion: Some religions believe that no contraceptives may be used.;
■ Level of education;
■ Availability of contraceptives;
■ Job opportunities – Unemployed people tend to have more babies(lack family
planning);
■ Wars
■ Migration – might decrease the birth rate;
■ Natural disasters.
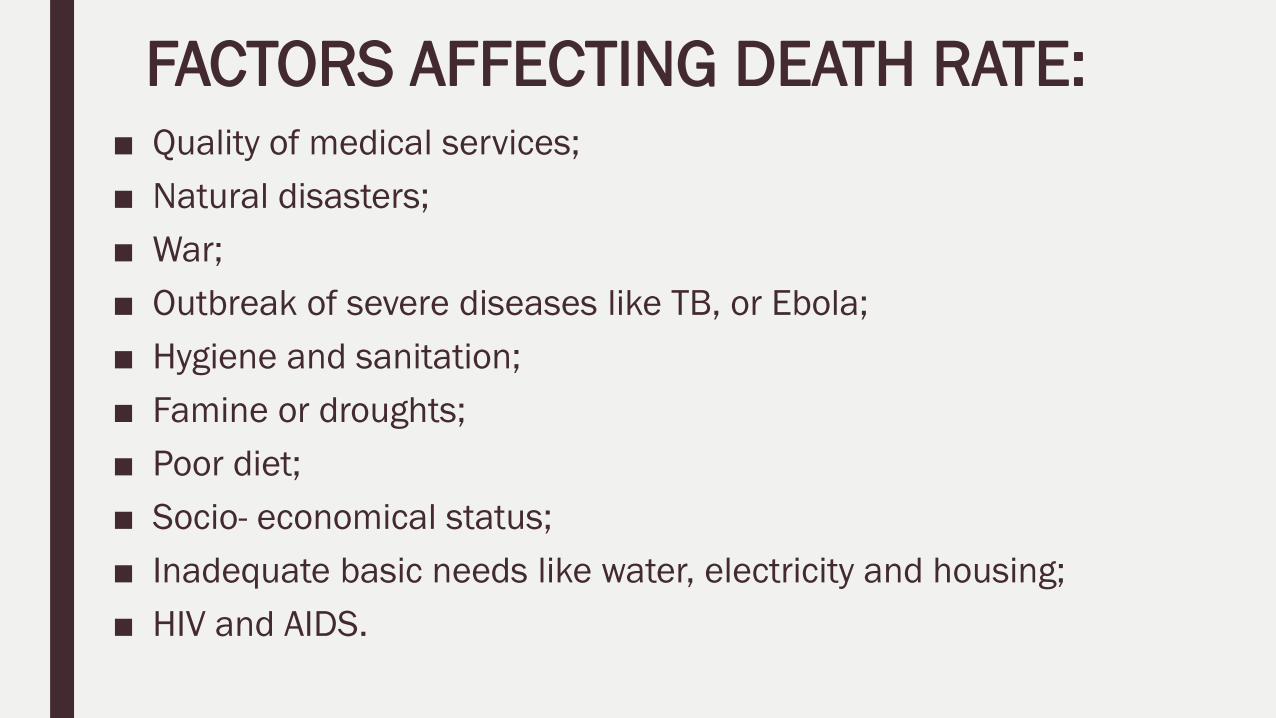
FACTORS AFFECTING DEATH RATE:■ Quality of medical services;
■ Natural disasters;
■ War;
■ Outbreak of severe diseases like TB, or Ebola;
■ Hygiene and sanitation;
■ Famine or droughts;
■ Poor diet;
■ Socio- economical status;
■ Inadequate basic needs like water, electricity and housing;
■ HIV and AIDS.
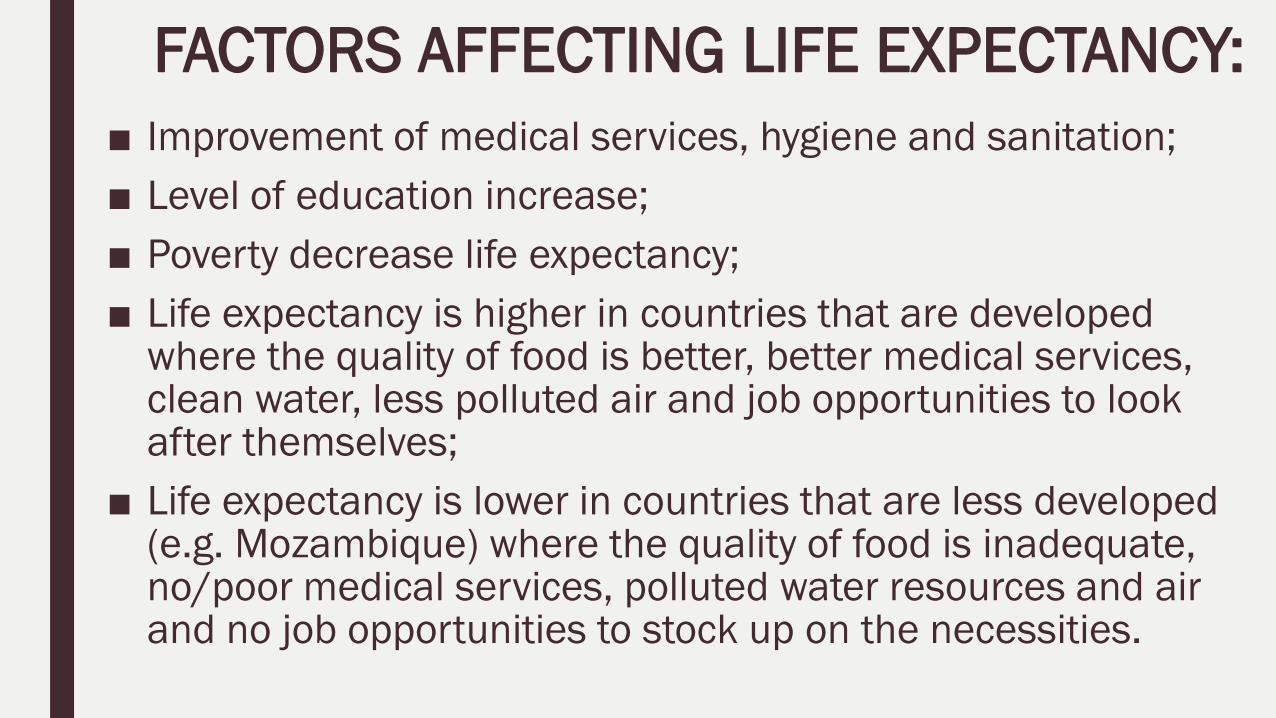
FACTORS AFFECTING LIFE EXPECTANCY:
■ Improvement of medical services, hygiene and sanitation;
■ Level of education increase;
■ Poverty decrease life expectancy;
■ Life expectancy is higher in countries that are developed where the quality of food is better, better medical services, clean water, less polluted air and job opportunities to look after themselves;
■ Life expectancy is lower in countries that are less developed (e.g. Mozambique) where the quality of food is inadequate, no/poor medical services, polluted water resources and air and no job opportunities to stock up on the necessities.

FACTORS AFFECTING FERTILITY RATE:■ Quality of medical care/services;
■ Religion;
■ Population policy e.g. China that implemented the one child policy;
■ Socio-economical welfare;
■ Availability of contraceptives;
■ Fertility rate is higher in areas where:
– Young marriages;
– Less education and job opportunities;
– No/Few available contraceptives.

■ Fertility rate is lower in areas where:
– Equal opportunities for women;
– Available contraceptives;
– Higher education levels;

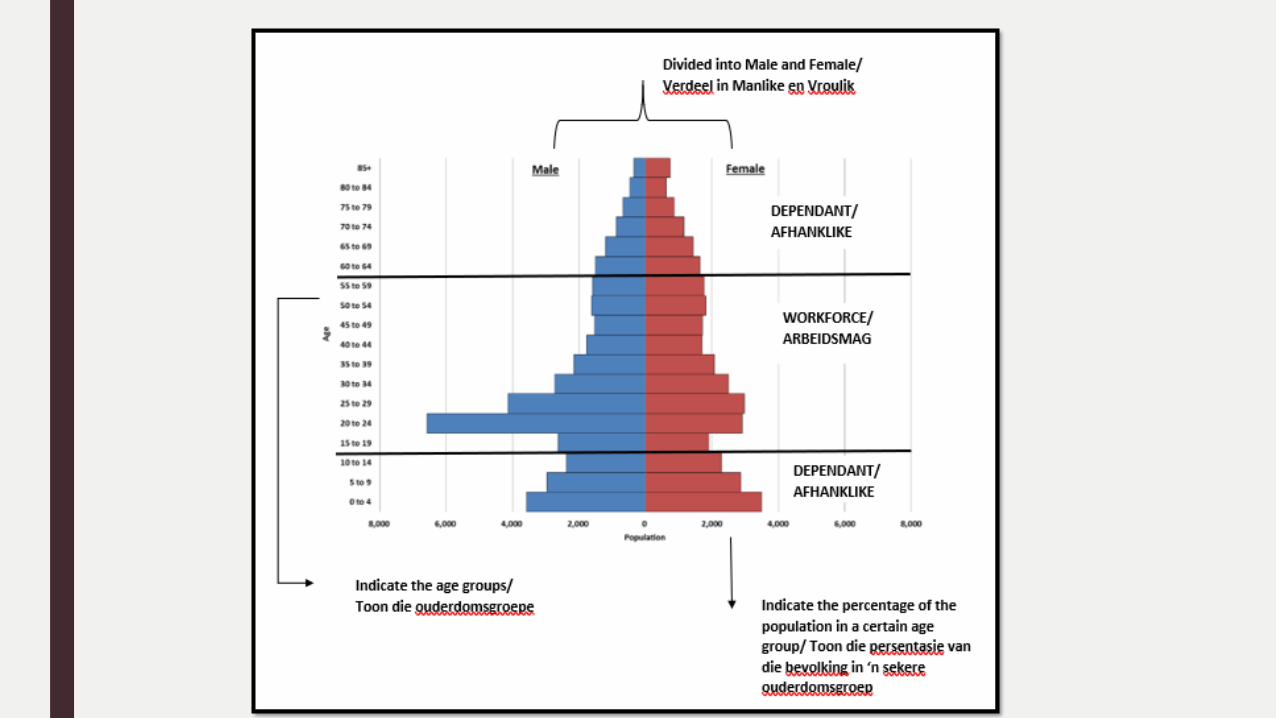
POPULATION STRUCTURE:Structure of a population is indicated on a population pyramid.
Population pyramid: A type of graph that indicates a country’s
population according to ages and genders.
WHAT CAN BE CONCLUDE FROM A POPULATION PYRAMID?
■ High/Low birth- and death rate;
■ If the country is a developing or developed country;
■ Dependency ratio can be calculated ( 𝑐ℎ𝑖𝑙𝑑𝑟𝑒𝑛 𝑢𝑛𝑑𝑒𝑟 15+𝑎𝑑𝑢𝑙𝑡𝑠 𝑜𝑙𝑑𝑒𝑟 𝑡ℎ𝑎𝑛 60
𝑡𝑜𝑡𝑎𝑙 𝑎𝑑𝑢𝑙𝑡𝑠 𝑏𝑒𝑡𝑤𝑒𝑒𝑛 16 𝑎𝑛𝑑 59× 100)
■ If the population has a positive or negative growth;
■ The life expectancy of the population;

TYPES OF POPULATION PYRAMIDE:
RAPID GROWTH AND POPULATION EXPANSION:
■ Symmetrical shape/triangular shape;
■ High birth and death rate;
■ High percentage dependants;
■ Low life expectancy;
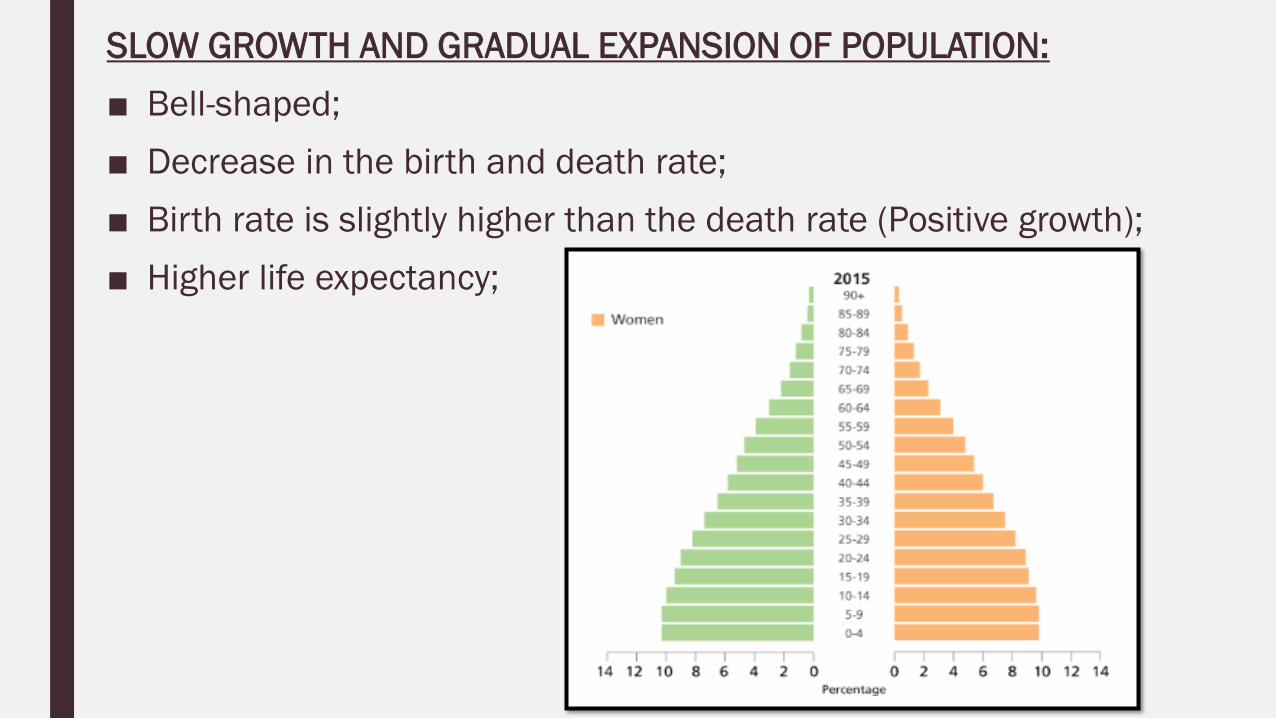
SLOW GROWTH AND GRADUAL EXPANSION OF POPULATION:
■ Bell-shaped;
■ Decrease in the birth and death rate;
■ Birth rate is slightly higher than the death rate (Positive growth);
■ Higher life expectancy;

STABLE AND STATIONARY POPULATION:
■ Bell-shaped;
■ Birth and death rate is declining;
■ Constant amount of people between the ages of 0 – 60,
■ Higher life expectancy rate;
■ Females life longer than the males
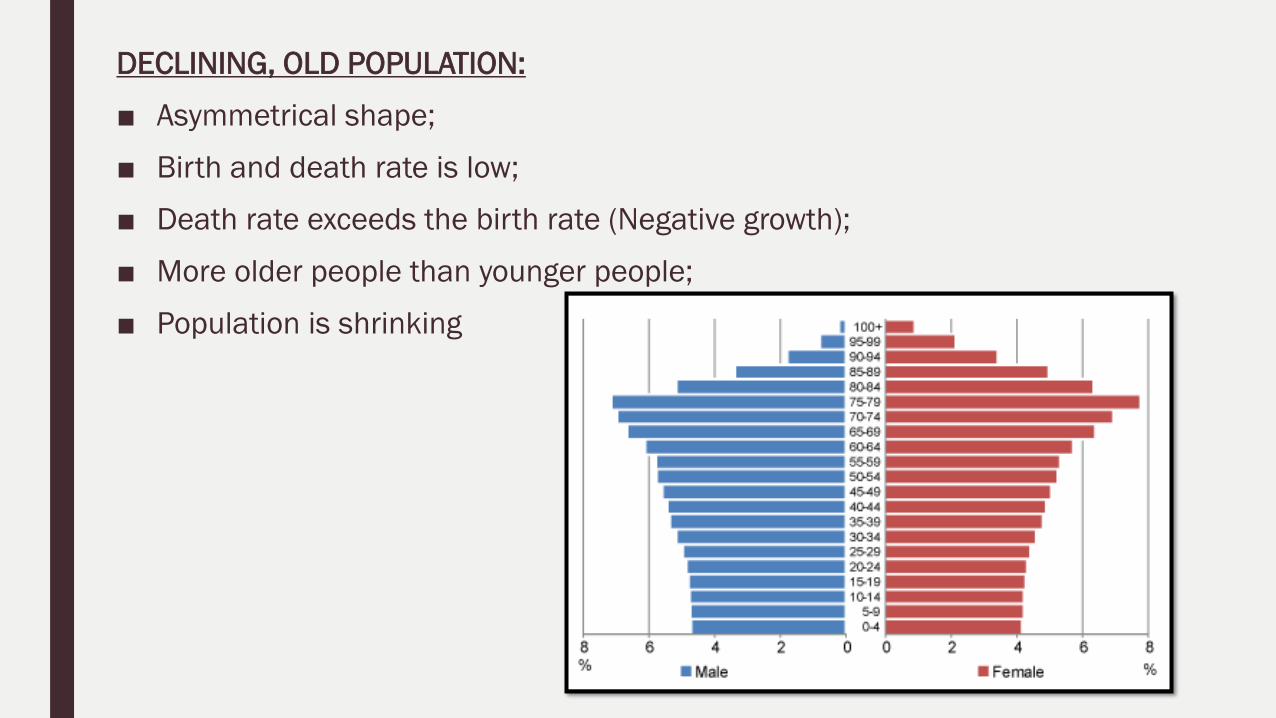
DECLINING, OLD POPULATION:
■ Asymmetrical shape;
■ Birth and death rate is low;
■ Death rate exceeds the birth rate (Negative growth);
■ More older people than younger people;
■ Population is shrinking

MODEL OF DEMOGRAPHIC TRANSITION:
■ Model to explain the growth of the population over time;

STAGE 1: HIGH STATIONARY STAGE
■ Birth and death rate is high;
■ Total population remain small;
■ Birth rate is high due to:
– Lack of contraceptives;
– Children are seen as a social status
■ Death rate is high due to:
– Diseases and plagues;
– Famine
– Poor diet
– Poor hygiene
– Poor medical services
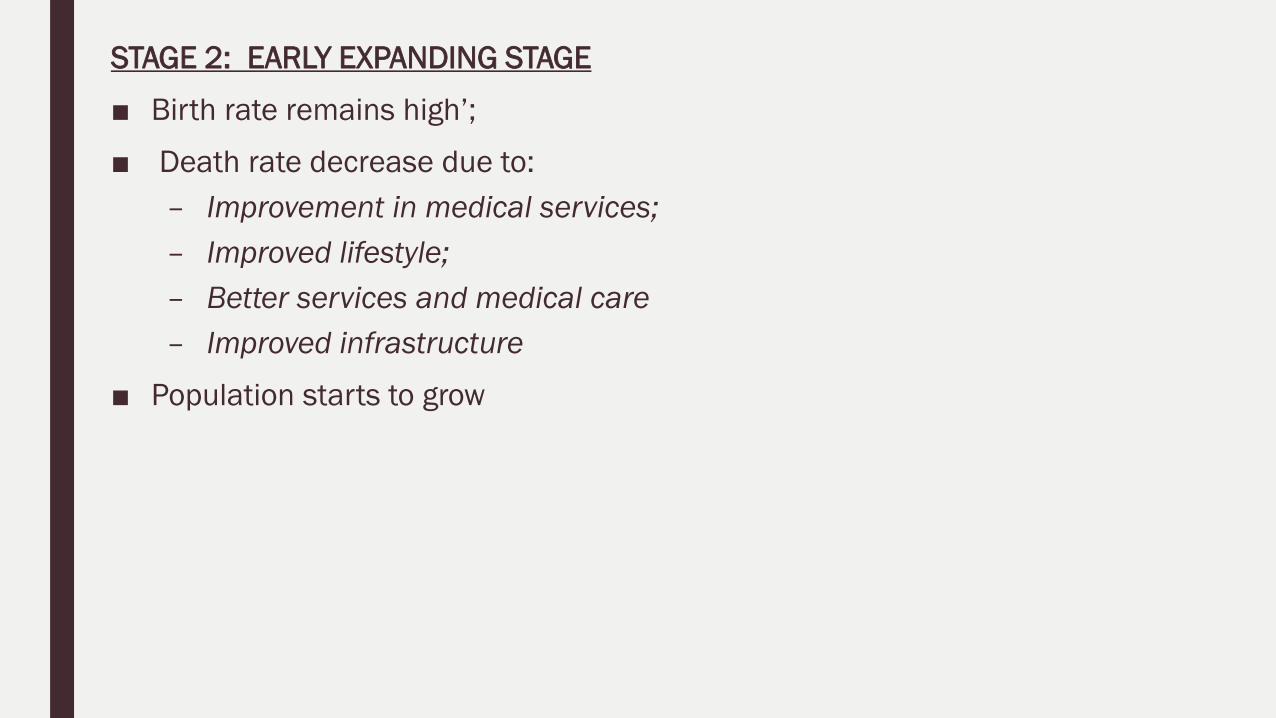
STAGE 2: EARLY EXPANDING STAGE
■ Birth rate remains high’;
■ Death rate decrease due to:
– Improvement in medical services;
– Improved lifestyle;
– Better services and medical care
– Improved infrastructure
■ Population starts to grow
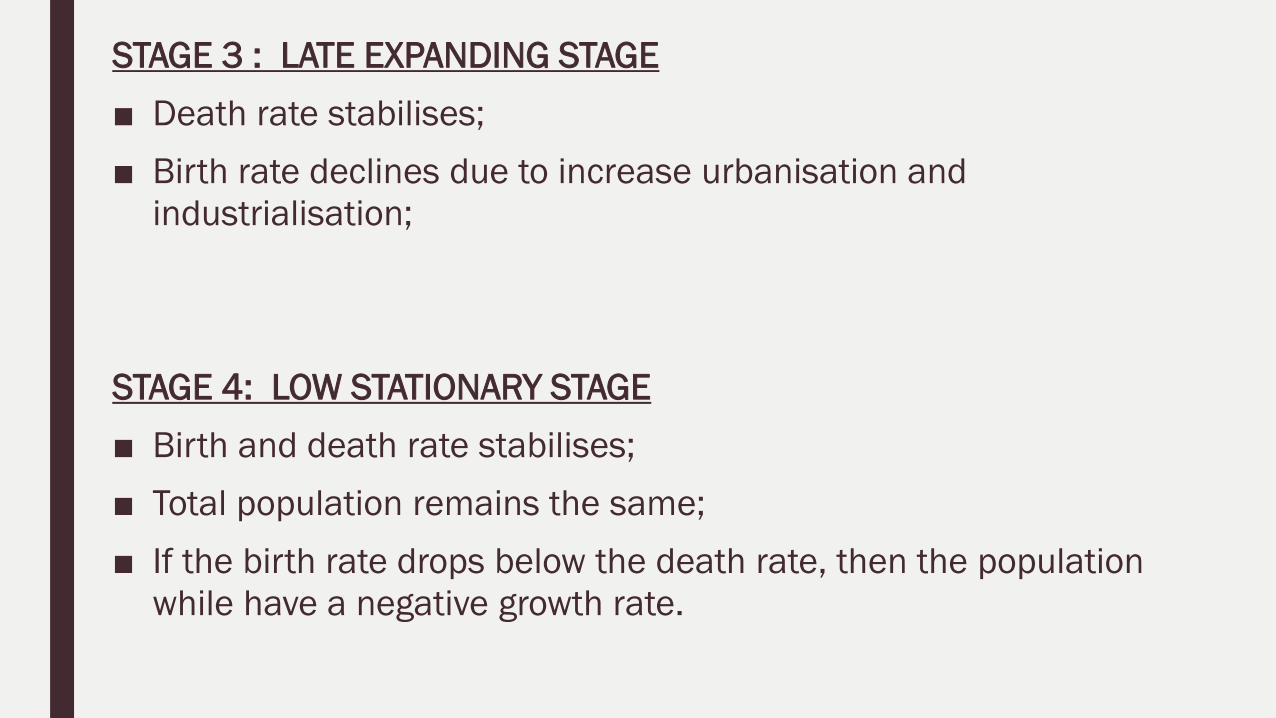
STAGE 3 : LATE EXPANDING STAGE
■ Death rate stabilises;
■ Birth rate declines due to increase urbanisation and
industrialisation;
STAGE 4: LOW STATIONARY STAGE
■ Birth and death rate stabilises;
■ Total population remains the same;
■ If the birth rate drops below the death rate, then the population
while have a negative growth rate.

OVERPOPULATION
High numbers of people that cause an area to be dense and overcrowded. This
leads to the depletion of resources and the deterioration of the environment.

MANAGING OVERPOPULATION:
1. EDUCATION:
■ Educate people about the benefits of small families;
■ Educate people about the sustainable use of resources and
conserving the environment.
2. EMPOWERING WOMEN:
■ Some women in rural areas are not given the freedom of choice over
their own bodies. They are not allowed to have an education or use
contraceptives.
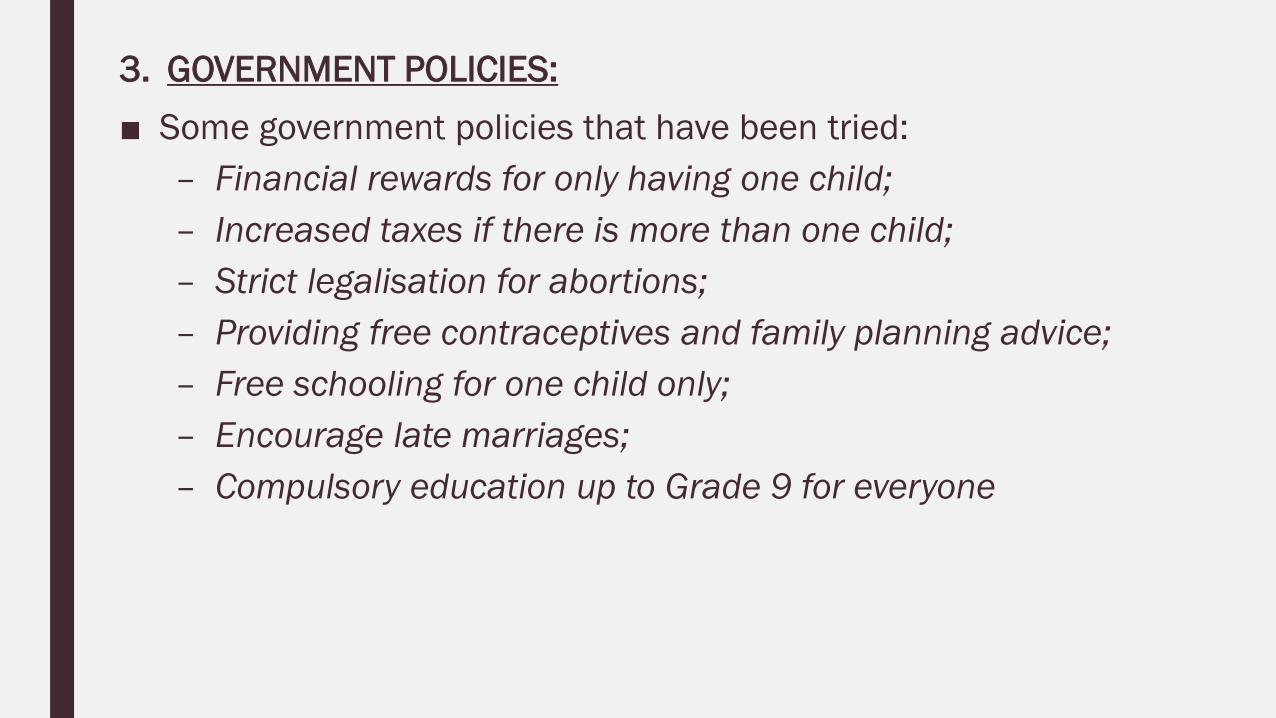
3. GOVERNMENT POLICIES:
■ Some government policies that have been tried:
– Financial rewards for only having one child;
– Increased taxes if there is more than one child;
– Strict legalisation for abortions;
– Providing free contraceptives and family planning advice;
– Free schooling for one child only;
– Encourage late marriages;
– Compulsory education up to Grade 9 for everyone

POPULATION MOVEMENTS:
WHAT IS MIGRATION?
Movement of people from one place to the other.

TYPES OF MIGRATION:
INTERNATIONAL MIGRATION: Movement of people over the country’s
boarder. Example South Africa to China.
EMIGRATION: When people exit the country of origin. Example South
Africa to Australia
IMMIGRATION: When people enter a new country to live in. Example
Zimbabwe to South Africa
RURAL-URBAN MIGRATION: When people move from rural areas to urban
areas.
URBANISATION: When more people live in urban areas than in rural areas.
URBAN-RURAL MIGRATION: Movement of people from urban areas to rural
areas.

RURAL-URBAN MIGRATION:PUSH FACTORS PULL FACTORS EFFECT SOLUTION
• Droughts
• Soil erosion
• Lack of infrastructure
and services
• Lack of job
opportunities
• Famine
• Services like
schools
• Medical facilities
• Job opportunities
Rural:
• Crops deteriorate
• Ageing population remain
in settlement
• More women than men
(declining death rate)
Urban:
• Overcrowding
• Lack of jobs or basic
services
• Development of informal
settlements
• Create job
opportunities
• Provide basic services
• Build schools and
houses
• Decentralise industries
to this area
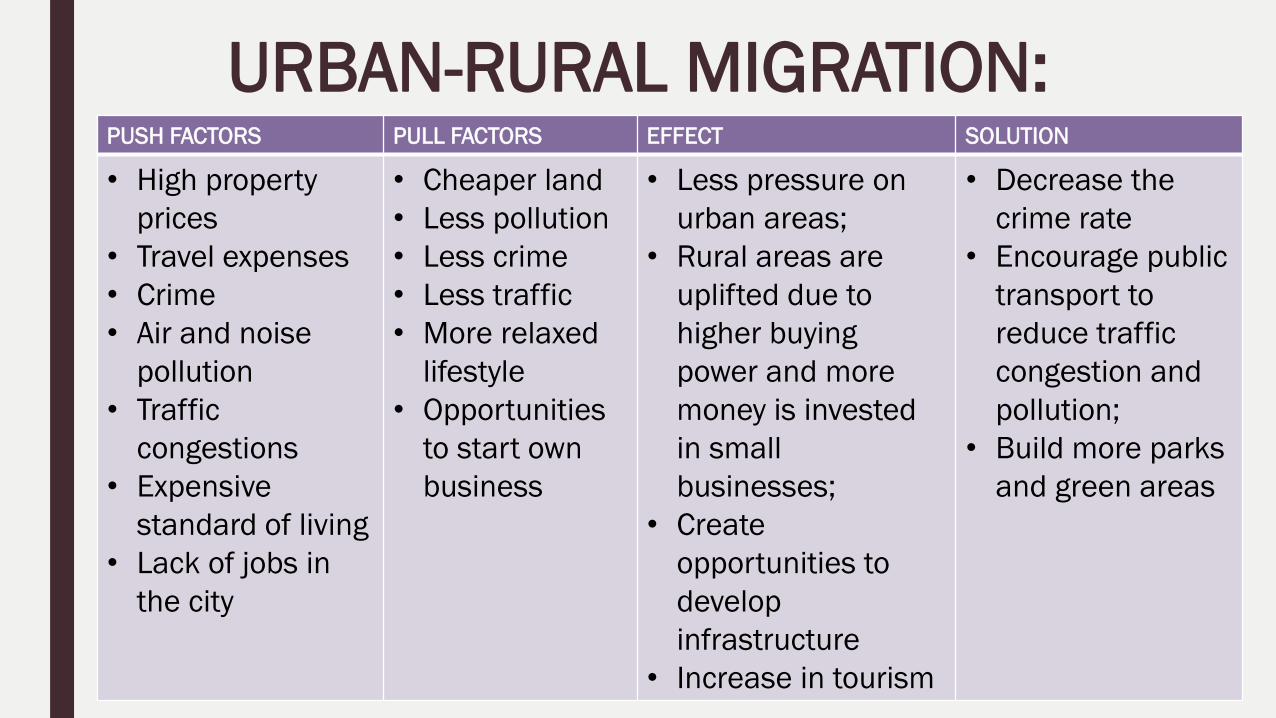
URBAN-RURAL MIGRATION:PUSH FACTORS PULL FACTORS EFFECT SOLUTION
• High property
prices
• Travel expenses
• Crime
• Air and noise
pollution
• Traffic
congestions
• Expensive
standard of living
• Lack of jobs in
the city
• Cheaper land
• Less pollution
• Less crime
• Less traffic
• More relaxed
lifestyle
• Opportunities
to start own
business
• Less pressure on
urban areas;
• Rural areas are
uplifted due to
higher buying
power and more
money is invested
in small
businesses;
• Create
opportunities to
develop
infrastructure
• Increase in tourism
• Decrease the
crime rate
• Encourage public
transport to
reduce traffic
congestion and
pollution;
• Build more parks
and green areas
HIV AND AIDS

HOW IS AIDS TRANSMITTED?■ Unprotected sex;
■ Contact with HIV person’s blood;
■ Poorly controlled blood transfusions;
■ Sharing of needles with an infected person;
■ Transmission from mother to baby during pregnancy

SOCIAL IMPACTS OF HIV AND AIDS:
■ Pressure on clinics and hospitals to treat HIV patients;
■ Not enough medical personnel to assist all the HIV patients;
■ Increase expenses to stock up with medication to treat patients;
■ Pressure on medical aid to pay for treatments;
■ Increase in secondary infections like TB
■ Patients and their families are exposed to emotional trauma and
suffering;
■ Increase in the amount of orphans due to parents that die because
of HIV and AIDS;
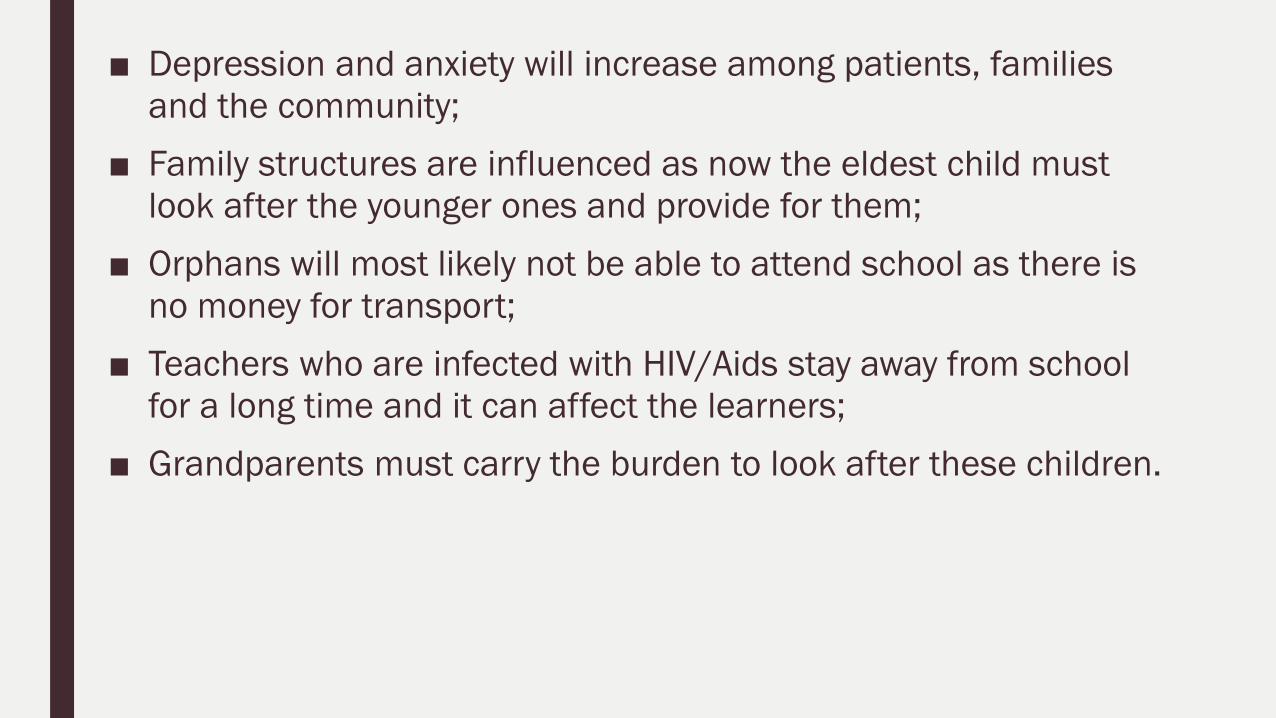
■ Depression and anxiety will increase among patients, families
and the community;
■ Family structures are influenced as now the eldest child must
look after the younger ones and provide for them;
■ Orphans will most likely not be able to attend school as there is
no money for transport;
■ Teachers who are infected with HIV/Aids stay away from school
for a long time and it can affect the learners;
■ Grandparents must carry the burden to look after these children.

ECONOMICAL IMPACTS OF HIV AND AIDS:
■ Decrease in the BBP of the country;
■ Productivity and work performance will decrease as people are too sick to
work/concentrate;
■ Decrease in exports – lower foreign capital will be earned
■ Company profits will decreased;
■ Companies/Industries have more expenses as they have to pay the person who
is sick and temporary employ another to do the job;
■ Person who generate an income in a family may die and the rest will be poor
with no income;
■ Pressure on SASSA to provide grants;
■ Increase cost for life insurance;

■ Retirement funds will decrease;
■ Poverty will increase;
■ Unemployment will increase;
■ Skills are lost due to illness and higher wages must be paid to rent
the service of foreigners to do a specific job;
■ Medical expenses will drain the economy of South Africa.