The urokinase plasminogen activator system as a target for prognostic studies in breast cancer

Pooled Analysis of Prognostic Impact of Urokinase-TypePlasminogen Activator and Its Inhibitor PAI-1 in 8377Breast Cancer Patients
Maxime P. Look, Wim L. J. van Putten, Michael J. Duffy, Nadia Harbeck, Ib JarleChristensen, Christoph Thomssen, Ronald Kates, Frédérique Spyratos, Mårten Fernö,Serenella Eppenberger-Castori, C. G. J. Fred Sweep, Kurt Ulm, Jean-Philippe Peyrat,Pierre-Marie Martin, Henri Magdelenat, Nils Brünner, Catherine Duggan, Björn W.Lisboa, Pär-Ola Bendahl, Véronique Quillien, Alain Daver, Gabriel Ricolleau, MarionE. Meijer-van Gelder, Peggy Manders, W. Edward Fiets, Marinus A. Blankenstein,Philippe Broët, Sylvie Romain, Günter Daxenbichler, Gudrun Windbichler, TanjaCufer, Simona Borstnar, Willy Kueng, Louk V. A. M. Beex, Jan G. M. Klijn, NiallO’Higgins, Urs Eppenberger, Fritz Jänicke, Manfred Schmitt, John A. Foekens
Background: Urokinase-type plasminogen activator (uPA)and its inhibitor (PAI-1) play essential roles in tumor inva-sion and metastasis. High levels of both uPA and PAI-1 areassociated with poor prognosis in breast cancer patients. Toconfirm the prognostic value of uPA and PAI-1 in primarybreast cancer, we reanalyzed individual patient data pro-vided by members of the European Organization for Re-search and Treatment of Cancer–Receptor and BiomarkerGroup (EORTC-RBG). Methods: The study included 18datasets involving 8377 breast cancer patients. During fol-low-up (median 79 months), 35% of the patients relapsedand 27% died. Levels of uPA and PAI-1 in tumor tissueextracts were determined by different immunoassays; valueswere ranked within each dataset and divided by the numberof patients in that dataset to produce fractional ranks thatcould be compared directly across datasets. Associations ofranks of uPA and PAI-1 levels with relapse-free survival(RFS) and overall survival (OS) were analyzed by Cox mul-tivariable regression analysis stratified by dataset, includingthe following traditional prognostic variables: age, meno-pausal status, lymph node status, tumor size, histologicgrade, and steroid hormone-receptor status. All P valueswere two-sided. Results: Apart from lymph node status, highlevels of uPA and PAI-1 were the strongest predictors ofboth poor RFS and poor OS in the analyses of all patients.Moreover, in both lymph node-positive and lymph node-negative patients, higher uPA and PAI-1 values were inde-pendently associated with poor RFS and poor OS. For (un-treated) lymph node-negative patients in particular, uPAand PAI-1 included together showed strong prognostic abil-ity (all P<.001). Conclusions: This pooled analysis of theEORTC-RBG datasets confirmed the strong and indepen-dent prognostic value of uPA and PAI-1 in primary breastcancer. For patients with lymph node-negative breast can-cer, uPA and PAI-1 measurements in primary tumors maybe especially useful for designing individualized treatmentstrategies. [J Natl Cancer Inst 2002;94:116–28]
Breast cancer is the most common malignancy in women inthe Western world. To improve the survival of patients with
primary breast cancer, adjuvant systemic treatment aimed at theeradication of occult metastases has been shown to be beneficial(1). For patients with lymph node-negative disease, however, theclinical benefits of adjuvant systemic treatment are relativelysmall because primary locoregional treatment cures 60%–70%of these patients. As a result, a large number of patients wouldbe subjected to unnecessary and toxic side effects were adjuvanttherapy to be given to all breast cancer patients. To avoid aburdening of patients not in need of systemic adjuvant treatment,strong prognostic markers are warranted to distinguish betweenpatients with low and high risks of disease recurrence. The useof traditional prognostic factors, such as age, menopausal status,tumor size, tumor grade, and steroid hormone-receptor status, isnot sufficient to make such a classification.
Affiliations of authors: M. P. Look, M. E. Meijer-van Gelder, J. G. M. Klijn,J. A. Foekens, (Department of Medical Oncology), W. L. J. van Putten (Depart-ment of Statistics), Rotterdam Cancer Institute (Daniel den Hoed Kliniek) andUniversity Hospital Rotterdam, The Netherlands; M. J. Duffy, C. Duggan,St. Vincent’s University Hospital, Dublin, Ireland; N. Harbeck, R. Kates,K. Ulm, M. Schmitt, Frauenklinik der Technischen Universität München, Klini-kum rechts der Isar, Munich, Germany; I. J. Christensen, N. Brünner, FinsenLaboratory, Copenhagen, Denmark; C. Thomssen, B. W. Lisboa, F. Jänicke,Universitätsklinikum Hamburg-Eppendorf, Hamburg, Germany; F. Spyratos,Laboratoire de Biologie Tissulaire, St. Cloud, France; M. Fernö, P. O. Bendahl,Department of Oncology, University Hospital, Lund, Sweden; S. Eppenberger-Castori, W. Kueng, U. Eppenberger, Stiftung Tumorbank Basel, Departmentof Research, University Hospital of Basel, Switzerland; C. G. J. Sweep,P. Manders, L. V. A. M. Beex, Department of Chemical Endocrinology, Uni-versity Hospital Nijmegen, The Netherlands; J. P. Peyrat, Laboratoired’Oncologie Moléculaire Humaine, Centre Oscar Lambret, Lille, France;P. M. Martin, S. Romain, Laboratoire de Transfert d’Oncologie Biologie,Marseille, France; H. Magdelenat, P. Broët, Institut Curie, Paris, France;V. Quillien, Laboratoire de Biologie, Centre Eugène Marquis, Rennes, France;A. Daver, Centre Paul Papin, Angers, France; G. Ricolleau, Centre René Gaudu-cheau, St. Herblain, France; W. E. Fiets, M. A. Blankenstein, University MedicalCenter Utrecht, The Netherlands; G. Daxenbichler, G. Windbichler, Univer-sitätsklinik für Frauenheilkunde, Innsbruck, Austria; T. Cufer, S. Borstnar,Institut of Oncology, Ljubljana, Slovenia; N. O’Higgins, University CollegeDublin, Ireland.
Correspondence to: Maxime P. Look, MSc., Josephine Nefkens Institute, Rm.Be 428, P. O. Box 1738, 3000 DR Rotterdam, The Netherlands (e-mail:[email protected]).
See “Notes” following “References.”
© Oxford University Press
116 ARTICLES Journal of the National Cancer Institute, Vol. 94, No. 2, January 16, 2002
by guest on February 17, 2016http://jnci.oxfordjournals.org/
Dow
nloaded from

To facilitate refinement of risk-adapted individualized treat-ment, major effort has been devoted to the study of factors thatgovern tumor spread and metastasis. From these studies, it hasbecome clear that the ability of cancer cells to invade the extra-cellular matrix, to intravasate into lymphatics and blood vessels,and to form metastases at distant sites depends on the coordi-nated interaction of two main protease systems, the matrix me-talloproteinase and the plasminogen activator systems. The lattersystem comprises the serine protease urokinase-type plasmino-gen activator (uPA), its receptor (uPAR, CD87), and its maininhibitor (PAI-1). These components play a central role in theprocesses leading ultimately to the development of metastases[for reviews, see references (2–4)]. Plasminogen activation re-sults in the formation of the broad-spectrum serine proteaseplasmin, which in turn activates the proenzyme of uPA to pro-teolytic active uPA and is the activator of several matrix metal-loproteinases (2–5). When compared with normal tissues, uPA,uPAR, and PAI-1 all have been shown to be at increased levelsin malignant solid tumors in a variety of human cancers, includ-ing breast cancer (2–4). As early as 1988, elevated uPA levels inprimary breast tumor tissue were shown to be associated with apoor prognosis of the patient (6). In the early 1990s, it becameevident that high antigen levels of PAI-1 in primary breast tu-mors also were associated with a poor prognosis (7). This find-ing of a relationship between a protease inhibitor and an unfa-vorable prognosis was initially surprising but is now explainedby the crucial role of PAI-1 in tumor cell adhesion, cell migra-tion, and angiogenesis (8–10). Following the initial reports (6,7),many independent studies have demonstrated that elevated tu-mor antigen levels of uPA and PAI-1 are associated with poordisease outcome in breast cancer [for reviews, see references(2–4,11,12)]. Furthermore, it has been shown that high tumorlevels of uPA and PAI-1 predict a poor outcome for patients whowere treated with tamoxifen for advanced disease (13).
The main purpose of this study was to investigate whether theprognostic impact of uPA and PAI-1, as published in differentreports from various authors, could be confirmed by a reanaly-sis, conducted in a uniform manner, of the individual patientdata. To this end, the European Organization for Researchand Treatment of Cancer–Receptor and Biomarker Group(EORTC-RBG) performed a pooled analysis with the use of 18datasets originating from nine European countries. The prognos-tic relevance of uPA and PAI-1 in the analyses of relapse-freesurvival (RFS) and overall survival (OS) was studied for allpatients and in subgroups of lymph node-negative and lymphnode-positive patients by stratified Cox multivariable regressionanalysis including the traditional prognostic factors.
METHODS
Datasets
The members of the EORTC-RBG proposed to share theirdata on uPA and/or PAI-1 levels in primary breast cancer tu-mors, on classical factors, and on the follow-up information. Allcenters with published (14–25) (n � 11) and unpublished (n �7) datasets agreed to participate and sent their data to Rotterdamfor statistical reanalysis. All published studies reported on theprognostic value of uPA and/or PAI-1. All of the participatinglaboratories are involved in ongoing quality-assurance programsfor measurement of biologic variables in tumor tissue (26). Stud-ies were approved by the local review boards. The following
inclusion and exclusion criteria were used: 1) All patients un-derwent primary surgery for breast cancer; 2) surgery took placebefore January 1, 1996; 3) there was no distant spread at orwithin 1 month of surgery; 4) patients with residual diseasediagnosed within 1 month after primary surgery were excluded;5) patients with noninvasive breast cancer or those who receivedneoadjuvant therapy were excluded; 6) male breast cancer pa-tients and female patients who previously experienced anothercancer (except basal cell skin cancer or early-stage cervical can-cer stage Ia/Ib) and male breast cancer patients were excluded;7) biochemical variables were determined in primary tumor tis-sue extract; and 8) uPA and PAI-1 antigen levels were deter-mined by immunoassays. Staging of the tumors was according tothe International Union Against Cancer TNM classification (27).Patients with missing values for postsurgical histopathologic tu-mor size (pT), lymph node status, and/or both estrogen receptor(ER) and progesterone receptor (PgR) status and/or both uPAand PAI-1 were excluded.
Of the 8377 patients included, the dates of primary surgeryranged from September 1978 through December 1995. The pa-tients were born between November 1891 and September 1969.Of the 18 cooperating laboratories, 17 were able to provide datafor the analysis of uPA, and 15 provided data for PAI-1. For thedatasets labeled A through R (see Fig. 2), the levels of uPA andPAI-1 were determined in either cytosolic tumor extracts(datasets A–D and K–Q) or Triton X-100-treated tumor extracts(datasets E–J and R). All assays used were commercially avail-able immunoassays. Enzyme-linked immunosorbent assay(ELISA) kits were obtained from American Diagnostica, Inc.(Greenwich, CT; datasets A–I), Monozyme (Horsholm, Den-mark; datasets P [only for PAI-1] and Q), and Oncogene Science(Cambridge, MA; dataset R). Luminometric Immuno Assay(LIA) kits were obtained from AB Sangtec Medical (Bromma,Sweden; datasets M–O and P [only for uPA]), and an in-houseassay was obtained as described (datasets J–L) (28). The proteinassays used for the various datasets consisted of Bio-Rad (Her-cules, CA; datasets A, D, F, L, M, Q, and R), Pierce (Rockford,IL; datasets B, C, E, and G–J), or according to Lowry et al. (29;datasets K and N–P). With the use of these various ELISAs,LIA, and protein assays, it was found in the different datasetsthat median levels of uPA ranged from 0.2 to 5.1 ng/mg ofprotein and that for PAI-1 they ranged from 1.3 to 26.7 ng/mgof protein. These wide ranges of median values highlighted theneed to model the underlying biologic relationship between uPAand PAI-1 measurements in different datasets so as to allow auniform analysis, which was accomplished by introducing frac-tional ranks as explained below. Histologic characteristics of thetumors, patients’ ages, and adjuvant treatments are listed inTable 1. Three percent of the patients were less than 35 yearsold, and 40% were premenopausal. Forty-four percent of thepatients had small tumors (pT1), and 56% were lymph nodenegative. The histologic grade of one third of the patients wasunknown. Forty-five percent of the patients received some formof systemic adjuvant treatment. Thirty-five percent (n � 2955)of the patients experienced disease recurrence, and 27% (n �2254) of the patients died within 10 years.
Statistical Analysis
Relationships between uPA and PAI-1 as well as patient andtumor characteristics were investigated with the use of nonpara-metric methods, i.e., Spearman rank correlations for continuous
Journal of the National Cancer Institute, Vol. 94, No. 2, January 16, 2002 ARTICLES 117
by guest on February 17, 2016http://jnci.oxfordjournals.org/
Dow
nloaded from

variables and the Wilcoxon rank-sum test or the Kruskal–Wallistest for ordered variables. In the latter tests, patient and tumorcharacteristics were used as grouping variables. A nonparamet-ric test for trend was used when appropriate. For all survivalanalyses, a Cox proportional hazards model was used. The like-lihood ratio test was used to test for differences between models.The endpoint for RFS was defined as any recurrence of breastcancer or contralateral breast cancer; for OS, it was defined asdeath from any cause. Patients who died without relapse werecensored at the last date of follow-up for the analysis of RFS.Patients with events after 120 months were censored at 120months. The rationale was that, after 10 years of observation,patients frequently are redirected to their general practitioner forcheckups and mammography and cease to be patients of theoutpatient breast cancer clinic. This would have an impact on theavailability and validity of follow-up data after 10 years.
The median follow-up of patients alive ranged from 46months to more than 120 months in the different datasets. Fivedatasets had a median follow-up of patients alive of less than60 months (46, 48, 53, 55, and 58 months, respectively). A basemodel was defined with the use of traditional prognostic factorsand adjuvant systemic therapy. Age was included as a linear
variable for both premenopausal and postmenopausal age com-bined with an indicator variable for menopausal status. Thisproved to be the best way of introducing age into the model, asit allows for the sharp decrease in hazard rates with age for theyoungest patients. As for tumor status, pT3 and pT4 were treatedas one category because the estimates from the Cox regressionwere similar in univariate and multivariable analyses with RFSas the endpoint. Lymph node status was the number of involvedlymph nodes categorized as 0, 1–3, 4–10, and more than 10. Lowhormone-receptor status was defined as either both ER low andPgR low or either ER low or PgR low and the other unknown;high hormone-receptor status was defined as at least one of ERor PgR high. The cutoff points as determined by each individuallaboratory for its dataset in defining high and low for ER andPgR, or the categorization as it was provided, was used. Histo-logic grade was included as well differentiated (grade I), mod-erately differentiated (grade II), undifferentiated (grade III), orunknown. Grade III was used as the reference category in thesurvival analyses. Adjuvant therapy was included as none, un-known, or any therapy. Some datasets did not have sufficientnumbers of events to allow a multivariable analysis. Cox uni-variate and multivariable regression analyses with either RFS or
Table 1. Patient and tumor characteristics
FactorNo. ofpatients %
uPA PAI-1
Total/high† % high† Two-sided P Total/high† % high† Two-sided P
Total 8377 100 8175/4086 50 6682/3337 50
Age in categories, y .55‡ .03‡<35 243 3 239/116 49 212/118 5635–55 3799 45 3720/1841 49 3104/1485 4856–70 3084 37 2998/1546 52 2357/1192 51>70 1251 15 1218/583 48 1009/542 54
Menopausal status .52§ .02§Premenopausal 3338 40 3278/1618 49 2749/1336 49Postmenopausal 5039 60 4897/2468 50 3933/2001 51
Tumor size <.001� <.001�pT1, �2 cm 3650 44 3540/1694 48 2857/1289 45pT2, >2–5 cm 4120 49 4035/2131 53 3266/1760 54pT3, >5 cm 444 5 438/180 41 407/204 50pT4 163 2 162/81 50 152/84 55
Lymph nodes involved .61� <.001�0 4676 56 4497/2270 50 3662/1740 481–3 2092 25 2079/1005 48 1692/890 534–10 1166 14 1160/583 50 952/513 54>10 443 5 439/228 52 376/194 52
Histologic grade <.001� <.001�I 583 7 530/209 39 439/157 36II 2237 27 2156/1065 49 1811/866 48III 2786 33 2728/1480 54 2490/1385 56Unknown 2771 33 2761/1332 48 1942/929 48
Adjuvant treatment .44� <.001�No 4286 51 4127/2061 50 3844/1891 49Unknown 320 4 320/145 45 44/20 45Yes 3771 45 3728/1880 50 2794/1426 51
Steroid hormone-receptor status¶ <.001§ <.001§Low 1697 20 1665/1052 63 1306/825 63High 6680 80 6510/3034 47 5376/2512 47
*uPA � urokinase-type plasminogen activator; PAI-1 � plasminogen activator inhibitor; pT � postsurgical histopathologic tumor size.†Above the overall median rank (rescaled ranks pooled for all datasets) for all tumors with data on uPA (8175 patients) or PAI-1 available (6682 patients).‡Spearman rank correlation.§Mann–Whitney U test.�Kruskal–Wallis test, followed by a nonparametric test for trend when appropriate.¶Low and high steroid hormone-receptor status as defined in the “Methods” section.
118 ARTICLES Journal of the National Cancer Institute, Vol. 94, No. 2, January 16, 2002
by guest on February 17, 2016http://jnci.oxfordjournals.org/
Dow
nloaded from

OS as endpoint were used; the sets were pooled and stratified bydataset. All multivariable analyses included the base model,which was defined as all variables except uPA and PAI-1. Theproportional hazards assumption was checked on the full mod-els. The assumption was not violated by uPA or PAI-1; however,some traditional prognostic factors, especially hormone-receptorstatus and lymph node status, did. Because the purpose of thisstudy was to show the prognostic impact of uPA and PAI-1, wechose to keep the base model as defined. To visualize uPA andPAI-1 in Kaplan–Meier curves, for each dataset, the uPA andPAI-1 data were divided into fifths with the use of their 20th,40th, 60th, and 80th percentiles. The log-rank test for trend wasused to test for differences.
Despite the use of different extraction and assay methods,measurements are highly correlated (30–32); i.e., high levels ofuPA and PAI-1 with the use of one method are high accordingto another method as well. However, because the method ofdetermination varied between laboratories, a common scale wasrequired. For each dataset, we ranked the uPA and PAI-1 mea-surements and divided the ranks by the number of patients.Thus, the uPA and PAI-1 levels were converted to fractionalranks (between 0 and 1). In this way, equal fractional ranks arecomparable across datasets with different numbers of patientsincluded. Effectively, we assume that the use of different assaysdid not influence the ranks of uPA and PAI-1 levels profoundly.As an alternative to dichotomization in each dataset, ranking andrescaling also have the advantage of allowing us to analyze uPAand PAI-1 as continuous variables. The hazard ratios (HRs) forthe ranked variables represent the differences between the ex-tremes. For a continuous variable, the hazard increases per unitwith the HR, which, in the case of fractional ranks, is the fullrange from 0 to 1. For categorized variables, such as uPA andPAI-1 when divided into fifths, dummy variables were intro-duced. The lower fifth was considered the reference category.The HRs for the remaining four groups were calculated com-pared with the reference category.
The base model was used to investigate the best fit of rankeduPA and PAI-1 in relation to RFS. The effect of ranked uPA andPAI-1 was modeled with the use of spline regression and frac-tional polynomials with relapse as the endpoint in a Cox pro-portional hazards model, stratified by dataset, and adjusted forthe base model. For uPA, spline regression with four knots (0.2,0.4, 0.6, and 0.8) showed the best fit. Fractional polynomials orfive knots in spline transformation did not result in a statisticallysignificantly better fit. The spline-transformed ranked uPA val-ues, rescaled between 0 and 1, were used for survival analyses.The ranks of PAI-1 did not need transformation because thelinear variable showed the best fit. For visualization of the in-dividual datasets, the HRs and 95% confidence intervals (CIs)corrected for the base model were presented as a forest plot (33).The combined HR and its 95% CI were calculated with the useof a random effects model (34). In random effects models, thebetween-studies variance is estimated and used to modify theweight used to calculate the summary estimate. It is assumedthat, in addition to sampling variation, the true effect variesbetween studies. The random effects model will in general bemore conservative (wider CIs) than the fixed effects model,which is based on the assumption that the true effect does notdiffer between studies. Using the random effects model, weestimated a mean effect (of the differing effects) around whichthe true effect is assumed to vary.
With the use of the base model and the final transformationsof uPA and PAI-1, interactions were investigated between theprognostic variables (age and menopausal status, tumor size,lymph node status, hormone-receptor status, histologic grade,and adjuvant treatment) and uPA or PAI-1 with the use of theCox proportional hazards model, stratified by dataset with RFSas the endpoint. For all interactions, a P value less than .01 wasconsidered statistically significant. The results suggest the analy-sis of the subsets of lymph node-negative and lymph node-positive patients. To visualize the prognostic value of uPA andPAI-1 in Kaplan–Meier curves for lymph node-negative andlymph node-positive patients, prognostic scores were calculatedwith both uPA and PAI-1 added to the base model and stratifiedfor datasets. The scores (exponentiated linear prediction) thenwere divided into fifths (i.e., with the use of the 20th, 40th, 60th,and 80th percentiles). All statistical analyses were performedwith the use of Stata Statistical Software (release 6.0; StataCorp., College Station, TX). Two-sided P values are given.
RESULTS
Associations of uPA and PAI-1 With Patient and TumorCharacteristics
The patient and tumor characteristics of all 8377 patientsincluded in the pooled analysis are presented in Table 1. Therelationships between uPA (8175 patients) or PAI-1 (6682 pa-tients) and patient and tumor characteristics are shown. The uPAand PAI-1 data are expressed as percentages of tumors above themedian rank value of 0.5. There were no statistically significantrelationships between uPA and age, menopausal status, or lymphnode status. PAI-1 values were correlated with age and werefound to be higher in postmenopausal and lymph node-positivepatients. The slightly higher PAI-1 levels in patients who re-ceived adjuvant treatment compared with those who did not areprobably a reflection of the association between treatment andlymph node status. Both the Spearman correlation coefficientbetween PAI-1 and age and its P value were .03. We consideredthis correlation and the relationship between PAI-1 and meno-pausal status to be of no clinical relevance. uPA and PAI-1 werepositively correlated with histologic grade, negatively correlatedwith hormone-receptor status, and found to be highest in pT2and pT4 tumors. The Spearman correlation coefficient betweenthe ranked uPA and PAI-1 values was .57 (P<.001; n � 6480).
Survival Analysis in All Patients as a Function of uPA andPAI-1 Status
Relapse-free survival. In Cox univariate analysis for RFS(data not shown), young premenopausal age, postmenopausalstatus, tumor size, number of lymph nodes involved, low steroidhormone-receptor level, and poor grade were all statisticallysignificantly associated with a poor disease outcome (allP<.001). Adjuvant treatment was associated with a poor RFS asa result of its association with poor prognostic features such asyoung premenopausal age and axillary lymph node involvementat diagnosis. Higher values of uPA and PAI-1 as continuousvalues were associated with a poor RFS (�2 � 189.5 and 247.1,respectively; df � 1). For visualization of the associationsof uPA and PAI-1 with RFS in Kaplan–Meier curves (Fig. 1,
Journal of the National Cancer Institute, Vol. 94, No. 2, January 16, 2002 ARTICLES 119
by guest on February 17, 2016http://jnci.oxfordjournals.org/
Dow
nloaded from
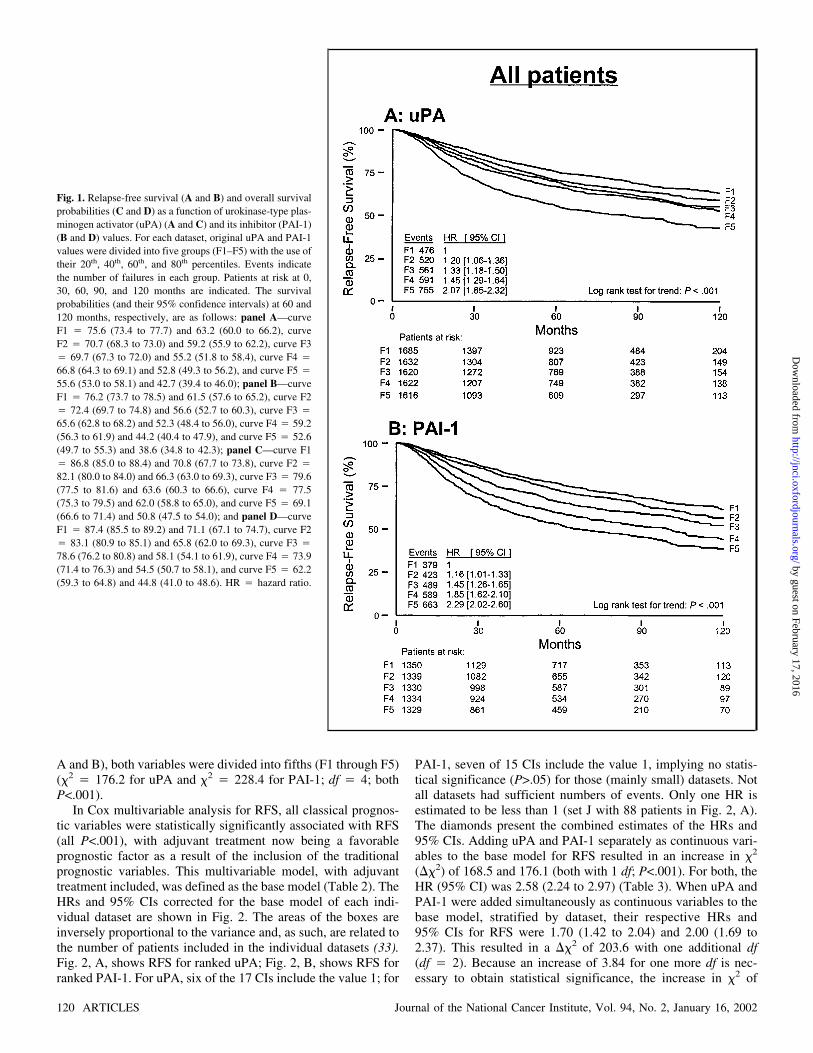
A and B), both variables were divided into fifths (F1 through F5)(�2 � 176.2 for uPA and �2 � 228.4 for PAI-1; df � 4; bothP<.001).
In Cox multivariable analysis for RFS, all classical prognos-tic variables were statistically significantly associated with RFS(all P<.001), with adjuvant treatment now being a favorableprognostic factor as a result of the inclusion of the traditionalprognostic variables. This multivariable model, with adjuvanttreatment included, was defined as the base model (Table 2). TheHRs and 95% CIs corrected for the base model of each indi-vidual dataset are shown in Fig. 2. The areas of the boxes areinversely proportional to the variance and, as such, are related tothe number of patients included in the individual datasets (33).Fig. 2, A, shows RFS for ranked uPA; Fig. 2, B, shows RFS forranked PAI-1. For uPA, six of the 17 CIs include the value 1; for
PAI-1, seven of 15 CIs include the value 1, implying no statis-tical significance (P>.05) for those (mainly small) datasets. Notall datasets had sufficient numbers of events. Only one HR isestimated to be less than 1 (set J with 88 patients in Fig. 2, A).The diamonds present the combined estimates of the HRs and95% CIs. Adding uPA and PAI-1 separately as continuous vari-ables to the base model for RFS resulted in an increase in �2
(��2) of 168.5 and 176.1 (both with 1 df; P<.001). For both, theHR (95% CI) was 2.58 (2.24 to 2.97) (Table 3). When uPA andPAI-1 were added simultaneously as continuous variables to thebase model, stratified by dataset, their respective HRs and95% CIs for RFS were 1.70 (1.42 to 2.04) and 2.00 (1.69 to2.37). This resulted in a ��2 of 203.6 with one additional df(df � 2). Because an increase of 3.84 for one more df is nec-essary to obtain statistical significance, the increase in �2 of
Fig. 1. Relapse-free survival (A and B) and overall survivalprobabilities (C and D) as a function of urokinase-type plas-minogen activator (uPA) (A and C) and its inhibitor (PAI-1)(B and D) values. For each dataset, original uPA and PAI-1values were divided into five groups (F1–F5) with the use oftheir 20th, 40th, 60th, and 80th percentiles. Events indicatethe number of failures in each group. Patients at risk at 0,30, 60, 90, and 120 months are indicated. The survivalprobabilities (and their 95% confidence intervals) at 60 and120 months, respectively, are as follows: panel A—curveF1 � 75.6 (73.4 to 77.7) and 63.2 (60.0 to 66.2), curveF2 � 70.7 (68.3 to 73.0) and 59.2 (55.9 to 62.2), curve F3� 69.7 (67.3 to 72.0) and 55.2 (51.8 to 58.4), curve F4 �
66.8 (64.3 to 69.1) and 52.8 (49.3 to 56.2), and curve F5 �
55.6 (53.0 to 58.1) and 42.7 (39.4 to 46.0); panel B—curveF1 � 76.2 (73.7 to 78.5) and 61.5 (57.6 to 65.2), curve F2� 72.4 (69.7 to 74.8) and 56.6 (52.7 to 60.3), curve F3 �
65.6 (62.8 to 68.2) and 52.3 (48.4 to 56.0), curve F4 � 59.2(56.3 to 61.9) and 44.2 (40.4 to 47.9), and curve F5 � 52.6(49.7 to 55.3) and 38.6 (34.8 to 42.3); panel C—curve F1� 86.8 (85.0 to 88.4) and 70.8 (67.7 to 73.8), curve F2 �
82.1 (80.0 to 84.0) and 66.3 (63.0 to 69.3), curve F3 � 79.6(77.5 to 81.6) and 63.6 (60.3 to 66.6), curve F4 � 77.5(75.3 to 79.5) and 62.0 (58.8 to 65.0), and curve F5 � 69.1(66.6 to 71.4) and 50.8 (47.5 to 54.0); and panel D—curveF1 � 87.4 (85.5 to 89.2) and 71.1 (67.1 to 74.7), curve F2� 83.1 (80.9 to 85.1) and 65.8 (62.0 to 69.3), curve F3 �
78.6 (76.2 to 80.8) and 58.1 (54.1 to 61.9), curve F4 � 73.9(71.4 to 76.3) and 54.5 (50.7 to 58.1), and curve F5 � 62.2(59.3 to 64.8) and 44.8 (41.0 to 48.6). HR � hazard ratio.
120 ARTICLES Journal of the National Cancer Institute, Vol. 94, No. 2, January 16, 2002
by guest on February 17, 2016http://jnci.oxfordjournals.org/
Dow
nloaded from

27.5 (203.6 minus 176.1) implies that both factors indepen-dently added to the prognostic strength provided by the tradi-tional prognostic factors, of which nodal status is the strongestfactor (Table 2). Thus, the model containing both uPA andPAI-1 is preferable over a model with only one of these factors(Table 3).
Overall survival. In the Cox univariate and multivariableanalyses for OS, the same factors that were of prognostic valuein the analysis of RFS showed statistically significant associa-tions in the same directions (all P<.001). Again nodal status isthe strongest prognostic factor in the model (data not shown). Asin the analysis for RFS, in the multivariable analysis for OS itwas shown that both uPA and PAI-1 were independent of thetraditional prognostic factors included in the base model and,furthermore, that inclusion of both factors resulted in a better fit(��2 � 212.9; df � 2) than that achieved with the inclusion ofeither factor alone (��2 � 149.5 and 192.4 for uPA and PAI-1,
respectively; df � 1) (Table 3). The Kaplan–Meier curves pre-sented in Fig. 1, C and D, illustrate the relationships of uPA andPAI-1 as categorical variables divided into fifths (�2 � 171.9and �2 � 259.4, [df � 4], respectively; both P<.001).
Interaction. The prognostic variables included in the basemodel were tested separately for interaction with uPA and PAI-1, with relapse as the endpoint. Significant interactions wereobserved between uPA and PAI-1 values with lymph node status(��2 � 13.6, df � 3, and P � .004, and �2 � 14.4, df � 3, andP � .002, respectively) and of uPA with tumor size (��2 � 9.3,df � 2, and P � .009). The other interactions tested were notstatistically significant, including those between uPA and PAI-1(��2 � 1.9, df � 1, and P � .17). The interaction of lymphnode status with uPA and PAI-1 suggested the analysis of theprognostic value of uPA and PAI-1 in the clinically importantsubgroups of lymph node-negative and lymph node-positivepatients.
Fig. 1. Continued.
Journal of the National Cancer Institute, Vol. 94, No. 2, January 16, 2002 ARTICLES 121
by guest on February 17, 2016http://jnci.oxfordjournals.org/
Dow
nloaded from

Survival Analysis as a Function of uPA and PAI-1 StatusAccording to Lymph Node Status of the Patients
Lymph node-negative patients. Until recently, systemic ad-juvant treatment for lymph node-negative patients was not stan-dard practice in many European countries. Of the 4676 lymphnode-negative patients in the pooled dataset, 3362 (72%) did notreceive systemic adjuvant therapy. To study the impact of uPAand PAI-1 on RFS and OS, we analyzed the prognostic value ofuPA and PAI-1 in all 3483 lymph node-negative patients forwhom both uPA and PAI-1 data were available. Table 4 (upperpart) shows the results of adding uPA and PAI-1, separately orcombined, to the base model for RFS. Except for the lack of astatistically significant association of steroid hormone-receptorstatus and adjuvant treatment with RFS, all traditional prognos-tic variables were statistically significantly associated with RFSand OS. uPA and PAI-1 were statistically significantly associ-ated with poor RFS (Table 4, upper part) when added separatelyto the base model (all P<.001). Furthermore, the addition of bothuPA and PAI-1 to the base model for RFS resulted in a statis-tically significantly better fit (��2 � 116.8; df � 2) than theaddition of either factor alone (��2 � 94.8 for uPA, ��2 � 83.1for PAI-1; df � 1). It is remarkable that the ��2 associated withthe simultaneous addition of uPA and PAI-1 was of a similarmagnitude as the �2 of 129.3 of the base model with all of thetraditional prognostic factors. In the analysis for OS, the additionof uPA and PAI-1 together resulted in a ��2 of 95.3 (df � 2).
This compared with 69.2 (df � 1) for uPA and 74.2 (df � 1) forPAI-1, implying a statistically significantly better fit after theaddition of both UPA and PAI-1 in the analysis for OS, as well.The HRs and 95% CIs were not different when the multivari-able-stratified analysis for RFS and OS were restricted to the2864 lymph node-negative patients who had not received adju-vant treatment and for whom both uPA and PAI-1 data wereavailable. When both uPA and PAI-1 were added to the basemodel for RFS, a statistically significantly better fit was ob-served (��2 � 94.0; df � 2) than that observed after the addi-tion of either factor alone (��2 � 76.6 for uPA, and ��2 � 66.5for PAI-1; df � 1) (Table 4, middle part). Similar results wereobtained in the analysis for OS (uPA and PAI-1 together, ��2 �81.6, and df � 2; uPA or PAI-1 alone, ��2 � 57.5 and 65.6,respectively, and df � 1).
To show categorized results for uPA and PAI-1 in lymphnode-negative patients, we calculated a prognostic score basedon the estimates from the multivariable analysis for RFS for alllymph node-negative patients (Table 4, upper part). For visual-ization in Kaplan–Meier curves, the prognostic score was di-vided into fifths with the use of the 20th, 40th, 60th, and 80th
percentiles. In the analysis for RFS, based on the prognosticscore for all 3483 lymph node-negative patients with both uPAand PAI-1 data available, the difference in 10-year RFS betweenthe lowest and highest risk groups was 34.5% (Fig. 3, A). In theanalysis for OS, the survival difference between the extreme-riskgroups was 28.2% at 10 years (Fig. 3, C). For the 2864 untreated
Table 2. Multivariable stratified Cox regression analysis for relapse-free survival: base model*
FactorNo. ofpatients Events HR† 95% CI† �2 df Two-sided P‡
Total 8377 2955 1173 14 <.001
Age and menopausal status§ 74.6 3 <.001Age premenopausal 3338 1258 0.70 0.64 to 0.76Age postmenopausal 5039 1697 0.96 0.91 to 1.02Postmenopausal vs. premenopausal 1.35 1.18 to 1.54
Tumor size, cm 98.8 2 <.001�2 3650 953 1>2–5 4120 1651 1.43 1.31 to 1.55>5� 607 351 1.79 1.57 to 2.04
Lymph nodes involved 626.5 3 <.0010 4676 1211 11–3 2092 760 1.86 1.67 to 2.084–10 1166 662 3.27 2.91 to 3.66>10 443 322 5.54 4.81 to 6.39
Steroid hormone-receptor status¶ 24.6 1 <.001Low 1697 689 1High 6680 2266 0.79 0.73 to 0.87
Histologic grade 71.4 3 <.001III 2786 1259 1Unknown 2771 959 0.79 0.71 to 0.89II 2237 645 0.73 0.66 to 0.81I 583 92 0.48 0.38 to 0.60
Adjuvant therapy 66.7 2 <.001No 4286 1516 1Unknown 320 80 0.98 0.70 to 1.37Yes 3771 1359 0.66 0.60 to 0.73
*Stratified for dataset.†HR � hazard ratio; CI � confidence interval.‡Likelihood ratio test.§Age and menopausal status combined; age tested separately for premenopausal and postmenopausal patients.�Postsurgical histopathologic tumor size pT3 and pT4 combined.¶Low and high steroid hormone-receptor status as defined in the “Methods” section.
122 ARTICLES Journal of the National Cancer Institute, Vol. 94, No. 2, January 16, 2002
by guest on February 17, 2016http://jnci.oxfordjournals.org/
Dow
nloaded from

lymph node-negative patients, the differences in 10-year RFSand OS between the lowest and highest risk groups were ofsimilar magnitude: 35.4% and 28.1%, respectively (Kaplan–Meier curves not shown).
Lymph node-positive patients. For the 2997 lymph node-positive patients with both uPA and PAI-1 data available, theresults of adding uPA and PAI-1 separately or together to thebase model for RFS are shown in Table 4 (bottom part). Alltraditional prognostic variables were statistically significantlyassociated with RFS and OS. Furthermore, uPA and PAI-1 werestatistically significantly associated with poor RFS (Table 4,bottom part) and OS when added separately to the base model
(for all, P<.001). In contrast to lymph node-negative patients,for lymph node-positive patients, the addition of both uPAand PAI-1 to the base model in the analysis for RFS did notresult in a better fit (��2 � 88.4; df � 2) than the addition ofeither factor alone (��2 � 52.5 for uPA, and ��2 � 87.1 forPAI-1; df � 1) (Table 4, bottom part). However, in the OSanalysis, the simultaneous addition of uPA and PAI-1 resulted ina better fit (��2 � 121.4; df � 2), compared with the additionof uPA (��2 � 77.0; df � 1) or PAI-1 alone (��2 � 105.9;df � 1).
A prognostic score was calculated for lymph node-positivepatients also. In the analysis for RFS, the difference in 10-year
Fig. 2. Multivariable analysis for relapse-free survival (RFS) as a function ofurokinase-type plasminogen activator (uPA) (A) and its inhibitor (PAI-1) (B) perdataset presented as a forest plot. All data are corrected for the base model,including age and menopausal status, tumor size, lymph node status, steroidhormone-receptor status, histologic grade, and adjuvant treatment. For eachdataset, the hazard ratio (HR) of transformed ranked uPA or ranked PAI-1 valuesis plotted as a solid square, its area being inversely proportional to the variance
of the estimated effect, and its 95% confidence interval (CI) is plotted as ahorizontal line. Individual patient data were obtained from both published [inwhole or in part; A (14), C (15), D (16), F (17), I (18), M (19), N (20), O (21),P (22), Q (23,24), and R (25)] and unpublished (B, E, G, H, J, K, and L) datasets.Diamond represents the combined random effects estimate (middle of the dia-mond) and its 95% CI (extremes of the diamond) of the combined estimatesadjusted for the base model.
Journal of the National Cancer Institute, Vol. 94, No. 2, January 16, 2002 ARTICLES 123
by guest on February 17, 2016http://jnci.oxfordjournals.org/
Dow
nloaded from

RFS between the lowest and highest risk groups was 41.4% (Fig.3, B). In the analysis for OS, the survival difference between theextreme-risk groups defined by the prognostic score was 45.9%at 10 years (Fig. 3, D).
DISCUSSION
Identification of those prognostic and predictive factors thatreflect the biology of breast cancer is important for refining ourassessment of prognosis and the selection of patients who maybenefit from adjuvant systemic therapy. In this respect, numer-
ous cell biologic factors have been studied in the past decade.Except for the well-established clinical utility of steroid hor-mone receptors, ER and PgR, many studies on prognostic factorsare hampered by inconsistent results. They are often inconclu-sive as a result of small numbers of patients and heterogeneity ofthe studies with respect to patient populations and laboratorytechniques used. Therefore, guidelines have been established forthe assessment of the clinical utility of prognostic factors(35,36). The studies reporting the impact of uPA and PAI-1 onprimary breast cancer prognosis all have shown an unfavorable
Table 3. Multivariable stratified analysis for relapse-free survival and overall survival as a function of urokinase-type plasminogenactivator (uPA) and its inhibitor PAI-1
Factor* No. of patients Events HR† 95% CI† �2 df Two-sided P‡
Relapse-free survivaluPA§ 8175 2903 2.58 2.24 to 2.97 168.5 1 <.001PAI-1§ 6682 2543 2.58 2.24 to 2.97 176.1 1 <.001uPA + PAI-1� 6480 2491 203.6 2 <.001
uPA 1.70 1.42 to 2.04PAI-1 2.00 1.69 to 2.37
Overall survivaluPA§ 8175 2228 2.73 2.33 to 3.19 149.5 1 <.001PAI-1§ 6682 1960 3.12 2.65 to 3.67 192.4 1 <.001uPA + PAI-1� 6480 1934 212.9 2 <.001
uPA 1.77 1.44 to 2.16PAI-1 2.34 1.93 to 2.83
*uPA and its inhibitor, PAI-1, added alone or together, as continuous variable, to the base model presented in Table 2. Hazard ratios represent the differencebetween the extreme fractional ranks of uPA or PAI-1 levels (i.e., a fractional rank of 1 compared with a fractional rank of 0).
†HR � hazard ratio; CI � confidence interval.‡Likelihood ratio test.§uPA or PAI-1 added alone.�uPA and PAI-1 added togther.
Table 4. Multivariable stratified analysis for relapse-free survival in lymph node subgroups of patients*
Factor† No. of patients Events HR‡ 95% CI‡ �2 df Two-sided P§
All lymph node-negative patientsBase model 3483 970 129.3 11 <.001uPA� 3.42 2.68 to 4.37 94.8 1 <.001PAI-1� 2.87 2.28 to 3.60 83.1 1 <.001uPA + PAI-1¶ 116.8 2 <.001
uPA 2.37 1.78 to 3.16PAI-1 1.90 1.45 to 2.49
Lymph node-negative patients without adjuvant treatmentBase model 2864 829 105.7 9 <.001uPA� 3.34 2.56 to 4.36 76.6 1 <.001PAI-1� 2.77 2.17 to 3.55 66.5 1 <.001uPA + PAI-1¶ 94.0 2 <.001
uPA 2.34 1.71 to 3.21PAI-1 1.86 1.39 to 2.48
Lymph node-positive patientsBase model 2997 1521 476.0 13 <.001uPA� 2.10 1.72 to 2.56 52.5 1 <.001PAI-1� 2.41 2.00 to 2.90 87.1 1 <.001
uPA + PAI-1¶ 88.4 2 <.001uPA 1.34 1.06 to 1.71PAI-1 2.05 1.64 to 2.56
*For patients for whom information on levels of both urokinase-type plasminogen activator (uPA) and its inhibitor (PAI-1) are available.†uPA and PAI-1 added alone or together as continuous variable to the base models (lymph node status not included in the base models for lymph node-negative
patients; adjuvant therapy not included in the base model for untreated lymph node-negative patients). Hazard ratios represent the difference between the extremefractional ranks of uPA or PAI-1 levels (i.e., a fractional rank of 1 compared with a fractional rank of 0).
‡HR � hazard ratio; CI � confidence interval.§Likelihood ratio test.�uPA or PAI-1 added alone.¶uPA and PAI-1 added together.
124 ARTICLES Journal of the National Cancer Institute, Vol. 94, No. 2, January 16, 2002
by guest on February 17, 2016http://jnci.oxfordjournals.org/
Dow
nloaded from

clinical outcome with high levels of uPA and/or PAI-1, andvirtually all of the criteria set by the guidelines have been met[for a review, see reference (12)]. More recently, it has beenproposed that, for acceptance of new tumor-associated markersinto clinical practice, studies should meet the Tumor MarkerUtility Grading System criteria for level of evidence 1 (LOE-1)(37,38). According to these criteria, LOE-1 can be attained ei-ther by a prospective high-powered study of a tumor-associatedmarker or by a suitable meta-analysis of prospective or retro-spective datasets (37,38). To substantiate the prognostic value ofuPA and PAI-1 for patients with primary breast cancer, twoLOE-1-type studies now have been carried out. The first is aprospective clinical trial in lymph node-negative breast cancerpatients (39), and the second is the pooled analysis presented inthis article. This analysis is, to our knowledge, the first collabo-rative study on tumor biologic markers in breast cancer with theuse of observational individual patient data.
In the various published studies on the prognostic signifi-cance of uPA and PAI-1, different variables were included in thefinal multivariable models, and often the numbers of events weretoo low to be conclusive (12). In this pooled analysis of indi-vidual patient data, we included the same variables and end-points for all datasets. All analyses presented included the sametraditional prognostic variables, defined as the base model. Ourstudy population included the individual patient and laboratorydata provided by the members of the EORTC-RBG. TheEORTC-RBG designs and validates new laboratory assays andinteracts on an international basis. It is important that all memberlaboratories are involved in quality-assurance programs for uPAand PAI-1 (26,30).
The 18 datasets included in these analyses were heteroge-neous with respect to the immunoassays used, the method oftumor extraction, the protein determination, and the patient char-acteristics. The first three of these differences were overcome inpart by transforming uPA and PAI-1 levels to fractional ranksfor all individual datasets, while the introduction of a base modelhelped to decrease the heterogeneity between datasets as a resultof the patient characteristics.
For uPA, spline-transformed ranked values with four knots,rescaled between 0 and 1, gave the best fit and were thus used inthe analyses; increasing the number of the knots or analyzing byfractional polynomials did not result in a better fit. For PAI-1, nofurther transformation of the ranks was necessary; the rankedvariable already provided the best fit. Note that, despite theheterogeneity between the individual datasets, the multivariableanalysis with the use of ranked variables showed that the HRsfor relapse in the individual datasets all point in the same direc-tion, with the exception of one small study of 88 patients. In thevarious published studies on the prognostic value of uPA and/orPAI-1 in primary breast cancer [for review, see reference (12)],different subgroups were analyzed, such as lymph node-negativeand lymph node-positive patients, premenopausal and post-menopausal patients, and steroid hormone-receptor subgroups ofpatients. In this study, we corrected for these traditional prog-nostic variables in the multivariable base model, including tumorgrade and adjuvant treatment. We found a statistically signifi-cant interaction between uPA and PAI-1 with lymph node statusin the analysis for RFS that led us to further investigate thesubgroups of lymph node-negative and lymph node-positive pa-tients. Analyzing subgroups ignores a large number of patients,and there is the risk of running into low numbers of events
jeopardizing these analyses. For lymph node-negative andlymph node-positive patients with both uPA and PAI-1 dataavailable, the numbers of events (970 and 1521, respectively)were sufficient, assuming that we need 15 events per category ofa variable (40). In our final multivariable models, the requirednumbers of events would amount to approximately 200 for thelymph node-negative patients and 225 for the lymph node-positive patients.
The results presented here on more than 8000 female patientswith primary breast cancer show unequivocally that high tumorlevels of uPA and PAI-1 are associated with poor RFS and OS.Similar findings were observed in the clinically important sub-groups of (untreated) lymph node-negative and lymph node-positive breast cancer patients. In the multivariable RFS and OSanalyses of all patients, lymph node status was the strongestprognostic variable, followed by levels of uPA and PAI-1 to-gether. Adding both uPA and PAI-1 to the model showed aneffect twice as strong as tumor size or histologic grade, irrespec-tive of the observed positive correlation between uPA and PAI-1with size and grade of the tumor. Of particular interest was theobservation that, in multivariable RFS analyses of lymph node-negative patients, the addition of uPA and PAI-1 together was ofa similar prognostic magnitude as the base model itself, with thecurrently used prognostic factors included. When stratified bydataset, a prognostic score for the full model, including bothuPA and PAI-1, distinguished between patients with a favorableand an unfavorable prognosis (a 34.5% difference in RFS and a28.2% difference in OS at 10 years between the extreme-riskgroups). In the most favorable 20% group of patients, at 10years, the RFS and OS probabilities were 76.9% and 87.2%,respectively. For patients in this low-risk group, some form ofadjuvant endocrine treatment could be considered, which may beless beneficial for patients with high uPA and PAI-1 levels (13).Some form of adjuvant chemotherapy could be offered to theremaining lymph node-negative patients. In lymph node-positivepatients, with the use of the categorized prognostic score, onefifth of the patients showed a relatively good prognosis (60.9%RFS and 72.0% OS at 10 years). Furthermore, a large group ofpatients (40%) with a particularly poor prognosis (<30% RFS)could be identified. These latter patients could possibly benefitfrom an aggressive form of adjuvant chemotherapy. Moreover,patients with uPA-expressing tumors may be future candidatesfor receiving drugs targeting the plasminogen activation system,several of which are currently being developed and tested pre-clinically (3,4).
Despite the heterogeneity of patient samples included and thedifferences in tumor extraction methods and assays to measureuPA and PAI-1 levels, this meta-analysis shows unequivocallythat high levels of uPA and PAI-1 are associated with a poorprognosis in primary breast cancer. The information that can begained by measuring the tumor levels of uPA and PAI-1 is surelybeyond that which is obtained by the currently used classicalprognostic factors such as tumor stage and grade. This statementalso holds for the clinically important subgroups of (untreated)lymph node-negative and lymph node-positive patients. In a rou-tine setting, the levels of uPA and PAI-1 can be measured in aslittle as 50 mg of tumor tissue, with the use of assays that can beeasily quality controlled (26) and standardized, making determi-nations of uPA and PAI-1 tumor levels feasible for almost allavailable primary breast tumors.
In spite of the strong data presented here, from this study, no
Journal of the National Cancer Institute, Vol. 94, No. 2, January 16, 2002 ARTICLES 125
by guest on February 17, 2016http://jnci.oxfordjournals.org/
Dow
nloaded from

recommendations for specific treatments for the various riskgroups of (subgroups of) patients can be made. To address thisissue, data from large, prospective, randomized (multicenter)trials, where all laboratories use identical assays and are subjectto external quality control, are needed. To this end, lymph node-negative patients stratified by their tumor uPA and PAI-1 levelshave been randomly assigned to receive chemotherapy or obser-vation (39).
REFERENCES
(1) Early Breast Cancer Trialists’ Collaborative Group. Systemic treatment ofearly breast cancer by hormonal, cytotoxic, or immune therapy: 133 ran-
domised trials involving 31,000 recurrences and 24,000 deaths among75,000 women. Lancet 1992;339:1–15 (Part I) and 71–85 (Part II).
(2) Andreasen PA, Kjoller L, Christensen L, Duffy MJ. The urokinase-typeplasminogen activator system in cancer metastasis: a review. Int J Cancer1997;72:1–22.
(3) Schmitt M, Harbeck N, Thomssen C, Wilhelm O, Magdolen V, Reuning U,et al. Clinical impact of the plasminogen activation system in tumor inva-sion and metastasis: prognostic relevance and target for therapy. ThrombHaemost 1997;78:285–96.
(4) Rosenberg S. Modulators of the urokinase-type plasminogen activationsystem for cancer. Exp Opin Ther Patents 2000;10:1843–52.
(5) Carmeliet P, Moons L, Lijnen R, Baes M, Lemaitre V, Tipping P, et al.Urokinase-generated plasmin activates matrix metalloproteinases duringaneurysm formation. Nat Genet 1997;17:439–44.
Fig. 3. Relapse-free survival (A and B) and overall survival(C and D) probabilities as a function of categorized prog-nostic scores in lymph node-negative (A and C) and lymphnode-positive (B and D) breast cancer patients. Based on thestratified estimates for the full model (for hazard ratios ofurokinase-type plasminogen activator [uPA] and its inhibi-tor [PAI-1], see Table 4), prognostic scores were calculatedand divided into five groups (F1–F5) with the use of their20th, 40th, 60th, and 80th percentiles. Events indicate thenumber of failures in each group. Patients at risk at 0, 30,60, 90, and 120 months are indicated. The survival prob-abilities (and their 95% confidence intervals) at 60 and 120months, respectively, are as follows: panel A—curve F1 �
90.0 (87.2 to 92.2) and 76.9 (71.2 to 81.6), curve F2 � 84.3(81.1 to 86.9) and 67.6 (61.8 to 72.8), curve F3 � 76.4(72.9 to 79.5) and 62.3 (57.0 to 67.2), curve F4 � 71.2(67.4 to 74.6) and 58.8 (53.3 to 63.8), and curve F5 � 55.5(51.6 to 59.3) and 42.4 (37.1 to 47.5); panel B—curve F1� 77.5 (73.7 to 80.8) and 60.9 (55.3 to 66.1), curve F2 �
61.8 (57.6 to 65.8) and 47.9 (42.5 to 53.1), curve F3 � 54.8(50.5 to 59.0) and 35.8 (30.3 to 41.4), curve F4 � 40.5(36.3 to 44.6) and 28.9 (24.4 to 33.5), and curve F5 � 29.5(25.7 to 33.3) and 19.5 (15.8 to 23.6); panel C—curve F1� 95.0 (93.0 to 96.5) and 87.2 (82.4 to 90.8), curve F2 �
92.1 (89.6 to 94.0) and 75.7 (69.7 to 80.7), curve F3 � 90.8(88.3 to 92.8) and 73.6 (68.1 to 78.2), curve F4 � 84.8(81.7 to 87.3) and 69.4 (64.2 to 74.0), and curve F5 � 74.2(70.6 to 77.4) and 59.0 (53.7 to 63.8); and panel D—curveF1 � 86.2 (83.1 to 88.9) and 72.0 (66.3 to 76.9), curve F2� 74.6 (70.7 to 78.1) and 46.2 (40.2 to 52.0), curve F3 �
66.1 (62.0 to 69.9) and 44.0 (38.4 to 49.4), curve F4 � 55.4(51.1 to 59.4) and 32.6 (27.9 to 37.5), and curve F5 � 42.3(38.2 to 46.3) and 26.1 (22.0 to 30.4).
126 ARTICLES Journal of the National Cancer Institute, Vol. 94, No. 2, January 16, 2002
by guest on February 17, 2016http://jnci.oxfordjournals.org/
Dow
nloaded from

(6) Duffy MJ, O’Grady P, Devaney D, O’Siorain L, Fennelly JJ, Lijnen HJ.Urokinase-plasminogen activator, a marker for aggressive breast carcino-mas: preliminary report. Cancer 1988;62:531–3.
(7) Janicke F, Schmitt M, Graeff H. Clinical relevance of the urokinase-typeand tissue-type plasminogen activators and of their type 1 inhibitor inbreast cancer. Semin Thromb Hemost 1991;17:303–12.
(8) Bajou K, Noel A, Gerard RD, Masson V, Brunner N, Holst-Hansen C, etal. Absence of host plasminogen activator inhibitor 1 prevents cancer in-vasion and vascularization. Nat Med 1998;4:923–8.
(9) Deng G, Curriden SA, Wang S, Rosenberg S, Loskutoff DJ. Is plasminogenactivator inhibitor-1 the molecular switch that governs urokinase receptor-mediated cell adhesion and release. J Cell Biol 1996;134:1563–71.
(10) Stefansson S, Lawrence DA. The serpin PAI-1 inhibits cell migration byblocking integrin �v�3 binding to vitronectin. Nature 1996;383:441–3.
(11) Duffy MJ. Proteases as prognostic markers in cancer. Clin Cancer Res1996;2:613–8.
(12) Look MP, Foekens JA. Clinical relevance of the urokinase plasminogenactivator system in breast cancer. APMIS 1999;107:150–9.
(13) Foekens JA, Look MP, Peters HA, van Putten WL, Portengen H, Klijn JG.Urokinase-type plasminogen activator and its inhibitor PAI-1: predictors ofpoor response to tamoxifen therapy in recurrent breast cancer. J Natl Can-cer Inst 1995;87:751–6.
(14) Foekens JA, Peters HA, Look MP, Portengen H, Schmitt M, Kramer MD,et al. The urokinase system of plasminogen activation and prognosis in2780 breast cancer patients. Cancer Res 2000;60:636–43.
(15) Bouchet C, Hacene K, Martin PM, Becette V, Tubiana-Hulin M, Lasry S,et al. Dissemination risk index based on plasminogen activator systemcomponents in primary breast cancer. J Clin Oncol 1999;17:3048–57.
(16) Eppenberger U, Kueng W, Schlaeppi JM, Roesel JL, Benz C, Mueller H,et al. Markers of tumor angiogenesis and proteolysis independently definehigh- and low-risk subsets of node-negative breast cancer patients. J ClinOncol 1998;16:3129–36.
Fig. 3. Continued.
Journal of the National Cancer Institute, Vol. 94, No. 2, January 16, 2002 ARTICLES 127
by guest on February 17, 2016http://jnci.oxfordjournals.org/
Dow
nloaded from

(17) Duffy MJ, Duggan C, Mulcahy HE, McDermott EW, O’Higgins NJ.Urokinase plasminogen activator: a prognostic marker in breast cancerincluding patients with axillary node-negative disease. Clin Chem1998;44(6 Pt 1):1177–83.
(18) Harbeck N, Thomssen C, Berger U, Ulm K, Kates RE, Hofler H, et al.Invasion marker PAI-1 remains a strong prognostic factor after long-termfollow-up both for primary breast cancer and following first relapse. BreastCancer Res Treat 1999;54:147–57.
(19) Peyrat JP, Vanlemmens L, Fournier J, Huet G, Revillion F, Bonneterre J.Prognostic value of p53 and urokinase-type plasminogen activator in node-negative human breast cancers. Clin Cancer Res 1998;4:189–96.
(20) Broet P, Spyratos F, Romain S, Quillien V, Daver A, Ricolleau G, et al.Prognostic value of uPA and p53 accumulation measured by quantitativebiochemical assays in 1245 primary breast cancer patients: a multicentrestudy. Br J Cancer 1999;80:536–45.
(21) Ferno M, Bendahl PO, Borg A, Brundell J, Hirschberg L, Olsson H, et al.Urokinase plasminogen activator, a strong independent prognostic factor inbreast cancer, analysed in steroid receptor cytosols with a luminometricimmunoassay. Eur J Cancer 1996;32A:793–801.
(22) Malmstrom P, Bendahl PO, Boiesen P, Brunner N, Idvall I, Ferno M.S-phase fraction and urokinase plasminogen activator are better markers fordistant recurrences than Nottingham Prognostic Index and histologic gradein a prospective study of premenopausal lymph node-negative breast can-cer. J Clin Oncol 2001;19:2010–9.
(23) Grondahl-Hansen J, Christensen IJ, Rosenquist C, Brunner N, MouridsenHT, Dano K, et al. High levels of urokinase-type plasminogen activator andits inhibitor PAI-1 in cytosolic extracts of breast carcinomas are associatedwith poor prognosis. Cancer Res 1993;53:2513–21.
(24) Grondahl-Hansen J, Christensen IJ, Briand P, Pappot H, Mouridsen HT,Blichert-Toft M, et al. Plasminogen activator inhibitor type I in cytosolictumor extracts predicts prognosis in low-risk breast cancer patients. ClinCancer Res 1997;3:233–9.
(25) Pedersen AN, Christensen IJ, Stephens RW, Briand P, Mouridsen HT,Dano K, et al. The complex between urokinase and its type-1 inhibitor inprimary breast cancer: relation to survival. Cancer Res 2000;60:6927–34.
(26) Sweep CG, Geurts-Moespot J, Grebenschikov N, de Witte JH, Heuvel JJ,Schmitt M, et al. External quality assessment of trans-European multicentreantigen determinations (enzyme-linked immunosorbent assay) of uroki-nase-type plasminogen activator (uPA) and its type 1 inhibitor (PAI-1) inhuman breast cancer tissue extracts. Br J Cancer 1998;78:1434–41.
(27) Sherman CD, Hossfeld DK. Breast cancer. In: Hossfeld DK, Sherman CD,Love RR, Bosch FX, editors. Manual of clinical oncology. Geneva (Swit-zerland): International Union Against Cancer; 1990. p. 253–71.
(28) Grebenschikov N, Geurts-Moespot A, De Witte H, Heuvel J, Leake R,Sweep F, et al. A sensitive and robust assay for urokinase and tissue-type
plasminogen activators (uPA and tPA) and their inhibitor type I (PAI-1) inbreast tumor cytosols. Int J Biol Markers 1997;12:6–14.
(29) Lowry OH, Rosebrough NJ, Farr AI, Randall G. Protein measurement withfolin phenol reagent. J Biol Chem 1951;193:265–75.
(30) Janicke F, Pache L, Schmitt M, Ulm K, Thomssen C, Prechtl A, et al. Boththe cytosols and detergent extracts of breast cancer tissues are suited toevaluate the prognostic impact of the urokinase-type plasminogen activatorand its inhibitor, plasminogen activator inhibitor type 1. Cancer Res 1994;54:2527–30.
(31) Benraad TJ, Geurts-Moespot J, Grondahl-Hansen J, Schmitt M, HeuvelJJTM, de Witte JH, et al. Immunoassays (ELISA) of urokinase-type plas-minogen activator (uPA): report of an EORTC/BIOMED-1 workshop. EurJ Cancer 1996;32A:1371–81.
(32) Bouchet C, Spyratos F, Hacene K, Durcos L, Becette V, Oglobine J.Prognostic value of urokinase plasminogen activator in primary breast car-cinoma: comparison of two immunoassay methods. Br J Cancer 1998;77:1495–501.
(33) Sharp S, Sterne J. 1997. sbe 16: Meta-analysis Stata Technical Bulletin38:9–14. Reprinted in Stata Technical Bulletin Reprints, vol. 7, pp. 100–6.
(34) DerSimonian R, Laird N. Meta-analysis in clinical trials. Control ClinTrials 1986;7:177–88.
(35) McGuire WL, Clark GM. Prognostic factors and treatment decisions inaxillary-node-negative breast cancer. N Engl J Med 1992;326:1756–61.
(36) Gasparini G, Pozza F, Harris AL. Evaluating the potential usefulness ofnew prognostic and predictive indicators in node-negative breast cancerpatients. J Natl Cancer Inst 1993;85:1206–19.
(37) Hayes DF, Bast RC, Desch CE, Fritsche H Jr, Kemeny NE, Jessup JM, etal. Tumor marker utility grading system: a framework to evaluate clinicalutility of tumor markers. J Natl Cancer Inst 1996;88:1456–66.
(38) Hayes DF, Trock B, Harris AL. Assessing the clinical impact of prognosticfactors: when is “statistically significant” clinically useful. Breast CancerRes Treat 1998;52:305–19.
(39) Janicke F, Prechtl A, Thomssen C, Harbeck N, Meisner C, Untch M, et al.Randomized adjuvant chemotherapy trial in high-risk, lymph node-negative breast cancer patients identified by urokinase-type plasminogenactivator and plasminogen activator inhibitor type 1. J Natl Cancer Inst2001;93:913–20.
(40) Harrell FE Jr, Lee KL, Mark DB. Multivariable prognostic models: issuesin developing models, evaluating assumptions and adequacy, and measur-ing and reducing errors. Stat Med 1996;15:361–87.
NOTES
Supported by the Dutch Cancer Society grants DDHK 1996–1234 and DDHK2000–2256.
Manuscript received April 9, 2001; revised October 19, 2001; acceptedNovember 5, 2001.
128 ARTICLES Journal of the National Cancer Institute, Vol. 94, No. 2, January 16, 2002
by guest on February 17, 2016http://jnci.oxfordjournals.org/
Dow
nloaded from
Copyright © 2022 FDOKUMEN