Polyhedral Oligomeric Silsesquioxane (POSS) Based Resists: Material Design Challenges and...
11
Polyhedral Oligomeric Silsesquioxane (POSS) Based Resists: Material Design Challenges and Lithographic Evaluation at 157 nm Evangelia Tegou, ² Vassilios Bellas, ² Evangelos Gogolides, ² Panagiotis Argitis,* ,² David Eon, ‡ Gilles Cartry, ‡ and Christophe Cardinaud ‡ Institute of Microelectronics, NCSR “Demokritos”, 15310 Ag. Paraskevi, Athens, Greece, and Laboratoire des Plasmas et des Couches Minces, Institut des Materiaux “Jean Rouxel”, BP 32229, 44322 Nantes, France Received October 30, 2003. Revised Manuscript Received March 16, 2004 In this paper we describe the lithographic behavior and related material properties of a new class of chemically amplified, positive tone, silicon-containing methacrylate photoresists incorporating the polyhedral oligomeric silsesquioxane (POSS) group as the etch-resistant component. POSS-bearing monomers were copolymerized with methacrylic acid (MA), tert- butyl methacrylate (TBMA), tert-butyl trifluoro methacrylate (TBTFMA), itaconic anhydride (IA), and 2-(trifluoromethyl) acrylic acid (TFMA), in various compositions. A perfluorooc- tylsulfonate-based photoacid generator (PAG) was used to deprotect TBMA (or TBTFMA) to base soluble carboxylic acid by heating after exposure. XPS and angular XPS analysis were used to examine possible surface segregation phenomena. It was proven that POSS surface enrichment occurs for the POSS-TBMA copolymers while surface segregation may be reduced if suitable additional resist components are selected. The POSS-based resists were studied for 157-nm lithographic applications and found to have high sensitivity (<10 mJ/cm 2 under open field exposure), no silicon outgassing, and sub-100-nm resolution capabilities. Ninety nanometer patterns in 100-nm thick films were resolved. At present, their absorbance is high (∼4 μm -1 ) for single-layer lithographic applications at 157 nm; however, high etch resistance in oxygen plasma makes them suitable for bilayer schemes. 1. Introduction The research activity on new lithographic resist materials capable of meeting the constantly increasing performance demands posed by the International Tech- nology Roadmap for Semiconductors for the next decade has greatly expanded during recent years. 1 Currently, different lithographic approaches are investigated for the fabrication of devices with sub-100-nm critical dimensions, including 193 nm, 157 nm, EUV (13 nm), and e-beam based technologies and it is not yet clear which approach will dominate in each of the future technology nodes. 2 In this context the research on new lithographic materials is also spread in quite a few directions and different classes of polymers are inves- tigated as main components of the future resist systems. In the case of 157-nm lithography, in particular, the problem of selecting polymers that can serve as the basis of the resist compositions is more severe due to the difficulty in finding organic materials with acceptable absorbance characteristics. 3-5 Partially fluorinated ma- terials are mostly considered as the resists of choice at this wavelength, due to the high transparency of the C-F bond. Nevertheless, nonoptimized so far imaging and etch resistance properties have been reported. 6-11 On the other hand, siloxanes and silsesquioxane polymers can offer an alternative route since Si-O bonds are also quite transparent at 157 nm. In addition, these materials can also be used as thin imaging layers in bilayer schemes that would relax to some degree the transparency demands. 12-14 Although undesirable chemi- * To whom correspondence should be addressed. Tel: +30210 6503114. Fax: +30210 6511723. E-mail: [email protected]. ² Institute of Microelectronics, NCSR “Demokritos”. ‡ Institut des Materiaux “Jean Rouxel”. (1) International Technology Roadmap for Semiconductors, http:// public.itrs.net. (2) Ronse, K. Microelectron. Eng. 2003, 67-68, 300. (3) Kunz, R. R.; Bloomstein, T. M.; Hardy, D. E.; Goodman, R. B.; Downs, D. K.; Curtin, J. E. Proc. SPIE 1999, 3678, 13. (4) Kishimura, S.; Katsuyama, A.; Sasago, M.; Shirai, M.; Tsunooka, M. Jpn. J. Appl. Phys. 1999, 38, 7103. (5) Yamazaki, T.; Itani, T. Jpn. J. Appl. Phys. 2002, 41, 4065. (6) Tran, H. V.; Hung, R. J.; Chiba, T.; Yamada, S.; Mrozek, T.; Hsieh, Y.; Chambers, C. R.; Osborn, B. P.; Trinque, B. C.; Pinnow, M. J.; MacDonald, S. A.; Willson, C. G.; Sanders, D. P.; Connor, E. F.; Grubbs, R. H.; Conley, W. Macromolecules 2002, 35, 6539. (7) Bae, Y. C.; Douki, K.; Yu, T.; Dai, J.; Schmaljohann, D.; Koerner, H.; Ober, C. K.; Conley, W. Chem. Mater. 2002, 14, 1306. (8) Trinque, B. C.; Chiba, T.; Hung, R. J.; Chambers, C. R.; Pinnow, M. J.; Osburn, B. P.; Tran, H. V.; Wunderlich, J.; Hsieh, Y.-T, Thomas, B. H.; Shafer, G.; DesMarteau, D. D.; Conley, W.; Willson, C. G. J. Vac. Sci. Technol. B 2002, 20, 531. (9) Toriumi, M.; Shida, N.; Yamazaki, T.; Watanabe, H.; Ishikawa, S.; Itani, T. Microelectron. Eng. 2002, 61-62, 717. (10) Itani, T.; Toriumi, M.; Naito, T.; Ishikawa, S.; Miyoshi, S.; Yamazaki, T.; Watanabe, M. J. Vac. Sci. Technol. B 2001, 19 (6), 2705. (11) Sanders, D. P.; Connor, E. F.; Grubbs, R. H.; Hung, R. J.; Osborn, B. P.; Chiba, T.; MacDonald, S. A.; Willson, C. G.; Conley, W. Macromolecules 2003, 36, 1534. (12) Lin, Q.; Katnani, A.; Brunner, T.; De Wan, C.; Fairchok, C.; LaTulipe, D.; Simons, J.; Petrillo, K.; Babich, K.; Seeger, D.; An- gelopoulos, M.; Sooriyakumaran, R.; Wallraff, G.; Hofer, D. Proc. SPIE 1998, 3333, 278. (13) Hatzakis, M.; Shaw, J.; Babich, E.; Paraszczak, J. J. Vac. Sci. Technol. B 1988, 6, 2224. 2567 Chem. Mater. 2004, 16, 2567-2577 10.1021/cm035089x CCC: $27.50 © 2004 American Chemical Society Published on Web 06/03/2004
-
Upload
demokritos -
Category
Documents
-
view
0 -
download
0
Transcript of Polyhedral Oligomeric Silsesquioxane (POSS) Based Resists: Material Design Challenges and...
Polyhedral Oligomeric Silsesquioxane (POSS) BasedResists: Material Design Challenges and Lithographic
Evaluation at 157 nm
Evangelia Tegou,† Vassilios Bellas,† Evangelos Gogolides,† Panagiotis Argitis,*,†
David Eon,‡ Gilles Cartry,‡ and Christophe Cardinaud‡
Institute of Microelectronics, NCSR “Demokritos”, 15310 Ag. Paraskevi, Athens, Greece, andLaboratoire des Plasmas et des Couches Minces, Institut des Materiaux “Jean Rouxel”,
BP 32229, 44322 Nantes, France
Received October 30, 2003. Revised Manuscript Received March 16, 2004
In this paper we describe the lithographic behavior and related material properties of anew class of chemically amplified, positive tone, silicon-containing methacrylate photoresistsincorporating the polyhedral oligomeric silsesquioxane (POSS) group as the etch-resistantcomponent. POSS-bearing monomers were copolymerized with methacrylic acid (MA), tert-butyl methacrylate (TBMA), tert-butyl trifluoro methacrylate (TBTFMA), itaconic anhydride(IA), and 2-(trifluoromethyl) acrylic acid (TFMA), in various compositions. A perfluorooc-tylsulfonate-based photoacid generator (PAG) was used to deprotect TBMA (or TBTFMA)to base soluble carboxylic acid by heating after exposure. XPS and angular XPS analysiswere used to examine possible surface segregation phenomena. It was proven that POSSsurface enrichment occurs for the POSS-TBMA copolymers while surface segregation maybe reduced if suitable additional resist components are selected. The POSS-based resistswere studied for 157-nm lithographic applications and found to have high sensitivity (<10mJ/cm2 under open field exposure), no silicon outgassing, and sub-100-nm resolutioncapabilities. Ninety nanometer patterns in 100-nm thick films were resolved. At present,their absorbance is high (∼4 µm-1) for single-layer lithographic applications at 157 nm;however, high etch resistance in oxygen plasma makes them suitable for bilayer schemes.
1. IntroductionThe research activity on new lithographic resist
materials capable of meeting the constantly increasingperformance demands posed by the International Tech-nology Roadmap for Semiconductors for the next decadehas greatly expanded during recent years.1 Currently,different lithographic approaches are investigated forthe fabrication of devices with sub-100-nm criticaldimensions, including 193 nm, 157 nm, EUV (13 nm),and e-beam based technologies and it is not yet clearwhich approach will dominate in each of the futuretechnology nodes.2 In this context the research on newlithographic materials is also spread in quite a fewdirections and different classes of polymers are inves-tigated as main components of the future resist systems.
In the case of 157-nm lithography, in particular, theproblem of selecting polymers that can serve as the basisof the resist compositions is more severe due to thedifficulty in finding organic materials with acceptableabsorbance characteristics.3-5 Partially fluorinated ma-terials are mostly considered as the resists of choice at
this wavelength, due to the high transparency of theC-F bond. Nevertheless, nonoptimized so far imagingand etch resistance properties have been reported.6-11
On the other hand, siloxanes and silsesquioxanepolymers can offer an alternative route since Si-Obonds are also quite transparent at 157 nm. In addition,these materials can also be used as thin imaging layersin bilayer schemes that would relax to some degree thetransparency demands.12-14 Although undesirable chemi-
* To whom correspondence should be addressed. Tel: +302106503114. Fax: +30210 6511723. E-mail: [email protected].
† Institute of Microelectronics, NCSR “Demokritos”.‡ Institut des Materiaux “Jean Rouxel”.(1) International Technology Roadmap for Semiconductors, http://
public.itrs.net.(2) Ronse, K. Microelectron. Eng. 2003, 67-68, 300.(3) Kunz, R. R.; Bloomstein, T. M.; Hardy, D. E.; Goodman, R. B.;
Downs, D. K.; Curtin, J. E. Proc. SPIE 1999, 3678, 13.
(4) Kishimura, S.; Katsuyama, A.; Sasago, M.; Shirai, M.; Tsunooka,M. Jpn. J. Appl. Phys. 1999, 38, 7103.
(5) Yamazaki, T.; Itani, T. Jpn. J. Appl. Phys. 2002, 41, 4065.(6) Tran, H. V.; Hung, R. J.; Chiba, T.; Yamada, S.; Mrozek, T.;
Hsieh, Y.; Chambers, C. R.; Osborn, B. P.; Trinque, B. C.; Pinnow, M.J.; MacDonald, S. A.; Willson, C. G.; Sanders, D. P.; Connor, E. F.;Grubbs, R. H.; Conley, W. Macromolecules 2002, 35, 6539.
(7) Bae, Y. C.; Douki, K.; Yu, T.; Dai, J.; Schmaljohann, D.; Koerner,H.; Ober, C. K.; Conley, W. Chem. Mater. 2002, 14, 1306.
(8) Trinque, B. C.; Chiba, T.; Hung, R. J.; Chambers, C. R.; Pinnow,M. J.; Osburn, B. P.; Tran, H. V.; Wunderlich, J.; Hsieh, Y.-T, Thomas,B. H.; Shafer, G.; DesMarteau, D. D.; Conley, W.; Willson, C. G. J.Vac. Sci. Technol. B 2002, 20, 531.
(9) Toriumi, M.; Shida, N.; Yamazaki, T.; Watanabe, H.; Ishikawa,S.; Itani, T. Microelectron. Eng. 2002, 61-62, 717.
(10) Itani, T.; Toriumi, M.; Naito, T.; Ishikawa, S.; Miyoshi, S.;Yamazaki, T.; Watanabe, M. J. Vac. Sci. Technol. B 2001, 19 (6), 2705.
(11) Sanders, D. P.; Connor, E. F.; Grubbs, R. H.; Hung, R. J.;Osborn, B. P.; Chiba, T.; MacDonald, S. A.; Willson, C. G.; Conley, W.Macromolecules 2003, 36, 1534.
(12) Lin, Q.; Katnani, A.; Brunner, T.; De Wan, C.; Fairchok, C.;LaTulipe, D.; Simons, J.; Petrillo, K.; Babich, K.; Seeger, D.; An-gelopoulos, M.; Sooriyakumaran, R.; Wallraff, G.; Hofer, D. Proc. SPIE1998, 3333, 278.
(13) Hatzakis, M.; Shaw, J.; Babich, E.; Paraszczak, J. J. Vac. Sci.Technol. B 1988, 6, 2224.
2567Chem. Mater. 2004, 16, 2567-2577
10.1021/cm035089x CCC: $27.50 © 2004 American Chemical SocietyPublished on Web 06/03/2004
cal routes leading to bond breaking and formation offragments (outgassing) that could cause problems withthe components of the optical systems have been well-recognized in Si-containing polymers, recent reportsshow that this issue is rather addressed by usingsiloxanes and silsesquioxanes as opposed to polymerswith Si-alkyl pendant groups.15,16 Finally, the develop-ment of suitable siloxane or silsesquioxane resists canbe of use not only for 157-nm lithography but also for193-nm, EUV, and probably other next generationlithographic regimes.17,18
In the above context, efforts have recently beenlaunched by our and other groups for examining arelated class of materials that contain polyhedral sils-esquioxane moieties (cages) and are provided also in theform of polymerizable acrylate monomers (Scheme1).19-22 Polyhedral oligomeric silsesquioxanes (POSS)represent a relatively new class of well-defined materi-als that consist of a silicon-based inorganic cage (Si8O12)surrounded by eight organic corner groups. POSS-containing molecules have recently received a consider-able amount of interest for applications in catalysis,modeling of silica surfaces and interfaces, as precursorsto silicates and as polymerizable reagents.23-25
Especially in the case of polymerization, POSS mono-mers are capable of imparting desirable properties tocommon classes of polymeric materials. In a typicalPOSS-polymer, represented by the formula P1R7Si8O12,a variety of inert substituents, R, can be attached atthe seven corner positions around the cage, while theremaining position is occupied by a reactive polymer-izable group, P. So far, the POSS molecules have beensuccessfully incorporated into styryls, acrylics, liquid-crystalline polyesters, siloxanes, polyamides, etc.
The cage type possesses a precisely defined structure(monodispersed silsesquioxane components) whereasour experience with ladder silsesquioxanes is that thecommercially available starting materials are unreliablebecause their actual molecular formulas are unknown.26
Moreover, cage structures are free from remainingsilanol bonds Si-OH that are common in commercialladder polymers and could cause condensation reactions,resulting in limited shelf life as well as negative tonechemistry.
In the present paper we report our group work on thecapabilities POSS monomers offer for high resolutionlithography. In the case of 157-nm lithography, the useof thin films has been employed in order to meet thelow absorbance criterion and achieve high-resolutionimaging.3,27 Incorporating the POSS cage as a pendantgroup in the traditionally used methacrylate platformpresents the advantage of enhanced etch resistance andthe possibility of employing the bilayer scheme. Never-theless, several requirements such as low absorbance,adhesion, controlled dissolution behavior, aqueous basedevelopment, and high-resolution imaging remain to besatisfied. The incorporation of an inert bulky hydropho-bic silicon group is likely to complicate resist design evenfurther as it impacts resist physicochemical properties.Furthermore, POSS polymers were reported to formself-assembled molecular aggregates.28,29 Therefore, theminimization of the aforementioned potential problems
(14) Hartney, M. A.; Hess, D. W.; Soane, D. S. J. Vac. Sci. Technol.B 1989, 7, 1.
(15) Hien, S.; Angood, S.; Asworth, D.; Basset, S.; Bloomstein, T.;Dean, K.; Kunz, R. R.; Miller, D.; Patel, S.; Rich, G. Proc. SPIE 2001,4345, 439.
(16) Lippert, T.; Dickinson, J. T. Chem. Rev. 2003, 103, 453.(17) Sooriyakumaran, R.; Fenzel-Alexander, D.; Fender, N.; Wall-
raff, G. M.; Allen, R. D. Proc. SPIE 2001, 4345, 319.(18) Hatakeyama, J.; Nakashima, M.; Kaneko, I.; Nagura, S.;
Ishihara, T. Proc. SPIE 1998, 3333, 62.(19) Wu, H.; Hu, Y.; Gonsalves, K. E.; Yakaman, M. J. J. Vac. Sci.
Technol. B 2001, 19, 851.(20) Azam, Ali M.; Gonsalves, K. E.; Golovkina, V.; Cerrina, F.
Microelectron. Eng. 2003, 65, 454.(21) Wu, H.; Gonsalves, K. E. Adv. Mater. 2001, 13, 670.(22) Bellas, V.; Tegou, E.; Raptis, I.; Gogolides, E.; Argitis, P.; Iatrou,
H.; Hadjichristidis, N.; Sarantopoulou, E.; Cefalas, A. C. J. Vac. Sci.Technol. B 2002, 20, 2902.
(23) Schwab, J. J.; Lichtenhan, J. D. Appl. Organomet. Chem. 1998,12, 707.
(24) Li, G.; Wang, L.; Ni, H.; Pittman, C. U. J. Inorg. Organomet.Polym. 2002, 11, 123.
(25) POSS Nanotechnology Conference, CA-USA, 2002.
(26) Unno, M.; Suto, A.; Matsumoto, H. J. Am. Chem. Soc. 2002,124, 1574.
(27) Rottstegge, J.; Herbst, W.; Hien, S.; Fuetterer, G.; Eschbaumer,C.; Hohle, C.; Schweider, J.; Sebald, M. Proc. SPIE 2002, 4690, 233.
Scheme 1
2568 Chem. Mater., Vol. 16, No. 13, 2004 Tegou et al.

toward the design of POSS materials suitable forlithographic applications presents a great challenge.
2. Experimental Section
2.1. Materials. POSS monomers were copolymerized withother monomers, such as methacrylic acid (MA), tert-butylmethacrylate (TBMA), tert-butyl trifluoro methyl acrylate(TBTFMA), itaconic anhydride (IA), and 2-(trifluoromethyl)acrylic acid (TFMA), in various compositions (Scheme 1). 1HNMR spectra were recorded on a Bruker 200-MHz instrumentwith CDCl3 as the solvent, at 25 °C. 13C NMR analysis ofpolymers was performed at room temperature in CDCl3 orDMF-d7, in an inverse-gated 1H-decoupled mode on a BrukerAF 250 (62.9 MHz) spectrometer. In all cases characteristicresonances were clearly present at δ ) 3.75 ppm (-CH2CH2-CH2-cage) and δ ) 0.6 ppm (methylene protons adjacent tothe POSS cage). Since the polymerizations were carried to nearcompletion (>90% yields), the ratios of the starting monomersin the copolymers are similar to the feed ratios and composi-tional homogeneity is expected.30-32 Note that the electron-deficient monomers IA, TFMA, and TBTFMA do not undergohomopolymerization under conventional (AIBN-initiated) radi-cal conditions.33,34 They were copolymerized with electron-acceptor monomers such as TBMA, forming random copoly-mers.
In a typical experiment 0.01 g of AIBN and 10 g of themonomers were dissolved in 30 g of dry oxygen-free tetrahy-drofuran (THF). The reaction mixture was then placed in anoil bath (70 °C) for 48 h. Each polymer was isolated afterprecipitation in methanol. The precipitant was dissolved inTHF, and the procedure was repeated twice. Finally, thecopolymers were dried under vacuum (50 °C) for 2 days. Gel-permeation chromatography (GPC) analyses were carried outon a Waters Breeze1515 series liquid chromatograph with adifferential refractometer (Waters 2410) as a detector.
2.2. Physicochemical Characterization. Absorption spec-tra in the VUV were recorded with a J.A. Woollam VUVvariable angle spectroscopic ellipsometer (VASE) VU301 and/or a SOPRA GES5-PUV spectroscopic ellipsometers. Modu-lated differential scanning calorimetry (MDSC) measurementswere carried out with a DSC 2920 (TA Instruments) at aheating rate of 10 °C/min. The surface hydrophobicity wasestimated by the contact angle formed by a deionized water(Millipore Milli-Qplus) droplet placed on the film surface, usingDigidrop DGW-EWS equipment. A Perkin-Elmer ParagonIdentity Check FT-NIR spectrophotometer equipped with adeuterated diglycerine sulfate detector was used to collect FT-IR spectra with resolution of 4 cm-1 at 64 scans. Samples wereprepared on single-polished silicon substrates. The FT-IRmeasurements were made in transmittance mode both for thin(150 nm) and thicker (0.5-1 µm) films. The surface chemicalstructure of POSS copolymers has been analyzed by X-rayphotoelectron spectroscopy (XPS). The Axis Ultra analyzerfrom Kratos analytical was used with spectral resolution ofabout 0.4 eV (fwhm).
2.3. Lithographic Processing. Solutions (4-6% w/w) ofall polymers were prepared with either methyl isobutyl ketone(MIBK) or propylene glycol methyl ether (PGME). The pho-toacid generator (PAG) used in resist formulations was triph-
enylsulfonium perfluorooctylsulfonate. Dissolution was moni-tored by an in-house-constructed DRM setup equipped with alaser emitting at a wavelength of 650 nm (angle of incidencea ∼ 5°).35 For low resolution near UV and deep UV exposures,a Hg-Xe lamp was used, equipped with the appropriate filters;157-nm exposures were performed at International Sematech(Austin, TX) on an Exitech microstepper (NA ) 0.6, σ ) 0.3)using alternating phase-shift masks.
2.4. Oxygen Plasma Etching Studies. Thin films (typicalthickness: 150 nm) of POSS copolymers were spin-cast on topof 350-nm-thick hard baked novolac. Etch resistance studiesof the films were performed in an inductively coupled plasma(ICP) etcher (MET) from Alcatel (composed of a cylindricalalumina source and a diffusion chamber). The temperature ofthe sample was controlled at 15 °C by mechanical clampingand helium backside cooling. The etching conditions were asfollows: oxygen plasma (100 sccm, 10 mTorr), source power(600 W), and bias voltage (-100 V). For comparison purposesetch resistance studies were also performed in a reactor witha similar source in Nantes. The temperature was controlledat 15 °C by using a cryostat (HUBERT unistat 385) and heliumcirculation. The samples were etched under 10 mTorr, 800 W,and -100 V (flow rate: 40 sccm). In both systems etching rateswere monitored in situ with laser interferometry and real-timespectroscopic ellipsometry (Woolam M88 system). Surfaceroughness was measured before and after etching in contactmode, with a Topometrics TMX 2000 atomic force microscope(AFM). The total etching time for the surface roughnessmeasurements was equal to the etch time for the novolac endpoint plus 20% overetching. The total time of etching for etchrate and selectivity measurements (novolac underlayer/resist)was as high as 900% overetching.
3. Results and Discussion
3.1. Material Properties. 3.1.1. Physical Propertiesof POSS Copolymers. Our motivation is to synthesize aphotoresist polymer containing polyhedral silsesquiox-anes. The monomers used are shown in Scheme 1. Inthis section we describe the various polymers synthe-sized and their physical properties. Each monomeremployed in the acrylate platform serves a specificreason. Methacryloxy propyl POSS is used as the etchbarrier imparting the required etch resistance. TBMAor TBTFMA plays the role of the protecting group whichundergoes the acid-catalyzed deprotection reaction (seesection 3.2.1) while hydrophilic groups such as MA orIA provide good adhesion to the substrate and increasethe aqueous base solubility (dissolution promoters). Thesolubility of these monomers in common organic sol-vents (MIBK, PGME) ensures a facile spin coating,providing regular and planar surfaces.
To study the effect of the alkyl substituents on thePOSS cage, we designed a methacrylate platform witheither cyclopentyl-POSS (cp-POSS) or ethyl-POSS (e-POSS) as the pendant groups. On the basis of transpar-ency, compatibility with the polymer matrix, etchresistance, surface roughness after plasma treatment,and development issues, we chose to explore further thee-POSS platforms (see section 3.2.2 and ref 22). Theabsorbance coefficient values of the e- and cp-POSScontaining methacrylate homopolymers at 157 nm weredetermined to be 3.1 and 7.6 µm-1, respectively (Table1). For the present e-POSS based copolymer composi-tions the absorbance is considerably high for single-layerlithographic applications; that is, the imaged copolymers
(28) Waddon, A. J.; Zheng, L.; Farris, R. J, Coughlin, E. B. NanoLett. 2002, 2, 1149.
(29) Zheng, L.; Waddon, A. J.; Farris, R. J.; Coughlin, B. E.Macromolecules 2002 35, 2375.
(30) Mormann, W.; Ferbitz, J. Eur. Polym, J. 2003, 39, 489.(31) Haddad, T. S.; Lichtenhan, J. D. Macromolecules 1996, 29,
7302.(32) Ferbitz, J.; Mormann, W. Macromol. Chem. Phys. 2003, 204,
577.(33) Aglietto, M.; Passaglia, E.; Dimirabello, L. M.; Botteghi, C.;
Paganelli, S.; Matteoli, U.; Menchi, G. Macromol. Chem. Phys. 1995,196, 2843.
(34) Ito, H.; Walraff, G. M.; Fender, N.; Brock, P. J.; Hinsberg, W.D.; Mohorowala, A.; Larson, C. E.; Truong, H. D.; Breyta, G.; Allen, R.D. J. Vac. Sci. Technol. B 2001, 19, 2678.
(35) Raptis, I.; Velessiotis, D.; Vasilopoulou, M.; Argitis, P. Micro-electron. Eng. 2000, 53, 489.
POSS-Based Resists Chem. Mater., Vol. 16, No. 13, 2004 2569

have absorbance values in the range 4.5-5.5 µm-1.Nevertheless, the absorbance value can be decreased to4.0 µm-1 by 30% fluorination.
The glass transition temperature (Tg) of the resistformulations containing polyhedral silsesquioxanesranges from 110 to 160 °C for the materials tested(Table 1). Increase of the polyhedral silsesquioxanecomponent increases the Tg of the material.
Copolymers with optimized monomer compositionwere used for the formulation of a series of resistformulations, namely, AC-POSS resists (ACrylate POSS,see Table 1), which showed limited outgassing. The testmethods applied to evaluate the outgassing probabilitywere the film thickness loss test and the CaF2 proof-plate test.36 For exposure doses up to ∼30 mJ/cm2,<2.5-nm loss occurred, while no silicon was detected ona CaF2 proof-plate as was verified by XPS analysis forall AC-POSS resists.
All synthesized e-POSS copolymers are hydrophobic,independently of the POSS content. The water contactangle was measured to be in the range from 90° to 101°for POSS contents 20-100% w/w (Table 1). In addition,no significant difference in the contact angle wasmeasured after the TBMA deprotection.
3.1.2. XPS Analysis of POSS Copolymer-Based Films.3.1.2.1. Motivation. Some of the resist formulationsbased on e-POSS (C28H46O14Si8) containing copolymershave presented unusually inhomogeneous wet develop-ment. For these specific resist formulations, the dis-solution rate is not constant: faster dissolution takesplace initially while, as film thickness decreases, slowerdissolution appears. In some materials, a pronounceddelay step is also present during the last period ofoscillation of the DRM signal. Typical DRM signals oftwo POSS copolymer-based resists with optimized (sig-nal A) and nonoptimized (signal B) development pro-cesses are shown in Figure 1. Signal B is a represen-tativesignalofaresistmaterialshowingtheaforementionedproblems. We suspected that development problemscould be due to surface segregation (similar to what hasbeen observed for random fluorine-containing copoly-mers37) or even self-organization phenomena.27,28 Toclarify whether surface segregation was present, weused XPS analysis.38
3.1.2.2. XPS Results. XPS analysis gives the surfacechemical composition (XPS is a surface analysis tech-nique and the maximum depth probed is about 10 nm).If POSS cages reside preferentially on the surface, thesurface chemical composition measured by XPS shouldbe different from the bulk chemical composition.
Carbon (C 1s), oxygen (O 1s), and silicon (Si 2p) XPSpeaks have been recorded and analyzed. The wholesurface of each of the three peaks has been employedto calculate the relative surface atomic percentages(carbon, oxygen, and silicon). The carbon peak decon-volution has been used to quantify the Si-C bondpercentage and the oxygen peak deconvolution has beenused to determine the Si-O bond percentage in thematerial. The CdO bond is well-resolved by the XPSanalyzer and its measured percentage can be easilydetermined from the C 1s peak. If POSS groups residepreferentially on the surface, XPS analysis shouldindicate a higher percentage of Si-C and Si-O bondthan expected from the chemical structure of thecopolymer without surface segregation. Si atomic per-centage should also be higher than expected. Further-more, the CdO bond should decrease in percentage.
Table 2 presents XPS results for different copolymers.Differences between measured percentages (“meas”) andexpected ones (“th”), divided by expected ones, are givenin percent (100 × [%meas - %th]/%th). Such a representa-
(36) Hien, S.; Angood, S.; Ashworth, D.; Basset, S.; Bloomstein, T.;Dean, K.; Kunz, R. R.; Miler, D.; Patel, S.; Rich, G. Proc. SPIE 2001,4345, 439.
(37) Baradie, B.; Shoichet, M. S. Macromolecules 2003, 36 (7), 2343.(38) Eon, D.; Cartry, G.; Fernandez, V.; Cardinaud, C.; Tegou, E.;
Bellas,V.; Argitis, P.; Gogolides, E., submitted to J. Vac. Sci. Technol.B.
Table 1. Physical Properties of Synthesized POSS-Containing Copolymers
copolymer composition (% w/w)a (µm-1)@157 nm
a (µm-1)@193 nm
Tg(°C)
contact angle(deg)
20 cp-POSS/80 TBMA 114 92100 cp-POSS 7.6 4.55 350 11620 e-POSS/80 TBMA 4.4 0.14 114 10140 e-POSS/60 TBMA 4.0 0.42 145 10060 e-POSS/40 TBMA 3.5 0.99 10130 e-POSS/40 TBMA/20 MA/10 IAa (resist AC-POSS-2-69) 5.2 0.67 142 9630 e-POSS/40 TBMA/10 MA/20 IAa (resist AC-POSS-2-71) 5.6 0.85 9140 e-POSS/40 TBMA/20 MAa 5.0 0.65 15330 e-POSS/50 TBMA/20 MA 4.9 0.20 147 9030 e-POSS/60 TBMA/10 MA 4.8 0.14 123100 e-POSS 3.1 0.17 251 10130 e-POSS/40 TBMA/30 TFMAa (resist AC-POSS-2-83) 4.0 132 94100 TBMA 6.5 100 86
a These materials were loaded with 5% w/w PAG.
Figure 1. Typical DRM signals of two POSS-based resistswith optimized (signal A, AC-POSS-2-71) and nonoptimized(signal B, AC-POSS-2-69) development processes.
2570 Chem. Mater., Vol. 16, No. 13, 2004 Tegou et al.
tion gives the relative importance of the surface segre-gation phenomena for the different copolymers. If nosurface segregation is present, the surface compositionobtained by XPS should be equal to the bulk composi-tion. High positive values for Si, C-Si, and O-Sitogether with a high negative value for CdO denotestrong surface segregation phenomena. For purposes ofcompleteness, the values in parentheses also provide theabsolute differences (%meas - %th).
The second column of the table presents measure-ments for the e-POSS homopolymer. No strong surfacesegregation is expected since in this case the polymercontains only POSS moieties. Therefore, all differencesin the second column should be zero. Clearly, thesedifferences do not exceed 10% (except for CdO bondpercentage, 17.5%). Moreover, a positive value for theSi percentage together with negative values for C-Siand O-Si bond percentages are observed. Surfacesegregation should lead to positive values for Si per-centage as well as for C-Si and O-Si bond percentages.Hence, results for the e-POSS homopolymer do notevidence strong surface segregation phenomena. Fur-thermore, the intense deviation of the CdO bond tonegative values (-17.5%) is attributed to the orientationof the cage group to the film surface and the consequentencryption of the CdO bond from the free surface. Onthe contrary, for POSS-containing copolymers, XPS
measurements point out surface segregation of POSSgroups. For instance, for those consisting of 20% w/we-POSS and 80% w/w TBMA (column 5 in Table II), theincrease of the silicon content with respect to a materialwithout surface segregation is about 200%, and theC-Si and O-Si bond percentages exceed the expectedones by more than 150%. The CdO bond presents adecrease of about 35%. Therefore, this material, as wellas other POSS-containing copolymers, shows strongsurface segregation effects. Moreover, for the membersof the homologous series of POSS-TBMA copolymers,surface segregation phenomena increase with decreas-ing POSS percentage (columns 2-5). Incorporation ofan additional hydrophilic monomer (whether MA, IA,or TFMA) seems to slightly decrease surface segrega-tion. Actually, a 30% POSS containing polymer with atleast three monomers (i.e., columns 6-8) presentssuppressed surface segregation phenomena comparedto the 40% POSS containing copolymer (column 4).
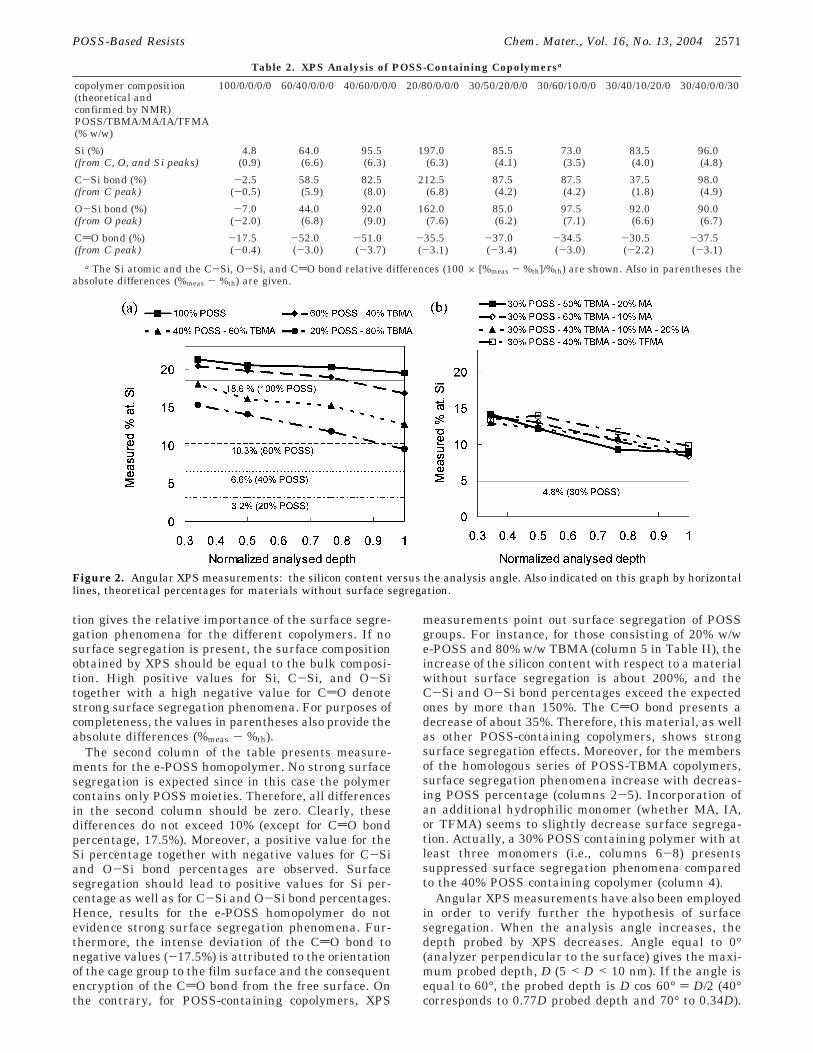
Angular XPS measurements have also been employedin order to verify further the hypothesis of surfacesegregation. When the analysis angle increases, thedepth probed by XPS decreases. Angle equal to 0°(analyzer perpendicular to the surface) gives the maxi-mum probed depth, D (5 < D < 10 nm). If the angle isequal to 60°, the probed depth is D cos 60° ) D/2 (40°corresponds to 0.77D probed depth and 70° to 0.34D).
Table 2. XPS Analysis of POSS-Containing Copolymersa
copolymer composition(theoretical andconfirmed by NMR)POSS/TBMA/MA/IA/TFMA(% w/w)
100/0/0/0/0 60/40/0/0/0 40/60/0/0/0 20/80/0/0/0 30/50/20/0/0 30/60/10/0/0 30/40/10/20/0 30/40/0/0/30
Si (%) 4.8 64.0 95.5 197.0 85.5 73.0 83.5 96.0(from C, O, and Si peaks) (0.9) (6.6) (6.3) (6.3) (4.1) (3.5) (4.0) (4.8)
C-Si bond (%) -2.5 58.5 82.5 212.5 87.5 87.5 37.5 98.0(from C peak) (-0.5) (5.9) (8.0) (6.8) (4.2) (4.2) (1.8) (4.9)
O-Si bond (%) -7.0 44.0 92.0 162.0 85.0 97.5 92.0 90.0(from O peak) (-2.0) (6.8) (9.0) (7.6) (6.2) (7.1) (6.6) (6.7)
CdO bond (%) -17.5 -52.0 -51.0 -35.5 -37.0 -34.5 -30.5 -37.5(from C peak) (-0.4) (-3.0) (-3.7) (-3.1) (-3.4) (-3.0) (-2.2) (-3.1)
a The Si atomic and the C-Si, O-Si, and CdO bond relative differences (100 × [%meas - %th]/%th) are shown. Also in parentheses theabsolute differences (%meas - %th) are given.
Figure 2. Angular XPS measurements: the silicon content versus the analysis angle. Also indicated on this graph by horizontallines, theoretical percentages for materials without surface segregation.
POSS-Based Resists Chem. Mater., Vol. 16, No. 13, 2004 2571
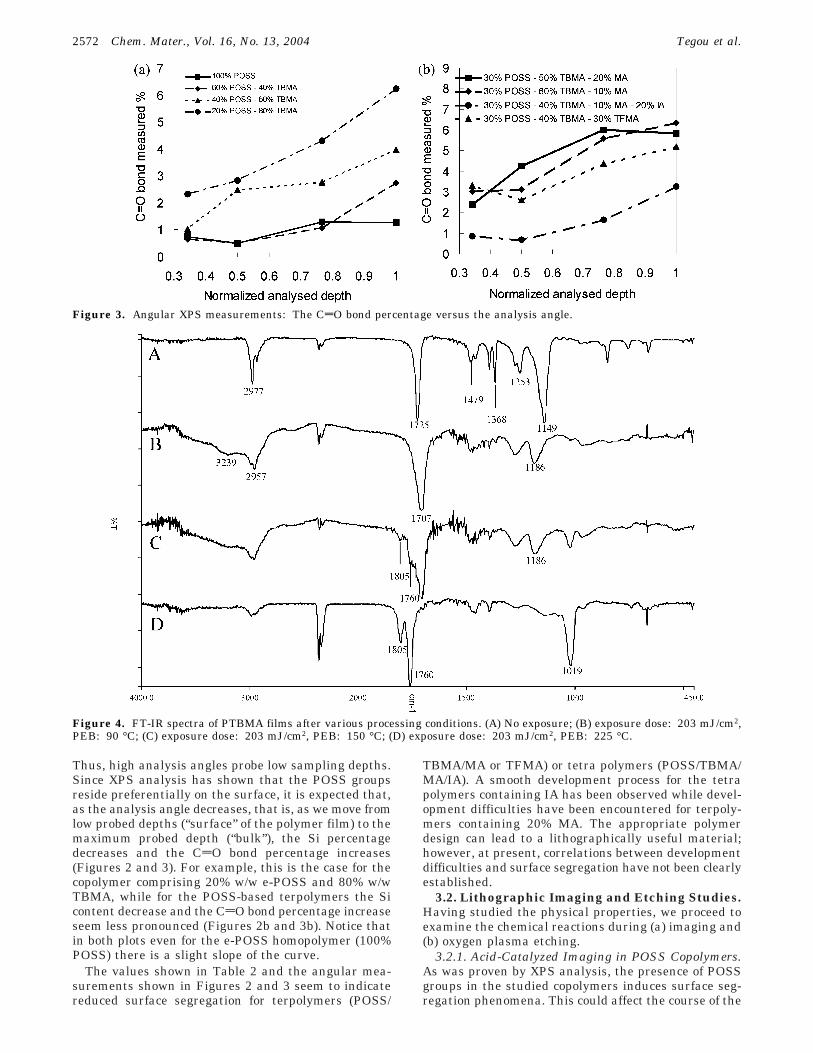
Thus, high analysis angles probe low sampling depths.Since XPS analysis has shown that the POSS groupsreside preferentially on the surface, it is expected that,as the analysis angle decreases, that is, as we move fromlow probed depths (“surface” of the polymer film) to themaximum probed depth (“bulk”), the Si percentagedecreases and the CdO bond percentage increases(Figures 2 and 3). For example, this is the case for thecopolymer comprising 20% w/w e-POSS and 80% w/wTBMA, while for the POSS-based terpolymers the Sicontent decrease and the CdO bond percentage increaseseem less pronounced (Figures 2b and 3b). Notice thatin both plots even for the e-POSS homopolymer (100%POSS) there is a slight slope of the curve.
The values shown in Table 2 and the angular mea-surements shown in Figures 2 and 3 seem to indicatereduced surface segregation for terpolymers (POSS/
TBMA/MA or TFMA) or tetra polymers (POSS/TBMA/MA/IA). A smooth development process for the tetrapolymers containing IA has been observed while devel-opment difficulties have been encountered for terpoly-mers containing 20% MA. The appropriate polymerdesign can lead to a lithographically useful material;however, at present, correlations between developmentdifficulties and surface segregation have not been clearlyestablished.
3.2. Lithographic Imaging and Etching Studies.Having studied the physical properties, we proceed toexamine the chemical reactions during (a) imaging and(b) oxygen plasma etching.
3.2.1. Acid-Catalyzed Imaging in POSS Copolymers.As was proven by XPS analysis, the presence of POSSgroups in the studied copolymers induces surface seg-regation phenomena. This could affect the course of the
Figure 3. Angular XPS measurements: The CdO bond percentage versus the analysis angle.
Figure 4. FT-IR spectra of PTBMA films after various processing conditions. (A) No exposure; (B) exposure dose: 203 mJ/cm2,PEB: 90 °C; (C) exposure dose: 203 mJ/cm2, PEB: 150 °C; (D) exposure dose: 203 mJ/cm2, PEB: 225 °C.
2572 Chem. Mater., Vol. 16, No. 13, 2004 Tegou et al.

photogenerated acid-induced deprotection reaction thattakes place after the PEB step. For monitoring thedeprotection reaction in POSS containing copolymers,FT-IR spectra were recorded. Pure PTBMA was usedas a reference. Both materials were loaded with photoacid generators (5% w/w triphenylsulfonium perfluo-rooctylsulfonate for the POSS containing copolymer and10% w/w triphenylsulfonium hexafluoroantimonate forPTBMA). Processing conditions inducing similar orstronger chemical effects were chosen for PTBMA toensure an accurate peak determination.
First, the reference material spectra are studied. InFigure 4 the spectra of PTBMA for bake conditionssimilar to the ones used for POSS containing copolymersare shown. In spectra B, C, and D extremely highexposure dose (203 mJ/cm2) was used. Spectrum A
corresponds to a PTBMA film after the prebake step(150 °C, 2 min). The peak at 1725 cm-1 is assigned tothe CdO bond of the ester group. In spectrum B theester group has undergone the deprotection reaction,producing the corresponding carboxylic acid (product Iin Scheme 2). Thus, the CdO peak has moved to 1707cm-1. Notice also the broad peak at approximately 3200cm-1 attributed to the O-H stretch vibration of the acid.In spectrum C the PEB temperature is higher thanspectrum B. As is evident in the spectrum, the depro-tection reaction proceeds to the formation of the car-boxylic acid as the main product while anhydrides(peaks at 1760 and 1805 cm-1) start to form in an inter-or an intramolecular fashion (Scheme 2). Finally, spec-trum D corresponding to the highest PEB temperature(225 °C) shows a complete disappearance of the CdO
Scheme 2
Figure 5. FT-IR spectra of AC-POSS-2-69 (see Table 1) resist film after various processing conditions. (A) No exposure; (B)exposure dose: 1 mJ/cm2, PEB: 160 °C; (C) exposure dose: 23 mJ/cm2, PEB: 160 °C.
POSS-Based Resists Chem. Mater., Vol. 16, No. 13, 2004 2573
of the corresponding carboxylic acid and a 100% anhy-dride formation. Attempts to dissolve this film provethat the anhydride-containing product is significantlyless soluble to the standard tetramethyl ammoniumhydroxide (TMAH) 0.26 N solution.
Second, the FT-IR spectra for the POSS containingfilms after various processing conditions are presentedin Figure 5. The copolymer used in AC-POSS-2-69 (seeTable 1) resist formulation was comprised of e-POSS,TBMA, MA, and IA. The obtained spectra, even afterthe prebake step (160 °C, 2 min), are more complicatedthan the PTBMA spectra due to the initial presence ofthree different types of CdO stretch vibrations. Forexample, in spectrum A (Figure 5) the TBMA CdO peakappears at 1724 cm-1 and the MA CdO appears as abroadening of the ester peak to smaller wavelengthswhile the IA CdO can be identified by the twin peaksat 1782 and 1860 cm-1. Spectrum B shows the samematerial after exposure and bake. The dose was 1 mJ/cm2, corresponding to the lithographic useful dose. Thespectrum shows a decrease of the ester CdO peak at1723 cm-1, while the carboxylic acid CdO peak, pro-duced at 1708 cm-1 after the tert-butyl ester deprotec-tion, appears, similar to spectrum B in Figure 4 (productI in Scheme 2). For the longer exposure time (23 mJ/cm2, spectrum C) two new bands at 1806 and 1764 cm-1
attributed to the formed anhydride bonds by neighbor-ing acid functionalities appear (products II and III inScheme 2). DRM results prove that the dissolution rateof the highly exposed AC-POSS film (spectrum C) issignificantly lower than the rate of the film exposed withthe lithographically useful dose (spectrum B).
FT-IR spectroscopy is an effective tool in monitoringthe chemical reactions during acid-catalyzed imaging.Carboxylic acid is formed for lithographically usefuldoses in POSS containing films during the ester depro-tection. In a more detailed examination of spectra C inFigures 4 and 5, we notice that, in POSS containingfilms, the carboxylic acid CdO peak (1708 cm-1) hasweakened significantly while the anhydride peaks (1764and 1806 cm-1) are well-resolved. It seems that, forsimilar bake temperatures, the deprotection reactionproceeds to anhydride formation in POSS containingfilms to a higher extent than in the case of PTBMAfilms, even though for the POSS material the exposuredose was almost 10 times lower than that for PTBMA.It is suggested that the POSS cages in the resist matrix
favor the neighboring of the deprotected -COOH groupsand, thus, the intra- or intermolecular anhydride forma-tion at milder baking conditions. However, no negativetone behavior has been observed for doses up to 30 mJ/cm2 (see section 3.3)
3.2.2 Etching of POSS Copolymers in an OxygenPlasma. Cyclopentyl-substituted POSS containing co-polymers show less etch resistance and higher surfaceroughness compared to ethyl-substituted copolymers. Atonly 20% overetching the surface roughness of the cp-POSS was ∼15 nm (rms value) while, on the contrary,e-POSS films showed only ∼0.3-nm surface roughness.This signifies that e-POSS films are appropriate forhigh-resolution imaging where small roughness is nec-essary. The reason for this difference might lie in theinherent POSS morphology: it is possible that duringetching cp-POSS is stripped by the surrounding organiccyclopentyl groups and, thus, the larger distance be-tween the cp-POSS units compared to the e-POSS unitsprevents the formation of a smooth oxide surface.
The etching of e-POSS copolymers containing variouscontents of e-POSS monomer, and hence various siliconcontents, was studied with in situ spectroscopic ellip-sometry and laser interferometry. A series of POSScopolymers containing 20% to 100% w/w e-POSS wasetched and compared with poly methyl silsesquioxane(PMSQ) and cross-linked poly dimethyl siloxane (PDMS).Polymers containing 30% or higher w/w (i.e., 9% Sicontent) e-POSS cages provide the necessary etchresistance as well as low surface roughness to oxygenplasma etching at 100-nm film thickness.22 In addi-tion, the etch resistance of the fluorinated polymer(30% w/w e-POSS) is adequate and similar or evenbetter to the etch resistance of the nonfluorinatedpolymer.39,40
The thickness loss is a strong function of the POSScontent and decreases as the POSS content increasesas shown in Figure 6. At each etching time we observea linear relation between the lost thickness and theinverse of silicon content in the material. In addition,all polymers exhibit a very fast initial thickness loss(large etching rate), followed by a much slower etching
(39) Gogolides, E.; Argitis, P.; Tegou, E.; Bellas, V. InternationalPatent Application PCT/GR03/0018/2003-02472.
(40) Tegou, E.; Bellas, V.; Gogolides, E.; Argitis, P.; Dean, K.; Eon,D.; Cartry, G.; Cardinaud, C. Proc. SPIE 2003, 5039, 453.
Figure 6. Thickness loss versus 1/silicon content, after various etching times in ICP oxygen plasma with 0 V bias. Comparisonwith poly dimethyl siloxane (PDMS) and poly methyl silsesquioxane (PMSQ).
2574 Chem. Mater., Vol. 16, No. 13, 2004 Tegou et al.

rate. Although for PMSQ, PDMS, and 100% e-POSS theetching rate seems to stabilize to constant values, forsmaller POSS contents the etching rate is higher andconstantly decreases. The first fast thickness loss isattributed to etching of the organic groups from the filmsurface, while the subsequent etching rate reduction isattributed to oxide sputtering and the densification toform an oxide. A similar mechanism has been proposedfor PDMS; however, more studies are necessary todetermine the surface oxide layer thickness for POSSmaterials.41
FT-IR spectroscopy has been used for detecting theformation of the SiOx layer during the oxygen plasmaetching. Figure 7 shows the FT-IR spectra of a copoly-mer (components: POSS, TBMA, MA, IA) before etching(spectrum A) and after 150 s of etching (spectrum B).The following peaks exist in spectrum A and becomesignificantly weak after oxygen-plasma treatment (spec-trum B): 2970 cm-1, attributed to C-H stretching; 1454and 1371 cm-1 to C-H bending; 1734 cm-1 to CdOstretching; 1156 cm-1 to C-O stretching. On the otherhand, peaks that become predominant in spectrum Bare the peaks corresponding to the silicon-containingpart of the copolymer, that is, at 1112 cm-1 correspond-ing to Si-O-Si asymmetrical stretch, the peak at 805cm-1 assigned to Si-O-Si bending, and the peak at 450cm-1 assigned to Si-O-Si wagging.42 The slight shift(∼6 cm-1) of the Si-O-Si stretching peak to lowerwavelengths as well as the shoulder band around 1138-
1249 cm-1 suggests the transformation of the cagestructure to a network structure.43 The wide bandsbetween 3100 and 3700 cm-1 (O-H stretching) and857-993 cm-1 (O-H out-of-plane deformation) as wellas the peak at 1266 cm-1 (O-H bending; also Si-Cstretching) could be attributed to vibration modes of Si-OH or/and some adsorbed moisture.44 These data pointto a strong oxidation of the POSS layer and formationof an oxide-like surface. Notice that C-H, CdO, andSi-C bonds still exist to a certain extent after oxygenplasma since oxide resides only on the surface, althoughSi-C could be present due to residues of organicfragments. These results have also been confirmed byXPS analysis.
3.3. Lithographic Evaluation. As for other acrylate-based systems, typical lithographic properties, that is,development behavior, developer strength, and imagingcapabilities, depend strongly not only on the particularmolecular structure of the POSS moieties but also onthe copolymer composition. AC-POSS resists (see Table1) show homogeneous development and provide materi-als with good film-forming properties, and high sensitiv-ity at 157 nm (1-10 mJ/cm2 under open field exposure).Positive tone imaging at 157 nm was obtained. Negativetone behavior has not been observed even at high doses(doses up to 10 times higher than the clearing dose havebeen examined). At present, due to the incorporation ofMA in the copolymer formula, low-strength developersare necessary.
(41) Tserepi, A.; Cordoyiannis, G.; Patsis, G. P.; Constantoudis, V.;Gogolides, E.; Valamontes, E. S.; Eon, D.; Peignon, M. C.; Cartry, G.;Cardinaud, C.; Turban, G. J. Vac. Sci. Technol. B 2003, 21, 174.
(42) Zhu, H.; Ma, Y.; Fan, Y.; Shen, J. Thin Solid Films 2001, 397,95.
(43) Liu, W.-C.; Yang, C.-C.; Chen, W.-C.; Dai, B.-T.; Tsai, M.-S. J.Non-Cryst. Solids 2002, 311, 233.
(44) Mor, Y. S.; Chang, T. C.; Liu, P. T.; Tsai, T. M.; Chen, C. W.;Yan, S. T.; Chu C. J.; Wu, W. F.; Pan, F. M.; Lur, W.; Sze, S. M. J.Vac. Sci. Technol. B 2002, 20, 1334.
Figure 7. (A) Copolymer consisting of e-POSS, TBMA, MA, and IA before plasma etching (film thickness: 147 nm on 350-nmhard baked novolac); (B) copolymer consisting of e-POSS, TBMA, MA, and IA after 150 s of oxygen plasma etching (filmthickness: 70 nm). In both spectra the novolac spectrum has been subtracted.
POSS-Based Resists Chem. Mater., Vol. 16, No. 13, 2004 2575
157-nm evaluation of the POSS containing copolymerswas carried out at Resist Test Center at InternationalSematech. Phase shift masks were used for high-resolution experiments. Four AC-POSS resists wereevaluated, namely, AC-POSS-2-69, AC-POSS-2-71,AC-POSS-2-83 (see Table 1), and AC-POSS-2-106(composition: 40% w/w e-POSS, 40% w/w TBTFMA, and20% w/w MA). For all resist formulas PAG content was5% w/w. The films evaluated were approximately 100-nm thick. Prebake and PEB temperature varied be-tween 120 and 160 °C. Diluted developer solutions (MFCD 26, Shipley) were used for all resists, usually 100:1H2O/MF CD 26% v/v or more dilute. In most experi-
ments the development conditions (developer concentra-tion and time) were nonoptimized.
In Figure 8a the contrast curves of the AC-POSS-2-71 resist for two different PEB temperatures arepresented. Upon comparison of the two figures, wenotice the effect of PEB temperature on resist litho-graphic performance. At high PEB temperatures (160°C), the resist contrast is improved and the swelling isreduced (notice that at 120 °C the normalized thick-ness is higher than 1.0). For unexposed film areas orfor areas that have received very low doses, 160 °CPEB temperature has the same effect as a prolongedPB step (see also data in ref 40). Swelling is also affectedby the development conditions (Figure 8b). For strongdevelopment conditions (developer dilution 1:10), swell-ing takes place while, for more optimized developmentconditions (developer dilution 1:100), no swelling isobserved.
However, for the fluorinated resist AC-POSS-2-83,as shown in Figure 9, no effect of PEB temperature onswelling or on contrast was observed, presumably dueto the inherent morphology of the sample. The improvedcontrast as well as the high sensitivity are attributedto the constructive partnership between POSS cagesand fluorinated components. To our knowledge, POSScage compatibility with the fluorine-containing groupsis demonstrated for the first time.
Lithographic evaluation is shown in Figure 10 forAC-POSS-2-69 and AC-POSS-2-71 and in Figure 11for the fluorinated resists. For high-resolution exposuresalternating phase shift masks were used. The results
Figure 8. Contrast curves of resist AC-POSS-71. (a) Effect of PEB temperature on swelling (developer dilution 1:10, PB: 160°C). (b) Effect of development conditions on swelling (PEB: 160 °C).
Figure 9. Contrast curves of resist AC-POSS-2-83 showingthe effect of PEB temperature on resist’s sensitivity (developerdilution 1:150, prebake: 120 °C).
Figure 10. (a) Resist AC-POSS-2-69 showing resolution: 100 nm, l/s 1:1.5 (dose: 27.5 mJ/cm2). (b) Resist AC-POSS-2-71,resolution: 100 nm, l/s 1:2 (dose: 9.0 mJ/cm2).
2576 Chem. Mater., Vol. 16, No. 13, 2004 Tegou et al.

show the potential of the platform, although furtheroptimization is necessary. On the other hand, firstpattern transfer attempts have shown the feasibility ofPOSS-based copolymers as bilayer resists (Figure 11c).
4. Conclusions
Copolymers bearing polyhedral oligomeric silsesqui-oxane (POSS) pendant groups with optimized monomercomposition provide materials with good film-formingproperties and high sensitivity at 157 nm (1-10 mJ/cm2 under open field exposure). Selection of suitablemonomers and optimized ratios are necessary for theavoidance of undesirable segregation phenomena. Pro-cess studies reveal a strong influence of thermal pro-cessing conditions and development concentrations onswelling of unexposed and underexposed resist areas.High-resolution patterning under these conditions has
shown potential for sub-100-nm lithography. Partialfluorination can improve substantially absorbance prop-erties as well as the lithography contrast at 157 nm,with no degradation of film physicochemical propertiesand related lithographic performance. On the otherhand, pattern transfer studies have shown that 100-nm-thick films of POSS-containing materials providethe necessary oxygen plasma resistance for use asbilayer resists.
Acknowledgment. This work has been funded bythe European Union IST-30143 Project 157-CRISPIES.Kim Dean and Sashi Patel from International Sematechare kindly acknowledged for 157-nm exposures. SOPRASA is kindly acknowledged for some of the absorbancemeasurements at 157 nm.
CM035089X
Figure 11. (a) Resist AC-POSS-2-83 showing resolution: 100 nm, l/s 1:1 (dose: 25.0 mJ/cm2). (b) Resist: AC-POSS-2-106,resolution: 100 nm, l/s 1:1.5 (dose: 24.0 mJ/cm2). (c) Resist AC-POSS-2-106 after partial dry development of the underlayerwith pure O2 plasma. Resolution: 90 nm, l/s 1:1.5 (dose: 20.5 mJ/cm2).
POSS-Based Resists Chem. Mater., Vol. 16, No. 13, 2004 2577


![Silica grafted with a silsesquioxane containing the positively charged 1,4-diazoniabicyclo[2.2.2]octane group used as adsorbent for anionic dye removal](https://static.fdokumen.com/doc/165x107/63228038807dc363600a7986/silica-grafted-with-a-silsesquioxane-containing-the-positively-charged-14-diazoniabicyclo222octane.jpg)