Self-Aligning Cylindrical Roller Bearings: The Ideal Non ...
ARTICLE IN PRESS
Optics and Lasers in Engineering 43 (2005) 951–962
0143-8166/$ -
doi:10.1016/j
�Correspo
E-mail ad
Investigation of dynamic displacements oflithographic press rubber roller by time average
geometric moire
Minvydas Ragulskisa,�, Rimas Maskeliunasb,Liutauras Ragulskisc, Vytautas Turlab
aKaunas University of Technology, Department of Mathematical Research in Systems, Studentu 50-222,
Kaunas LT-51368, LithuaniabVilnius Gediminas Technical University, Department of Printing Machines, J. Basanaviciaus 28,
Vilnius LT-03224, LithuaniacVytautas Magnus University, Department of Informatics, Vileikos 8, Kaunas LT-44404, Lithuania
Received 1 July 2004; received in revised form 1 October 2004; accepted 1 October 2004
Available online 24 December 2004
Abstract
Geometric moire fringe formation method is a classical well-established experimental
technique with numerous practical applications. This paper proposes the application of time-
average geometric moire analysis for the determination of dynamic displacements of the
lithographic press rubber roller. This optical measurement technique is a natural extension of
double-exposure geometric moire for the identification of dynamic displacements of vibrating
elastic structures. Experimental investigations prove the validity and effective practical
applicability of the method.
r 2004 Elsevier Ltd. All rights reserved.
Keywords: Geometric moire; Fringes; Time average; Vibration; Press roller
see front matter r 2004 Elsevier Ltd. All rights reserved.
.optlaseng.2004.10.004
nding author. Tel.: +370 698 22456; fax: +370 373 30446.
dress: [email protected] (M. Ragulskis).

ARTICLE IN PRESS
M. Ragulskis et al. / Optics and Lasers in Engineering 43 (2005) 951–962952
1. Introduction
Double-exposure geometric moire [1] can produce valuable and meaningfulpatterns of fringes. It is a well-established technique with various applications [2].There exist numerous technical solutions for dynamic moire analysis [3]. A typicalexample is when a free surface of liquid is illuminated through a grid focusing anarray of light and dark lines on the surface. Interpretation of the dynamic picture (orseries of static pictures) of grating can bring lots of useful information about themotion of the surface. Another widely used application is the analysis of transientmechanics of deformation exploiting laser moire interferometry [4–6].
Nevertheless, direct dynamic interpretation of structural vibrations from dynamicpictures of moire grating is hardly possible due to a relatively high frequency ofresonance oscillations of the analysed structures. An alternative could be thecoupling of time-average techniques and geometric moire fringe analysis. It can benoted that direct geometric moire analysis (not laser moire interferometry) isconsidered when a grating of dark and white lines is plotted onto the surface of theanalysed body. Yet there are a few open questions. Will the patterns of fringes beformed as the time-average techniques are used? And if the pattern of fringes isformed, how can it be interpreted ? This paper tries to answer these questions and toprove the applicability of time-average geometric moire for analysis of vibratingelastic structures. Such a method of measurement does not require complexexperimental set-up and can provide valuable results in many practical applications.
2. One-dimensional model
For simplicity, a one-dimensional system is analysed first. The moire grating in thestate of equilibrium is defined as a harmonic variation of grey scale in the rangebetween 0 (representing black colour) and 1 (representing white colour). Such adefinition of grating is well suited for numerical reconstruction of moire fringes [7].The intensity is a continuous function, and line width is 50% of the pitch.
Superposition of two gratings (double exposure of the gratings in the state ofequilibrium and in the deformed state) produces a moire fringe pattern:
Isðx; uÞ ¼1
2cos2 p
lx
� �þ cos2 p
lðx � uÞ
� �� �
¼1
2þ
1
2cos
2pl
1 �u
2x
� �x
� �cos
pl
u� �
; ð1Þ
where Is is the intensity in double exposure geometric moire, x, the longitudinal co-ordinate, u, the displacement from the state of equilibrium at point x and l is theparameter defining the pitch of grating. The first term in Eq. (1) represents the grey-scale level of the surface in the state of equilibrium and the second term representsthat in the state of deformation. Such a formulation of intensity enablesstraightforward embedding of the results from finite element analysis to digitalcomputer plotting procedures. The centres of fringes will coincide with the locations
ARTICLE IN PRESS
M. Ragulskis et al. / Optics and Lasers in Engineering 43 (2005) 951–962 953
where the intensity will be equal to 0.5. Thus, the relationship among fringe orders,the pitch of the grating and the displacement can be derived from the conditioncosððp=lÞuÞ ¼ 0:
u ¼ l n �1
2
� �; n ¼ 1; 2; . . . ; (2)
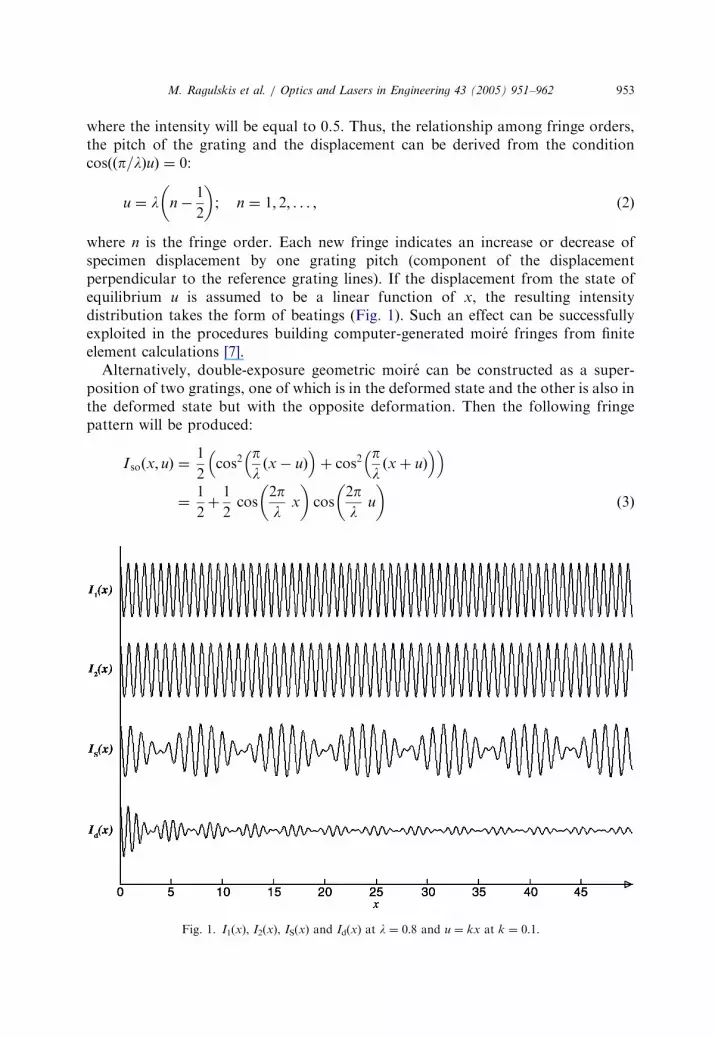
where n is the fringe order. Each new fringe indicates an increase or decrease ofspecimen displacement by one grating pitch (component of the displacementperpendicular to the reference grating lines). If the displacement from the state ofequilibrium u is assumed to be a linear function of x, the resulting intensitydistribution takes the form of beatings (Fig. 1). Such an effect can be successfullyexploited in the procedures building computer-generated moire fringes from finiteelement calculations [7].
Alternatively, double-exposure geometric moire can be constructed as a super-position of two gratings, one of which is in the deformed state and the other is also inthe deformed state but with the opposite deformation. Then the following fringepattern will be produced:
I soðx; uÞ ¼1
2cos2 p
lðx � uÞ
� �þ cos2 p
lðx þ uÞ
� �� �
¼1
2þ
1
2cos
2pl
x
� �cos
2pl
u
� �ð3Þ
Fig. 1. I1(x), I2(x), IS(x) and Id(x) at l ¼ 0:8 and u ¼ kx at k ¼ 0:1:

ARTICLE IN PRESS
M. Ragulskis et al. / Optics and Lasers in Engineering 43 (2005) 951–962954
where Iso is the intensity of double exposure moire when gratings with oppositedeformations are superposed. Thus, the relationship among fringe orders, the pitchof the grating and the displacement takes the following form:
u ¼l2
n �1
2
� �; n ¼ 1; 2; . . . : (4)
Let us consider the previously mentioned one-dimensional model with theassumption that an elastic structure performs harmonic oscillations and theamplitudes (maximum displacements from the status of equilibrium) are u(x). Ifthe time of exposition is much longer than the period of oscillations, the resultingpattern is formed as an integral sum of the continuous process of motion:
Idðx; uÞ ¼ limT!1
1
2T
Z T
0
1 þ cos2plðx � u sinðot þ jÞÞ
� �� �dt
¼o2p
Z ð2p�jÞ=o
�j=ocos2 p
lðx � u sinðot þ jÞÞ
� �dt
�o2p
Xm
i¼1
cos2 pl
x � u sin o �joþ ði � 1Þ
2pmo
� �þ j
� �� �2pmo
� �
¼1
m
Xm
i¼1
cos2 pl
x � u sin2pm
ði � 1Þ
� �� �� �� �; ð5Þ
where Id is the intensity of illumination in dynamic moire fringe analysis, T, theexposure time, o; the angular frequency of oscillations, j; the phase and m, thenumber of discrete states in a period of oscillations.
The first equality in Eq. (5) follows from the periodicity of harmonic function. Thesecond approximate equality builds the ground for approximate numerical techniqueof the reconstruction of the pattern of fringes. The greater the value of m, the betterthe quality. It can be noted that neither o nor j has any effect on the pattern offringes. But
limT!1
1
2T
Z T
0
1 þ cos2plðx � u sinðot þ jÞÞ
� �� �dt
¼1
2þ lim
T!1
1
2T
Z T
0
cos2pl
x
� �cos
2plðu sinðot þ jÞÞ
� �dt
þ limT!1
1
2T
Z T
0
sin2pl
x
� �sin
2plðu sinðot þ jÞÞ
� �dt
¼1
2þ
1
2cos
2pl
x
� �J0
2pl
u
� �; ð6Þ
where J0, is the zero-order Bessel function of the first kind:
J0ðaÞ ¼ limT!1
1
T
Z T
0
expðja sinðot þ jÞÞdt
� �(7)

ARTICLE IN PRESS
M. Ragulskis et al. / Optics and Lasers in Engineering 43 (2005) 951–962 955
It can be noted that integrals
limT!1
1
2T
Z T
0
sin2pl
ðu sinðot þ jÞÞ� �
dt and
limT!1
1
T
Z T
0
sinða sinðot þ jÞÞ dt
converge to zero due to the non-evenness of the sine function.The surface intensities for double exposure and time-average geometric moire are
illustrated in Fig. 1, where I1(x) is the equilibrium state and I2(x) the deformed state.Eq. (6) enables explicit construction of the envelope function which modulates the
grating cosðð2p=lÞxÞ and characterises the formation of fringes:
EðuÞ ¼1
2
1
2J0
2pl
u
� �(8)
where E stands for the envelope function (Fig. 2a). Though the decay of intensity ofillumination at increasing amplitudes is quite strong, it is not as fast as in timeaverage holography1, where the decay of intensity of illumination is defined as
HðuÞ ¼ J02pl
u
� �� �2
; (9)
where H is the intensity of illumination in the time-average holographic image. It isimportant to note that the intensity of illumination in time-average moireapplications converges to 0.5 (instead of 0 in holographic analysis) at increasingamplitudes, and special digital image brightening techniques [8] can be avoided.
From Eq. (6), it is clear that the accuracy of numerical reconstruction of the imageis determined by the parameter m—the number of discrete states in a period ofoscillations ascertains the character of the reconstructed envelope function (explicitlydefined by Eq. (8)). The procedure of numerical reconstruction presented in Eq. (6)does not explicitly define the envelope function. But it is still possible to define thatfunction using a similar technique as used in Eq. (8). It can be noted that the extremevalues of the last term in Eq. (6) occur at x ¼ 0 and x ¼ l=2: Then,
EmðuÞ ¼
1m
Pmi¼1
cos2 pl sin 2p
mði � 1Þ
�u
� �
1m
Pmi¼1
sin2 pl sin 2p
mði � 1Þ
�u
� �
8>>><>>>:
(10)
where Em is the reconstructed envelope function at predefined m. Fig. 2a presents thenumerically reconstructed envelope lines at m ¼ 22; which guarantees sufficientaccuracy of reconstruction of the first five fringes. The relationship between thenumber of correctly reconstructed fringes and the number of discrete states in aperiod of harmonic oscillations is presented in Fig. 2b.

ARTICLE IN PRESS
Fig. 2. (a) Envelope function at l ¼ 0:25; solid line stands for the analytical definition and dashed lines for
the numerical reconstruction at m ¼ 22: (b) Relationship between the number of correctly reconstructed
fringes and parameter m.
M. Ragulskis et al. / Optics and Lasers in Engineering 43 (2005) 951–962956
3. Interpretation of the fringe pattern (quantitative analysis of deformation)
The fringe pattern produced by time-average geometric moire is directly related tothe displacement field, as in double exposure geometric moire. The only difference isthat the relationship between the number of fringes and the value of displacement in

ARTICLE IN PRESS
Fig. 3. Relationship between the non-dimensional displacement and the fringe number.
M. Ragulskis et al. / Optics and Lasers in Engineering 43 (2005) 951–962 957
time-average moire analysis is non-linear. Explicitly, this relationship can be derivedfrom Eq. (8). The centres of the fringes coincide with the isolines corresponding tothe solution of equality EðuÞ ¼ 1
2: Thus, the explicit relationship among the fringe
order, pitch of the grating and dynamic displacement is obtained from the conditionrequiring that the value of the Bessel function is zero:
u ¼l
2prn; (11)
where rn is the nth root of the zero-order Bessel function of the first kind. It can benoted that the values of the roots of the zero-order Bessel function of the first kindare available in classical texts [9]. The relationship between the non-dimensionaldynamic displacement and the fringe number is presented in Fig. 3.
It can be noted that the object of moire analysis is to measure displacementcomponents normal to the grating lines. Both components of the two-dimensionaldisplacement vector can be determined from two experiments with mutuallyorthogonal gratings. This is true both for double exposure and time-averagegeometric moire.
4. Experimental validation of the method
The goal of experimental time-average moire analysis is to validate the method. Agrating of dark and white lines is drawn on the surface of rubber specimens whichare mounted to a shaker system (Fig. 4).

ARTICLE IN PRESS
Fig. 4. View of the experimental set-up.
M. Ragulskis et al. / Optics and Lasers in Engineering 43 (2005) 951–962958
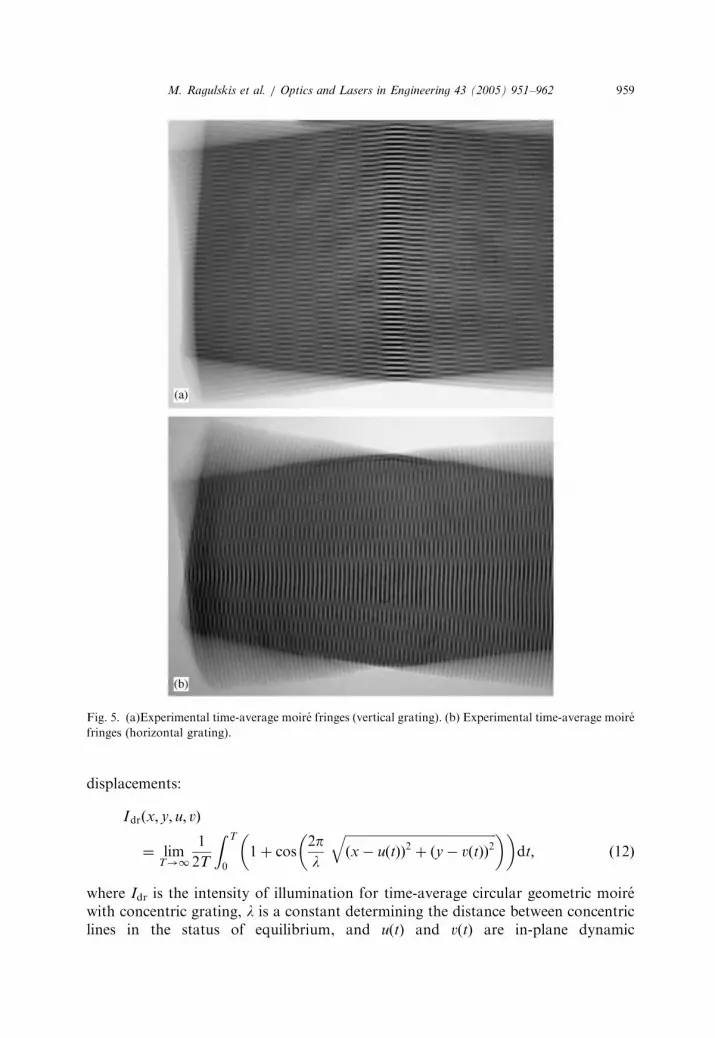
One rubber specimen is produced with horizontal grating and another withvertical grating. The grating pitch is 1 mm, line width is half of the pitch, and drivingfrequency of the shaker table is 51 Hz, which corresponds to the second resonancefrequency of the rubber specimens. A digital photo camera with exposition timeT ¼ 1:5 seconds is used. The produced images are presented in Figs. 5a and b. It canbe noted that the high sharpness of the grating is preserved in the motionless zones ofthe rubber specimen. The fringes can be identified with the naked eye in liveexperiments, although for higher fringe numbers their contrast decreases.
The produced experimental time-average moire fringes enable the straightforwardinterpretation of dynamic deformations. For example, nine fringes are visible to theleft of the motionless zone in Fig. 5a. This means that the maximum dynamicdisplacement of the end of the rubber specimen in the vertical direction is u=l ¼
r9=2p (from Eq. (11)), and here r9 � 27; 4927: Thus, the maximum dynamicdisplacement from the status of equilibrium is 4,3756 pitches, or 8,7512 pitches frommaximum displacement ‘‘up’’ and maximum displacement ‘‘down’’ in the verticaldirection. It is easy to count the grating lines between the maximum deflections at theregion of the end section of the rubber specimen. The number of lines is about 8.That shows perfect coincidence between experimental and theoretical results.
5. Experimental analysis of lithographic press rubber roller
Circular time-average moire has many advantageous features over otherexperimental methods for the analysis of rotating circular objects. This is clearlyillustrated in a time-average photo of a rotating lithographic press rubber roller train(Fig. 6). No interpretable patterns would be formed at all if the moire grating werenot formed as an array of concentric circles.
The intensity of illumination for time-average circular geometric moire withconcentric grating can be expressed as an integral average of variation of radial
ARTICLE IN PRESS
Fig. 5. (a)Experimental time-average moire fringes (vertical grating). (b) Experimental time-average moire
fringes (horizontal grating).
M. Ragulskis et al. / Optics and Lasers in Engineering 43 (2005) 951–962 959
displacements:
Idrðx; y; u; vÞ
¼ limT!1
1
2T
Z T
0
1 þ cos2pl
ffiffiffiffiffiffiffiffiffiffiffiffiffiffiffiffiffiffiffiffiffiffiffiffiffiffiffiffiffiffiffiffiffiffiffiffiffiffiffiffiffiffiffiffiffiffiffiffiðx � uðtÞÞ2 þ ðy � vðtÞÞ2
q� �� �dt; ð12Þ
where Idr is the intensity of illumination for time-average circular geometric moirewith concentric grating, l is a constant determining the distance between concentriclines in the status of equilibrium, and u(t) and v(t) are in-plane dynamic

ARTICLE IN PRESS
Fig. 6. Time-average photo of a rotating lithographic press rubber roller train.
Fig. 7. Time-average photograph of the vibrating rubber roller.
M. Ragulskis et al. / Optics and Lasers in Engineering 43 (2005) 951–962960
displacements in cartesian frame. It can be noted that concentric grating enables theregistration of radial displacements and is insensitive to angular displacements(rotation). Alternatively, radial moire grating can be used for circular objects. Suchgrating would be sensitive to angular, not radial displacements (but not applicablefor rotating objects):
Idaðx; y; u; vÞ ¼ limT!1
1
2T
Z T
0
1 þ cos k tan�1 x � uðtÞ
y � vðtÞ
� �� �dt; (13)
where Ida is the intensity of illumination for time-average circular geometric moirewith radial grating and k is a constant determining the number of radial lines.
If the roller train vibrates, time-average circular geometric moire with concentricgrating can provide valuable information about dynamic deformations. This is

ARTICLE IN PRESS
Fig. 8. Digitally processed image of the contact zone with enumerated fringes.
M. Ragulskis et al. / Optics and Lasers in Engineering 43 (2005) 951–962 961
illustrated in Fig. 7, where the rubber roller does not turn and its axis is motionlesslyfixed. The pitch of circular grating is 1 mm, and line width is half the pitch. The steelroller performs harmonic vibrations, the frequency of vibrations is 20 Hz, andexposure time is 2 s. Interference fringes in the contact zone are clearly visible withthe naked eye. Noteworthy is the image of the steel roller where two maximumdeflections from the status of equilibrium are best registered in the time-averagephoto due to the fact that the velocity of the vibrating body is small around theregions of maximum displacements.
Digital processing of the image of the contact zone (Fig. 8) provides an evenclearer picture of the interference fringes. It can be noted that the interpretation offringes is different from double-exposure geometric moire as the formation of fringesis governed by time-average moire and is defined explicitly by Eq. (11). Forconcentric grating every fringe will determine dynamic displacement in the radialdirection and the magnitude of displacement can be found from Eq. (11). Ordinaryfringe counting techniques can be used for determination of the fringe order.
It is important to note that time-average geometric moire is a non-contact whole-field technique and provides information on dynamic deformations which can beeasily registered and quantified in the domain of the whole analysed object. Theadvantages of this optical technique are especially clear when applied for the analysisof dynamic deformations of the rubber layer of the lithographic press roller.
6. Concluding remarks
Time-average geometric moire for analysis of in-plane vibrations of elasticstructures is proposed in this paper. Apparently, the fact that the intensity of higherfringes is blurred was hiding this method amongst other non-contact whole-fieldexperimental techniques for analysis of structural vibrations.
This paper proves that such a method is feasible for the analysis of vibrations. Ithas many advantageous features — it is a straightforward method and does not
ARTICLE IN PRESS
M. Ragulskis et al. / Optics and Lasers in Engineering 43 (2005) 951–962962
require a complex experimental set-up. It is even more simple than double-exposuregeometric moire—no artificial superposition of the reference image and the image ofthe object in the deformed state is necessary. Naturally, the interpretation of fringepatterns in time-average geometric moire is different from the double-exposuregeometric moire. But this fact does not decrease the practical value of the method,which can be effectively exploited for the analysis of vibrating elastic structures.
References
[1] Kobayashi AS, editor. Handbook on experimental mechanics. 2nd ed. SEM; 1993.
[2] Post D, Han B, Ifju P. High sensitivity moire: experimental analysis for mechanics and materials.
Berlin: Springer Verlag; 1997.
[3] Indebetoun G, Czarnek R. Selected papers on optical moire and applications. Virginia Polytechnic
Institute and State University; 1992.
[4] Huimin X, Guotao W, Fulong D, Guangjun Z, Xingfu L, Fangju Z, et al. The dynamic deformation
measurement of the high speed heated LY12 aluminium plate with moire interferometry. J Mater
Process Technol 1998;83(1–3):159–63.
[5] Deason VA, Epstein JS, Abdallah A. Dynamic diffraction moire: theory and applications. Opt Lasers
Eng 1990;12(2–3):173–87.
[6] Kokaly MT, Lee J, Kobayashi AS. Moire interferometry for dynamic fracture study. Opt Lasers Eng
2003;40(4):231–47.
[7] Ragulskis M, Maskeliunas R, Ragulskis L. Plotting moire fringes for circular structures from FEM
results. Exp Techniques 2002;26(1):31–5.
[8] Ragulskis M, Palevicius A, Ragulskis L. Plotting holographic interferograms for visualization of
dynamic results from finite-element calculations. Int J Numer Meth Engng 2003;56:1647–59.
[9] West CM. Holographic interferometry. New York: Wiley; 1979.
Copyright © 2022 FDOKUMEN