A lithographic approach to determine volume expansion factors during anodization: Using the example...
7
Electrochimica Acta 54 (2009) 5942–5948 Contents lists available at ScienceDirect Electrochimica Acta journal homepage: www.elsevier.com/locate/electacta A lithographic approach to determine volume expansion factors during anodization: Using the example of initiation and growth of TiO 2 -nanotubes Steffen Berger, Julia Kunze, Patrik Schmuki ∗ , Darren LeClere, Anna T. Valota, Peter Skeldon, George E. Thompson Department of Materials Science, Institute for Surface Science and Corrosion (LKO), University of Erlangen-Nürnberg, Martensstrasse 7, D-91058 Erlangen, Germany article info Article history: Received 12 March 2009 Received in revised form 14 May 2009 Accepted 16 May 2009 Available online 27 May 2009 Keywords: Anodic TiO2 Nanotubes Growth Lithography abstract The present work investigates the formation of nanotubes by anodizing titanium at 20V in glycerol con- taining either 0.175 M or 0.35 M NH 4 F. A photoresist-masking method of thin Ti films allows to use SEM cross-sections to directly obtain information on oxide morphology, layer thickness and metal substrate loss. Therefore not only features of the initial growth stages but also oxide expansion factors can accurately be determined. The expansion factors were found to be ∼2.4 for the initial formation of a barrier layer, ∼1.7–1.9 during pore initiation and ∼2.7–3.1 as the main nanotubes develop. These values (>2.6) suggest substantial contribution to steady state tube growth by a plastic oxide flow mechanism. Combined with RBS efficiency measurements the method presented here allows facile and direct investigation of the mechanism of pore/tube formation. © 2009 Elsevier Ltd. All rights reserved. 1. Introduction Self-organized nanostructured oxides, grown by anodizing, have attracted great interest in recent years. Following particularly from studies of nanoporous alumina, [1] the oxides can now be formed on various valve metals and their alloys using dilute fluoride-based electrolytes under optimized electrochemical conditions. Highly ordered nanotubular titania is especially promising [2–7], since it offers several interesting functional properties that have been explored in a wide field of applications, including catalyst sys- tems [8–10], sensors [11], wettability tuning of surfaces [12,13], biomedicine [14,15], electrochromic devices [16–18], and solar energy conversion [19–22]. In accordance with the application requirements, the nanotubular oxides can be tailored, for exam- ple with respect to layer thickness [23], tube diameter [24] and other morphological [21,25,26], electrical [27] or chemical proper- ties [10]. The mechanism of self-organization has been studied in the case of anodic alumina in order to understand and to control the morphology of the porous layers. Film growth was considered in detail by O’Sullivan and Wood, with pores presumed to form by field-assisted dissolution of alumina at the pore base [28]. More recently, it has been suggested that flow of film material from the barrier layer region towards the pore walls can provide an alternative explanation of pore development [29,30]. Plasticity in ∗ Corresponding author. E-mail address: [email protected] (P. Schmuki). anodic alumina under the electric field is well-established from the behaviour of anodized aluminum wire [31]. A field-assisted dissolu- tion process has been proposed for the formation of pores in anodic titania [5], similar to that of anodic alumina [32,33], although a combination of flow and dissolution processes may occur, which has been considered in recent tracer studies [34]. However, the detailed processes of nanotube formation remain uncertain, even for well-controlled systems. For titania nanotubes several concepts have been put forward [6,35,36]. Taveira et al. [35] identified a sequence of events for nanotubular layer growth involving formation of breakdown sites in the barrier layer, development of a non-uniform film morphol- ogy and evolution of a highly regular tube-like structure. Yasuda et al. addressed several aspects of the formation mechanism of self- organized nanotube layers formed on valve metals and their alloys in fluoride-containing electrolytes [36]. In a recent study of nan- otube initiation, surface pre-treatment was shown to have a major influence on nanotube formation, probably related to its effect on the atomic structure and access of fluoride ions to the titanium/film interface [37]. Most of these detailed oxide growth studies are car- ried out on fractured or sliced cross-sections using TEM or SEM for observation, also in combination with tracers and chemical charac- terization techniques [34]. A key point is to determine the amount of oxide formed and the amount of metal “lost”. In the present paper several aspects of the nanotube formation mechanisms are explored using a novel cross-sectioning approach. We use photolithography to partially cover a thin Ti film on Si with a patterned photoresist. After selective anodization of the opened 0013-4686/$ – see front matter © 2009 Elsevier Ltd. All rights reserved. doi:10.1016/j.electacta.2009.05.064
Transcript of A lithographic approach to determine volume expansion factors during anodization: Using the example...
Aa
SPD
a
ARRAA
KATNGL
1
asoeoietberpotttifirta
0d
Electrochimica Acta 54 (2009) 5942–5948
Contents lists available at ScienceDirect
Electrochimica Acta
journa l homepage: www.e lsev ier .com/ locate /e lec tac ta
lithographic approach to determine volume expansion factors duringnodization: Using the example of initiation and growth of TiO2-nanotubes
teffen Berger, Julia Kunze, Patrik Schmuki ∗, Darren LeClere, Anna T. Valota,eter Skeldon, George E. Thompsonepartment of Materials Science, Institute for Surface Science and Corrosion (LKO), University of Erlangen-Nürnberg, Martensstrasse 7, D-91058 Erlangen, Germany
r t i c l e i n f o
rticle history:eceived 12 March 2009eceived in revised form 14 May 2009ccepted 16 May 2009
a b s t r a c t
The present work investigates the formation of nanotubes by anodizing titanium at 20 V in glycerol con-taining either 0.175 M or 0.35 M NH4F. A photoresist-masking method of thin Ti films allows to use SEMcross-sections to directly obtain information on oxide morphology, layer thickness and metal substrateloss. Therefore not only features of the initial growth stages but also oxide expansion factors can accurately
vailable online 27 May 2009
eywords:nodiciO2
anotubes
be determined. The expansion factors were found to be ∼2.4 for the initial formation of a barrier layer,∼1.7–1.9 during pore initiation and ∼2.7–3.1 as the main nanotubes develop. These values (>2.6) suggestsubstantial contribution to steady state tube growth by a plastic oxide flow mechanism. Combined withRBS efficiency measurements the method presented here allows facile and direct investigation of themechanism of pore/tube formation.
rowthithography
. Introduction
Self-organized nanostructured oxides, grown by anodizing, havettracted great interest in recent years. Following particularly fromtudies of nanoporous alumina, [1] the oxides can now be formedn various valve metals and their alloys using dilute fluoride-basedlectrolytes under optimized electrochemical conditions. Highlyrdered nanotubular titania is especially promising [2–7], sincet offers several interesting functional properties that have beenxplored in a wide field of applications, including catalyst sys-ems [8–10], sensors [11], wettability tuning of surfaces [12,13],iomedicine [14,15], electrochromic devices [16–18], and solarnergy conversion [19–22]. In accordance with the applicationequirements, the nanotubular oxides can be tailored, for exam-le with respect to layer thickness [23], tube diameter [24] andther morphological [21,25,26], electrical [27] or chemical proper-ies [10]. The mechanism of self-organization has been studied inhe case of anodic alumina in order to understand and to controlhe morphology of the porous layers. Film growth was consideredn detail by O’Sullivan and Wood, with pores presumed to form by
eld-assisted dissolution of alumina at the pore base [28]. Moreecently, it has been suggested that flow of film material fromhe barrier layer region towards the pore walls can provide anlternative explanation of pore development [29,30]. Plasticity in∗ Corresponding author.E-mail address: [email protected] (P. Schmuki).
013-4686/$ – see front matter © 2009 Elsevier Ltd. All rights reserved.oi:10.1016/j.electacta.2009.05.064
© 2009 Elsevier Ltd. All rights reserved.
anodic alumina under the electric field is well-established from thebehaviour of anodized aluminum wire [31]. A field-assisted dissolu-tion process has been proposed for the formation of pores in anodictitania [5], similar to that of anodic alumina [32,33], although acombination of flow and dissolution processes may occur, whichhas been considered in recent tracer studies [34]. However, thedetailed processes of nanotube formation remain uncertain, evenfor well-controlled systems. For titania nanotubes several conceptshave been put forward [6,35,36].
Taveira et al. [35] identified a sequence of events fornanotubular layer growth involving formation of breakdown sitesin the barrier layer, development of a non-uniform film morphol-ogy and evolution of a highly regular tube-like structure. Yasuda etal. addressed several aspects of the formation mechanism of self-organized nanotube layers formed on valve metals and their alloysin fluoride-containing electrolytes [36]. In a recent study of nan-otube initiation, surface pre-treatment was shown to have a majorinfluence on nanotube formation, probably related to its effect onthe atomic structure and access of fluoride ions to the titanium/filminterface [37]. Most of these detailed oxide growth studies are car-ried out on fractured or sliced cross-sections using TEM or SEM forobservation, also in combination with tracers and chemical charac-terization techniques [34]. A key point is to determine the amount
of oxide formed and the amount of metal “lost”.In the present paper several aspects of the nanotube formationmechanisms are explored using a novel cross-sectioning approach.We use photolithography to partially cover a thin Ti film on Si witha patterned photoresist. After selective anodization of the opened
S. Berger et al. / Electrochimica Acta 54 (2009) 5942–5948 5943
tion r
aaoo
2
s(otuwIatwGtmpwDnwTwtsetwaweewarwsts(GsmbP
graphs that disclose the thicknesses of the TiO2 film and the onefrom the residual titanium with increasing times of anodizing inglycerol/0.35 NH4F and glycerol/0.175 NH4F (Fig. 4a and b); cross-section and plan views are shown in the upper and lower parts
Fig. 1. Schematic drawing of the produc
reas, cross-sectional SEM allows to exactly determine oxidationnd expansion rates. This new approach therefore enables the studyf film formation during the initiation and growth of nanotubularxides.
. Experimental
Titanium layers, nominally 750 nm thick, were deposited onilicon wafers at the Fraunhofer Institute for Integrated SystemsErlangen) using electron beam evaporation with a deposition ratef 0.6 nm/min at 5 × 10⁻⁷ to 2 × 10⁻⁶ mbar. The wafers were cuto squares of 1.5 cm × 1.5 cm, using a diamond cutter, successivelyltra-sonicated in acetone, isopropanol and methanol, then rinsedith deionized (DI) water, and finally dried in a nitrogen stream.
n order to measure the ratio of the thickness of the anodic filmnd of the consumed titanium, a photoresist was applied to par-ially cover the specimens. The titanium surface was spin-coatedith a 100 nm thick positive photoresist layer (Microposit S18132, Rohm and Haas, USA), pre-baked at 120 ◦C for 30 s and exposed
o UV light for 10 s through a patterned stainless steel mask in aask aligner (MA 6, Karl Suss KG). After UV exposure the sam-
les were post-baked at 120 ◦C for 60 s. The exposed photoresistas developed and removed in a developing agent (Microposit 351eveloper, Rohm and Haas, USA) to produce a surface with alter-ating regions of masked and exposed titanium. The specimensere rinsed with deionized water and dried in a nitrogen stream.
he specimens were then anodized using an electrochemical cellith a conventional three-electrode configuration, with the pat-
erned titanium-substrate serving as working electrode, a platinumheet as counter electrode and a platinum wire as a pseudo refer-nce electrode. The pseudo reference electrode was used in ordero avoid introduction of water into the electrolyte. The specimensere pressed against an O-ring in the electrochemical cell, leavingtotal area of approximately 0.22 cm2 exposed to the electrolyte ofhich approximately 0.08 cm2 was exposed titanium, i.e. not cov-
red by the photoresist. High purity glycerol (99.5%), containingither 0.175 M or 0.35 M NH4F, was used as electrolyte. Anodizingas carried out potentiostatically at 20 V for selected times, usinghigh-voltage potentiostat (Jaissle IMP 88). After anodizing, the
emaining photoresist was removed using acetone; the specimensere then rinsed in DI water and dried in a nitrogen stream. Fig. 1
ummarizes the specimen preparation procedure, which enabledhe measurement of the thicknesses of both the film and con-umed titanium using field emission scanning electron microscopyHitachi FE-SEM S4800), with cross-sections obtained by cleaving.
rowth efficiency data was obtained via Rutherford backscatteringpectroscopy (RBS) measurements. In the course of these measure-ents the compositions of the anodic films were determined by ioneam analysis using the Van de Graff accelerator of the University ofaris, with an analyzed specimen area of 1 mm diameter. RBS was
oute for the partially anodized samples.
carried out using 1.7 MeV He+ ions, with the ion beam at normalincidence to the specimen surface and with detection of scatteredions at 165◦ to the direction of the incident beam. The data wereinterpreted using the RUMP program.
3. Results
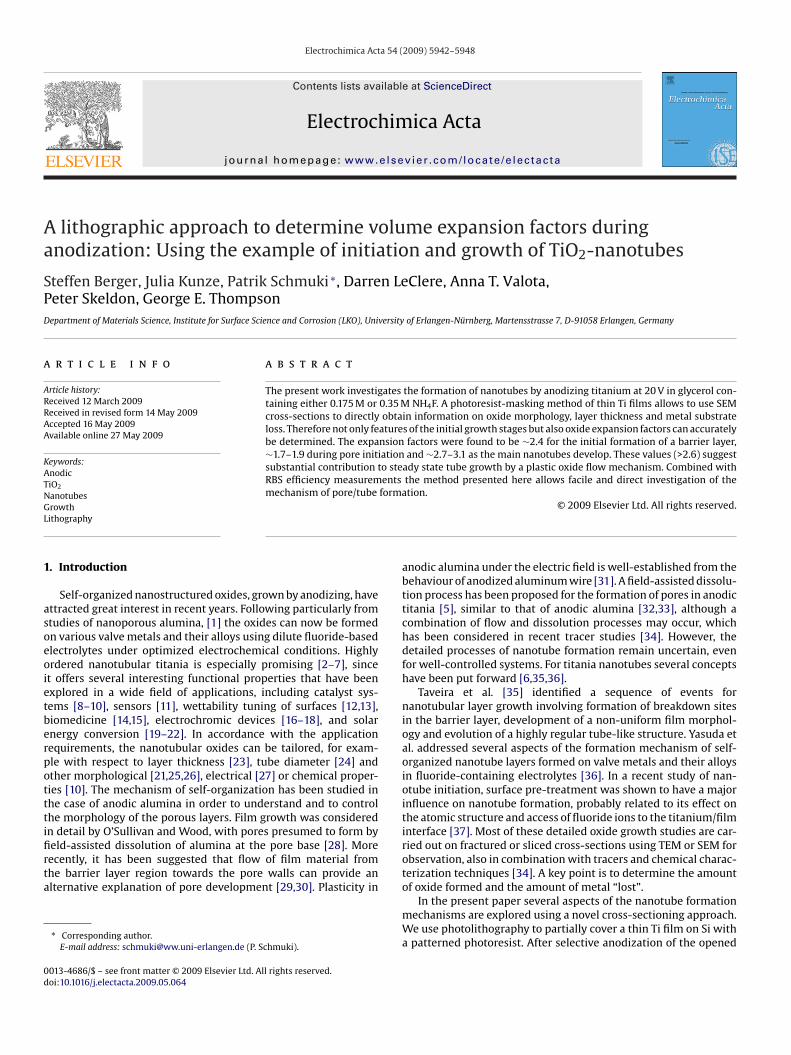
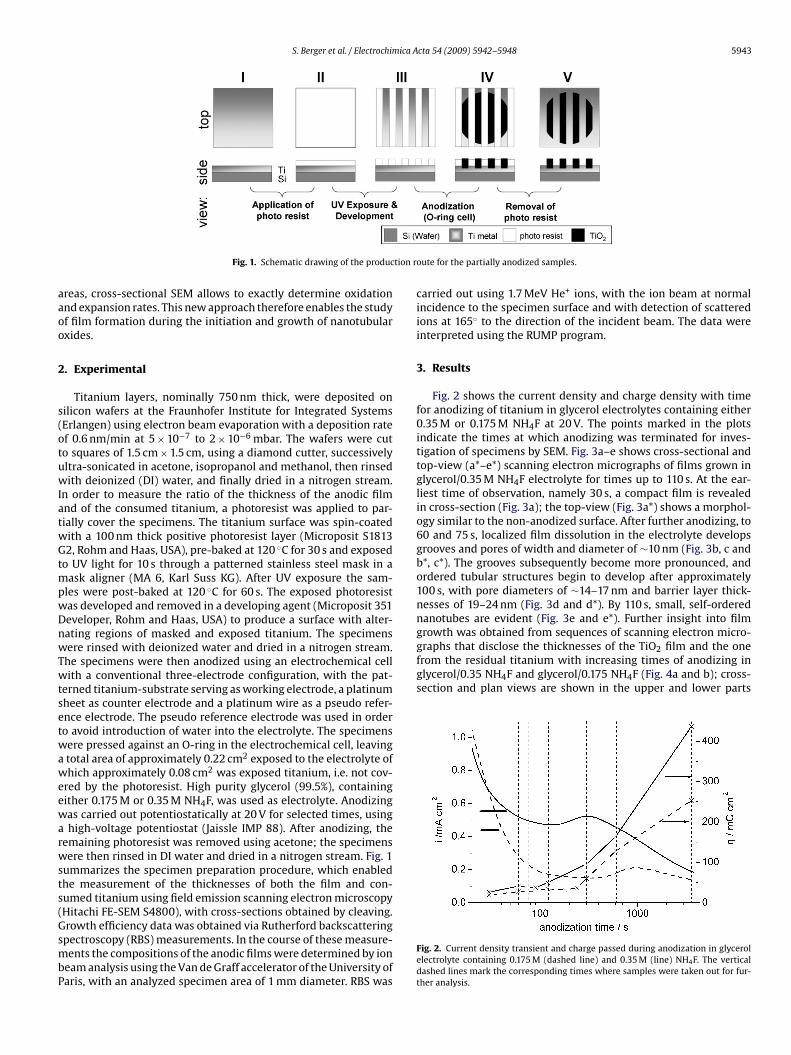
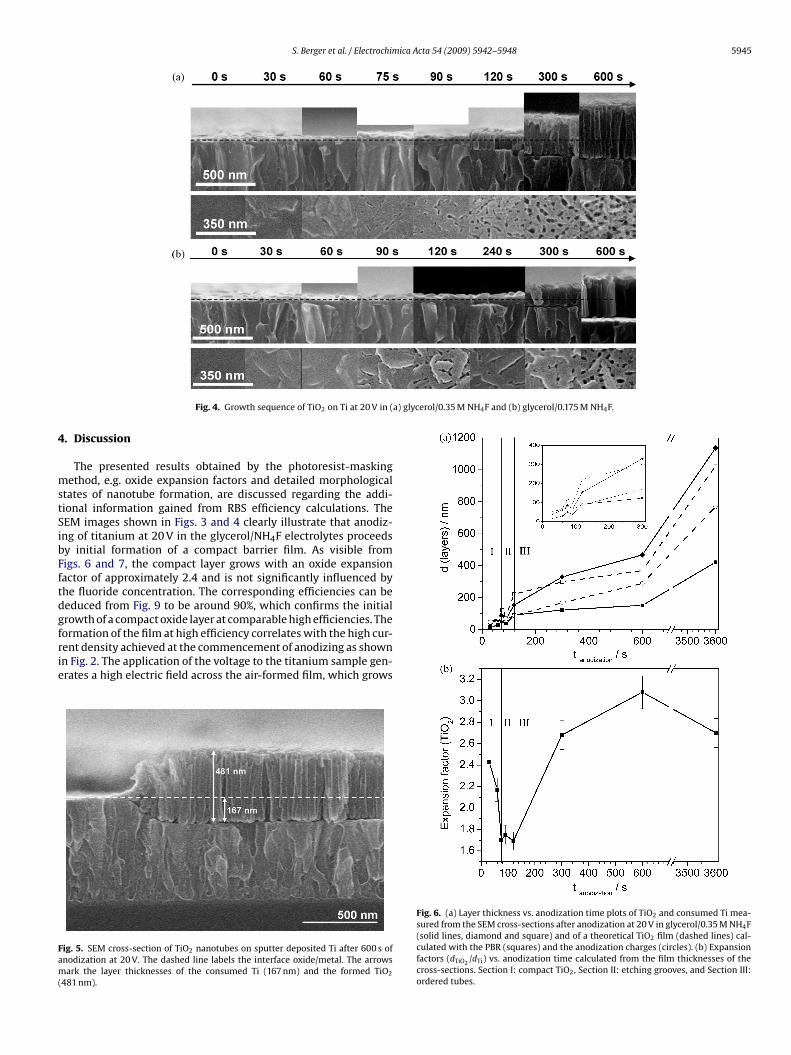
Fig. 2 shows the current density and charge density with timefor anodizing of titanium in glycerol electrolytes containing either0.35 M or 0.175 M NH4F at 20 V. The points marked in the plotsindicate the times at which anodizing was terminated for inves-tigation of specimens by SEM. Fig. 3a–e shows cross-sectional andtop-view (a*–e*) scanning electron micrographs of films grown inglycerol/0.35 M NH4F electrolyte for times up to 110 s. At the ear-liest time of observation, namely 30 s, a compact film is revealedin cross-section (Fig. 3a); the top-view (Fig. 3a*) shows a morphol-ogy similar to the non-anodized surface. After further anodizing, to60 and 75 s, localized film dissolution in the electrolyte developsgrooves and pores of width and diameter of ∼10 nm (Fig. 3b, c andb*, c*). The grooves subsequently become more pronounced, andordered tubular structures begin to develop after approximately100 s, with pore diameters of ∼14–17 nm and barrier layer thick-nesses of 19–24 nm (Fig. 3d and d*). By 110 s, small, self-orderednanotubes are evident (Fig. 3e and e*). Further insight into filmgrowth was obtained from sequences of scanning electron micro-
Fig. 2. Current density transient and charge passed during anodization in glycerolelectrolyte containing 0.175 M (dashed line) and 0.35 M (line) NH4F. The verticaldashed lines mark the corresponding times where samples were taken out for fur-ther analysis.
5944 S. Berger et al. / Electrochimica A
F27a
otatsmisfittcpa
The efficiency is in excess of 90% in the early stages of film growth,when a barrier film is formed, but reduces as pores initiate, reaching
ig. 3. SEM cross-sectional (a–e) and top-view (a*–e*) images of TiO2 formed at0 V in glycerol/0.35 M NH4F after anodization times of (a, a*) 30 s, (b, b*) 60 s, (c, c*)5 s, (d, d*) 100 s and (e, e*) 110 s. In the top-view images the border separating thenodized from the non-anodized region is shown.
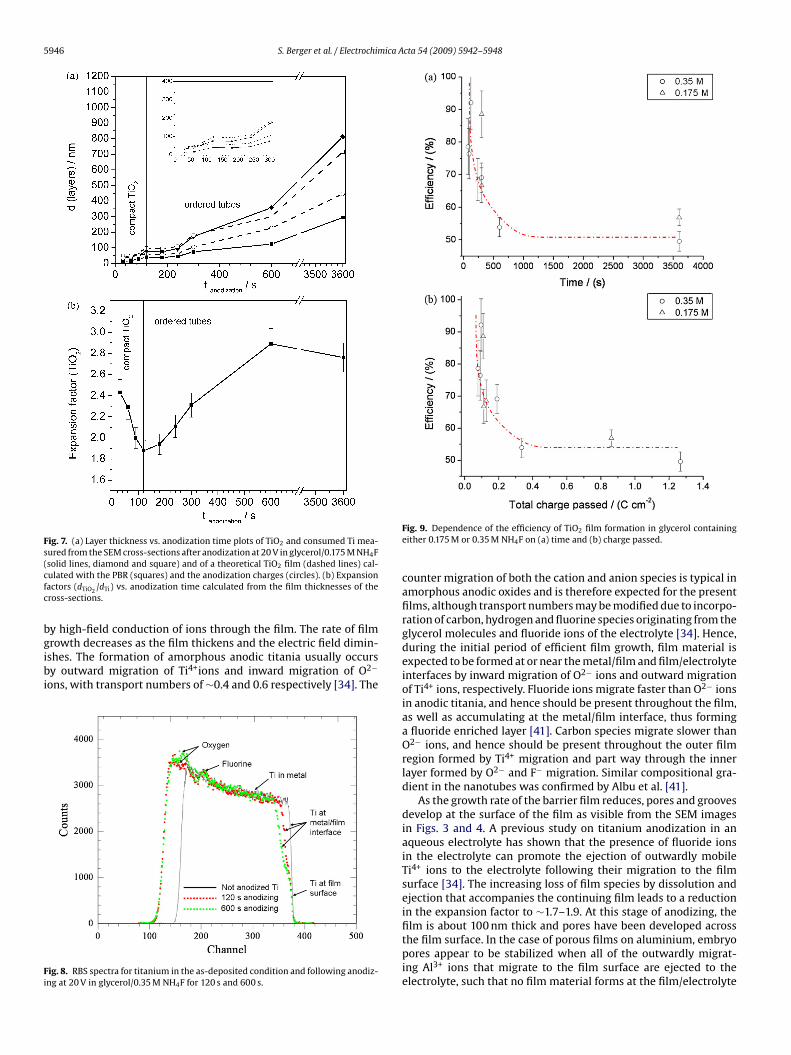
f these figures respectively. The dashed lines depict the plane ofhe non-anodized surface that was protected by photoresist duringnodizing. The ratio of the film thickness to that of the consumeditanium, subsequently referred to as the expansion factor, changesignificantly as the films thicken. The expansion factor was deter-ined at each growth step using the procedure illustrated in Fig. 5,
n which a dashed line marks the metal/film interface and arrowshow the thicknesses used to determine the expansion factors, i.e.lm of 481 nm and consumed titanium of 167 nm. The results of
he measurements, shown in Figs. 6 and 7, are compared with thehickness of a compact film calculated from (i) the thickness ofonsumed titanium, using a Pilling–Bedworth ratio (PBR) for amor-hous anodic titania of 2.43 [38,39] (dashed line, empty squares),nd (ii) from the anodizing charge per unit area of exposed titanium,cta 54 (2009) 5942–5948
Q (dashed line, empty circles). The thickness, L, determined from(ii), was obtained from Faraday’s law, assuming electrochemicaloxidation to be a four electron reaction with 100% current efficiencyi.e.
L = QM(TiO2)�(TiO2)4F
(1)
in which M(TiO2) is the molar mass of TiO2 (79.88 g), �(TiO2) isthe density of amorphous TiO2, (3.1 g cm−3) [40] and F is the Fara-day constant. The plots depicting the film thickness calculated from(i) and (ii) show similar curvature (dashed lines), with (ii) gen-erally yielding smaller values. In comparison, the measured filmthicknesses increase during the first 75 s and 120 s for 0.35 M and0.175 M NH4F respectively (Fig. 7a); following slight decreases, fur-ther increases follow after ∼90 s and 180 s. The films exceed thethicknesses of (i) and (ii) after 245 s and 345 s. For both electrolytes,the measured and calculated curves merge for times ≤90 s. How-ever, films are significantly thicker than the calculated values atincreased times.
Figs. 6b and 7b show the expansion factors as a function ofanodizing time for glycerol/0.35 M NH4F and glycerol/0.175 M NH4F(solid lines), respectively. For the 0.35 M NH4F electrolyte, the ini-tial factor, ∼2.4, decreases to a minimum of ∼1.7 after 75 s and thenincreases steeply after ∼120 s. For the 0.175 M NH4F electrolyte, aminimum of ∼1.9 is reached at ∼120 s, when a less steep increasebegins. In the longer term, the expansion factors reach the range2.7–3.1 for both electrolytes, exceeding the PBR (2.43) after 255 s(0.35 M NH4F) and after 362 s (0.175 M NH4F). These times are sim-ilar to those obtained from Figs 6a and 7a, namely 245 s and 345 s.
Further information, i.e. composition and growth efficiency ofthe anodic films were obtained by RBS measurements. The effi-ciency of film growth has been determined for anodizing in bothelectrolytes. The titanium is assumed to be present in the film asTi4+ ions; the number of Ti4+ ions is quantified by RBS. The effi-ciency equals the ratio of the charge of the Ti4+ ions in the anodicfilm to the charge passed in forming the film determined from thecharge density–time responses. Fig. 8 shows typical spectra at vari-ous stages of film growth in the electrolyte containing 0.35 M NH4F.The spectra were very similar for the increased concentration offluoride in the electrolyte. The presence of titanium, oxygen andfluorine species in the films is indicated. The oxygen and fluorinesignals are superimposed upon the yield from titanium. The tita-nium in the film corresponds to the step in the leading edge of thetitanium yield. The width of the step increases as film thickens, andhence the amount of titanium in the film increases. A signal fromcarbon species, at about channel 118, could not be resolved fromthe yield from the titanium substrate. Further, any hydrogen speciescannot be detected by the analysis. Simulated spectra were fittedto the experimental spectra using a film composition incorporat-ing of all these species. The RBS data were interpreted assuming afilm composition of Ti1O1.64–1.95F0.35–0.67C0.01–0.03H0.03–0.08, whichis similar to that found previously for nanotubular films formedunder conditions close to those of the present study [34]. The deter-mination of the number of Ti4+ ions in the film is not significantlyaffected by the precise ratios of oxygen, fluorine and carbon species.Fig. 9 shows the relationship between the efficiency and the time ofanodizing (a) as well as the charge passed in forming the films (b).
a value of about 55–60% when the main nanotubes are established.The latter efficiency is in agreement with a previous measurementof efficiency made for the formation of nanotubes. The efficiencyis not significantly influenced by the difference in concentration offluoride ions in the two electrolytes.
S. Berger et al. / Electrochimica Acta 54 (2009) 5942–5948 5945
a) glycerol/0.35 M NH4F and (b) glycerol/0.175 M NH4F.
4
mstSibFftdgfrie
Fam(
Fig. 4. Growth sequence of TiO2 on Ti at 20 V in (
. Discussion
The presented results obtained by the photoresist-maskingethod, e.g. oxide expansion factors and detailed morphological
tates of nanotube formation, are discussed regarding the addi-ional information gained from RBS efficiency calculations. TheEM images shown in Figs. 3 and 4 clearly illustrate that anodiz-ng of titanium at 20 V in the glycerol/NH4F electrolytes proceedsy initial formation of a compact barrier film. As visible fromigs. 6 and 7, the compact layer grows with an oxide expansionactor of approximately 2.4 and is not significantly influenced byhe fluoride concentration. The corresponding efficiencies can beeduced from Fig. 9 to be around 90%, which confirms the initialrowth of a compact oxide layer at comparable high efficiencies. The
ormation of the film at high efficiency correlates with the high cur-ent density achieved at the commencement of anodizing as shownn Fig. 2. The application of the voltage to the titanium sample gen-rates a high electric field across the air-formed film, which growsig. 5. SEM cross-section of TiO2 nanotubes on sputter deposited Ti after 600 s ofnodization at 20 V. The dashed line labels the interface oxide/metal. The arrowsark the layer thicknesses of the consumed Ti (167 nm) and the formed TiO2
481 nm).
Fig. 6. (a) Layer thickness vs. anodization time plots of TiO2 and consumed Ti mea-sured from the SEM cross-sections after anodization at 20 V in glycerol/0.35 M NH4F(solid lines, diamond and square) and of a theoretical TiO2 film (dashed lines) cal-culated with the PBR (squares) and the anodization charges (circles). (b) Expansionfactors (dTiO2
/dTi) vs. anodization time calculated from the film thicknesses of thecross-sections. Section I: compact TiO2, Section II: etching grooves, and Section III:ordered tubes.
5946 S. Berger et al. / Electrochimica Acta 54 (2009) 5942–5948
Fig. 7. (a) Layer thickness vs. anodization time plots of TiO2 and consumed Ti mea-sured from the SEM cross-sections after anodization at 20 V in glycerol/0.175 M NH4F(cfc
bgibi
Fi
solid lines, diamond and square) and of a theoretical TiO2 film (dashed lines) cal-ulated with the PBR (squares) and the anodization charges (circles). (b) Expansionactors (dTiO2
/dTi) vs. anodization time calculated from the film thicknesses of theross-sections.
y high-field conduction of ions through the film. The rate of film
rowth decreases as the film thickens and the electric field dimin-shes. The formation of amorphous anodic titania usually occursy outward migration of Ti4+ions and inward migration of O2−ons, with transport numbers of ∼0.4 and 0.6 respectively [34]. The
ig. 8. RBS spectra for titanium in the as-deposited condition and following anodiz-ng at 20 V in glycerol/0.35 M NH4F for 120 s and 600 s.
Fig. 9. Dependence of the efficiency of TiO2 film formation in glycerol containingeither 0.175 M or 0.35 M NH4F on (a) time and (b) charge passed.
counter migration of both the cation and anion species is typical inamorphous anodic oxides and is therefore expected for the presentfilms, although transport numbers may be modified due to incorpo-ration of carbon, hydrogen and fluorine species originating from theglycerol molecules and fluoride ions of the electrolyte [34]. Hence,during the initial period of efficient film growth, film material isexpected to be formed at or near the metal/film and film/electrolyteinterfaces by inward migration of O2− ions and outward migrationof Ti4+ ions, respectively. Fluoride ions migrate faster than O2− ionsin anodic titania, and hence should be present throughout the film,as well as accumulating at the metal/film interface, thus forminga fluoride enriched layer [41]. Carbon species migrate slower thanO2− ions, and hence should be present throughout the outer filmregion formed by Ti4+ migration and part way through the innerlayer formed by O2− and F− migration. Similar compositional gra-dient in the nanotubes was confirmed by Albu et al. [41].
As the growth rate of the barrier film reduces, pores and groovesdevelop at the surface of the film as visible from the SEM imagesin Figs. 3 and 4. A previous study on titanium anodization in anaqueous electrolyte has shown that the presence of fluoride ionsin the electrolyte can promote the ejection of outwardly mobileTi4+ ions to the electrolyte following their migration to the filmsurface [34]. The increasing loss of film species by dissolution andejection that accompanies the continuing film leads to a reductionin the expansion factor to ∼1.7–1.9. At this stage of anodizing, thefilm is about 100 nm thick and pores have been developed across
the film surface. In the case of porous films on aluminium, embryopores appear to be stabilized when all of the outwardly migrat-ing Al3+ ions that migrate to the film surface are ejected to theelectrolyte, such that no film material forms at the film/electrolyte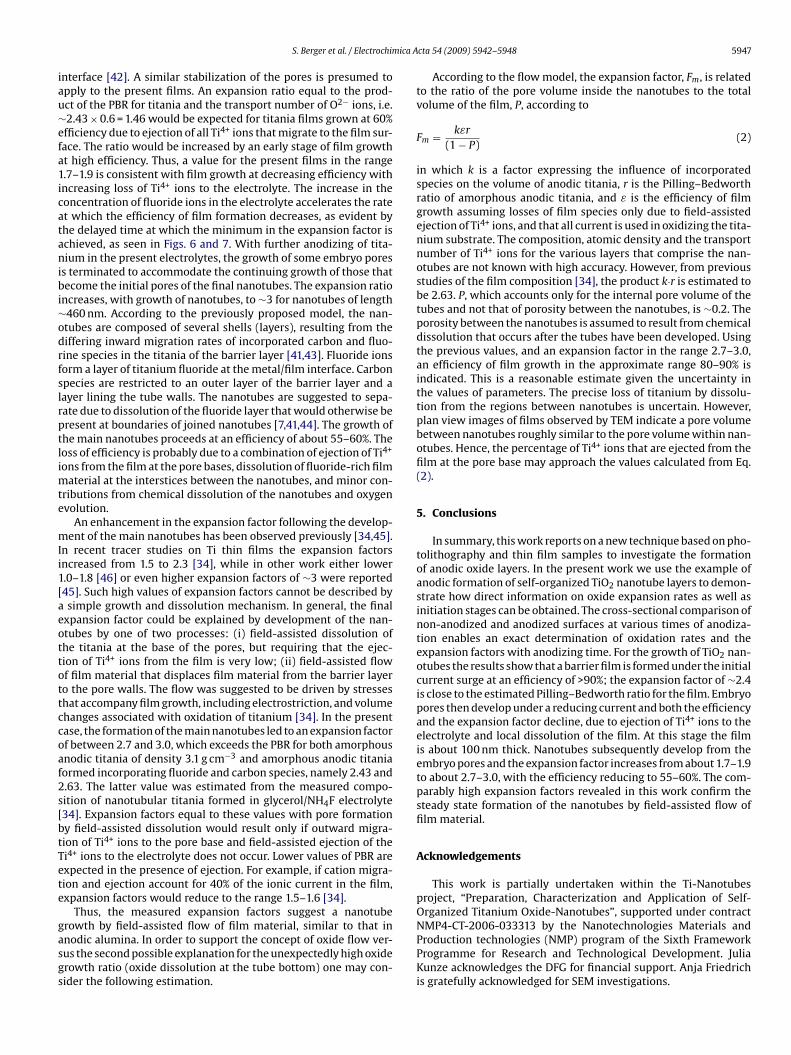
ica A
iau∼efa1icatanibi∼odrfslrptlimte
mIi1[aeottottccoaf2s[btTete
gasgs
project, “Preparation, Characterization and Application of Self-Organized Titanium Oxide-Nanotubes”, supported under contract
S. Berger et al. / Electrochim
nterface [42]. A similar stabilization of the pores is presumed topply to the present films. An expansion ratio equal to the prod-ct of the PBR for titania and the transport number of O2− ions, i.e.2.43 × 0.6 = 1.46 would be expected for titania films grown at 60%fficiency due to ejection of all Ti4+ ions that migrate to the film sur-ace. The ratio would be increased by an early stage of film growtht high efficiency. Thus, a value for the present films in the range.7–1.9 is consistent with film growth at decreasing efficiency withncreasing loss of Ti4+ ions to the electrolyte. The increase in theoncentration of fluoride ions in the electrolyte accelerates the ratet which the efficiency of film formation decreases, as evident byhe delayed time at which the minimum in the expansion factor ischieved, as seen in Figs. 6 and 7. With further anodizing of tita-ium in the present electrolytes, the growth of some embryo pores
s terminated to accommodate the continuing growth of those thatecome the initial pores of the final nanotubes. The expansion ratio
ncreases, with growth of nanotubes, to ∼3 for nanotubes of length460 nm. According to the previously proposed model, the nan-tubes are composed of several shells (layers), resulting from theiffering inward migration rates of incorporated carbon and fluo-ine species in the titania of the barrier layer [41,43]. Fluoride ionsorm a layer of titanium fluoride at the metal/film interface. Carbonpecies are restricted to an outer layer of the barrier layer and aayer lining the tube walls. The nanotubes are suggested to sepa-ate due to dissolution of the fluoride layer that would otherwise beresent at boundaries of joined nanotubes [7,41,44]. The growth ofhe main nanotubes proceeds at an efficiency of about 55–60%. Theoss of efficiency is probably due to a combination of ejection of Ti4+
ons from the film at the pore bases, dissolution of fluoride-rich filmaterial at the interstices between the nanotubes, and minor con-
ributions from chemical dissolution of the nanotubes and oxygenvolution.
An enhancement in the expansion factor following the develop-ent of the main nanotubes has been observed previously [34,45].
n recent tracer studies on Ti thin films the expansion factorsncreased from 1.5 to 2.3 [34], while in other work either lower.0–1.8 [46] or even higher expansion factors of ∼3 were reported45]. Such high values of expansion factors cannot be described bysimple growth and dissolution mechanism. In general, the final
xpansion factor could be explained by development of the nan-tubes by one of two processes: (i) field-assisted dissolution ofhe titania at the base of the pores, but requiring that the ejec-ion of Ti4+ ions from the film is very low; (ii) field-assisted flowf film material that displaces film material from the barrier layero the pore walls. The flow was suggested to be driven by stresseshat accompany film growth, including electrostriction, and volumehanges associated with oxidation of titanium [34]. In the presentase, the formation of the main nanotubes led to an expansion factorf between 2.7 and 3.0, which exceeds the PBR for both amorphousnodic titania of density 3.1 g cm−3 and amorphous anodic titaniaormed incorporating fluoride and carbon species, namely 2.43 and.63. The latter value was estimated from the measured compo-ition of nanotubular titania formed in glycerol/NH4F electrolyte34]. Expansion factors equal to these values with pore formationy field-assisted dissolution would result only if outward migra-ion of Ti4+ ions to the pore base and field-assisted ejection of thei4+ ions to the electrolyte does not occur. Lower values of PBR arexpected in the presence of ejection. For example, if cation migra-ion and ejection account for 40% of the ionic current in the film,xpansion factors would reduce to the range 1.5–1.6 [34].
Thus, the measured expansion factors suggest a nanotube
rowth by field-assisted flow of film material, similar to that innodic alumina. In order to support the concept of oxide flow ver-us the second possible explanation for the unexpectedly high oxiderowth ratio (oxide dissolution at the tube bottom) one may con-ider the following estimation.cta 54 (2009) 5942–5948 5947
According to the flow model, the expansion factor, Fm, is relatedto the ratio of the pore volume inside the nanotubes to the totalvolume of the film, P, according to
Fm = kεr
(1 − P)(2)
in which k is a factor expressing the influence of incorporatedspecies on the volume of anodic titania, r is the Pilling–Bedworthratio of amorphous anodic titania, and ε is the efficiency of filmgrowth assuming losses of film species only due to field-assistedejection of Ti4+ ions, and that all current is used in oxidizing the tita-nium substrate. The composition, atomic density and the transportnumber of Ti4+ ions for the various layers that comprise the nan-otubes are not known with high accuracy. However, from previousstudies of the film composition [34], the product k·r is estimated tobe 2.63. P, which accounts only for the internal pore volume of thetubes and not that of porosity between the nanotubes, is ∼0.2. Theporosity between the nanotubes is assumed to result from chemicaldissolution that occurs after the tubes have been developed. Usingthe previous values, and an expansion factor in the range 2.7–3.0,an efficiency of film growth in the approximate range 80–90% isindicated. This is a reasonable estimate given the uncertainty inthe values of parameters. The precise loss of titanium by dissolu-tion from the regions between nanotubes is uncertain. However,plan view images of films observed by TEM indicate a pore volumebetween nanotubes roughly similar to the pore volume within nan-otubes. Hence, the percentage of Ti4+ ions that are ejected from thefilm at the pore base may approach the values calculated from Eq.(2).
5. Conclusions
In summary, this work reports on a new technique based on pho-tolithography and thin film samples to investigate the formationof anodic oxide layers. In the present work we use the example ofanodic formation of self-organized TiO2 nanotube layers to demon-strate how direct information on oxide expansion rates as well asinitiation stages can be obtained. The cross-sectional comparison ofnon-anodized and anodized surfaces at various times of anodiza-tion enables an exact determination of oxidation rates and theexpansion factors with anodizing time. For the growth of TiO2 nan-otubes the results show that a barrier film is formed under the initialcurrent surge at an efficiency of >90%; the expansion factor of ∼2.4is close to the estimated Pilling–Bedworth ratio for the film. Embryopores then develop under a reducing current and both the efficiencyand the expansion factor decline, due to ejection of Ti4+ ions to theelectrolyte and local dissolution of the film. At this stage the filmis about 100 nm thick. Nanotubes subsequently develop from theembryo pores and the expansion factor increases from about 1.7–1.9to about 2.7–3.0, with the efficiency reducing to 55–60%. The com-parably high expansion factors revealed in this work confirm thesteady state formation of the nanotubes by field-assisted flow offilm material.
Acknowledgements
This work is partially undertaken within the Ti-Nanotubes
NMP4-CT-2006-033313 by the Nanotechnologies Materials andProduction technologies (NMP) program of the Sixth FrameworkProgramme for Research and Technological Development. JuliaKunze acknowledges the DFG for financial support. Anja Friedrichis gratefully acknowledged for SEM investigations.
5 ica A
R
[
[
[[
[
[[
[
[
[
[
[[
[[[
[[
[
[
[[[[[
[
[
[
[[[
[
[
948 S. Berger et al. / Electrochim
eferences
[1] H. Masuda, K. Fukuda, Science 268 (1995) 1644.[2] V. Zwilling, M. Aucouturier, E. Darque-Ceretti, Electrochim. Acta 45 (1999) 921.[3] J.M. Macak, H. Tsuchiya, L. Taveira, S. Alderbergova, P. Schmuki, Angew. Chem.
Int. Ed. 44 (2005) 7463.[4] J.M. Macak, K. Sirotna, P. Schmuki, Electrochim. Acta 45 (2005) 3679.[5] J.M. Macak, H. Tsuchiya, P. Schmuki, Angew. Chem. Int. Ed. 44 (2005) 2100.[6] J.M. Macak, H. Tsuchiya, A. Ghicov, K. Yasuda, R. Hahn, S. Bauer, P. Schmuki, Curr.
Opin. Sol. State Mater. Sci. 11 (2007) 3.[7] A. Ghicov, P. Schmuki, Chem. Commun. doi:10.1039/b822726h (2009), 2791.[8] J.M. Macak, P.J. Barczuk, H. Tsuchiya, M.Z. Nowakowska, A. Ghicov, A. Chojak, S.
Bauer, S. Virtanen, P.J. Kulesza, P. Schmuki, Electrochem. Commun. 7 (2005) 9.[9] J.M. Macak, M. Zlamal, J. Krysa, P. Schmuki, Small 3 (2) (2007) 300.10] J.M. Macak, F. Schmidt-Stein, P. Schmuki, Electrochem. Commun. 9 (7) (2007)
1783.11] O.K. Varghese, D. Gong, M. Paulose, K.G. Ong, C.A. Grimes, Sens. Actuators B 93
(1–3) (2003) 338.12] E. Balaur, J.M. Macak, H. Tsuchiya, P. Schmuki, J. Mater. Chem. 15 (2005) 4488.13] E. Balaur, J.M. Macak, L. Taveira, P. Schmuki, Electrochem. Commun. 7 (2005)
1066.14] H. Tsuchiya, J.M. Macak, L. Mueller, J. Kunze, F. Mueller, P. Greil, S. Virtanen, P.
Schmuki, J. Biomed. Mater. Res. Part A 77A (2006) 534.15] J. Park, S. Bauer, K.vd. Mark, P. Schmuki, Nano Lett. 7 (6) (2007) 1686.16] A. Ghicov, H. Tsuchiya, R. Hahn, J.M. Macak, A.G. Munoz, P. Schmuki, Elec-
trochem. Commun. 8 (2005) 528.17] R. Hahn, A. Ghicov, H. Tsuchiya, J.M. Macak, A.G. Munoz, P. Schmuki, Phys. Stat.
Sol. (a) 204 (5) (2007) 1281.18] J.R. Jennings, A. Ghicov, L.M. Peter, P. Schmuki, A.B. Walker, J. Am. Chem. Soc.
130 (40) (2008) 13364.19] J.M. Macak, H. Tsuchiya, A. Ghicov, P. Schmuki, Electrochem. Commun. 7 (2006)
1133.
20] R. Hahn, T. Stergiopoulus, J.M. Macak, D. Tsoukleris, A.G. Kontos, S.P. Albu, D.Kim, A. Ghicov, J. Kunze, P. Falaras, P. Schmuki, Phys. Stat. Sol. (RRL) 1 (4) (2007)135.
21] D. Kim, A. Ghicov, S.P. Albu, P. Schmuki, J. Am. Chem. Soc. 130 (49) (2008) 16454.22] A. Ghicov, B. Schmidt, J. Kunze, P. Schmuki, Chem. Phys. Lett. 433 (4–6) (2007)
323.
[
[
[
cta 54 (2009) 5942–5948
23] S.P. Albu, A. Ghicov, J.M. Macak, P. Schmuki, Phys. Stat. Sol. (RRL) 2 (2007) R65.24] S. Bauer, S. Kleber, P. Schmuki, Electrochem. Commun. 8 (2006) 1321.25] S.P. Albu, A. Ghicov, J.M. Macak, R. Hahn, P. Schmuki, Nano Lett. 7 (2007)
1286.26] S.P. Albu, D. Kim, P. Schmuki, Angew. Chem. Int. Ed. 47 (2008) 1916.27] A. Ghicov, J.M. Macak, H. Tsuchiya, J. Kunze, V. Haeublein, L. Frey, P. Schmuki,
Nano Lett. 6 (2006) 1080.28] J.P. O’Sullivan, G.C. Wood, Proc. Roy. Soc. Ser. A: Math. Phys. Sci. 317 (1731) (1970)
511.29] P. Skeldon, G.E. Thompson, S.J. Garcia-Vergara, L. Iglesias-Rubianes, C.E. Blanco-
Pinzon, Electrochem. Sol. State Lett. 9 (11) (2006) B47.30] J.E. Houser, K.R. Hebert, Phys. Stat. Sol. A 205 (10) (2008) 2396.31] D.H. Bradhurst, J.S. Llewelyn Leach, J. Electrochem. Soc. 113 (1966) 1245.32] K.S. Raja, M. Misra, K. Paramguru, Electrochim. Acta 51 (2005) 154.33] T.P. Hoar, N.F. Mott, J. Phys. Chem. Sol. 9 (1959) 97.34] D.J. LeClere, A. Valota, P. Skeldon, G.E. Thompson, S. Berger, J. Kunze, P. Schmuki,
H. Habazaki, S. Nagata, J. Electrochem. Soc. 155 (9) (2008) C487.35] L.V. Taveira, J.M. Macak, H. Tsuchiya, L.F.P. Dick, P. Schmuki, J. Electrochem. Soc.
152 (2005) B405.36] K. Yasuda, J.M. Macak, S. Berger, A. Ghicov, P. Schmuki, J. Electrochem. Soc. 154
(2007) C472.37] A. Seyeux, S. Berger, D.J. LeClere, A. Valota, P. Skeldon, G.E. Thompson, J. Kunze,
P. Schmuki, J. Electrochem. Soc. 156 (2009) K17.38] N.B. Pillings, R.E. Bedworth, J. Inst. Metals 29 (1923) 529.39] J.C. Nelson, R.A. Oriani, Corr. Sci. 34 (2) (1993) 307.40] H. Habazaki, M. Uozumi, H. Konno, K. Shimizu, S. Nagata, K. Takayama, Y. Oda,
P. Skeldon, G.E. Thompson, J. Electrochem. Soc. 152 (2005) B263.[41] S.P. Albu, A. Ghicov, S. Aldabergenova, P. Drechsel, D.J. LeClere, G.E. Thompson,
J.M. Macak, P. Schmuki, Adv. Mater. 20 (21) (2008) 4135.42] G.E. Thompson, Y. Xu, P. Skeldon, K. Shimizu, S.H. Han, G.C. Wood, Philos. Mag.
B 55 (1987) 651.43] A. Valota, D.J. LeClere, T. Hashimoto, P. Skeldon, G.E. Thompson, S. Berger, J.
Kunze, P. Schmuki, Nanotechnology 19 (35) (2008) 355701.44] A. Valota, D.J. LeClere, P. Skeldon, M. Curioni, T. Hashimoto, S. Berger, J. Kunze,
P. Schmuki, G.E. Thompson, Electrochim. Acta 54 (18) (2009) 4321.45] S. Berger, J.M. Macak, J. Kunze, P. Schmuki, Electrochem. Sol. State Lett. 11 (7)
(2008) C37.46] D.-J. Yang, H.-G. Kim, S.-J. Cho, W.-Y. Choi, Mater. Lett. 62 (2008) 775.