Points of Interest and Visual Dictionaries for Automatic Retinal Lesion Detection
10
2244 IEEE TRANSACTIONS ON BIOMEDICAL ENGINEERING, VOL. 59, NO. 8, AUGUST 2012 Points of Interest and Visual Dictionaries for Automatic Retinal Lesion Detection Anderson Rocha ∗ , Member, IEEE, Tiago Carvalho, Herbert F. Jelinek, Member, IEEE, Siome Goldenstein, Senior Member, IEEE, and Jacques Wainer Abstract—In this paper, we present an algorithm to detect the presence of diabetic retinopathy (DR)-related lesions from fundus images based on a common analytical approach that is capable of identifying both red and bright lesions without requiring specific pre- or postprocessing. Our solution constructs a visual word dic- tionary representing points of interest (PoIs) located within regions marked by specialists that contain lesions associated with DR and classifies the fundus images based on the presence or absence of these PoIs as normal or DR-related pathology. The novelty of our approach is in locating DR lesions in the optic fundus images using visual words that combines feature information contained within the images in a framework easily extendible to different types of retinal lesions or pathologies and builds a specific projection space for each class of interest (e.g., white lesions such as exudates or normal regions) instead of a common dictionary for all classes. The visual words dictionary was applied to classifying bright and red lesions with classical cross validation and cross dataset valida- tion to indicate the robustness of this approach. We obtained an area under the curve (AUC) of 95.3% for white lesion detection and an AUC of 93.3% for red lesion detection using fivefold cross validation and our own data consisting of 687 images of normal retinae, 245 images with bright lesions, 191 with red lesions, and 109 with signs of both bright and red lesions. For cross dataset analysis, the visual dictionary also achieves compelling results us- ing our images as the training set and the RetiDB and Messidor images as test sets. In this case, the image classification resulted in an AUC of 88.1% when classifying the RetiDB dataset and in an AUC of 89.3% when classifying the Messidor dataset, both cases for bright lesion detection. The results indicate the potential for training with different acquisition images under different setup conditions with a high accuracy of referral based on the presence of either red or bright lesions or both. The robustness of the visual dictionary against image quality (blurring), resolution, and retinal background, makes it a strong candidate for DR screening of large, diverse communities with varying cameras and settings and levels of expertise for image capture. Index Terms—Diabetic retinopathy (DR), diabetes automated screening, hard exudate detection, hemorrhage detection, microa- neurysm detection, red and bright lesion classification, visual dictionaries. Manuscript received December 26, 2011; revised April 9, 2012; accepted May 19, 2012. Date of publication May 30, 2012; date of current version July 18, 2012. This work was supported by the Microsoft Research and Fapesp. Asterisk indicates corresponding author. ∗ A. Rocha is with the Institute of Computing, University of Campinas (Uni- camp), Campinas 13083-852, Brazil (e-mail [email protected]). T. Carvalho, S. Goldenstein, and J. Wainer are with the Institute of Comput- ing, University of Campinas (Unicamp), Campinas 13083-852, Brazil (e-mail [email protected]; [email protected]; [email protected]). H. F. Jelinek is with the Centre for Research in Complex Systems, Charles Sturt University, N.S.W. 2830, Australia, and also with the Australian School of Advanced Medicine, Macquarie University, N.S.W. 2113, Australia (e-mail [email protected]). Color versions of one or more of the figures in this paper are available online at http://ieeexplore.ieee.org. Digital Object Identifier 10.1109/TBME.2012.2201717 I. INTRODUCTION D IABETIC retinopathy (DR) is the result of microvascular retinal changes triggered by diabetes that can lead to a complete loss of sight if not treated in a timely manner. Recent reports have shown that approximately 25 000 people with dia- betes go blind every year in the U.S. due to DR [1]. According to [1], in the U.S. and Europe, DR is the major cause of blindness for the economically active population and, according to [2], it is estimated that DR is responsible for 5% of all the world’s blindness cases. Early diagnosis of DR and treatment [3] can prevent blind- ness, and therefore, systematic screening (by specialists) of di- abetic patients is a cost-effective health care practice [4]. How- ever, due to the large number of people that require screening and annual reviews, an automated and accurate screening tool is a useful adjunct in diabetes clinics. Currently, several highly accurate programs exist for automated detection of specific DR- related lesions [5]–[7]. These algorithms require different pre- and postprocessing steps of the retinal images depending on the lesion of interest as well as corrections for resolution and color normalization to account for images with different fields of view and ethnicity [8]. The presence of microaneurysms and dot hemorrhages (red lesions) and/or hard exudates (bright lesions) are indicative of early stage DR. Fig. 1(a) depicts one example with the main retinal regions highlighted. Microaneurysms are focal dilata- tions of retinal capillaries [see Fig. 1(b)] and have an appearance similar to red dots in these images. Intraretinal lipid exudates (hard exudates) are caused by the breakdown of the blood- retinal barrier, which leads to fluid rich in lipids and proteins to leave the parenchyma, causing retinal edema and exudation [see Fig. 1(c)]. Finally, dot hemorrhages are similar to microa- neurysms but slightly larger and are found where capillary walls weaken. These may rupture causing intraretinal hemorrhages [see Fig. 1(d)]. Automated bright lesion detection has resulted in highly accu- rate classification and has been discussed recently by [9]–[11]. For automated red lesion detection similar high sensitivity and specificity has been reported. The Iowa retinopathy online chal- lenge published results by five research groups using different algorithms for pre- and postprocessing and detection of microa- neurysms [12]. More recent results reported by Niemeijer and colleagues including Giancardo et al. [5] and the group led by Antal et al. [6] have shown a further improvement. Addressing the detection of multiple DR-related lesions, Abr` amoff and coworkers combined several different lesion- specific detectors into a single automatic detection program and 0018-9294/$31.00 © 2012 IEEE
-
Upload
independent -
Category
Documents
-
view
0 -
download
0
Transcript of Points of Interest and Visual Dictionaries for Automatic Retinal Lesion Detection

2244 IEEE TRANSACTIONS ON BIOMEDICAL ENGINEERING, VOL. 59, NO. 8, AUGUST 2012
Points of Interest and Visual Dictionariesfor Automatic Retinal Lesion DetectionAnderson Rocha∗, Member, IEEE, Tiago Carvalho, Herbert F. Jelinek, Member, IEEE,
Siome Goldenstein, Senior Member, IEEE, and Jacques Wainer
Abstract—In this paper, we present an algorithm to detect thepresence of diabetic retinopathy (DR)-related lesions from fundusimages based on a common analytical approach that is capable ofidentifying both red and bright lesions without requiring specificpre- or postprocessing. Our solution constructs a visual word dic-tionary representing points of interest (PoIs) located within regionsmarked by specialists that contain lesions associated with DR andclassifies the fundus images based on the presence or absence ofthese PoIs as normal or DR-related pathology. The novelty of ourapproach is in locating DR lesions in the optic fundus images usingvisual words that combines feature information contained withinthe images in a framework easily extendible to different types ofretinal lesions or pathologies and builds a specific projection spacefor each class of interest (e.g., white lesions such as exudates ornormal regions) instead of a common dictionary for all classes.The visual words dictionary was applied to classifying bright andred lesions with classical cross validation and cross dataset valida-tion to indicate the robustness of this approach. We obtained anarea under the curve (AUC) of 95.3% for white lesion detectionand an AUC of 93.3% for red lesion detection using fivefold crossvalidation and our own data consisting of 687 images of normalretinae, 245 images with bright lesions, 191 with red lesions, and109 with signs of both bright and red lesions. For cross datasetanalysis, the visual dictionary also achieves compelling results us-ing our images as the training set and the RetiDB and Messidorimages as test sets. In this case, the image classification resulted inan AUC of 88.1% when classifying the RetiDB dataset and in anAUC of 89.3% when classifying the Messidor dataset, both casesfor bright lesion detection. The results indicate the potential fortraining with different acquisition images under different setupconditions with a high accuracy of referral based on the presenceof either red or bright lesions or both. The robustness of the visualdictionary against image quality (blurring), resolution, and retinalbackground, makes it a strong candidate for DR screening of large,diverse communities with varying cameras and settings and levelsof expertise for image capture.
Index Terms—Diabetic retinopathy (DR), diabetes automatedscreening, hard exudate detection, hemorrhage detection, microa-neurysm detection, red and bright lesion classification, visualdictionaries.
Manuscript received December 26, 2011; revised April 9, 2012; acceptedMay 19, 2012. Date of publication May 30, 2012; date of current version July18, 2012. This work was supported by the Microsoft Research and Fapesp.Asterisk indicates corresponding author.
∗A. Rocha is with the Institute of Computing, University of Campinas (Uni-camp), Campinas 13083-852, Brazil (e-mail [email protected]).
T. Carvalho, S. Goldenstein, and J. Wainer are with the Institute of Comput-ing, University of Campinas (Unicamp), Campinas 13083-852, Brazil ([email protected]; [email protected]; [email protected]).
H. F. Jelinek is with the Centre for Research in Complex Systems, CharlesSturt University, N.S.W. 2830, Australia, and also with the Australian Schoolof Advanced Medicine, Macquarie University, N.S.W. 2113, Australia ([email protected]).
Color versions of one or more of the figures in this paper are available onlineat http://ieeexplore.ieee.org.
Digital Object Identifier 10.1109/TBME.2012.2201717
I. INTRODUCTION
D IABETIC retinopathy (DR) is the result of microvascularretinal changes triggered by diabetes that can lead to a
complete loss of sight if not treated in a timely manner. Recentreports have shown that approximately 25 000 people with dia-betes go blind every year in the U.S. due to DR [1]. Accordingto [1], in the U.S. and Europe, DR is the major cause of blindnessfor the economically active population and, according to [2], itis estimated that DR is responsible for 5% of all the world’sblindness cases.
Early diagnosis of DR and treatment [3] can prevent blind-ness, and therefore, systematic screening (by specialists) of di-abetic patients is a cost-effective health care practice [4]. How-ever, due to the large number of people that require screeningand annual reviews, an automated and accurate screening toolis a useful adjunct in diabetes clinics. Currently, several highlyaccurate programs exist for automated detection of specific DR-related lesions [5]–[7]. These algorithms require different pre-and postprocessing steps of the retinal images depending on thelesion of interest as well as corrections for resolution and colornormalization to account for images with different fields of viewand ethnicity [8].
The presence of microaneurysms and dot hemorrhages (redlesions) and/or hard exudates (bright lesions) are indicative ofearly stage DR. Fig. 1(a) depicts one example with the mainretinal regions highlighted. Microaneurysms are focal dilata-tions of retinal capillaries [see Fig. 1(b)] and have an appearancesimilar to red dots in these images. Intraretinal lipid exudates(hard exudates) are caused by the breakdown of the blood-retinal barrier, which leads to fluid rich in lipids and proteinsto leave the parenchyma, causing retinal edema and exudation[see Fig. 1(c)]. Finally, dot hemorrhages are similar to microa-neurysms but slightly larger and are found where capillary wallsweaken. These may rupture causing intraretinal hemorrhages[see Fig. 1(d)].
Automated bright lesion detection has resulted in highly accu-rate classification and has been discussed recently by [9]–[11].For automated red lesion detection similar high sensitivity andspecificity has been reported. The Iowa retinopathy online chal-lenge published results by five research groups using differentalgorithms for pre- and postprocessing and detection of microa-neurysms [12]. More recent results reported by Niemeijer andcolleagues including Giancardo et al. [5] and the group led byAntal et al. [6] have shown a further improvement.
Addressing the detection of multiple DR-related lesions,Abramoff and coworkers combined several different lesion-specific detectors into a single automatic detection program and
0018-9294/$31.00 © 2012 IEEE

ROCHA et al.: POINTS OF INTEREST AND VISUAL DICTIONARIES FOR AUTOMATIC RETINAL LESION DETECTION 2245
suggested that a single algorithm that is able to identify multi-ple lesions is required [9]. Bright and red lesions have differentimage characteristics and, therefore, require different pre- andpostprocessing making automatic multilesion detection difficultin practice. A program that allows for multiple lesions to bedetected without requiring different processing of the imagesis an important step forward in the development of automaticretinal fundus assessment programs. Detecting the presence ofa specific lesion or multiple different lesions offers a solutionto improve the accuracy of detecting DR and correctly classi-fying images for the presence of either specific single lesionsor combinations thereof. Computer-based feature detection hasthe advantage of being able to utilize characteristics of imagesthat do not necessarily correspond to DR-related lesion charac-teristics but rather use features such as colorization of a regionof interest (RoI) [13] or discontinuities in the image such astexture, color, or boundaries [14].
In clinical practice, machine vision learning algorithms havebeen applied for screening of DR in the southern United Statesusing content-based image retrieval for automated diagnosis[15]. This system achieves a sensitivity of 94.8% and a speci-ficity of 78.7% with an area under the curve (AUC) of 95.3%but requires extensive pre- and postprocessing to differentiatebetween different stages of DR progression and type of lesions.Web-based applications of machine learning tools have alsobeen investigated to enhance the uptake of current automatedtechnologies [16].
This paper introduces an algorithm that addresses several ofthe aforementioned issues. The solution is based on a unifiedfeature detection and analysis framework that is capable of iden-tifying different DR-related lesions such as hard exudates andmicroaneurysms by correlating image specific features with thepresence of specific lesions without the necessity of pre- andpostprocessing of images. The approach utilizes experts to indi-cate RoIs containing specific lesions and then identifies points ofinterest (PoIs) within these regions that become “words” withina visual dictionary. Our approach extends previous work as itis independent of the image resolution, color space represen-tation, and amenable to detect different lesions other than justmicroaneurysms. Finally, our approach does not rely on any adhoc parameter (e.g., Gaussian standard deviations) nor does itassume any prespecific size of the lesions such as required bysome of the current microaneurysm detectors in the literature.
The visual word dictionary is based on measuring metrics atthe image level and does not follow a “decision-support tool”approach, where the system is used to aid diagnosis, as it isfound in most of the current methods. The decision-supportapproach requires pinpointing the location of each lesion toallow the specialist to evaluate the image for diagnosis. In thiscase, metrics based on the accuracy of detecting each type oflesion is more relevant. Using a visual words dictionary as thebasis for a classification algorithm was inspired by the computervision and image processing literature [17]–[21], where visualdictionaries and PoIs are used as a basis for several applicationssuch as image retrieval and classification.
Section II presents state-of-the-art achievements for auto-matic DR-related lesion detection. Section III introduces our
method. Section IV reports the experimental setup and the clas-sification results for different retinal datasets. Finally, Section Vconcludes this paper and discusses some considerations regard-ing directions for future work.
II. DETECTION OF DIABETIC RETINOPATHY LESION
A number of recent reviews on automatic retinal analysiswith emphasis on DR lesion detection have described some ofthe major research results in the area. Abramoff et al. [22] isa more general review in retinal image processing, while [23]and [24] are more specific to DR.
Most of the techniques used for automatic DR lesion detectionare based on specific segmentation or feature extraction tech-niques developed for identifying each specific lesion. Thesetechniques have been achieving increasing accuracy rates butnormally a technique developed for the detection of one kindof lesion cannot be directly used to detect another kind. Flem-ing and colleagues recently reported combining red and brightlesion detection by adapting their microaneurysm detector toidentify bright lesions but requiring separate processing of theimages depending on whether bright or red lesions detectionwas required [11].
Detection of bright or red lesions also relies heavily oncolor [25] and thus some color normalization is needed [5],[8]. Detecting microaneurysms requires additional processingto remove retinal blood vessels and the optic disk. Thus, detec-tion and removal of these structures is a necessary initial stepwhen single-lesion detection is required. Many of the automaticdetectors also use feature size (in terms of pixels) as a crite-rion [26] and, thus, require preprocessing due to confoundingby image resolution of the absolute pixel size. For these algo-rithms to function, training and test sets usually have to haveidentical resolution for the algorithm to function optimally. Aninteresting example is [27] that presents a microaneurysm de-tector trained on different images for detection in an optometryclinic.
Single-lesion detectors may also be sensitive to fundus imageswith white reflection that is present in retinae of the young [27].We refer the reader to the recent reviews [23] and [24] for moredetails on these techniques.
Including RoI for detection of lesions was reported by Agurtoet al. [28] and [26]. Agurto et al. used 120 regions of 40 × 40pixels representative of four types of lesions commonly as-sociated with DR (i.e., microaneurysms, exudates, neovascu-larization, and hemorrhages). The regions were characterizedusing texture descriptors at multiple scales (e.g., cumulativedistribution functions of the amplitude, frequency magnitude,and relative instantaneous frequency angle). Similar to Agurtoet al.’s approach the method described in this paper also usesregion characterization and performs multiscale analysis of theimages. Our work uses representative regions in the image toidentify lesions and creates a dictionary to capture commonproperties among such regions [26]. The main differences toAgurto et al.’s work is how the regions are characterized andthat our method does not specify a specific size for any of theRoIs.

2246 IEEE TRANSACTIONS ON BIOMEDICAL ENGINEERING, VOL. 59, NO. 8, AUGUST 2012
III. VISUAL DICTIONARIES FOR DR DETECTION
In this paper, we present a solution to classify DR-related le-sions based on the concept of selecting features around locallyinvariant interest points and visual dictionaries of images. Thisparadigm uses a set of highly extensible feature representations,and characterizes red and bright lesions in the optic fundus im-ages using visual words that incorporates information providedby specialists into a framework easily extendible to differenttypes of retinal abnormalities.
Two fundamental differences to previous work is that: 1) themethod builds a specific projection space for each class of inter-est (e.g., exudates or normal regions) instead of using a commondictionary for all classes; and 2) PoIs are only considered duringtraining if they fall within the regions in the fundus image high-lighted by the specialists rather than including all PoIs withinthe fundus images when training.
Visual dictionaries constitute a robust representation ap-proach as each image is treated as a collection of regions. Inthis representation, the only important information is the ap-pearance of each region [18]. Dictionary “words” are not in thespace of images (or patches of images), but at the space of fea-ture description of the “PoIs” in the image, with the PoIs locatedwithin the RoIs.
The objective when creating a visual dictionary is to learn,from a training set of examples, the optimal representative PoIsfor a given problem. The dictionary must be large enough todistinguish relevant differences between images but not includeirrelevant variations [29], [30]. Given a visual dictionary, an im-age can be represented according to the visual words it contains.
We can summarize the approach that we introduce in thispaper for DR-related lesion detection into two phases: trainingand detection. The training phase consists of learning the overallbehavior of the lesions of interest and what makes the imageswith lesions different to normal images. The detection phaseconsists of using the learned knowledge in an automatic fashionfor testing unknown images. Algorithm 1 presents the maintraining steps, while Algorithm 2 shows the detection procedure.The next sections present details about each step of the approachdescribed in the two algorithms.
A. Background
Identifying features around locally invariant interest pointswas originally developed for large baseline correspondence ap-plications and has recently been a focus of intense research forother applications. A few attempts have been made to apply thismodel for image retrieval and classification [19], [33]
The PoIs approach is based on the hypothesis that PoIs withinan image convey more information than other points and thatevery image in a collection can be represented using a largenumber of PoIs. It is then possible to calculate a local descriptoraround each PoI, and store these local descriptors in an indexingdata structure [34]. Local descriptors computed around PoIsare more robust in identifying subtle changes within imagescompared to global descriptors [19]–[21]. The advantage ofusing PoIs is that they can be robustly estimated, even if theimage suffers distortions as the major criterion of quality fora PoI algorithm is repeatability [34]. Robustness of this kindmight be interesting in retinal imagery since small changes canoccur during different equipment setup, motion blur, and smallgeometric distortions.
Although the discriminative power of the PoIs is an extremelyimportant attribute and advantageous to use when searching fora specific target, they are less than optimal when searchingfor complex categories as the ability to generalize becomesparamount. Therefore, alternative techniques combined withPoIs are required. A solution is to apply the concept of visualdictionaries, which considers the high-dimensional descriptorspaces associated with the PoIs and finds the ones that bestrepresent the whole set of PoIs by means of a nonsupervisedlearning technique (e.g., clustering).
The biggest challenge for developing an accurate algorithmis to design a good visual dictionary. The creation of the dic-tionary requires the quantization of the description space that isachieved using clustering approaches and including the infor-mation provided by the expert.
B. Identification of Points of Interest
The protocol we devised and followed for our tests are asfollows. To detect bright or red lesions, the specialists mark RoIswithin the retinal images are considered as good representativesof bright or red lesions. For normal/control images, the entireretinal region represented in the image can be considered aRoI. On average 2–5 RoIs for each training image with a given

ROCHA et al.: POINTS OF INTEREST AND VISUAL DICTIONARIES FOR AUTOMATIC RETINAL LESION DETECTION 2247
Fig. 1. Retina’s main regions as well as examples of DR-related pathologies.(a) Retina’s main regions. (b) Microaneurysms. (c) Intraretinal lipid exudates.(d) Hemorrhages.
DR-related lesion are marked by the specialists. The trainingstage then locates PoIs within all images. The parameters are agood tradeoff between classification accuracy and computationefficiency for finding good representative PoIs.
PoIs are found at discontinuities within the image, being ei-ther textural or containing some other boundary condition. It isdesirable to choose scale-invariant PoIs in order to achieve arepresentation that is robust to possible image transformations(e.g., rotations, scale, and partial occlusions). There are severaloptions for finding and characterizing PoIs such as Speeded-Up Robust Features (SURF) [35] and Scale-Invariant FeaturesTransform (SIFT) [32]. Both methods achieve high repeatabilityand distinctiveness. Empirically, we determined that the resultsusing SURF were somewhat better than the ones using SIFT;therefore, we present only results with SURF.
Using SURF, each image in the training set generates a seriesof PoIs as illustrated in Fig. 2. All of these PoIs are then filteredand only PoIs within the RoIs marked by the specialist are keptfor further processing. In Fig. 2, only the points lying within thedashed RoIs are kept. To cover the most important characteristicswithin an image, a reasonable number of PoIs need to be used.We have found that, normally, 1000 PoIs per image is optimalwithin 3–5 RoIs for the images with lesions. Once the PoIs inan image are found, their neighborhoods are characterized bymeans of a local descriptor.
In brief, SURF has two steps: detection of the PoIs and de-scription of these points. The detection is based on multiscaledecomposition of the image using the convolution of Gaussiansecond-order derivatives within the image, at different scales.The PoI characterization considers a square region of radius20s centered around the PoI, where s is the scale on which thepoint was detected. This square region is then split into regularsmaller 4 × 4 square subregions and, for each subregion, themethod computes a number of features (sums and differences)at 5 × 5 regularly spaced sample points.
The result of the SURF is a set of PoIs each one representedin n-dimensions. In this paper, we use each PoI with n = 128
Fig. 2. PoIs located by SURF (white circles) and the RoIs markings performedby a medical specialist (yellow dashed polygons).
dimensions. For more details about SURF, we refer the readerto [35].
C. Visual Dictionary
A database of training examples comprising positive images(i.e., images with bright or red lesions present) and negativecontrol images (i.e., considered normal by specialists) is created.
As described in Section III-A, SURF is a good low-levelrepresentative feature detector. To preserve the discriminatorypower of such descriptors found by SURF while increasingtheir generalization, the concept of visual dictionaries [30] canbe introduced.
After finding the PoIs, a dictionary representing distinctivefeatures of images with a specific lesion of interest as well asimages tagged as normal by specialists is created. An importantparameter for classification is the number of words k in thisdictionary. A k too low groups together too many PoIs into thesame visual word and looses the ability to distinguish importantinformation. A k too high memorizes the details of the PoIs in thetraining set and looses its ability to generalize. To achieve this,the clustering task is performed using the k-means algorithm[36] and all PoIs in normal images are clustered into k/2 groups,as are the PoIs in the RoI containing bright or red lesions.This results in a dictionary with k words. Applying k-meansclustering at this stage ensures that the visual dictionary has thesame number of normal and DR-related lesion words. However,it is not a strict requirement to have the same number of wordsfor control and DR-related lesions. We have experimental resultsshowing that, for some lesions, other proportions may be better.However, in this paper, we focused on a 50%–50% proportion.We empirically found the dictionary sizes considering a tradeoffbetween classification accuracy and computational efficiency.However, we can employ automatic approaches such as [37] forthis task.
After creating the visual word dictionary, each of the remain-ing PoIs within the RoIs in the training images are assigned tothe closest visual word of the dictionary using a process calledprojection or quantization [17], [34]. At the end of the quan-tization process, each image is represented by a signature orhistogram of the visual words it contains, which is the inputto a machine learning classifier in the last stage. Formally, the
2248 IEEE TRANSACTIONS ON BIOMEDICAL ENGINEERING, VOL. 59, NO. 8, AUGUST 2012
Fig. 3. Typical signatures for images showing bright and red lesions calculatedbased on averaging out all the signatures of the training set considering the aver-age of a fivefold cross-validation procedure for DR1 dataset (c.f., Section IV-A.(a) Bright lesions. (b) Red lesions.).
quantization performs a hard assignment (each PoI is attributedto the closest visual word in the dictionary) and the aggregationfunction is the sum [34] (once a PoI is matched to a visual wordthe corresponding entry in the signature is increased by one).
Fig. 3 depicts two examples of typical signatures found forimages with and without lesions and provides an indication ofthe discriminative power of the proposed approach. Each plotshows a typical signature for normal images versus images witheither bright or red lesions. The typical signature for imagesshowing bright and red lesions is calculated based on averagingout all the signatures of a training set (DR1 in this case, seeSection IV-A).
Specifically, each plot depicts 100 “visual words” and theirfrequency in the training set. Positions 1–50 represent lesion-based visual words (e.g., bright or red lesions in this case) whilepositions 51–100 represent words for the normal regions. Forpositions 1–50, it is expected that the visual words associatedwith lesions dominate (i.e., have a higher frequency of occur-rence) the normal visual words while the opposite is the casefor positions 51–100.
To perform the final classification, a two-class machine learn-ing classifier such as a support vector machine (SVM) wasselected [36]. For training the classifier, the signature vectorsof the training images containing examples of images with agiven lesion and normal/control images are fed into the clas-sifier. To test a new image, its PoIs are located and projectedonto the precomputed dictionary to create its signature vector,which forms the input to the trained classifier. However, somePoIs may lie outside the retinal boundary of the image. There-fore, before the quantization, the PoIs lying within the retinalboundary are identified by calculating a binary mask of the im-age using a pixel thresholding procedure and then calculatingthe Hough transform [31] of the resulting binary mask. Otherpossible algorithms could be used but the Hough transform issimple and fast. The rationale for its use is that the binary maskof a retinal image can contain several image portions not relatedto the retina. The Hough transform then finds the best circlethat encompasses the retina. Fig. 4 shows an example of a reti-nal image, its binarization, and the resulting Hough transformdelimited retinal portion.
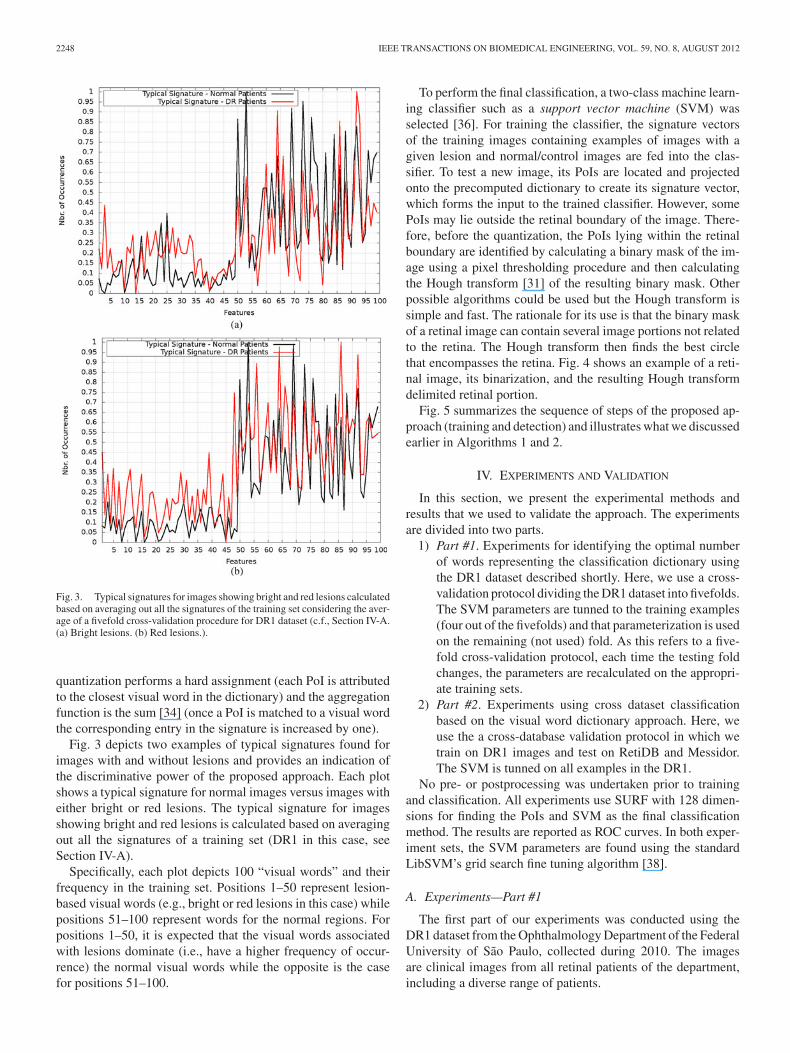
Fig. 5 summarizes the sequence of steps of the proposed ap-proach (training and detection) and illustrates what we discussedearlier in Algorithms 1 and 2.
IV. EXPERIMENTS AND VALIDATION
In this section, we present the experimental methods andresults that we used to validate the approach. The experimentsare divided into two parts.
1) Part #1. Experiments for identifying the optimal numberof words representing the classification dictionary usingthe DR1 dataset described shortly. Here, we use a cross-validation protocol dividing the DR1 dataset into fivefolds.The SVM parameters are tunned to the training examples(four out of the fivefolds) and that parameterization is usedon the remaining (not used) fold. As this refers to a five-fold cross-validation protocol, each time the testing foldchanges, the parameters are recalculated on the appropri-ate training sets.
2) Part #2. Experiments using cross dataset classificationbased on the visual word dictionary approach. Here, weuse the a cross-database validation protocol in which wetrain on DR1 images and test on RetiDB and Messidor.The SVM is tunned on all examples in the DR1.
No pre- or postprocessing was undertaken prior to trainingand classification. All experiments use SURF with 128 dimen-sions for finding the PoIs and SVM as the final classificationmethod. The results are reported as ROC curves. In both exper-iment sets, the SVM parameters are found using the standardLibSVM’s grid search fine tuning algorithm [38].
A. Experiments—Part #1
The first part of our experiments was conducted using theDR1 dataset from the Ophthalmology Department of the FederalUniversity of Sao Paulo, collected during 2010. The imagesare clinical images from all retinal patients of the department,including a diverse range of patients.
ROCHA et al.: POINTS OF INTEREST AND VISUAL DICTIONARIES FOR AUTOMATIC RETINAL LESION DETECTION 2249
Fig. 4. Constraining the analysis of normal retina image using Hough transform. (a) Original image. (b) Its binarization. (c) Result of a Hough transform todelimit the retina’s region.
Fig. 5. Sequence of steps for classifying DR lesions (e.g., bright or red lesions) from fundus images.
The DR1 dataset comprises 1014 images with an averageresolution of 640 × 480 pixels, (687 are normal retinae, 245images contain bright lesions, 191 contain red lesions, and 109contain signs of both bright and red lesions). All of the images inthe DR1 dataset were manually annotated for DR-related lesion(presence/absence) by three medical specialists. For each image,the specialist tags the image as having or not having bright or redlesions. All of the images in which the three agree were kept inthe final dataset. The RoIs were marked on some of the imageswith red, bright, or both lesions by a single ophthalmologistwith five years of experience. The expert draws a boundarysurrounding the lesion(s) and thus creates a RoI in the digitaltraining images (see Fig. 2). The images were captured usinga TRC50X (Topcon Inc., Tokyo, Japan) mydriatic camera withmaximum resolution of one megapixel and a field of view (fov)of 45◦. This dataset is publicly available1 and adds to currentlyexisting images [39], [40].
In the first part of the experiments, we explored the impor-tance of how the number of words considered to characterizeeach lesion in the creation of the dictionary influences the out-come of the detector. We also investigated how changing thediscriminatory power of the SURF PoIs, that is the space sur-rounding the PoIs, influenced the classification outcome and
1http://www.recod.ic.unicamp.br/site/asdr/
determined empirically that the characterization of PoIs contain-ing 128 orientations is more effective than using 64 orientations.A possible reason for this can be that discontinuities associatedwith lesions have a higher number of subtle characteristics thatrequire more orientations to be captured. The results of trainingthe classifier using the DR1 dataset are based on the average ofa fivefold cross-validation procedure (five independent evalua-tions of the full algorithm using at each time onefold as test andthe remaining four as training).
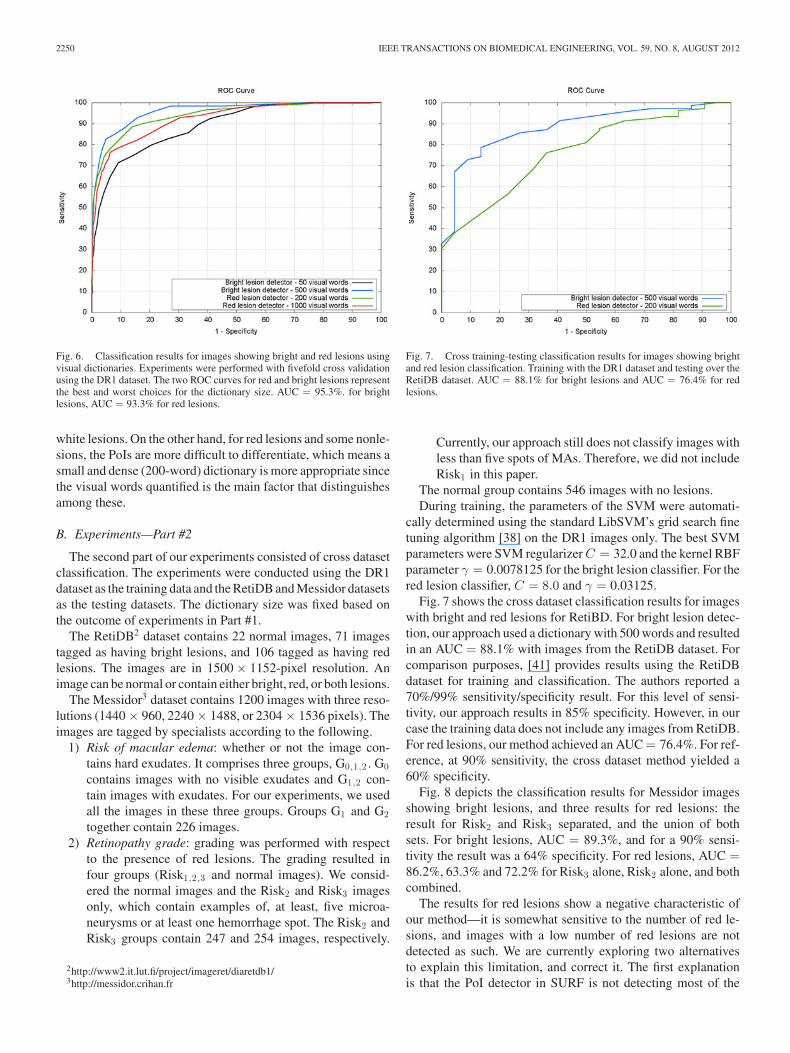
Fig. 6 shows the ROC classification results for images withbright and red lesions with the best and worst dictionary sizes.For bright lesions, the best-performing dictionary size consistedof 500 words (250 bright lesions-based words plus 250 normal-based words) with a corresponding AUC = 95.3%. For refer-ence, at 90% sensitivity, the system achieves 87% specificity.The worst performing dictionary size was 50. For red lesions,the differences among the different dictionary sizes are not assignificant, but nevertheless, the best performing dictionary has200 words (100 for lesion-based words and 100 for normal),with a corresponding AUC = 93.3%. For reference, at 90%sensitivity, the system achieves 83% specificity.
In the case of bright lesion classification, there is a large dif-ference between the characterizing PoIs for bright lesion andnonlesion structures and a 500-word, being a sparse large dic-tionary, is able to best capture the characteristics associated with
2250 IEEE TRANSACTIONS ON BIOMEDICAL ENGINEERING, VOL. 59, NO. 8, AUGUST 2012
Fig. 6. Classification results for images showing bright and red lesions usingvisual dictionaries. Experiments were performed with fivefold cross validationusing the DR1 dataset. The two ROC curves for red and bright lesions representthe best and worst choices for the dictionary size. AUC = 95.3%. for brightlesions, AUC = 93.3% for red lesions.
white lesions. On the other hand, for red lesions and some nonle-sions, the PoIs are more difficult to differentiate, which means asmall and dense (200-word) dictionary is more appropriate sincethe visual words quantified is the main factor that distinguishesamong these.
B. Experiments—Part #2
The second part of our experiments consisted of cross datasetclassification. The experiments were conducted using the DR1dataset as the training data and the RetiDB and Messidor datasetsas the testing datasets. The dictionary size was fixed based onthe outcome of experiments in Part #1.
The RetiDB2 dataset contains 22 normal images, 71 imagestagged as having bright lesions, and 106 tagged as having redlesions. The images are in 1500 × 1152-pixel resolution. Animage can be normal or contain either bright, red, or both lesions.
The Messidor3 dataset contains 1200 images with three reso-lutions (1440 × 960, 2240 × 1488, or 2304 × 1536 pixels). Theimages are tagged by specialists according to the following.
1) Risk of macular edema: whether or not the image con-tains hard exudates. It comprises three groups, G0,1,2 . G0contains images with no visible exudates and G1,2 con-tain images with exudates. For our experiments, we usedall the images in these three groups. Groups G1 and G2together contain 226 images.
2) Retinopathy grade: grading was performed with respectto the presence of red lesions. The grading resulted infour groups (Risk1,2,3 and normal images). We consid-ered the normal images and the Risk2 and Risk3 imagesonly, which contain examples of, at least, five microa-neurysms or at least one hemorrhage spot. The Risk2 andRisk3 groups contain 247 and 254 images, respectively.
2http://www2.it.lut.fi/project/imageret/diaretdb1/3http://messidor.crihan.fr
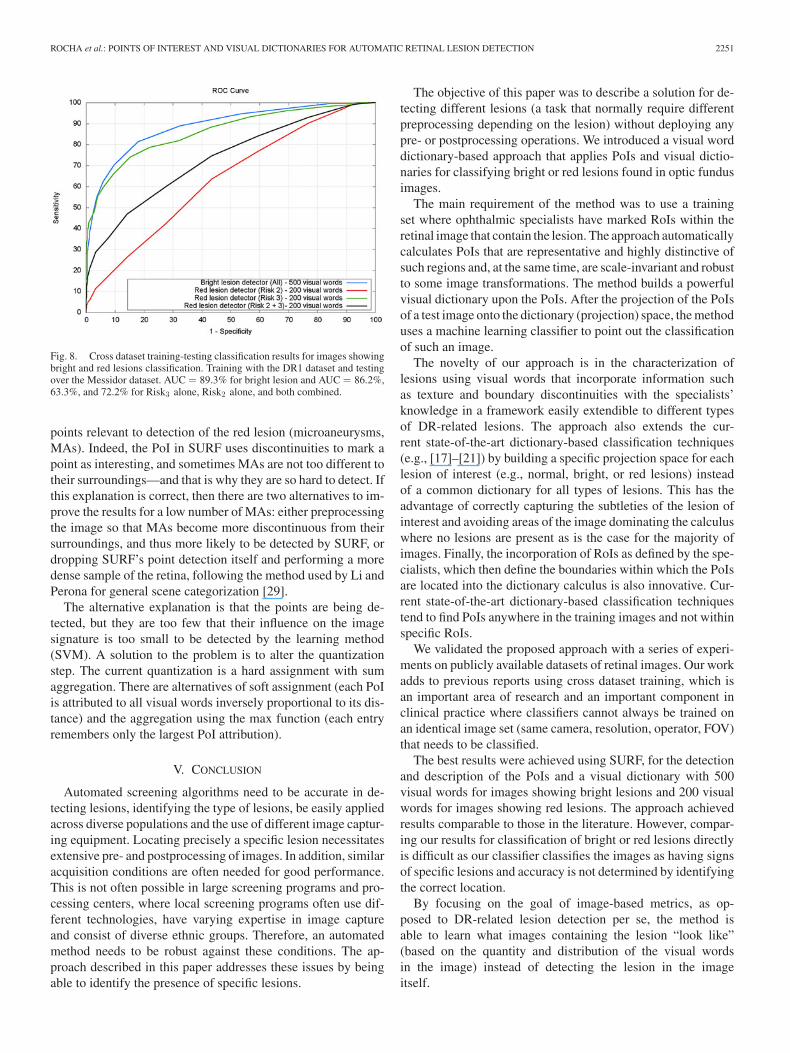
Fig. 7. Cross training-testing classification results for images showing brightand red lesion classification. Training with the DR1 dataset and testing over theRetiDB dataset. AUC = 88.1% for bright lesions and AUC = 76.4% for redlesions.
Currently, our approach still does not classify images withless than five spots of MAs. Therefore, we did not includeRisk1 in this paper.
The normal group contains 546 images with no lesions.During training, the parameters of the SVM were automati-
cally determined using the standard LibSVM’s grid search finetuning algorithm [38] on the DR1 images only. The best SVMparameters were SVM regularizer C = 32.0 and the kernel RBFparameter γ = 0.0078125 for the bright lesion classifier. For thered lesion classifier, C = 8.0 and γ = 0.03125.
Fig. 7 shows the cross dataset classification results for imageswith bright and red lesions for RetiBD. For bright lesion detec-tion, our approach used a dictionary with 500 words and resultedin an AUC = 88.1% with images from the RetiDB dataset. Forcomparison purposes, [41] provides results using the RetiDBdataset for training and classification. The authors reported a70%/99% sensitivity/specificity result. For this level of sensi-tivity, our approach results in 85% specificity. However, in ourcase the training data does not include any images from RetiDB.For red lesions, our method achieved an AUC = 76.4%. For ref-erence, at 90% sensitivity, the cross dataset method yielded a60% specificity.
Fig. 8 depicts the classification results for Messidor imagesshowing bright lesions, and three results for red lesions: theresult for Risk2 and Risk3 separated, and the union of bothsets. For bright lesions, AUC = 89.3%, and for a 90% sensi-tivity the result was a 64% specificity. For red lesions, AUC =86.2%, 63.3% and 72.2% for Risk3 alone, Risk2 alone, and bothcombined.
The results for red lesions show a negative characteristic ofour method—it is somewhat sensitive to the number of red le-sions, and images with a low number of red lesions are notdetected as such. We are currently exploring two alternativesto explain this limitation, and correct it. The first explanationis that the PoI detector in SURF is not detecting most of the
ROCHA et al.: POINTS OF INTEREST AND VISUAL DICTIONARIES FOR AUTOMATIC RETINAL LESION DETECTION 2251
Fig. 8. Cross dataset training-testing classification results for images showingbright and red lesions classification. Training with the DR1 dataset and testingover the Messidor dataset. AUC = 89.3% for bright lesion and AUC = 86.2%,63.3%, and 72.2% for Risk3 alone, Risk2 alone, and both combined.
points relevant to detection of the red lesion (microaneurysms,MAs). Indeed, the PoI in SURF uses discontinuities to mark apoint as interesting, and sometimes MAs are not too different totheir surroundings—and that is why they are so hard to detect. Ifthis explanation is correct, then there are two alternatives to im-prove the results for a low number of MAs: either preprocessingthe image so that MAs become more discontinuous from theirsurroundings, and thus more likely to be detected by SURF, ordropping SURF’s point detection itself and performing a moredense sample of the retina, following the method used by Li andPerona for general scene categorization [29].
The alternative explanation is that the points are being de-tected, but they are too few that their influence on the imagesignature is too small to be detected by the learning method(SVM). A solution to the problem is to alter the quantizationstep. The current quantization is a hard assignment with sumaggregation. There are alternatives of soft assignment (each PoIis attributed to all visual words inversely proportional to its dis-tance) and the aggregation using the max function (each entryremembers only the largest PoI attribution).
V. CONCLUSION
Automated screening algorithms need to be accurate in de-tecting lesions, identifying the type of lesions, be easily appliedacross diverse populations and the use of different image captur-ing equipment. Locating precisely a specific lesion necessitatesextensive pre- and postprocessing of images. In addition, similaracquisition conditions are often needed for good performance.This is not often possible in large screening programs and pro-cessing centers, where local screening programs often use dif-ferent technologies, have varying expertise in image captureand consist of diverse ethnic groups. Therefore, an automatedmethod needs to be robust against these conditions. The ap-proach described in this paper addresses these issues by beingable to identify the presence of specific lesions.
The objective of this paper was to describe a solution for de-tecting different lesions (a task that normally require differentpreprocessing depending on the lesion) without deploying anypre- or postprocessing operations. We introduced a visual worddictionary-based approach that applies PoIs and visual dictio-naries for classifying bright or red lesions found in optic fundusimages.
The main requirement of the method was to use a trainingset where ophthalmic specialists have marked RoIs within theretinal image that contain the lesion. The approach automaticallycalculates PoIs that are representative and highly distinctive ofsuch regions and, at the same time, are scale-invariant and robustto some image transformations. The method builds a powerfulvisual dictionary upon the PoIs. After the projection of the PoIsof a test image onto the dictionary (projection) space, the methoduses a machine learning classifier to point out the classificationof such an image.
The novelty of our approach is in the characterization oflesions using visual words that incorporate information suchas texture and boundary discontinuities with the specialists’knowledge in a framework easily extendible to different typesof DR-related lesions. The approach also extends the cur-rent state-of-the-art dictionary-based classification techniques(e.g., [17]–[21]) by building a specific projection space for eachlesion of interest (e.g., normal, bright, or red lesions) insteadof a common dictionary for all types of lesions. This has theadvantage of correctly capturing the subtleties of the lesion ofinterest and avoiding areas of the image dominating the calculuswhere no lesions are present as is the case for the majority ofimages. Finally, the incorporation of RoIs as defined by the spe-cialists, which then define the boundaries within which the PoIsare located into the dictionary calculus is also innovative. Cur-rent state-of-the-art dictionary-based classification techniquestend to find PoIs anywhere in the training images and not withinspecific RoIs.
We validated the proposed approach with a series of experi-ments on publicly available datasets of retinal images. Our workadds to previous reports using cross dataset training, which isan important area of research and an important component inclinical practice where classifiers cannot always be trained onan identical image set (same camera, resolution, operator, FOV)that needs to be classified.
The best results were achieved using SURF, for the detectionand description of the PoIs and a visual dictionary with 500visual words for images showing bright lesions and 200 visualwords for images showing red lesions. The approach achievedresults comparable to those in the literature. However, compar-ing our results for classification of bright or red lesions directlyis difficult as our classifier classifies the images as having signsof specific lesions and accuracy is not determined by identifyingthe correct location.
By focusing on the goal of image-based metrics, as op-posed to DR-related lesion detection per se, the method isable to learn what images containing the lesion “look like”(based on the quantity and distribution of the visual wordsin the image) instead of detecting the lesion in the imageitself.

2252 IEEE TRANSACTIONS ON BIOMEDICAL ENGINEERING, VOL. 59, NO. 8, AUGUST 2012
The visual dictionary is an elegant method to learn and rep-resent important features of a specific lesion, and allows clas-sifying whether or not an image contains these lesions with aunified approach. This approach is independent of the imageresolution, color space representation, and does not assume anyspecific size of the lesions. Furthermore, the approach is robustacross differences in the appearance of the lesions and the retinaacross different ethnicities. In [14], we report the result of ap-plying this technique on Australian aboriginal cases, with betterresults than any other approach published.
Cross-dataset learning—training of one dataset to test theperformance on an entirely different dataset—is the ultimatetest to expose the weaknesses and robustness of a method. Aswe report here, it showed us that there is still some room forimprovement and adjustment on the deployment details of ourapproach. We strongly believe the community as a whole shouldadopt this validation procedure from now on.
A. Future Work
This paper has shown how to construct detectors for two ofthe most common lesions in DR. The work continues in threedifferent directions. As mentioned, the red lesion detector is stilldependent on the number of spot signs in the images. We arecurrently exploring the alternatives discussed in Section IV-B—pre-processing the image, dense SURF, and soft quantizationwith max aggregation [34].
On the other hand, it is possible that even a combination oftechniques will not be enough to detect a very small numberof microaneurysms. However, retinae with fewer than three mi-croaneurysms have a higher disappearance rate compared toretinae with four or more aneurysms. This suggests that theidentification of five microaneurysms can be seen as the stagewhere a referral is necessary [42], [43]. Our results are in linewith current clinical practice as the Wisconsin work was basedon seven-field ETDRS criteria and the U.K. prospective studyon four retinal fields while current automated screening usesone or two retinal views (foveal field and optic disk centered).Microaneurysms outside of the foveal field are not immediatelysight threatening and only 50% of microaneurysms were withinthis region reported by Klein et al. [44]. A plausible conclu-sion is that, for screening purposes, detection of less than fivemicroaneurysms is not that useful.4
The second direction of future research involves the develop-ment of an automatic DR screening system, that can detect thepresence of many abnormalities related to DR. Thus, we are de-veloping detectors for other lesions (cotton wool spots, drusen,superficial hemorrhage, neovascularization) and defining a wayto combine the output of each of these detectors into a singledecision on whether or not the patient should be referred to aspecialist and the level of disease progression. The developmentof other detectors follows in part the steps laid down by the twodetectors described herein—detecting PoIs, mapping them tovisual words and learning a classifier to distinguish the differ-ent histograms. However, not all forms of lesions are equally
4Personal Communication, Allan Luckie, Albury Eye Clinic, Australia.
Fig. 9. Results with combining the two detectors with an OR. The averageresult of a fivefold cross validation on DR1 alone. The images are only the onesin DR1 where either bright or red lesions were detected. AUC = 95.2%.
amenable to such approach—and some of them may requiresome changes to the process. For example, neovascularizationsuffers the problem of not having highly discontinuous pointsto be detected by SURF, and thus we are following the densetraditional SURF approach in such cases.
The third direction of future research is how to combine theresults of each of the detectors. In principle, the combinationis simple if any detector identifies a lesion, the patient shouldbe referred to the specialist. This is what we call an OR-rule.Fig. 9 presents the result of using the OR rule for red and brightlesion fusion. The figure shows the average of a fivefold cross-validations using the DR1 data. The combination of detectorshas a promising AUC of 95.2. But we can go beyond the OR-rule. The SVM classifiers used in the detectors may return notjust the class to which the image belongs to, but some measureof distance of that image to the boundary region. Thus, we canuse this information to combine the results in other ways. Forexample, if all identify that the image is normal but with a lowcertainty of that determination (this may be the case if thereare dust particles captured in the image during photography), itmight be prudent to refer the patient to the specialist. We arecurrently exploring some of these alternatives to combine theoutput of each detector.
ACKNOWLEDGMENT
The authors would like to thank the Federal University ofSao Paulo medical team for helping them to collect and tagthe ocular-fundus images. They would also like to thank Dr. E.Dib, for leading the DR1 dataset image grading and EmanueleTrucco for suggestions on early drafts of this study.
REFERENCES
[1] M. D. Abramoff, M. Niemeijer, M. S. Suttorp-Schulten, M. A. Viergever,S. R. Russell, and B. van Ginneken, “Evaluation of a system for automaticdetection of diabetic retinopathy from color fundus photographs in a largepopulation of patients with diabetes,” Diabetes Care, vol. 31, no. 2,pp. 193–198, 2008.

ROCHA et al.: POINTS OF INTEREST AND VISUAL DICTIONARIES FOR AUTOMATIC RETINAL LESION DETECTION 2253
[2] S. R. Salomao, M. R. K. H. Mitsuhiro and R. Belfort, Jr., “Visual im-pairment and blindness: An overview of prevalence and causes in Brazil,”Anals Braz. Acad. Sci., vol. 81, pp. 539–549, 2009.
[3] Q. Mohamed, M. C. Gillies, and T. Y. Wong, “Management of diabeticretinopathy: A systematic review,” J. Amer. Med. Assoc., vol. 298, no. 8,pp. 902–916, 2007.
[4] M. James, D. A. Turner, D. M. Broadbent, J. Vora, and S. P. Harding,“Cost effectiveness analysis of screening for sight threatening diabeticeye disease,” Br. Med. J., vol. 320, pp. 1627–1631, 2000.
[5] L. Giancardo, F. Meriaudeau, T. Karnowski, Y. Li, K. Tobin, and E. Chaum,“Microaneurysm detection with radon transform-based classification onretina images,” in Proc. Intl. Conf. IEEE Eng. Med. Biol. Soc., 2011,pp. 5939–5942.
[6] B. Antal, I. Lazar, A. Hajdu, Z. Torok, A. Csutak, and T. Peto, “Evaluationof the grading performance of an ensemble-based microaneurysm detec-tor,” in Proc. Intl. Conf. IEEE Eng. Med. Biol. Soc., 2011, pp. 5943–5946.
[7] A. D. Fleming, S. Philip, K. A. Goatman, J. A. Olson, and P. F. Sharp,“Automated microaneurysm detection using local contrast normalizationand local vessel detection,” IEEE Trans. Med. Imag., vol. 25, no. 9,pp. 1223–1232, 2006.
[8] M. J. Cree, E. Gamble, and D. J. Cornforth, “Colour normalisation toreduce inter-patient and intra-patient variability in microaneurysm detec-tion in colour retinal images,” in Proc. Workshop Digital Image Comput.,2005, pp. 163–168.
[9] M. Niemeijer, B. van Ginneken, S. R. Russell, and M. S. A. Suttorp-Schulten, M. D. Abramoff, “Automated detection and differentiation ofdrusen, exudates, and cotton-wool spots in digital color fundus pho-tographs for diabetic retinopathy diagnosis,” Invest. Ophthalmol. Vis.Sci., vol. 48, no. 5, pp. 2260–2267, 2007.
[10] A. D. Fleming, S. Philip, K. A. Goatman, G. J. Williams, J. A. Olson,and P. F. Sharp, “Automated detection of exudates for diabetic retinopathyscreening,” Phys. Med. Biol., vol. 52, no. 24, pp. 7385–7396, 2007.
[11] A. D. Fleming, K. A. Goatman, S. Philip, G. J. Williams, G. J. Prescott,G. S. Scotland, P. McNamee, G. P. Leese, W. N. Wykes, P. F. Sharp,and J. A. Olson, “The role of haemorrhage and exudate detection inautomated grading of diabetic retinopathy,” Br. J. Ophthalmol., vol. 94,no. 6, pp. 706–711, 2010.
[12] M. Niemeijer, B. van Ginneken, M. J. Cree, A. Mizutani, G. Quellec,C. I. Sanchez, B. Zhang, R. Hornero, M. Lamard, C. Muramatsu, X. Wu,G. Cazuguel, J. You, A. Mayo, L. Qin, Y. Hatanaka, B. Cochener, C. Roux,F. Karray, M. Garcia, H. Fujita, and M. D. Abramoff, “Retinopathy onlinechallenge: Automatic detection of microaneurysms in digital color fundusphotographs,” IEEE Trans. Med. Imag., vol. 29, no. 1, pp. 185–195, Jan.2010.
[13] H. F. Jelinek, K. Al-Saedi, and L. Backlund, “Computer assisted top-down assessment of diabetic retinopathy,” in Proc. World Congr. Biophys.Biomed. Eng., 2009, pp. 127–130.
[14] H. F. Jelinek, A. Rocha, T. Carvalho, S. Goldenstein, and J. Wainer,“Machine learning and pattern classification in identification of indigenousretinal pathology,” in Proc. Intl. Conf. IEEE Eng. Med. Biol. Soc., 2011,pp. 5951–5954.
[15] Y. Li, T. P. Karnowski, K. W. Tobin, L. Giancardo, S. Morris, S. E.Sparrow, S. Garg, K. Fox, and E. Chaum, “A health insurance porta-bility and accountability act-compliant ocular telehealth network for theremote diagnosis and management of diabetic retinopathy,” Telemedicinee-Health, vol. 17, no. 8, pp. 627–634, 2011.
[16] A. Ruggeri, E. Poletti, D. Fioroin, and L. Tramontan, “From laboratory toclinic: The development of web-based tools for the estimation of retinaldiagnostic parameters,” in Proc. Intl. Conf. IEEE Eng. Med. Biol. Soc.,2011, pp. 3379–3382.
[17] J. Sivic and A. Zisserman, “Video Google: A Text Retrieval Approach toObject Matching in Videos,” in Proc. IEEE Intl. Conf. Comput. Vision,2003, pp. 1470–1477.
[18] J. Winn, A. Criminisi, and T. Minka, “Object categorization by learneduniversal visual dictionary,” in Proc. IEEE Intl. Conf. Comput. Vision,2005, pp. 1800–1807.
[19] K. Mikolajczyk and C. Schmid, “Scale and affine invariant interest pointdetectors,” Intl. J. Comput. Vision, vol. 60, no. 1, pp. 63–86, Jan. 2004.
[20] E. N. Mortensen, H. Deng, and L. G. Shapiro, “A SIFT descriptor withglobal context,” in Proc. IEEE Intl. Conf. Comput. Vision Pattern Recogn.,2005, pp. 184–190.
[21] M. F. Demirci, A. Shokoufandesh, Y. Keselman, L. Bretzner, andS. Dickinson, “Object recognition as many-to-many feature matching,”Intl. J. Comput. Vision, vol. 69, no. 2, pp. 203–222, 2006.
[22] M. D. Abramoff, M. K. Garvin and M. Sonka, “Retinal imaging and imageanalysis,” IEEE Rev. Biomed. Eng., vol. 3, pp. 169–208, 2010.
[23] R. Winder, P. Morrow, I. McRitchie, J. Bailie, and P. Hart, “Algorithmsfor digital image processing in diabetic retinopathy,” Computerized Med.Imag. Graph., vol. 33, pp. 608–622, 2009.
[24] O. Faust, R. Acharya, E. Y. K. Ng, K.-H. Ng, and J. S. Suri, “Algorithmsfor the automated detection of diabetic retinopathy using digital fundusimages: A review,” J. Med. Syst., vol. 36, no. 1, pp. 145–157, Feb. 2012.
[25] H. Wang, W. Hsu, K. G. Goh, and M. L. Lee, “An effective approach todetect lesions in color retinal images,” in IEEE Intl. Conf. Comput. VisionPattern Recogn., vol. 2, pp. 181–186, 2000.
[26] B. Zhang, K. Karray, L. Zhang, and J. You, “Microaneurism (MA) detec-tion via sparse representation classifier with MA and non-MA dictionarylearning,” in Proc. Intl. Conf. Pattern Recogn., 2010, pp. 277–280.
[27] H. F. Jelinek, M. J. Cree, D. Worsley, A. Luckie, and P. Nixon, “Anautomated microaneurysm detector as a tool for identification of diabeticretinopathy in rural optometric practice,” Clin. Exp. Optometry, vol. 89,pp. 299–305, 2006.
[28] C. Agurto, V. Murray, E. Barriga, S. Murillo, M. Pattichis, H. Davis,S. Russel, and M. Abramoff, P. Soliz, “Multiscale AM-FM methods fordiabetic retinopathy lesion detection,” IEEE Trans. Med. Imag., vol. 29,no. 2, pp. 502–512, Feb. 2010.
[29] F.-F. Li and P. Perona, “A bayesian hierarchical model for learning nat-ural scene categories,” in Proc. IEEE Intl. Conf. Comput. Vision PatternRecogn., vol. 2, pp. 524–531, Jun. 2005.
[30] G. Csurka, C. R. Dance, L. Fan, J. Willamowski, and C. Bray, “Visualcategorization with bags of keypoints,” in Proc. Workshop Stat. Learn.Comput. Vision, 2004, pp. 1–8.
[31] P. Hough and B. Powell, “A method for faster analysis of bubble chamberphotographs,” Il Nuovo Cimento, vol. 18, pp. 1184–1191, 1960.
[32] D. Lowe, “Distinctive image features from scale-invariant keypoints,”Intl. J. Comput. Vision, vol. 60, no. 2, pp. 91–110, Feb. 2004.
[33] R. Datta, D. Joshi, and J. Wang, “Image retrieval: Ideas, influences, andtrends of the new age,” ACM Comput. Surv., vol. 40, no. 2, pp. 1–77, Apr.2008.
[34] E. Valle, “Local-descriptor matching for image identification systems,”Ph.D. dissertation, Ecole Doctorale Sciences et Ingenierie, Universit deCergy-Pontoise, Cergy-Pontoise, France, 2008.
[35] H. Bay, A. Ess, T. Tuytelaars, and L. V. Gool, “Speeded-up robust features(SURF),” Comput. Vision Image Understanding, vol. 110, no. 3, pp. 346–359, 2008.
[36] C. M. Bishop, Pattern Recognition and Machine Learning, 1st ed.Berlin, Germany: Springer, 2006.
[37] J. P. Papa and A. Rocha, “Image categorization through optimum path for-est and visual words,” in Proc. Intl. Conf. Image Process., 2011, pp. 3586–3589.
[38] C.-C. Chang and C.-J. Lin, LIBSVM: A library for support vector ma-chines, 2001, software at [Online]. Available: http://www.csie.ntu.edu.tw/cjlin/libsvm
[39] L. Giancardo, F. Meriaudeau, T. P. Karnowski, Y. Li, S. Garg,K. W. Tobin, and E. Chaum, “Exudate-based diabetic macularedema detection in fundus images using publicly available datasets,”Med. Image Anal., vol. 16, no. 1, pp. 216–226, 2012. Available:http://www.ncbi.nlm.nih.gov/pubmed/21865074
[40] C. I. Sanchez, M. Niemeijer, A. V. Dumitrescu, M. S. A. Suttorp-Schulten,M. D. Abramoff, and B. van Ginneken, “Evaluation of a computer-aideddiagnosis system for diabetic retinopathy screening on public data,” Invest.Ophthalmol. Vis. Sci., vol. 52, no. 7, pp. 4866–4871, Jul. 2011.
[41] D. Welfer, J. Scharcanski, and D. R. Marinho, “A coarse-to-fine strategyfor automatically detecting exudates in color eye fundus images,” Comput.Med. Imag. Graph., vol. 34, no. 3, pp. 228–235, 2010.
[42] A. K. Sjølie, R. Klein, M. Porta, T. Orchard, J. Fuller, H. H. Parving,R. Bilous, S. Aldington, and N. Chaturvedi, “Retinal microaneurysmcount predicts progression and regression of diabetic retinopathy. Post-hoc results from the direct programme,” Diabetic Med., vol. 28, no. 3,pp. 345–351, 2011.
[43] E. M. Kohner, I. M. Stratton, S. J. Aldington, R. C. Turner, and D. R. M. forthe UK Prospective Diabetes Study (UKPDS) Group”, “Microaneurysmsin the development of diabetic retinopathy (UKPDS 42),” Diabetilogia,vol. 42, pp. 1107–1112, 1999.
[44] R. Klein, S. M. Meuer, S. E. Moss, and B. E. Klein, “Retinal microa-neurysm counts and 10-year progression to diabetic retinopathy,” Arch.Ophthalmol., vol. 113, pp. 1386–1391, 1985.
Author’s photographs and biographies not available at the time of publication.