The Role of PET/CT and SPECT/CT in Oncology Drug Development
Upload
khangminh22Category
view
1download
0
Page 1/16
Bene�t of contrast-enhanced PET/CT versus non-contrast-enhanced PET/CT relative to lesion detection, lesioncharacterization, and diagnostic accuracy in patients withcancerTanyaluck Thientunyakit ( [email protected] )
Mahidol University Faculty of Medicine Siriraj Hospital https://orcid.org/0000-0002-6139-7887Phakphoom Thiravit
Mahidol University Faculty of Medicine Siriraj HospitalPichet Mali
Mahidol University Faculty of Medicine Siriraj HospitalPotjanee Kanchanapiboon
Mahidol University Faculty of Medicine Siriraj Hospital
Research article
Keywords: Contrast-enhanced PET/CT, non-contrast-enhanced PET/CT, lesion detection, lesion characterization,diagnostic accuracy, cancer, [F-18]FDG
Posted Date: August 28th, 2019
DOI: https://doi.org/10.21203/rs.2.10431/v1
License: This work is licensed under a Creative Commons Attribution 4.0 International License. Read Full License
Page 2/16
AbstractBackground To investigate the bene�t of contrast-enhanced PET/CT (PET/CECT) versus non-contrast-enhancedPET/CT (PET/NCCT) relative to lesion detection, characterization, and diagnostic accuracy in cancer patients. MethodsThis prospective study included patients aged >18 years with histopathologically proven cancer who underwent [F-18]FDG PET/CT at the Division of Nuclear Medicine, Department of Radiology, Mahidol University, Bangkok, Thailandduring the December 2014 to November 2017 study period. PET/NCCT was performed followed by PET/CECT scan inall patients. The results of PET/NCCT, PET/CECT, and pre/post-contrast enhanced PET/CT (PET/NCCT-CECT) for eachpatient were interpreted by 1 nuclear medicine physician and 1 radiologist. The sensitivity, speci�city, accuracy, positivepredictive value (PPV), and negative predictive value (NPV) were calculated from ROC curve analysis. Results Onehundred and ten patients were included. The mean age was 52.45±17.14 years, and 52.7% were female. Lymphomawas the most common cancer diagnosis (47.3%). No signi�cant difference was observed between PET/CT techniquesfor detection rate at the primary tumor site, lymph node, or distant organ. High agreement was observed betweenPET/CT techniques for lesion characterization. Lesion characterizations were not signi�cantly correlated with age,gender, BMI, or FBS; however, lesion characterization was found to be signi�cantly associated with primary tumor size,indication for PET/CT and lesion size. The following ranges were observed from all PET/CT techniques: sensitivity81.5%-85.3%, speci�city 94.4%-95.5%, accuracy 89.4%-91.4%, PLR 14.572-18.719, NLR 0.155-0.196, PPV 90.4%-92.1%,and NPV 88.9%-91.3%. Conclusions [F-18]FDG PET/CT demonstrated no signi�cant advantage over PET/NCCT forlesion detection, lesion characterization, or diagnostic accuracy in patients with cancer. The use of intravenous contrastmaterial should be limited to select cases in order to reduce the risk of renal toxicity and/or anaphylactic reaction, andto minimize unnecessary costs.
BackgroundIntegrated positron emission tomography and computed tomography or PET/CT scan using [F-18] �uorodeoxyglucose([F-18]FDG) is a well-accepted imaging technique that is used for diagnosis, staging, response assessment, recurrencedetection, and follow-up among patients with suspected or de�nitively diagnosed cancer. PET/CT was shown to havegreater diagnostic accuracy than PET or CT alone relative to primary tumor detection, lymph node metastasis, anddistant metastasis.(1) In order to obtain a diagnostically e�cacious CT scan when combined with PET, theadministration of intravenous contrast material may be required. The use of intravenous contrast material facilitatesprecise identi�cation and differentiation of vascular and parenchymatous organ tissue from surrounding tissues.Moreover, the evaluation of lesion enhancement improves lesion detection and lesion characterization. Additionally,assessment of a lesion’s relationship with adjacent vascular structures is important for surgical planning.(2,3) Someprevious studies suggested that contrast-enhanced PET/CT improves the detection and characterization of liver lesionsin patients with colorectal cancer(2), recurrent rectal cancer(4), ovarian cancer(5), and lung cancer.(6) In contrast, otherstudies found no signi�cant difference between non-contrast-enhanced CT and contrast-enhanced CT integrated withPET in patients with malignant lymphoma(7), and in patients with head and neck cancer.(8,9) Importantly, intravenouscontrast material should be used only when the potential bene�ts outweigh the potential risks since contrast materialcan cause renal toxicity and/or anaphylactic reaction in some patients. Some authors recommend against routineintravenous contrast administration for PET/CT, but they agree that it may be selectively used in patients with early-stage head and neck cancer that requires meticulous anatomic and topographic data to plan the operation, and inpatients with advanced-stage cancer for assessing vascular invasion.(9) No consensus has yet been reached regardingif, how, and when intravenous contrast material should be used in PET/CT study.
Accordingly, the aim of this study was to investigate the bene�t of contrast-enhanced PET/CT versus non-contrast-enhanced PET/CT relative to lesion detection, characterization, and diagnostic accuracy in patients with cancer.

Page 3/16
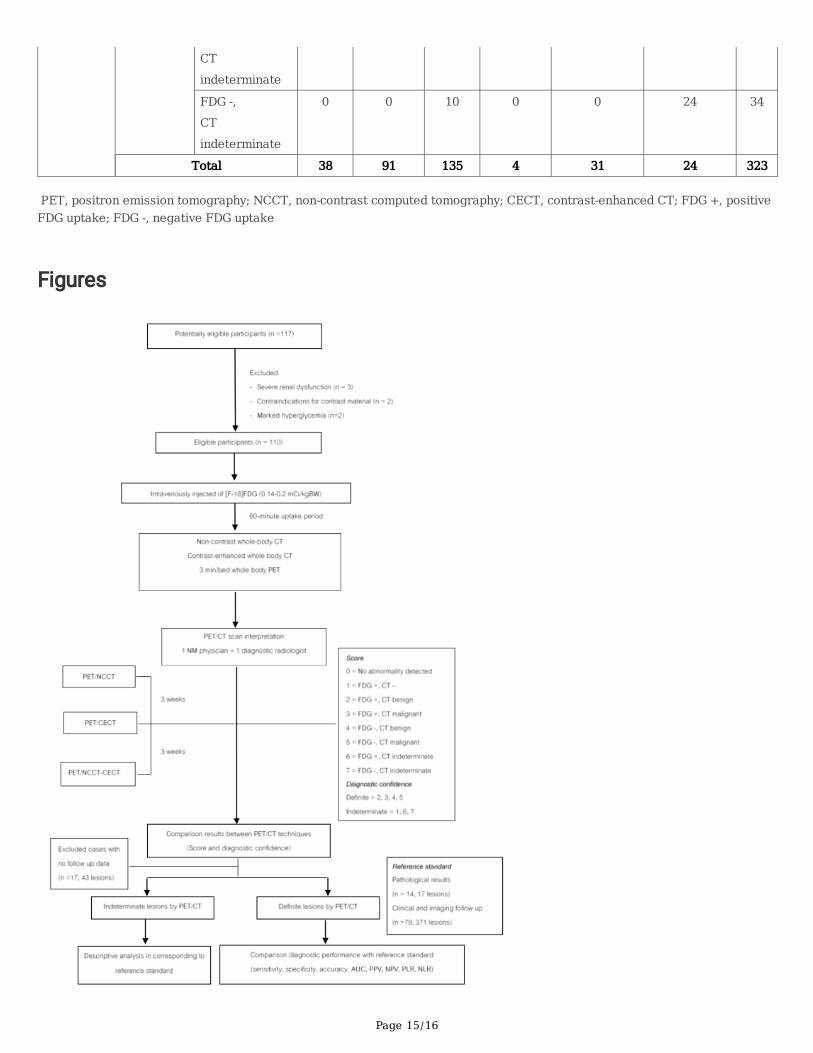
MethodsA �ow diagram describing patient enrollment and the study protocol is shown in Figure 1.
Patients
This prospective study was conducted in patients aged >18 years with histopathologically proven cancers whounderwent [F18]FDG whole body PET/CT scan at the Division of Nuclear Medicine, Department of Radiology, Faculty ofMedicine Siriraj Hospital, Mahidol University, Bangkok, Thailand during the 1 December 2014 to 30 November 2017study period. Patients with severe renal dysfunction (glomerular �ltration rate [GFR] <20 ml/minute; n=3),contraindications for contrast material (n=2), and marked hyperglycemia (fasting blood sugar [FBS] >200 mg/dl; n=2)were excluded.
All PET/CT studies were performed at least 4 weeks after biopsy or surgery, 6 weeks after chemotherapy, 12weeks after radiotherapy, and 2 weeks after granulocyte-colony stimulating factor (GCSF) treatment to prevent false-positive results due to in�ammatory changes. Clinical, histopathological, radiological follow-up, and other correlativeinvestigation were used as reference standards to evaluate the diagnostic accuracy of PET/CT.
PET/CT protocol
All data were acquired using an integrated PET/CT system (Discovery®; GE Healthcare, Milwaukee, WI, USA) thatintegrates a 16-detector row CT scanner with a lutetium oxyorthosilicate (LSO)-based PET scanner. Patients fasted atleast 6 hours prior to [F-18]FDG administration, and blood glucose level was checked using a glucose meter (Stat Strip®;Nova Biomedical, Waltham, MA, USA) just before [F-18]FDG administration. Tracer injection was performed only inpatients whose blood glucose level was less than 150 mg/dL. Whole-body emission images were obtained 60 minutesafter intravenous administration of [F-18]FDG (0.14-0.2 mCi/kg), with an average injected dose of 381.19±76.4 MBq(10.3±2.0 mCi).
In all patients, 2 ml/kg of non-ionic contrast material using either Iopamidol (Iopamiro®; Bracco Imaging, Milano,Italy) or Iohexol (Omnipaque®; GE Healthcare, Milwaukee, WI, USA) or Ioversol (Optiray®; Guerbet, Cedex, France) orIodixanol (Visipaque®, GE Healthcare, Milwaukee, WI, USA) was intravenously injected. Whole body CT (30-300 mAsusing Automatic Exposure Control (AEC) and smart mA, 14.0 noise index, 120 kVp, and helical thickness of 2.5 mmcollimation) was performed immediately before and after contrast injection. Contrast-enhanced CT scan wasperformed after contrast injection using the appropriate delay time (40 seconds for lesion at head/neck/chest, and 70seconds for lesion at abdomen). PET data was acquired in 3-D mode, 3 minutes per bed position, and reconstructionwas performed using an ordered subset expectation maximization algorithm (3D Iterative [VUE Point]).
Image interpretation
The reconstructed, attenuation-corrected images of all PET/CT datasets were reviewed by one board-certi�ednuclear medicine physician (14-years’ experience) and one diagnostic radiologist (11-years’ experience), both of whomwere blinded to patient clinical information, using an AW Workstation (GE Healthcare, Milwaukee, WI, USA). Imageswithout attenuation correction were available for evaluation in cases with suspicious artifacts. For non-contrastPET/CT, a lesion was de�ned as either a focus of increased [F-18]FDG uptake compared with background, or asmorphologic change with features that increase suspicion of the presence of a tumor. For contrast-enhanced PET/CT,abnormal enhancement was added to the criteria adopted for non-contrast PET/CT (e.g., enhancement >15 HU inpulmonary nodule sized >8 mm).(10-13) Lymph node metastasis was considered in lymph nodes with FDG avidity andwhen their shortest axial diameter was >11 mm in the jugulodigastric region and >10 mm in the

Page 4/16
cervical/abdominal/pelvic region (>5 mm in rectal cancer), or if irregular border or central necrosis was evident, or ifthere was a cluster of three or more lymph nodes of borderline size.(14-16) Distant metastasis was de�ned as a focallyincreased [F-18]FDG activity compared with background, with associated soft tissue mass outside of the primary lesionor bony destruction. Equivocal lesion detected by PET or CT that failed to satisfy any of the aforementioned diagnosticcriteria was designated as an indeterminate lesion.
Outcome assessment
All whole body PET/CT studies were assessed using an 8-point scale, as follows; 0 = no abnormality detected; 1 = focalFDG uptake without CT abnormality; 2 = focal FDG uptake with CT abnormality, favoring benign; 3 = focal FDG uptakewith CT abnormality, favoring malignant; 4 = CT abnormality without FDG avidity, favoring benign; 5 = CT abnormalitywithout FDG avidity, favoring malignant; 6 = focal FDG uptake with CT abnormality, indeterminate; and, 7 = CTabnormality without FDG avidity, indeterminate. These lesions were then classi�ed as indeterminate (scores 1, 6, or 7);de�nite benign lesion (scores 2 or 4); or, de�nite malignant lesion (scores 3 or 5). Both observers reviewed PET/NCCT�rst, followed by PET/CECT and PET/NCCT-CECT, with at least a 3-week interval between each of the 3 sets to preventrecall bias.
Study outcome was assessed by comparing total number, characterization scores (0-7), and diagnostic con�dence(determinate vs. indeterminate) for all lesions detected by the three PET/CT techniques. Both patient-based and lesion-based data were collected and analyzed. To compare diagnostic performance, we compared the interpretation obtainedfrom PET/CT studies with the corresponding results from intra-operative �ndings, pathologic study, or change inimaging �ndings during a minimum follow-up period of 6 months. Among patients with no intraoperative �ndings,lesions that decreased in size or that remain unchanged without receiving any further treatment were consideredbenign, while progressive lesions were considered to be malignant.
Statistical analysis and sample size calculation
All data were analyzed using the statistical software package PASW Statistics for Windows, Version 18.0 (SPSS, Inc.,Chicago, IL, USA) and MedCal version 18.2.1 (MedCalc Software bvba, Ostend, Belgium; http://www.medcalc.org;2018). Categorical variables were analyzed using chi-square test, and continuous variables were tested using one-wayanalysis of variance (ANOVA) with post hoc analysis. McNemar’s test was used to determine the statistical signi�canceof differences in lesion detection accuracy by PET/NCCT, PET/CECT, and PET/NCCT-CECT. Kappa statistic was used toanalyze agreement of interpretation between PET/CT techniques. For all tests, a p-value less than 0.05 was consideredstatistically signi�cant. Receiver operating characteristic (ROC) curve analysis was performed to assess diagnosticperformance relative to the results obtained from intra-operative �nding, pathological study, or change in imaging�ndings from each technique. The sensitivity, speci�city, accuracy, likelihood ratio, positive predictive value (PPV), andnegative predictive value (NPV) of all techniques were determined. Net reclassi�cation improvement (NRI) of PET/CECTas compared to PET/NCCT was also calculated, with malignancy from �nal diagnosis being considered an event.
The sample size for this study was calculated using data from a study by Cantwell, et al.(2) Using a detection rate ofliver lesion by non-contrast enhanced PET/CT in patients with colorectal cancer of 70%, a signi�cance level of 0.05, anda power of 80%, the calculated sample size was 33. To cover the three most common types of cancer for which PET/CTstudy is requested and to compensate for a 10% loss of data for any reason, the calculated minimum sample size was110 patients.
Results

Page 5/16
Demographic data
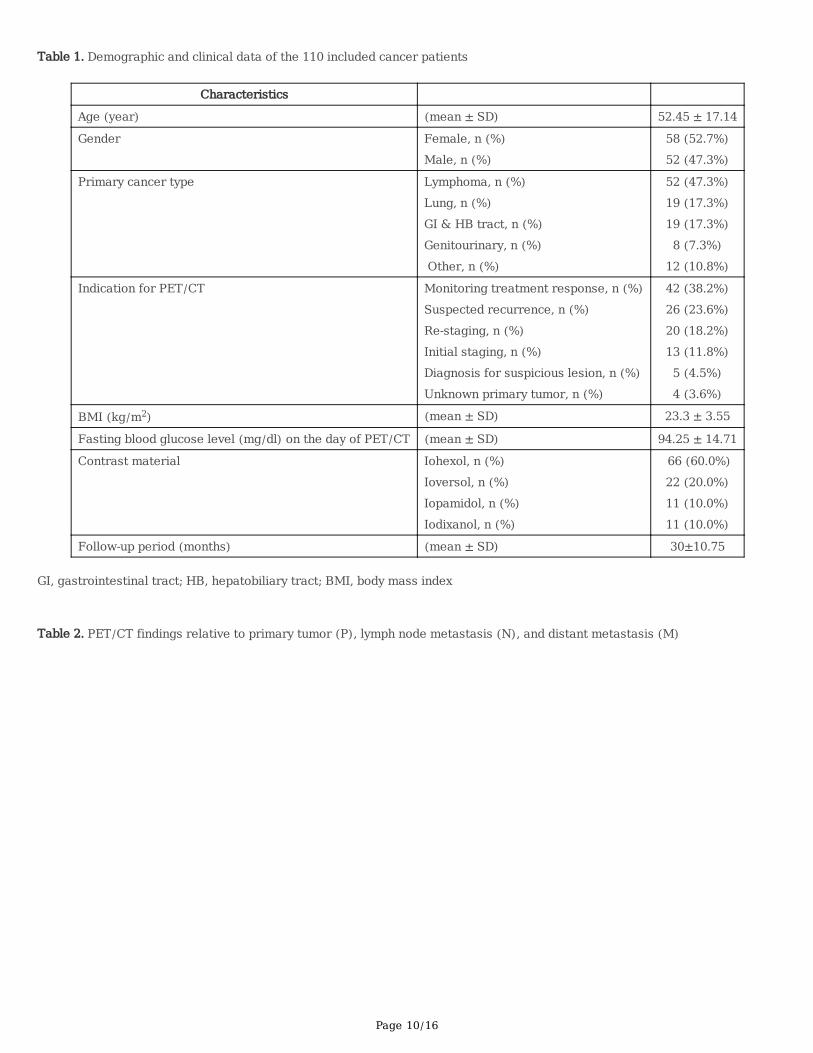
There were 110 cancer patients included. The types of cancer that were presented included lymphoma, lungcancer, gastrointestinal and hepatobiliary tract cancer, genitourinary cancer, and other cancers (5 breast cancer, 3sarcoma, 2 melanoma, 2 metastatic cancer of unknown primary, and 1 thyroid cancer). The mean age of patients was52.45±17.14 years, and 52.7% were female. Approximately one-third of patients were indicated for PET/CT to monitorresponse during treatment – with or without baseline study. Detailed demographic and clinical data of the studypopulation are shown in Table 1.
Lesion detection and characterization
No signi�cant difference was observed between the PET/CT technique used and the total/individual lesion score at theprimary tumor site, lymph node, or distant organ. The details of lesions detected by each PET/CT technique aresummarized in Table 2. Indeterminate lesions (scores 1, 6, and 7) were found at the primary site in 7/53 (13.2%), 6/55(10.9%), and 6/56 (10.7%) of cases; at lymph node in 8/82 (9.8%), 6/84 (7.1%), and 6/84 (7.1%) of cases; and, atdistant metastatic site in 33/93 (35.5%), 33/95 (34.7%), and 31/95 (32.6%) of cases with PET/NCCT, PET/CECT, andPET/NCCT-CECT, respectively. No signi�cant difference in indeterminate lesions was found among PET/CT techniques.There was very high agreement for diagnostic characterization of these lesions among PET/CT techniques (p>0.05)relative to both score and diagnostic con�dence (determinate vs. indeterminate) (Table 3).
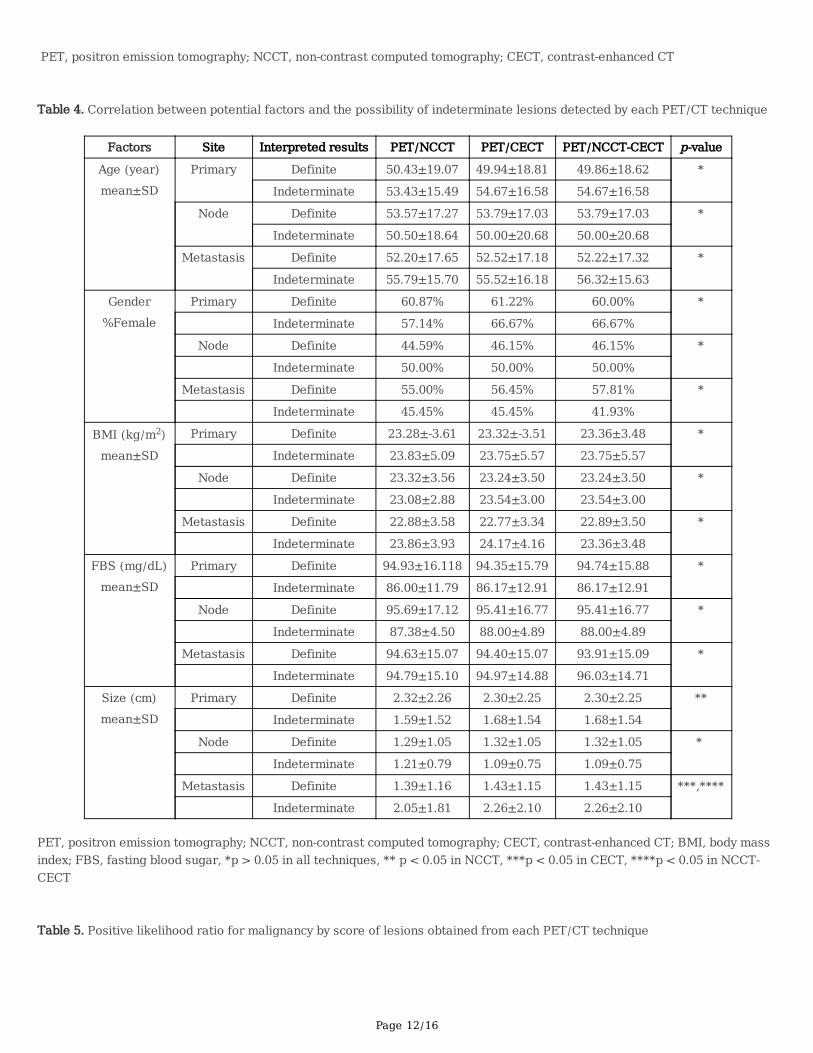
We also evaluated correlation between potential factors and the possibility of indeterminate lesions detected by eachPET/CT technique, as shown in Table 4. Overall, there was no statistically signi�cant difference in diagnosticcon�dence between any PET/CT technique and gender, primary tumor type, or indication for PET/CT at primary tumorsite, lymph node, or distant metastatic site. However, statistically signi�cant differences in diagnostic con�dence wereobserved at distant metastatic sites relative to primary tumor type (mostly in GU and GI systems with p-values of 0.026,0.017, and 0.003 in PET/NCCT, PET/CECT, and PET/NCCT-CECT, respectively), and indication for PET/CT (mostly inCUP with p-values of 0.07 and 0.025 in PET/CECT and PET/NCCT-CECT, respectively).
From 371 total detectable lesions, the most common location was thoracic lymph node (n=76), followed by lung(n=59), bone (n=47), liver (n=44), and abdominal lymph node (n=31). The average size of all 291 measurable lesionswas 1.73±1.68 cm. From ROC curve analysis, the best cut-off for detectable lesion size was 1.25 cm, with a sensitivityand speci�city of 71.1% and 71.2%, respectively. Interestingly, there were signi�cant differences in lesion size betweende�nite and indeterminate lesions in some techniques, but in the opposite ways. Speci�cally, inderminate lesionstended to be found more often in larger lesions at the primary site, but in smaller lesions at distant metastatic sites.
Diagnostic performance
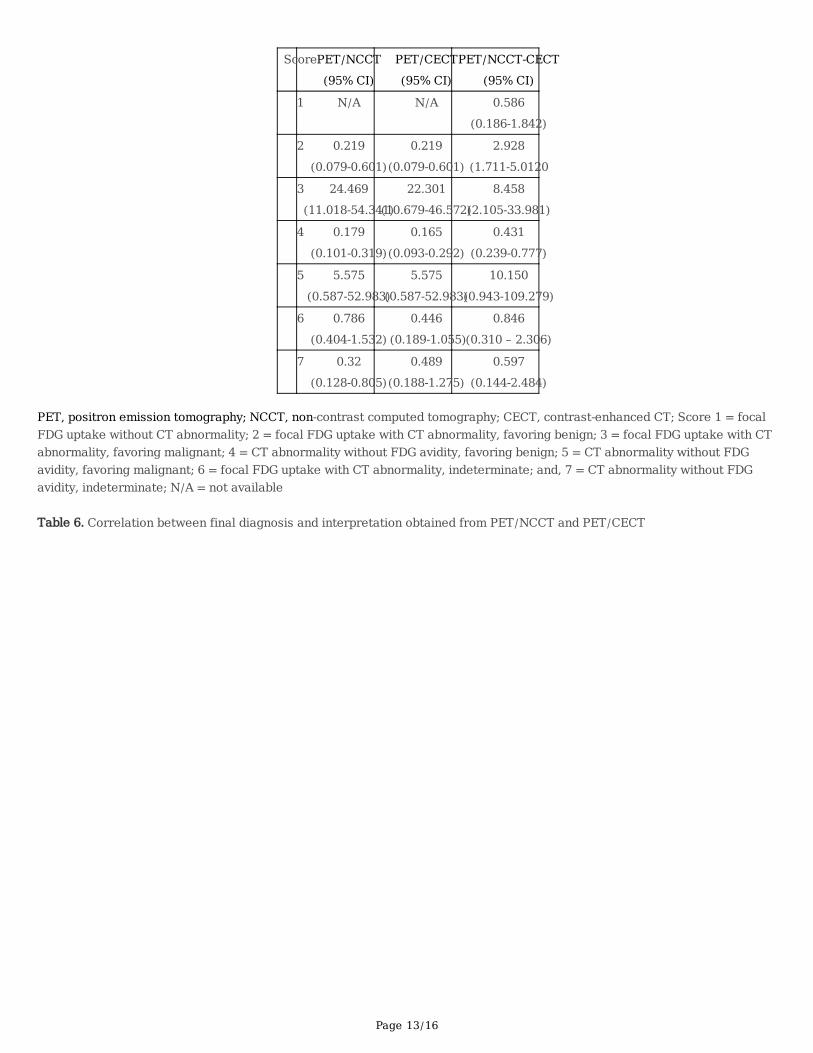
There were 17 patients (15.5%, 48 lesions) who did not follow-up at our center, so their �nal outcome data were notavailable. The sensitivity, speci�city, accuracy, PPV, and NPV of PET/CT techniques in the remaining 93 patients wereevaluated against the corresponding results of intra-operative �nding in 14 patients (17 lesions; 16 malignant, 1benign). In the other 79 patients, 97 lesions were considered to be malignant based on observed disease progression,and 209 lesions were considered to be benign due to no change or decrease in lesion size during the mean follow-up of30 months. The following ranges were observed from all PET/CT techniques: sensitivity 81.5%-85.3%, speci�city94.4%-95.5%, accuracy 89.4%-91.4%, PLR 14.572-18.719, NLR 0.155-0.196, PPV 90.4%-92.1%, and NPV 88.9%-91.3%(Figure 2). The AUC obtained from ROC curve analysis was 0.9, 0.902, and 0.88 for PET/NCCT, PET/CECT, andPET/NCCT-CECT, respectively. The indeterminate lesions (81 lesions in PET/NCCT, 65 lesions in PET/CECT andPET/NCCT-CECT) were excluded from diagnostic performance evaluation, but they are discussed further in theDiscussion section. Based on the likelihood of malignancy per each lesion score (Table 5), lesion with positive FDG
Page 6/16
uptake and characteristics indicative of malignancy from CT �ndings (score 3) showed the highest likelihood ofmalignancy in all techniques, followed by lesion with evidence of malignancy by CT without FDG uptake (score 5).Other lesions without suggestive evidence of malignancy either by PET together with CT or CT alone showed relativelylow likelihood of malignancy.
Of the other 252 lesions with de�nite impression by both PET/NCCT and PET/CECT, there was no lesion that wasidenti�ed as benign in PET/NCCT that was changed to malignant by PET/CECT (or vice versa) regardless of �naldiagnosis group. Therefore, the calculated NRIe, NRIne, and sum NRI were all 0 (Table 6).
Adverse reaction from contrast material
Two patients developed skin rash within 24 hours after intravenous contrast injection for a prevalence of adversereaction of 1.8%. Both events were mild in severity, and no active treatment was required. No serious adverse eventswere observed during this study.
DiscussionIn contrast to the added bene�cial effect of intravenous contrast material found and reported in some studies(2-6), wefound no signi�cantly added value from the use of intravenous contrast material relative to diagnostic con�dence ordiagnostic performance of [F-18]FDG PET/CT study using CECT alone or combined NCCT/CECT. The detection rate,diagnostic con�dence as de�ned by percentage of indeterminate lesions, and diagnostic performance of PET/CECTand PET/NCCT-CECT were almost identical. This can be explained by the fact that the main component of resultsinterpretation on PET/NCCT-CECT is mainly based on contrast-enhanced CT image. Thus, dual CT scans provide noadditional bene�t; however, they expose the patient to added and unnecessary radiation, even though only minimalexposure from the low-dose CT used in PET/CT is claimed. Similar results were also observed in previous studies inpatients with lymphoma(7), and head and neck cancer.(8-9) Despite the reported added value of contrast material inPET/CT study that has been reported in cancers of the head and neck, abdominal and pelvic regions, and possibly intumors with mild or no [F-18]FDG avidity(2,4,5,6,8), our results failed to show statistically signi�cant added value ofcontrast-enhanced CT regardless of the region of the detectable lesions. However, there were 16 indeterminate lesionsfrom PET/NCCT that were de�nitely classi�ed by PET/CECT, and 5 of those were found to be malignant in the �naldiagnosis. Most of those lesions were small intra-abdominal lesions with faint FDG activity that were easier to identifyand diagnose via the use of contrast enhancement.
There was no signi�cant correlation between incidence of indeterminate lesion at the primary site or lymph node andgender, primary cancer type, or indication for PET/CT. However, signi�cant correlation was found between indeterminatemetastatic lesions with primary cancer type and indication for PET/CT, particularly the PET/CECT and PET/NCCT-CECTtechniques. The highest incidence of indeterminate metastatic lesions was found in approximately half of genitourinarycancer, gastrointestinal tract cancer, and hepatobiliary tract cancer, and in approximately two-thirds of patientsindicated for PET/CT due to cancer of unknown primary (CUP) and for diagnosis of suspicious lesion(s). Mostindeterminate lesions (71 in PET/NCCT and 55 in PET/CECT) demonstrated mild FDG uptake. As a result, the �ndingsfrom CT did not ful�l the criteria for malignancy. Even though the use of contrast material seemed to lower the numberof indeterminate lesions, the difference between PET/CT techniques was not statistically signi�cant. Considering thehighest likelihood of malignancy that can be obtained from lesions with positive �ndings from both FDG PET and CT,while the lowest likelihood in lesions detected by CT only without FDG uptake, unless strong evidence of malignancyfrom CT, the signi�cance of these additional non-FDG avid lesions might be relatively low. In additional lesions detectedby CT without FDG avidity, a �nal diagnosis of malignancy was found in 11/135 (8.1%) vs. 11/125 (8.8%), 3/4 (75%)vs. 3/4 (75.0%). and 5/24 (20.8%) vs. 5/34 (14.7%) of lesions classi�ed as benign, malignant, and indeterminate by

Page 7/16
NCCT and CECT, respectively. All of these results show no signi�cant incremental advantage of intravenous material inPET/CT study. In addition, the unnecessary use of contrast material should be avoided due to its potentially seriousside effects. The incidence rate of side effects in this study was a low 1.8% due to our strict adherence to setting-speci�c guidelines. Moreover, the cost of contrast material is approximately 100 USD per patient, which makes it a highunnecessary expense in cases that will not bene�t from contrast enhancement. Taken together, our data do not supportthe routine use of contrast material in whole body PET/CT study.
We admit that this study has some limitations. First, this was a single-center study with a relatively small sample sizecompared to previous publications. [F-18]FDG PET/CT study in Thailand has limited indications for reimbursement(currently only in colorectal cancer and non-small cell lung cancer), so this technique is still underutilized. This explainswhy the sample size is so small and why the study period is so long. Second, most of the enrolled PET/CT studies wereperformed post-treatment, which may affect the detection rate of malignant diseases. The prevalence of malignancywas only 35% among all detectable lesions. Third, only a small number of case (n=14, 12.7%) had pathologicallyproven lesions detected by PET/CT, particularly among lesions identi�ed as benign or indeterminate. However, with themean follow-up of approximately 2 years, lesions that decreased in size or that remain unchanged without receivingany further treatment were considered benign, while progressive lesions were considered to be malignant. Fourth andlast, contrast-enhanced PET/CT in this study was performed in single-phase manner, so our results may not begeneralizable to multi-phase contrast-enhanced PET/CT, which was previously suggested by some authors.(17)
In contrast to other reports that studied in speci�c types of cancer, the strengths of this study are its prospective designand the fact that we studied different types of cancer, which increases the generalizability of our �ndings. However,further investigation in those cancers with a small number of cases, as well as in other indications, is needed to con�rmthe results of this study.
Conclusions The results of this prospective study revealed no signi�cant advantage of [F-18]FDG PET/CT over PET/NCCT for lesiondetection, lesion characterization, or diagnostic accuracy in patients with cancer. Although the rate of adverse eventswas extremely low, the use of intravenous contrast material should be limited to select cases in order to reduce the riskof renal toxicity and/or anaphylactic reaction, and to minimize unnecessary costs.
AbbreviationsFBS: fasting blood sugar
FDG: Fluorodeoxyglucose
GFR: glomerular �ltration rate
LSO: lutetium oxyorthosilicate
NRI: Net reclassi�cation improvement
NPV: negative predictive value
PET/CT: positron emission tomography/computed tomography
PET/CECT: contrast-enhanced PET/CT
Page 8/16
PET/NCCT: non-contrast-enhanced PET/CT
PET/NCCT-CECT: contrast-enhanced and non-contrast-enhanced PET/CT
PPV: positive predictive value
DeclarationsAcknowledgements
The authors gratefully acknowledge Dr. Akarin Nimmannit for being our project facilitator, Miss PimrapatTengtrakulchareon for assistance with developing our research methodology, Miss Dollaporn Polyeam for assistancewith data collection and analysis, and Dr. Chulaluk Komoltri and Miss Nerisa Thornsri for assistance with statisticalanalysis.
Funding
This study was supported by a grant from the Siriraj Research Development Fund (Managed by Routine to ResearchUnit: R2R), Faculty of Medicine Siriraj Hospital, Mahidol University (grant no. 14RD03017/074/14), and by aChalermprakiat Grant from the Faculty of Medicine Siriraj Hospital, Mahidol University to TT, PT, and PK.
Availability of Data and Materials
Please contact author for data requests.
Authors contribution
TT contributed in concepts, design, literature search, clinical studies, images interpretation, data analysis, manuscriptpreparation and guarantor, PT contributed in design, literature search, clinical studies, images interpretation, PM and PKcontributed in clinical studies, data acquisition and reconstruction. All authors have read and approved the manuscriptfor publication.
Ethical Approval and Consent to participate
This study was approved by the Siriraj Institutional Review Board (SIRB) (COA no. Si413/2014), and all patientsprovided written consent before enrollment into the study.
Consent for publication
Not applicable.
Competing interest
All authors declare no personal or professional con�icts of interest, and no �nancial support from the companies thatproduce and/or distribute the drugs, devices, or materials described in this report.
References1. El-Galaly TC, Gormsen LC, Hutchings M. PET/CT for Staging; Past, Present, and Future. Semin Nucl Med.
2018;48:4-16.

Page 9/16
2. Cantwell CP, Setty BN, Holalkere N, Sahani DV, Fischman AJ, Blake MA. Liver lesion detection and characterizationin patients with colorectal cancer: a comparison of low radiation dose non-enhanced PET/CT, contrast-enhancedPET/CT, and liver MRI. J Comput Assist Tomogr. 2008; 32:738-44.
3. Antoch G, Freudenberg LS, Beyer T, Bockisch A and Debatin JF. To Enhance or Not to Enhance? 18F-FDG and CTContrast Agents in Dual-Modality 18F-FDG PET/CT. J Nucl Med. 2004;45:56S–65S.
4. Soyka JD, Veit-Haibach P, Strobel K, Breitenstein S, Tschopp A, Mende KA, et al. Staging pathways in recurrentcolorectal carcinoma: is contrast-enhanced 18F-FDG PET/CT the diagnostic tool of choice? J Nucl Med. 2008;49:354-61.
5. Kitajima K, Murakami K, Yamasaki E, Domeki Y, Kaji Y, Fukasawa I, et al. Performance of integrated FDG-PET/contrast-enhanced CT in the diagnosis of recurrent ovarian cancer: comparison with integrated FDG-PET/non-contrast-enhanced CT and enhanced CT. Eur J Nucl Med Mol Imaging. 2008; 35:1439-48.
�. Behrendt FF, Temur Y, Verburg FA, Palmowski M, Krohn T, Pietsch H, et al. PET/CT in lung cancer: In�uence ofcontrast medium on quantitative and clinical assessment. Eur Radiol. 2012; 22:2458-64.
7. Rodrı´guez-Vigil1 B, G´omez-Le´on N, Pinilla1 I, Hern´andez-Maraver D, Coya J, Martı´n-Curto L, et al. PET/CT inlymphoma: prospective study of enhanced full-dose PET/CT versus unenhanced low-dose PET/CT. J Nucl Med.2006; 47:1643-48.
�. Goerres GW, Schuknecht B, Schmid DT, Stoeckli SJ, Hany TF. Positron emission tomography/computedtomography for staging and restaging of head and neck cancer: comparison with positron emission tomographyread together with contrast-enhanced computed tomography. Clin Imag. 2008; 32:431-7.
9. Yoshida K, Suzuki A, Nagashima T, Lee J, Horiuchi C, Tsukuda M, et al. Staging primary head and neck cancerswith (18)F-FDG PET/CT: is intravenous contrast administration really necessary? Eur J Nucl Med Mol Imaging.2009; 36:1417-24.
10. Erasmus JJ, Connolly JE, McAdams HP, Roggli VL. Solitary pulmonary nodules. I. Morphologic evaluation fordifferentiation of benign and malignant lesions. Radiographics. 2000; 20:43–58.
11. Erasmus JJ, Connolly JE, McAdams HP, Roggli VL. Solitary pulmonary nodules. II. Evaluation of indeterminatenodule. Radiographics. 2000; 20:59–66.
12. Swensen SJ, Viggiano RW, Midthun DE, et al. Lung nodule enhancement at CT: multicenter study. Radiology. 2000;214:73–80.
13. Austin JH, Garg K, Aberle D, Yankelevitz D, Kuriyama K, Lee HJ, et al. Radiologic implications of the 2011classi�cation of adenocarcinoma of the lung. Radiology. 2013; 266:62-71.
14. Ng SH, Yen TC, Laio CL, Chang JT, Chan SC, Ko SF, et al. 18F-FDG PET and CT/MRI in oral cavity squamous cellcarcinoma: a prospective study of 124 patients with histologic correlation. J Nucl Med. 2005; 46:1136-43.
15. UyBico SJ, Wu CC, Suh RD, Le NH, Brown K, Krishnam MS. Lung cancer staging essentials: the new TNM stagingsystem and potential imaging pitfalls. Radiographics. 2010; 30:1163-81.
1�. Kaur H, Choi H, You YN, Rauch GM, Jensen CT, Hou P, et al. MR imaging for preoperative evaluation of primaryrectal cancer: practical considerations. Radiographics. 2012;32:389-409
17. Morbelli S, Conzi R, Campus C, Cittadini G, Bossert I, Massollo M, et al. Contrast-enhanced [18 F]�uorodeoxyglucose-positron emission tomography/computed tomography in clinical oncology: tumor-, site-, andquestion-based comparison with standard positron emission tomography/computed tomography. Cancer Imag.2014;14:1-10.
Tables
Page 10/16
Table 1. Demographic and clinical data of the 110 included cancer patients
Characteristics
Age (year) (mean ± SD) 52.45 ± 17.14
Gender Female, n (%)Male, n (%)
58 (52.7%)52 (47.3%)
Primary cancer type Lymphoma, n (%)Lung, n (%)GI & HB tract, n (%)Genitourinary, n (%) Other, n (%)
52 (47.3%)19 (17.3%)19 (17.3%)8 (7.3%)
12 (10.8%)
Indication for PET/CT Monitoring treatment response, n (%)Suspected recurrence, n (%)Re-staging, n (%)Initial staging, n (%)Diagnosis for suspicious lesion, n (%)Unknown primary tumor, n (%)
42 (38.2%)26 (23.6%)20 (18.2%)13 (11.8%)5 (4.5%)4 (3.6%)
BMI (kg/m2) (mean ± SD) 23.3 ± 3.55
Fasting blood glucose level (mg/dl) on the day of PET/CT (mean ± SD) 94.25 ± 14.71
Contrast material Iohexol, n (%)Ioversol, n (%)Iopamidol, n (%)Iodixanol, n (%)
66 (60.0%)22 (20.0%)11 (10.0%)11 (10.0%)
Follow-up period (months) (mean ± SD) 30±10.75
GI, gastrointestinal tract; HB, hepatobiliary tract; BMI, body mass index
Table 2. PET/CT findings relative to primary tumor (P), lymph node metastasis (N), and distant metastasis (M)

Page 11/16
Lesion Score PET/NCCTN (%)
PET/CECTN (%)
PET/NCCT-CETN (%)
p valuePatient-based Lesion-based Patient-based Lesion-based Patient-based Lesion-based
Primarytumor
0 1234567
57 (51.8%)2 (1.8%)5 (4.5%)30 (27%)14 (13%)0 (0%)
4 (3.6%)1 (0.9%)
-2 (2.5%)5 (6.3%)49 (61%)19 (24%)0 (0%)4 (5%)
1 (1.3%)
55 (50%)1 (0.9%)7 (6.4%)
30 (27.3%)15 (13.6%)
0 (0%)4 (3.6%)1 (0.9%)
-1 (1.2%)7 (8.2%)
49 (57.6%)22 (25.9%)
0 (0%)4 (4.7%)2 (2.4%)
54 (49.1%)1 (0.9%)7 (6.4%)
30 (27.3%)17 (15%)0 (0%)
4 (3.6%)1 (0.9%)
-1 (1.1%)8 (9.1%)
49 (55.7%)25 (28%)0 (0%)
4 (4.5%)1 (1.1%)
0.50**1.00***0.25****
Lymphnode
0123 4 567
28 (25%)4 (3.6%)6 (5.4%)
34 (30.9%)
45 (40.9%)
0 (0%)9 (8.2%)2(1.8%)
-4(1.2%)8 (2.3%)
162 (47.4%)139 (40.8%)
0 (0%)25 (7.3%)3 (0.9%)
27 (25%)1 (0.9%)8 (7.3%)
34 (30.9%)
46 (41.8%)
0 (0%)9 (8.2%)2 (1.8%)
-1 (0.3%)11 (3.2%)
162 (46.6%)148 (42.5%)
0 (0%)24 (6.9%)2 (0.6%)
27 (25%)1 (0.9%)8 (7.3%)
34 (30.9%)
46 (41.8%)
0 (0%)8 (7.3%)1 (0.9%)
-1 (0.3%)11 (3.1%)
162 (46.4%)151 (43.3%)
0 (0%)23 (6.6%)1 (0.3%)
1.00**1.00***1.00****
Distantmetastasis
01234 567
17 (15%)15 (14%)16 (15%)31 (28%)
57 (51.8%)
4 (3.6%)13 (11.8%)8 (7.3%)
-20 (6.1%)24 (7.3%)117 (36%)
124 (37.7%)11 (3.3%)14 (4.2%)19 (5.8%)
15 (13.6%)14 (12.7%)16 (15%)31 (28%)59 (54%)
4 (3.6%)
14 (12.7%)8 (7.3%)
-19 (5.7%)24 (7.2%)118 (35%)127 (38%)
12 (3.6%)15 (4.5%)18 (5.4%)
14 (13%)14 (13%)
16 (14.5%)31 (28%)
59 (53.6%)
4 (3.6%)13 (12%)7 (6.4%)
-19 (5.7%)24 (7.2%)118 (35%)129 (39%)
13 (3.9%)14 (4.2%)17 (5.1%)
0.50**1.00***0.50****
PET, positron emission tomography; NCCT, non-contrast computed tomography; CECT, contrast-enhanced CT; score 0= noabnormality detected; 1= focal FDG uptake without CT abnormality; 2 = focal FDG uptake with CT abnormality, favored benign;3 = focal FDG uptake with CT abnormality, favored malignant; 4 = CT abnormality without FDG avidity, favored benign; 5 = CTabnormality without FDG avidity, favored malignant; 6 = focal FDG uptake with CT abnormality, indeterminate and 7 = CTabnormality without FDG avidity, indeterminateP value of **PET/NCCT vs PET/CECT, ***PET/CECT vs PET/NCCT-CECT, ****PET/NCCT vs PET/NCCT-CECT
Table 3. Lesion characterization agreement among different combinations of PET/CT techniques
Characterization PET/NCCT vs. PET/CECT PET/CECT vs. PET/NC_CECT PET/NCCT vs. PET/NC_CECT
Kappa (SD) 95% CI Kappa (SD) 95% CI Kappa (SD) 95% CI
Score 0.941 (0.01) 0.913-0.969 0.808 (0.02) 0.763-0.853 0.762 (0.02) 0.713-0.810
Definite vs. Indeterminate 0.864 (0.03) 0.799-0.929 1.000 (0.00) 1.000-1.000 0.864 (0.03) 0.799–0.929
Page 12/16
PET, positron emission tomography; NCCT, non-contrast computed tomography; CECT, contrast-enhanced CT
Table 4. Correlation between potential factors and the possibility of indeterminate lesions detected by each PET/CT technique
Factors Site Interpreted results PET/NCCT PET/CECT PET/NCCT-CECT p-value
Age (year)mean±SD
Primary Definite 50.43±19.07 49.94±18.81 49.86±18.62 *
Indeterminate 53.43±15.49 54.67±16.58 54.67±16.58
Node Definite 53.57±17.27 53.79±17.03 53.79±17.03 *
Indeterminate 50.50±18.64 50.00±20.68 50.00±20.68
Metastasis Definite 52.20±17.65 52.52±17.18 52.22±17.32 *
Indeterminate 55.79±15.70 55.52±16.18 56.32±15.63
Gender%Female
Primary Definite 60.87% 61.22% 60.00% *
Indeterminate 57.14% 66.67% 66.67%
Node Definite 44.59% 46.15% 46.15% *
Indeterminate 50.00% 50.00% 50.00%
Metastasis Definite 55.00% 56.45% 57.81% *
Indeterminate 45.45% 45.45% 41.93%
BMI (kg/m2)mean±SD
Primary Definite 23.28±-3.61 23.32±-3.51 23.36±3.48 *
Indeterminate 23.83±5.09 23.75±5.57 23.75±5.57
Node Definite 23.32±3.56 23.24±3.50 23.24±3.50 *
Indeterminate 23.08±2.88 23.54±3.00 23.54±3.00
Metastasis Definite 22.88±3.58 22.77±3.34 22.89±3.50 *
Indeterminate 23.86±3.93 24.17±4.16 23.36±3.48
FBS (mg/dL)mean±SD
Primary Definite 94.93±16.118 94.35±15.79 94.74±15.88 *
Indeterminate 86.00±11.79 86.17±12.91 86.17±12.91
Node Definite 95.69±17.12 95.41±16.77 95.41±16.77 *
Indeterminate 87.38±4.50 88.00±4.89 88.00±4.89
Metastasis Definite 94.63±15.07 94.40±15.07 93.91±15.09 *
Indeterminate 94.79±15.10 94.97±14.88 96.03±14.71
Size (cm)mean±SD
Primary Definite 2.32±2.26 2.30±2.25 2.30±2.25 **
Indeterminate 1.59±1.52 1.68±1.54 1.68±1.54
Node Definite 1.29±1.05 1.32±1.05 1.32±1.05 *
Indeterminate 1.21±0.79 1.09±0.75 1.09±0.75
Metastasis Definite 1.39±1.16 1.43±1.15 1.43±1.15 ***,****
Indeterminate 2.05±1.81 2.26±2.10 2.26±2.10
PET, positron emission tomography; NCCT, non-contrast computed tomography; CECT, contrast-enhanced CT; BMI, body massindex; FBS, fasting blood sugar, *p > 0.05 in all techniques, ** p < 0.05 in NCCT, ***p < 0.05 in CECT, ****p < 0.05 in NCCT-CECT
Table 5. Positive likelihood ratio for malignancy by score of lesions obtained from each PET/CT technique
Page 13/16
ScorePET/NCCT(95% CI)
PET/CECT(95% CI)
PET/NCCT-CECT(95% CI)
1 N/A N/A 0.586(0.186-1.842)
2 0.219(0.079-0.601)
0.219(0.079-0.601)
2.928(1.711-5.0120
3 24.469(11.018-54.341)
22.301(10.679-46.572)
8.458(2.105-33.981)
4 0.179(0.101-0.319)
0.165(0.093-0.292)
0.431(0.239-0.777)
5 5.575(0.587-52.983)
5.575(0.587-52.983)
10.150(0.943-109.279)
6 0.786(0.404-1.532)
0.446 (0.189-1.055)
0.846(0.310 – 2.306)
7 0.32(0.128-0.805)
0.489(0.188-1.275)
0.597(0.144-2.484)
PET, positron emission tomography; NCCT, non-contrast computed tomography; CECT, contrast-enhanced CT; Score 1 = focalFDG uptake without CT abnormality; 2 = focal FDG uptake with CT abnormality, favoring benign; 3 = focal FDG uptake with CTabnormality, favoring malignant; 4 = CT abnormality without FDG avidity, favoring benign; 5 = CT abnormality without FDGavidity, favoring malignant; 6 = focal FDG uptake with CT abnormality, indeterminate; and, 7 = CT abnormality without FDGavidity, indeterminate; N/A = not available Table 6. Correlation between final diagnosis and interpretation obtained from PET/NCCT and PET/CECT

Page 14/16
Finaldiagnosis
PET/CECT Total
FDG +,CT
benign
FDG +,CT
malignant
FDG -,CT
benign
FDG -,CT
malignant
FDG +,CT
indeterminate
FDG -,CT
indeterminate
Benign PET/NCCT FDG +, CTbenign
34 0 0 0 0 0 34
FDG +, CTmalignant
0 6 0 0 0 0 6
FDG -, CTbenign
0 0 114 0 0 0 114
FDG -, CTmalignant
0 0 0 1 0 0 1
FDG +,CTindeterminate
0 1 0 0 25 0 26
FDG -, CTindeterminate
0 0 10 0 0 19 29
Total 34 7 124 1 25 19 210
Malignant PET/NCCT FDG +, CTbenign
4 0 0 0 0 0 4
FDG +, CTmalignant
0 79 0 0 0 0 79
FDG -, CTbenign
0 0 11 0 0 0 11
FDG -, CTmalignant
0 0 0 3 0 0 3
FDG +,CTindeterminate
0 5 0 0 6 0 11
FDG -,CTindeterminate
0 0 0 0 0 5 5
Total 4 84 11 3 6 5 113
Total PET/NCCT FDG +, CTbenign
38 0 0 0 0 0 38
FDG +, CTmalignant
0 85 0 0 0 0 85
FDG -, CTbenign
0 0 125 0 0 0 125
FDG -, CTmalignant
0 0 0 4 0 0 4
FDG +, 0 6 0 0 31 0 37
Page 15/16
CTindeterminate
FDG -,CTindeterminate
0 0 10 0 0 24 34
Total 38 91 135 4 31 24 323
PET, positron emission tomography; NCCT, non-contrast computed tomography; CECT, contrast-enhanced CT; FDG +, positiveFDG uptake; FDG -, negative FDG uptake
Figures

Page 16/16
Figure 1
Flow diagram of patient enrollment and the study protocol
Figure 2
Diagnostic performance among PET/NCCT, PET/CECT, and PET/NCCT-CECT * PET, positron emission tomography;NCCT, non-contrast computed tomography; CECT, contrast-enhanced CT; AUC, area under the curve; PLR, positivelikelihood ratio; NLR, negative likelihood ratio; PPV, positive predictive value; NPV, negative predictive value*Indeterminate results by each PET/CT technique were excluded
Copyright © 2022 FDOKUMEN