![Detection of Pancreatic Carcinomas by Imaging Lactose-Binding Protein Expression in Peritumoral Pancreas Using [18F]Fluoroethyl-Deoxylactose PET/CT](https://static.fdokumen.com/doc/165x107/631be6bc93f371de19012dfd/detection-of-pancreatic-carcinomas-by-imaging-lactose-binding-protein-expression.jpg)
Automatic alignment of myocardial perfusion PET and 64-slice coronary CT angiography on hybrid...
24
Automatic alignment of myocardial perfusion PET and 64-slice coronary CT angiography on hybrid PET/CT Ryo Nakazato, MD, PhD a , Damini Dey, PhD b,c , Erick Alexánderson, MD d,e , Aloha Meave, MD d,e , Moisés Jiménez, MD d,e , Edgar Romero, MD d , Rodrigo Jácome, MD d , Marco Peña, MD d , Daniel S. Berman, MD a,c , and Piotr J. Slomka, PhD a,c a Departments of Imaging and Medicine, and Cedars-Sinai Heart Institute, Cedars-Sinai Medical Center, Los Angeles, CA, USA b Department of Biomedical Sciences and Biomedical Imaging Research Institute, Cedars-Sinai Medical Center, Los Angeles, CA, USA c David Geffen School of Medicine, University of California Los Angeles, Los Angeles, CA, USA d Unidad PET/CT Ciclotrón, Facultad de Medicina, Universidad Nacional Autónoma de México, Mexico, D.F., Mexico e Instituto Nacional de Cardiología Ignacio Chávez, Mexico, D.F., Mexico Abstract Background—Hybrid PET/CT allows acquisition of cardiac PET and coronary CT angiography (CCTA) in one session. However, PET and CCTA, are acquired with differing breathing protocols and require software registration. We aimed to validate automatic correction for breathing misalignment between PET and CCTA acquired on hybrid scanner. Methods—Single-session hybrid PET/CT studies of rest/stress 13 N-ammonia PET and CCTA in 32 consecutive patients were considered. Automated registration of PET left ventricular (LV) surfaces with CCTA volumes was evaluated by comparison to expert manual alignment by 2 observers. Results—The average initial misalignment between the position of LV on PET and CCTA was 27.2±11.8mm, 13.3±11.5mm, and 14.3±9.1mm in x, y, and z axes on rest, and 26.3±10.2mm, 11.1±9.5mm, and 11.7±7.1mm in x, y, and z axes on stress. The automated PET-CCTA co- registration had 95% agreement as judged visually. Compared to expert manual alignment, the translation errors of the algorithm were 5.3±2.8mm (rest) and 6.0±3.5mm (stress). 3D visualization of combined coronary vessel anatomy and hypoperfusion from PET could be made without further manual adjustments. Conclusion—Software co-registration of CCTA and PET myocardial perfusion imaging on hybrid PET/CT scanners is necessary, but can be performed automatically, facilitating integrated 3D display on PET/CT. Address for correspondence: Piotr Slomka, PhD, Department of Imaging, Cedars-Sinai Medical Center, 8700 Beverly Boulevard, Taper Building Suite A047, Los Angeles, CA 90048, USA, Phone: 310-423-4348, Fax: 310-423-0171, [email protected]. Conflict of interest statement: Drs. Daniel Berman and Piotr Slomka receive royalties from the software employed in the study. All others disclose no current conflict of interest. NIH Public Access Author Manuscript J Nucl Cardiol. Author manuscript; available in PMC 2013 June 01. Published in final edited form as: J Nucl Cardiol. 2012 June ; 19(3): 482–491. doi:10.1007/s12350-012-9528-7. $watermark-text $watermark-text $watermark-text
-
Upload
independent -
Category
Documents
-
view
1 -
download
0
Transcript of Automatic alignment of myocardial perfusion PET and 64-slice coronary CT angiography on hybrid...

Automatic alignment of myocardial perfusion PET and 64-slicecoronary CT angiography on hybrid PET/CT
Ryo Nakazato, MD, PhDa, Damini Dey, PhDb,c, Erick Alexánderson, MDd,e, Aloha Meave,MDd,e, Moisés Jiménez, MDd,e, Edgar Romero, MDd, Rodrigo Jácome, MDd, Marco Peña,MDd, Daniel S. Berman, MDa,c, and Piotr J. Slomka, PhDa,c
aDepartments of Imaging and Medicine, and Cedars-Sinai Heart Institute, Cedars-Sinai MedicalCenter, Los Angeles, CA, USAbDepartment of Biomedical Sciences and Biomedical Imaging Research Institute, Cedars-SinaiMedical Center, Los Angeles, CA, USAcDavid Geffen School of Medicine, University of California Los Angeles, Los Angeles, CA, USAdUnidad PET/CT Ciclotrón, Facultad de Medicina, Universidad Nacional Autónoma de México,Mexico, D.F., MexicoeInstituto Nacional de Cardiología Ignacio Chávez, Mexico, D.F., Mexico
AbstractBackground—Hybrid PET/CT allows acquisition of cardiac PET and coronary CT angiography(CCTA) in one session. However, PET and CCTA, are acquired with differing breathing protocolsand require software registration. We aimed to validate automatic correction for breathingmisalignment between PET and CCTA acquired on hybrid scanner.
Methods—Single-session hybrid PET/CT studies of rest/stress 13N-ammonia PET and CCTA in32 consecutive patients were considered. Automated registration of PET left ventricular (LV)surfaces with CCTA volumes was evaluated by comparison to expert manual alignment by 2observers.
Results—The average initial misalignment between the position of LV on PET and CCTA was27.2±11.8mm, 13.3±11.5mm, and 14.3±9.1mm in x, y, and z axes on rest, and 26.3±10.2mm,11.1±9.5mm, and 11.7±7.1mm in x, y, and z axes on stress. The automated PET-CCTA co-registration had 95% agreement as judged visually. Compared to expert manual alignment, thetranslation errors of the algorithm were 5.3±2.8mm (rest) and 6.0±3.5mm (stress). 3Dvisualization of combined coronary vessel anatomy and hypoperfusion from PET could be madewithout further manual adjustments.
Conclusion—Software co-registration of CCTA and PET myocardial perfusion imaging onhybrid PET/CT scanners is necessary, but can be performed automatically, facilitating integrated3D display on PET/CT.
Address for correspondence: Piotr Slomka, PhD, Department of Imaging, Cedars-Sinai Medical Center, 8700 Beverly Boulevard,Taper Building Suite A047, Los Angeles, CA 90048, USA, Phone: 310-423-4348, Fax: 310-423-0171, [email protected].
Conflict of interest statement:Drs. Daniel Berman and Piotr Slomka receive royalties from the software employed in the study. All others disclose no currentconflict of interest.
NIH Public AccessAuthor ManuscriptJ Nucl Cardiol. Author manuscript; available in PMC 2013 June 01.
Published in final edited form as:J Nucl Cardiol. 2012 June ; 19(3): 482–491. doi:10.1007/s12350-012-9528-7.
$waterm
ark-text$w
atermark-text
$waterm
ark-text

INTRODUCTIONBoth myocardial perfusion imaging (MPI) and coronary CT angiography (CCTA) arewidely used for assessment of patients with suspected or known coronary artery disease(CAD). In current clinical practice, a physician subjectively performs the integration ofanatomic and physiologic information from angiography and MPI. The two image sets areviewed independently, and integration of the information is performed mentally. Someproportion of patients requires both examinations because of inconclusive results obtainedby the first test.(1, 2) In such cases, the combined imaging results are often challenging tointerpret, because of the presence of artifacts or equivocal findings in at least one modality.In addition, the location of a stenosis with respect to the left ventricular epicardial surfacecan only be judged with considerable approximation in some cases. The existence of morethan one stenosed artery exacerbates this problem, especially if the degree of stenosis isunclear since such stenosis may or may not cause perfusion abnormalities.
It has been suggested that visual analysis of fused MPI and CCTA images cansynergistically improve the diagnostic value of sequential combined imaging and reduce therate of equivocal studies.(3, 4) Manual tools for the purpose of combined visual analysishave been developed.(5) However, the manual interactive alignment of the images from twomodalities introduces subjective errors, takes a substantial amount of time, and limits thepractical clinical use of such tools. Previously, automated software tools for registeringstandalone single photon emission computed tomography (SPECT)-MPI and CCTA (6, 7)and SPECT to magnetic resonance imaging (8) have been described.
Hybrid positron emission tomography (PET)/CT potentially allows integrated multimodalitycardiac evaluation of MPI and CCTA in one scanning session. However, even with thehybrid scanner, the PET and CCTA are not truly simultaneous and are acquired withdiffering breathing protocols, resulting in significant misalignments of the images from thetwo modalities. Subsequently, cardiac PET and CCTA images cannot be accurately fused byhardware registration alone.
The aim of this study was to evaluate the amount of initial misalignment that occurs betweencardiac PET and CCTA studies obtained in one session on a hybrid scanner and to determinewhether previously developed software for standalone SPECT-CCTA cardiacapplications(6) could be applied as an automated correction tool for breathing misalignmentbetween CCTA and cardiac PET.
METHODSPatient Population
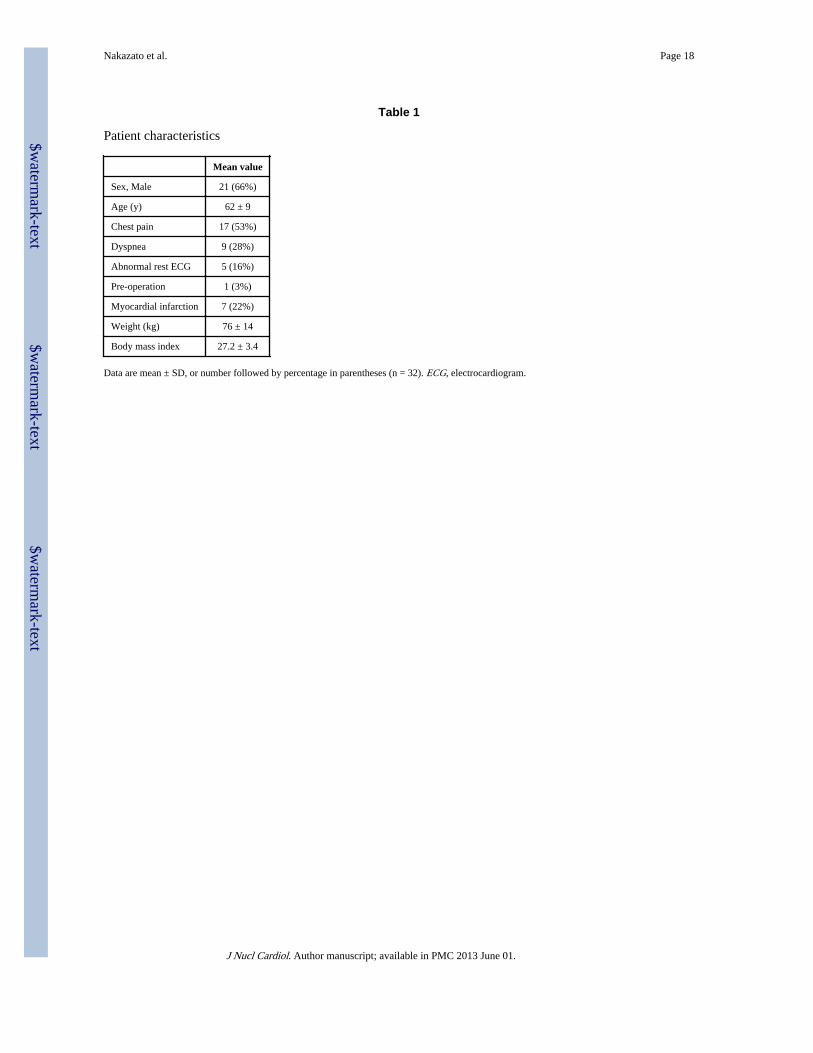
The study population consisted of a consecutive 32 patients (21 men, age 62 ± 9 years) withsuspected CAD referred for combined clinical evaluation of myocardial ischemia andcoronary anatomy in the same setting (Table 1). Seventeen patients had chest pain and 9patients had dyspnea. Patients with known hypersensitivity to the substances used during thestudy (i.e. β-blockers, iodinated contrast agent), patients with renal failure (serum creatininelevel >1.2mg/dL), and patients with contraindications for adenosine administration were allexcluded. The study was approved by the Institutional Review Board.
Integrated PET-CT ImagingAll patients were studied on a whole-body 64-slice PET/CT scanner (Biograph-64 TruePointPET/CT; Siemens Medical, Erlangen, Germany). Patients were studied after an overnight
Nakazato et al. Page 2
J Nucl Cardiol. Author manuscript; available in PMC 2013 June 01.
$waterm
ark-text$w
atermark-text
$waterm
ark-text
fast, and all refrained from caffeine-containing beverages or theophylline-containingmedications for 24 h prior to the study.
13N-ammonia PET scan acquisition, reconstruction—All image data was acquiredin list mode. Myocardial perfusion was assessed at rest and during vasodilator stress withadenosine and with 13N-ammonia as a tracer. Two CT-based transmission scans (120 kVp;20–30 mA; pitch = 1.35) were obtained prior to the rest perfusion studies and after the stressperfusion studies, for soft tissue photon attenuation. Myocardial perfusion was first assessedduring rest using 20 mCi of 13N-ammonia. Rest imaging extended for 10 min and startedfew seconds before the 13N-ammonia injection. The 13N-ammonia was administered as asingle peripheral IV bolus (3–5 s), followed by a 10-ml saline flush. Thirty min later a stressscan was performed, beginning with the infusion of adenosine over a 6-min period (0.14 mg/kg/min). A second dose of 20 mCi of 13N-ammonia was injected at the third min of theadenosine infusion, with 10 min stress acquisition started few seconds before the radiotracerinjection. Patients were instructed to breathe normally during the CT transmission and PETacquisition. The estimated mean effective radiation dose from 13N-ammonia PET was 1.5mSv for both rest and stress.(9) Static images were generated from the list mode data usingstandard reconstruction (2D Attenuation Weighted Ordered Subsets ExpectationMaximization) with 3 iterations and 14 subsets and 3D post-filtering with 5mm Gaussiankernel. Transverse data was reformatted to 168×168×47 matrix with 2 mm pixel size. Staticstress and rest perfusion images were reconstructed from the list mode data with a delay of 2minutes to allow for the clearance of the radioactivity from the blood pool.
CCTA scan acquisition, reconstruction and interpretation—CCTA (64-slice) wasperformed immediately after completion of the rest-stress 13N-ammonia PET protocol,without changing patient position on the imaging table. Prior to CT imaging, patients with aheart rate >70 bpm were given metoprolol (up to 100 mg oral or 20 mg intravenous in 5 mgincrements) to attain a heart rate <70 bpm. A short-acting nitrate (5 mg of isosorbidedinitrate) was given to all patients 2–3 min prior to the scan. For CCTA, after a timingbolus, ECG gated helical scanning was performed using ECG-based dose modulationwhenever possible, and administration of 60 to 80 mL of Iopamiron 370 (370 mg iodine/mL,rate 5 mL/sec, Schering Bayer, Germany) during a single breath-hold (~10 sec). Scanparameters included heart rate dependent pitch (range, 0.18–0.2), 330-ms gantry rotationtime, 120-kVp tube voltage, 550–945 mA tube current. The estimated mean effectiveradiation dose ranged from 12–15 mSv. Retrospectively, gated reconstruction of contrast-enhanced data was performed at end-systole and in diastole with the use of the followingparameters: 0.6 mm slice thickness, 0.3 mm slice increment, 250 mm field of view, 512×512matrix, and a “medium smooth” kernel. The cardiac phase with the best image quality wasused for further analysis. All CCTA images were analyzed by an experienced cardiologistblinded to the MPI scan result. Luminal-diameter stenosis severity was assessed asrecommended stenosis grading.(10) Percent obstruction of coronary artery lumen was basedon a comparison of the luminal diameter of the segment exhibiting obstruction to theluminal diameter of the most normal-appearing site immediately proximal to the stenoticlesion. Obstructive stenosis was defined as ≥50% luminal stenosis by visual assessment.
Myocardial perfusion quantification—The quantitative perfusion variable employedwas total perfusion deficit (TPD), which reflects a combination of both extent and severityof the defect in one parameter, as previously described.(11) Stress, rest and reversible(difference between stress and rest) myocardial perfusion defects on PET/CT were assessedby quantification of the TPD.(12, 13) MPI analysis was performed individually for eachvessel with the “group” function in QPET, in which 17 segments are assigned to a vascularterritory on the basis of the perfusion-defect pattern.(11) The portion of the TPD
Nakazato et al. Page 3
J Nucl Cardiol. Author manuscript; available in PMC 2013 June 01.
$waterm
ark-text$w
atermark-text
$waterm
ark-text
corresponding to a given territory was used for the automated quantification in each vessel,with a threshold of 2% as previously established.(11, 14) We have used the 13N-ammonianormal limits database, which is derived from gender combined very low likelihood patientswith normal perfusion images, for perfusion quantification.(15)
Automated co-registration—We have adopted previously developed software forstandalone SPECT to CCTA registration.(6) Briefly, to provide a robust registrationapproach, we registered pre-segmented MPI volumes using the left ventricle (LV)segmentation algorithm of quantitative gated PET(16) and the additional segmentation of theblood-pool region, derived from the MPI LV definition. For both CCTA and MPI,transverse image orientation was used during the registration process. The MPI-CCTAregistration algorithm was implemented as previously described.(6) Phase adjustment aspreviously described(7) was not performed in the current study. Automated co-registrationwas performed without any manual intervention. An overview of image processing ispresented in Figure 1.
Manual co-registration—For validation purposes, separate expert manual alignment wasperformed without knowledge of the automated co-registration results. Two expert observersindependently verified the alignment of CCTA images with emission PET data, using thefusion capability of the quantitative perfusion QPET software developed at our institution.(14) Data were reviewed in all planes using a multiplanar (sagital, coronal, and transverse)display of PET, CT, and fused PET/CT data. The manual alignment parameters [3translations (x, y, z)] by expert observers were recorded for the comparison with theautomated co-registration. X axis reflects left to right direction, y axis reflects front to backdirection, z axis reflects bottom to top (feet to head) direction. Experts were able to adjustthe window and level settings on the CT display and adjust alpha-blending between PET andCT image components before adjusting the position. Roving window display (an interactivesuperimposition of a portion of the PET image on the CT image) was also used in all casesto judge the misalignment.(17) The observers performed a visual alignment in 3 dimensions(x, y, z), adjusting x, y, and z shifts to measure quantitatively the misalignment betweenPET and CCTA data. The manual alignment process took about 2–3 min for each case. Toresolve the differences between 2 observers for the misalignment correction, average x, y,and z misalignments were computed by averaging 2 observers’ results for each case.
Comparison of manual and automatic registration—The automated co-registrationalgorithm was applied and compared to the average visual alignment for the 64 datasets (32stress and 32 rest). The offset from mean observer location choice was defined based on thecomparison of automated co-registration with averaged manual registration by 2 observersas the difference between the results of manual and automated alignment. The initialmisalignment between PET and CCTA before any corrections were applied (amount ofmotion correction) was defined as the difference between alignment parameters before andafter automated co-registration as well as before and after manual registration.
Vessel extraction and 3D visualization—For the 3D visualization of coronary vesselssuperimposed with MPI surfaces, we used the output obtained from CCTA analysis usingthe Syngo Circulation software (Siemens, Erlangen, Germany) on a LEONARDOworkstation (Siemens, Forchheim, Germany). The coronary tree was segmentedautomatically with a region-growing algorithm. To complete the coronary artery tree,missing vessel segments were marked manually and then added to the data set by thealgorithm.(18) The computer file containing the 3D binary mask was transferred to thestandalone workstation with QPET software. Within QPET, volume rendering wasperformed in OpenGL with 2D/3D textures and pre-assigned color tables with varying red-
Nakazato et al. Page 4
J Nucl Cardiol. Author manuscript; available in PMC 2013 June 01.
$waterm
ark-text$w
atermark-text
$waterm
ark-text
green-blue intensities and opacities to maximize the contrast opacity, provide realisticdisplay (blood/tissue, pink/red; calcium, white), and minimize the influence of neighboringtissue such as fat.(19) Further details were previously described.(6) A 3D bounding box wasused to speed up the volume rendering of coronary arteries. The bounding box was directlycomputed from the coronary mask. The rendering was integrated with the standard 3D MPIepicardial surfaces. Raw perfusion information of quantitative blackout maps could bedisplayed on the epicardial surface. Stress and rest images had the same CCTA imagesuperimposed. These segmented coronary trees derived from CCTA were used only fordisplay purposes and were not used in any way during the image registration process. Theimage registration algorithm was based on only the original transverse datasets.
CCTA-guided MPI contour and territory adjustment—At first, MPI images wereevaluated blinded to the CCTA result and without fusing CCTA images. Then, fused CCTAand MPI images were evaluated with overlaid contours in multiplanar orientations (bothcardiac axis and orthogonal views) in the fusion page of the QPET program. If discrepanciesbetween the MPI valve plane position and the location on CCTA were seen on the fusedimages, the contour was manually adjusted in the standard manual QPET page with standardMask and Constrain options(20); subsequently, the adjusted PET contour was verified by theCCTA fusion. Next, the default vascular territory boundaries were overlaid with the 3D LVMPI surfaces, with color-coded perfusion information and with a co-registered volumerendered segmented 3D coronary tree as described above. Vascular territories could then beadjusted segment by segment (based on a 17-segment American Heart Association model),using anatomic information provided by the 3D visualization of coronary vesselssuperimposed with MPI surfaces.
Statistical AnalysisAll continuous variables are expressed as mean ± SD. The overall agreement in alldirections was determined by calculating the linear weighted kappa coefficient between 2observers, between each observer versus the automated software and between averages of 2observers against automated software. The alignment tolerance of 5mm was appliedbetween 2 observers, between observer and automated software. Similarly, the categoricalscores for the kappa agreement have been computed by assuming 5 mm steps. The 95%limits of agreement from Bland-Altman analysis were reported and the McNemar’s test wasalso performed. The inter-observer variability was computed in all 3 directions. Successfulautomated co-registration was defined as the result with an offset from mean observerlocation choice of ≤ 5 mm. Statistical analyses were performed with SPSS software (version19.0, SPSS Inc., Chicago, Illinois).
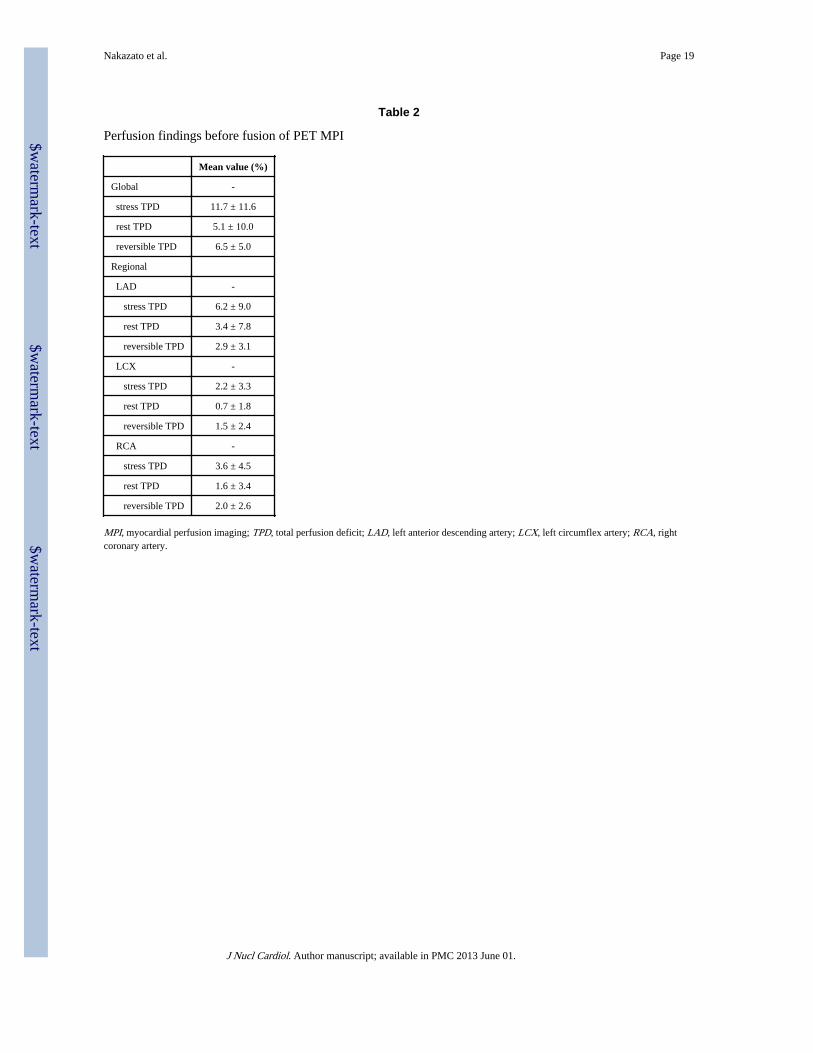
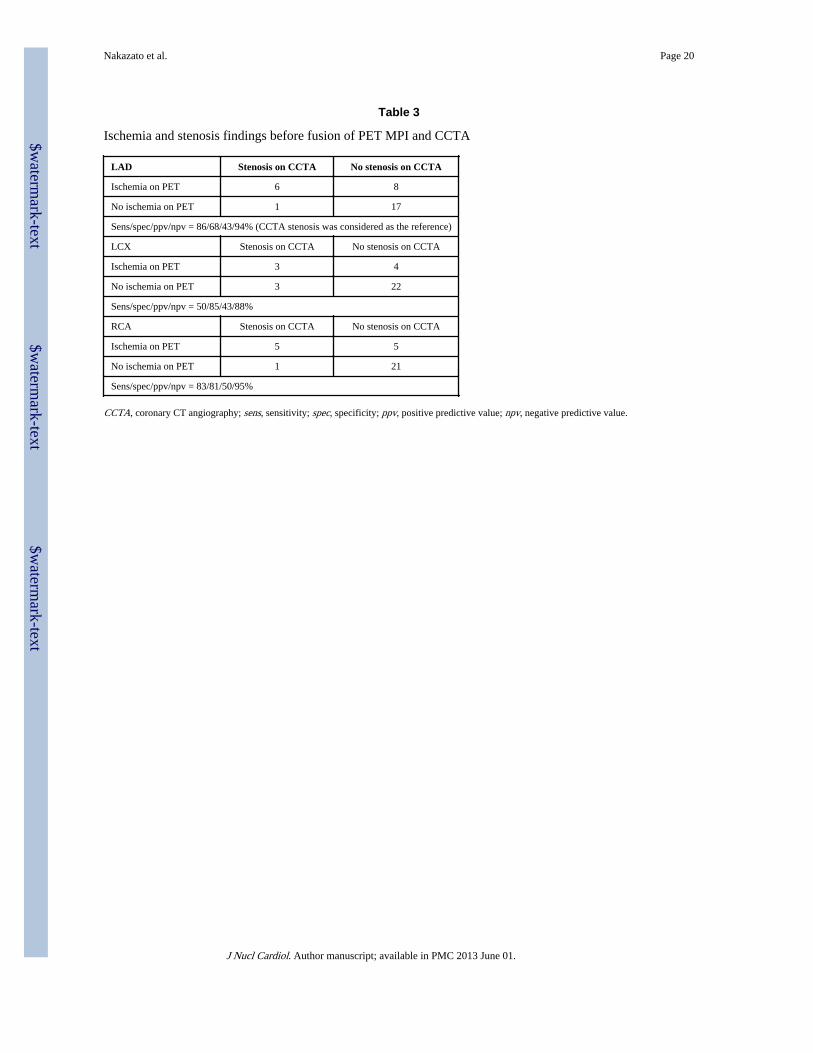
RESULTSCharacterization of perfusion abnormalities on PET before fusion of PET MPI and CCTAare described in Table 2. Quantitatively, mean TPD was 11.7% ± 11.6% on stress and 5.1%± 10.0% on rest. Myocardial ischemia and obstructive stenosis findings before fusion ofPET MPI and CCTA are summarized in Table 3. The presence of obstructive stenosis onCCTA was noted in 13 of 32 studies, with 7 left anterior descending artery (LAD) lesions, 6left circumflex artery (LCX) lesions and 6 right coronary artery (RCA) lesions. In thelesions with obstructive stenosis on CCTA, myocardial ischemia was found in 6 LADlesions, 3 LCX lesions and 5 RCA lesions on PET MPI. In the lesions without obstructivestenosis, 17 out of 25 showed no ischemia in LAD, 22 out of 26 showed no ischemia inLCX, and 21 out of 26 showed no ischemia in RCA.
Nakazato et al. Page 5
J Nucl Cardiol. Author manuscript; available in PMC 2013 June 01.
$waterm
ark-text$w
atermark-text
$waterm
ark-text
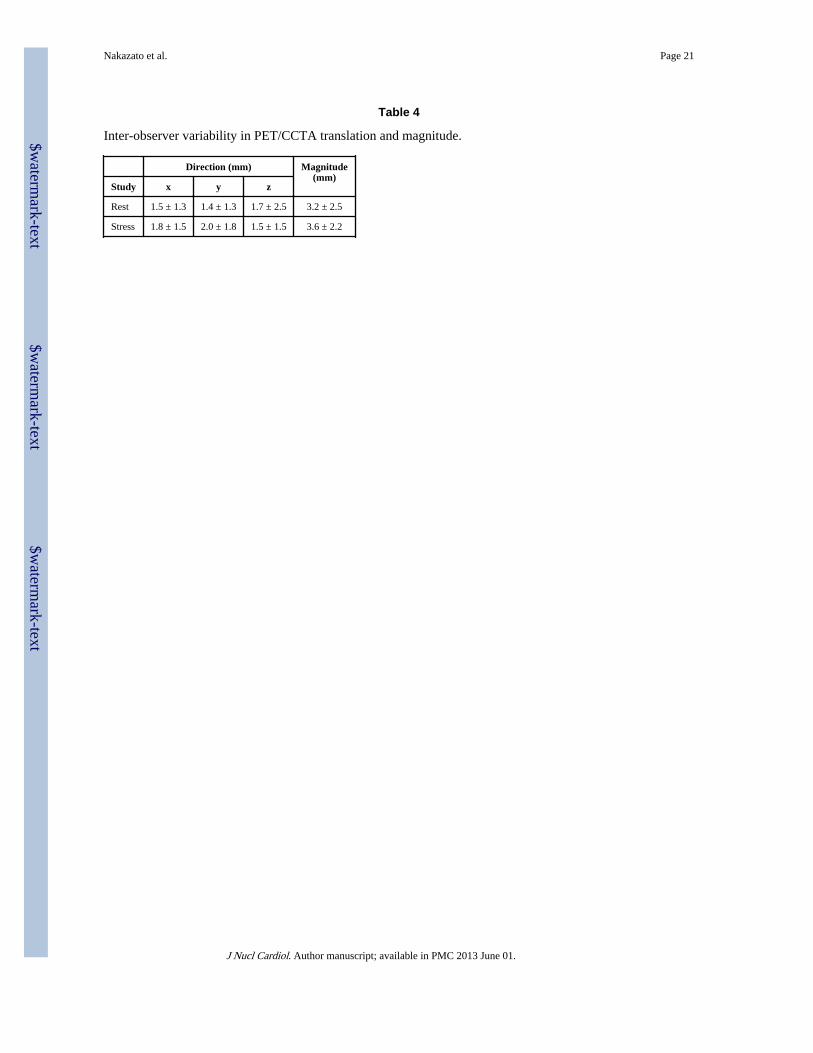
There was excellent agreement in all directions between 2 observers (97%), with a kappavalue of 0.90 [95% confidence intervals (CI) 0.86 to 0.94, p <0.0001], McNemar’s p=NS forrest. Similarly, there was excellent agreement between 2 observers (96%), with kappa valueof 0.86 (95% CI 0.80 to 0.93, p <0.0001), McNemar’s p=NS for stress. In regard totranslations on rest, 95% limits of agreement from Bland-Altman comparison ranged from−0.6 to 0.8 mm with a low bias of 0.1 mm in x, −1.0 to 0.4 mm with a low bias of 0.3 mm iny and −1.4 to 0.7 mm with a low bias of 0.3 mm in z. Similar results were found for stress.The 95% limits of agreement ranged from −0.7 to 1.0 mm with a low bias of 0.1 mm in x,0.0 to 1.8 mm with a low bias of 0.9 mm in y, and −0.1 to 1.3 mm with a low bias of 0.6 mmin z. In Table 4, inter-observer variability is specified in all 3 directions and the mean valueswere ≤ 2mm in all 3 directions.
The frequency and magnitude of the initial misalignment by automated co-registration onrest and stress studies are shown Figure 2. The initial PET-CCTA misalignment was 27.2 ±11.8 mm in x, 13.3 ± 11.5 mm in y, and 14.3 ± 9.1 mm in z axes on rest (Figure 3A), 26.3 ±10.2 mm in x, 11.1 ± 9.5 mm in y, and 11.7 ± 7.1 mm in z axes on stress (Figure 3B)studies. The frequency and magnitude of the initial misalignment by average of 2 observers(manual registration) on rest and stress studies are shown Figure 4. The initial PET-CCTAmisalignment by average of 2 observers (manual registration) was 26.4 ± 11.2 mm in x, 12.6± 10.8 mm in y, and 11.2 ± 8.3 mm in z axes on rest (Figure 5A), 25.3 ± 11.0 mm in x, 10.1± 8.5 mm in y, and 8.3 ± 6.4 mm in z axes on stress (Figure 5B) studies.
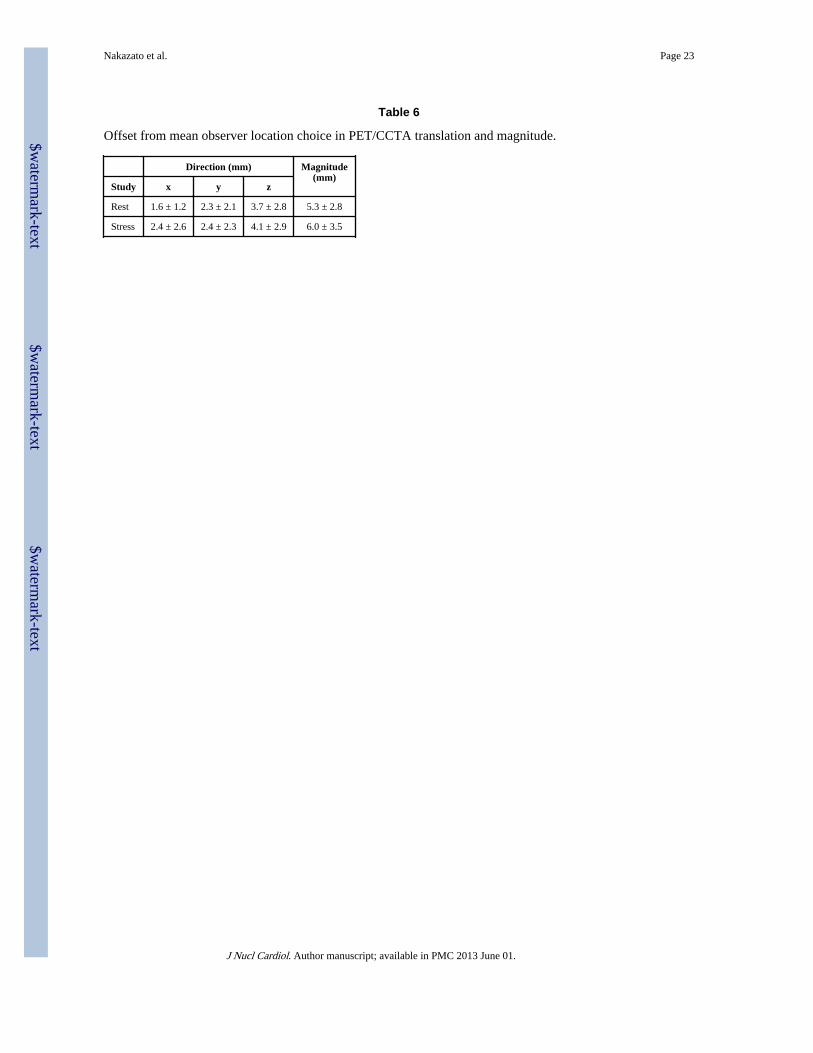
As shown in Table 5, there was excellent agreement in all directions between each observerversus automated software. Automated PET-CCTA co-registration had excellent agreementagainst mean of observers [agreement 97%, kappa (95% CI) 0.83 (0.78 to 0.88), p <0.0001,McNemar’s p=NS for rest; agreement 94%, kappa (95% CI) 0.80 (0.75 to 0.86), p <0.0001,McNemar’s p=NS for stress]. The automated co-registration processing time was about 2seconds for each case. The offset from mean observer location choice was 1.6 ± 1.2 mm inx, 2.3 ± 2.1 mm in y, and 3.7 ± 2.8 mm in z axes on rest, 2.4 ± 2.6 mm in x, 2.4 ± 2.3 mm iny, and 4.1 ± 2.9 mm in z axes on stress studies (Table 6). In regard to translations on rest,95% limits of agreement from Bland-Altman comparison ranged from −1.4 to 0.1 mm witha low bias of −0.6 mm in x, −1.2 to 1.1 mm with a low bias of 0.0 mm in y and −4.7 to −2.6mm with a low bias of −3.7 mm in z. Similarly, on stress, 95% limits of agreement rangedfrom −2.2 to 0.3 mm with a low bias of −1.0 mm in x, −1.1 to 1.3 mm with a low bias of 0.1mm in y and −5.2 to −3.1 mm with a low bias of −4.1 mm in z.
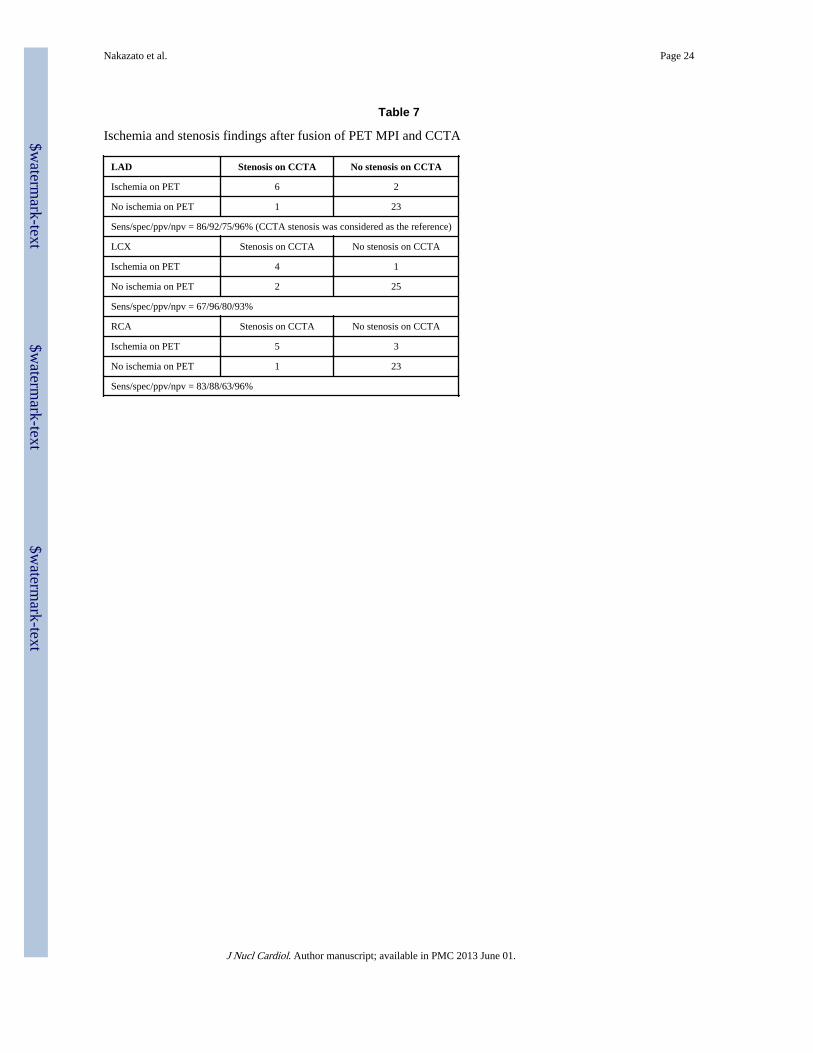
Overlaid PET/CCTA trees were superimposed on the 3D MPI surface based on theautomatic registration results between PET and CCTA volume. The coronary tree did notneed to be adjusted for the display in any patient as qualitatively judged by both observers.Based on the 3D fusion of CCTA and PET, LV contours were adjusted in 8 studies andvascular territories were adjusted in another 3 studies with co-registered CCTA images as aguide. Myocardial ischemia and obstructive stenosis findings after fusion of PET MPI andCCTA are summarized in Table 7. In the lesions with obstructive stenosis on CCTA,myocardial ischemia was found in 6 LAD lesions, 4 LCX lesions and 5 RCA lesions on PETMPI. In the lesions without obstructive stenosis, 23 out of 25 showed no ischemia in LAD,25 out of 26 showed no ischemia in LCX, and 23 out of 26 showed no ischemia in RCA. Wecould reduce false positive results by PET MPI resulting improved specificity (from68/85/81% to 92/96/88% for LAD/LCX/RCA, respectively) and positive predictive value(from 43/43/50% to 75/80/63% for LAD/LCX/RCA, respectively) using CCTA as thereference standard.
Figure 6 shows an example of 3D visualization of coronary vessels superimposed with MPIsurfaces before and after automated co-registration of MPI and CCTA. From the same
Nakazato et al. Page 6
J Nucl Cardiol. Author manuscript; available in PMC 2013 June 01.
$waterm
ark-text$w
atermark-text
$waterm
ark-text

patient in Figure 7, we show an example of the fused images obtained by the automated co-registration of MPI with CCTA.
DISCUSSIONHybrid SPECT-CCTA(21) or PET-CCTA imaging(22–24) performed in one session hasbeen proposed for PET/CT scanners equipped with multidetector-CT. However, if MPI-CCTA scans are obtained on a hybrid scanner, even with data from both modalities insimilar anatomic positions, interactive software realignment are required because ofmismatches in the respiratory phases.(17, 21, 25) It is likely that the availability of fast andreliable automatic registration will allow routine review of fused MPI-CCTA in clinicalpractice whenever both datasets are available. The manual registration would have to berepeated separately for stress and rest scans, and perhaps other scans such as gated scans.Furthermore, the need for the manual interactive alignment of the images from twomodalities introduces subjective errors and inter-observer variability, and limits the practicalday-to-day clinical use of such tools. Therefore, we can save the physician’s time andimprove the overall clinical workflow of multimodality hybrid imaging by the use of suchautomated tools.
Although in the current study PET-CCTA was acquired on a hybrid scanner with the patientin the same bed position for both PET and CCTA scan, we have found that the averagemagnitude of the initial PET-CCTA misalignment was 27.2 ± 11.8 mm in x, 13.3 ± 11.5 mmin y, and 14.3 ± 9.1 mm in z axes on rest, 26.3 ± 10.2 mm in x, 11.1 ± 9.5 mm in y, and 11.7± 7.1 mm in z axes on stress studies. The initial misalignment is substantially larger than theoffset from mean observer location choice or inter-observer variability. We have shown thatautomated software is very fast (2 seconds), reliable, and corrects for the initialmisalignment just as visual observers do. The offset from mean observer location choice iscomparable to the inter-observer variability. The agreement between the automated softwareand the visual observers is similar to the agreement between 2 observers. We demonstratedthat our automated co-registration method has a success rate of 95% in eliminating the initialPET-CCTA misalignment, with a similar offset from mean observer location choice asachieved in our previous study of CCTA-SPECT registration.(6)
In our previous method for SPECT-CCTA registration, gated images were processed with amotion-frozen algorithm(26) or phase matching(7) in order to provide static myocardialperfusion SPECT images to match the cardiac phase of CCTA.(6) In the current study, wedid not use motion-frozen data to demonstrate the practical image of image fusion withstatic perfusion data used in routine clinical analysis. Further evaluation could be performedwith the motion-frozen data and phase matching, and may yield more accurate results forboth visual observers and the automatic algorithm.
Finally, we have shown that the fusion approach synergistically improves the identificationof obstructive stenosis using CCTA as the reference standard, especially in specificity andpositive predictive value and no loss in sensitivity or negative predictive value.
LimitationsThis study has several limitations. First, our sample of studied patients is relatively small.Then the results of invasive coronary angiography (as the gold standard for evaluation ofcoronary stenosis) were not available in this study since only a small proportion of thepatients underwent this procedure. Nevertheless, this study focused on the validation of theautomated alignment between the 2 modalities. Although we performed fully automatedimage registration, the contour definitions and vascular territory were manually guided bythe coregistered CCTA anatomy; however, it is feasible that this adjustment can be
Nakazato et al. Page 7
J Nucl Cardiol. Author manuscript; available in PMC 2013 June 01.
$waterm
ark-text$w
atermark-text
$waterm
ark-text
automated in the future if automatic segmentation of CCTA scan is performed. In ourapplication, the success of registration depends on successful MPS contour determination. Ifthe contours are incorrectly determined, causing the LV shape to be grossly distorted, theautomatic registration could fail. Further, it is a currently clinically uncommon occurrencefor patients to have both PET and CCTA studies; however, such protocols have beenproposed for certain patient groups.(27, 28) Our estimated mean effective radiation dose wassimilar with helical CT protocol in those previous reports. The hybrid approach used in thisstudy was associated with a higher radiation exposure than alternative approaches usingeither PET or CCTA alone.(29) Note that the 13N-ammonia scan dose is very low for bothrest and stress scans (1.5 mSv for each)(9), which is much lower than radiation dose fromthe SPECT scan. Therefore dosimetry from the combined study 13N-ammonia PET iscomparable to approaches commonly used to investigate CAD (i.e., one-day technetium99m SPECT and CCTA or invasive coronary angiography). This exposure will be greatlyreduced, providing the ability of more extensive ECG dose modulation and prospectivegating with step-and-shoot protocols, which is expected to greatly reduce radiation dosesfrom CCTA by more than 50%. Furthermore, by potentially reducing the number ofunnecessary coronary revascularization procedures, the hybrid approach will ultimatelyresult in a lower overall radiation burden in patients. In addition, hybrid imaging may allowstress-only PET further reducing radiation dose.(28, 30) Finally, the motion-frozen data wasnot used and the phase on CCTA was not matched to MPI. This may be revisited in thefuture when “motion-frozen” images are used routinely for perfusion assessment.
CONCLUSIONSSoftware co-registration of CCTA and PET obtained on hybrid PET/CT scanners is stillnecessary due to different breathing protocols with the two modalities, but it can beperformed rapidly and automatically, allowing rapid integrated 3D display and CCTA-guided contour and territory adjustment on PET.
AcknowledgmentsThis work was supported in part by a grant to Dr. Berman from the Diane and Gilford Glazer Foundation. Wewould like to thank Mark Hyun from Cedars-Sinai Medical Center for his technical help. We would like to thankArpine Oganyan for editing and proof-reading the text. Drs. Daniel Berman and Piotr Slomka receive royalties fromthe software employed in the study. All others disclose no current conflict of interest.
REFERENCES1. Berman D, Hachamovitch R, Shaw L, Friedman J, Hayes S, Thomson L, et al. Roles of nuclear
cardiology, cardiac computed tomography, and cardiac magnetic resonance: assessment of patientswith suspected coronary artery disease. J Nucl Med. 2006; 47:74–82. [PubMed: 16391190]
2. Taylor AJ, Cerqueira M, Hodgson JM, Mark D, Min J, O'Gara P, et al. ACCF/SCCT/ACR/AHA/ASE/ASNC/NASCI/SCAI/SCMR 2010 appropriate use criteria for cardiac computed tomography:a report of the American College of Cardiology Foundation Appropriate Use Criteria Task Force,the Society of Cardiovascular Computed Tomography, the American College of Radiology, theAmerican Heart Association, the American Society of Echocardiography, the American Society ofNuclear Cardiology, the North American Society for Cardiovascular Imaging, the Society forCardiovascular Angiography and Interventions, and the Society for Cardiovascular MagneticResonance. J Am Coll Cardiol. 2010; 56:1864–1894. [PubMed: 21087721]
3. Gaemperli O, Schepis T, Valenta I, Husmann L, Scheffel H, Duerst V, et al. Cardiac image fusionfrom stand-alone SPECT and CT: clinical experience. J Nucl Med. 2007; 48:696–703. [PubMed:17475956]
4. Santana CA, Garcia EV, Faber TL, Sirineni GK, Esteves FP, Sanyal R, et al. Diagnosticperformance of fusion of myocardial perfusion imaging (MPI) and computed tomography coronaryangiography. J Nucl Cardiol. 2009; 16:201–211. [PubMed: 19156478]
Nakazato et al. Page 8
J Nucl Cardiol. Author manuscript; available in PMC 2013 June 01.
$waterm
ark-text$w
atermark-text
$waterm
ark-text
5. Gaemperli O, Schepis T, Kalff V, Namdar M, Valenta I, Stefani L, et al. Validation of a new cardiacimage fusion software for three-dimensional integration of myocardial perfusion SPECT and stand-alone 64-slice CT angiography. Eur J Nucl Med Mol Imaging. 2007; 34:1097–1106. [PubMed:17245532]
6. Slomka P, Cheng V, Dey D, Woo J, Ramesh A, Van Kriekinge S, et al. Quantitative analysis ofmyocardial perfusion SPECT anatomically guided by coregistered 64-slice coronary CTangiography. J Nucl Med. 2009; 50:1621–1630. [PubMed: 19759104]
7. Woo J, Slomka PJ, Dey D, Cheng VY, Hong BW, Ramesh A, et al. Geometric feature-basedmultimodal image registration of contrast-enhanced cardiac CT with gated myocardial perfusionSPECT. Med Phys. 2009; 36:5467–5479. [PubMed: 20095259]
8. Aladl UE, Hurwitz GA, Dey D, Levin D, Drangova M, Slomka PJ. Automated image registration ofgated cardiac single-photon emission computed tomography and magnetic resonance imaging. JMagn Reson Imaging. 2004; 19:283–290. [PubMed: 14994295]
9. Johansson L, Mattsson S, Nosslin B, Leide-Svegborn S. Effective dose from radiopharmaceuticals.Eur J Nucl Med. 1992; 19:933–938. [PubMed: 1308762]
10. Raff G, Abidov A, Achenbach S, Berman D, Boxt L, Budoff M, et al. SCCT guidelines for theinterpretation and reporting of coronary computed tomographic angiography. J CardiovascComput Tomogr. 2009; 3:122–136. [PubMed: 19272853]
11. Slomka PJ, Nishina H, Berman DS, Akincioglu C, Abidov A, Friedman JD, et al. Automatedquantification of myocardial perfusion SPECT using simplified normal limits. J Nucl Cardiol.2005; 12:66–77. [PubMed: 15682367]
12. Berman D, Kang X, Hayes S, Friedman J, Cohen I, Abidov A, et al. Adenosine myocardialperfusion single-photon emission computed tomography in women compared with men. Impact ofdiabetes mellitus on incremental prognostic value and effect on patient management. J Am CollCardiol. 2003; 41:1125–1133. [PubMed: 12679212]
13. Shaw LJ, Berman DS, Maron DJ, Mancini GB, Hayes SW, Hartigan PM, et al. Optimal medicaltherapy with or without percutaneous coronary intervention to reduce ischemic burden: resultsfrom the Clinical Outcomes Utilizing Revascularization and Aggressive Drug Evaluation(COURAGE) trial nuclear substudy. Circulation. 2008; 117:1283–1291. [PubMed: 18268144]
14. Nakazato R, Berman D, Dey D, Le Meunier L, Hayes S, Fermin J, et al. Automated quantitativeRb-82 3D PET/CT myocardial perfusion imaging: normal limits and correlation with invasivecoronary angiography. J Nucl Cardiol. 2011 In press.
15. Slomka PJ, Alexanderson E, Jácome R, Jiménez M, Romero E, Meave A, et al. Comparison ofClinical Tools for Measurements of Regional Stress and Rest Myocardial Blood Flow Assessedwith 13N-Ammonia PET/CT. J Nucl Med. 2012
16. Slomka P, Germano G, Kavanagh P, Javadi M, Berman D, Bengel F. Evaluation of a newautomatic algorithm for quantification of ECG-gated 82Rb cardiac PET. J Nucl Med. 2009;50(Suppl 2):1167.
17. Slomka PJ. Software approach to merging molecular with anatomic information. J Nucl Med.2004; 45(Suppl 1):36S–45S. [PubMed: 14736834]
18. Busch S, Johnson TR, Nikolaou K, von Ziegler F, Knez A, Reiser MF, et al. Visual and automaticgrading of coronary artery stenoses with 64-slice CT angiography in reference to invasiveangiography. Eur Radiol. 2007; 17:1445–1451. [PubMed: 17180326]
19. Levin D, Aladl U, Germano G, Slomka P. Techniques for efficient, real-time, 3D visualization ofmulti-modality cardiac data using consumer graphics hardware. Comput Med Imaging Graph.2005; 29:463–475. [PubMed: 15979844]
20. Germano G, Kavanagh PB, Slomka PJ, Van Kriekinge SD, Pollard G, Berman DS. Quantitation ingated perfusion SPECT imaging: the Cedars-Sinai approach. J Nucl Cardiol. 2007; 14:433–454.[PubMed: 17679052]
21. Rispler S, Keidar Z, Ghersin E, Roguin A, Soil A, Dragu R, et al. Integrated single-photonemission computed tomography and computed tomography coronary angiography for theassessment of hemodynamically significant coronary artery lesions. J Am Coll Cardiol. 2007;49:1059–1067. [PubMed: 17349885]
Nakazato et al. Page 9
J Nucl Cardiol. Author manuscript; available in PMC 2013 June 01.
$waterm
ark-text$w
atermark-text
$waterm
ark-text
22. Di Carli MF, Dorbala S, Hachamovitch R. Integrated cardiac PET-CT for the diagnosis andmanagement of CAD. J Nucl Cardiol. 2006; 13:139–144. [PubMed: 16580946]
23. Namdar M, Hany TF, Koepfli P, Siegrist PT, Burger C, Wyss CA, et al. Integrated PET/CT for theassessment of coronary artery disease: a feasibility study. J Nucl Med. 2005; 46:930–935.[PubMed: 15937302]
24. Javadi M, Mahesh M, McBride G, Voicu C, Epley W, Merrill J, et al. Lowering radiation dose forintegrated assessment of coronary morphology and physiology: first experience with step-and-shoot CT angiography in a rubidium 82 PET-CT protocol. J Nucl Cardiol. 2008; 15:783–790.[PubMed: 18984453]
25. Slomka PJ, Baum RP. Multimodality image registration with software: state-of-the-art. Eur J NuclMed Mol Imaging. 2009; 36(Suppl 1):S44–S55. [PubMed: 19104803]
26. Slomka P, Nishina H, Berman D, Kang X, Akincioglu C, Friedman J, et al. "Motion-frozen"display and quantification of myocardial perfusion. J Nucl Med. 2004; 45:1128–1134. [PubMed:15235058]
27. Di Carli MF, Dorbala S, Curillova Z, Kwong RJ, Goldhaber SZ, Rybicki FJ, et al. Relationshipbetween CT coronary angiography and stress perfusion imaging in patients with suspectedischemic heart disease assessed by integrated PET-CT imaging. J Nucl Cardiol. 2007; 14:799–809.[PubMed: 18022106]
28. Kajander S, Joutsiniemi E, Saraste M, Pietilä M, Ukkonen H, Saraste A, et al. Cardiac positronemission tomography/computed tomography imaging accurately detects anatomically andfunctionally significant coronary artery disease. Circulation. 2010; 122:603–613. [PubMed:20660808]
29. Einstein AJ, Moser KW, Thompson RC, Cerqueira MD, Henzlova MJ. Radiation dose to patientsfrom cardiac diagnostic imaging. Circulation. 2007; 116:1290–1305. [PubMed: 17846343]
30. Husmann L, Herzog BA, Gaemperli O, Tatsugami F, Burkhard N, Valenta I, et al. Diagnosticaccuracy of computed tomography coronary angiography and evaluation of stress-only single-photon emission computed tomography/computed tomography hybrid imaging: comparison ofprospective electrocardiogram-triggering vs. retrospective gating. Eur Heart J. 2009; 30:600–607.[PubMed: 19106197]
Nakazato et al. Page 10
J Nucl Cardiol. Author manuscript; available in PMC 2013 June 01.
$waterm
ark-text$w
atermark-text
$waterm
ark-text

Figure 1.Overview of image processing. CCTA = CT angiography.
Nakazato et al. Page 11
J Nucl Cardiol. Author manuscript; available in PMC 2013 June 01.
$waterm
ark-text$w
atermark-text
$waterm
ark-text

Figure 2.Frequency and magnitude of the initial PET-CCTA misalignment on rest (A) and stress (B)studies by automated co-registration.
Nakazato et al. Page 12
J Nucl Cardiol. Author manuscript; available in PMC 2013 June 01.
$waterm
ark-text$w
atermark-text
$waterm
ark-text
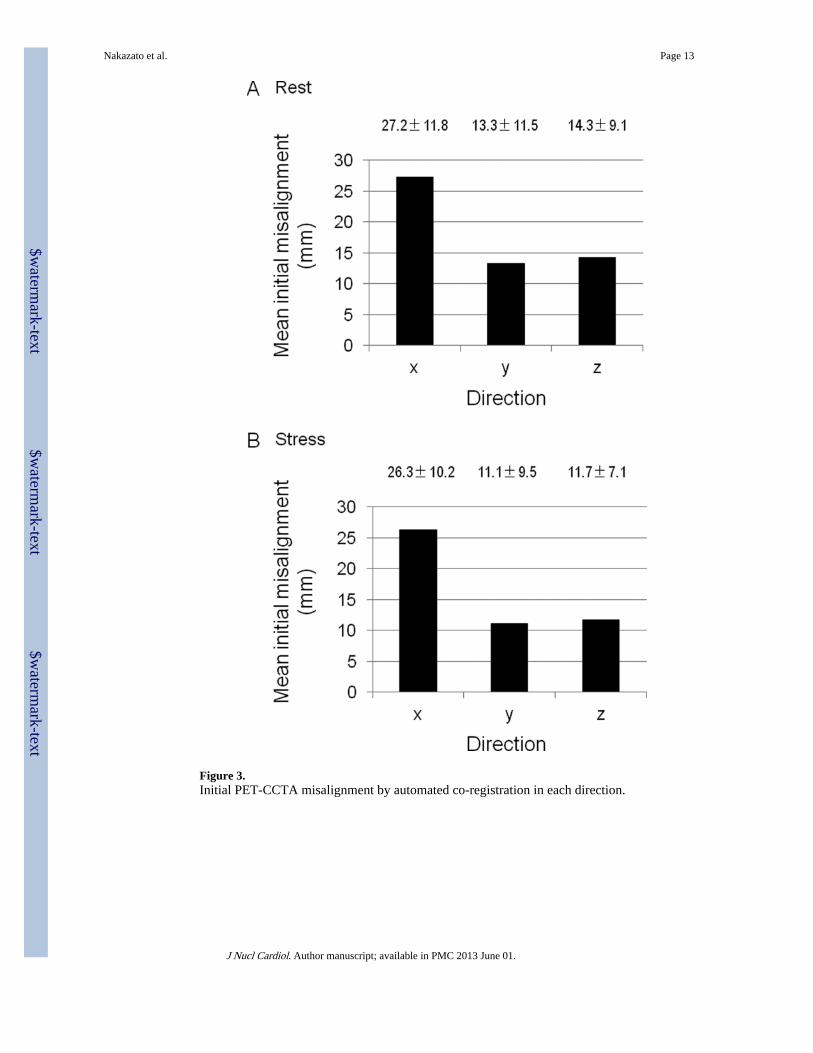
Figure 3.Initial PET-CCTA misalignment by automated co-registration in each direction.
Nakazato et al. Page 13
J Nucl Cardiol. Author manuscript; available in PMC 2013 June 01.
$waterm
ark-text$w
atermark-text
$waterm
ark-text
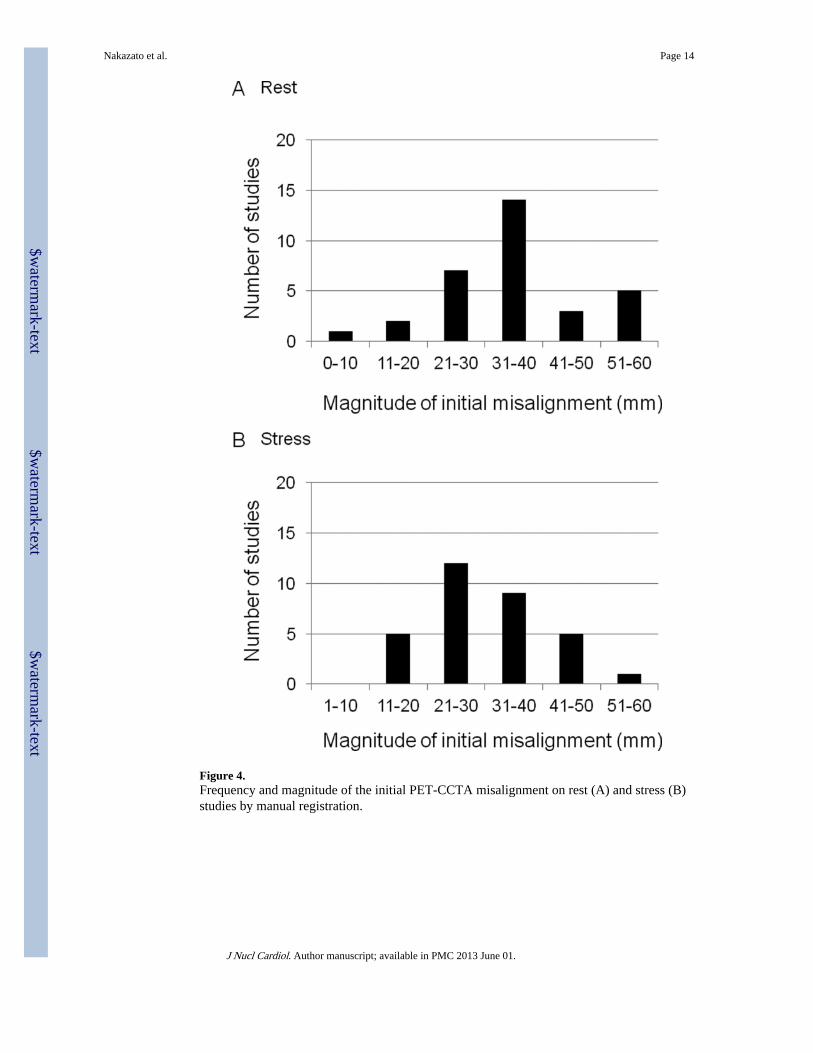
Figure 4.Frequency and magnitude of the initial PET-CCTA misalignment on rest (A) and stress (B)studies by manual registration.
Nakazato et al. Page 14
J Nucl Cardiol. Author manuscript; available in PMC 2013 June 01.
$waterm
ark-text$w
atermark-text
$waterm
ark-text

Figure 5.Initial PET-CCTA misalignment by manual registration in each direction.
Nakazato et al. Page 15
J Nucl Cardiol. Author manuscript; available in PMC 2013 June 01.
$waterm
ark-text$w
atermark-text
$waterm
ark-text
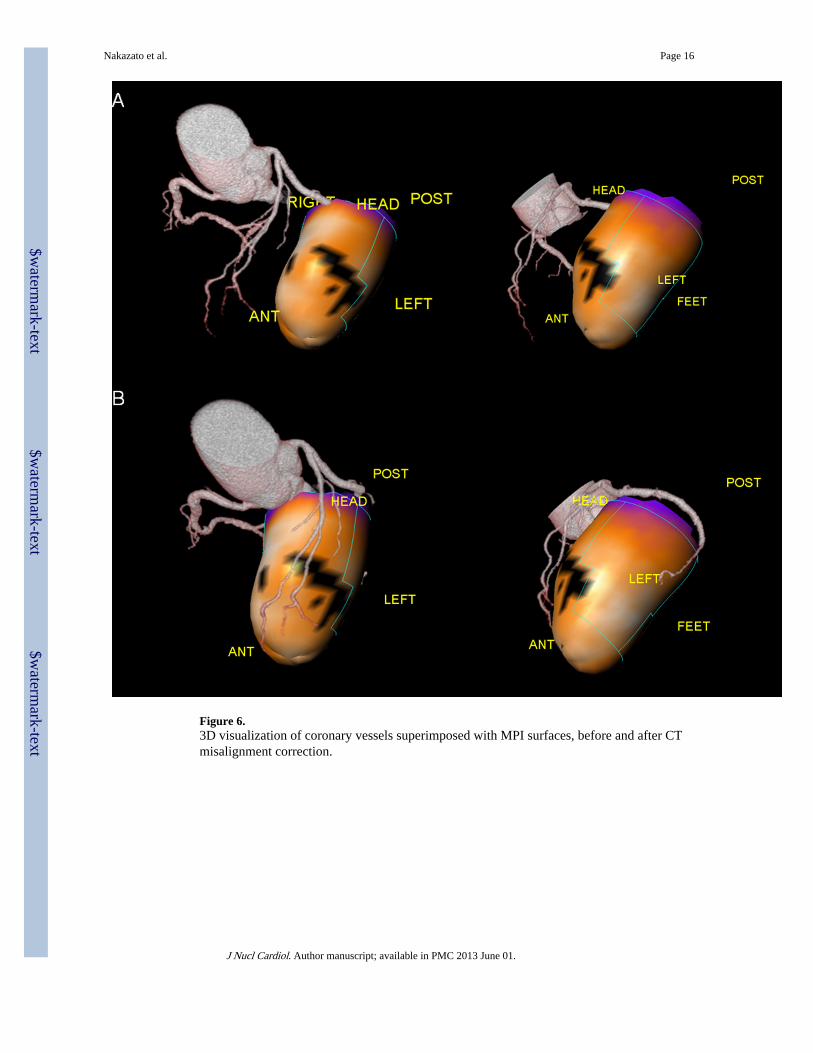
Figure 6.3D visualization of coronary vessels superimposed with MPI surfaces, before and after CTmisalignment correction.
Nakazato et al. Page 16
J Nucl Cardiol. Author manuscript; available in PMC 2013 June 01.
$waterm
ark-text$w
atermark-text
$waterm
ark-text
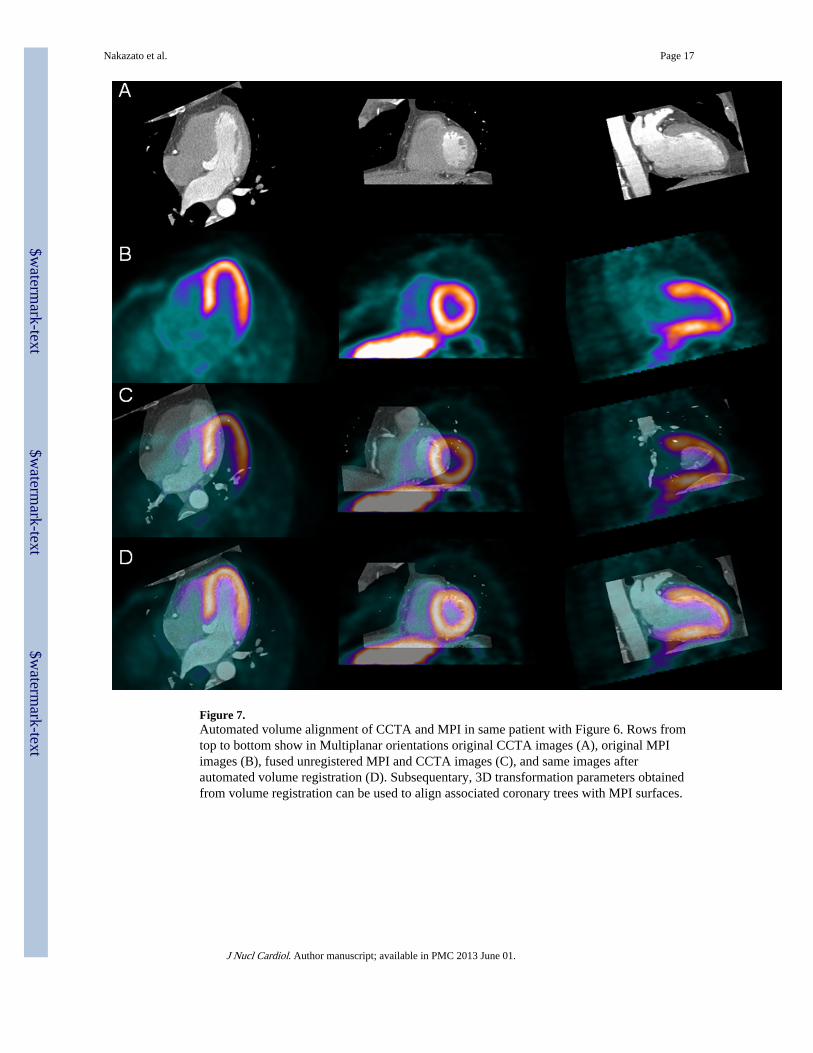
Figure 7.Automated volume alignment of CCTA and MPI in same patient with Figure 6. Rows fromtop to bottom show in Multiplanar orientations original CCTA images (A), original MPIimages (B), fused unregistered MPI and CCTA images (C), and same images afterautomated volume registration (D). Subsequentary, 3D transformation parameters obtainedfrom volume registration can be used to align associated coronary trees with MPI surfaces.
Nakazato et al. Page 17
J Nucl Cardiol. Author manuscript; available in PMC 2013 June 01.
$waterm
ark-text$w
atermark-text
$waterm
ark-text
$waterm
ark-text$w
atermark-text
$waterm
ark-text
Nakazato et al. Page 18
Table 1
Patient characteristics
Mean value
Sex, Male 21 (66%)
Age (y) 62 ± 9
Chest pain 17 (53%)
Dyspnea 9 (28%)
Abnormal rest ECG 5 (16%)
Pre-operation 1 (3%)
Myocardial infarction 7 (22%)
Weight (kg) 76 ± 14
Body mass index 27.2 ± 3.4
Data are mean ± SD, or number followed by percentage in parentheses (n = 32). ECG, electrocardiogram.
J Nucl Cardiol. Author manuscript; available in PMC 2013 June 01.
$waterm
ark-text$w
atermark-text
$waterm
ark-text
Nakazato et al. Page 19
Table 2
Perfusion findings before fusion of PET MPI
Mean value (%)
Global -
stress TPD 11.7 ± 11.6
rest TPD 5.1 ± 10.0
reversible TPD 6.5 ± 5.0
Regional
LAD -
stress TPD 6.2 ± 9.0
rest TPD 3.4 ± 7.8
reversible TPD 2.9 ± 3.1
LCX -
stress TPD 2.2 ± 3.3
rest TPD 0.7 ± 1.8
reversible TPD 1.5 ± 2.4
RCA -
stress TPD 3.6 ± 4.5
rest TPD 1.6 ± 3.4
reversible TPD 2.0 ± 2.6
MPI, myocardial perfusion imaging; TPD, total perfusion deficit; LAD, left anterior descending artery; LCX, left circumflex artery; RCA, rightcoronary artery.
J Nucl Cardiol. Author manuscript; available in PMC 2013 June 01.
$waterm
ark-text$w
atermark-text
$waterm
ark-text
Nakazato et al. Page 20
Table 3
Ischemia and stenosis findings before fusion of PET MPI and CCTA
LAD Stenosis on CCTA No stenosis on CCTA
Ischemia on PET 6 8
No ischemia on PET 1 17
Sens/spec/ppv/npv = 86/68/43/94% (CCTA stenosis was considered as the reference)
LCX Stenosis on CCTA No stenosis on CCTA
Ischemia on PET 3 4
No ischemia on PET 3 22
Sens/spec/ppv/npv = 50/85/43/88%
RCA Stenosis on CCTA No stenosis on CCTA
Ischemia on PET 5 5
No ischemia on PET 1 21
Sens/spec/ppv/npv = 83/81/50/95%
CCTA, coronary CT angiography; sens, sensitivity; spec, specificity; ppv, positive predictive value; npv, negative predictive value.
J Nucl Cardiol. Author manuscript; available in PMC 2013 June 01.
$waterm
ark-text$w
atermark-text
$waterm
ark-text
Nakazato et al. Page 21
Table 4
Inter-observer variability in PET/CCTA translation and magnitude.
Direction (mm) Magnitude(mm)
Study x y z
Rest 1.5 ± 1.3 1.4 ± 1.3 1.7 ± 2.5 3.2 ± 2.5
Stress 1.8 ± 1.5 2.0 ± 1.8 1.5 ± 1.5 3.6 ± 2.2
J Nucl Cardiol. Author manuscript; available in PMC 2013 June 01.

$waterm
ark-text$w
atermark-text
$waterm
ark-text
Nakazato et al. Page 22
Table 5
Agreement in all directions between each observer versus automated software.
Agreement (%) kappa (95% CI) p value McNemar’sp value
Observer 1 versus automated
Rest 95 0.82 (0.77–0.87) < 0.0001 NS
Stress 94 0.77 (0.71–0.83) < 0.0001 NS
Observer 2 versus automated
Rest 95 0.83 (0.78–0.88) < 0.0001 NS
Stress 93 0.77 (0.71–0.83) < 0.0001 NS
J Nucl Cardiol. Author manuscript; available in PMC 2013 June 01.
$waterm
ark-text$w
atermark-text
$waterm
ark-text
Nakazato et al. Page 23
Table 6
Offset from mean observer location choice in PET/CCTA translation and magnitude.
Direction (mm) Magnitude(mm)
Study x y z
Rest 1.6 ± 1.2 2.3 ± 2.1 3.7 ± 2.8 5.3 ± 2.8
Stress 2.4 ± 2.6 2.4 ± 2.3 4.1 ± 2.9 6.0 ± 3.5
J Nucl Cardiol. Author manuscript; available in PMC 2013 June 01.
$waterm
ark-text$w
atermark-text
$waterm
ark-text
Nakazato et al. Page 24
Table 7
Ischemia and stenosis findings after fusion of PET MPI and CCTA
LAD Stenosis on CCTA No stenosis on CCTA
Ischemia on PET 6 2
No ischemia on PET 1 23
Sens/spec/ppv/npv = 86/92/75/96% (CCTA stenosis was considered as the reference)
LCX Stenosis on CCTA No stenosis on CCTA
Ischemia on PET 4 1
No ischemia on PET 2 25
Sens/spec/ppv/npv = 67/96/80/93%
RCA Stenosis on CCTA No stenosis on CCTA
Ischemia on PET 5 3
No ischemia on PET 1 23
Sens/spec/ppv/npv = 83/88/63/96%
J Nucl Cardiol. Author manuscript; available in PMC 2013 June 01.