Mutations in squirrel monkey glucocorticoid receptor impair nuclear translocation
Upload
khangminh22Category
view
2download
0
Podocyte-specific glucocorticoid effects in
childhood nephrotic syndrome
A thesis submitted to The University of Manchester for the degree
of Doctor of Philosophy in the Faculty of Medical and
…………………………Human Sciences
2015
James C. McCaffrey
School of Medicine
Institute of Human Development

2
Table of Contents
1 Introduction ................................................................................................ 16
1.1 General ...................................................................................................................... 16
1.2 The Kidney ................................................................................................................ 17
1.2.1 The five layers of the glomerular filtration barrier ....................................................... 20
1.2.1.1 Endothelial surface layer ............................................................................ 20
1.2.1.2 Glomerular Endothelial Cells ..................................................................... 20
1.2.1.3 Glomerular Basement Membrane ............................................................... 21
1.2.1.4 Podocytes .................................................................................................... 21
1.2.1.5 Subpodocyte space ...................................................................................... 23
1.2.2 Models of filtration ....................................................................................................... 25
1.2.2.1 The albumin retrieval hypothesis ................................................................ 25
1.2.2.2 The pore model ............................................................................................ 26
1.2.2.3 The electrokinetic model ............................................................................. 27
1.3 The podocyte ............................................................................................................. 29
1.3.1 The podocyte cytoskeleton ............................................................................................ 29
1.3.2 Signalling at the slit diaphragm .................................................................................... 32
1.3.3 The role of the podocyte in nephrotic syndrome .......................................................... 32
1.3.3.1 Direct effects of Gc on the podocyte ........................................................... 33
1.3.4 Podocyte contractility and motility ............................................................................... 37
1.4 Clinical aspects of nephrotic syndrome ..................................................................... 39
1.4.1 Classification of NS ...................................................................................................... 39
1.4.1.1 Classification by histopathological criteria ................................................ 39
1.4.1.2 Classification by age of disease onset ......................................................... 40
1.4.1.3 Classification by response to pharmacological therapy ............................. 40
1.4.2 Prognosis ....................................................................................................................... 42
1.4.2.1 Prognosis for children with SSNS ............................................................... 43
1.4.2.2 Prognosis for children with SRNS............................................................... 44
1.4.2.3 Significance of histology for prognosis ....................................................... 45

3
1.4.3 The genetics of NS ........................................................................................................ 45
1.4.3.1 Genetics of congenital and infantile NS ...................................................... 48
1.4.3.2 Genetics of SSNS ......................................................................................... 48
1.4.3.3 Genetics of SRNS ........................................................................................ 49
1.5 Aetiology of INS ....................................................................................................... 51
1.5.1 Circulating glomerular permeability factor ................................................................... 51
1.5.1.1 Permeability factors in MCD and FSGS ..................................................... 52
1.5.2 Possible immunological basis for INS .......................................................................... 54
1.5.2.1 Links between immune dysregulation and podocyte cytoskeletal changes . 55
1.5.3 Protease dysregulation leading to a hypermotile podocyte phenotype ......................... 57
1.6 Glucocorticoids ......................................................................................................... 58
1.6.1 Gc bioavailability in vivo .............................................................................................. 58
1.6.1.1 Gc binding to plasma proteins .................................................................... 59
1.6.1.2 Metabolism of Gc by 11β-HSD ................................................................... 61
1.6.1.3 Glucocorticoid ligand potency at the GR and MR ...................................... 62
1.6.2 GR structure .................................................................................................................. 63
1.6.2.1 GR gene structure ....................................................................................... 63
1.6.2.2 GR protein structure ................................................................................... 64
1.6.3 Mode of action of GR ................................................................................................... 66
1.6.3.1 Genomic actions .......................................................................................... 66
1.6.3.2 Non-genomic actions ................................................................................... 69
1.6.4 Post-translational modifications of GR ......................................................................... 69
1.6.5 Gc resistance ................................................................................................................. 71
1.6.5.1 Genetic basis for Gc-resistance .................................................................. 71
1.6.5.2 Familial glucocorticoid resistance ............................................................. 72
1.6.5.3 Defects in GR .............................................................................................. 72
1.6.5.4 Abnormalities of GR chaperones ................................................................ 73
1.6.5.5 Abnormalities in inflammatory mediators .................................................. 74
1.6.5.6 Histone deacetylation .................................................................................. 74
1.6.5.7 Vitamin D .................................................................................................... 75

4
1.6.5.8 Pharmacokinetics ........................................................................................ 75
1.7 Cell migration ............................................................................................................ 77
1.7.1 Overview of cell migration ........................................................................................... 77
1.7.2 Small GTPases .............................................................................................................. 78
1.7.2.1 The Ras family ............................................................................................. 79
1.7.2.2 The Rho family ............................................................................................ 79
1.7.2.3 The Rab family ............................................................................................ 79
1.7.2.4 The Ran family ............................................................................................ 80
1.7.2.5 The Arf family.............................................................................................. 80
1.7.3 The Rho sub-family ...................................................................................................... 82
1.7.4 The Rac subfamily ........................................................................................................ 84
1.7.5 Cdc42 ............................................................................................................................ 85
1.7.6 Rho GTPase cross-talk .................................................................................................. 85
1.7.7 Rho GTPases and nephrotic syndrome ......................................................................... 86
1.7.8 Rac1 and chronic kidney disease .................................................................................. 89
1.8 Project aims ............................................................................................................... 91
2 General materials and methods ................................................................ 92
2.1 Materials and reagents ............................................................................................... 92
2.2 General buffers .......................................................................................................... 92
2.3 SDS-PAGE and western blotting buffers .................................................................. 92
2.4 Antibodies ................................................................................................................. 92
2.4.1 Primary antibodies ........................................................................................................ 92
2.4.2 Secondary antibodies .................................................................................................... 93
2.5 Human cell lines ........................................................................................................ 95
2.6 Cell Culture ............................................................................................................... 95
2.7 Protein analysis .......................................................................................................... 96
2.7.1 Preparation of a total cell lysate .................................................................................... 96
2.7.2 Polyacrylamide gel electrophoresis .............................................................................. 96
2.7.3 Immunoblotting ............................................................................................................. 96

5
2.7.3.1 Electrophoretic transfer .............................................................................. 96
2.7.3.2 Membrane blocking, antibody probing and detection ................................ 96
2.8 Immunofluorescence staining .................................................................................... 97
2.9 Widefield fluorescence microscopy .......................................................................... 97
2.10 Electric Cell Substrate Impedance Sensing ........................................................... 97
3 Human podocytes respond directly to glucocorticoid exposure in
vitro ..................................................................................................................... 98
3.1 Overview ................................................................................................................... 98
3.2 Chapter-specific methods .......................................................................................... 99
3.2.1 Quantitative real-time polymerase chain reaction ......................................................... 99
3.3 Results ..................................................................................................................... 100
3.3.1 The podocyte GR-signalling pathway is functionally active in vitro .......................... 100
3.3.2 Podocyte-specific GR isoform expression and MR levels .......................................... 103
3.3.3 Prednisolone exerts a direct protective effect on human podocytes ........................... 105
3.4 Discussion ............................................................................................................... 106
4 Glucocorticoid-regulated changes in podocyte transcriptional
output................................................................................................................ 113
4.1 Overview ................................................................................................................. 113
4.2 Chapter-specific methods ........................................................................................ 114
4.2.1 Microarrays ................................................................................................................. 114
4.2.2 Data Analysis .............................................................................................................. 114
4.3 Results ..................................................................................................................... 115
4.3.1 Initial processing of microarray data........................................................................... 115
4.3.2 Genes involved with tissue damage ............................................................................ 121
4.3.3 Predicted Gc-effects on biological function ................................................................ 126
4.4 Discussion ............................................................................................................... 136
5 Glucocorticoid effects on podocyte motility........................................... 139
5.1 Overview ................................................................................................................. 139
5.2 Chapter-specific methods ........................................................................................ 140

6
5.2.1 Live cell imaging ........................................................................................................ 140
5.2.2 Rac1 activity assay ...................................................................................................... 140
5.2.3 RhoA activity assay .................................................................................................... 140
5.3 Results ..................................................................................................................... 142
5.3.1 Gc effects on podocyte motility .................................................................................. 142
5.3.2 Gc effects on Rac1 and RhoA ..................................................................................... 149
5.4 Discussion ............................................................................................................... 154
6 The podocyte GR cistrome ...................................................................... 158
6.1 Overview ................................................................................................................. 158
6.2 Chapter-specific methods ........................................................................................ 159
6.2.1 Cell treatment and harvest ........................................................................................... 159
6.2.2 Chromatin immunoprecipitation ................................................................................. 159
6.2.3 ChIP-Seq ..................................................................................................................... 161
6.3 Results ..................................................................................................................... 163
6.3.1 Development of methods ............................................................................................ 163
6.3.1.1 Sonication.................................................................................................. 163
6.3.1.2 Antibody choice ......................................................................................... 167
6.3.2 GR-binding characteristics .......................................................................................... 169
6.3.3 Association between GR-binding and Gc-responsiveness of genes ........................... 174
6.3.4 Motif analysis .............................................................................................................. 178
6.4 Discussion ............................................................................................................... 184
7 Proteomic analysis of human wild type podocytes................................ 187
7.1 Overview ................................................................................................................. 187
7.2 Chapter specific methods ........................................................................................ 188
7.2.1 Sample preparation ..................................................................................................... 188
7.2.2 Digestion ..................................................................................................................... 188
7.2.3 Mass spectrometry ...................................................................................................... 188
7.2.4 Progenesis data analysis .............................................................................................. 189
7.2.5 Functional analysis of data .......................................................................................... 189

7
7.3 Results ..................................................................................................................... 190
7.3.1 Optimisation of experimental conditions .................................................................... 190
7.3.2 Protein composition of human wild type podocytes ................................................... 190
7.4 Discussion ............................................................................................................... 198
8 Podocyte-specific GR deletion in vivo ..................................................... 200
8.1 Overview ................................................................................................................. 200
8.2 Chapter-specific methods ........................................................................................ 201
8.2.1 Transgenic mouse lines and genotyping ..................................................................... 201
8.2.2 Isolation of primary murine podocytes using a differential sieving technique ........... 201
8.2.3 Phenotyping mice ........................................................................................................ 202
8.2.3.1 Cryosections .............................................................................................. 202
8.2.3.2 Electron microscopy ................................................................................. 203
8.2.3.3 Hematoxylin and eosin staining ................................................................ 203
8.3 Results ..................................................................................................................... 204
8.4 Discussion ............................................................................................................... 210
9 General discussion and perspectives ...................................................... 211
10 Supplementary Tables ............................................................................. 215
11 Formal acknowledgements ...................................................................... 230
12 References ................................................................................................. 231
Word Count: 64,678

8
Table of Figures
Figure 1.1 The glomerulus ............................................................................................ 19
Figure 1.2 The layers of the glomerular filtration barrier (GFB). ........................... 24
Figure 1.3 Podocyte ultrastructure .............................................................................. 31
Figure 1.4 Schematic diagram of the linkage between slit-diaphragm (SD) proteins
and the actin cytoskeleton. ........................................................................................... 36
Figure 1.5 The small GTPase cycle .............................................................................. 81
Figure 1.6 Podocyte motility is a determinant of glomerular barrier function ....... 88
Figure 3.1 Podocyte GR expression and response to Gc exposure. ........................ 101
Figure 3.2 Ligand-dependent nuclear translocation of GR and transcriptional
response. ....................................................................................................................... 102
Figure 3.3 GR isoform and MR expression pattern in podocytes. ......................... 104
Figure 3.4 The effect of puromycin aminonucleoside (PAN) treatment on
podocytes ...................................................................................................................... 108
Figure 3.5 Direct Gc effect on podocyte barrier integrity ....................................... 109
Figure 4.1 Quality control of microarray data ......................................................... 117
Figure 4.2 Identification of Gc-regulated genes ....................................................... 118
Figure 4.3 Predicted effects of microarray-determined transcriptional changes on
organ toxicity ............................................................................................................... 122
Figure 4.4 Pathway analysis for kidney-specific toxicology terms ......................... 123
Figure 4.5 Bar chart illustrating Gc-effects on podocyte cellular functions .......... 128
Figure 4.6 Expanded gene ontology anlalysis of microarray results. ..................... 129
Figure 4.7 Gc-regulated genes with known connection to cellular movement ...... 131
Figure 4.8 Gene ontology heatmap ............................................................................ 133
Figure 4.9 Example of how observed microarray changes may relate to changes in
cellular motility............................................................................................................ 135
Figure 5.1 Effects of Gc and puromycin aminonucleoside exposure on podocyte
motility ......................................................................................................................... 144
Figure 5.2 Effects of Gc and lipopolysaccharide exposure on podocyte motility. . 146
Figure 5.3 Early effects of Gc on podocyte motility. ................................................ 148
Figure 5.4 Gc effects on Rac1 and RhoA activity and expression. ......................... 151
Figure 5.5 Rac1 activity following exposure to puromycin aminonucleoside (PAN).
....................................................................................................................................... 152
Figure 5.6 Effect of Rac1 inhibition on podocyte barrier function. ....................... 153

9
Figure 6.1 Chromatin immunoprecipitation coupled with high throughput DNA
sequencing (ChIP-Seq) methodology. ....................................................................... 165
Figure 6.2 Sonication Optimisation ........................................................................... 166
Figure 6.3 Sample enrichment prior to ChIP-Seq ................................................... 169
Figure 6.4 GR binding sites in relation to a reference human genome. ................. 171
Figure 6.5 Chromosomal distribution of GR-binding sites. .................................... 172
Figure 6.6 Genomic distribution of GR binding sites. ............................................. 173
Figure 6.7 Combining the podocyte microarray and ChIP-Seq dataset. ............... 175
Figure 6.8 Relation between Gc-regulated genes and GR-binding sites ................ 176
Figure 6.9 Transcriptional output and site of GR-binding ..................................... 177
Figure 6.10 Motif analysis .......................................................................................... 179
Figure 6.11 GR co-regulators in Gc-sensitive and –insensitive sites ...................... 182
Figure 6.12 Summary of GR binding pattern in human podocytes ....................... 183
Figure 6.13 Comparison of human podocyte ChIP-Seq dataset to other cell lines
....................................................................................................................................... 185
Figure 7.1 Principal component analysis of optimisation samples ......................... 192
Figure 7.2 MS samples ................................................................................................ 193
Figure 7.3 Principal component analysis of peptide ions detected by mass
spectrometry ................................................................................................................ 194
Figure 7.4 Sub-cellular origin of podocyte proteins identified by mass spectrometry
....................................................................................................................................... 195
Figure 7.5 Biological functions of proteins identifed by global mass spectrometry
anlaysis ......................................................................................................................... 196
Figure 7.6 Gene ontology anlaysis of Gc-regulated proteins................................... 197
Figure 8.1 Generation of Cre+ GR fl/fl mice .............................................................. 205
Figure 8.2 Immunofluorescence images of murine primary podocytes in culture 206
Figure 8.3 Phenotype of Cre+ GRfl/fl mice. ............................................................... 207
Figure 8.4 Glomerular ultrastructure of Cre+ GRfl/fl mice ..................................... 209

10
Table of tables
Table 1.1 Proteins located at the slit diaphragm ........................................................ 30
Table 1.2 Consensus definitions for clinical aspects of nephrotic syndrome ........... 41
Table 1.3 Genetic mutations identified in NS ............................................................. 46
Table 2.1 Primary antibodies ....................................................................................... 93
Table 2.2 Secondary antibodies ................................................................................... 94
Table 4.1 Upstream regulator analysis using IPA® software .................................. 119
Table 4.2 Genes showing largest changes in transcription following Gc exposure
....................................................................................................................................... 120
Table 4.3 Gc-regulated genes involved with kidney damage .................................. 124
Table 4.4 Activation z-scores of cellular movement gene ontology terms ............. 132
Table 4.5 Examples of published studies identifying Gc-regulated genes ............. 138
Table 6.1 Enriched transcription factor binding motifs .......................................... 180
Table 6.2 GR coregulators .......................................................................................... 181
Table 6.3 Genes near multiple GR-binding sites ...................................................... 186
Table 8.1 Primers used for mouse genotyping.......................................................... 201
Supplementary Table 10.1 Genes involved with cell movement ............................. 215
Supplementary Table 10.2 Fifty most enriched GR-binding sites .......................... 220
Supplementary Table 10.3 Gc-regulated proteins ................................................... 226
Supplementary Table 10.4 Details of mice ................................................................ 229
Details of Gc-regulated genes from microarray..Compact Disc 1: Back cover insert
Details of 1130 ChIP-Seq GR binding sites….... .Compact Disc 1: Back cover insert

11
Key abbreviations
11β-HSD 11 beta-hydroxysteroid dehydrogenase
ChIP-Seq Chromatin immunoprecipitation followed by high-throughput DNA
sequencing
CKD Chronic kidney disease
CNS Congenital nephrotic syndrome
ECIS Electric cell-substrate impedance sensing
ECM Extracellular matrix
ESL Endothelial surface layer
ESRD End-stage renal disease
FPs Foot processes
FSGS Focal segmental glomerulosclerosis
GAP GTPase Activation Protein
GBM Glomerular basement membrane
GBS Glucocorticoid receptor binding site
Gc Glucocorticoid
GDI Guanosine nucleotide dissociation inhibitors
GECs Glomerular endothelial cells
GEF Guanine nucleotide-exchange factor
GFB Glomerular filtration barrier
GR Glucocorticoid receptor
HPA Hypothalamic-pituitary-adrenal
INS Idiopathic nephrotic syndrome
IPA® Ingenuity pathway analysis

12
kDa Kilodalton
LC-MS/MS Liquid chromatography-tandem mass spectrometry
LPS Lipopolysaccharide
MCD Minimal change disease
MR Mineralocorticoid receptor
mRNA messenger ribonucleic acid
MS Mass spectrometry
NPHS1 Nephrin
NPHS2 Podocin
NRSF Nuclear receptor super-family
NS Nephrotic syndrome
PAN Puromycin aminonucleoside
PBS Phosphate buffered saline
Rac1 Ras-related C3 botulinum toxin substrate 1
RhoA Ras homolog gene family, member A
SD Slit diaphragm
SDS-PAGE sodium dodecyl sulfate polyacrylamide gel electrophoresis
SRNS Steroid resistant nephrotic syndrome
SSNS Steroid sensitive nephrotic syndrome
TED Thromboembolic disease
UUO Unilateral ureteral obstruction
WT1 Wilms’Tumour 1
13
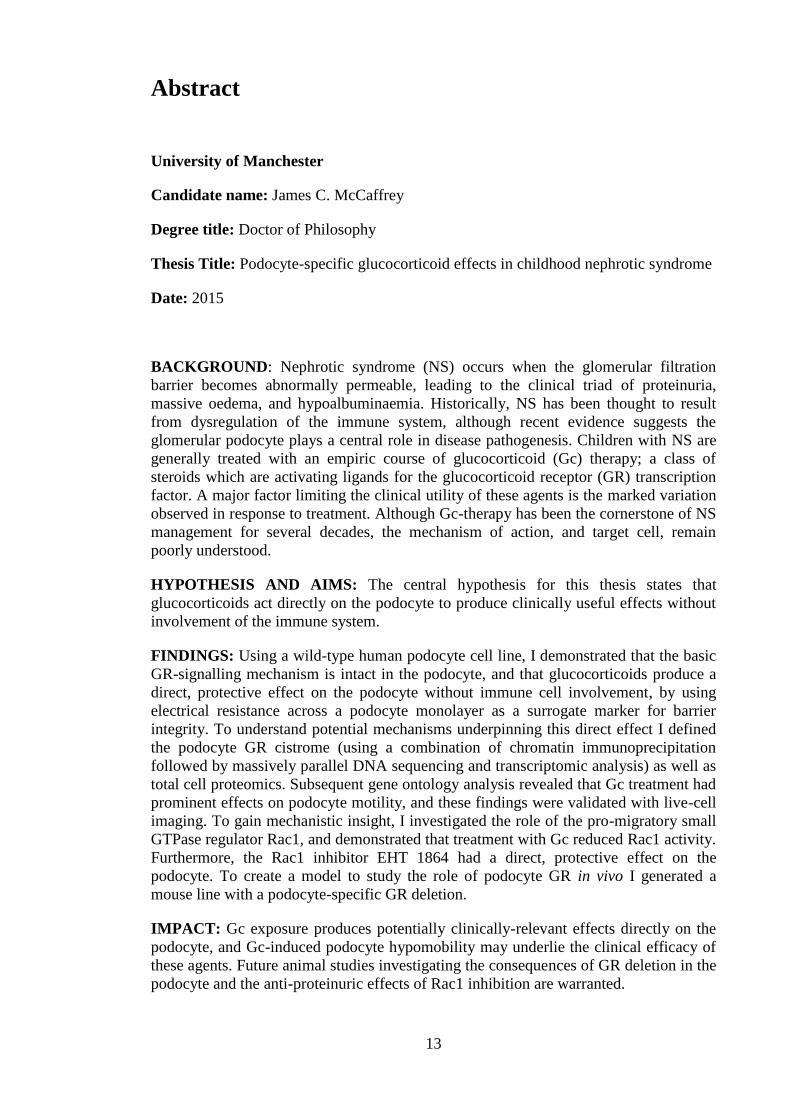
Abstract
University of Manchester
Candidate name: James C. McCaffrey
Degree title: Doctor of Philosophy
Thesis Title: Podocyte-specific glucocorticoid effects in childhood nephrotic syndrome
Date: 2015
BACKGROUND: Nephrotic syndrome (NS) occurs when the glomerular filtration
barrier becomes abnormally permeable, leading to the clinical triad of proteinuria,
massive oedema, and hypoalbuminaemia. Historically, NS has been thought to result
from dysregulation of the immune system, although recent evidence suggests the
glomerular podocyte plays a central role in disease pathogenesis. Children with NS are
generally treated with an empiric course of glucocorticoid (Gc) therapy; a class of
steroids which are activating ligands for the glucocorticoid receptor (GR) transcription
factor. A major factor limiting the clinical utility of these agents is the marked variation
observed in response to treatment. Although Gc-therapy has been the cornerstone of NS
management for several decades, the mechanism of action, and target cell, remain
poorly understood.
HYPOTHESIS AND AIMS: The central hypothesis for this thesis states that
glucocorticoids act directly on the podocyte to produce clinically useful effects without
involvement of the immune system.
FINDINGS: Using a wild-type human podocyte cell line, I demonstrated that the basic
GR-signalling mechanism is intact in the podocyte, and that glucocorticoids produce a
direct, protective effect on the podocyte without immune cell involvement, by using
electrical resistance across a podocyte monolayer as a surrogate marker for barrier
integrity. To understand potential mechanisms underpinning this direct effect I defined
the podocyte GR cistrome (using a combination of chromatin immunoprecipitation
followed by massively parallel DNA sequencing and transcriptomic analysis) as well as
total cell proteomics. Subsequent gene ontology analysis revealed that Gc treatment had
prominent effects on podocyte motility, and these findings were validated with live-cell
imaging. To gain mechanistic insight, I investigated the role of the pro-migratory small
GTPase regulator Rac1, and demonstrated that treatment with Gc reduced Rac1 activity.
Furthermore, the Rac1 inhibitor EHT 1864 had a direct, protective effect on the
podocyte. To create a model to study the role of podocyte GR in vivo I generated a
mouse line with a podocyte-specific GR deletion.
IMPACT: Gc exposure produces potentially clinically-relevant effects directly on the
podocyte, and Gc-induced podocyte hypomobility may underlie the clinical efficacy of
these agents. Future animal studies investigating the consequences of GR deletion in the
podocyte and the anti-proteinuric effects of Rac1 inhibition are warranted.

14
Declaration
No portion of the work referred to in the thesis has been submitted in support of an
application for another degree or qualification of this or any other university or other
institute of learning.
Copyright Statement
i. The author of this thesis (including any appendices and/or schedules to this thesis)
owns certain copyright or related rights in it (the “Copyright”) and he has given The
University of Manchester certain rights to use such Copyright, including for
administrative purposes.
ii. Copies of this thesis, either in full or in extracts and whether in hard or electronic
copy, may be made only in accordance with the Copyright, Designs and Patents Act
1988 (as amended) and regulations issued under it or, where appropriate, in accordance
with licensing agreements which the University has from time to time. This page must
form part of any such copies made.
iii. The ownership of certain Copyright, patents, designs, trade marks and other
intellectual property (the “Intellectual Property”) and any reproductions of copyright
works in the thesis, for example graphs and tables (“Reproductions”), which may be
described in this thesis, may not be owned by the author and may be owned by third
parties. Such Intellectual Property and Reproductions cannot and must not be made
available for use without the prior written permission of the owner(s) of the relevant
Intellectual Property and/or Reproductions.
iv. Further information on the conditions under which disclosure, publication and
commercialisation of this thesis, the Copyright and any Intellectual Property and/or
Reproductions described in it may take place is available in the University IP Policy
(see http://documents.manchester.ac.uk/DocuInfo.aspx?DocID=487), in any relevant
Thesis restriction declarations deposited in the University Library, The University
Library’s regulations (see http://www.manchester.ac.uk/library/aboutus/regulations) and
in The University’s policy on Presentation of Theses.
15
Acknowledgements
Firtsly, I would like to thank my primary supervisor, Dr. Rachel Lennon for the
opportunity to work in such an excellent and friendly group, and for her inspiring
enthusiasm for all things residing inside the glomerulus. Also thanks to Prof. David Ray
for his valuable guidance at critical times of the project, and to Prof. Webb for the
fantastic tuition he provided in preparing important presentations.
When I arrived in the lab, I did not know one end of a Gilson pipette from the other; I
thank Hellyeh Hamidi for remedying this and for her endless patience. Thanks to all
members of the Lennon lab for their humour and making my PhD such an enjoyable
experience. Special thanks go to Mikey for providing solutions to I.T. and lab problems
with remarkable consistency, and his willingness to always find time to help. I would
like to thank all members of the Humphries and Caswell groups for showing me how
science should be done, and to Toryn and Shona for all the help in the torturous and
tortuous ChIP-Seq method development. Also, thanks to Cressie for sharing in the
mind-numbing repetitiveness of manual cell tracking.
Finally, I’d like to thank my wonderful wife Lotte and my parents. This thesis is
dedicated to them.

16
1 Introduction
1.1 General
Nephrotic syndrome (NS) is one of the commonest causes of chronic kidney disease in
the paediatric population. The cardinal clinical features are proteinuria (urinary loss of
plasma proteins) leading to hypoalbuminaemia (low blood levels of the plasma protein
albumin) and oedema (massive body swelling). Historically the disease had a dismal
prognosis, with five-year mortality rates of 67% being recorded in the period 1929-
1936.[1] Although the introduction of glucocorticoid (Gc) and antibiotic therapy in the
modern era has reduced mortality rates to approximately 3%,[2] NS remains a
significant clinical burden due to the side effects of Gc treatment, the ongoing threat of
NS-related sepsis, thromboemobolic disease, and the high rates of chronic kidney
disease among patients resistant to Gc-therapy.

17
1.2 The Kidney
The kidneys perform a wide range of essential regulatory functions in mammals
including water and electrolyte homeostasis, excretion of toxic metabolites, acid-base
balance, and regulation of blood pressure. Additionally, they play roles in vitamin D
metabolism and produce erythropoietin which is a regulator of red blood cell
production.
A key step necessary for the kidneys to maintain physiological homeostasis is the
filtering of blood to produce an initial ultrafiltrate of primary urine. This primary urine
then enters the renal tubular system where regulated specific reabsorption and excretion
events finally lead to the production of urine for excretion. Normally, water and small
solutes (eg, urea, glucose, amino acids) freely cross the kidney filtration barrier, while
circulating cells (eg, erythrocytes) and high-molecular weight proteins (eg, albumin) are
retained in blood. This filter selects for both size and charge: the glomerular
permeability of negatively charged proteins such as albumin is exceeded by those of
neutral dextrans of comparable or even larger sizes. [3]
In health, the normal rate of urinary protein excretion throughout childhood in both
boys and girls is <100 mg/m2/day.[4] For a typical 5 year old boy weighing 20 kg with a
body surface area of 0.79 m2, this would equate to 79 mg urinary protein loss/day.
Approximately 50% of this small urinary protein loss consists of a glycoprotein secreted
into the renal tubular system called Tamm-Horsfall protein, with the remainder
consisting of plasma proteins such as albumin, immunoglobulins and β2-microglobulin.
Albumin comprises <30% of the total urinary protein in normal individuals.[4] NS
occurs when the renal filtration barrier becomes hyperpermeable to plasma proteins,
leading to urinary protein losses >2 mg protein/mg creatinine (with normal levels in a
healthy individual being <0.2 mg protein/mg creatinine).[4, 5] In a hospital setting,
urinary protein:creatinine ratios are often reported as mg protein/mmol creatinine, and
values ≥200 are considered to be in the nephrotic range.[6]
The major functions of the kidney are performed by a repeating functional unit called
the nephron. The filtering sub-unit of the nephron is the glomerulus; each human adult
kidney contains approximately 1.4 million glomeruli.[7] (see Figure 1.1) Filtration at

18
the glomerulus is dependent on several components, which collectively form the
‘glomerular filtration barrier’ (GFB).

19
Figure 1.1 The glomerulus
The glomerulus is the filtering sub-unit of the kidney and each glomerulus consists of a tuft of capillaries surrounded by the glomerular filtration
barrier (GFB). Glomerular epithelial cells called podocytes have a key role in maintaining GFB integrity. Images show immunofluorescence
staining for a podocyte-specific marker nephrin using kidney cryosections from a C57BL/6 mouse. (A) shows the location of glomeruli
visualised using a 3D Histech Pannoramic 250 Flash II slide scanner (2X magnification); (B) shows a high-magnification image (40X) of a single
glomerulus imaged using a DeltaVision microscope.

20
1.2.1 The five layers of the glomerular filtration barrier
The GFB is a highly specialised structure, responsible for the selective ultrafiltration of
blood, ensuring minimal urinary protein loss in health.[8] Proteinuria occurs when the
GFB becomes abnormally permeable.[9]
Traditionally, the GFB has been viewed as consisting of three layers: endothelial cells
of the glomerular capillaries, the glomerular basement membrane (GBM), and visceral
epithelial cells lining the outside of glomerular capillaries called podocytes. However,
more recent data has also highlighted the importance of the endothelial surface layer,
and the sub-podocyte space (see Figure 1.2).[10] In the following section, I will
describe each of the GFB layers in turn.
1.2.1.1 Endothelial surface layer
The endothelial surface layer (ESL) is a carbohydrate-rich barrier lying at the interface
of blood and glomerular endothelial cells. The ESL can be sub-divided into two layers:
membrane-bound secreted proteoglycans comprising a protein core (including perlecan
and syndecan) with covalently associated glycosaminoglycan side-chains (eg, heparan
sulphate and hyaluronic acid), and an adsorbed layer of plasma proteins including
albumin.[11-14] A role for the ESL in regulating glomerular permeability came initially
from Singh et al., who demonstrated that removal of a significant portion of the ESL
from glomerular endothelial cells in vitro with neuraminidase altered both
transendothelial albumin passage and electrical resistance, and selective removal of
heparan sulphate proteoglycans with heparanase increased transendothelial monolayer
albumin passage only.[15] Additionally, an increase in the fractional clearance of
albumin in isolated perfused murine kidneys was seen following treatment with the
glycosaminoglycan-degrading enzyme hyaluronidase.[16]
1.2.1.2 Glomerular Endothelial Cells
Glomerular endothelial cells (GECs) differ from endothelial cells found in many other
areas of the body due to their abnormally large fenestrated area, constituting 20-50% of
the entire endothelial surface.[17, 18] The fenestrae are approximately 60 nm in
diameter, while the dimensions of albumin (whose passage across the GFB occurs only
at very low levels in health), are 5.97 x 9.70 x 5.97 nm.[18, 19] Additionally,
endothelial fenestrae in other organs (eg, salivary gland) are bridged by diaphragms that
express plasmalemmal vesicle associated protein (PV-1), but these diaphragms seem to

21
be absent from GEC fenestrae. [20] Thus, although GECs are suited to the role the
glomeruli performs as a high-capacity filtering unit due to their large fenestrations, the
diameter of these diaphragm-free fenestrations suggests their direct contribution to
preventing the passage of plasma proteins such as albumin is limited.
1.2.1.3 Glomerular Basement Membrane
The GBM is a dense network of secreted extracellular matrix (ECM) components
supporting GECs on the inner capillary wall and podocytes on the outer layer of the
GFB.[21] The GBM arises from the fusion of two membranes: one derived from
podocytes and the second derived from endothelial cells,[22] and openings of the GBM
protein mesh of variable dimensions (10-20nm in radius) have been identified.[23]
The main structural support of the GBM is provided by two major networks of laminin
and collagen IV. Laminins are heterotrimeric glycoproteins consisting of α, β, and γ
chains, and are an absolute requirement for basement membrane formation.[24] The
mature GBM is predominantly composed of laminin α5β2γ1, and the importance of
laminin is underscored by the observation that mutations in LAMB2 (the gene encoding
the laminin β2 chain) causes Pierson syndrome, a disease characterised by congenital
NS and ocular abnormalities.[21]
Collagen IV consists of heterotrimers comprising three α chain combinations (α1α1α2,
α3α4α5, or α5α5α6), with the mature GBM principally containing α3α4α5. Although
the collagen IV network is not an absolute requirement for basement membrane
formation, mutations leading to reduced or absent α3α4α5 cause Alport Syndrome,
characterised by progressive renal failure, sensorineural hearing loss and ocular
defects.[21, 25]
Although the collagen/laminin network forms the core of the GBM, a recent proteomics
analysis of the human glomerular ECM has shown the matrix to be a complex system of
structural and regulatory proteins: 144 glomerular ECM proteins were identified, with
>50% expressed in the GBM.[26]
1.2.1.4 Podocytes
Podocytes are highly differentiated epithelial cells located on the outside of glomerular
capillaries, consisting of a large cell body in the urinary space, connecting to the
underlying GBM via cell protrusions (‘major processes’) which terminate in smaller

22
foot processes (FPs). FPs from one podocyte interdigitate with FPs from neighbouring
podocytes creating a signature structural motif.[18] In addition to FPs arising from
major processes, FPs that arise directly from the podocyte cell body to connect the cell
body to the GBM (‘anchoring processes’) have also been described.[27]
Both podocyte-podocyte and podocyte-GBM interactions are critical for the
maintenance of GFB function. The most important adhesion receptor responsible for
binding the podocyte to underlying matrix is integrin α3β1,[28] and homozygous
mutations in ITGA3 (the gene encoding integrin α3) leads to congenital NS, as well as
lung and skin disease.[29]
The junction between adjacent podocyte FPs is termed the slit diaphragm and is
approximately 40 nm wide. In parallel view, the slit diaphragm is a continuous band
between FPs with a zipper-like structure consisting of cross-bridges extending from the
walls of the FPs to a longitudinal central filament, thus forming rectangular pores in the
diaphragm. In one early study, the pore sizes were found to be variable and robust
quantitative analysis was not possible; however superimposing albumin molecules from
x-ray crystallographic data onto the electron tomography slit-diaphragm data showed
that the pore sizes of the larger pores was similar to, or smaller than, albumin
molecules. Additionally, the slit diaphragm pores form convoluted interconnected
channels with varying diameter, rather than simple straight holes of regular size. These
observations suggest the slit diaphragm contributes significantly to the retention of
macromolecules such as albumin within the circulation.[30, 31]
More recent transmission electron microscopy in rat glomeruli identified ellipsoidal
pores in slit diaphragms with a minor and major radius of 9.8 and 14.7 nm, respectively
(the dimensions of albumin are 5.97 x 9.70 x 5.97nm), with a higher frequency of larger
pores in proteinuric rats compared to healthy controls. This observation may help to
provide an explanation for the increased permeability of the GFB in proteinuric
conditions. [32]
The podocyte is thought to play a critical role in maintaining GFB integrity, and this
will be discussed in detail in later sections. However, the importance of this cell in the
pathogenesis of NS is highlighted by the observation that in NS presenting before the
age of 1 year, two-thirds of cases can be explained by mutations in just four genes: i)
NPHS1 – encoding nephrin, a critical component of the podocyte slit diaphragm; ii)
23
NPHS2-encoding podocin, a close interactor of nephrin in the podocyte slit diaphragm;
iii) WT1- encoding Wilms tumor suppressor gene 1, a transcriptional regulator of
several podocyte genes such as NPHS1, NPHS2, MAGI2, PLCE1 and NCK2[33-35]
and; iv) LAMB2- encoding laminin β2, which as a GBM component is critical for
maintaining podocyte architecture and stability.[36]
1.2.1.5 Subpodocyte space
Until recently, it was assumed that there was no significant resistance to solute and fluid
flux downstream of the podocyte FPs. However, it has now been shown that anchoring
processes directly connecting the podocyte cell body to the GBM form a subpodocyte
space (SPS) that is restrictive to fluid flow. This SPS is on the urinary side of the GBM
and is bound by the GBM and FPs on one side and the underside of the podocyte cell
body on the other, with 61% of the filtration area of the GBM (ie, excluding
mesangium) filtering into an SPS. [27]
Fluid that enters the SPS follows a tortuous pathway before reaching a constriction
between the SPS and a larger fluid channel between neighbouring podocytes, termed the
interpodocyte space (IPS). This constriction is termed the SPS exit pore (SEP), and is a
significant barrier to fluid flow: filtrate that crosses the GBM needs to pass through an
SEP area that is 4% of the filtration area to reach the peripheral, pre-tubular urinary
space termed Bowman’s space (BS). [10, 27] Further evidence of the functional
importance of the SPS was provided by multiphoton microscopy in ex vivo perfused rat
glomeruli, which demonstrated that Lucifer yellow flux (a surrogate marker of fluid
flux) in SPS regions was 66-75% of that occurring through regions of GFB that were
not covered by SPS.[37]
Mathematical modelling suggests the resistance of the SEP is 2.47 times that of the
remainder of the GFB and exquisitely sensitive to changes in the dimensions of the
SEP, suggesting an important role for the podocyte in the regulation of fluid flux across
the GFB.[38] Additionally, it has been proposed that the SPS may be important in
preventing clogging of the GFB with solutes, through transient back flux of fluid.[10]

24
Figure 1.2 The layers of the glomerular filtration barrier (GFB).
The GFB is reponsible for the selective ultrafiltration of blood, ensuring minimal passage of
proteins such as albumin into the primary urinary filtrate in health. The GFB consists of five
layers: the endothelial surface layer (ESL); glomerular endothelial cells (GECs); the glomerular
basement membrane (GBM); podocytes, which are specialised epithelial cells whose foot
process (FP) protrusions are linked by the slit diaphragm (SD); and the sub-podocyte space
(SPS).

25
1.2.2 Models of filtration
An appreciation of the mechanism underpinning normal glomerular filtration is a
prerequisite to understanding the development of proteinuria, which is the key feature of
NS. In the following section, I will explain the main hypotheses of filtration and address
the strengths and weaknesses of each model.
1.2.2.1 The albumin retrieval hypothesis
An ongoing area of debate is the degree to which albumin traverses the GFB under
normal conditions. The term used to quantify this is the ‘sieving coefficient’ (SC): the
ratio of the concentration of albumin (or other high-molecular weight proteins) in
primary filtrate compared to plasma. Micropuncture of rat proximal tubules gives a SC
of 6x10⁻⁴,[39] while a SC of 8x10⁻⁵ was found in patients with Fanconi syndrome
(dysfunction of proximal tubule reabsorption).[40] Values of 3x10⁻⁴ were obtained in
rats in which tubular reabsorption was inhibited with lysine, [18] and a SC of 5x10⁻⁵
was found in mice with reduced capacity for tubular albumin reabsorption due to
tubular-cell-specific cubulin/megalin double knock-out.[41] However, use of
fluorescent labelled albumin coupled with intravital two photon microscopy in rats by
Russo et al., suggest a SC of 0.034, [42] which, if true, would mean approximately 8%
instead of 0.02-0.06% of albumin would cross the renal filter.[43]
The proposal that the GFB is more permeable to albumin than previously thought gave
rise to the ‘albumin retrieval hypothesis’ whereby relatively large amounts of albumin
pass through the GFB and are subsequently retrieved by downstream tubular cells. In
addition to the vast majority of published evidence suggesting the SC is much smaller
than 0.034, mathematical modelling suggests that the high rates of tubular albumin
reabsorption required by this burden would be impossible, even if every albumin
molecule that reaches an epithelial cell were internalised immediately.[44, 45] When the
two photon microscopy technique applied by Russo et al., (described above), was used
by two independent groups, they found the SC of albumin and 70-kD dextran were
much lower than values obtained by Russo (~0.002 Vs ~0.03). [46, 47] Explanations
put forward to explain Russo’s data include the use of external (instead of internal)
photodetectors that were responsible for the collection of significant out-of-focus
fluorescence (background noise potentially erroneously recorded as an albumin
reading). With further developments in intravital imaging allowing highly precise
measurements of fluorophore intensity in the glomerulus, a sieving coefficient of 70-kD

26
dextran was found to be approximately 0.001, suggesting the GFB is a strong barrier to
protein flux.[48]
Further problems with this hypothesis involve the tubular reabsorption of albumin.
Although it is known that albumin is taken up by the megalin-cubulin complex, a
significant proportion of this would subsequently undergo degradation in lysosomal
vesicles.[49] The ‘albumin retrieval hypothesis’ of filtration remains controversial and
is not widely accepted.[18, 43]
1.2.2.2 The pore model
The observation that there is increasing restriction to the passage of macromolecules
from the capillaries into the primary filtrate as molecular diameter increases led to the
idea that the glomerulus is essentially a passive mechanical sieve consisting of a series
of pores: the GBM acting as a coarse filter for large proteins, while podocyte slit
diaphragms restricting the passage of smaller proteins such as albumin. This theoretical
scheme was the basis of the ‘pore model’ of filtration.[50]
The first data suggesting filtration may be a more dynamic process came from Ryan et
al., who examined haemodynamic effects on filtration in the rat glomerulus. It was
found that during periods of normal blood flow, plasma albumin does not significantly
penetrate beyond the endothelial layer of the glomerular capillary wall. When renal
blood flow was interrupted via occlusion of the renal pedicle, albumin was found in
large amounts in the urinary space and the GBM, with glomerular structural architecture
being preserved. Interestingly, this seemed to be a reversible process: if the blood flow
was restored following a five minute period of ligation, the distribution of albumin in
the glomerulus returned to normal (within minutes). These data suggest that GFB
function cannot be attributed solely to structural elements, and haemodynamic features
play a role. [50, 51]
The model was subsequently developed to include two major forces dictating albumin
flux across the filter: convection and diffusion. Convective flux is driven by the drag of
the flow of water across the GFB and is proportional to the hydraulic pressure
difference across the layer. Diffusion is driven by the concentration difference within
the capillary lumen and the primary filtrate. The flux of albumin across the GFB in the
absence of blood flow/convection identified by Ryan et al., was ascribed to
diffusion.[43, 51]

27
However, the most problematic aspect of this model is its failure to explain why the
filter does not clog with macromolecules. An analogous example of the ‘pore model’ of
filtration used in clinical practice is continuous venovenous filtration (CVVH), which
produces a protein-free ultrafiltrate from plasma using a semi-permeable membrane (as
does the glomerulus), but typically clogs after three days use.[43] Additionally, it seems
that under normal conditions albumin does not penetrate further than the GBM, despite
the pores in the GBM being much larger than albumin. [23, 51] A more refined model
incorporating an anti-clogging mechanism, and explaining why albumin does not
significantly penetrate the GBM despite limited structural resistance has been proposed,
as described below.
1.2.2.3 The electrokinetic model
The electrokinetic model of glomerular filtration assumes that, in addition to convection
and diffusion, an electrical field is generated across the barrier by the physical
phenomenon of a ‘streaming potential,’ which in turn prevents the negatively charged
plasma proteins from entering or passing the filter.[52, 53]
The most likely mechanism by which a charge is generated across the GFB is by a
streaming potential. When a filtration pressure is applied to a porous membrane
separating two spaces, cations (eg, sodium, potassium) and anions (eg, chloride,
bicarbonate) will be differentially separated. This streaming potential across the
filtration layer is proportional to the effective filtration pressure.[52]
This model has supportive in vivo data. It is technically challenging to perform
micropuncture experiments in mammalian glomerular capillaries due to their small size
(4-5µm). However, in the amphibian Necturus maculosus (with a capillary diameter of
50µm), a potential difference was measured across the GFB that was proportional to the
filtration pressure (-0.045 mV/ 10cm H2O), and negative within Bowman’s (urinary)
space.[54] The authors postulate that the electrokinetic model may provide an
explanation for orthostatic proteinuria (proteinuria in the upright position, but not in the
supine position, as a consequence of a drop in renal perfusion and glomerular filtration
rate when upright). As the filtration pressure is a vital factor in generating the streaming
potential, when the filtration pressure is reduced in the upright position, the streaming
potential across the GFB is diminished and proteinuria results.

28
The electrokinetic model may also explain the link between the podocyte cytoskeletal
changes associated with NS, and the development of proteinuria. In health, the filtering
surface is covered with interdigitating podocyte foot processes, allowing filtration to
occur homogeneously across the filtering surface (the main podocyte cell bodies, which
would act as barriers to filtration, are not in contact with the filtering surface, but are
submerged in primary urine). During periods of proteinuria, podocyte foot processes are
effaced so that they cover almost the entire filtering surface: some filtration (and
therefore charge separation) will still occur between cells, but the anions will
immediately fall back across the non-filtering (but still electrically conductive) areas
underneath the effaced podocyte, so short-circuiting the streaming potential throughout
the glomerulus.[54]
In summary, the electrokinetic model of filtration describes the GFB as a barrier with
electrical effects, not simply as a passive filter. The GFB produces streaming potentials,
generated whenever an ionic fluid passes through an electrically charged barrier, and is
sufficient to repel negatively charged plasma proteins from entering the GFB.[55] This
explains the observation that most of the albumin in the mammalian kidneys never
reaches the podocyte slit diaphragm, even though the fenestrations in the endothelial
cells, and pores in the GBM are unlikely to offer sufficient mechanical resistance to
albumin flux.[50, 56] The negative charge on the urinary side of the GFB also provides
an explanation for why anionic proteins are preferentially retained in the blood
compared to other (non-anionic) molecules of comparable size. [3, 54] When podocyte
foot process effacement occurs in NS, larger parts of the GFB will block filtration
because they are covered by flattened podocytes, the electrical field decays, plasma
proteins are incompletely repelled, and this results in proteinuria.[55]

29
1.3 The podocyte
1.3.1 The podocyte cytoskeleton
A complex system of cytoskeletal and signalling molecules is responsible for ensuring
podocyte structural integrity is maintained and efficient renal filtration can occur.
Podocyte cytoarchitecture is characterised by an arborised cell body with multiple major
projections, which subdivide into secondary processes and eventually into finer terminal
foot processes (see Figure 1.3). The cytoskeleton consists of three distinct sets of
structural elements: microfilaments (7-9 nm in diameter), intermediate filaments (10
nm), and microtubules (24 nm). Podocyte cell bodies, major processes and secondary
processes are supported by microtubules (polymers of α-tubulin and β-tubulin) and
intermediate filaments (eg, vimentin and desmin), while foot processes are rich in
parallel bundles of F-actin microfilaments, myosin, and the actin-bundling protein, α-
actinin-4. [57-59]
Foot processes of neighbouring podocytes are connected with one another via the slit
diaphragm (SD) in a characteristic interdigitating pattern. The SD bridges the 30-50nm
space between neighbouring foot processes and is classified as a ‘modified adherens
junction’ composed of P-cadherin, α-, β-, and γ-catenin, and zonula occludens-1 (ZO-1),
unique podocyte proteins such as nephrin, but lacking the characteristic adherens
junction protein vinculin. [60] Transmission electron microscopy studies suggest the SD
consists of rodlike units, connected in the centre to a linear bar, forming a ‘zipperlike’
pattern.[31, 57] Proteins that have been localised to the SD are listed in Table 1.1.
A protein of critical importance for maintaining SD function is nephrin, and mutations
in the nephrin gene NPHS1 are the cause of congenital nephrotic syndrome of the
Finnish type.[61] Nephrin is a member of the immunoglobulin (Ig) superfamily, and
interacts with other nephrin molecules in the SD via its extracellular domain. [62] The
intracellular cytoplasmic tail of nephrin indirectly links to the cytoskeleton via
modulators of actin dynamics including CD2-associated protein (CD2AP) and
podocin.[63, 64] CD2AP, in turn, interacts with actin,[65] as well as the actin-binding
proteins CapZ,[66] cortactin,[67] and the α–actinin-modulating protein
synaptopodin.[68] Nephrin also plays a central role in the transduction of extracellular
signals via phosphorylation-dependent mechanisms to the internal podocyte
cytoskeleton, and this will be discussed in the following section.

30
Table 1.1 Proteins located at the slit diaphragm
Protein Reference(s)
α-, β-, γ- catenin [60]
aPKC/Par3/Par6 complex [69]
CASK [70]
CD2AP [64, 71]
Cingulin [70]
CLIC5 [72]
Cx43 [73]
Dendrin [74]
Ephrin-B1 [75]
FAT1 [76]
Galectin-1 [77]
JAM-A [70]
MAGI-1, -2 [78, 79]
Neph-1, -2 [80, 81]
Nephrin [30, 82, 83]
Occludin [70]
P-cadherin [60]
Podocin [63, 84]
Spectrin (αII, βII) [79]
Zonula occludens-1 [85, 86]

31
Figure 1.3 Podocyte ultrastructure
Podocytes form an important part of the glomerular filtration barrier. These cells have an
arborized structure, whereby actin-rich major processes extended from the cell body, to form
major processes, which sub-divide further into secondary processes (SP) and eventually foot
processes (FP). FPs are connected by a complex modified adherens junction called the slit
diaphragm (SD). The white arrow shows the direction of filtration across the glomerular
filtration barrier. GBM=glomerular basement membrane. Transmission electron microscopy
images taken by Dr Aleksandr Mironov (University of Manchester), using samples from a
female, 4 month old C57BL/6 mouse.

32
1.3.2 Signalling at the slit diaphragm
The SD functions as a complex signalling hub, playing a critical role in the transduction
of a variety of extracellular signals to the podocyte cytoskeleton (see Figure 1.4).[59,
87] A key step in initiating this signalling cascade is the tyrosine-phosphorylation of
nephrin by the Src family kinase Fyn.[88] Phosphorylation of nephrin leads to the
recruitment of several proteins including the adaptor proteins Nck1/2[89], Crk1/2[90],
CrkL [91], Grb2[92], as well as PI3-kinase.[93, 94] Additionally, Neph1 forms a protein
complex with Nephrin, and Fyn-dependent tyrosine phosphorylation of Neph1 leads to
recruitment of Grb2.[95]
After Nck1/2 has bound phosphorylated nephrin, Nck1/2 binds to neuronal Wiskott-
Aldrich syndrome protein (N-WASP), which in turn activates the Arp2/3 complex, and
leads to cytoskeletal reorganization.[59, 96] In contrast to the role nephrin plays in
promoting actin polymerisation, signalling via the podocyte Robo2 receptor inhibits
nephrin-induced actin polymerisation.[97]
1.3.3 The role of the podocyte in nephrotic syndrome
Shortly after the podocyte SD was first identified in healthy glomeruli using electron
microscopy,[31] it was observed that the flattening of podocyte foot processes with loss
of the SD (‘effacement’) was a characteristic morphological feature of proteinuria.
Additionally, it was discovered that the SD reforms after administration of Gc therapy
and regression of proteinuria.[98] These observations gave rise to the concept that NS
results from functional and structural alterations to the podocyte and SD.[87]
Further evidence implicating the podocyte in the development of proteinuria came with
the discovery that mutations in NPHS1 (coding for the podocyte-specific protein
nephrin) cause congenital nephrotic syndrome of the Finnish type.[61] Additionally,
mutations in genes encoding other SD proteins such as podocin,[99] Neph1,[80]
protocadherin Fat1,[100] the ion channel TRPC6,[101] and the adaptor protein
CD2AP,[71] result in proteinuria in mice and humans. For a more complete list of gene
mutations implicated in NS, see Table 1.3.
Over the previous decades, an immunological basis for NS has been postulated, partly
due to the presumption that medications known to be effective in INS (eg, Gc,
calcineurin inhibitors) are potent immunosuppressive agents.[102] However, more
recent data has shown that many of these therapeutic agents have direct effects on the

33
podocyte, underlining the role of this cell as a key player in the pathogenesis of INS.
For example, the calcineurin inhibitor ciclosporin A is used to treat children with steroid
dependent- or steroid resistant NS (definitions provided in Table 1.2) and exerts an
immunosuppressive effect through inhibition of nuclear factor of activated T-cells
(NFAT) signalling in T-cells. However, Faul et al., showed the therapeutic efficacy of
ciclosporin A in INS is not dependent on NFAT inhibition in T cells, but directly via
stabilisation of the actin cytoskeleton in podocytes by protecting the actin-regulating
protein synaptopodin from degradation by cathepsin L.[103] I will now discuss direct
effects of Gc on the podocyte.
1.3.3.1 Direct effects of Gc on the podocyte
As will be discussed in later sections, the canonical mechanism of action of Gc is
through binding to the cytosolic glucocorticoid receptor (GR). GR is a ligand-activated
transcription factor. Upon ligand binding, GR translocates into the nucleus and directs
the expression of target genes. Yan et al., provided the first data in adult human
histology specimens that podocytes express GR, and GR could be identified in
transcriptionally-active nuclear euchromatin, but not in the heterochromatic nuclear
areas which typically exhibit lower transcriptional activity.[104] It was subsequently
shown that exposure of an immortalised murine podocyte cell line to the Gc
dexamethasone causes cytosolic GR to translocate into the nucleus, induces
upregulation of protein and messenger ribonucleic acid (mRNA) of known Gc-targets,
and reduces GR expression in a negative feedback loop. These data confirm the key
components of the Gc signalling pathway are intact in the mouse podocyte.[105]
Building on these data, several studies have characterised Gc-effects on the podocytes.
Ransom et al., compared the total proteomic output of murine podocytes with and
without Gc treatment using a mass spectrometry approach, and identified 7 Gc-
regulated proteins (ATPase, H+ transport, lysosomal; annexin 5; ciliary neurotrophic
factor; αB-crystallin; gelosin; purine nucleotide phosphorylase; and heat shock protein
27).[106]
A microarray approach has been utilised to understand how Gc exposure affects
podocyte differentiation at the transcriptomic level.[107] The immortalised human
podocyte cell line used in the study takes 10-14 days to fully differentiate.[108] The
authors allowed 2 days of differentiation before treating with either vehicle or
dexamethasone for a further 3 days. Dexamethasone altered the expression of several

34
genes involved in inflammation, cell migration, angiogenesis, as well as the nuclear
factor kappa-light-chain-enhancer of activated B cells (NF-κB) and transforming growth
factor β (TGF-β) pathways.
Other studies have investigated Gc effects on the podocytes using disease-models. It has
been demonstrated that treatment of a murine podocyte cell line with dexamethasone
protected, and enhanced recovery, from the puromycin aminonucleoside (PAN) model
of podocyte injury (quantified using a cell viability assay and total polymerised cell
actin content).[109] Activity of the actin-regulating GTPase Ras homolog gene family,
member A (RhoA) was also increased when cells were treated with dexamethasone for
30 minutes, followed by culture for a further 3 days in fresh (non-dexamethasone
containing) medium.
Wada et al., have shown that dexamethasone significantly reduced podocyte apoptosis
in a PAN cell culture model. [110] This protective effect was associated with decreased
expression of the pro-apoptosis protein cellular tumour antigen p53 (p53), and increased
expression of anti-apoptotic protein B-cell lymphoma-extra large (Bcl-xL). Of potential
functional benefit was the observation that Gc upregulated expression of nephrin and α-
tubulin in an immortalised human podocyte cell line.[102]
Gc treatment also has potentially clinically-relevant effects on the expression of
vascular endothelial growth factor (VEGF). The VEGF-A isoform regulates SD-
signalling and podocyte cytoskeletal dynamics via nephrin-nck-actin interactions, and
VEGF-A overexpression causes proteinuria and FP effacement in mice.[111, 112]
Podocytes are the major source of VEGF-A in glomeruli [113, 114] and higher
expression levels are observed in NS.[115] Gc has been shown to reduce VEGF-A
expression in podocytes in vitro.[102]
The possible immunological basis for INS will be discussed in Section 1.5.2. Podocytes
express a number of chemokine receptors (CCR4, CCR8, CCR9, CCR10, CXCR1,
CXCR3, CXCR4, and CXCR5)[116] and dexamethasone treatment supresses podocyte
expression of interleukin-6 (but not interleukin-8).[102]
Some data exist that Gc may be exerting a direct, potentially clinically-relevant effect
on podocytes through altering intracellular trafficking and post-translational
modifications of nephrin. Fuji et al., have shown in human embryonic kidney-293
(HEK 293) cells that endoplasmic reticulum (ER) stress led to the formation of

35
underglycosylated nephrin that remained in the ER.[117] Dexamethasone exposure
restored the synthesis of fully glycosylated nephrin via stimulation of adenosine
triphosphate production (ATP) and restored normal trafficking of nephrin to the plasma
membrane. On the basis of these observations, the authors speculate that Gc may exert
protective effects by affecting intracellular levels of ATP. Building on data
demonstrating that nephrin is phosphorylated under normal conditions, and
phosphorylation is decreased in rodent PAN and human NS,[118] Ohashi et al., showed
that Gc (dexamethasone) exposure increased the phosphorylation of nephrin via
serum/glucocorticoid-induced kinase 1 (SGK1).[119]
Using an in vivo rodent model of adriamycin-induced NS,[120] Gc (prednisone)
reduced proteinuria, possibly through stabilising the abnormal subcellular localisation
of nephrin, podocin, CD2AP, and α-actinin observed after adriamycin exposure.[120]
A report from 2014 suggests Gc may be exerting protective effects on podocytes
through altering expression of microRNA (miRNA) molecules, specifically the miR-30
family.[121] All members of miR-30 were found to be downregulated in patients with
NS, as well as in rats treated with PAN. Moreover, transfer of exogenous miR-30a to
podocytes of PAN-treated rats using an in vivo gene delivery system ameliorated
proteinuria and podocyte injury and reduced Notch1 activation. Gc exposure sustained
miR-30 expression and reduced Notch1 activation, leading to the possibility that miR-
30a expression may be a novel mechanism underlying the therapeutic effectiveness of
Gc in INS.

36
Figure 1.4 Schematic diagram of the linkage between slit-diaphragm (SD) proteins and the
actin cytoskeleton.
The SD is a multiprotein, complex signalling hub connecting adjacent podocyte foot processes
(FPs). Membrane proteins are shown in red, adaptor proteins in orange, and effector proteins in
green. Biochemical protein-protein interactions are shown by blue double arrows, and the
effector pathways are indicated by green arrows. Taken from [59].

37
1.3.4 Podocyte contractility and motility
As described above, podocytes contain a complex cytoskeletal network. It has been
proposed that these distinct architectural features are necessary to withstand, and
possibly react to, the highly dynamic conditions existing in the urinary space: varying
filtration flow rates; the mechanical stress imposed by the shear stress from primary
filtrate; and the hydraulic pressure from capillaries.[59, 122, 123] Indeed, the
requirement for podocytes to withstand such stresses is underscored by the observation
that they exhibit several characteristics of smooth muscle cells, including rapid insulin-
sensitive glucose uptake, expression of smooth muscle markers smoothelin and
calponin,[124, 125] and spontaneous contraction in vitro.[124] Additionally, fluid shear
stress induces a reorganisation of the actin cytoskeleton including enhancement of
podocyte cell protrusion formation and redistribution of the actin nucleation protein
cortactin to the cell periphery.[126]
Mechanistically, stretch- and calcium-sensitive potassium channels have been identified
in podocytes,[127] and the podocyte cytoskeletal reorganisation elicited by mechanical
force involves the (calcium-sensitive) calmodulin-dependent kinase and activation of
the small GTPase ras homolog gene family, member A (RhoA). It has also been shown
that the TRPC5 and TRPC6 ion channels mediate calcium influx into podocytes in
response to angiotensin II, eliciting reorganisation of the actin cytoskeleton via RhoA
and Ras-related C3 botulinum toxin substrate 1 (Rac1).[128]
Thus, the podocyte cytoskeleton is sensitive to the mechanical stimuli it experiences
within the glomerulus. Additionally, the concept of podocyte motility as a determinant
of GFB function is an emerging theme in renal biology.[129, 130] This originated from
the observation that treating primary rodent podocytes with puromycin aminonucleoside
(PAN) (used to induce proteinuria in the rodent model of puromycin aminonucleoside
nephrosis) promoted podocyte migration ex vivo.[131] PAN treatment also upregulated
expression of the cysteine protease cathepsin L (CatL) in podocytes in vivo, and isolated
rodent podocytes lacking CatL were protected from PAN-induced cell detachment.
Additionally, PAN-induced cell migration was slowed in CatL-deficient podocytes.
From these data, the authors postulated that the onset of proteinuria represents a
migratory event in podocytes, possibly mediated via CatL.
Recent developments in serial multiphoton imaging have also allowed direct
visualisation of the kidney at a cellular level in vivo and shown that podocytes are

38
motile along the basement membrane.[48, 132] Using serial multiphoton microscopy of
the same glomeruli over several days in mice expressing green fluorescent protein under
the control of the podocyte-specific podocin promoter in vivo, it was possible to observe
podocytes migrate within the glomerulus.[132] Higher rates of podocyte migration were
observed in mice after renal injury was induced through unilateral ureteral obstruction
(UUO) and via the adriamycin nephropathy model compared to healthy control mice.
Cell bridges of podocyte origin also formed between the visceral and parietal
glomerular cell layers in mice post-injury. These observations have altered the view of
the GFB from a static to a highly dynamic structure, with podocytes capable of rapidly
reorganising their actin-based cytoskeleton in response to external stimuli.[130] It has
been proposed that under normal conditions, podocyte motility is necessary to ensure
the GFB remains clear of proteins, which may otherwise become trapped under the SD.
However, a hypermotile podocyte phenotype signals the onset of proteinuria.[123]
Insight into potential mechanisms underlying disease-associated podocyte hypermotility
came from Ma et al., who demonstrated a role for focal adhesion kinase (FAK). The
group demonstrated that in murine models, glomerular injury led to podocyte FAK
activation associated with FP effacement and proteinuria, and glomerular damage was
reduced by FAK inhibition. Furthermore, in vitro, podocytes isolated from FAK
knockout mice demonstrated reduced motility, suggesting pharmacological inhibition of
FAK may have therapeutic potential in NS.[133] In a more recent study, Harris et al.,
demonstrated that proteases present in serum from patients with active FSGS can
activate the protease activated receptor 1 (PAR1), which leads to the podocin-dependent
phosphorylation of actin-associated protein vasodilator stimulated phosphoprotein
(VASP), and enhanced podocyte motility.[134]

39
1.4 Clinical aspects of nephrotic syndrome
NS is characterised by heavy proteinuria and resultant hypoalbuminaemia, leading to a
fall in plasma oncotic pressure and generalised oedema. These features are typically
associated with hyperlipidaemia.[135] Children with NS are at risk of a wide range of
complications associated with significant morbidity and experience mortality rates of up
to 2.7%.[2]
1.4.1 Classification of NS
Several schemes have been used to classify NS including: i) histopathological criteria;
ii) time of disease onset (congenital/infantile NS or idiopathic NS); and iii) response to
pharmacological therapy.
1.4.1.1 Classification by histopathological criteria
The introduction of percutaneous needle renal biopsy in the 1950’s led to a recognition
of the range of histopathological abnormalities that can underlie NS. [136] In childhood
NS, the three most common histopathological patterns seen are: minimal change disease
(MCD), focal segmental glomerulosclerosis (FSGS), and mesangial proliferative
(mesangiocapillary) glomerulonephritis (MPGN). Analysis of renal biopsy findings in
127 new-onset, untreated cases of paediatric NS revealed MCD accounted for 79% of
cases, FSGS for 9% of cases, and MPGN for 5% of cases.[137]
In MCD, glomeruli appear normal by light microscopy.[138] However, electron
microscopy reveals podocyte FP effacement. Although MCD is the most common
histological diagnosis among NS paediatric patients, it displays a distinctive age-related
distribution: MCD accounts for 90% of cases in patients under 10 years old, falling to
50% of cases in children older than 10 years, and 10% of adults.[138, 139]
FSGS is characterised by a segmental scarring of the glomerular tuft, affecting only
some glomeruli,[140] and is the most common glomerular histological pattern of
paediatric end stage renal disease (ESRD).[141] For unclear reasons, the incidence of
FSGS seems to have approximately doubled over a number of decades (1978-1997),
and may even have surpassed MCD as the most frequent diagnosis in the paediatric
African American population. [142]
There is considerable debate focussed on whether MCD and FSGS are actually distinct
clinical entities. Hoyer et al. reported 3 children suffering from NS refractory to

40
pharmacological management, who were undergoing kidney transplantation. All 3
children suffered disease-recurrence post-transplantation. Two of the children showed
histological progression from MCD early in the disease to FSGS after transplantation
(the third child showed features of FSGS at presentation).[143] Some authors suggest
MCD and FSGS are parts of a single spectrum of disease, with MCD resulting from
minor glomerular injury and rapidly corrected by pharmacological therapy, with FSGS
an ‘irreversible’ form of MCD, frequently progressing to ESRD.[144]
1.4.1.2 Classification by age of disease onset
NS can also be divided into congenital NS (presentation before 3 months of age),
infantile NS (presentation between 3 months-1 year of age) and idiopathic NS (INS)
(NS presenting after the age of 1 year). Congenital and infantile NS are extremely rare,
while the incidence of INS from a study in northern England using data collected over a
12 year period was found to be 2.3/ 100,000 patient years (pyrs). The authors found a
marked difference in incidence according to ethnic background: 7.4/100,000 pyrs in
South Asian children, compared with 1.6/100,000 in non-South Asian children.[145]
Asian children with INS also had an earlier mean age of onset of 3.4 years compared to
European children who typically present at 4.2 years.[146]
Although the majority of congenital and infantile NS have an underlying genetic basis
(and will be discussed subsequently), other rarer causes include: infection (eg,
congenital cytomegalovirus, heptatitis B and C, congenital rubella), malignancy (eg,
nephroblastoma), and drug reactions. The underlying cause(s), and treatment of INS
will be discussed in detail in section 1.5.
Unlike the treatment for INS, pharmacological management does not produce disease-
remission in congenital NS.[147, 148] The mainstay of treatment involves controlling
oedema with albumin infusions, preventing malnutrition with high-energy and high-
protein feeds, and reducing proteinuria by nephrectomy. Kidney transplantation is the
only curative option.[147]
1.4.1.3 Classification by response to pharmacological therapy
Arneil in 1956 was the first investigator to publish evidence supporting the use of the
synthetic glucocorticoid prednisolone as effective therapy for childhood INS.[149] This
landmark discovery led to the International Study of Kidney Disease in Children
(ISKDC)[137, 139] and later work by the Arbeitsgemeinschaft für Pӓdiatrische
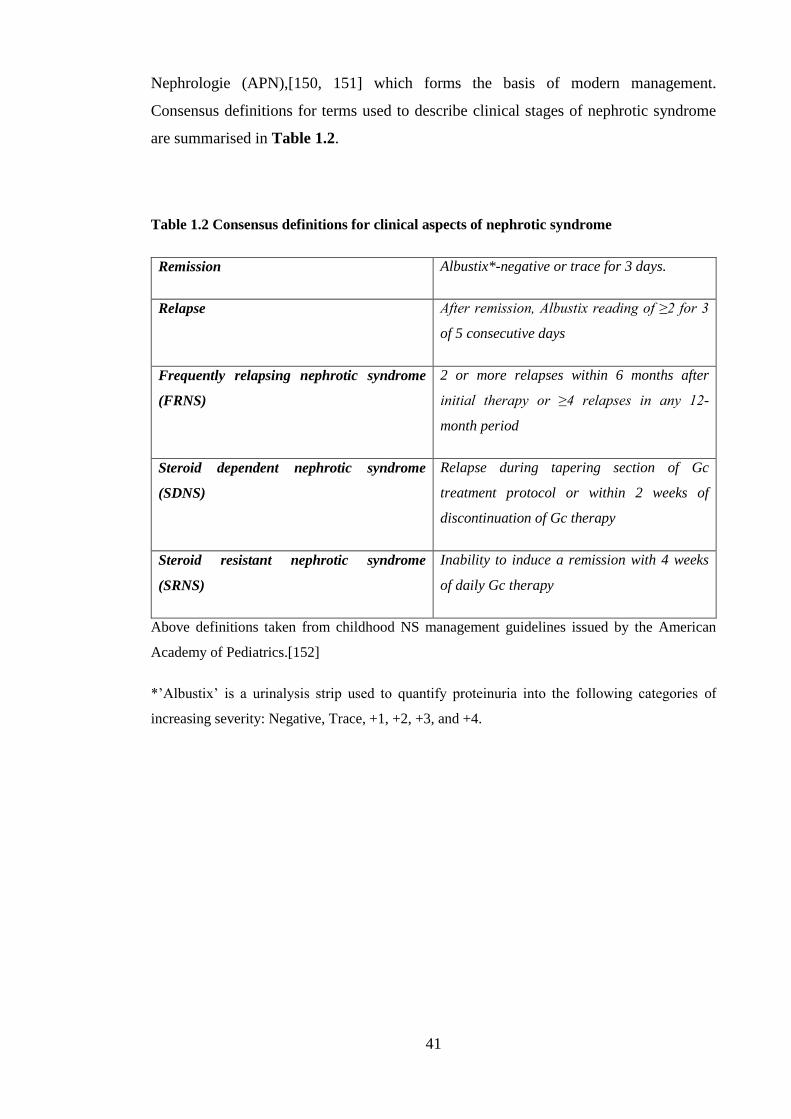
41
Nephrologie (APN),[150, 151] which forms the basis of modern management.
Consensus definitions for terms used to describe clinical stages of nephrotic syndrome
are summarised in Table 1.2.
Table 1.2 Consensus definitions for clinical aspects of nephrotic syndrome
Remission Albustix*-negative or trace for 3 days.
Relapse After remission, Albustix reading of ≥2 for 3
of 5 consecutive days
Frequently relapsing nephrotic syndrome
(FRNS)
2 or more relapses within 6 months after
initial therapy or ≥4 relapses in any 12-
month period
Steroid dependent nephrotic syndrome
(SDNS)
Relapse during tapering section of Gc
treatment protocol or within 2 weeks of
discontinuation of Gc therapy
Steroid resistant nephrotic syndrome
(SRNS)
Inability to induce a remission with 4 weeks
of daily Gc therapy
Above definitions taken from childhood NS management guidelines issued by the American
Academy of Pediatrics.[152]
*’Albustix’ is a urinalysis strip used to quantify proteinuria into the following categories of
increasing severity: Negative, Trace, +1, +2, +3, and +4.

42
Current initial standard management includes a minimum eight week course of oral Gc
(prednisolone in the UK) at a dose of 60mg/m2 (maximum dose 80mg) once a day for
the first month, followed by 40mg/m2 (maximum dose 60mg) on alternate days for the
second month, without renal biopsy at presentation. This established regimen is
currently being compared to an extended (sixteen week) tapering prednisolone regimen
in a UK multicentre randomised double blind trial called the PREDnisolone in
NephrOtic Syndrome (PREDNOS) study.
Approximately 92% of children with INS will go into remission during the initial course
of Gc therapy, and are classified as having steroid-sensitive nephrotic syndrome
(SSNS), while 8% of children fail to enter remission during this initial treatment period
and are classified as having steroid resistant nephrotic syndrome (SRNS).[153] Of
SSNS patients, 44% will go into long-term remission, 22% have an infrequently
relapsing course (relapsing but not satisfying criteria for FRNS), 31% have a frequently
relapsing course, and 3% subsequently develop SRNS.
Pharmacological management of FRNS, SDNS and SRNS may involve the anthelmintic
drug levamisole, alkylating agents (eg, cyclophosphamide), calcineurin inhibitors (eg,
ciclosporin), antiproliferative agents (eg, mycophenolate mofetil) and an anti-CD20
antibody (rituximab).
1.4.2 Prognosis
Children with SSNS generally have a good long-term outcome. However, significant
morbidity is associated with a disease course refractory to pharmacological
management. Acute problems include infection and thromboembolic events, while long-
term risks include medication toxicity and the risk of developing end-stage renal disease
(ESRD) necessitating a period of dialysis and ultimately kidney transplantation.
The leading cause of mortality in the childhood INS population is infection, and the
annual incidence of invasive bacterial infection is approximately 1-2%.[2, 154] The
ISKDC followed up 373 children with INS for 5-10years and reported 10 deaths, 6 due
to infection.[2] Potential reasons for the increased rates of infection in INS include
urinary loss of immunoglobulin, disturbances of the complement system, [155]
defective opsonisation and altered T-cell function.[5] The importance of infection in
INS is underscored by the observation that the first significant reductions in mortality
attributed to INS came with the introduction of antimicrobial agents: in the pre-

43
antibiotic era INS mortality was 67% (1929-1936), falling to 42% after the introduction
of sulphonamide antibiotics in 1939, and still further to 35% in 1944 following wide-
spread use of penicillin.[1]
The second leading cause of mortality in nephrotic children is thromboembolic disease
(TED).[2] A study involving 326 children with INS with a median follow-up time of 3.7
years reported that 9.2% of the patient cohort experienced at least one episode of TED.
In addition to these acute complications, children with INS face several long-term
complications, and these will be addressed below.
1.4.2.1 Prognosis for children with SSNS
Although the majority of children with SSNS achieve long-term disease remission
without further relapses by the early-mid teenage years,[156] recent studies indicate a
significant relapse rate after 18 years of age between 27-42%.[157-159] Many of the
complications faced by children with SSNS are attributable to medication side effects.
Indeed, one of the major challenges facing clinicians is to effectively treat the acute
complications associated with the proteinuric state, whilst minimising risk to long-term
health outcomes.
Repeated courses of Gc therapy during childhood have a number of significant adverse
effects, including short stature, obesity and osteoporosis.[160] Gc administration is also
associated with ophthalmological complications: in a study including 45 Japanese
children with SSNS, 20% had elevated intraocular pressure, while one-third had
posterior subcapsular cataracts. The severity of cataract was related to total duration of
Gc therapy.[161] It has been shown that children with INS receiving long-term alternate
day Gc therapy are at risk of developing suppression of the hypothalamic-pituitary-
adrenal axis (HPA), and those with evidence of HPA suppression are at greater risk of
disease relapse.[162] Children with INS on prolonged Gc remain at risk of adrenal
insufficiency until at least 9 months after Gc-discontinuation.[163]
Children with SSNS may be at risk from Gc-induced osteoporosis and osteomalacia
due to decreased 25-hydroxy-vitamin D levels secondary to urinary loss of vitamin D
binding protein.[164] Some evidence suggests that children with INS receiving Gc
therapy do suffer from Gc-induced osteoporosis defined by radiological criteria
[quantitatively expressed as a bone mineral density (BMD) value evaluated by dual-
energy X-linked absorptiometry of the lumbar spine],[165] although it has not been

44
shown that reduced BMD in paediatric nephrotic patients results in an increased fracture
rate. However, adults taking a prednisolone dose ≥7.5 mg/day for either treatment of
asthma or rheumatoid arthritis double their risk of experiencing a fracture.[166] Some
studies report a loss of growth (height) velocity with high cumulative Gc doses,[167,
168] although significant catch-up growth seems to compensate for pubertal growth
retardation and children with SSNS attain normal final adult heights (as defined by
estimated target height).[158]
It must be emphasised that even though some Gc-induced side effects may be transitory,
they may still significantly impact patient outcome. Leonard et al., examined 60
children and adolescents with SSNS who had received Gc-therapy within 1 year of
recruitment. It was found that they were shorter (p=0.008) and had a greater body-mass
index (p<0.001) than controls.[169] Side-effects are thought to be a key cause of non-
adherence to medication, especially in the adolescent population. Data for INS patients
specifically is lacking, but non-compliance has been identified as the aetiology of graft
failure in 13% of adolescent kidney transplant recipients,[170] and the World Health
Organization has identified cosmetic side effects (eg, Gc-induced acne) and chronicity
of medication prescription as influencing factors on medication adherence.[171]
1.4.2.2 Prognosis for children with SRNS
In contrast to the generally favourable outcome of SSNS, patients with SRNS have a
much more guarded prognosis, with 53% of children progressing to ESRD within 15
years.[172] In a European study involving 78 children with SRNS with a median
follow-up period of 7.7 years, twenty patients (26%) received kidney transplants.
Following transplant, ten children showed recurrence of NS. Deep venous thrombosis
confirmed by imaging occurred in 6 patients (8%), and infections requiring
hospitalisation occurred in 24 patients (31%). Two (2.6%) children died: one from
sepsis and one from renal and haemodynamic failure.[172]
Additionally, the PodoNet consortium has recently reported data from a heterogeneous
population of 1655 children with SRNS [defined as either congenital NS (6%), infantile
NS (7%), adolescent-onset NS (13%), or childhood onset NS (74%)], with a median
follow-up time of 3.7 years. At time of the last follow-up, 11.7% required dialysis,
14.2% of the children had received kidney allografts, and 2.3% of the patients were
deceased.[173]

45
1.4.2.3 Significance of histology for prognosis
Children with a histopathological diagnosis of FSGS, MPGN or diffuse mesangial
sclerosis are less likely to respond to Gc therapy and more likely to relapse than those
with MCD.[137, 174] Conversely, the most common histopathological diagnosis in
children with clinically more aggressive SRNS is FSGS (56% of SRNS children),[173]
compared to MCD in children with SSNS (children with SSNS no longer undergo
kidney biopsy, but older data shows 98/99 children with SSNS had MCD at
presentation).[137]
However, Webb et al., examined renal biopsy specimens from 51 children with SSNS
(FRNS or SDNS) prior to the start of cyclophosphamide treatment and found that
prebiopsy clinical course did not predict for histologic diagnosis and histology had little
value in predicting future disease course. [175] Indeed, it is now well recognised that
initial response to Gc therapy has a superior prognostic value than histology findings. In
a study of 103 children with INS, a significant association was found between the
interval from onset of treatment to remission and future risk of relapse. Patients with
non-relapsing and infrequent relapsing NS had a median time to remission of <7 days;
patients with frequently relapsing and SDNS had a median time to remission of >7
days.[176]
1.4.3 The genetics of NS
Known disease-causing mutations are only responsible for NS in a minority of children.
However, recognition of the affected genes has led to a greater understanding of the
pathophysiology underlying NS, and increased the likelihood of targeted therapies being
developed for those children for whom current management is suboptimal.[177] As will
be discussed below, detecting causative genetic mutations can also guide current
management of children with NS by helping the clinician to decide whether
immunosuppressive therapy (with the associated side-effects) is in the best interests of
the patient prior to kidney transplantation, and for some very rare mutations involving
mitochondrial genes, specific therapy to delay or avoid renal failure may be instigated.
[178] Table 1.3 lists genes mutated in NS.

46
Table 1.3 Genetic mutations identified in NS
Gene Protein Syndrome
Slit-diaphragm proteins
NPHS1 Nephrin CNS/SRNS
NPHS2 Podocin CNS/SRNS
PLCE1 Phospholipase Cε1 SRNS
CD2AP CD2 associated protein SRNS
TRPC6 Transient receptor potential
cation channel, subfamily C,
member 6
Adult-onset SRNS
Cytoskeletal components and
regulators
ACTN4 α-actinin-4 Late-onset SRNS
MYH9 Nonmuscle myosin heavy chain-
A
Increased propensity to FSGS in
African-Americans
MYO1E Nonmuscle class I myosin 1e SRNS
INF2 Inverted formin 2 SRNS
ARHGAP24 Rho GTPase activating protein
24
SRNS
Nuclear proteins
LMX1B LIM/homeobox protein LMX1B Nail-patella syndrome: NS in
40% of cases.
SMARCAL1 SMARCA-like protein Schimmke immune-osseous
dysplasia
WT1
Wilms’ tumour 1 Denys-Drash syndrome, Frasier
syndrome

47
Glomerular basement
membrane proteins
LAMB2 Laminin-β2 Pierson syndrome
ITGA3 Integrin-α3 CNS
Mitochondrial proteins
PDSS2 Decaprenyl diphosphate
synthase-2
Leigh syndrome and SRNS
COQ2 Para-hydroxybenzoate-
polyprenyl-transferase
CoQ10 deficieny, SRNS
COQ6 Coenzyme Q6 monooxygenase SRNS and sensorineural
deafness
List of genes mutated in nephrotic syndromes. Table modified from [177]and [179].
Abbreviations: CNS-Congenital nephrotic syndrome; FSGS-Focal segmental
glomeruloscelrosis; SRNS-Steroid resistant nephrotic syndrome; NS-Nephrotic syndrome.
48
1.4.3.1 Genetics of congenital and infantile NS
In a large cohort of 89 children from 80 families of non-Scandinavian European decent,
66.3% of patients presenting with NS within the first year of life were found to carry a
mutation in one of four genes: NPHS1, NPHS2, WT1, and LAMB2. NPHS2 mutations
(coding for the protein podocin) were the most common cause of both congenital and
infantile NS. Mutations in NPHS1 (coding for the protein nephrin), accounted for 23%
of cases of congenital NS (CNS), but did not appear to cause infantile NS. Of the 45/89
children who were treated with Gc, only one child achieved a remission. This child did
not carry a disease-causing mutation in one of the four genes included in the study.
None of the children who carried a disease-causing mutation was responsive to Gc
therapy.[36]
Although congenital NS is found in infants of many ethnic backgrounds,[36, 180] the
disease has a particularly high incidence in Finland of 1:10,000 [181] CNS of the
Finnish type is characterised by autosomal recessive inheritance and is caused by
mutations in NPHS1.[61] Two NPHS1 mutations, Fin-major and Fin-minor, account for
more than 90% of mutations found in infants with Finnish type CNS, while these
mutations are rare in non-Finns.[182] In non-Finns, more than 60 different NPHS1
mutations have been reported. Although the majority of these NPHS1 mutations cause
medication-refractory proteinuria and rapid progression to ESRD typical of CNS, some
result in a relatively mild phenotype. For example, two siblings with compound
heterozygous NPHS1 mutations (L130F and C623F) mutation have been reported who
experienced persistent NS since birth, but had not progressed to ESRD at 20 and 24
years of age.[183] Also, female Maltese children with the homozygous R1160X NPHS1
mutation have a particularly mild phenotype with only mild proteinuria, although boys
with the same mutation follow a more typical CNS clinical course. The reason for the
marked difference between males and females is currently unclear.[184]
1.4.3.2 Genetics of SSNS
Unlike congenital, infantile and steroid resistant nephrotic syndrome, SSNS is only very
rarely found in familial form.[185] Fuchshuber et al., investigated 15 families with 32
individuals with autosomal recessive SSNS from Europe. The clinical course was found
to be similar to the more common sporadic form of SSNS, and linkage to the NPHS2
locus (the most common mutation found in congenital, infantile and steroid resistant
NS) was excluded, which led the authors to conclude that familial SSNS is genetically

49
distinct from other familial variants of NS.[186] Ruf et al., later examined a family from
Germany including three children with SSNS and identified a disease-causing locus on
chromosome 2p12-p13.2.[187] Landau et al., compared rates of familial SSNS in
Jewish (low consanguineous marriage rates) and Bedouin (high consanguineous
marriage rates of approximately 65%) families in Southern Israel, and found higher
familial SSNS rates among the Bedouin community than the Jewish community (28%
compared to 4%, p<0.05). The authors suggested a role for susceptibility gene
enrichment resulting in highly consanguineous populations experiencing an increased
incidence of SSNS. However, they were unable to identify linkage to a chromosomal
locus or find causative mutations in 80 NS-associated genes analysed.[185]
1.4.3.3 Genetics of SRNS
The predominant mutation found in childhood-onset SRNS is in NPHS2, with a
significantly smaller proportion having WT1 or NPHS1 mutations.[177] In a cohort of
338 patients with SRNS (mean age of presentation approximately 5 years old), a
mutation in NPHS2 was found in 43% of familial SRNS compared to 10.5% of sporadic
SRNS.[188]
As described above, PodoNet have recently reported data from a heterogenous SRNS
cohort. Mutation analysis was performed in 1174/1655 patients, and a genetic cause was
identified in 23.6% of the screened patients. The most commonly observed mutations
were in NPHS2 (n=138), WT1 (n=48) and NPHS1 (n=41). The proportion of children
with an underlying genetic cause of SRNS inversely correlated with the age of disease
manifestation: 66% in congenital NS to 15-16% in schoolchildren and adolescents.
Marked differences in rates of disease recurrence post-transplantation were also noted:
recurrence occurred in 28.5% of patients without a genetic diagnosis, compared to 4.5%
of those with a genetic diagnosis.[173]
A retrospective study investigated 91 patients with SRNS or CNS and found 68% of
patients without an identified genetic defect responded to immunosuppression, while
none of those with genetic-based NS experienced a complete remission and only 17%
achieved a partial response.[189] These data are useful to clinicians: children with
SRNS and a genetic mutation in one of the five genes detailed above are unlikely to
respond to immunosuppressive therapy, but have low-rates of disease recurrence post-
transplant, and so planning for a live related kidney transplant could begin at an early

50
stage, pre-emptively avoiding a prolonged period of dialysis and futile
immunosuppressive therapy.[177]
However, it should be noted that children with certain genetic mutations can respond to
immunosuppressive therapy. Hinkes et al., reported truncating mutations in the
phospholipase C epsilon gene causing early onset NS in twelve children. Two of these
twelve children responded to pharmacotherapy: one boy presented with NS at the age of
2 months but following a 2.5 year course of ciclosporin A, remains free of proteinuria at
the last follow-up at the age of 13yrs, while another boy presented with NS at the age of
8 months, subsequently received an 8 week course of Gc therapy, and was symptom
free at the last recorded follow up at age 6 years.[190] Additionally, for the rare patient
for whom a mutation affecting the mitochondrial COQ10 biosynthesis pathway is
discovered, supplemental enzyme therapy to delay or avoid renal failure could be
instigated.[177, 178] Two children with SRNS and sensorineural deafness due to a
COQ6 mutation were treated with oral COQ10 supplementation: both children
experienced lower levels of proteinuria, and one additionally experienced an
improvement in hearing.[178] There is also a case report of the early administration of
COQ10 restoring renal function in an infant with a COQ2 mutation.[191]

51
1.5 Aetiology of INS
The cause of idiopathic nephrotic syndrome (INS) is unclear. Various hypotheses have
been proposed to explain the underlying basis for disease including an (as yet,
unknown) circulating serum factor, immune system dysregulation, and enzymatic
cleavage of key podocyte cytoskeletal components by cathespsin L.[5, 129] Some
overlap exists between these hypotheses, and I will discuss the main possibilities below.
1.5.1 Circulating glomerular permeability factor
Hoyer et al., proposed the existence of a circulating serum factor as a causative agent
for INS to explain the observation that patients are at risk of recurrence of INS post-
kidney transplantation (frequently occurring within hours).[143] For children with
FSGS undergoing kidney transplantation, the risk of disease recurrence in a first graft is
14–50%.[192] Interestingly, the incidence of recurrence after transplantation is reduced
in patients with SRNS due to mongenic disorders, and initial Gc-sensitivity at the onset
of NS is highly predictive of post-transplant disease. These data clearly support a role
for a circulating factor in the pathogenesis of SSNS, but not in forms of NS with a
genetic basis.[193]
The idea of INS as a systemic disease was further strengthened by the report of a patient
with MCD who died following an intracranial haemorrhage.[194] Although he was
suffering from active MCD at the time of death, each of his kidneys were transplanted
into different individuals. Proteinuria initially persisted in the transplant recipients, but
subsequently resolved in both patients. Post-transplantation biopsies revealed a normal
podocyte FP architecture. It appears transferring a kidney from an ‘INS environment’ to
a ‘non-INS environment’ leads to reversal of the signature podocyte cytoskeletal
disturbances usually associated with MCD.
Alternative evidence in support of a circulating factor include the observation that
plasmapheresis (extracorporeal filtration of plasma) can reduce proteinuria in
FSGS,[195] and reports of transient proteinuria transmission from a mother to her
babies; possibly through a permeability factor crossing the placenta.[196] Zimmerman
et al., demonstrated that transferring serum from a patient with recurrent INS into a rat
produced proteinuria in the recipient.[197] Savin et al., produced similar data with an
assay involving isolated rat glomeruli incubated with serum from 100 patients with
FSGS. The group found that the serum from patients with recurrent FSGS after renal
52
transplantation had a higher mean value for permeability to albumin than normal
subjects, or those FSGS patients who did not suffer disease recurrence.[198]
1.5.1.1 Permeability factors in MCD and FSGS
Although a circulating factor(s) does seem to have some role in the development of
INS, a definitive understanding of the factor(s) identity and the pathological
mechanisms involved has proved elusive. Savin et al., partially characterised the
permeability factor found in the study described in the previous paragraph: using
ammonium sulphate precipitation, only the serum precipitate obtained at 70-80%
saturation was active, and the estimated molecular mass of the protein was
approximately 50kDa.[198]
A study on SSNS in human MCD and the puromycin aminonucleoside nephrosis (PAN)
rat model found that expression of angiopoietin-like-4 (Angptl4), a glycoprotein, is Gc-
sensitive, and highly upregulated in serum and in podocytes during the disease
process.[199] The group also found that podocyte-specific transgenic overexpression of
Angptl4 (using a NPHS2-Angptl4 construct) in rats induced nephrotic-range proteinuria,
loss of charge across the GBM, and FP effacement, while transgenic overexpression
specifically in adipose tissue resulted in increased circulating Angptl4, but no
proteinuria. This could be explained by the observation that Angptl4 secreted from
podocytes lack normal sialylation. Indeed, it was found that feeding the sialic acid
precursor N-acetyl-D-mannosamine (ManNAc) to NPHS2-Angptl4 transgenic rats
increased sialyation of Angptl4 and decreased albuminuria by more than 40%.
Another candidate for a permeability factor in MCD is hemopexin (Hx). Hx is a heme-
scavenging protein with serine protease activity when activated. Hx has enhanced
protease activity (although lower absolute concentration) in MCD patients in relapse
compared with patients with MCD in remission, patients with FSGS and healthy
controls.[200] It increases the permeability of a monolayer of endothelial cells to
albumin and induces nephrin-dependent reorganisation of the podocyte actin
cytoskeleton in vitro.[201] Interestingly, this Hx-induced actin reorganisation was
partially blocked when cells were preincubated with culture medium containing 10%
normal human plasma, raising the possibility that the systemic component of INS arises
from the loss of a protective factor(s), rather than an accumulation of a harmful
factor(s).

53
In (typically steroid resistant) FSGS, a role for the podocyte urokinase receptor (uPAR;
encoded by PLAUR) has been demonstrated by Wei et al.[202] uPAR is a
glycosylphosphatidylinisotol (GPI)-anchored three-domain protein, which can be
released from the plasma membrane as a soluble marker (suPAR) by cleavage of the
GPI anchor. suPAR ranges in size from 20-50kDa depending on the degree of
glycosylation and proteolytic cleavage, thus approximating the size of the partially-
characterised serum factor identified by Savin et al.[198] It was found that suPAR
serum concentrations were raised in 45/63 (71.4%) subjects with FSGS, but only 4/11
(36.4%) of subjects with membranous nephropathy, 1/7 subjects with preeclampsia
(14.3%), and 0/25 (0.0%) subjects with SSNS/MCD. The authors also reported that a
higher serum concentration of suPAR in pre-transplant FSGS patients who subsequently
went on to develop recurrent disease. Mechanistically, it was demonstrated that suPAR
binds to and activates podocyte β3 integrin, and in human graft tissue obtained 2 hours
post-reperfusion, β3 integrin activity was increased in patients with recurrent FSGS, but
not patients with nonrecurrent FSGS (using the activation epitope-recognizing antibody
for β3 integrin AP5). This study identified suPAR as a circulating factor that may cause
FSGS; therefore, removal of this protein from patients with high serum levels may have
therapeutic benefit.
However, since publication of the data by Wei et al. in 2011,[202] several concerns
have been raised regarding the identification of suPAR as the soluble proteinuric factor
that causes FSGS. Initial criticism focussed on the specificity of suPAR as a biomarker
for FSGS, as it was already known that suPAR is massively elevated in patients
suffering from a range of primarily non-renal diseases including lung cancer, sepsis and
systemic lupus erythematosus.[203-205] Subsequently it was noted that in the western
blotting of Wei et al.,[202] the molecular weight of the predominant suPAR fragment in
FSGS serum was 21 kDa: proteins of this size pass through the GFB into the urine.[206]
Wei et al, had not adjusted for estimated glomerular filtration rate (eGFR) in their
study, leading to the possibility that the raised suPAR levels may simply be a marker for
poorer renal filtration in the FSGS patient cohort. Indeed, numerous studies
subsequently confirmed an inverse relationship between serum levels of suPAR and
eGFR in a variety of renal diseases.[207-209] One study examining Japanese adult
patients did find serum suPAR levels were significantly higher in patients with FSGS
than healthy controls, but no significant difference was found between patients with
FSGS and other renal diseases (MCD, membranous nephropathy, and immunoglobulin

54
A nephropathy).[208] Additionally, no significant difference was observed in serum
suPAR levels in patients with nephrotic-range proteinuria and non-nephrotic range
proteinuria (of any aetiology).
Of direct relevance to the paediatric INS population was the study by Sinha et al., in
which serum suPAR levels were prospectively measured in healthy controls and
children with various forms of NS.[209] Serum suPAR levels in INS were similar to
controls and did not distinguish between the various aetiologies of INS. Similar
proportions of patients in each group had suPAR levels over 3000 pg/mL (the cut-off
suPAR level used by Wei et al. to identify patients with FSGS). Mean levels of suPAR
were 3021 pg/mL in healthy controls (n=83), 3316 pg/mL in steroid resistant FSGS
(n=99), 3253 pg/mL in biopsy-proven MCD (n=117) and 3150 pg/mL in SSNS (n=138;
no biopsy performed). There were no changes in serum suPAR levels following therapy
or remission. Additionally, no correlation was found between urinary and serum suPAR
levels, but urinary suPAR levels were inversely correlated with age, weight, height and
directly correlated to the degree to proteinuria. Although the possibility remains that
different forms of suPAR may differentially contribute to the development of
proteinuria, no data are yet available to substantiate this, and the discrepancies between
various studies is difficult to explain, especially as all the results were obtained with the
same commercially available suPAR ELISA kit.[210]
1.5.2 Possible immunological basis for INS
In 1974 Shalhoub proposed that the source of the causative circulating factor in INS is
an abnormal clone of T cells.[211] There are multiple lines of evidence in support of an
immunological basis for INS: measles infection often result in remission of INS,
possibly through T-cell immunosuppression;[212] INS onset and recurrence can
coincide with viral infection;[213] MCD is associated with Hodgkin lymphoma
(HL);[214] and the therapeutic benefit of medications known to exert
immunosuppressive effects such as Gc and cyclophosphamide in INS.[5] Also, T-cell
culture supernatants from patients with MCD produced significant proteinuria and a
change in charge of the GBM when infused into rats, and these differences were not
produced by healthy donors.[215]
Some groups have attempted to refine the source of a potential immunological
circulating permeability factor further. The association of INS with atopy led to the
proposal that INS had a predominantly T helper 2 (Th2)-mediated aetiology.[216]

55
Although the cardinal Th2 cytokine interleukin-4 does not induce INS, a rat model of
MCD with similar histological findings has been produced through over-expression of
the Th2-cytokine interleukin-13.[217]
Further support for an immune-cell source of a circulating factor came from
immunodeficient mice reconstituted with cells from patients with SSNS or FSGS.[218]
Mice reconstituted with human cells expressing the marker of myeloid and lymphoid
progenitors CD34 developed proteinuria and characteristic podocyte morphological
changes. When CD34+ cells were excluded from the population of injected cells, these
changes did not arise, suggesting a potential role for immature differentiating cells in
the pathogenesis of INS.
Sahali et al., hypothesised a role for the transcription factor nuclear factor kappa-light-
chain-enhancer of activated B cells (NF-κB) in MCD because of its central role in the
regulation of cytokine expression.[219] Using an electrophoretic mobility shift assay,
they showed nuclear extracts from peripheral blood mononuclear cells from adults and
children with MCD displayed higher levels of NF-κB-DNA binding during relapse than
remission. The authors postulated that abnormalities of the NF-κB pathway may
contribute to the pathophysiological process of MCD.
1.5.2.1 Links between immune dysregulation and podocyte cytoskeletal changes
T-cells of patients with MCD express higher levels of c-maf inducing protein (c-mip) in
relapse compared with remission.[220] It was subsequently found that c-mip is found in
the podocytes of adult patients with MCD but not in control specimens (obtained from
patients undergoing renal biopsy due to a polar kidney tumour). Mice overexpressing c-
mip in podocytes developed proteinuria. c-mip was found to block interaction of
nephrin with Fyn, thereby decreasing phosphorylation of nephrin in vitro and in vivo.
Additionally, c-mip inhibited interactions between Fyn and N-WASP, and between Nck
and nephrin, potentially explaining the cytoskeletal dysregulation characteristic of INS.
Finally, injection of small interfering RNA targeting c-mip prevented
lipopolysaccharide-induced proteinuria in mice. These data suggest c-mip may be a key
component in the molecular pathogenesis of INS. The authors postulate that as c-mip is
found in low abundance under physiological conditions but induced in T-cells and
podocytes in patholphysiological situations, it may form a possible bridge between
immune alterations and podocyte dysfunction.

56
Another possible mechanism whereby dysregulated immune signalling leads to
proteinuria is through persistent overexpression of CD80 (B7-1). CD80 is a T-cell
costimulatory molecule expressed on antigen-presenting dendritic cells, natural killer
cells, and activated B lymphocytes. Binding of CD80 to the T-cell receptor CD28 has a
key role in T-cell activation, as well as termination of the T-cell response [the latter
partly through binding of CD80 by cytotoxic T-lymphocyte-associated (CTLA)-4 on the
membrane of FOXp3+ regulatory T-cells (Tregs)]. [221] Resier and Mundel were the
first to propose that glomerular CD80 expression may have a role in MCD,[222] based
on observations that proteinuria-inducing lipopolysaccharide (LPS) signalling through
toll-like receptor-4 (TLR-4) reorganised the podocyte actin cytoskeleton in vitro, and
LPS upregulated CD80 expression on podocytes in wild-type mice, causing heavy
proteinuria.[223] Furthermore, mice lacking CD80 were protected from LPS-induced
proteinuria, while SCID (severe combined immunodeficiency) mice were still
susceptible to LPS-induced proteinuria. These data suggest direct activation of
podocytes, independent of T-cell involvement, can induce CD80 expression, podocyte
cytoskeletal changes and proteinuria.
More recently, the potential therapeutic role of a CD80 inhibitor called cytotoxic T-
lymphocyte–associated antigen 4–immunoglobulin fusion protein (CTLA-4–
Ig)/Abatacept has been investigated. Abatacept blocked LPS- or CD80 (stable
transfection)- induced podocyte hypermotility in vitro and in five patients (4 with
rituximab-resistant recurrent FSGS after transplantation and 1 patient with Gc-resistant
FSGS) aged 7-28 years, with positive podocyte staining for CD80 on biopsy specimens,
abatacept induced partial or complete remission of proteinuria (no controls were
included in the study).[224] A larger-scale, adequately controlled, successful study
would be required before abatacept could potentially be considered for use in a sub-
group of INS patients with podocyte CD80 expression [225]
The identification of circulating permeability factors can be of immediate clinical
benefit. This has been shown by Delville et al., who constructed a panel of seven
antibodies (CD40, PTPRO, CGB5, FAS, P2RY11, SNRPB2, and APOL2) by comparing
sera from FSGS patients experiencing post-transplant relapse, from those not
experiencing post-transplant disease relapse. This panel was shown to predict post-
transplant FSGS recurrence with 92% accuracy, with the single most powerful predictor
being pre-transplant elevation of CD40 (78% accuracy).[226]

57
1.5.3 Protease dysregulation leading to a hypermotile podocyte phenotype
As described previously, CatL is a member of the cathepsin family of cysteine
proteases.[129] Building on the observation that CatL inhibitors reduced proteinuria in a
rat model of glomerulonephritis,[227] Reiser et al., subsequently demonstrated that
PAN treatment upregulates CatL expression in podocytes in vivo, and primary
podocytes from mice lacking CatL are protected from PAN-induced cell detachment ex
vivo. [131] PAN-induced podocyte migration was also slowed in CatL-deficient
podocytes. CatL expression is also increased in podocytes in human renal disease
(membranous nepropathy, FSGS, and diabetic nephropathy) and murine LPS-induced
nephropathy.[228] Two podocyte targets of CatL-mediated proteolysis are synaptopodin
and dynamin.
Synaptopodin is highly expressed in podocytes and is a key regulator of cytoskeletal
dynamics. Mechanistically, synaptopodin induces stress fibre formation by blocking the
ubiquitin-mediated targeting of RhoA for proteasomal degradation.[68] Synaptopodin
also blocks pro-migratory filopodial cell protrusions by disrupting cell division control
protein 42 homolog (Cdc42) - insulin receptor tyrosine kinase substrate of 53 kDa
(IRSp53)-Mena complexes.[229] Synaptopodin is therefore an antagonistic regulator of
RhoA and Cdc42 signalling that blocks the reorganisation of the podocyte into a
migratory phenotype.[129] Faul et al., demonstrated that the antiproteinuric effect was
mediated through preventing the CatL-induced proteolysis of synaptopodin.[103]
The GTPase dynamin also has a key role in maintaining normal glomerular function. In
human FSGS (but not MCD) and murine LPS-induced nephropathy, induction of CatL
in podocytes leads to cleavage of dynamin, associated with cytoskeletal dysregulation
and proteinuria.[228] When dynamin mutants that lack the CatL cleavage site are
delivered into mice, these mutants were resistant to LPS-induced proteinuria.
Together, these data suggest CatL-mediated proteolysis may have a role in the
development of proteinuria in INS.[129]

58
1.6 Glucocorticoids
Glucocorticoids are a class of steroid hormone synthesised in the adrenal cortex under
control of the hypothalamic-pituitary-adrenal (HPA) axis. Glucocorticoids regulate a
vast array of biological processes including carbohydrate-, protein-, and lipid-
metabolism, maintenance of vascular tone, apoptosis, lung development, regulation of
the inflammatory and immune response, and exert effects on the central nervous system
affecting cognition, arousal, and mood. [230] The human adrenal gland synthesises and
secretes two main glucocorticoids: cortisol and corticosterone, but the latter is
synthesised at a rate of approximately 1/10th that of cortisol.[231] Synthetic
glucocorticoids such as prednisolone, prednisone and dexamethasone are amongst the
most prescribed medicines in clinical use today, producing beneficial responses in
diseases as diverse as lymphoma, asthma, and rheumatoid arthritis, as well as NS.[232]
Cortisol is the major physiological ligand in humans for the glucocorticoid receptor
(GR), which is a member of the nuclear receptor super-family (NRSF). The steroid
receptor subgroup of the NRSF includes the androgen receptor, estrogen receptors
(ERα, ERβ), the progesterone receptor, the 1,25-dihydroxyvitamin D3 receptor, GR,
and the mineralocorticoid receptor (MR).[233] The importance of GR is underscored by
the observation that global knock-out of GR in mice by inserting a neomycin
phosphotransferase gene cassette into exon 2 of the mouse GR gene, leads to death
within a few hours of birth due to respiratory failure. This effect was partially dependent
on the genetic background of the mice: 7.1% of mutant mice born with a C57BL/6
background were alive 4 hours after birth, compared to no mice born with a 129/J
background.[234] Further studies suggested this discrepancy in mortality may be due in
part to production of a Gc-binding GR fragment.[235]
1.6.1 Gc bioavailability in vivo
Ligand-free GR is located mostly in the cytoplasm of human cells; after binding to Gc-
ligand, GR dimerizes and translocates to the nucleus to regulate transcription.[236]
Regulation of bioavailability of Gc-ligand is controlled both at the systemic and tissue
level. The majority of Gc circulating in blood is bound to plasma proteins, which
controls Gc systemic distribution, the fraction of total Gc available for GR-binding, and
the rate of release of Gc to surrounding tissues during periods of inflammation.[237]
Another pre-receptor regulatory mechanism involves 11 beta-hydroxysteroid

59
dehydrogenase (11β-HSD), which metabolises Gc and contributes to whether GR- or
MR- effects predominate, in a tissue-specific manner.
1.6.1.1 Gc binding to plasma proteins
In human subjects, cortisol is the most abundant circulating Gc. 90-95% of total serum
cortisol circulates bound to proteins. Corticosteroid-binding globulin (CBG, also known
as transcortin) binds >80% of serum cortisol, and albumin binds 10-15%.[236] It is
generally assumed that carrier proteins are required for cortisol to circulate in blood
because cortisol is hydrophobic. However, Moisan has challenged this assumption with
3 pieces of evidence: i) in CBG-deficient patients, cortisol circulates normally; ii) CBG
is not present in many species, such as teleost fish, in which cortisol circulates; and iii)
circulating aldosterone is equally hydrophobic and does not have a specific binding
protein.[238] CBG deficiency in mice results in markedly reduced total circulating
corticosterone at rest and in response to stress.[239] Also, free corticosterone
concentrations are normal at rest but reduced after stress in CBG-deficient mice. This
suggests that CBG functions as a reservoir of Gc for times of physiological stress.
Bound and unbound forms of cortisol in serum are in a dynamic equilibrium, which can
be affected by several factors including temperature and pH.[240] Additionally, the
local release of cortisol during inflammation involves cleavage of CBG by neutrophil
elastase.[241]
The prevailing view is that the biological activity of Gc is defined by the levels of
circulating unbound hormone rather than the bound fraction because only free cortisol is
able to cross the capillary boundary, enter tissues and passively diffuse into cells (‘free-
hormone’ hypothesis).[236] This is supported by data showing that the rate of
dissociation of cortisol from binding proteins defines and is always higher than tissue
uptake rate,[242] and intracellular cortisol concentrations in rat liver are proportional to
circulating free cortisol levels.[243] No evidence currently exists for the internalisation
of bound cortisol or CBG.[236]
Of relevance to the current project is that circulating proteins the size of albumin (66
kDa) and CBG (52 kDa) are excreted into the urine during periods of impaired GFB
function in INS. Prednisolone (the standard Gc used clinically in the UK for INS) binds
to CBG, but most other synthetic glucocorticoids bind with very low affinity. For
example, in a study analysing the ability of synthetic compounds to displace labelled
cortisol from CBG absorbed onto a solid phase matrix, the relative binding activities

60
(RBA-relative to cortisol) and association constants (K, 106 M-1) were found to be as
follows: cortisol RBA=1, K=76; prednisolone RBA=0.59, K=41, dexamethasone
RBA=<0.001, K=<0.1.[244] The authors also used a computer model to predict the in
vivo effect of administration of synthetic Gc on circulating cortisol levels, and found the
presence of maximal therapeutic levels of prednisolone decreased the concentration of
cortisol bound to CBG by 32%. However, the displacement of cortisol from CBG by
administration of exogenous prednisolone is unlikely to be of any clinical relevance as
total plasma cortisol concentrations are decreased to undetectable levels within 4 hours
of administration of exogenous Gc due to suppression of the hypothalamic-pituitary-
adrenal (HPA) axis.[245]
Frey et al., showed that total prednisolone serum concentrations in a group of adults
with INS were lower than in healthy volunteers, with a higher unbound fraction of
prednisolone.[246] The authors postulated that this was due to the lower concentrations
of CBG and albumin observed in the INS group. Prednisone is the inactive pre-cursor of
prednisolone, which is converted to prednisolone by first-pass hepatic metabolism by
11β-HSD 1 [247, 248]. A study involving thirteen children treated with the Gc
prednisone during a relapse of INS found that the elimination of prednisolone was
increased when serum albumin was decreased.[245] No statistically significant
difference was found for prednisolone pharmacokinetic properties between children
with SSNS, SRNS and SDNS.
Another study examined the pharmacokinetics of intravenous prednisolone and oral
prednisone administration in six children with INS during active disease and in
remission.[249] Results were compared to existing values previously obtained from
asthmatic children who had received similar intravenous doses. The results showed that
the area under the curve for prednisolone (the area under the curve is a value
proportional to the total amount of drug that reached the circulation) was higher after
oral doses of prednisone when compared to the intravenous prednisolone doses,
indicating that INS relapse does not produce impaired absorption and conversion of
prednisone to prednisolone. A larger steady-state volume of distribution was observed
in active disease than in remission, suggesting greater availability of the steroid to
tissues. Additionally, apparent prednisolone clearance in both stages of nephrotic
syndrome were greater than those obtained in asthmatic children, possibly due to
decreased protein binding of prednisolone in INS.
61
1.6.1.2 Metabolism of Gc by 11β-HSD
Gc bioavailability at the tissue level is also affected by the interconversion of
biologically active cortisol and inactive cortisone by 11β-HSD, which has two
subtypes.[236] 11β-HSD 1 is a predominant reductase enzyme under most conditions,
generally amplifying Gc-action by converting cortisone to cortisol, and transgenic
overexpression of 11β-HSD 1 in either adipose tissue or the liver in mice causes
components of the metabolic syndrome (type 2 diabetes mellitus, hypertension and
dyslipidaemia.), which typically occurs in people with primary Gc-excess.[250]
Cortisol, and the synthetic glucocorticoids prednisolone and prednisone are substrates
for 11β-HSD 1, while no reductase activity was observed with dexamethasone as the
substrate.[251] 11β-HSD1 is widely distributed in adult mammals, with highest
expression found in the liver.[252] Other tissues with 11β-HSD1 expression include
ovary, testis, brain, uterus, skeletal muscle and kidney (distribution is mostly in the
proximal tubules and medulla; glomerular expression has not specifically been
investigated).[253, 254]
As will be discussed in section 1.6.1.3 Gc ligands can also activate MR in a similar
manner to the classical MR-ligand aldosterone. 11β-HSD 2 converts cortisol to inactive
cortisone. The tissue-specific expression of 11β-HSD2 is an important pre-receptor
regulatory mechanism ‘protecting’ MR from cortisol-activation, ensuring aldosterone is
the predominant MR-activating ligand.[254] Data supporting the view of 11β-HSD2 as
a determinant of MR-receptor occupancy includes a study demonstrating co-localisation
of 11β-HSD2 and MR in the same cells in the distal convoluted tubule, Henle’s loop
and collecting ducts of the kidney, and the absorptive epithelia of the gastrointestinal
tract.[255] Additionally, mutations of the 11β-HSD 2 gene in humans are a rare
monogenic cause of hypertension due to ‘apparent mineralocorticoid excess,’ whereby
overstimulation of the MR by cortisol in sodium-transporting epithelia such as the
tubular system of the kidney leads to sodium retention, hypokalaemia, low plasma renin
and aldosterone concentrations, and hypertension.[256] 11β-HSD2 expression is largely
restricted to classical aldosterone/MR-target tissues such as the distal nephron of the
kidney, sweat and salivary glands and colonic epithelium.[254] 11β-HSD2 expression
has also been found in the glomerulus.[254] Interestingly, while 11β-HSD2 shows
exclusive oxidative activity (converting cortisol to cortisone) with endogenous
glucocorticoids, it reduces 9-fluorinated glucocorticoids (such as dexamethasone),

62
regenerating 11-dehydrodexamethasone to dexamethasone, thus potentiating
dexamethasone action (no reduction data are provided for prednisolone). [254, 257]
1.6.1.3 Glucocorticoid ligand potency at the GR and MR
As described above, regulatory mechanisms exist to control the access of physiological
and synthetic Gc-ligands to the GR in a tissue-specific manner. In addition to their
ability to bind GR, glucocorticoids also bind the MR to varying degrees; this is most
likely due to the close structural relationship between GR and MR. The physiological
human ligands for GR and MR are cortisol and aldosterone respectively. In a similar
manner to GR, MR is located mostly in the cytoplasm of the cell in the ligand-free state;
subsequent ligand-binding activates MR, causing dissociation from chaperone
molecules and the translocation of MR to the cell nucleus where it directs the
transcription of target genes.[258]
GR is expressed almost ubiquitously (with the notable exception of the suprachiasmatic
nucleus of the hypothalamus which has a key role in regulating circadian rhythm[259]),
whereas MR shows a much more restricted tissue distribution, with high-expression
confined to the sodium-transporting epithelia of the distal colon and distal nephron, the
salivary glands, in certain regions of the central nervous system (eg, hippocampus), and
at lower abundance in a variety of other tissues.[254, 260] All subsets of human
glomerular cells express GR,[104] while several studies have demonstrated that MR is
not present in the human,[255, 261] and rabbit glomerulus.[261]
In vitro, MR has a high and very similar affinity for cortisol and aldosterone, whereas
synthetic glucocorticoids such as dexamethasone only activate MR at high
concentrations. In contrast, GR has low affinity for physiological glucocorticoids and
aldosterone, but a higher affinity for synthetic glucocorticoids. Therefore, under basal
conditions, the GR is occupied to only a small extent by ligand, but becomes
progressively activated as Gc levels rise during ultradian pulses, a stress response or
pharmacotherapy.[254] The relative ligand binding affinities also highlight the need for
the pre-receptor gating mechanisms discussed previously: plasma cortisol
concentrations are 100- to 1000-fold higher than that of aldosterone and without the
regulation provided by the 11β-HSD system, most of MR would be bound by Gc,
severely reducing the ability of aldosterone to exert physiological responses.[258] In
addition, Lombes et al., demonstrated that the off-rate of aldosterone from human MR

63
was five times lower than that of cortisol, suggesting an intrinsic discriminatory
property of MR.[262]
Grossmann et al., compared the mineralocorticoid- and glucocorticoid- properties of
different steroids in a luciferase transactivation assay in CV-1 cells (African green
monkey kidney cells) transfected with either human MR or human GR vectors.[263]
Drug responses were quantified by a variety of parameters including EC50 (the half
maximal effective concentration of a drug which induces a response halfway between
the baseline and maximum after a specified exposure time) and relative potencies [for
GR, relative to cortisol (GCP); for MR, relative to aldosterone (MCP)]. The results for
GR were as follows: Cortisol (EC50 1.2x10⁻⁸ M, GCP=1.0), aldosterone (EC50 1.7x10⁻⁷
M, GCP=0.07), dexamethasone (EC50 5.6x10⁻¹⁰ M, GCP=21), prednisolone (EC50
6.9x10⁻⁹ M, GCP=1.7). The results for MR were as follows: Aldosterone (EC50 4.8x10-
11 M, MCP=1.0), cortisol (EC50 9.0x10⁻¹⁰ M, MCP=0.054), dexamethasone (EC50
5.09x10⁻⁹ M, MCP=0.0094), prednisolone (EC50 3.78x10⁻⁹, MCP=0.013). Therefore, at
GR the synthetic glucocorticoids dexamethasone and prednisolone have a higher
potency than either cortisol or aldosterone, while at MR, dexamethasone and
prednisolone have a very low potency.
1.6.2 GR structure
1.6.2.1 GR gene structure
Human GR is encoded by the NR3C1 (nuclear receptor subfamily 3, group C, member
1) gene on chromosome 5q31-32 and contains ten exons.[264] The protein-coding
region is formed by exons 2-9, whereas exon 1 represents the 5’-untranslated region.
Exon 1 contains three transcription-initiation sites, each of which produces an
alternative first exon that is fused to a common exon 2 after splicing. This array of
binding sites on NR3C1 promoters could account for the observation that NR3C1 is
constitutively expressed under a variety of physiological conditions. Exon 2 contains
the coding sequence for the transactivation domain 1 (AF1), exon 3 and exon 4 each
contain the sequence for a zinc finger motif, and constitute the DNA binding domain
(DBD); and the region encompassing exons 5-9 encodes for the transactivation domain
2 (AF2), the ligand binding domain (LBD), and the 3’-untranslated region.[230]
Alternative splicing of exon 9α and exon 9β on the pro-mRNA transcript produces two
distinct mRNAs: GRα and GRβ. The two isoforms are identical up to amino acid 727,

64
but diverge beyond this position. The classical GR (GRα) consists of 777 amino acids.
In GRβ the 50 carboxy terminal amino acids of GRα have been replaced by 15 non-
homologous amino acids encoded by exon 9β resulting in a protein of 742 amino
acids.[230]
GRα is expressed in almost all human tissues, while GRβ is expressed in a variety of
human tissues, but usually at a lower concentration that GRα.[230] Pujols et al.,
investigated the expression levels of both these isoforms in human tissue and cells and
found GRα mRNA abundance (x106 cDNA copies/µg total RNA) as follows: brain
(3.83) > skeletal muscle > macrophages > lung > kidney > liver > heart > eosinophils >
peripheral blood mononuclear cells (PBMCs) > nasal mucosa > neutrophils > colon
(0.33). GRβ mRNA levels were much lower than GRα levels, with the following
abundances (x103 cDNA copies/µg total RNA): eosinophils (1.55) > PBMCs > liver ≥
skeletal muscle > kidney > macrophages > lung > neutrophils > brain ≥ nasal mucosa >
heart (0.15). GRβ mRNA was not found in colon. GRα protein was detected in all cells
and tissues, while GRβ was not detected in any specimen.[265]
In contrast to GRα, GRβ does not appear to bind Gc and is transcriptionally inactive. In
cell culture, overexpressed GRβ acts as a dominant negative inhibitor on GRα-mediated
transcription and may contribute to tissue-specific sensitivity to Gc.[266]
An additional GR splice variant, GRγ, has been detected in childhood acute
lymphoblastic leukaemia. The functional relevance of GRγ is unknown but GRγ
expression was observed to be lower in leukaemic blast cells from patients with a good
response to Gc therapy, compared to patients who had a poor response to Gc
therapy.[267]
1.6.2.2 GR protein structure
GRα mRNA is translated from at least eight alternative initiation sites into multiple
GRα isoforms termed GRα-A to D (A, B, C1, C2, C3, D1, D2, and D3). GRα-A has a
molecular weight of 94kDa, while GRα-B has a molecular weight of 91 kDa.[230, 268]
Additionally, some data suggests that multiple isoforms may exist for GRβ.[230]
Lu et al., found that levels of various GRα isoforms differ among tissues, and they
investigated whether the relative amounts of the different GR isoforms could alter tissue
Gc-sensitivity. [268]They co-transfected COS-1 cells with a constant amount of the
GRα-A isoform and an increasing amount of the GRα-C3 or GRα-D3 isoform and

65
measured glucocorticoid responsiveness in a luciferase assay. Increasing the amount of
the GRα-C isoform enhanced GRα-A transcriptional activity whereas increasing the
amount of the GRα-D3 isoform did not. These data suggest that the ratios of various
GRα in a tissue may alter the Gc-sensitivity. The group also examined whether each
GRα isoform could regulate a different set of genes within the same cell. Comparing the
transcriptional output of U-2 OS cells treated with either vehicle or Gc using a cDNA
microarray revealed that 189 genes were regulated commonly by all GRα isoforms.
However, the total number of genes regulated by individual isoforms varies: 1318,
1054, 664, 1077, or 626 for the GRα-A, -B, -C3, or -D3 isoforms, respectively,
indicating that each GRα isoform also regulated a unique set of genes.
Although different GRα isoforms vary at their N-terminal domain, their overall general
structures are similar to each other, and to other steroid receptors. GR is a modular
protein organised into 3 major functional domains: the N-terminal domain (NTD), the
central DNA-binding domain (DBD), and the C-terminal ligand-binding domain
(LBD).[230] The NTD varies in both size and amino-acid sequence between GR
isoforms, and contains the transactivation domain AF-1 capable of activating target
genes in a ligand-dependent manner,[269] and also contains the sites of GR-
phosphorylation.[270]
The DBD is highly conserved between GR isoforms and contains two zinc finger motifs
which interact with DNA, as well as a dimerization and nuclear localisation domain
(NLS1).[271] The C-terminal LBD is responsible for the recognition and binding of
Gc.[230] A weaker activation function (AF-2) and a second nuclear localisation signal
(NLS2) are also embedded within this region. The C-terminus also contains sequences
important for interaction with heat shock proteins (hsps), nuclear transcription factors,
nuclear translocation and receptor dimerisation.[272, 273]

66
1.6.3 Mode of action of GR
1.6.3.1 Genomic actions
In the absence of ligand, GR resides predominantly in the cytoplasm of cells in a large
multi-protein complex consisting of several proteins including hsp90, hsp70,
immunophilins, tyrosine protein kinase Src (c-Src), and p23.[274] The interaction of
GR with two hsp90 molecules keeps the ligand-binding pocket of the receptor in a high
affinity conformation. Upon ligand binding, GR undergoes conformational
changes,[230] leading to its dissociation from the cytoplasmic chaperones, exposing the
two nuclear localisation signals, and GR is rapidly translocated into the nucleus through
nuclear pores.[275] GR can both positively and negatively regulate gene expression
through three main mechanisms (direct, tethering and composite) which will be
discussed in turn.
In the ‘direct’ mechanism of GR-mediated regulation of gene expression, the activated
receptor binds as a homodimer to target DNA sequences called glucocorticoid response
elements (GREs). The consensus GRE sequence is the palindromic 15 base pair motif
AGAACAAnnnTGTTCT (where n is any nucleotide).[237] Binding of GR to a GRE
promotes the recruitment of co-activators to the GR-DNA complex, such as cyclic AMP
response element binding binding protein (CBP), p300, p-300-CBP.[276] These co-
activators contain histone acetylase (HAT) activity, which results in nucleosomal
rearrangement and DNA unwinding which allows the basal transcription machinery to
access the promoter. Gc-mediated synthesis of several anti-inflammatory proteins
including glucocorticoid-induced leucine zipper protein (GILZ), IL-1 receptor
antagonist, IL-10, and lipocortin-1 are thought to be mediated via direct binding of GR
to GREs.[276-278]
GR can also repress genes by binding directly to a negative GRE (nGRE), which are
more variable in sequence than positive GREs. One example of this mechanism is GR
binding to the ostocalcin nGRE, which prevents binding of the transcription factor,
TATA box binding protein (TBP) whose binding site overlaps with the nGRE.[279]
The second mechanism of GR-mediated regulation of gene expression is independent of
DNA-binding and involves direct protein-protein interaction between GR and other
transcription factors (‘tethering’ or ‘transrepression’). Many of the transcription factors
bound by GR in this manner normally upregulate a variety of pro-inflammatory

67
proteins, and this direct tethering by GR is thought to be a major mechanism whereby
GR exerts its potent anti-inflammatory effects.[276] Pro-inflammatory transcription
factors shown to physically interact with GR, leading to a reduction in expression of
target genes, includes nuclear factor-κβ (NF-κβ) and activator protein-1 (AP-1).[278]
Tethering of GR to AP-1 or NF-κβ alters the assembly of coactivator complexes that are
required for gene activation, eg, at the Il8 promoter.[280] Interestingly, the repressive
effect of GR on NF-κβ seems to be mutual, since NF-κβ has also been shown to
negatively regulate GR-mediated transcription.[281] Interaction of GR with some
transcription factors [eg, signal transduction and activator of transcription (STAT)],
without GR-DNA binding, can also enhance the transcription of target genes.[282]
A central characteristic of tethering is that GR-DNA binding is not required for GR to
exert is effects on gene transcription. However, in the ‘composite’ mechanism of GR-
mediated regulation of gene expression, GR binds directly to a GRE before physically
interacting with AP-1 or NF-κβ bound on a neighbouring site on the DNA. Recruitment
of the GR corepressor glucocorticoid receptor-interacting protein 1 (GRIP1) plays a
central role in this mechanism.[283]
Genome-wide data examining the characteristics of GR-upregulated compared to GR-
repressed genes was provided by Uhlenhaut et al. who identified 918 GR-bound
regulatory elements linked to positive gene expression and 729 elements that served
repressed gene expression in LPS-treated macrophages.[284] Surprisingly, they found
that a majority of both negative and positive GR enhancers are composed of canonical
GREs in combination with NF-κβ and AP-1 sites. Additionally, while up to 20% of GR-
dependent gene repression is found at nGREs and tethered sites, approximately 20% of
GR-induced genes also harbour these same motifs. It therefore appears that cistromic
motif classification is insufficient to predict whether a particular GR-binding event will
lead to gene upregulation or downregulation. The group also found that GR recruits
GRIP1 in a comparable fashion to both up- and down-regulated genes, where it may act
as a coactivator or corepressor, as determined by the presence of interferon regulatory
factor 3/IRF3 (in the case of repressive enhancers) and other, currently unknown,
factors.
The development of chromatin immunoprecipitation combined with next-generation
sequencing (ChIP-seq) has allowed the characterisation of GR-binding patterns on a
genome-wide scale. A surprising finding from these studies is that the majority of GR

68
binding sequences (GBSs) are located outside of the promoter of Gc-responsive genes
in intergenic or intragenic regions, often far removed from the transcription start
site.[237] For example, John et al., found that 93% of GBSs were 2.5 kb distal to the
nearest transcriptional start site, and there was no clear relationship between GR
occupancy patterns and transcriptional activation of nearby genes.[285] Explanations
for this include that GR acts through long-range mechanisms (the ‘chromosome folding’
mechanism) or many GR-binding events are opportunistic and do not lead to changes in
transcriptional activity.
Another surprising finding is that different cell types display a low degree of overlap in
GBSs. The data provided by John et al., highlighted the importance of cell-specific
chromatin accessibility as a determinant of GR-binding. By comparing GBSs in
mammary (3134) and pituitary (AtT-20) cell lines, they found that the majority of GR
binding events occurred in areas of accessible chromatin (as determined by DNAse 1
sensitivity) before Gc-exposure (71% and 95% for 3134 and AtT-20 cells
respectively).[285] However, only 11% of GBSs were shared between the two cell
lines.
Recent data has also highlighted the highly dynamic interaction between GR and DNA.
A study involving GR labelled with a green fluorescent protein revealed GR-DNA
interactions on a time-scale of seconds; a mechanism described as ‘hit and run.’[286]
Voss et al., also investigated the GR steady-state occupancy at a given GBS.[287, 288]
The group used a cell line containing a tandem array of gene copies harbouring GREs.
In the cells, they co-expressed fluorescently tagged GR and a mutated form of the
estrogen receptor (ER). They then monitored the association of these receptors to the
array by fluorescence microscopy, in the presence of dexamethasone alone (which
activates GR), estradiol alone (which activates ER), or both ligands together. It was
found that steady-state levels of DNA-bound GR are virtually unchanged in cells treated
with dexamethasone alone compared to both ligands together, suggesting the receptors
are not competing for binding to the GREs. Even more surprisingly, the ER-DNA
associations were even enhanced in cells exposed to both agonists; a phenomenon the
authors refer to as ‘assisted loading.’ The authors conclude that GREs are largely
unsaturated during hormone-induced transcriptional activation, and they also confirm
the previous observations that GR-DNA interactions are in the timescale of seconds.

69
1.6.3.2 Non-genomic actions
Although the principal effects of glucocorticoids are mediated by changes in
transcriptional response that occur in minutes to hours, accumulating evidence suggests
GR can also act through rapid mechanisms (taking seconds to minutes), which do not
require changes in gene transcription.[289] These non-genomic effects of
glucocorticoids can be mediated by proteins that dissociate from the cytoplasmic GR-
chaperone complex following ligand binding. For example, dissociation of c-Src from
the chaperone complex leads to the phosphorylation of annexin 1, inhibition of cytosolic
phospholipase A2 activity, and impaired release of arachidonic acid which is a pro-
inflammatory mediator.[290, 291]
Non-genomic actions also underlie Gc-mediated effects on neural progenitor cells
(NPCs). Gc activation of GR localised at the plasma membrane leads to MAPK-
dependent phosphorylation of connexin-43 and c-Src activity limits proliferation of
NPCs and alters gap junction intercellular communication.[292] It has also been
proposed that glucocorticoids affect cellular permeability, eg, altering the synchrony of
spontaneous calcium transient currents across the plasma membrane.[292]
1.6.4 Post-translational modifications of GR
As described above, tissue-specific GR action is controlled by several layers of
regulatory mechanisms including pre-receptor bioavailability, differential expression of
GR isoforms, and accessibility of DNA for GR-binding as dictated by the chromatin
landscape. In addition, GR function can also be affected by post-translational
modifications such as phosphorylation, sumoylation and ubiquitination.
Human GRα is phosphorylated on at least seven serine residues (Ser-113, Ser-134, Ser-
141, Ser-203, Ser-211, Ser-226, and Ser-404), all of which are located in the NTD of
the receptor. These sites can be phosphorylated by mitogen protein kinases (MAPK),
cyclin-dependent kinase (CDK), glycogen synthase kinase-3 (GSK-3) and c-Jun N-
terminal kinases. [230, 293, 294] One of the major effects of GR-phosphorylation is to
alter the transcriptional activity of the receptor, but this is highly context dependent.
This is shown by a study which compared the activity of wild-type GR and GR with
mutated serine phosphorylation sites in two different chloramphenicol acetyltransferase
(CAT) reporter genes after transient transfection into COS-1 cells.[270] One CAT
70
reporter had a mouse mammary tumour virus long terminal repeat (MMTV-LTR)
promoter, the other a promoter with two copies of the GRE from the aminotransferase
gene linked to a TATA sequence. Activities of the mutants did not differ significantly
from that of wild-type GR with the first reporter, but almost all the mutants had
activities that were 50-75% lower than that of wild type GR with the second reporter.
The majority of data suggests that the phosphorylation of GR is induced by ligand-
binding,[295] and accumulating data suggests phosphorylation at particular residues
have specific effects. For example, one group found that transcriptional activity of GR
correlated with the amount of phosphorylation at Ser 211, suggesting Ser 211 is a
marker for activated GR.[296] In the same study, it was found that the Ser 203-
phorphorylated form of the receptor was predominantly cytoplasmic, whereas Ser 211-
phosphorylated GR was found in the nucleus. Furthermore, GR has the greatest
transcriptional activity when Ser 211 phosphorylation exceeds that of Ser 226
phosphorylation, and blocking Ser 226 phosphorylation has been found to enhance the
transcriptional response of GR.[297] Another example is phosphorylation of Ser 404
causes a conformational change within GR, leading to altered co-factor recruitment and
attenuated GR-signalling.[298]
Phosphorylation also alters other properties of GR including protein stability: this is
shown by data demonstrating that phosphorylation-deficient mutant GR is stabilised in
the presence of Gc, suggesting degradation of the GR protein is enhanced by Gc-
dependent phosphorylation of GR.[299]
Other post-translational modifications of GR include ubiquitination. Ubiquitin is a 76
amino acid protein that, when attached to specific lysine residues, marks proteins for
proteasomal degradation.[237] Ubiquitination of GR at Lys-419 targets the receptor for
the proteasome, and mutant receptors that cannot be ubiquitinated at this residue are
resistant to Gc-dependent downregulation and exhibit potentiated transcriptional
activity on Gc-responsive reporter genes.[300, 301]
GR is also post-translationally modified by sumoylation, whereby SUMO (small
ubiquitin-related modifier) peptides are covalently attached to specific lysine residues
(eg, Lys-277 and Lys-293, Lys-703) on GR. SUMO peptides are attached in the absence
of ligand, but attachment is increased following Gc-exposure. Transcriptional activity of

71
GR can either be enhanced or repressed depending on the site of sumoylation.[237, 302,
303]
Acetylation of GR on lysine residues (Lys-494 and Lys-495) has been shown to limit
the inhibitory actions of Gc on NF-κβ signalling.[237] It has also been shown that GR
acetylation is higher in the morning than in the evening in peripheral blood
mononuclear cells from humans, and GR acetylation may form part of a counter
regulatory mechanism to the actions of diurnally fluctuating cortisol, effectively
decreasing tissue sensitivity to glucocorticoids in the morning and increasing it at
night.[304]
1.6.5 Gc resistance
In addition to NS, Gc therapy is also used to treat many other clinical conditions
including asthma, rheumatoid arthritis, inflammatory bowel disease and autoimmune
diseases.[305, 306] In a similar fashion to NS, a proportion of patients with these
conditions show a poor or absent response to Gc treatment (eg, about 30% of patients
with rheumatoid arthritis have a poor clinical response to glucocorticoids).[307] In the
following section, I will discuss potential reasons for this resistance to Gc therapy. Most
glucocorticoid resistance studies have focussed on inflammatory conditions such as
asthma, but I will highlight data relating directly to NS whenever possible.
1.6.5.1 Genetic basis for Gc-resistance
A study from 1981 describing Gc-resistant asthma found that sufferers had a family
history of asthma more commonly than Gc-sensitive patients. This led the authors to
postulate that Gc-resistance may have a genetic basis.[308] Additionally, although
SRNS usually occurs as a sporadic disease, familial cases have frequently been
reported.[309] Transcriptomic profiling using peripheral blood mononuclear cells
(PBMCs) from Gc-sensitive and Gc-resistant asthma patients identified 11 genes which
discriminate between these groups.[310] Thus, it may be possible to predict response to
Gc-therapy, avoiding exposing patients to unnecessary courses of glucocorticoids.
Additionally, Donn et al., stratified healthy subjects according to Gc-responsiveness
using a low dose dexamethasone suppression test.[311] The group compared the
transcriptome of primary lymphocytes from the 10% with the greatest and least Gc-
responsiveness and identified 24 genes that were differentially regulated. The most
discriminate differentially-expressed gene between the two groups was bone

72
morphogenetic protein receptor type II, and overexpression of this protein in vitro
resulted in enhancement of Gc-mediated activation of a reporter gene.
Further data suggesting a genetic basis for Gc-resistance comes from a genome-wide
association study in patients with asthma which identified a single-nucleotide
polymorphism (SNP) mapping to the glucocorticoid-induced transcript 1 gene
(GLCCI1) associated with a poor response to Gc therapy. Following reports that
GLCCI1 is expressed in podocytes, Cheong et al., genotyped 211 Korean children with
INS and 102 controls but did not identify SNPs correlating with Gc-responsiveness (or
any other factor).[312] The relevance of GLCCI1 in INS is therefore questionable.
1.6.5.2 Familial glucocorticoid resistance
Insight into potential molecular mechanisms underlying Gc-resistance came from
studies examining the extremely rare inherited syndrome familial glucocorticoid
resistance (FGR), which is characterised by high circulating cortisol concentration
without signs or symptoms of hypercortisolism.[305, 306] Clinical manifestations
(which may be absent) are due to an excess of non-Gc adrenal steroids stimulated by
high adrenocorticotrophin (ACTH) levels, and may include hypertension with
hypokalaemia and/or signs of androgen excess (eg, hirsutism and menstrual
abnormalities in females). Inheritance seems to be dominant with variable expression,
and since its first description in 1976 only about 30 patients with mostly asymptomatic
family members have been described in the literature.[313] Several causative NR3C1
mutations have been identified in FGR patients leading to defective binding of ligand to
GR, reduced binding of GR to DNA, and reduced GR expression.
1.6.5.3 Defects in GR
These findings do not appear to be generalisable to other disease processes as a study
comparing GR complementary DNA (cDNA) from asthmatic patients with differential
response to Gc-therapy did not detect any base-pair mismatches between groups,
suggesting the defect in Gc-resistant asthma does not seem to be related to the structure
of GR.[314] Some data from the INS population suggests overall GR expression levels
may be a factor in Gc-resistance: lower GR expression levels in the glomeruli of adults
with INS correlated with a longer time to respond to Gc therapy,[315] and lower GR
expression levels were found in the lymphocytes and monocytes of children with SRNS
compared to children with SSNS.[316]

73
Further work examining a role for NR3C1 mutations in Gc-resistance comes from
Koper et al., who examined the prevalence of NR3C1 mutations responsible for
insensitivity to glucocorticoids.[317] The group analysed the NR3C1 genotype in a
group of 20, otherwise healthy, people with a reduced response to a dexamethasone
suppression test and in 20 controls, and found no mutations or polymorphisms
associated with a reduced sensitivity to glucocorticoids. However, they did identify five
novel mutations in NR3C1; one of which (ER22\23EK in exon 2) was subsequently
shown to result in reduced transactivation capacity of GR in vitro when transfected in
COS-1 cells.[318] The E22\23EK polymorphism has also been shown to be associated
with an increased survival rate associated with lower levels of an inflammatory markers
(C-reactive protein) in a general population of elderly men.[319] The mechanism for
this Gc-insensitivity in vitro and reduced inflammatory profile in vivo may involve a
shift from GRα to GRβ expression leading to a decrease in transactivation activity.[320]
As described in section 1.6.2.1, GRβ acts as a dominant negative inhibitor of GRα by
binding DNA, but not binding ligand. A SNP of GRβ (GR-9β) was found to be
associated with a reduced trans-repression, but normal transactivation, response in an
elderly cohort of patients recruited as part of a larger prospective study determining
factors underlying the development of illnesses in old age.[321] Some studies have
reported increased expression of GRβ in Gc-resistant patients in several diseases
including asthma, rheumatoid arthritis, and inflammatory bowel disease, and children
with INS.[322-325] However, other studies have not been able to replicate these
findings,[326] and the clinical relevance of altered GRβ remains uncertain.[327]
1.6.5.4 Abnormalities of GR chaperones
Some groups have focussed attention on molecular chaperones of GR including hsp90.
The expression of hsp90 in peripheral blood mononuclear cells (PBMCs) from adult
INS patients resistant to Gc therapy was found to be higher than those with SSNS.[328]
Additionally, the distribution of hsp90 in the SRNS group was greater in the nuclei than
that of SSNS patients. Further work in the adult INS population demonstrated increased
nuclear hsp90 binding to GR, and decreased GR–GRE binding activity in PBMCs from
Gc-resistant patients, leading to the possibility that nuclear hsp90 may hinder GR
activity and contribute to Gc-resistance.[329] A recent study has shown that Gc-
insensitivity in Cushing disease (a neuroendocrine condition caused by a partially Gc-
resistant corticotroph adenoma that excessively secretes ACTH, leading to

74
hypercortisolism) may be caused by overexpression of hsp90, and pharmacological
inhibition of hsp90 can lead to restoration of Gc-sensitivity.[330]
1.6.5.5 Abnormalities in inflammatory mediators
As described in section 1.5.2, some evidence suggests INS may have an immunological
basis. Based on this, Jafar et al., investigated 150 children with INS and 569 healthy
controls, and found the following polymorphisms were more prevalent in children with
SRNS compared to children with SSNS: IL-6 (G174C); IL-4 (C590T); and tumour
necrosis factor α (G308A).[331]
IL-2 and IL-4 are highly expressed in the airways of patients with Gc-resistant asthma,
and ex vivo, this combination of cytokines reduced GR nuclear translocation in T-cells
and reduced ligand-binding affinity of GR.[332] The mechanism underlying this defect
may involve p38 mitogen-activated kinase (MAPK) inhibitor, as inhibition of this
kinase blocks the effects triggered by IL-2 and IL-4.[333] Defective GR nuclear
translocation in Gc-resistant asthmatic patients has also been identified in another
study.[334]
Another cytokine with a potential role in Gc-resistance is the pro-inflammatory
mediator macrophage migration inhibitory factor (MIF). MIF is produced mainly by T
lymphocytes, but also by epithelial and endothelial cells.[335] Unlike many other pro-
inflammatory cyctokines, MIF expression is increased following Gc exposure, but in
parallel leads to inhibition of Gc-efficacy.[336] Indeed, MIF-inhibition has been shown
to be therapeutically useful in a range of rodent models of inflammatory diseases.[337]
Interestingly, Berdeli et al., examined the MIF -173G/C polymorphism in 214 children
with INS and 103 healthy controls and found that a significant increase in GC genotype
and C allele frequency in INS.[338] The group also identified a 20-fold higher
expression of the CC-genotype in the SRNS group compared to children with SSNS,
and CC-genotype were at increased risk of developing ESRD. The authors conclude that
MIF antagonists may be useful therapeutic agents for children with SRNS, but no
human clinical data is currently available.
1.6.5.6 Histone deacetylation
Epigenetic factors may also play a role in Gc-resistance. For example, histone
deacetylase (HDAC) 2 deacetylates lysine residues at the N-terminal regions of core
histone proteins, and low HDAC2 expression has been found in PBMCs and alveolar

75
macrophages from patients with Gc-resistant asthma,[339] and in surgically-resected
lung tissue from patients with (typically Gc-resistant) chronic obstructive pulmonary
disease (COPD).[340] Additionally, HDAC2 overexpression in broncho-alveolar
macrophages from patients with Gc-resistant chronic obstructive pulmonary disease ex
vivo restored Gc-sensitivity to the level seen in healthy control subjects.[341]
1.6.5.7 Vitamin D
Some data linking vitamin D deficiency to Gc-resistance comes from a study
demonstrating that T-helper cells from patients with Gc-resistant asthma did not secrete
the Gc-induced anti-inflammatory cytokine IL-10, but this was restored after addition of
vitamin D3.[342] Additionally, an enhanced Gc-induced IL-10 response was found in 3
patients with Gc-resistant asthma following oral ingestion of vitamin D3, suggesting
this intervention may be of some therapeutic relevance.
1.6.5.8 Pharmacokinetics
Another potential mechanism underlying Gc-resistance may involve membrane
transporter systems. For example, P-glycoprotein 170 (P-gp170), coded by the
multidrug-resistance gene MDR1, transports a range of drugs (eg, glucocorticoids,
methotrexate) out of cells.[305] High levels of MDR1 expression have been found in
lymphocytes from patients with Gc-resistant inflammatory bowel disease [343] and
rheumatoid arthritis,[344] and polymorphisms of the MDR1 gene have been examined
in children with INS. Jafar et al., found two SNPs of MDR1 (G2677T/A and C3435T )
which increase the risk of developing SRNS,[345] and these findings have been
replicated in another study.[346] Data from the Egyptian population of children with
INS found a correlation between expression of serum IL-2 expression and P-gp170,
with higher expression of both proteins in lymphocytes of children with SRNS.[347] A
report from Poland examining children with INS also found higher expression, and
pump activity of P-gp170 in lymphocytes of children with SRNS.[348] Interestingly,
this higher P-gp170 activity was reduced by calcium channel blockers in vitro,
suggesting this may be a potential approach to reverse Gc-resistance.
The human cytochrome P450 (CYP) system of enzymes plays a major role in the
metabolism of endogenous hormones, xenobiotics and drugs. Chiou et al., analysed the
A6986G polymorphism in the CYP3A5 gene but found no difference in frequency
between children with SSNS and SRNS.[349] Additionally, a range of pharmacokinetic

76
parameters were evaluated in thirteen children treated with prednisolone during an
active phase of INS, and no correlation was found between any parameter and response
to Gc-therapy.[245] These data suggest that assessment of pharmacokinetics is not able
to predict response to Gc-therapy in children with INS.
In summary, glucocorticoids are potent therapy for many clinical conditions, but a
major limiting factor in their clinical use is the wide variation observed in
responsiveness to therapy. The reasons underpinning this Gc-resistance are currently
unclear and are likely to be disease-specific. A number of approaches to enhance Gc-
sensitivity are currently being developed including targeting of MIF and P-gp170, as
well as the use of selective GR modulators (SGRMs) which would ideally preserve anti-
inflammatory activity but lack the side-effect profile of conventional
glucocorticoids.[350] Data concerning the utility of such agents in the treatment SRNS
is lacking.

77
1.7 Cell migration
Cell migration is essential for normal development and is an integral part of the
responss to tissue damage and infection.[351] Cell migration also occurs in chronic
human diseases such as cancer, atherosclerosis, rheumatoid arthritis, and, as described
in section 1.3.4, INS. Indeed, agents which specifically reduce cancer cell motility have
already been shown to be promising therapeutic agents.[352-355] In the following
sections, I will describe the mechanisms regulating cell motility, with a particular focus
on the podocyte.
1.7.1 Overview of cell migration
Cell migration is a multi-step, cyclical process, usually initiated in response to
extracellular cues, leading to reorganisation of the actin cytoskeleton and cell
polarisation. [351] The cell motility cycle may be divided into mechanistically distinct
steps:
i) A cell must first interact with its environment and adhere to the ECM.
Examples of receptors mediating cell-ECM interaction include integrins,
syndecans, and dystroglycan.[356] Integrin-ECM engagement triggers the
recruitment of a large number of proteins termed focal adhesion complexes
which not only provide physical and regulatory links between the ECM and
the cytoskeleton, but also provide influence over other major cellular
functions including cell survival and proliferation.[357]
ii) To initiate migration, cells must receive a pro-migratory stimulus, which
may be physical (eg, ECM-integrin interaction), or chemical (eg,
lysophosphatidic acid or growth factors such as platelet derived growth
factor).[358]
iii) Pro-migratory stimuli cause the cell to polarise forming a leading edge and a
trailing edge, allowing directional cell movement to occur.[359] In order to
migrate, a cell must push its membrane forward at the leading edge and
retract it at the trailing edge. Cells extend four different plasma membrane
protrusions at the leading edge: lamellipodia, filopodia, blebs and
invadopodia.[360]
Lamellipodia are sheet-like protrusions filled with a branched network of
actin, while filopodia are ‘finger-like’ structures that are filled with tight

78
parallel bundles of filamentous (F)-actin.[361] The elongation of these
structures pushes the leading edge forward, thus promoting cell migration.
Invadopodia are protrusions rich in proteinases such as members of the
matrix metalloprotease (MMP) family and the urokinase-type plasminogen
activator (uPA) proteolytic system, which allow focal degradation of the
ECM to facilitate invasion through tissues.[362] Blebs form when the
plasma membrane detaches focally from the underlying actin filament
cortex, allowing cytoplasmic flow to push the membrane outwards rapidly
due to intracellular hydrostatic pressure, and are thought to be important
during development.[360]
iv) The final stage involves the dynamic control of adhesion complex recycling
to ensure these complexes do not persist too long (resulting in the ability of a
cell to move forward), or for too short a period (which would lead to
unstable adhesion to the ECM and limited cell traction). An example of this
is how endocytosed integrins are sorted to either the leading or trailing edge
of cancer cells based on their activation status: Ras-related protein Rab-25
(Rab25) coordinates cell extension and retraction by regulating recycling of
inactive integrin to the cell front, whereas active integrins are recycled to the
cell rear where they can promote signals for forward movement.[363, 364]
The Ras superfamily of small guanosine triphosphatases (GTPases) are major regulators
of actin dynamics and other processes involved in cell migration and will be discussed
below.
1.7.2 Small GTPases
The Ras superfamily of small GTPases (from now on simply referred to as ‘small
GTPases’) comprise over 150 human members and are divided into five major
branches: Ras, Rho, Rab, Ran and Arf. [365] Small GTPases possess intrinsic
phosphatase activity and bind either guanosine triphosphate (GTP) or guanosine
diphosphate (GDP). The relative affinity difference of the effector molecules from GTP-
versus GDP-loaded states of small GTPases can be as much as 100-fold.[366] Thus,
small GTPases function as molecular switches, cycling between inactive (GDP-bound)
and active (GTP-bound) states (see Figure 1.5).
79
GDP/GTP cycling is controlled by guanine-nucleotide-exchange factors (GEFs) which
promote the formation of the active GTP-bound form,[367] GTPase-activating proteins
(GAPs) which accelerate the intrinsic GTPase activity to promote the formation of the
inactive GDP-bound form,[368] and GDP disassociation inhibitors (GDIs) which bind
GDP-associated GTPases and maintain the small GTPases in an inactive state.[369]
Small GTPases within a family branch use both shared and distinct GAPs and GEFs,
while small GTPases in different family branches use structurally distinct but
mechanistically similar GAPs and GEFs.[365]
1.7.2.1 The Ras family
The Ras sarcoma (Ras) oncoproteins consist of 36 members and interact with multiple
downstream effectors regulating gene expression, cell proliferation and cell
survival.[365] They have critical roles in human oncogenesis,[370] and in the context of
cell migration Rap1 regulates integrin activation,[371] and RaIA promotes the
formation of filopodia.[372]
1.7.2.2 The Rho family
The mammalian Ras homologous (Rho) family consist of 20 members, and have well
characterised roles in actin cytoskeletal regulation.[373] Several subfamilies exist
within the Rho family including Rac (Rac1, Rac2, Rac3 and RhoG), Rho (RhoA, RhoB,
RhoC) and Cdc42h (Cdc42, TC10, TCL, Chp).[351] Rho GTPases have been
implicated in the regulation of cell polarity, cell movement, cell shape, as well as in the
regulation of endocytosis and exocytosis.[374] The members of the Rho family that
have received most attention in the context of cell migration (primarily because they
were the first to be characterised in the morphological responses of cells to external
stimuli in the early 1990s[375]) are RhoA, Cdc42 and Rac1. I will discuss each of these
in more detail in later sections, but as a general overview, RhoA activation leads to the
assembly of contractile actin-myosin filaments (stress fibres),[358] Rac1 is implicated
in the formation of lamellipodia,[376] and Cdc42 has a critical role in the formation of
filopodia.[377]
1.7.2.3 The Rab family
Ras-like proteins in the brain (Rab) form the largest branch of the superfamily with 61
members, and regulate intracellular vesicular transport and the trafficking of proteins
along endocytic and secretory pathways.[365] Regarding cell migration, Rab proteins

80
play essential roles in the recycling of adhesion receptors. For example, in cancer cells
Rab25 promotes migration by regulating the delivery of integrin receptors to the tip of
membrane protrusions at the leading edge.[365]
1.7.2.4 The Ran family
The Ras-like-nuclear (Ran) is the only member of this family but is the most abundant
small GTPase in the cell and has well characterised roles in nucleocytoplasmic transport
of RNA and proteins.[365] Ran also has role in trafficking intracellular vesicles
containing Legionella pneumophilia (the causative agent of Legionnaires’
disease).[378]
1.7.2.5 The Arf family
Like the Rab proteins, the ADP-ribosylation factor (Arf) proteins regulate intracellular
vesicular transport.[365] Arf1 is the best characterised member of this family and
controls the formation of vesicle coats in the exocytic and endocytic pathways.[379]
Arf6 is involved in integrin recycling during cell migration, remodelling of the actin
cytoskeleton and invadopodia formation.[380]

81
Figure 1.5 The small GTPase cycle
Small GTPases serve as molecular switches, cycling between an active guanosine-triphosphate
(GTP)-bound form, and an inactive guanosine diphosphate (GDP)-bound form. Activation of
small GTPases is mediated by guanine-nucleotide-exchange factors (GEFs), while GTPase-
activating proteins (GAPs) promote the formation of the inactive GDP-bound form.
82
1.7.3 The Rho sub-family
The three Rho isoforms (RhoA, RhoB, and RhoC) are highly homologous, with the
primary protein sequences being approximately 85% identical.[375] Early work on the
control of the cytoskeleton was done in fibroblasts, in which actin filaments principally
exists in three types of structure: the cortical actin network, actin stress fibres which
emanate from adhesion complexes, and membrane protrusions (eg, filopodia).[381] The
first data implicating Rho proteins in the control of actin dynamics came from a study in
which injection of C3 transferase into cells (which inhibits all three Rho isoforms)
causes fibroblasts to lose their actin stress fibres and to round up.[382]
More direct evidence that Rho proteins have effects on the actin cytoskeleton came
from microinjection of serum-starved fibroblasts with recombinant RhoA or plasmids
overexpressing rhoA cDNA, which caused cell contraction and adhesion complex
formation.[382] Ridley et al., subsequently demonstrated that serum-starved cells
contain few stress fibres, while fibroblasts growing in the presence of serum contain
abundant stress fibres, and addition of serum induced rapid cytoskeletal
reorganisation.[358] They identified several growth factors including lysophospholipid
and platelet derived growth factor responsible for these changes, suggesting these may
be critical activators of Rho.
RhoA controls intracellular contractility by regulating both actin severing and actin
polymerisation. RhoA activates Rho-associated protein kinases (ROCK1/2), which in
turn phosphorylates myosin light chain (MLC) (directly) or MLC phosphatase causing
cell contraction and retraction of the cell trailing edge.[383] RhoA also modulates actin
depolymerisation by activating ROCK, which in turn activates LIM kinase (LIMK),
which phosphorylates the actin severing protein cofilin.[366] Through its severing
activity, cofilin increases the number of free barbed ends at the end of filaments, playing
a role in the initiation of actin-based cell protrusions in lamellipodia and
invadopodia.[384]
Another downstream effector of Rho proteins is the Formin family of proteins. Formins
produce straight, unbranched actin fibres involved in the initiation of actin filament
assembly.[385] Indeed, active RhoA has been identified at the front of lamellipodia
where it may act to stimulate actin polymerisation mediated by the formin mDia1.[386]
Thus, RhoA has complex actions on the cytoskeleton with roles in contraction of the
trailing edge, as well as being a regulator of membrane protrusions at the leading edge.
83
The small degree of protein sequence divergence between the three Rho isoforms occurs
around the Switch 1 region (which changes conformation between GDP- and GTP-
bound forms), suggesting the proteins could have different affinities for regulator or
effector proteins.[375] However, few GEFs and GAPs have been compared for their
relative activity on RhoA, RhoB, and RhoC, and most have been tested only on RhoA.
Of those that have been tested on all three isoforms, very little difference in affinity has
been observed.[367]
In terms of effector protein binding, ROCK has higher affinity for RhoC compared to
RhoA and RhoB. Moreover, RhoC-mediated ROCK activation is higher than that
elicited by RhoA or RhoB.[375] This difference suggests the isoforms may have
differing contributions to cellular motility. Differences in cellular localisation have also
been observed: RhoA and RhoC localise to the plasma membrane or interact with
RhoGDI in the cytoplasm, whereas RhoB localises to the endosomal membranes.[373]
The effects of Rho proteins on cell migration also seem to be cell-specific, which
probably reflects the basal level of stress fibres and focal adhesions.[351] Vega et al.,
investigated the role of RhoA and RhoC in invasion and migration using two cancer
cells lines: PC3 (prostate cancer cells) and MDA-MB-231 (breast cancer cells).[387]
Both RhoA-depleted and RhoC-depleted PC3 cells showed reduced migration speed but
through different mechanisms: RhoA-depleted cells extended narrow protrusions
simultaneously in two or more opposing directions, resulting in reduced net movement,
whereas RhoC-depleted cells were unable to polarise. Additionally, in a 3D invasion
assay RhoA-depleted cells showed enhanced invasion compared to control or RhoC-
depleted cells, suggesting a link between the protrusive nature of RhoA-depleted cells
and an increase in invasive behaviour. In contrast, another study showed that RhoB-
depleted PC3 cells showed an increase in migration speed (no invasion assay was
performed).[388]
In addition to their roles in regulating actin dynamics, Rho proteins have been
implicated in the control of endosome trafficking, cell survival and cancer progression.
For example, RhoB-null smooth muscle cells have impaired trafficking of the PDGF
receptor,[389] RhoC-null mice have reduced number and size of metastatses in a model
of lung cancer, with a decreased metastatic cell survival time. [390]

84
1.7.4 The Rac subfamily
The four members of the Rac subfamily (Rac1, Rac2, Rac3 and RhoG) have different
expression patterns. [373] Rac1 is the most studied member of this family and is
ubiquitously expressed, whereas Rac2 expression is mostly restricted to cells of
haematopoietic origin, and Rac3 is most abundant in the brain.[391, 392] RhoG has the
lowest sequence identity to Rac1, is widely expressed, but at varying levels with human
tissues: in the human kidney, moderate tubular staining is observed but no glomerular
expression.[393] In the following discussion, I will focus on the actions of Rac1.
Rac1 is activated by a variety of stimuli including shear stress,[394] mechanical
stretch,[395] reactive oxygen species,[396] inflammatory cytokines (eg, tumour
necrosis factor α),[397] growth factors (eg, epidermal growth factor),[398] integrins (eg,
β3 integrin),[399, 400] high glucose concentrations,[401] homocysteine,[402] osmotic
stress,[403] angiotensin II,[404] and aldosterone.[405, 406] Activation of Rac1 is
associated with the regulation of membrane protrusions required for cell
migration.[373] This was first shown in a study which showed microinjection of
recombinant Rac1 protein into fibroblasts stimulated the formation of
lamellipodia.[407] Nobes et al., provided further insight using a wound healing
assay.[408] Inhibition of Rac1 had pronounced inhibitory effects on cell movement: in
cells injected with dominant negative Rac1 protein, wound size after 5 hours was
reduced by 80%, and in cells injected with a dominant negative Rac1 expression
plasmid, cell movement was inhibited by 98%. Microinjection of constitutively active
Rac1 protein had no effect on cell migration across the wound. The authors concluded
that Rac1 is essential for cell movement. Additionally, Rac1-null Schwann cells,
endothelial cells and platelets have impaired lamellipodium formation.[409-411] More
recent data have revealed that activation of Rac1 alone, using a photoactivatable Rac1,
is sufficient to induce lamellipodium extension. [412]
Rac1 regulates actin polymerisation during lamellipodial extension in several ways: i)
activation of actin-nucleating proteins [eg, the ARP2/3 complex through WASP-family
verprolin-homologous protein (WAVE) proteins] and mDia formins; ii) controlling the
availability of free actin barbed ends through cofilin and; iii) increasing the availability
of actin monomers via the actions of cofilin.[373, 413]

85
Additionally, Rac1 has roles in integrin-mediated cell adhesion,[414] reactive oxygen
species production,[415] cell cycle progression, phagocytosis, and gene expression (eg,
by activation of the MAPK and STAT pathways).[416]
1.7.5 Cdc42
A role for Cdc42 in cytoskeletal regulation was identified in a study in which
microinjection of Cdc42 protein in fibroblasts led to the rapid formation of
filopodia.[417] Using a wound healing assay, it was subsequently found that Cdc42
inhibition led to a 50% reduction in cell movement, suggesting Cdc42 is required for
efficient movement but is not absolutely essential (a 98% reduction in cell movement
was found with Rac1 inhibition in the same study).[408] Additionally, other small
GTPases can also induce filopodia formation including RhoQ, RhoU, RhoF, and
RhoD.[373, 418-420] Another study used a chemotaxis chamber to demonstrate that
RhoA and Rac1 are required for cell migration, whereas Cdc42 is required for cells to
respond to an attractant chemokine gradient, but is not essential for cell
locomotion.[376]
1.7.6 Rho GTPase cross-talk
Many of the early studies examining how Rho GTPases regulate actin dynamics
focussed on isolated effects of either RhoA, Rac1 or Cdc42. However, recent data show
that these proteins act in complex activation cascades, involving antagonistic regulatory
mechanisms.[366] For example, Rac1 and RhoA are mutually inhibitory,[421] and
Cdc42 can activate Rac1.[417]
It has also previously been hypothesised that the protrusive phenotype driven primarily
by Rac1 must be dominant at the leading edge, and the RhoA-mediated contractile
phenotype causing tail retraction must be dominant at the rear of the cell.[366]
However, again more recent data indicates that a much finer spatiotemporal control of
migratory events occurs in cells. For example, Machacek et al., examined small GTPase
coordination in fibroblasts through simultaneous visualisation of GTPase biosensors for
RhoA, Rac1, and Cdc42.[422] The group found that all three GTPases (ie, including
RhoA), were maximally active proximal to the leading edge. This is not consistent with
the hypothesis of dominant Rac1/Cdc42 activity at the leading edge, with dominant
RhoA at the trailing edge. Additionally, they found that RhoA was activated at the cell
edge synchronous with edge advancement, whereas Rac1 and Cdc42 were activated

86
2µm behind the edge with a delay of 40 seconds. These data suggest that Rac1 and
RhoA operate antagonistically in a precise manner, and that RhoA has a role in the
initial protrusion event, whereas Rac1 and Cdc42 activate pathways implicated in
reinforcement and stabilisation of the newly expanded protrusion.
1.7.7 Rho GTPases and nephrotic syndrome
Mechanistic links between podocyte motility, proteinuria, and the Rho family of small
GTPases were suggested by a study demonstrating suPAR (a serum factor potentially
linked to the onset of INS) led to increased podocyte motility in vitro, and FP
effacement and proteinuria in vivo through activation of podocyte β3-integrin, which in
turn promotes Rac1 and Cdc42 activity.[400] These observations were made in the era
before the complex spatiotemporal regulatory mechanisms involving the small GTPases
(see section 1.7.6) were widely recognised. It was hypothesised that RhoA activation
causes a hypomobile podocyte phenotype, stabilising the podocyte FP structure and
protecting from effacement and proteinuria, whereas Rac1 and Cdc42 activity promotes
podocyte motility and the development of FP effacement and proteinuria (see Figure
1.6).[129, 130] Data supporting this hypothesis includearhg the observation that a
mouse line with inducible podocyte-specific constitutively active Rac1 displayed a
rapid onset of proteinuria associated with altered FP morphology.[423]
Subsequent in vivo work demonstrated that the relationship between small GTPase
activity and proteinuria was more complex than initially thought, and both under- and
over-activity of small GTPase action in podocytes has a detrimental effect on
glomerular barrier function.
Shibata et al., demonstrated that inhibition of ROCK (a downstream effector of RhoA)
by fasudil reduced proteinuria in a PAN-nephrosis model in rats, suggesting excessive
RhoA activity increases GFB permeability.[424] Podocyte-specific expression of a
constitutively active, doxycycline-inducible form of RhoA in mice led to significant
proteinuria: weak activation of RhoA led to histological findings consistent with MCD,
while stronger activation of RhoA resulted in histological findings similar to FSGS in
humans.[425] However, further studies showed podocyte-specific expression of both a
constitutively active RhoA construct or a dominant-negative RhoA construct in mice led
to proteinuria, FP effacement and disruption of the actin cytoskeleton.[426]

87
The individual contributions of the Rho GTPases were assessed by Scott et al., who
deleted each of these proteins in rodent podocytes. Cdc42 mutant mice displayed
proteinuria from birth and died of renal failure within two weeks. In contrast, Rac1 and
RhoA mutants did not develop proteinuria by 3 months of age and showed no overt
disease phenotype or decline in weight even after 1 year.[427] One confounding issue
not tackled in this study is the possibility of molecular redundancy. RhoA shows 84%
and 92% amino acid sequence identity with RhoB and RhoC respectively; Rac1, Rac2
and Rac3 all share >90% sequence identity; while Cdc42 shows only 62% and 55%
homology with its closest relatives RhoQ and RhoJ.[373] There is a possibility that the
lack of an overt phenotype in the RhoA and Rac1 mutants in the study by Scott et al.,
arises from the ability of related molecules to functionally compensate.
Blattner et al., further studied the role of Cdc42 by demonstrating that although mice
with podocyte-specific deletion of Cdc42 appeared normal at birth, they began to
experience significant morbidity and proteinuria from approximately 2 weeks of age
and the majority of mutants died by the age of 4 weeks.[428] In the same study,
podocyte-specific deletion of Rac1 resulted in healthy mice pups experiencing no
proteinuria at 6 months of age and displaying no gross renal pathology. However, in an
acute protamine sulphate model of podocyte injury, deletion of Rac1 prevented FP
effacement, while in a chronic model of glomerular damage (uninephrectomized/
deoxycorticosterone acetate salt-induced hypertension), Rac1 mutants exhibited
increased proteinuria compared to control mice. Thus, loss of Rac1 either improves or
worsens the effects of agents harmful to the filtration barrier dependent on the context.
Yu et al., provided further evidence for a role for Rac1 in the development of
proteinuria by generating a podocyte-specific, inducible transgenic mouse line that
expressed constitutively-active Rac1.[423] Induction of the transgene resulted in a
rapid onset of proteinuria associated with FP effacement.

88
Figure 1.6 Podocyte motility is a determinant of glomerular barrier function
Podocytes are motile cells in vivo, and hypermobility is associated with glomerular
disease.[132] Key regulators of cellular motility are the small GTPases Ras-related C3
botulinum toxin substrate 1 (Rac1), which stimulates the formation of pro-migratory cell
protrusions, [373] and Ras homolog gene family, member A (RhoA), which forms stress fibres
when active.[382] Images show human, wild type immortalised podocytes stained with the F-
actin fluorescent dye Texas Red®-Y and imaged using a DeltaVision microscope.

89
1.7.8 Rac1 and chronic kidney disease
Data implicating Rac1 in the development of chronic kidney disease (CKD) comes from
a study examining crosstalk between Rac1 and MR. MR and its ligand aldosterone have
well-established pathophysiological roles in the progression of kidney disease,[429] and
MR antagonists (eg, spironolactone) are used clinically as adjunctive therapy to reduce
proteinuria.[430] Shibata et al., transiently transfected constitutively active Rac1 into
human embryonic kidney cells (HEK) 293 cells and demonstrated enhanced MR
activity, including increased nuclear translocation.[431] Additionally, mice lacking Rho
GDI α (Arhgdia-/-) (GDIs prevent small GTPases from being converted to the active
GTP-bound form) developed heavy proteinuria associated with increased Rac1 (but not
RhoA) and MR signalling. Treating Arhgdia-/- mice with a Rac-inhibitor (NSC23766)
reduced MR overactivity and renal damage, and MR-blockade also reduced proteinuria
(fasudil, a ROCK inhibitor, was ineffective therapy). This suggests Rac1 enhances the
activity of MR in a ligand-independent manner, accelerating kidney damage.[431] The
observation that mutations in the Arhgdia gene cause SRNS underscores its importance
in the pathogenesis of proteinuria.[432]
Further evidence implicating Rac1 in kidney disease comes from a study examining
angiotensin-II-induced podocyte injury. This study demonstrated a switch from a
stationary to motile phenotype involving Rac1 in cultured mouse podocytes stably
expressing the type 1 angiotensin II-receptor.[433] Tian et al., showed, again in a mouse
podocyte cell line, that calcium influx via TRPC5 channels activate Rac1 and stimulates
podocytes to adopt a motile phenotype, whereas calcium influx via TRPC6 channels
activates RhoA and elicits a more stationary podocyte phenotype.[128] Babelova et al.,
examined a potential role for Rho GTPase inhibition in CKD using the 5/6 nephrectomy
model of arterial hypertension and proteinuria in mice, using EHT1846 (Rac1 inhibitor),
SAR407899 (ROCK inhibitor) and ramipril (angiotensin converting enzyme inhibitor
which is used widely in clinical practice for the treatment of chronic kidney
disease).[434] All inhibitors markedly attenuated proteinuria as well as glomerular and
tubulointerstitial damage. Additionally, the combination of the ROCK inhibitor and
ramipril was more effective in preventing albuminuria than ramipril alone.
Regulators of Rac1 also seem to play a role in the development of kidney disease: when
RhoA is activate, a Rac1 GAP, Rho GTPase-activating protein 24, RhoGAP24 (coded

90
by the Arhgap24 gene), is phosphorylated by ROCK. This phosphorylation increases
the GAP activity of RhoGAP24, resulting in the inactivation of Rac1 and Cdc42.[406,
435] In cultured mouse podocytes, RhoGAP24 knock down results in increased levels
of active Rac1 and Cdc42 (but not RhoA), and results in increased motility in a wound
healing assay.[436] Furthermore, mutations in Arhgap24 have been associated with
familial FSGS in humans.

91
1.8 Project aims
Glucocorticoid therapy has been the cornerstone of management of childhood idiopathic
nephrotic syndrome for several decades but the clinically-relevant mechanism of action,
and the target cell remain poorly understood. An understanding of these unknowns may
help to guide the future development of targeted therapeutics with an improved side
effect profile.
We hypothesise that glucocorticoids act directly on podocytes to produce potentially
clinically useful effects without involvement of the immune system. I will principally
use an immortalised human podocyte cell line to:
1. Define the glucocorticoid receptor cistrome in the podocyte to understand the
effects glucocorticoids exert on the podocyte.
2. Validate potentially clinically-relevant effects identified in aim (1).
3. Identify any novel mechanistic pathways which may be amenable to therapeutic
treatment in vitro.

92
2 General materials and methods
2.1 Materials and reagents
Unless otherwise stated, all cell culture plastic ware were provided by Corning; media
and reagents were provided by Sigma-Aldrich. Ultrapure water was obtained using a
Milli-Q Synthesis system (Millipore Ltd).
2.2 General buffers
PBS: Dulbecco’s phosphate buffered saline (150mM Nacl) without divalent cations.
TBS: Tris buffered saline, 150mM NaCl, 25mM Tris-HCl, pH 7.4
TAE: 50X; 2M Tris-acetate, 50mM EDTA, pH 7.7.
TE: 10mM Tris, 1mM EDTA, pH 8.0.
2.3 SDS-PAGE and western blotting buffers
Laemmli SDS sample loading buffer (5X): 125mM Tris-HCl pH 6.8, 25% (w/v)
glycerol, 10% (w/v) sodium dodecyl-sulfate (SDS), 0.001% (w/v) bromophenol blue,
2% (v/v) β-mercaptoethanol.
NuPAGE MES [2-(N-morpholino)ethanesulfonic acid] SDS running buffer (1X):
50mM MES, 50mM Tris base, 0.1% SDS, 1mM EDTA, pH7.3.
Western blotting transfer buffer: 50mM Tris-base, 170mM glycine, 0.1% (w/v) SDS,
20% (v/v) methanol
TBS-Tween: 25mM Tris pH 7.4, 150mM NaCl, 0.1% (w/v) Tween-20.
Blocking buffer(10X): Casein blocking buffer (Sigma-Aldrich, B6429).
2.4 Antibodies
2.4.1 Primary antibodies
See Table 2.1.

93
Table 2.1 Primary antibodies
WB: western blotting; IF:immunofluorescence; IHF: fluorescent immunohistochemistry; CS:
chromatin immunoprecipitation sequencing; GR: glucocorticoid receptor; Rac1: Ras-related C3
botulinum toxin substrate 1; RhoA: Ras homolog gene family, member A; MR:
mineralocorticoid receptor; GAPDH: Glyceraldehyde 3-phosphate dehydrogenase.
Antibody target Species Use and
dilution (v/v)
Supplier Catalogue
number
Human GR Rabbit IF: 1/200 Proteintech 24050-1-AP
WB: 1/2000
CS: 2µg
Human GR Rabbit CS: 2µg Sigma-Aldrich HPA004248
Mouse GR Rabbit IHF: 1/100 Santa-Cruz M20 : sc-
1004
Human
phosphorylated-
GR (serine 211)
Rabbit WB:1/1000 Cell Signaling 4161
Rac1 mouse WB: 1/1000 BD
Biosciences
610651
RhoA mouse WB: 1/500 Cytoskeleton ARH03
Mouse nephrin Guinea pig IHF: 1/100 Acris BP5030
Human GAPDH Mouse WB: 1/2000 Sigma-Aldrich G8795
Human MR Mouse WB: 1/1000 Life
Technologies
MA1-620
2.4.2 Secondary antibodies
See Table 2.2.

94
Table 2.2 Secondary antibodies
WB: western blotting IHF: fluorescent immunohistochemistry; IF: immunofluorescence; Ig:
immunoglobulin
Antibody
target
Source
Species
Fluorescent
dye
Use and
dilution
(v/v)
Supplier Catalogue
number
Rabbit IgG Goat Alexa Fluor
680
WB:
1/5000
Invitrogen A21109
Mouse IgG Goat Alexa Fluor
800
WB:
1/5000
Invitrogen A11001
Rabbit IgG Donkey Alexa Fluor
647
IHF: 1/200 Invitrogen A31573
Guinea pig
IgG
Goat Alexa Fluor
488
IHF: 1/200 Invitrogen A11073
Rabbit IgG Donkey Cy2 IF:1/200 Jackson
immunoresearch
laboratories
711225152

95
2.5 Human cell lines
Human wild type podocytes: a conditionally immortalised human podocyte cell line
developed by transfection with the temperature-sensitive SV40-T gene, which
proliferate at 33oC, but at 37oC enter growth arrest and express markers of differentiated
in vivo podocytes.[108] Obtained from M. Saleem, University of Bristol, UK.
GEnC: Conditionally immortalised human glomerular endothelial cells.[437] Obtained
from S. Satchell, University of Bristol, UK.
A549: Human lung adenocarcinomic alveolar basal epithelial cells.[438] Obtained from
T. Poolman, University of Manchester, UK.
HEK 293: Human embryonic kidney cells (Invitrogen).[439]
2.6 Cell Culture
Conditionally immortalised podocytes,[108] were grown in RPMI-1640 medium with
L-glutamine and NaHCO3 (R8758) supplemented with 10% (v/v) foetal calf serum (Life
Technologies), 1% (v/v) insulin-transferrin-selenium (Life Technologies, 41400045),
and 1% penicillin-streptomycin (P0781-stock 10,000 units penicillin and 10mg
streptomycin per mL).
Proliferating podocytes were cultured at 33oC in a 5% (v/v) CO2 humidified incubator,
and passaged when confluent, by detachment with Trypsin-EDTA solution (0.5g
porcine trypsin and 0.2g EDTA per litre of Hanks’s balanced salt solution with phenol
red), and reseeded in fresh tissue culture flasks.
Podocytes underwent 10-14 days differentiation at 37oC before use. Unless otherwise
stated, glucocorticoid (Gc)-treatment refers to 1µM prednisolone dissolved in
methanol.; vehicle-treatment refers to administration of an equal, 0.001% (v/v) amount
of methanol alone. The Ras-related C3 botulinum toxin substrate 1 (Rac1) inhibitor
EHT 1864 (Chapter 5) was used at a dose of 30µM (gift from Dr. Caswell, University
of Manchester).

96
2.7 Protein analysis
2.7.1 Preparation of a total cell lysate
Cells were washed twice with PBS, before harvesting with ice-cold
radioimmunoprecipitation assay cell lysis buffer (RIPA) [150mM NaCl, 20mM Tris pH
7.4, 3mM MgCl2, 0.5% (v/v) Triton X-100, supplemented with PhosSTOP protease
inhibitor tablets (Roche) and cOmplete protease inhibitor cocktail tablets (Roche)].
Cells were detached by scraping prior to centrifugation at 21,000g for 10 minutes at
4oC.
Supernatant was collected and stored at -80oC prior to analysis by sodium dodecyl
sulfate polyacrylamide gel electrophoresis (SDS-PAGE).
2.7.2 Polyacrylamide gel electrophoresis
Protein samples were separated by SDS-PAGE using 4-12% (w/v) NuPAGE Novex
Bis-Tris gels (Invitrogen). Precision Plus Protein All Blue standards (Bio-Rad
Laboratories) were loaded onto gels as molecular weight markers. Gels were resolved in
NuPAGE MES SDS running buffer (Invitrogen) using XCell SureLock mini-cells
(Invitrogen) at 150 volts (V) for 50 minutes.
2.7.3 Immunoblotting
2.7.3.1 Electrophoretic transfer
Proteins resolved by SDS-PAGE were transferred onto Protran nitrocellulose blotting
membrane (Whatman International Ltd.) using XCell II blot modules (Invitrogen)
according to the manufacturer’s instructions. Proteins were transferred in transfer buffer
at 30V for 90 minutes.
2.7.3.2 Membrane blocking, antibody probing and detection
Nitrocellulose membranes were blocked with blocking buffer diluted in ultrapure water
(Millipore Ltd) for 45 minutes at room temperature. Membranes were probed with
primary antibodies (see Table 2.1) resuspended to the appropriate concentration in
blocking buffer diluted in TBS-Tween and incubated overnight at 4oC. Membranes
were washed five times with TBS-Tween and incubated with the appropriate fluorescent
dye-conjugated secondary antibody (see Table 2.2) diluted in TBS-Tween for 45
minutes at room temperature, protected from sources of light. Membranes were washed

97
five times with TBS-Tween and visualised using the Odyssey IR imaging system
(700nm and 800nm channels, 169µm resolution, without focus offset).
2.8 Immunofluorescence staining
Cells on coverslips were fixed in 4& (w/v) paraformaldehyde for 10minutes at room
temperature. Following two washed with PBS, cells were permeabilised with 0.5% (v/v)
Triton X-100 in PBS for 10 minutes at room temperature, before blocking with 1%
(w/v) bovine serum albumin (BSA) diluted in PBS for 10 minutes at room temperature.
Coverslpis were incubated with primary antibodies diluted in 1% BSA for 1 hour at
room temperature. Coverslips were then washed three times with PBS before incubation
with an appropriate secondary antibody (Table 2.2) diluted in 1% BSA for 1 hour at
room temperature. After a further 3 washes with PBS, nuceli were stained with 4',6-
diamidino-2-phenylindole (DAPI) before mounting onto glass slides using Polyvinyl
alcohol mounting medium with DABCO® antifading reagent. Coverslips were imaged
on a Delta Vision fluorescence microscope.
2.9 Widefield fluorescence microscopy
Fluorescent images were acquired on a Delta Vision [RT] (Applied Precision)
restoration microscope using a 40x/ numerical aperture 0.85 Uplan Apo objective and
the Sedat filter set (86000v2). The images were collected using a Coolsnap HQ
(Photometrics) camera with a Z optical spacing of 0.2μm. All images were taken with
constant exposure time between all the conditions of the same staining. Images were
processed using ImageJ 1.49c.
2.10 Electric Cell Substrate Impedance Sensing
Time course analysis and resistance measurement was performed using an automated
cell monitoring system, Electrical Cell-Substrate Impedance Sensing (ECIS 1600R,
Applied Biophysics), as used in previous studies of podocyte function.[440]
Differentiated podocytes were seeded at a density 25,000 cells per well onto 8W10E+
arrays (Applied Biophysics) coated with 10mM cysteine and 10µg/mL fibronectin. Each
experiment measured the resistance in two 8W10E+ arrays, each 8W10E+ array
contained five wells. The electrical resistance in each well was measured using ten
electrodes. The resistance was measured at regular time intervals of 30 seconds.

98
3 Human podocytes respond directly to glucocorticoid
exposure in vitro
3.1 Overview
Although glucocorticoid (Gc) therapy has been used for several decades to treat children
with NS, the target cell and mechanism of action have never been clearly identified. The
well-characterised immunosuppressive effects of glucocorticoids have previously been
taken as indirect evidence that the therapeutically-relevant mechanism of action on the
kidney involves an indirect effect via immune cells. More recently, data have emerged
to demonstrate that glucocorticoids act directly on podocytes. For example, a murine
podocyte cell line expresses key components of the GR complex, and GR-mediated
signalling is intact following exposure to dexamethasone.[105] Additionally, human
podocytes express GR in vivo,[104] and treating cultured murine podocytes with
dexamethasone protects them from actin filament disruption.[109]
In this chapter, I demonstrate that the GR-signalling mechanism is intact in a human
podocyte cell line following exposure to prednisolone (the GR-ligand used in clinical
practice for the treatment of NS). Specifically, I show that: i) podocytes express GR and
exposure to ligand reduces GR levels; ii) GR is phosphorylated at serine 211 following
prednisolone exposure; iii) GR translocates to the nucleus following ligand activation
and; iv) podocyte messenger RNA (mRNA) levels for a known Gc-regulated gene
increase following prednisolone exposure. I also show that prednisolone has a direct
protective effect on human podocytes, without immune cell involvement, by using
electrical resistance across a monolayer of podocytes as a functional marker of barrier
integrity.

99
3.2 Chapter-specific methods
3.2.1 Quantitative real-time polymerase chain reaction
Fully differentiated human, wild-type podocytes were treated with either prednisolone
(1nM, 3nM, 10 nM, 30 nM, 100nM, or 1000nM) or vehicle (standard culture medium
supplemented with 0.001% v/v methanol) for 6 hours. Total RNA was prepared using
the RNeasy mini kit with on-column DNase I digestion (Qiagen). The concentration of
the RNA was quantified using a Nanodrop ND1000 ultra low volume
spectrophotometer (Lab Tech) and 1µg RNA per sample was used to prepare
complementary DNA (cDNA) using a High Capacity RNA to cDNA kit, and was
analysed using the Power SRBR Green PCR Master Mix (Applied Biosystems) on a
StepOnePlus Real-Time PCR system (Life Technologies). Primers used for
Glyceraldehyde 3-phosphate dehydrogenase (GAPDH) and Glucocorticoid-induced
leucine zipper (GILZ), were obtained from the 10x QuantiTect Primer Assay (Qiagen).
Relative expression levels were calculated using the Δ∆CT method, normalizing to
GAPDH control.

100
3.3 Results
3.3.1 The podocyte GR-signalling pathway is functionally active in vitro
I first confirmed that human immortalised wild type podocytes express GR using
western blotting (Figure 3.1). Exposure to the GR ligand prednisolone resulted in
reduced GR expression by the 2 hour time point, a nadir of GR expression at 12 hours,
followed by a gradual recovery in expression levels over the remaining 2 days of the
experiment. Phosphorylation of GR at serine residue 211 peaked at the 2 hour time
point following prednisolone exposure, and subsequently decreased until reaching a
steady level at the 24 hour time point.

101
Figure 3.1 Podocyte GR expression and response to Gc exposure.
(A) Wild type podocytes express GRα as demonstrated by western blotting. Exposure to
the GR-ligand prednisolone results in decreased GR expression. (B) Quantification of
western blotting results. GR expression is reduced as early as 2 hours following
prednisolone exposure. The solid red line represents the mean GR expression and error
bars represent the standard error of the mean (SEM). Results were analysed by one-
way ANOVA followed by Dunnett’s multiple comparisons test. ** = adjusted p value
<0.05 ; *** = adjusted p value <0.005. Blue line represents the mean GR
phosphorylated at serine residue 211 divided by total GR. No significant difference in
phospho-GR levels were found. The experiment was repeated 3 times (n=3).

102
Figure 3.2 Ligand-dependent nuclear translocation of GR and transcriptional response.
(A) Immunofluorescence data demonstrating GR nuclear translocation following 3 hours of
prednisolone exposure. (B) Graph showing fold change in messenger RNA (mRNA) levels for a
known Gc-regulated gene, glucocorticoid-induced leucine zipper (GILZ), following exposure to
different concentrations of prednisolone for 6 hours. mRNA levels were quantified using real-
time polymerase chain reaction (qPCR). The experiment was performed three times. Results
were analysed using one way ANOVA followed by Dunnet’s multiple comparisons test.*** =
adjusted p value <0.005. n=3.

103
Ligand-dependent translocation of GR into the nucleus was observed (Figure 3.2), as
was a dose-dependent increase in levels of mRNA for a known Gc-regulated gene,
glucocorticoid-induced leucine zipper (GILZ). In summary, these results demonstrate
that the basic GR-signalling mechanism is intact in the human podocyte in vitro, and
functionally active as shown by the transcriptional output elicited by prednisolone
exposure.
3.3.2 Podocyte-specific GR isoform expression and MR levels
Next, I further characterised the human wild type podocyte cell line (AB) by examining
the GR-isoform expression pattern in relation to three other cell lines: human
glomerular endothelial cells (GEnC), human embryonic kidney 293 (HEK 293) cells,
and adenocarcinomic human alveolar basal epithelial (A549) cells. Thus, wild type
podocytes were compared with two other kidney cell lines, and another non-kidney cell
line. Figure 3.3-A shows that total GR antibody identified three dominant GR isoforms
in podocytes following western blotting of total cell lysate. The molecular weights
corresponded to known GR isoforms, specifically: GRα (94kDa), GR-P (74 kDa), and
GR-A (65 kDa).[441] AB podocytes were found to have higher GRα expression than
GEnC cells (Figure 3.3-B), no statistically significant difference in GR-P expression
levels were found between the four cell lines (Figure 3.3-C), and podocytes had higher
GR-A expression levels than HEK 293 and A549 cells (Figure 3.3-D).
Many Gc ligands also have high affinity for MR. However, unlike GR, MR has a very
tissue-specific distribution (see Section 1.6.1.3). Therefore, to investigate the possibility
that some cellular effects of Gc-ligands may be mediated via MR in the podocyte, MR
expression patterns were compared across the four cell lines (Figure 3.3-E). Only a
very faint band was observed in podocytes, with HEK 293 cells showing 6 fold higher
expression levels (Figure 3.3–G). It is therefore unlikely that Gc effects are mediated
via MR in the wild type podocytes in vitro.

104
Figure 3.3 GR isoform and MR expression pattern in podocytes.
(A) Western blot demonstrating three dominant GR isoforms expressed by wild type podocytes
(AB) in comparison to GEnC, HEK 293 and A549 cells. Quantification of GRα (B), GR-P (C)
and GR-A (D) expression patterns between the cell lines. Expression (E)/(F) and quantification
(G) of mineralocorticoid receptor (MR) expression between the cell lines. Results analysed
using one way ANOVA followed by Dunnett’s multiple comparisons test. *=adjusted p
value<0.05, ***=adjusted p value <0.005. For western blotting, all wells were loaded with 40µg
of total cell lysate. n=3.

105
3.3.3 Prednisolone exerts a direct protective effect on human podocytes
After demonstrating that GR-signalling was intact in the podocyte cell line, I
investigated the possibility that prednisolone has direct, protective effects against a
damaging insult on podocytes, without the involvement of immune cells in vitro. In
order to do this, I used an assay called Electric Cell-Substrate Impedance Sensing
(ECIS). The assay consists of a series of wells with an electrode at the bottom of each
well. When cells are added to the ECIS arrays and attached to the electrodes, they form
a monolayer and act as insulators, increasing the electrical resistance. The data
generated are resistance versus time. In the assay, electrical resistance is taken as a
surrogate marker for monolayer or barrier integrity, with higher resistance
corresponding to higher barrier integrity. In support of this approach, electrical charge
across the glomerular filtration barrier (GFB) has been shown to be an integral
component of a functioning renal filtration system (see Section 1.2.2.3).
I chose to use the well-characterised puromycin aminonucleoside (PAN)-model of
podocyte damage for use in the ECIS assay. This model is used both in vitro and in
vivo. Following PAN administration to rats, podocyte injury is manifest by podocyte
effacement, reduction of charge across the GFB and proteinuria.[442] I first confirmed
that the in vitro dose of PAN frequently described in the literature (5.0 µg/mL) did
produce disruption of the podcyte actin cytoskeleton.[109] Figure 3.4 shows that the
well-defined actin fibres apparent in the vehicle-treated podocytes are lost in podocytes
treated with PAN for 24 hours, confirming the efficacy of this dose of PAN.
Following plating of podocytes into the wells of the ECIS array, the resistance across
the cell monolayer markedly increased (Figure 3.5-B). Cells were subsequently treated
with culture medium containing either vehicle alone, prednisolone alone, PAN alone, or
PAN and prednisolone together. The subsequent changes in resistance reflect changes in
cell morphology and the nature of the cell-electrode attachments. As expected, the
resistance across cells treated with PAN alone markedly decreased, signifying podocyte
damage. Cells treated with prednisolone alone showed higher resistance than vehicle-
treated cells. Interestingly, Gc exposure seemed to provide some protective effect
against PAN-damage, as demonstrated by the higher resistance recorded for PAN/Gc
cells compared to cells treated with PAN alone (Figure 3.5-A).

106
3.4 Discussion
The target cell of action of Gc therapy in NS unclear. In this project, I propose that
podocytes are the target of Gc action. In this chapter, I investigated whether human
podocytes in vitro can respond directly to Gc exposure, and whether this exerts a
functionally protective effect in a PAN-model of podocyte damage. Prior to this
investigation, it had already been established that podocytes express GR in
homogenates of isolated normal human glomeruli.[104] Key components of the GR
signalling pathway were shown to be expressed in a murine podocyte cell line, and it
was demonstrated that the GR signalling pathway can be activated by the GR-ligand
dexamethasone.[105] It was also known that wild type human podocytes express
GR.[102]
In this chapter I demonstrated that the GR signalling pathway is intact in human
podocytes following exposure to the GR-ligand prednisolone. I also demonstrated
homologous regulation of GR expression levels by prednisolone (Figure 3.1-A), with
GR levels reduced by 55% compared to baseline after only 2 hours of Gc exposure, and
maximal downregulation occurring at 12 hours of exposure. Several studies
investigating the impact of Gc-ligand on GR expression have been performed but most
have focussed on GR messenger RNA (mRNA) levels rather than protein levels. The
vast majority of reports suggest Gc-ligand downregulates GR expression. In a study by
Rosewicz et al. from 1988, dexamethasone maximally decreased GR mRNA levels to
43% of control after 6 hours of incubation with dexamethasone in human IM-9
lymphocytes, whereas in AR42J rat pancreatic cells mRNA levels were maximally
decreased to 50% of control after 12 hours.[443] Incubation with dexamethasone for up
to 72 hours caused no further down-regulation. In another study using mouse AtT-20
pituitary tumour cells treated with the GR-ligand triamcinolone acetonide, GR mRNA
levels decreased to approximately 60% of control levels at 4 hours of treatment, 48% of
control levels at 48 hours of treatment, and then increased slightly to 67% at 72
hours.[444] Interestingly, the authors also performed a series of in vitro studies
demonstrating that GR is degraded in an ATP-dependent manner, suggesting a role for
the ubiquitin proteolytic pathway. One study found that homologous regulation of GR
may be cell type specific: dexamethasone caused an upregulation of GR mRNA in

107
human CEM-C7 T-lymphoblast cells, but a downregulation of GR mRNA in IM-9
lymphocytes.[445]

108
Figure 3.4 The effect of puromycin aminonucleoside (PAN) treatment on podocytes
Human podocytes were cultured in growth medium containing either vehicle or 5.0µg/mL of
PAN. Immunofluorescence staining was performed using 4',6-diamidino-2-phenylindole
(DAPI) for nuclear staining, and Texas Red-X phalloidin F-actin dye. Scale bars are included on
the bottom right of the combined images.

109
Figure 3.5 Direct Gc effect on podocyte barrier integrity
Direct effects of prednisolone on a monolayer of podocytes were investigated using Electric
Cell-Substrate Impedance Sensing (ECIS) which measures resistance across a monolayer of
podocytes over time. Higher resistance is a surrogate marker for higher barrier integrity. (A)
shows combined data from 3 separate experiments, normalised to the vehicle control. Data was
analysed using one way ANOVA followed by Tukey’s multiple comparison test. ***= adjusted
p value <0.0001. The grey dotted line surrounding each continuous coloured line denotes the
standard error of the mean (SEM). (B) shows a single, representative experiment with the time
of cell plating and cell treatment labelled.

110
Later studies looked directly at GR protein levels. Sathiyaa et al., exposed primary
cultures of trout hepatocytes to cortisol and found a significantly decreased GR protein
content at 24 hours of treatment (no earlier time points were examined).[446] In a
murine podocyte cell line, the effect of dexamethasone on GR protein expression was
examined at the 2 hour and 24 hour time point. Although no statistically significant
difference in GR protein expression was observed at 2 hours, levels were significantly
lower at 24 hours.[105] This decrease in GR protein level occurred without a change in
GR mRNA level, suggesting post-transcriptional processes are responsible for
autologous GR degradation. Xing et al., presented data using the human podocyte cell
line used in the current study.[102] The group examined a single time point at an
extended 14 days of culture in dexamethasone-containing medium and surprisingly
found an upregulation of GR expression levels. The discrepancy with the data presented
here may be due to the different length of the time course examined (48 hours compared
to 2 weeks).
Further work examining the mechanism of the ligand-dependent reduction in GR levels
has been performed in COS-1 (African Green monkey kidney) cells, which showed that
GR protein levels fall to 42% of control levels after 12 hours of treatment with
dexamethasone (no earlier time point was examined), and this downregulation was
blocked by a proteasome inhibitor.[301] This implicates the ubiquitin-proteasome
mediated degradation pathway as an important system in controlling GR expression
levels. Interestingly, phosphorylation of GR may be a key-step in initiating this process
as mutation of all phosphorylation sites in GR increased receptor half-life and abolished
ligand-dependent downregulation.[230]
Figure 3.1 shows a peak of GR phosphorylation at serine residue 211 at 2 hours
following exposure to prednisolone. As described in Section 1.6.4, phosphorylation of
human GR at serine 211 is induced by ligand binding, and is also associated with
increased transcriptional activity of GR, and translocation to the nucleus.[230] Results
from the present study are consistent with data from the murine podocyte cell line,
which showed at peak in phosphorylation at serine 220 at the 2 hour time point
following dexamethasone exposure.[105] Further data presented here suggesting the
GR-signalling pathway is intact in human podocytes includes the demonstration of GR

111
translocation from the cytoplasm to the nucleus, and activation of transcriptional output
of a known Gc-responsive gene following exposure to GR-ligand (Figure 3.2).
The vast majority of in vitro studies have used dexamethasone as the GR-ligand. I was
unable to identify any in vitro studies involving podocytes where prednisolone was
used. Key studies investigating the effects of dexamethasone on cells in vitro have used
a wide range of concentrations from 0.01µM [109] to 100 µM.[105] However, the most
commonly used concentration is 100nM (0.1µM).[447-450] A pharmokinetic study
found the mean peak plasma concentration of prednisolone in children with NS
following an oral dose of the pro-drug prednisone was 0.1µM.[245] However, in
another study involving 11 children with relapsed steroid-sensitive NS, the mean peak
serum concentrations of prednisolone following an intravenous (prednisolone) bolus
was approximately 3µM.[451] In vivo, it is unclear how the plasma concentration of
prednisolone relates to the Gc concentration of the ultrafiltrate surrounding the
podocyte, and how the 11 beta-hydroxysteroid dehydrogenase system affects this (see
Section 1.6.1.2). As the most common in vitro dose of dexamethasone used in the
literature is 0.1µM, and dexamethasone has been shown to be a ten-fold more potent
GR-agonist than prednisolone in luciferase transactivation assays (see Section
1.6.1.3),[263] a dose of 1µM prednisolone was used in the current study, unless
otherwise stated.
In this chapter, I characterised the GR isoform expression profile of human wild type
podocytes for the first time (Figure 3.3). It is already known that one single human GR
gene produces several GR isoforms through a combination of alternative splicing and
alternative translation initiation. Although GRα is the dominant, ubiquitously expressed
isoform, the other variants have differing tissue distribution patterns and transcriptional
regulatory patterns, and this may play a role in the cell-specific response to
glucocorticoids.[268, 452] By performing western blotting on total cell lysate from
human podocytes, I identify bands corresponding to GR-P (74 kDa) and GR-A (65 kDa)
in addition to GRα. GR-A and GR-P both have low transactivation activities and the
manner in which these may interact with GRα to control podocyte-specific responses to
Gc exposure is incompletely understood at present.[441] GR-P has been identified in
normal lymphocytes as well as several haematological tumour cells.[453] There is
controversy regarding its role in Gc-sensitivity, with some studies suggesting that it may
contribute to a Gc-resistant phenotype,[454] and others providing evidence that GR-P

112
can enhance the activity of GRα.[455] One study examining GR-A in human myeloma
cells suggested high expression levels may be associated with Gc-resistance.[453]
GR-ligands typically also have high affinity for MR. However, unlike GR, MR has a
tissue-restricted expression pattern (section 1.6.1.3). For example, within the kidney,
MR expression is found at high levels in the distal nephron, but several studies have
demonstrated that MR is not present in the human,[255, 261] and rabbit
glomerulus.[261] Figure 3.3 confirms the finding that podocytes express only low
levels of MR. These data suggest MR has a limited role in mediating the effects of Gc-
ligand within the glomerulus. However, definitive data to support this would require the
use of a MR-antagonist.
Although direct protective effects of Gc exposure on the murine podocyte actin
cytoskeleton in vitro have been demonstrated previously,[109] here I use the ECIS
assay to demonstrate that prednisolone exposure protects human podocytes from PAN-
induced damage, by using electrical resistance across a cell monolayer as a surrogate
marker of barrier integrity. This approach is strengthened by the recent insights
suggesting charge across the GFB in vivo contributes to normal functioning of the renal
filtration system (see Section 1.2.2.3). Figure 3.5 shows that Gc exposure increases
resistance across the podocyte cell layer compared to vehicle-treated cells in the
unchallenged state, and also provides protection against PAN-induce damage. This
demonstrates that, in vitro, Gc exposure can protect podocytes directly against a
damaging insult causing proteinuria in vivo, without involvement of immune cell
mediators. In the following chapters, I will provide data suggesting mechanisms
underpinning this podocyte-protective effect.

113
4 Glucocorticoid-regulated changes in podocyte
transcriptional output
4.1 Overview
The mechanism(s) whereby Gc-exposure results in beneficial clinical effects and altered
podocyte function remain poorly understood. GR is a transcription factor which is
activated by Gc-ligand binding, and this is the dominant signalling pathway whereby
glucocorticoids exert biologically-relevant actions.[456] In order to provide mechanistic
insight to understand Gc-effects on podocytes in vitro, I used microarray expression
analysis to identify Gc-regulated genes. Target genes subsequently underwent gene
ontology analysis to reveal key biological functions regulated by Gc-exposure. From the
biological functions identified by this analysis, I aimed to gain insight into mechanisms
underpinning the protective effect observed in podocytes following Gc-exposure.
Analysis of the microarray data highlighted some already well-characterised effects of
Gc exposure such as regulating apoptosis,[457] providing confidence the dataset was
robust. However, the anlaysis also revealed that Gc treatment exerted prominent effects
on genes regulating cellular motility. As described in Section 1.3.4, podocyte
hypermotility is associated with glomerular barrier dysfunction, and the microarray
results suggest that reversing the hypermotility phenotype may be a novel mechanism
whereby Gc-exposure exerts podocyte-protective effects.

114
4.2 Chapter-specific methods
4.2.1 Microarrays
Fully differentiated human wild type podocytes cultured in RPMI 1640 medium (see
Section 0) were treated with 1µM prednisolone or an equal volume (0.001%,v/v) of
methanol as a vehicle control for 5 hours at 37oC. Total cellular RNA was isolated using
the RNeasy mini kit with on-column DNase I digestion (Qiagen). RNA integrity was
assessed by a Nanodrop ND100 ultralow volume-spectrophotometer (Lab Tech)
followed by a 2100 Bioanalyser (Agilent). Only samples with an absorbance
260nm/280nm ratio 1.9-2.1 were processed further. Sample processing was performed
by Michal Smiga of the Genomic Technologies Core research facility (University of
Manchester). Total RNA from each sample was used to prepare biotinylated fragmented
complementary RNA according to the GeneChip® Expression Analysis Protocol
(Affymetrix). GeneChip® Human Genome U133A Plus 2.0 Array were hybridised and
scanned using the GeneArray® 2500, according to the GeneChip® Expression Analysis
Protocol (Affymetrix). Treatments were done in triplicates and the same batch of
microarrays was used for all treatments.
4.2.2 Data Analysis
Technical quality control and outlier analysis was performed with dChip (V2005)
(www.dchip.org)[458], using the default settings. Background correction, quantile
normalization, and gene expression analysis were performed using RMA in
Bioconductor.[459] To establish relationships and compare variability between patients,
principal components analysis (PCA) was used since this method is able to reduce the
effective dimensionality of complex gene-expression space without significant loss of
information.[460] PCA was performed with Partek Genomics Solution (version 6.5,
Copyright 2010, Partek Inc.) Differential expression analysis was performed using
Limma using the functions lmFit and eBayes.[461] Gene lists of differentially expressed
genes were controlled for false discovery rate (fdr) errors using the method of q
value.[462] Probsets were selected for further analysis if the fold-change was >1.5 and q
value <0.05. Gene ontology anlaysis was performed using Ingenuity® Pathway Analysis
software.

115
4.3 Results
4.3.1 Initial processing of microarray data
In order to understand Gc-effects on the podocyte in vitro, the transcriptional output of
fully differentiated wild-type human podocytes following a 5 hour treatment with either
prednisolone or vehicle was performed using whole-genome Affymetrix U133 Plus 2.0
Arrays. The 5 hour time point was chosen to ensure primary-response genes were
analysed.[107] Triplicate samples for each condition were analysed. Probe intensity
levels were similar between all arrays as shown by the box-plot in in Figure 4.1-A and
the close overlap between arrays in the histogram in Figure 4.1–B. These results
suggest none of the arrays contained a spacial artifact or abnormally high background
interference. Principal component analysis revealed a clear separation between
prednisolone- and vehicle-treated samples (Figure 4.1-C). These results indicated good
technical quality of the data, and therefore indicated that further analysis was warranted.
In order to derive a list of Gc-regulated genes, transcripts showing a fold change of
>1.5 fold (either up or down) and a q-value of <0.05 were considered to be significantly
altered between vehicle and Gc conditions, in line with other Gc-microarray
studies.[107, 463] The volcano plot in Figure 4.2-A shows the distribution of Gc-
regulated transcripts in relation to the total transcript population detected. This cut-off
resulted in 606 significantly altered transcripts/probe set identifiers (ids) corresponding
to 397 unique genes [full details in Compact Disc 1 (back cover insert)]. The difference
between 606 and 397 is due to probe-set redundancy, as shown in Figure 4.2. 267/397
genes were upregulated, while 130/397 showed reduced expression following treatment
with Gc (Figure 4.2-C).
The list of 397 Gc-regulated genes was analysed using Ingenuity Pathway Analysis®
(IPA®) software. IPA software is underpinned by the Ingenuity® Knowledge Base,
which is a highly curated repository of biological interactions, allowing modelling of
relationships between observed, experimental transcriptional changes and how these
may impact biological functions in vivo and in vitro.
IPA® also can also independently identify upstream regulators and predict whether they
are activated or inhibited, given the observed gene expression changes in the
experimental dataset. The expected causal effects are derived from the literature
compiled in the Ingenuity® Knowledge Base. The analysis examines the known targets

116
of each upstream regulator (UR) in the data submitted by the user, and compares the
targets’ actual direction of change to the predicted direction of change derived from the
literature, then issues a prediction for each upstream regulator. An ‘upstream regulator’
in this context covers the range of molecules found in the literature, including
transcription factors, cytokines, microRNAs, kinases chemicals and drugs. For each
potential UR two statistical measures, an overlap p-value and activation z-score are
computed. The overlap p-value identifies likely upstream regulators based on significant
(p value <0.01) overlap between dataset genes and the genes that are regulated by a
regulatory molecule. The activation z-score is used to infer the activation states of
predicted upstream regulators (ie, whether the observed transcriptional dataset is best
explained by activation or inhibition of a particular regulator). When the list of Gc-
regulated genes from the current study were analysed in IPA®, activated GR was clearly
identified as the UR which best explained the gene changes observed in the dataset,
with a p-value of overlap of 3x10-12 and an z-activation score of 4.1 (Table 4.1). This
provided further confidence that the dataset was suitable for further analysis, and
reflected changes caused by GR activation. The top 10 most upregulated and
downregulated genes are listed in Table 4.2.

117
Figure 4.1 Quality control of microarray data
Microarray analysis using biotin-labelled complementary RNA derived from human podocytes
following 5 hour treatment with either vehicle (arrays 1,3,5) or prednisolone (arrays 2,4,6) was
performed using Affymetrix U133 Plus 2.0 arrays. (A) boxplot comparing probe intensity levels
between arrays of the dataset. Either end of the box represents the upper and lower quartile. The
line in the middle of the box represents the median. Horizontal lines connected to the box by
‘whiskers’ indicate the largest and smallest values not considered outliers. (B) histogram of
probe density compared to probe intensity. (C) Principal component analysis (PCA) of array
data.

118
Figure 4.2 Identification of Gc-regulated genes
A fold-change in transcript expression of ±1.5 and a q-value of <0.05 between vehicle- and
prednisolone-treated samples was considered significant, and this defined the list of Gc-
regulated genes. (A) is a volcano plot showing the distribution of Gc-regulated transcripts. (B)
and (C) are pie-charts showing the number of Gc-regulated transcripts and unique genes,
respectively.
0
1
2
3
4
5
6
-3 -2 -1 0 1 2 3 4

119
Table 4.1 Upstream regulator analysis using IPA® software
A list of 397 genes identified as being ‘Gc-regulated’ following microarray analysis from samples
obtained from wild type podocytes underwent analysis using IPA® to independently identify likely
upstream regulators. Overlap p-values are used to quantify the significance of overlap between dataset
genes and genes known to be regulated by different upstream regulators. Activation z-scores infer the
likely activation state of regulators. This analysis was performed to understand which regulators would be
most likely to cause the transcriptional changes observed in the dataset, using data from existing
literature. GR was the regulator most likely to cause the observed changes, suggesting that the dataset is a
valid list of Gc-regulated genes, and warranted further analysis. NP=not predicted (insufficient/conflicting
data).
Upstream Regulator Molecule Type Predicted
Activation
State
Activation z-
score
p-value of
overlap
NR3C1
(Glucocorticoid receptor)
Ligand-dependent nuclear
receptor
Activated 4.149 3.00E-12
NFKBIA
(Nuclear factor of kappa light
polypeptide gene enhancer In
B-cells inhibitor, alpha)
Transcription regulator NP 0.064 4.00E-09
STAT3
(Signal transducer and activator
of transcription 3)
Transcription regulator NP 0.104 5.31E-09
NR3C2 (Mineralocorticoid
receptor)
Ligand-dependent nuclear
receptor
NP 1.213 6.48E-09
PGR (Progesterone receptor) Ligand-dependent nuclear
receptor
Activated 2.338 1.06E-08
CTNNB1
[Catenin (Cadherin-Associated
Protein), Beta 1]
Transcription regulator NP 0.942 1.38E-08
EZH2
(Enhancer Of Zeste 2 Polycomb
Repressive Complex 2 Subunit)
Transcription regulator NP -0.756 3.18E-08
FOXL2
(Forkhead Box L2)
Transcription regulator NP -0.451 2.12E-07
JUN
(Jun proto-oncogene)
Transcription regulator Np -1.347 5.64E-07
NFKB1
(Nuclear Factor Of Kappa Light
Polypeptide Gene Enhancer In
B-Cells 1)
Transcription regulator NP 0.095 6.38E-07

120
Table 4.2 Genes showing largest changes in transcription following Gc exposure
Microarray analysis was performed on human podocytes following 5 hour exposure to either
vehicle prednisolone. (A) shows genes that were mostly highly upregulated ; (B) shows genes
that were most strongly downregulated.
Gene Symbol Gene Name Fold
change
AREG Amphiregulin ↑ 8.028
PDK4 Pyruvate
Dehydrogenase
Kinase, Isozyme
4
↑ 6.738
KIAA1211L Uncharacterized
Protein
KIAA1211-Like
↑ 6.126
CCL20 Chemokine (C-C
Motif) Ligand 20
↑ 4.375
GILZ Glucocorticoid-
Induced Leucine
Zipper Protein
↑ 4.339
NPR3 Natriuretic
Peptide Receptor
3
↑ 4.265
FKBP5 FK506 Binding
Protein 5
↑ 4.248
SLC46A3 Solute Carrier
Family 46,
Member 3
↑ 3.899
IRS2 Insulin Receptor
Substrate 2
↑ 3.762
HPGD Hydroxyprostagla
ndin
Dehydrogenase
15-(NAD)
↑ 3.696
Gene Symbol Gene Name Fold
Change
IL11 Interleukin 11 ↓ 3.365
KRTAP1-1 Keratin Associated
Protein 1-1
↓ 3.192
TRPC4 Transient Receptor
Potential Cation
Channel,
Subfamily C,
Member 4
↓ 3.115
KMO Kynurenine 3-
Monooxygenase
(Kynurenine 3-
Hydroxylase)
↓ 2.852
MAB21L3 Protein Mab-21-
Like 3
↓ 2.710
IL1A Interleukin 1,
Alpha
↓ 2.570
KCTD4 Potassium Channel
Tetramerization
Domain Containing
4
↓ 2.519
TNFRSF11B Tumor Necrosis
Factor Receptor
Superfamily,
Member 11b
↓ 2.361
CYP1B1
Cytochrome P450,
Family 1,
Subfamily B,
Polypeptide 1
↓ 2.280
C4orf26 Chromosome 4
Open Reading
Frame 26
↓ 2.276
A. B.
121
4.3.2 Genes involved with tissue damage
The list of 397 Gc-regulated genes underwent toxicology analysis using IPA® software
to identify those genes involved in organ-specific tissue damage (in either a protective
or deleterious manner). The IPA® Knowledge Base contains a database of molecules
known to be involved with particular types of organ toxicity. Understanding which Gc-
regulated genes identified in my dataset have known roles in preventing (or causing)
kidney damage may help to develop an understanding of mechanism underpinning the
Gc-mediated protective effects on the kidney.
A key aspect of IPA® is its ability to predict the direction of change in a given
biological function elicited by changes in expression of particular genes using the
curated IPA® Knowledge Base, which is quantified by the z-score. In this context, if an
activating molecule of a particular biological process had increased gene expression,
that biological process would be expected to be enhanced (positive z-score).
Conversely, if an inhibitory molecule of particular biological process had increased
gene expression, that biological process would be expected to be reduced (negative z
score). IPA® only makes predictions concerning the direction of change in biological
processes with activation scores either ≤2 or ≥2.
Genes from the Gc-regulated list identified by IPA® as having roles in kidney-specific
damage are shown in Table 4.3. Figure 4.3 represents the tissue-type and disease
processes with which genes from the dataset involved with tissue damage are involved.
The top-ranking kidney-specific terms are ‘glomerular injury,’ ‘kidney failure’ and
‘renal fibrosis.’ In order to ascertain whether effects on the kidney were predicted to be
beneficial or damaging, pathway analysis was performed (Figure 4.4). This analysis
links changes in experimentally-observed gene expression to predictions in changes of
biological function. IPA predicted the changes in expression levels observed in the
microarray dataset would have effects on six kidney-related terms (ie, z-activation score
≤2 or ≥2): all six kidney toxicology terms were predicted to be inhibited (exact
activation z-scores are provided in Table 4.3). These data further underscore the
protective effects of Gc-exposure on the kidney.

122
Figure 4.3 Predicted effects of microarray-determined transcriptional changes on organ
toxicity
Gc-regulated genes were identified by microarray analysis on human wild type podocytes. The
IPA® Knowledge Base contains a dataset of genes known to be involved with various types of
organ-damage (toxicology lists). To understand if the genes identified in the microarray had
known roles in specifically reducing kidney damage, the dataset was analysed to produce a list
of organ-specific toxicology terms known to be affected by the genes in the dataset. The bar
chart displays these terms in order of statistical significance. Terms in red denote kidney-related
terms. The orange line denotes a threshold significance value corresponding to a p-value of
0.05.
Cardiac hypertrophy
Increased levels of alkaline phosphatase
Cardiac fibrosis
Glomerular injury
Kidney failure
Renal fibrosis
Heart failure
Cardiac congestive cardiac failure
Cardiac arteriopathy
Liver damage
Congenital heart anomaly
Liver fibrosis
Renal inflammation
Renal nephritis
Liver steatosis
Pulmonary hypertension
Increased levels of LDH
Renal proliferation
Renal necrosis/cell death
Renal damage
-log(p-value)

123
Figure 4.4 Pathway analysis for kidney-specific toxicology terms
IPA® software was used to predict whether the transcriptional changes observed in the
microarray dataset would have beneficial or deleterious effects on kidney function. Gc-regulated
genes from the dataset, identified using IPA® Knowledge Base as having a role in kidney
damage, are displayed around the outside circle. Toxicology-terms are displayed in the central
circle. Out of the nine toxicology terms identified, changes observed in the microarray dataset
were predicted to have a beneficial effects on six of them (coloured blue) ; IPA did not make a
prediction about the change in direction of the remaining two terms (coloured white).
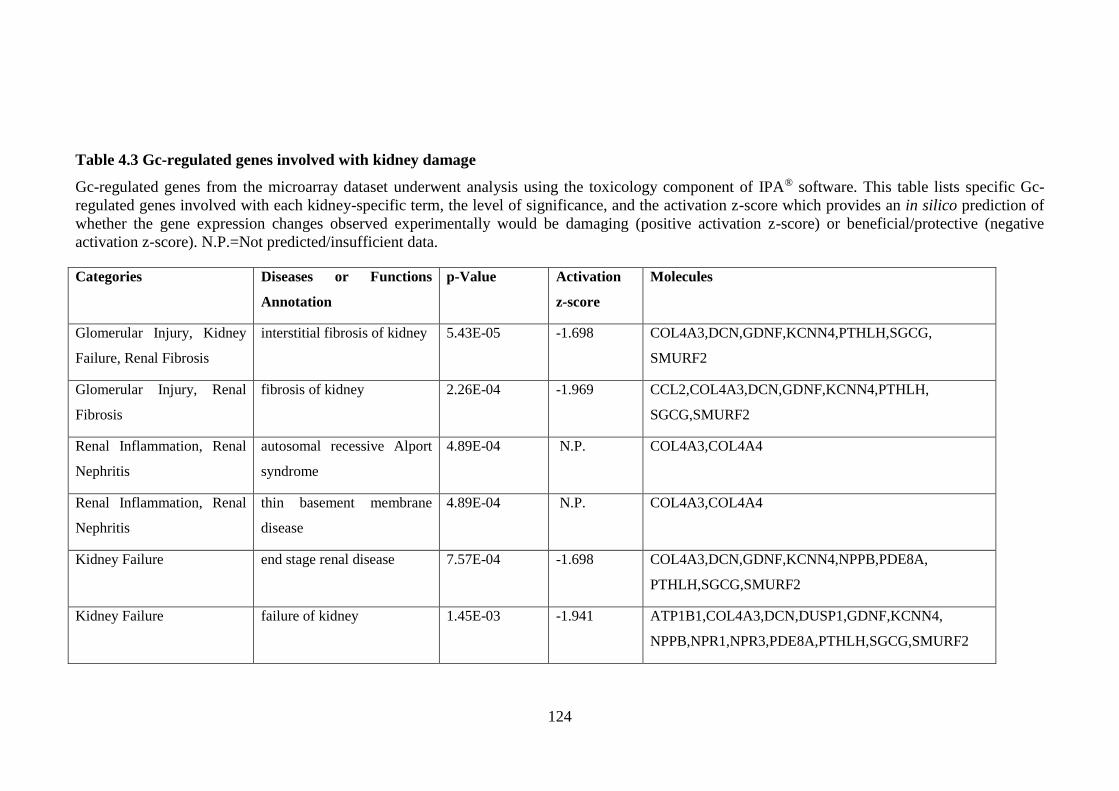
124
Table 4.3 Gc-regulated genes involved with kidney damage
Gc-regulated genes from the microarray dataset underwent analysis using the toxicology component of IPA® software. This table lists specific Gc-
regulated genes involved with each kidney-specific term, the level of significance, and the activation z-score which provides an in silico prediction of
whether the gene expression changes observed experimentally would be damaging (positive activation z-score) or beneficial/protective (negative
activation z-score). N.P.=Not predicted/insufficient data.
Categories Diseases or Functions
Annotation
p-Value Activation
z-score
Molecules
Glomerular Injury, Kidney
Failure, Renal Fibrosis
interstitial fibrosis of kidney 5.43E-05 -1.698 COL4A3,DCN,GDNF,KCNN4,PTHLH,SGCG,
SMURF2
Glomerular Injury, Renal
Fibrosis
fibrosis of kidney 2.26E-04 -1.969 CCL2,COL4A3,DCN,GDNF,KCNN4,PTHLH,
SGCG,SMURF2
Renal Inflammation, Renal
Nephritis
autosomal recessive Alport
syndrome
4.89E-04 N.P. COL4A3,COL4A4
Renal Inflammation, Renal
Nephritis
thin basement membrane
disease
4.89E-04 N.P. COL4A3,COL4A4
Kidney Failure end stage renal disease 7.57E-04 -1.698 COL4A3,DCN,GDNF,KCNN4,NPPB,PDE8A,
PTHLH,SGCG,SMURF2
Kidney Failure failure of kidney 1.45E-03 -1.941 ATP1B1,COL4A3,DCN,DUSP1,GDNF,KCNN4,
NPPB,NPR1,NPR3,PDE8A,PTHLH,SGCG,SMURF2

125
Glomerular Injury glomerulosclerosis 1.77E-03 -1.968 CCL2,COL4A3,DCN,GDNF,HBEGF,KCNN4,
PTHLH,SGCG,SMURF2
Glomerular Injury bleeding of renal glomerulus 2.85E-03 N.P. COL4A3,FOXC2
Renal Inflammation, Renal
Nephritis
Nephritis 4.99E-03 -1.429 COL4A3,COL4A4,CSF2,DCN,DKK1,GADD45B,
GDNF,HBEGF,SERPINE1,SMURF2,TNFAIP3,
VCAM1
Renal Proliferation proliferation of glomerular
cells
6.23E-03 -1.98 DCN,DUSP1,IL1B,PLAU,PTHLH
Renal Proliferation proliferation of kidney cells 6.33E-03 -1.446 DCN,DUSP1,GDNF,IL1B,PLAU,PTHLH
Renal Inflammation, Renal
Nephritis
tubular nephritis 6.92E-03 N.P. COL4A3,DCN
Renal Necrosis/Cell Death cell death of kidney cells 7.56E-03 -0.345 AREG,BCL2A1,BIRC3,CFLAR,CRYAB,DCN,
DUSP1,EMP1,HIPK2,IL1B,PTHLH,RASSF4,
SLC47A1,TCF4,TNFRSF19,TNFSF10,UNC5A
Renal Damage damage of kidney 8.41E-03 0 DKK1,DUSP1,HBEGF,IL1R1,ITGB6,POU2F2,
RGCC,SERPINE1
Glomerular Injury formation of glomerular
crescent
9.29E-03 N.P. COL4A3,PLAU,SERPINE1

126
4.3.3 Predicted Gc-effects on biological function
In order to understand the biological processes regulated by Gc exposure in the
podocyte, the Gc-regulated list of genes derived from the microarray study underwent
gene ontology analysis using IPA®. Individual genes in the Gc-regulated gene list will
have one or more known biological functions identified using the IPA® Knowledge
Base. If enough genes with the same biological function are found in the gene list, that
biological function was considered to be enriched. Understanding the key biological
functions that Gc regulates in the podocyte may help to identify mechanisms
responsible for the protective effect exerted by Gc during periods of glomerular
filtration barrier dysfunction.
Figure 4.5 displays the biological functions linked to the gene expression changes
ranked in order of statistical significance (using the search term ‘molecular and cellular
functions’). As expected, these data show that glucocorticoids regulate a wide variety of
functions within the cell including growth, apoptosis and metabolism. However,
unexpectedly, ‘cellular movement’ was a highly ranked term (third overall). As it is
already known that a hypermotile podocyte phenotype is associated with proteinuria in
vivo (see Section 1.3.4), this in silico prediction of an effect of Gc exposure on podocyte
motility was intriguing, and I decided to pursue this further.
Gene ontology analysis in IPA® can also be used to understand which diseases and
general physiological functions are altered by the changes observed in the dataset.
Figure 4.6 displays the results of expanding the gene ontology analysis to include all
three gene ontology terms available on IPA®, viz., ‘disease and disorders,’ ‘molecular
and cellular functions’ and ‘physiological system development and function’ with an
example of a pathway analysis relevant to each displayed significant term. This
highlights the wide range of effects that glucocorticoids exert on tissues, including roles
in cancer and apoptosis. These findings are consistent with the clinical use of Gc-
therapy as the cornerstone of lymphoid cancer treatment.[457]
Gc-regulated genes involved with cellular movement identified by IPA® are displayed
in Figure 4.7 and Supplementary Table 10.1. As described in Section 1.3.4, gene
effects on motility are highly cell-specific. As the IPA® Knowledge Base is based on the
general scientific published literature (ie, not podocyte-specific), predictions regarding
the direction of change in cellular movement (ie, increasing or decreasing) are difficult
to interpret. As shown in Figure 4.7, Table 4.4 and Supplementary Table 10.1, many

127
of the individual Gc-regulated genes have predicted antagonistic effects on cellular
movement, and the net effect cannot be accurately predicted from this in silico analysis.
These data can alternatively be visualised with a gene ontology heat map as shown in
Figure 4.8. The parent gene ontology term ‘cellular movement’ is sub-divided into
smaller boxes each corresponding to a lower-order gene ontology term (eg, migration of
smooth muscle cells). Each of these smaller boxes is coloured according to activation z-
score, providing an in silico prediction of whether the transcriptional changes observed
in the microarray dataset would be expected to increase or decrease cellular motility
relating to the corresponding lower order term. Out of the 46 lower-order cellular
motility terms recognized by IPA as being significantly enriched in the current dataset,
29/46 were predicted to be inhibited by the changes observed in the microarray (ie,
reducing cellular movement), 10/46 were predicted to be enhanced by the observed
changes, and IPA did not make a prediction for 7/46 terms. Although this provides a
very weak prediction that the observed transcriptional changes in the microarray dataset
would overall act to reduce cellular motility, it needs to be emphasised again that this in
silico prediction relied on existing published general literature and is not podocyte-
specific.
IPA® software also helps to generate hypotheses for how a phenotype is altered by
experimentally-observed transcriptional changes, using an algorithm based on pre-
established connections known from the published literature. In order to understand
how the Gc-responsive regulators of cellular motility may be exerting phenotypic
change, I performed IPA® downstream analysis. This provided a visual representation
of known links between genes in my dataset on effects on cellular motility in a range of
cell types. These data ares shown in Figure 4.9.

128
Figure 4.5 Bar chart illustrating Gc-effects on podocyte cellular functions
Podocyte Gc-regulated genes identified by microarray analysis underwent gene ontology
analysis with IPA® software using the term ‘molecular and cellular functions.’ Enriched terms
are listed in order of significance. The orange line denotes a threshold level of significance
corresponding to a p-value of 0.05. ‘Cellular movement’ was a term selected for further analysis
and is highlighted in red.

129
Figure 4.6 Expanded gene ontology anlalysis of microarray results.
Legend on next page.

130
Gc-regulated genes were identified by comparing the transcriptional output of vehicle- and
prednisolone- treated human podocytes using microarray technology. This list of genes
underwent gene ontology analysis using the following terms: ‘disease and disorders,’
‘molecular and cellular functions’ and ‘physiological system development and function’ to
understand the range of processes regulated by Gc. Significantly enriched terms are
displayed, with the size of each box being inversely proportional to the p-value. Each
displayed term has a pathway analysis example contained within the box, illustrating the
relationship between transcriptional changes and effects on lower-order gene ontology
terms.

131
Figure 4.7 Gc-regulated genes with known connection to cellular movement
Chart displaying Gc-regulated genes from the microarray analysis identified by IPA® as having
a role in cellular movement, as established by existing scientific literature. Chart also shows
direction in change of expression for each gene observed in the microarray dataset, and provides
an in silico prediction of how this observed change in gene expression will affect cellular
movement.

132
Table 4.4 Activation z-scores of cellular movement gene ontology terms
Figure 4.7 illustrates genes from the microarray dataset involved with cellular motility. This
table provides activation z-scores quantifying in silico predictions generated by IPA® software
of whether Gc-effect on the podocyte are pro-migratory (positive activation z-scores) or anti-
migratory (negative activation z-scores).
Categories Functions annotation p-value Activation z-score
Cellular
Movement cell movement
1.72E-
11 0.728
Cellular
Movement invasion of cells
1.86E-
10 -1.395
Cellular
Movement migration of cells
3.92E-
09 0.302
Cellular
Movement invasion of tumor cell lines
1.37E-
08 -1.187
Cellular
Movement cell movement of tumor cell lines
2.64E-
08 0.1
Cellular
Movement migration of tumour cell lines
2.23E-
06 -0.674

133
Activation z-score
Figure 4.8 Gene ontology heatmap
Legend on next page.

134
Gc-regulated genes identified by microarray experiments underwent gene ontology (GO) analysis using the following GO terms:
‘disease and disorders,’ ‘molecular and cellular functions’ and ‘physiological system development and function.’ The size of the
box is inversely proportional to the level of significance; significantly enriched parent GO terms form the large boxes. Each
large parent GO term box is subdivided in smaller boxes representing lower-order terms, relating to the parent term. Each of
these smaller boxes is coloured according to the activation z-score (ie, an in silico prediction of the change in direction for that
GO term elicited by the expression changes from the microarray datset). Gene ontology heat maps represent not only which GO
terms are enriched, but also whether each GO term is predicted to be up- or –downregulated following Gc-exposure.

135
Figure 4.9 Example of how observed microarray changes may relate to changes in cellular motility IPA® software connects upstream regulators, experimentally observed changes in gene expression following Gc-exposure to provide in silico
predictions of how these may affect cell phenotype. This diagram represents an example of how Gc-regulated genes observed in my dataset may
alter cellular motility.

136
4.4 Discussion
The mechanism(s) underlying the ability of glucocorticoids to protect podocytes from
damage is poorly understood. In order to provide insight into potential mechanisms
underlying these direct protective effects, I identified Gc-regulated genes using
microarray analysis following a 5 hour exposure of human, wild type AB podocytes to
either vehicle or prednisolone. This revealed a list 397 genes whose expression changed
significantly following Gc treatment. Initial analysis involved identification of Gc-
regulated genes involved with aspects of kidney tissue damage. In silico predictions
using IPA software® suggest Gc-exposure would have direct protective effects on the
kidney. This supports existing literature, as well as data provided in Chapter 3 of the
current study.[109, 110]
Subsequent gene ontology categorisation of the microarray dataset illustrated Gc-
regulated gene involvement in a diverse range of cellular functions (Figure 4.5), and
suggested a prominent role for effects on cellular motility, which was the third most
significantly enriched gene ontology term. Recent data have highlighted that podocyte
hypermotility is a feature of a dysfunctional renal filtration barrier disease (see Section
1.3.4); it is thus possible that glucocorticoids may exert a protective effect on podocytes
by reversing this hypermotility phenotype.
In the present study, I identified direct Gc-gene targets using a short exposure (5 hours)
of the GR-agonist prednisolone to fully differentiated (differentiation time of 14 days)
human podocytes. Cheng et al., have previously used a microarray approach to
investigate the effect Gc-treatment has on podocyte differentiation. The group identified
direct and indirect Gc-targets using a prolonged 3 day exposure of the GR-agonist
dexamethasone to minimally differentiated (differentiation time 2 days) AB
podocytes.[107] In a similar fashion to the current study, “negative regulation of smooth
muscle cell migration” was identified as an enriched gene ontology term following
treatment with Gc.
Table 4.5 details examples of other studies examining whole-genome changes in gene
expression following treatment with a variety of GR-agonists, in various cell lines, for
variable lengths of treatment. ‘Cellular motility’ has been identified as an enriched
gene-ontology term in Gc-regulated genes in human primary monocytes and an
137
endometrial cancer cell line, but not in an A549 lung cancer cell line or in lens epithelial
cells.
Although analysis of the microarray data strongly suggests prednisolone exposure
affects podocyte motility in vitro, whether this would be a pro-migratory or anti-
migratory effect is difficult to determine from this analysis alone. The cell type-specific
nature of motility regulation combined with the antagonistic effects resulting from the
in silico predictions suggest experimental, podocyte-specific, validation of Gc-effects
on motility are warranted. This validation is the subject of the following chapter.

138
Table 4.5 Examples of published studies identifying Gc-regulated genes
In the current study, genes whose expression significantly changed following a 5 hour treatment
with the GR-agonist prednisolone using the human podocyte cell line. Here, I provide examples
of other studies examining genome-wide changes in gene expression in a variety of cell types,
using different GR-ligands and for variable lengths of treatment.
Cell-type GR-agonist Length of
treatment
with GR-
agonist
Number of
Gc-
regulated
genes
identified
Cell
motility
identified
as enriched
gene
ontology
term
Reference
Human AB
podoctyte cell line
(Differentiating)
Dexamethasone 3 days 517 [107]
Human primary
peripheral
monocytes
Fluticasone 16 hours 133 [464]
Human uterine
endometrial cancer
cell line (ECC1
cells)
Dexamethasone 6 hours 1802 [465]
Human primary
lens epithelial cells
Dexamethasone 4 and 16
hours
4 hour
treatment-
136 genes ;
16 hours- 86
genes
[466]
Human
adenocarcinomic
alveolar basal
epithelial cell line
(A549 cells)
Dexamethasone 1 hour 234 [449]

139
5 Glucocorticoid effects on podocyte motility
5.1 Overview
In the previous chapter, gene ontology analysis of glucocorticoid (Gc)-regulated genes
suggested that Gc exposure may be exerting effects on podocyte motility. In this
chapter, I present data examining Gc effects on podocyte motility using complementary
in vitro assays. Live-cell imaging of podocytes coupled with tracking analysis using
MTrackJ/ImageJ software confirmed that Gc-exposure does indeed reduce the speed of
podocytes and also causes podocytes to adopt more directionally persistent movement.
To gain insight into how Gc-exposure may be causing a change in podocyte motility, I
focussed on two small GTPases, Rac1 and RhoA, which exert mutually antagonistic
effects on cell movement (see Section 1.7.6). These small GTPases cycle between an
inactive, guanosine diphosphate (GDP)-bound form, and an active, guanine triphosphate
(GTP)-bound form. Active Rac1 stimulates the formation of pro-migratory
lamellipodial cell protrusions,[407] while active RhoA stimulates stress-fibre
formation.[382] Data presented here suggest that Gc exposure reduces Rac1 activity in a
time-dependent manner.
As podocyte hypermotility has been associated with the development of
proteinuria,[132] and Rac1 overactivity has been implicated in the development of
chronic kidney disease,[406] the observation that Gc exposure reduced podocyte
motility and Rac1 activity suggested some of the protective effects of Gc on podocytes
may be through reducing Rac1 activity. I subsequently showed that damaging
podocytes by exposure to puromycin aminonucleoside (PAN) increases Rac1 activity,
before investigating whether inhibiting Rac1 activity has any direct, protective effect on
podocytes against PAN-damage. Using the electric cell substrate impedance sensing
(ECIS) assay (see Section 2.10), which uses electrical resistance across a monolayer of
podocytes as a surrogate marker for barrier integrity, I demonstrated that Rac1
inhibition using the small molecule EHT 1864 does indeed increase electrical resistance
compared to cells treated with PAN alone, and interestingly Rac1 inhibition and Gc in
combination seem to exert a cumulatively protective effect. This suggests that Rac1
inhibitors and downstream effectors of the Rac1 pathway may be useful starting points
for future in vitro and animal studies investigating novel anti-proteinuric therapeutic
strategies.

140
5.2 Chapter-specific methods
5.2.1 Live cell imaging
Differentiated wild type podocytes were seeded at a density of 5,000 cell/mL per well in
a 24 well cell culture cluster plate (Costar). Two wells were used for each treatment
condition. Cells were then filmed using an AS MDW live cell imaging system (Leica)
with a 5x/NA 0.15 HC Plan Fluotar air objective (magnification 1.5x). Point visiting
was used to allow multiple positions to be imaged within the same time course, and
cells were maintained at 37oC and 5% (vol/vol) CO2. Images were collected using a
Coolsnap HQ camera, and six movies (3 movies per well) were generated for each
condition. To assess cell migration, the speed and directionality of 120 cells per
condition (20 cells per movie) was measured using the MTrackJ plug-in of ImageJ. Cell
tracking was performed over a 24-hour period.
5.2.2 Rac1 activity assay
Active Rac1 was affinity purified from lysates using an effector pull-down approach
with GST-PAK beads. Cells were serum starved for 24 hours before treatment. At the
relevant time, cells were lysed in ice-cold lysis buffer [20mM Hepes pH 7.5, 140mM
NaCl, 1% (v/v) Igepal, 4mM EDTA, 4mM EGTA, 0.5% (wt/vol) sodium deoxycholate,
10% (vol/vol) glycerol] supplemented with EDTA-free protease inhibitor tablets
(Roche). Lysates were clarified by centrifugation at 12,000 g, 4oC for 5 minutes prior to
snap-freezing in liquid nitrogen to preserve GTPase-activity while other batched
samples were processed.
Thawed lysates were then incubated with 20µg GST-PAK beads (Cytoskeleton) for 1
hour at 4oC. Beads were washed three times with ice-cold lysis buffer, and active Rac1
was eluted off beads by addition of Laemmli reducing sample buffer. For each
condition, equal volumes of GTP-Rac1 eluted from the GST-PAK beads, and equal
volume of ‘total’ extract obtained prior to snap-freezing were resolved by SDS-PAGE
and analysed by Western blotting. The ratio between GTP-Rac1 and total Rac1 was
quantified to determine the Rac1 activation state.
5.2.3 RhoA activity assay
Active RhoA was affinity purified from lysates using an effector pull-down approach
with Rhotekin RBD beads. Cells were serum starved for 24 hours before treatment. At
the relevant time, cells were lysed in ice-cold lysis buffer[50mM Tris pH 7.5, 10mM

141
MgCl2, 0.5M NaCl, and 2% (vol/vol) Igepal] supplemented with protease inhibitor
cocktail (Cytoskeleton). Lysates were clarified by centrifugation at 10,000g, 4oC for 1
minute prior to snap-freezing in liquid nitrogen to preserve GTPase-activity while other
batched samples were processed.
Thawed lysates were then incubated with 50µg Rhotekin RBD beads (Cytoskeleton) for
1 hour at 4oC. Beads were washed once with ice-cold wash buffer (25mM Tris pH 7.5,
30mM MgCl2, 40 mM NaCl), and active RhoA was eluted off beads by addition of
Laemmli reducing sample buffer. For each condition, equal volumes of GTP-RhoA
eluted from the Rhotekin-RBD beads, and equal volume of ‘total’ extract obtained prior
to snap-freezing were resolved by SDS-PAGE and analysed by Western blotting. The
ratio between GTP-RhoA and total RhoA was quantified to determine the RhoA
activation state.

142
5.3 Results
5.3.1 Gc effects on podocyte motility
To validate the findings of the microarray and subsequent gene ontology analysis
suggesting Gc exposure affects podocyte motility, live-cell imaging of podocytes over a
24 hour period was performed. Representative movies are provided in Compact Disc 1
(back cover insert). The imaging commenced 24 hours after treatment with Gc.
Podocytes in these movies were manually tracked using the MTrackJ plugin on ImageJ
software to generate quantifiable data for analysis.
As shown in Figure 5.1-A, Gc-exposure reduced the mean speed of podocytes over the
24 hour period by approximately 36%, from 0.0053 µm/sec (vehicle-treated) to 0.0034
µm/sec (Gc-treated). Confidence in the assay was enhanced by the observation that
damaging podocytes with PAN caused a statistically significant increase in podocyte
motility from 0.0053 µm/sec (vehicle-treated) to 0.0063 µm/sec (PAN-treated).
Interestingly, the hypermobile PAN-treated podocytes also responded to Gc-treatment
by reducing speed from 0.0063 m/sec (PAN-treated) to 0.0035 µm/sec (PAN+Gc-
treated).
To determine if Gc-treatment also affected the directional persistence of podocyte
movement, the ratio of the Euclidean distance travelled by each podocyte (ie, distance
between the starting and final point of each track) compared to the total distance
travelled was calculated. A cell persistence ratio of 1 corresponds to a cell that travels in
a perfectly straight line during the whole period of imaging, while a ratio tending
towards 0 would imply a cell constantly changing direction. Figure 5.1-B shows a very
modest, but statistically significant increase in podocyte persistent movement from 0.50
(vehicle-treated) to 0.57 (Gc-treated). In order to visualise movement patterns of
podocytes in the different treatment conditions, rose plots were constructed which
displayed movement of individual cells over the imaging period using the x,y
coordinates generated by the tracking software (Figure 5.1C-F). Figure 5.1–G plots the
movement of PAN-treated cells and PAN+Gc treated cells on the same axes to
demonstrate the shorter distance travelled by PAN+Gc-treated podocytes during the
same time interval.
To ascertain Gc-effects on cell motility in the context of another podocyte-damaging
agent, the live cell imaging was repeated using lipopolysaccharide (LPS) instead of

143
PAN, with the remainder of the experimental design remaining the same. The results are
shown in Figure 5.2. The manual cell tracking in this experiment was performed by a
different individual to reduce the risk of observer-bias.
Figure 5.2-A again shows a reduction in podocyte motility following Gc-treatment.
Here, a 51% decrease in podocyte speed was observed: from 0.021 µm/sec (vehicle-
treated) to 0.010 µm/sec (Gc-treated). LPS-exposure also increased podocyte motility
from 0.021 µm/sec (vehicle-treated) to 0.031 µm/sec (LPS-treated). The hypermobile
LPS-treated podocytes displayed reduced motility when LPS was co-administered with
Gc (0.014 µm/sec). Also, Gc-treated podocytes (cell persistence ratio 0.58) showed a
small increase in persistence compared to vehicle-treated podocytes (0.51), and LPS-
treated podocytes displayed reduced directional movement (0.43).
To determine the time taken for Gc to have an effect on podocyte motility, another set
of live-cell imaging experiments was performed comparing vehicle- and Gc-treated
podocytes during the first 24 hours following treatment. Figure 5.3-B shows the
instantaneous speed of podocytes at each time point. The first statistically-significant
difference in the mean speed of the vehicle- and Gc-treated podocyte populations
occurred 120 minutes following treatment (p-value 0.013). The statistical significance
of this difference had increased at the 180 minute time-point (p value 0.0004) and again
at the 220 minute time-point (p value <0.0001).

144
Figure 5.1 Effects of Gc and puromycin aminonucleoside exposure on podocyte motility
Legend on next page
Veh
icle G
cPAN
PAN+G
c
0.0
0.2
0.4
0.6
0.8
Cell
Pers
iste
nce
(no
un
its)
**
N.S.
N.S.
-500
-400
-300
-200
-100
0
100
200
300
400
-300 -200 -100 0 100 200 300 400 500
-40 0
-30 0
-20 0
-10 0
0
10 0
20 0
30 0
40 0
50 0
-60 0 -50 0 -40 0 -30 0 -20 0 -10 0 0 10 0 20 0 30 0 40 0
-300
-250
-200
-150
-100
-50
0
50
100
150
200
-500 -400 -300 -200 -100 0 100 200 300 400
-400
-300
-200
-100
0
100
200
300
400
500
-600 -500 -400 -300 -200 -100 0 100 200 300 400
Me
an
sp
eed
(µm
/se
c)
Veh
icle Gc
PAN
PAN+G
c
0.000
0.002
0.004
0.006
0.008
***
****
****
-250
-200
-150
-100
-50
0
50
100
150
200
250
-250 -200 -150 -100 -50 0 50 100 150 200 250 300

145
Microarray analysis of Gc-regulated genes from wild-type podocytes suggested Gc exposure
affected podocyte motility. In order to test this, live cell imaging of podocytes was performed
for a 24 hour period, beginning 24 hours following treatment. Subsequently, manual cell
tracking was performed using the MTrackJ plugin on ImageJ software to allow analysis of
podocyte speed and cell directional persistence. Each experiment consisted of tracking 120 cells
per condition. The experiment was performed 3 times. (A) quantifies mean podocyte speed over
the 24 hour period. (B) quantifies podocyte directional persistence. Rose plots were created for
each condition to visualize the path travelled for 20 cells (the path of each cell is marked with a
different colour). The x- and y-axis refer to x,y coordinates of each cell over time generated by
the cell tracking software: (C) vehicle-treated; (D) Gc-treated; (E) PAN-treated; (F) PAN+Gc-
treated. (G) is a rose plot comparing the movement of 10 PAN-treated podocytes (red)
compared with 10 podocytes treated with PAN+Gc (black) over the 24 hour period. Results
were analysed by one-way ANOVA followed by Dunnett’s multiple comparisons test. **=
adjusted p value 0.091; ***= adjusted p value 0.0003; ****= adjusted p value <0.0001. N.S.=
not significant. Error bars represent standard error of the mean.

146
Figure 5.2 Effects of Gc and lipopolysaccharide exposure on podocyte motility.
Legend on next page.
Veh
icle G
cLP
S
LPS+G
c
0.00
0.01
0.02
0.03
0.04
Mea
nsp
ee
d(µ
m/s
ec
)
****
****
****
Veh
icle G
cLP
S
LPS+G
c
0.0
0.2
0.4
0.6
0.8
Cell
Pers
iste
nce
(no
un
its)
***
**
N.S.
-1500
-1000
-500
0
500
1000
1500
2000
2500
3000
-1500 -1000 -500 0 5 00 1000 1500 2000 2500
-1 0 00
-5 00
0
5 00
1000
1500
-1 5 00 -1 0 00 -5 00 0 5 00 1 0 00 1 5 00
-2000
-1500
-1000
-500
0
500
1000
1500
2000
2500
-3000 -2000 -1000 0 1000 2000 3000 4000
-1500
-1000
-500
0
500
1000
1500
2000
-1000 -800 -600 -400 -200 0 200 400 600 800 1000 1200
-150 0
-100 0
-50 0
0
50 0
100 0
150 0
200 0
250 0
-300 0 -200 0 -100 0 0 100 0 200 0 300 0 400 0

147
Figure 5.1 shows analysis of effects of Gc and the podocyte-damaging agent puromycin
aminonucleoside (PAN) on podocyte motility. This figure shows analysis of the effects on
podocyte motility of Gc and another podocyte-damaging agent, lipopolysaccharide (LPS).
Again, live cell imaging was performed on wild type podocytes for a 24 hour period, beginning
24 hours after treatment. Each experiment consisted of tracking 120 cells per condition. The
experiment was performed three times. Manual tracking using ImageJ software was performed
by a different individual for the PAN- and LPS- experiments to reduce the risk of observer bias.
(A) quantifies mean podocyte speed over the 24 hour period. (B) quantifies podocyte directional
persistence. Rose plots were created for each condition to visualize the path travelled for 20
cells (the path of each cell is marked with a different colour). The x- and y-axis refer to x,y
coordinates of each cell over time generated by the cell tracking software: (C) vehicle-treated;
(D) Gc-treated; (E) LPS-treated; (F) LPS+Gc-treated. (G) is a rose plot comparing the
movement of 10 LPS-treated podocytes (red) compared with 10 podocytes treated with LPS+Gc
(black) over the 24 hour period. Results were analysed by one-way ANOVA followed by
Dunnett’s multiple comparisons test. ****=adjusted p value <0.0001; ***= adjusted p value
0.0009; **=adjusted p value 0.0027. N.S.= not significant. Error bars represent standard error
of the mean. I (JM) prepared the cells or the experiment, performed the video imaging and data
anlaysis. Ms. Cressida Moxey (University of Manchester Medical School) performed the
manual cell tracking.

148
Figure 5.3 Early effects of Gc on podocyte motility.
To analyse the length of time taken for Gc to affect podocyte speed, live cell imaging of WT
podocytes was performed in the 24 hour period following treatment. Each experiment consisted
of manually tracking 120 cells per condition using ImageJ software. The experiment was
performed twice. (A) shows the mean cell speed during the whole period of imaging. (B) shows
the instantaneous speed for the podocytes during the 24 hour period. Coloured arrows on the X-
axis refer to the level of significance of the difference between the means of cell speed between
vehicle- and Gc-treated cells. The first time of significant difference is shown by the arrow at
120 minutes. Results were analysed by two-way repeated measures ANOVA followed by
Šídák’s multiple comparisons test. *=adjusted p value 0.0134; ***=adjusted p value 0.0004;
****=adjusted p value <0.0001. Error bars represent standard error of the mean.
Mean
sp
eed
(µm
/sec)
Veh
icle
+Gc
0.000
0.002
0.004
0.006 *****

149
5.3.2 Gc effects on Rac1 and RhoA
The small GTPases Rac1 and RhoA are important regulators of cell motility and are
mutually inhibitory.[421] To understand if Gc action affected the activity of either of
these proteins, pull-down assays using beads specific for the active, GTP-bound protein
were performed, and the active protein component was normalised to the total (inactive
plus active) protein content. Data were obtained at the 3 hour time point as this
corresponded to the approximate time at which differences in cellular motility following
Gc-exposure were first observed in the live-cell imaging experiment (Figure 5.3), and
also at the 24 hour time point.
Figure 5.4-A shows that Gc reduced Rac1 activity at both the 3 hour time point and 24
hour time point compared to vehicle-treated cells harvested at the same time point.
Although RhoA showed a trend towards increased activity following Gc exposure, this
was not statistically significant (p value 0.9 at both 3 hour time point and 24 hour time
point). Gc exposure did not significantly affect total Rac1 or RhoA protein expression
(Figure 5.4 C-F).
As Gc-exposure reduced Rac1 activity, I investigated whether the converse was true by
performing pull-down assays for active Rac1 following 24 hours of PAN-exposure.
Indeed, PAN-damaged podocytes did show an increase in Rac1 activity following
treatment (Figure 5.5).
The association between a hypermobile podocyte phenotype and proteinuria has already
been established.[132] As Gc exposure resulted in reduced podocyte speed (Figure 5.1)
and reduced activity of the pro-migratory regulator Rac1 (Figure 5.4), I investigated
whether inhibiting Rac1 with the small molecule EHT 1864 may have any protective
function on podocytes against PAN-induced damage. To do this, I returned to the
electric cell substrate impedance sensing assay (ECIS) used in Chapter 3, which
measures electrical resistance across a monolayer of podocytes. Electrical resistance is
used as a surrogate marker for barrier integrity, with higher electrical resistance
implying higher barrier function. In accordance with other studies, a dose of 30µM EHT
1864 was used.[467] Figure 5.6 demonstrates that podocytes simultaneously treated
with PAN and EHT 1864 had higher trans-barrier electrical resistance compared to
podocytes treated with PAN alone (p value <0.0001). Also, the electrical resistance
across a podocyte cell layer exposed to PAN was higher when EHT 1864 and Gc were

150
co-administered, compared to when either Gc or EHT 1864 were used as single
treatments (p value <0.0001).

151
Figure 5.4 Gc effects on Rac1 and RhoA activity and expression.
To understand effects of Gc exposure on the activity of two key regulators of cell motility, Rac1
and RhoA, pull-down assays using beads specific for the active form of these proteins was
performed. This allowed quantification of the active protein : total protein. (A) demonstrates
Rac1 activity at 3 hours and 24 hours following Gc exposure. (B) demonstrates RhoA activity at
3 hours and 24 hours following Gc exposure. Results were analysed using the nonparametric
Mann-Whitney U test: vehicle-control treated cells were compared with Gc-treated cells at the 3
hour time point, and separate vehicle-control treated cells were compared with Gc-treated cells
at the 24 hour time point for each experiment. The experiment was performed at least six times.
N.S.= not significant. Western blot (C) and quantification (D) of total Rac1 expression
following Gc exposure (n=3), and western blot (E) and quantification (F) of RhoA expression
(n=2), showed no significant change in expression following analysis using one way ANOVA
and Dunnett’s multiple comparisons test for any time point measured. Error bars represent
standard error of the mean.
+Gc
3hrs
+Gc
24hrs
-2
0
2
Fo
lcch
an
ge
Rac1
acti
vit
yV
s.
-Gc
p= 0.0002p=0.0361
* ***
Fo
lcch
an
ge
Rh
oA
acti
vit
yV
s.
-Gc
+Gc
3hrs
+Gc
24hrs
0
1
2
3
4
N.S.
N.S.
Veh
icle
Gc+
2hr
Gc+
6hr
Gc+
12hr
Gc+
24hr
0.0
0.5
1.0
1.5
2.0
Rac1
exp
ressio
n(f
old
ch
an
ge)
Vehic
le
Gc+
2hr
Gc+
6hr
Gc+
12hr
Gc+
24hr
0
1
2
3
4
5
Rh
oA
ex
pre
ss
ion
(fo
ldc
ha
ng
e)

152
Figure 5.5 Rac1 activity following exposure to puromycin aminonucleoside (PAN).
To understand if injuring podocytes with PAN affected Rac1-activity, pull-down assays using
beads specific for active Rac1were performed following 24 hours of PAN exposure. This
allowed quantification of the ratio of active Rac1 : total Rac1. (A) shows a representative
western blot; (B) shows quantification. Results were analysed using the nonparametric Mann-
Whitney U test. The experiment was performed four times. Error bars represent standard error
of the mean.

153
Figure 5.6 Effect of Rac1 inhibition on podocyte barrier function.
The effects of Rac1 inhibition with the small molecule EHT 1864 on electrical resistance across
a monolayer of podocytes was examined using electrical cell-substrate impedance sensing
(ECIS). Here, electrical resistance is used as a surrogate marker for cell barrier integrity, with
higher electrical resistance implying higher barrier integrity. (A) shows the combined results of
three experiments normalised to the vehicle control. Each experiment consisted of 3 plated wells
of cells per condition, with each experiment lasting for 60 hours following treatment. The
experiment was performed three times. Measured electrical resistances during the final 30
minutes of the experiment for each condition were used for final statistical analysis. Statistical
analysis was performed using one-way ANOVA followed by Tukey’s multiple comparisons
test. ****= p value <0.0001. The thin grey lines represent standard error of the mean. (B) shows
an example of a single experiment, with the resistance on the y-axis normalised to measured
resistance at the time of treatment for each condition.

154
5.4 Discussion
Cell motility is essential during embryogenesis, development and immune responses,
and is known to play a prominent role in pathological conditions such as cancer
metastasis, atherosclerosis, wound healing and arthritis.[359] The majority of studies
examining the role of cell migration in disease processes to date have focussed on
understanding the pathways governing tumour invasiveness [degradation of the
extracellular matrix (ECM)], and tumour motility (actual movement of the cancerous
cell). In order for a cell to move, it must adhere to the ECM, polarise to form a leading
edge and trailing edge, push the leading edge forward and retract the trailing edge, and
re-internalise cell-environment interactors (eg, integrins) to repeat the cycle (see Section
1.7.1). These processes are highly complex, tightly regulated, and carefully
coordinated.[468] The concept that tumour progression is a disease of dysregulated cell
motility has recently gained recognition,[469] and accumulating evidence suggests
therapies targeting motility would be effective at treating metastasis.[468]
In a similar manner, the concept of podocyte motility as a determinant of glomerular
filtration barrier (GFB) function is an emerging theme in renal biology.[129, 130] This
idea originated from the in vitro observation that exposing podocytes to proteinuric
stimuli such as PAN caused cells to adopt a hypermobile phenotype. Recent advances
with in vivo imaging have confirmed that podocytes are motile along the GFB, and
migrate at a higher rate during periods of proteinuric renal disease.[132]
In the current Chapter, I build on microarray data from Chapter 4 suggesting Gc therapy
may be exerting prominent effects on podocyte motility. I demonstrate using in vitro
live-cell imaging that podocytes show reduced motility (as quantified by cell speed)
following exposure to Gc, and Gc reduces the motility of podocytes exposed to two
proteinuria-inducing agents: PAN (Figure 5.1 ) and LPS (Figure 5.2). In combination,
these observations raise the possibility that some of the beneficial effects of Gc during
periods of proteinuria may be through directly preventing the increased podocyte
motility associated with renal disease.
Numerous regulators of cell motility have been identified. These include the Rho family
of small GTPases which, when bound to GTP, recruit a range of proteins which regulate
the cytoskeleton.[470] Active Rac1 promotes the formation of large membrane
protrusions called lamellipodia that drive the motility of many cell types,[407] while

155
active RhoA can recruit the Rho kinase (ROCK) family of kinases that phosphorylate a
range of cytoskeletal proteins, promoting the formation of actin stress fibres and the
generation of contractile force.[471] It has also been shown that active Rac1 inhibits
RhoA and vice versa.[421] Additionally, mutations in genes associated with Rac1
regulation have been shown to cause INS. For example, mutations in the Rho guanosine
nucleoside dissociation inhibitor α gene Arhgdia, which normally functions to prevent
inactive Rac1 from being converted to active Rac1, cause SRNS,[432] and mutations in
Arhgap24 (RhoGAP24), which inactivates Rac1in the non-mutated form, has been
associated with familial FSGS.[436] Podocyte-specific under- and over-activity of these
small GTPases in animal models have also been shown to cause proteinuria.[426, 428] I
therefore proceeded to investigate Gc effects on the activity of Rac1 and RhoA to gain a
small degree of mechanistic insight.
These small GTPase activity assays revealed that Gc exposure reduced (pro-migratory)
Rac1 activity, and showed a (non-statistically significantly) trend to increase the activity
of RhoA. Previously, Ransom et al., performed a similar experiment using cultured
murine podocytes. In this paper, cells were treated with dexamethasone for 30 minutes,
cultured in fresh medium for a further 3 days, before cells were harvested for
analysis.[109] The group found a statistically significant increase in RhoA activity in
Gc-treated cells, but no difference in Rac1 activity. Discrepancies between these data
and mine may be due to the GR ligand investigated (dexamethasone compared to
prednisolone), the podocyte cell line used (murine compared to human) or length of
time of Gc exposure. As my data suggested a prominent Gc-effect on reducing Rac1
activity consistent with the anti-migratory effect of Gc I had observed in the live-cell
imaging experiments, I confirmed that damaging podocytes with PAN-exposure
increased Rac1 activity (Figure 5.5).
As well as quantifying podocyte speed, I also investigated Gc effects on the pattern of
podocyte migration. Data illustrated in Figure 5.1-B and Figure 5.2-B demonstrates
that I found a small increase in directionally persistent cell movement in podocytes
treated with Gc (ie, podocytes exposed to Gc displayed less frequent changes in
direction of movement). Weiger et al., demonstrated that the directionality of 2
dimensional cell motion clearly distinguishes benign and tumorigenic cell lines, with
tumorigenic cell lines harbouring less directed, more random motion.[472] In data
presented here, Gc promotes persistent cell movement, and LPS (but not PAN) causes

156
more random motion, similar to the dysregulated motility pattern observed in
tumorigenic cells.
Directional migration is regulated by multiple mechanisms including
microtubules,[473] Cdc42,[417] integrins,[474] and chemotactic stimuli.[475] Duning
et al., reported that the protein KIBRA (for kidney and brain) bound to synaptopodin, an
important regulator of the podocyte cytoskeleton, and that stable knockdown of KIBRA
in immortalised podocytes impaired directional cell migration.[476] It has been shown
that chemotaxis imposes more persistent migration in cells via activation of
phosphatidylinositol 3’-kinase (PI3K).[477, 478] However, many migratory processes
occur with no evidence of extrinsic chemotactic signalling, and use intrinsic cell
migration properties. Pankov et al., investigated mechanisms underpinning intrinsic
control of directionally persistent cell migration, and identified Rac1 as a molecular
switch responsible for determining whether cells move in a random or directionally
persistent manner.[479] Using cultured human fibroblast cells, the group identified that
high Rac1 activity resulted in increased random migration (low cell persistence),
increased cell speed and increased lamellae formation. Conversely, low Rac1 activity
switched cells to a directionally persistent, low-speed phenotype with fewer lamellae
cell protrusions. The data presented in Figure 5.2 of LPS treated podocytes displaying
increased motility and lower directional persistence, which was reversed following Gc
exposure to a more directionally persistent, lower-speed phenotype gave me confidence
that Gc was reducing Rac1 activity.
In the context of cancer, the Rac1-specific inhibitor NSC23766 has been shown to
reduce the motility of non-small-cell lung cancer cells in vitro, and reduce tumour size
in mice in vivo (no robust systemic toxicology analysis was performed, but the authors
reported that the treated animals did not experience severe side effects or a loss in body
weight compared to control mice).[480] Regarding kidney disease, the Rac1 inhibitor
EHT 1864 has been shown to markedly attenuate proteinuria as well as glomerular and
tubulointerstitial damage in the 5/6 nephrectomy chronic model of arterial hypertension
and proteinuria in mice.[434] EHT 1864 also attenuated renal injury and fibrosis with
the chronic angiotensin II-salt-induced kidney injury model of double transgenic
Tsukuba hypertensive mice.[481] I therefore returned to the ECIS assay to investigate
whether Rac1 inhibition with EHT 1864 had any direct protective effect on podocytes
undergoing acute damage with PAN in vitro.

157
ECIS provides a reading of the electrical resistance across a monolayer of cells plated
into wells of the assay. As in vivo studies have revealed that a potential difference exists
across the GFB, and loss of this potential difference is associated with proteinuria, ECIS
provides a good in vitro functional measurement of podocyte barrier function.[54] ECIS
experiments demonstrated that EHT 1864 did indeed increase the electrical resistance
across the PAN-treated podocyte cell layer compared to podocytes treated with PAN
alone. Also interestingly, PAN-treated podocytes co-administered with Gc and EHT
1864 had a higher electrical resistance compared to podocytes treated with either agent
in isolation (Figure 5.6). Whether this observation is due to the two agents in
combination reducing Rac1 activity levels below those reached with either agent alone,
or whether Gc and EHT 1864 work via multiple, distinct mechanisms is unclear from
the current data.
Direct, podocyte-specific, effects of medication frequently used in current clinical
practice for the treatment of INS have already been established. Until relatively
recently, the potent immunosuppressive effect of ciclosporin A was assumed to underlie
its therapeutic efficacy. However, Faul et al., demonstrated the key anti-proteinuric
mechanism of ciclosporin A was through direct stabilization of the podocyte actin
cytoskeleton.[103] In a similar manner, it is possible that Gc efficacy in INS results
from direct effects on the podocyte, and does not rely on the potent immunosuppressive
action of Gc. Specifically, promotion of a hypomobile podocyte phenotype and effects
on the Rac1 pathway may be important.
As described in Section 1.7.4, Rac1 has a wide range of effects in addition to regulating
cell motility, including roles in cell cycle progression and phagocytosis. Additionally, it
has already been demonstrated that either podocyte-specific over- or under-activity of
small GTPases in vivo can result in proteinuria,[426] and it has been proposed that a
low, basal-level of podocyte motility is necessary to ensure the GFB remains clear of
filtered plasma proteins.[123] As physiological podocyte motility may have a role in the
normal functioning of the GFB, and Rac1 has roles in a range of biological processes,
drugs affecting cell motility must be subtly targeted. Any future in vitro or animal
studies examining the potential therapeutic benefits of Rac1 inhibition in reducing the
acute-onset proteinuria observed in INS must be careful to ensure robust toxicology
screening is performed, although the possibility of anti-proteinuria medication targeted
at reducing disease-associated podocyte hypermotility is an intriguing possibility.

158
6 The podocyte GR cistrome
6.1 Overview
GR translates the glucocorticoid (Gc) signal into genomic outputs. In the absence of Gc,
GR resides primarily in the cytoplasm of the cell, but Gc-GR interaction results in the
translocation of GR into the nucleus where it binds DNA to regulate gene
expression.[237] Both GR-binding patterns and Gc-regulated transcriptional output are
highly cell specific.[285] To date, a comprehensive map of GR binding sites (GBS) in
podocytes has not been produced. Tackling this issue is key to understand how GR
produces transcriptional change.
In this chapter, I identify GBS on a genome-wide scale in human podocytes scale using
a combination of chromatin immunoprecipitation coupled with high throughput DNA
sequencing (ChIP-Seq). I then proceed to characterise GBS in relation to important
functional genetic units, before overlying the microarray analysis from Chapter 4, to
identify links between GR-binding and Gc-regulated genes. A striking observation, in
agreement with data from other cell types, is that a large proportion of GR-binding
occurs at significant linear distances away from Gc-regulated genes, suggesting GR
causes changes in gene expression by long-range looping interactions, and, as yet, other
unidentified mechanisms.
159
6.2 Chapter-specific methods
6.2.1 Cell treatment and harvest
Twenty 15cm-diameter culture dishes of confluent wild-type human podocytes,
approximating to 6x10⁷ cells, were used for each treatment condition. Twenty four
hours prior to harvest, cell culture medium containing standard 10% fetal bovine serum
(FBS) was exchanged with cell culture medium containing 10% charcoal-stripped FBS
(CSFBS) (Gibco™) to prevent endogenous Gc activating GR. One hour prior to
harvesting, cells in culture medium containing CSFBS were treated with either 1µM
prednisolone dissolved in methanol or an equal volume (0.001% v/v) of methanol alone
as a vehicle control.
Following treatment, cells were cross-linked in 0.1% (v/v) 11% formaldehyde solution
for 10 minutes at room temperature, followed by quenching of the cross-linking reaction
using 0.05% (v/v) 2.5 M glycine. Each plate was then washed twice with 1 x phosphate-
buffered saline (PBS), before cells were harvested using a cell scraper. Cells were
pooled into a 50mL conical tube (separate tubes for Gc-treated and vehicle-treated
samples) and centrifuged at 700xg for 5 minutes at 4oC. The supernatant was discarded
and the cell pellet was resuspended in 10mL PBS. Tubes were centrifuged at 700xg for
5 minutes at 4oC and the supernatant was discarded. Samples were flash-frozen in liquid
nitrogen and stored at -80oC.
6.2.2 Chromatin immunoprecipitation
Samples were processed using reagents from the ChIP-IT® High Sensitivity kit (Active
Motif). Cell pellets from -80oC were resuspended in 5mL Chromatin Prep Buffer
supplemented with 5µL of protease inhibitor cocktail (PIC) and 5µL 100nM
phenylmethylsulfonyl fluoride (PMSF) at room temperature. Samples were
homogenized using a Qiagen TissueRuptor® (power setting ‘4’ for 45 seconds), before a
5 minute incubation on ice. Samples then underwent 90 stokes with a chilled Dounce
homogeniser, before transfer to a 15 mL tube, which was centrifuged at 1250g for 3
minutes at 4oC. The supernatant was discarded and the pellet was resuspended in 500µL
ChIP Buffer supplemented with 5µL PIC and 5µL 100nM PMSF. Following a 10
minute incubation on ice, samples were sonicated using an Active Motif EpiShear®
probe sonicator in combination with an EpiShear cooled sonication platform (35%
power; 45 cycles- each cycle consisted of 30 seconds of sonication followed by 30
seconds of inactivity).

160
Samples were then centrifuged at 4oC at maximum speed for 2 minutes to pellet the
cellular debris. 100µL from the vehicle treated sample (for ‘input’ DNA) and 100µL
from the +Gc sample were removed at this point to confirm that sonication produced
appropriately sized DNA fragments. The remaining samples were stored in aliquots at -
80oC.
100µL Tris-EDTA (TE) buffer, pH 8.0 and 2µL RNAase A (10ug/µL) were added to
the 100µL chromatin samples before a 1 hour incubation at 37oC. 5µL proteinase K
(10µg/µL) was then added before a 3 hour incubation at 37oC. The samples then
underwent a 16 hour incubation at 65oC with 10µL 5M NaCl.
DNA from the 100µL samples was purified using the Macherey-Nagel Nucleospin® kit.
1mL NTB was added to the sheared chromatin, and samples were spun through
purification columns for 30 seconds at 11,000g, and the flow-through was discarded.
700µL NT3 was then added to the columns before centrifugation for 30 seconds at
11,000 g, and the flow-through was discarded. The step involving NT3 was performed
twice, before the column was dried by 11,000g spin for 1 minute. The column was then
inserted into a new holding 1.5mL tube and 20µL NE buffer was added before a 1
minute incubation at room temperature. The column was centrifuged at 11,000g for 1
minute. 18µL of the sample was placed into a PCR tube with 2µL 5M NaCl before a 20
minute incubation at 100oC, and the sonication efficiency was checked by running the
sample on a 1.5% agarose gel (100 volts, 60 minutes).
The chromatin aliquots stored at -80oC were thawed on ice, and spun at maximum speed
at 4oC for 2 minutes. Overnight incubation at 4oC on an end to end rotator was
performed with the following components: 205µL chromatin, 5µL blocker, 2µg
Proteintech™ anti-human GR antibody (24050-1-AP) with 2µg of Sigma® anti- human
GR antibody (HPA004248), and 5µL PIC (total volume 240µL).
30µL protein G agarose beads per reaction were washed twice in 30µL TE buffer. The
chromatin/antibody mixture was centrifuged at 1250g for 1 minute and 30µL protein G
agarose beads were added for a 3 hour period at 4oC on an end to end rotator. ChIP
reactions were centrifuged at 1250g for 1 minute before 600µL ChIP buffer was added,
and the mixture was transferred to a ChIP filtration column. The column was washed
five times with 900µL AM1 wash buffer. The column was transferred to a 1.5mL tube
before centrifugation for 3 minutes at 1250g. Following transfer to a new 1.5mL tube,
161
warm AM4 elution buffer was added to the column before centrifugation at 1250g for 3
minutes. 2µL of proteinase K (10µg/µL) was added to the 100µL solution before a 30
minute incubation at 55oC. The cross-links were then reversed with a 2 hour incubation
at 80oC. 500µL DNA purification binding buffer was added and the pH was adjusted to
ensure pH<7.5 using 5µL aliquots of 3M sodium acetate. The sample was then added to
the DNA purification column before centrifugation at 14,000 rpm for 1 minute, and the
flow through was discarded. 750µL DNA purification wash buffer was added prior to
another 14,000 rpm centrifugation for 1 minute. The column was dried with a 2 minute
14,000 centrifugation before transfer to a new 1.5mL tube. Warm purification elution
buffer was added to the column before a 1 minute incubation at room temperature,
followed by collection of purified ChIP DNA by centrifugation at 14,000rpm for 1
minute.
Prior to sample sequencing, real-time polymerase chain reaction (qPCR) was performed
to ensure enrichment of the +Gc samples over vehicle-treated samples for a known GR-
binding site (GBS) (Figure 6.3). Quantification of the concentration of DNA was
performed using the Qubit™ fluorometer.
6.2.3 ChIP-Seq
Following Chromatin-immunoprecipitation (ChIP), DNA libraries were constructed
according to the TruSeq® ChIP Sample Preparation Guide (Illumina). Briefly, sample
DNA (5–10 ng) was blunt-ended and phosphorylated, and a single 'A' nucleotide added
to the 3' ends of the fragments in preparation for ligation to an adapter with a single-
base 'T' overhang. The ligation products were then purified and PCR-amplified to enrich
for fragments with adapters on both ends. The final purified product was then
quantitated prior to cluster generation on a cBot instrument and the loaded flow-cell
then paired-end sequenced on an Illumina HiSeq2500 instrument.
Data from the finished sequencing run was transferred to the Bioinformatics Core
Facility (University of Manchester), on dedicated off-instrument storage space and
converted to .fastq formatted reads using the software CASAVA. Quality control was
performed using FastQC v0.11.2. Read pairs (R1 and R2) were filtered using
Trimmomatic v0.32 using paired-end mode, to remove adapters, and truncate reads (3')
with a base sequence quality of <Q20, taken as an average of a 4bp moving window.
Filtered reads <50b were removed. Default settings were applied.
162
Filtered paired reads were mapped to human reference sequence (HG19/GRCh37;
minus haplotypes) using Bowtie2 v2.2.3 with default parameters. Mapped paired-reads
were filtered with 'samtools view' v0.1.19, to remove reads with mapping quality <Q30
and discordant pairs (i.e. incorrect orientation and/or >500bp apart). Only paired reads
belonging to chromosomes 1-22, X and Y were used in downstream analyses (reads
mapping to unassembled contigs and particularly the mitochondrial genome adversely
affect the statistics generated by the peak caller).
Regions of the genome significantly enriched with GR read-pairs, considered as
fragments of DNA, compared to a background model using the input DNA fragments,
were identified using model-based analysis for ChIP-Seq (MACS) 2 v2.1.0.20140616.
Paired-end mapped reads enabled MACS2 to take the observed mean of DNA
fragments, as opposed to approximating by cross-correlation when single-end reads are
used. Binding regions were reported with a minimum q-value of 0.05, and fold
enrichment was set at a cut-off of 5 over background.
The University of California, Santa Cruz (UCSC) human canonical genes for HG19
were associated with the summit regions (200bp centred on binding region summits)
using RnaChipIntegrator (unpublished, by the BCF core facility). The two closest
genes, by closest edges, up to 1 million bases away. Promoter region was designated as
-2000b to 100b of transcriptional start site (TSS).
Motif analysis was performed using the Pscan-ChIP.[482]

163
6.3 Results
6.3.1 Development of methods
ChIP-Seq is a powerful method for identifying genome-wide binding sites for DNA-
associated proteins such as transcription factors. An overview of ChIP-Seq is provided
in Figure 6.1. Two key steps in ChIP-Seq are ensuring adequate sonication of DNA
samples and optimising the immunoprecipitation conditions. When performing ChIP-
seq for low-abundance transcription factors such as GR (in comparison to ChIP-Seq
involving histone modifications), ensuring a sufficient mass of purified DNA is
obtained after immunoprecipitation for sequencing is also challenging.
6.3.1.1 Sonication
Sonication is a highly variable step and will vary greatly dependent on the cell type, cell
culture conditions, quantity of cells, degree of crosslinking and specifics of the
sonicator being used.[483] Undersonication results in a loss of resolution of binding
events. Smaller DNA fragments allow for more precise localisation of GR-binding
events, as a smaller region of DNA will be pulled down in the immunoprecipitation.
The Illumina protocol for pre-sequencing sample preparation involves a size selection
step which selects for libraries that are 250-300 base pairs (bp) long. Prior to this, 60 bp
adapters have been ligated onto DNA fragments to be sequenced (adding 120 bp to the
DNA fragment size). Therefore, 100-200 bp DNA fragments are required prior to
immunoprecipitation.
To optimise sonication conditions, I performed a time course experiment, removing
aliquots of DNA isolated from human wild type podocytes at discrete points throughout
an extended sonication run using a Diagenode® waterbath bioruptor. Each cycle lasted 1
minute and consisted of 30 seconds of sonication and 30 seconds of inactivity (periods
of inactivity are introduced to preventing samples overheating). Following crosslink
reversal and purification, the DNA samples were run on a 2% agarose gel to estimate
the degree of sonication. Figure 6.2-A displays results from a published protocol[483]
using a Misonix® 3000 sonicator, where each cycle lasted 90 seconds and consisted of
30 seconds of sonication followed by 90 seconds of rest, for comparison. This group
suggested 12 cycles of sonication (Figure 6.2-A) provided a good degree of sonication.
My results in Figure 6.2-B similarly show decreased fragment size with longer periods
of sonication, and I achieved similar results with 20-25 sonication cycles.

164
However, in both Figure 6.2–A and –B, a significant proportion of the total DNA
exceeds the 200 bp size-selection cut-off, and would not be sequenced. I therefore
attempted to improve the sonication step by using an Active Motif EpiShear® probe
sonicator in combination with an EpiShear cooled sonication platform. Each cycle
lasted for 1 minute and consisted of 30 seconds of sonication followed by 30 seconds of
inactivity. In comparison to the waterbath sonicator, a much higher proportion of the
total DNA was found at levels compatible with downstream sequencing. 45 cycles
produced shorter DNA fragments lower than those resulting from 30 cycles (Figure
6.2-C), and an increase to 60 cycles did not produce additional benefit (Figure 6.2-D).
As 60 cycles would expose the DNA to unnecessary mechanical shearing and heat, I
concluded that 45 cycles of sonication was optimal.

165
Figure 6.1 Chromatin immunoprecipitation coupled with high throughput DNA
sequencing (ChIP-Seq) methodology.
To perform ChIP-Seq, DNA:protein interactions are first stabilised using a cross-linker (eg,
formaldehyde). Chromatin is then isolated from cells and fragmented. An antibody against the
protein of interest [eg, the glucocorticoid receptor (GR)] is used to enrich for specific chromatin
fragments. DNA bound with the protein of interest undergoes cross-link reversal, and the DNA
is then sequenced. Aligning these specific DNA fragments with a reference genome allows
specific protein-binding loci to be determined.

166
..
Figure 6.2 Sonication Optimisation
Sonication is an important step in preparing samples for ChIP-Seq. Small DNA fragments are required
to allow precise localisation of GR-binding sites. 100-200 base pair (bp) DNA fragments are optimal
for the current protocol. (A) shows a published example of 2x10⁸ crosslinked human Jurkat cells
sonicated using a Misonix 3000 sonicator with microtip (power setting 7) with aliquots after a discrete
number of cycles (each cycle consisted of 30 seconds of sonication, followed by 90 seconds rest) and
run on a 2% agarose gel following DNA purification and cross-link reversal.[483] (B) Samples from
6x10⁷ wild type human podocytes sonicated using a Diagenode® waterbath bioruptor (each cycle
consists of 30 seconds sonication, followed by 30 seconds of inactivity). (C) and (D) podocyte samples
were sonicated using an Active Motif EpiShear® probe sonicator.

167
6.3.1.2 Antibody choice
Some published GR ChIP-Seq studies have used a ‘cocktail’ of several GR antibodies to
perform ChIP-Seq.[285, 484] At the time of performing the experiment, the majority of
GR ChIP-Seq studies had been performed using murine cell lines, and data regarding
successful human GR ChIP-Seq experiments was scarce. In previous small-scale ChIP-
Seq optimisation experiments using human A549 cells performed by Dr. Toryn
Poolman at the University of Manchester, the Proteintech™ anti-human GR antibody
24050-1-AP had performed well, providing significant enrichment above background
(personal communication). I therefore decided to compare the performance of 24050-1-
AP in isolation, and in combination with the Sigma® anti- human GR HPA004248
antibody, which had performed well when used by members of Dr. Lennon’s laboratory
for immunostaining of human kidney specimens.
Following preparation of two ChIP-Seq optimisation samples (one vehicle-treated, one
Gc-treated) (see Section 6.2), I performed immunoprecipitations for each sample under
the following two conditions (four immunoprecipitations in total; total volume for each
immunoprecipitation was 155µL): i) 4µg of 24050-1-AP; and ii) 2µg of 24050-1-AP
with 2µg of HPA004248.
To test the efficiency of the two antibody conditions in pulling down GR/DNA cross-
linked complexes, I planned to use real-time polymerase chain reaction (qPCR) to
identify known GR binding sites in the various samples. However, no GR ChIP-Seq had
previously been performed in podocytes (murine or human), and it was already known
that GR-occupancy of genetic loci is highly cell-selective. For example, only 11.4% of
GBS are shared between murine pituitary and mammary cells.[285]
I therefore had to first identify a human podocyte GBS. To do this, I prepared another
set of ChIP-Seq optimisation samples. As I had previously demonstrated that the GILZ
gene was Gc-responsive (see Chapter 3), I first used qPCR primers for the GILZ
proximal promoter region, but this only showed a 2.53 fold enrichment (using the 2-∆∆Ct
method)[485] over background, which is insufficient for downstream ChIP-Seq
analysis. A possible reason for this became clear following the publication of a human
GR ChIP-Seq dataset in A549 cells, which did not identify a GBS in the GILZ proximal
promoter.[449] The minimal GILZ enrichment observed in my sample was therefore
probably due to GR/DNA complexes with long DNA strands (DNA fragment size
selection had not yet occurred).

168
However, a human GBS dataset did identify a binding region 86 kilobases (kb)
upstream of the FKBP5 gene (FKBP+86) which had been shown to be Gc-responsive in
my podocyte microarray dataset (see Chapter 4), and also provided primer sequences
for a region 97 kb upstream of FKBP5 (FKBP+97) with no GBS, to act as a
control.[486] After performing qPCR on my samples previously analysed for GILZ
proximal promoter enrichment, I found a fold-enrichment of 15.8 for the FKBP+86 site,
and a fold enrichment of 1.25 for the FKBP+97 site, suggesting primers for the
FKBP+86 site were suitable to use to test the efficiency of my GR immunoprecipitation.
The results for the samples submitted for sequencing are shown in Figure 6.3.
Using the FKBP+86 primers, I found a 56-fold enrichment for the Gc-treated sample
over the vehicle-treated sample when using the 24050-1-AP antibody and HPA004248
antibody together, but DNA purified from the immunoprecipitations involving the
24050-1-AP antibody alone did not record a signal. Ideally, I would have wished to
perform another optimisation experiment investigating the HPA004248 alone.
However, as it took approximately 6 weeks just to culture sufficient numbers of cells for
optimisation experiments, I decided to proceed using the 24050-1-AP antibody and
HPA004248 antibody combination.

169
Figure 6.3 Sample enrichment prior to ChIP-Seq
Prior to the sequencing step of ChIP-Seq, it is common practice to ensure samples are suitable
by performing real time polymerase chain reaction (qPCR) to ensure a known GR-binding site
(GBS) is enriched. Results above demonstrate an 8.6 fold enrichment of vehicle (-Gc) over
prednisolone (+Gc) treated samples. Fold enrichment was calculated using the 2-∆∆Ct
method.[485] Primers used for the qPCR reaction were for a known GBS near to the FKBP5
gene,[486] and for a 59 bp fragment from a gene desert on human chromosome 4 as a negative
control (Active Motif®).
6.3.2 GR-binding characteristics
I used ChIP-Seq to identify the genomic locations bound by GR in human wild type
podocytes following one hour treatment with the GR-ligand prednisolone. Since GR
binding to DNA precedes effects on gene expression (as analysed in Chapter 4), one
hour was chosen as the length of Gc exposure, consistent with other GR ChIP-Seq
studies.[107, 285] ChIP DNA was sequenced with an Illumina 2500 system and
mapped to a human reference sequence using the Bowtie programme. The model-based
analysis of ChIP-Seq (MACS) algorithm was then used to identify enriched genomic
regions in Gc-treated samples compared to DNA input (‘background’). To ensure the
specificity of the GR antibody, a vehicle-treated control was prepared (without GR-
ligand, little GR-DNA interaction should occur). As expected, an insufficient mass of
DNA for sequencing was obtained after immunoprecipitation in the vehicle-treated
sample (using the high-sensitivity setting on the Qubit® fluorometer, the DNA
concentration following immunoprecipitation in the Gc-treated samples was 0.23 ng/µL,

170
whereas the concentration in vehicle-treated sample was too low for quantification). A
fold-enrichment of 5 over background levels was used to identify 1,130 genomic
positions occupied by GR following Gc-exposure. This fold-enrichment over
background is at least as conservative as published studies: some groups have used fold-
enrichments of 3[487, 488] and 4.[489] RnaChipIntegrator was used to assign the two
closest human genes based to each GR-binding site (GBS). The 50 GR-binding sites
(GBS) showing the highest fold-enrichment over background are shown in
Supplementary Table 10.2. Details of the full list of 1,130 GBS are provided in
Compact Disc 1 (back cover insert).
Visualisation of GBS/human gene alignment was performed using the University of
California, Santa Cruz (UCSC) genome browser. Two examples are shown in Figure
6.4. GBS peak 1 in the TTI1 gene locus and GBS peak 1 in the Per1 gene locus have
previously been identified as GR-binding regions in A549 lung adenocarcinoma cells as
part of the ENCODE project (https://genome.ucsc.edu/ENCODE/).
The Cis-regulatory element annotation system (CEAS) was used to characterise GBS in
terms of alignment with functionally important genomic regions such as gene promoters
or exons. Figure 6.5 shows the distribution of GBS over chromosomes. In general, GBS
were distributed evenly throughout the genome. The only statistically significant
differences when comparing the percentage of GBS on each chromosome to the
percentage of total mappable regions of the genome occupied by each chromosome
occurred for chromosomes 19 and 20 (more GBS than would be expected) and the X
chromosome (fewer GBS than would be expected).
Figure 6.6-A shows how GBS are distributed over important genomic features.
Consistent with data from previous studies (see ‘Discussion’), the majority of GBS were
located outside the intragenic and immediate proximal promoter region of genes. 56.6%
of the GBS observed in my dataset were located >2.5 kilobases (kb) away from the
nearest transcriptional start site, with 41.2% of GBS located intragenically. An
alternative way to visualise this is shown in Figure 6.6-B, which illustrates the average
binding GBS profile for a hypothetical 3,000 bp gene. The two genomic regions with
the highest frequency of GBS are distal to the proximal-promoter, and intragenic.

171
Figure 6.4 GR binding sites in relation to a reference human genome.
GR binding sites (GBS) in human wild type podocytes were identified using ChIP-Seq. Significant GBS
were defined as those showing ≥5 fold-enrichment in Gc-treated podocytes compared to DNA input. Results
were visualised using the University of California, Santa Cruz (UCSC) genome browser. Two significant
intragenic GBS for the TTI1 gene (A), and a significant peak approximately 400bp downstream of the
transcriptional start site (peak 1) and in the promoter region (peak 2) of the Per1 gene (B) are displayed.

172
Figure 6.5 Chromosomal distribution of GR-binding sites.
The distribution of 1,130 significant GR-binding sites (GBS) identified by ChIP-Seq over
chromosomes was analysed using the cis-regulatory element annotation system (CEAS). The
orange bars represent the percentage of total mappable regions in the chromosome (genome
background) and the blue bars the percentage of total GBS found in that chromosome. For
example, 4.1% of GBS reside in chromosome 20, whereas 2.1% of total mappable regions
occupy chromosome 20.
Percentage (%)
Ch
rom
oso
me
0 2 4 6 8 10
Y
X
M
22
21
20
19
18
17
16
15
14
13
12
11
10
9
8
7
6
5
4
3
2
1
**
**
**

173
Figure 6.6 Genomic distribution of GR binding sites.
GR-binding sites (GBS) in human wild type podocytes identified by ChIP-Seq were analysed
using the cis-regulatory element annotation system (CEAS). (A) illustrates the percentage of
GBS located in different functional genomic units. (B) represents the average GBS binding
profile on a hypothetical 3kb meta-gene, which shows that GBS are enriched in upstream distal
and intragenic regions.

174
6.3.3 Association between GR-binding and Gc-responsiveness of genes
I then investigated the relationship between the location of GBS and the Gc-responsive
genes identified in the microarray dataset from Chapter 4. Frequently, genes have been
operationally defined as the coding sequence plus a fixed physical distance in each
direction.[490] Lengths of the extensions have been from 0 to 500 kb,[491, 492] but
most often of 20kb[493-495] or 50kb.[496-500] For analysis, I separated GBS into 3
categories: i) GBS located ≥50kb away from the coding sequence of any gene; ii) GBS
located ≤50kb away from a Gc-regulated gene (as defined by my microarray dataset);
and iii) GBS located ≤50kb away from a Gc-unresponsive gene (as defined by my
microarray dataset).
Figure 6.7 shows that 32.4% of GBS are located ≥50kb from the nearest gene. I then
performed separate CEAS analysis on GBS within 50kb of a Gc-regulated gene and
compared this to CEAS analysis on GBS within 50kb of a Gc-unresponsive gene to gain
insight into whether the site of GR-binding impacts gene Gc-responsiveness. This
revealed that when a GBS is located within 50kb of a Gc-responsive gene it has a higher
likelihood of binding in the immediate 2.5kb upstream promoter region. The bar chart in
Figure 6.7 shows greater enrichment of GBS in the 2.5kb upstream promoter region for
Gc-responsive genes compared to Gc-unresponsive genes.
I then focussed my analysis on the Gc-regulated genes from my microarray dataset in
Chapter 4. Although when GBS do occur within 50kb of a Gc-responsive gene, binding
within the 2.5kb upstream region is enhanced, GBS are found within 50kb of a Gc-
responsive gene only in a minority of cases. Figure 6.8 shows that only 83/397 (20.9%)
of Gc-regulated genes are located within 50kb of a GBS. 81/83 of these Gc-regulated
genes were upregulated following treatment with Gc, with only DYRK2 and SOX9
displaying reduced expression. Seven genes were found to have a GR binding site in the
2.5kb upstream promoter region including the classically Gc-regulated genes Per1 and
DUSP1.[284] Twenty Gc-regulated genes were located within 50kb of more than one
GBS and are listed in Table 6.3.
I next went onto investigate the likelihood of GR binding in a particular genetic
functional module being associated with transcriptional change of that gene. Focussing
on the 764 GBS located within 50kb of any gene, I quantified the number of times a
GBS is found within a particular genetic unit (2.5kb upstream promoter, gene body, or
GBS within 50kb of gene but outside gene body and immediate upstream promoter) and

175
expressed the probability of GR-residency in that locus being associated without
transcriptional change of that gene as a percentage. Figure 6.9 shows that GR-residency
in any of these genetic loci does not predict Gc-responsiveness, eg, if GR is located in
the 2.5kb upstream regulatory region, there is only a 11.8% chance of that gene
undergoing a change in transcriptional output.
Figure 6.7 Combining the podocyte microarray and ChIP-Seq dataset.
The relation between the GR binding sites (GBS) in wild type podocytes identified by ChIP-Seq
and the transcriptional output elicited by Gc-exposure, as identified by microarray, was
compared. The large pie chart shows division of GBS according to distance from Gc-regulated
genes. Linked diagrams shows the percentage of GBS sites found in areas surrounding Gc –
responsive and –unresponsive genes. Bar chart shows GBS enrichment in 2.5 kb promoter
region over general genome background for Gc –responsive and –unresponsive genes.

176
Figure 6.8 Relation between Gc-regulated genes and GR-binding sites
Gc-regulated genes in wild-type human podocytes were identified using microarray analysis and GR-binding sites
(GBS) identified using ChIP-Seq. Pie-chart shows proportion of Gc-regulated genes found within 50 kb of a GBS.
Seven Gc-regulated genes had a GBS within their 2.5kb upstream promoter.

177
Figure 6.9 Transcriptional output and site of GR-binding
Pie chart shows proportion of GR-binding sites (GBS) in wild type podocytes with a gene within 50kb. Chart shows likelihood of GR residency in
particular genomic locations being associated with a change in gene expression following Gc-exposure.

178
6.3.4 Motif analysis
To gain insight into the nucleotide sequences where GR preferentially bound, I used the
Pscan-ChIP programme,[482] which searches the JASPAR database
(http://jaspar.binf.ku.dk/) for known binding nucleotide motifs of transcription factors.
Pscan-ChIP identified nucleotide sequences in the 1,130 GBS which were found more
frequently than would be expected if GR was binding randomly, before linking these
enriched nucleotide sequences with known binding motifs of transcription factors.
Figure 6.10-A shows the most enriched binding motif was a 15bp known
glucocorticoid responsive element (GRE). Figure 6.10-B shows that, as expected, the
location of this binding motif is located in the central region of GBS (typical GREs are
15bp in length, but DNA sonication step in the ChIP-Seq protocol produces DNA
strands 100-200 bp in length).
Table 6.1 shows the most enriched binding motifs identified, and the transcription
factor associated with that motif. To understand more about potential co-regulators of
GR, I performed a ‘motif-centred’ analysis. For regions in my dataset containing a
known GRE, PScanChIP processed the 150bp region around the oligonucleotide to
identify known binding sites for other transcription factors. The results are shown in
Table 6.2 and include the Jun and Fos monomeric subunits of activator protein 1 (AP1),
which is known to be critical for GR-regulated transcription, partly through maintaining
baseline chromatin accessibility.[501] I then investigated whether any differences in
binding motif patterns existed between those GBS located within 50kb of a Gc-
responsive gene and GBS located within 50kb of a Gc-unresponsive gene. As shown in
Figure 6.11, no differences of obvious functional importance were observed.
A summary overview of the data is provided in Figure 6.12.

179
Figure 6.10 Motif analysis
Nucleotide sequence motifs where GR was preferentially binding were identified using Pscan-
ChIP.[482] (A) shows the sequence motif which was most enriched; a known GR-binding
motif. The size of the letter for each nucleotide position relates to how dominant the base is for
that position, and the matrix below quantifies this. For example, at base 4, adenine was found
most commonly, but guanine and thymine are sometimes located in this position. (B) shows an
average representation of where the best matching oligonucleotides in the binding region (blue)
were found in relation to total DNA fragment (red). A= adenine, C=cytosine, T=thymine,
U=uracil.

180
Table 6.1 Enriched transcription factor binding motifs
1,130 GR-binding sites (GBS) in human wild type podocytes were
identified using ChIP-Seq. These nucleotide sequences were analysed by
Pscan-ChIP,[482] and the most enriched transcription-factor specific
binding motifs are listed below. GR= glucocorticoid receptor,
AR=androgen receptor, ESR= oestrogen receptor, RXRA=retinoid
receptor alpha, VDR= vitamin D receptor, HSF1= heat shock transcription
factor 1, TBP= TATA-binding protein, SOX10=sex determining region Y-
box 10, PAX5=paired box 5.
Transcription
factor with
enriched
binding motif
JASPAR
ID
Local
enrichment
p-value
Motif over-
(↑) or
under-(↓)
represented
GR MA0113.2 1.4 x10-137 ↑
AR MA0007.2 2.6 x10-136 ↑
Ar MA0007.1 2.6 x10-129 ↑
GR MA0113.1 2.4 x10-58 ↑
ESR2 MA0258.1 1.3 x10⁻³² ↑
ESR1 MA0112.2 6.2 x10⁻¹¹ ↑
ESR2 MA0258.2 7.3 x10⁻⁸ ↑
RXRA::VDR MA0074.1 5.4 x10⁻⁷ ↑
HSF1 MA0486.1 1.0 x10⁻⁶ ↑
TBP MA0108.2 4.2 x10⁻⁵ ↓
SOX10 MA0442.1 4.7 x10⁻⁵ ↑
PAX5 MA0014.2 5.1 x10⁻⁵ ↑
TBP MA0108.1 5.3 x10⁻⁵ ↓

181
Table 6.2 GR coregulators
1,130 GR-binding sites in human wild-type podocytes identified by ChIP-Seq
underwent ‘motif centred’ analysis using Pscan-ChIP.[482] Regions in the dataset
containing a known GR binding motif were extended 150bp in both directions to
identify other known transcription factor binding motifs which may be acting as
co-regulators with GR. GR= glucocorticoid receptor, AR=androgen receptor,
ESR= oestrogen receptor, RXRA=retinoid receptor alpha, Fos= cellular oncogene
c-fos, HSF1= heat shock transcription factor 1, JUND= Jun D proto-oncogene,
ARID3A= AT rich interactive domain 3A, PAX5= paired box 5, CDX2= caudal
type homeobox 2.
Transcription
factor with
enriched
binding motif
JASPAR
ID
Local
enrichment
p-value
Motif over-(↑)
or under-
(↓)represented
GR MA0113.2 2.3 X10-262 ↑
AR MA0007.2 9.7 X10-226 ↑
Ar MA0007.1 1.9 X10-213 ↑
GR MA0113.1 8.4 X10-101 ↑
ESR2 MA0258.1 2.2 X10⁻³³ ↑
RXRA::VDR MA0074.1 4.0 X10⁻¹³ ↑
ESR1 MA0112.2 7.2 X10⁻¹¹ ↑
ESR2 MA0258.2 1.8 X10⁻⁹ ↑
FOS MA0476.1 2.1 X10⁻⁸ ↑
HSF1 MA0486.1 9.7 X10⁻⁷ ↑
JUND MA0491.1 1.5 X10⁻⁶ ↑
ARID3A MA0151.1 4.5 X10⁻⁶ ↓
PAX5 MA0014.2 8.1 X10⁻⁶ ↑
CDX2 MA0465.1 9.1 X10⁻⁶ ↓
SOX10 MA0442.1 4.1 X10⁻⁵ ↑
FOSL1 MA0477.1 5.2 X10⁻⁵ ↑
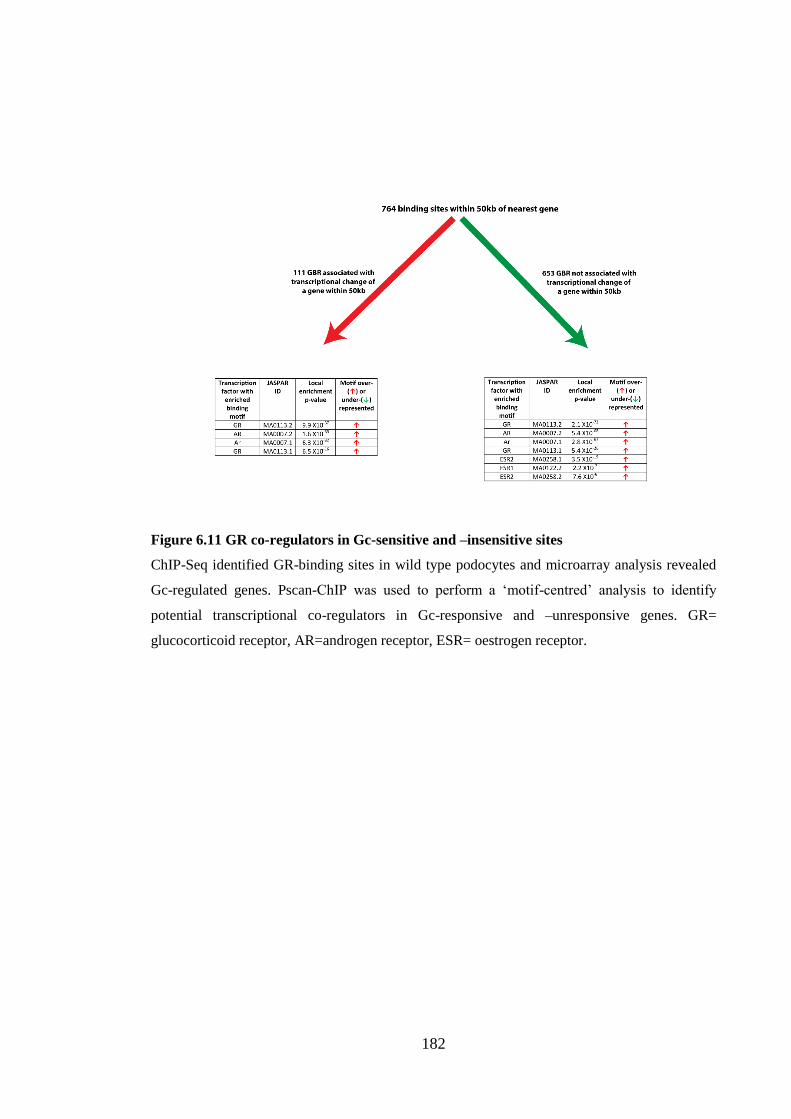
182
Figure 6.11 GR co-regulators in Gc-sensitive and –insensitive sites
ChIP-Seq identified GR-binding sites in wild type podocytes and microarray analysis revealed
Gc-regulated genes. Pscan-ChIP was used to perform a ‘motif-centred’ analysis to identify
potential transcriptional co-regulators in Gc-responsive and –unresponsive genes. GR=
glucocorticoid receptor, AR=androgen receptor, ESR= oestrogen receptor.

183
Figure 6.12 Summary of GR binding pattern in human podocytes
ChIP-Seq identified 1,130 GR binding sites in human wild-type podocytes, and their location in
relation to Gc-regulated genes was investigated. The diagram above shows a cartoon summary
of the GR binding pattern observed.
184
6.4 Discussion
In this chapter I analysed the GR-binding pattern in human wild type podocytes, and
how this relates to the transcriptional changes observed in the microarray study from
Chapter 4. GR ChP-Seq has previously been performed in other cell lines, and a striking
feature of these datasets is the large proportion of GR binding events occurring
significant distances away from the gene coding region. A comparison summary of
locations of GBS identified in my data with other studies is shown in Figure 6.13.
John et al., performed GR ChIP-Seq in 3134 murine mammary adenocarcinoma cells
and found 93% of GBS were located >2.5kb away from the nearest gene (in comparison
to 52.6% of GBS in my dataset).[285] In a similar manner, the group were unable to
identify any clear relationship between GR-occupancy patterns and transcriptional
activation of nearby genes. Yu et al., found that 54% of Gc-regulated genes in murine
adipocytes had a GBS within 100kb,[502] and Reddy et al., found that 30% of Gc-
responsive genes had a GBS within 10kb,[449] whereas my analysis revealed 20.9% of
Gc-regulated genes had a GBS within 50kb. These data raise the possibility that GR acts
through long-range mechanisms, or that many binding events are opportunistic and do
not necessarily affect transcriptional output. Indeed, long-range looping interactions
between regulatory sequences and their target genes have been analysed using
chromosome conformation-capture (3C)-based techniques, and identified chromatin
interactions that span a linear genomic distance from several hundred base pairs to over
1 million base pairs.[503] Wilms’ tumour 1 (WT1) is a transcription factor with a key
role in kidney development, and WT1 mutations lead to a range of renal manifestations
including Denys-Drash syndrome, the Frasier syndrome, and steroid-resistant NS.
Several WT1 ChIP-Seq experiments have been performed in podocytes, and these show
around 45% of WT1 genomic binding sites are located more than 50kb away from
transcription start sites.[33-35] This suggests WT1 regulates gene expression via both
proximal and distal regulatory elements in a similar manner to GR.
Another prominent observation from my data was that of the 83 Gc-regulated genes
located within 50kb of a GBS, only 2 genes (DYRK2 and SOX9) showed transcriptional
downregulation. This raises the possibility that linear genomic distance between the
GR-binding site and gene may be a factor in determining the directionality of
transcriptional change. A similar observation was made in lung adenocarcinoma A549
cells by Reddy et al., who found genes activated by Gc have GR bound within a median
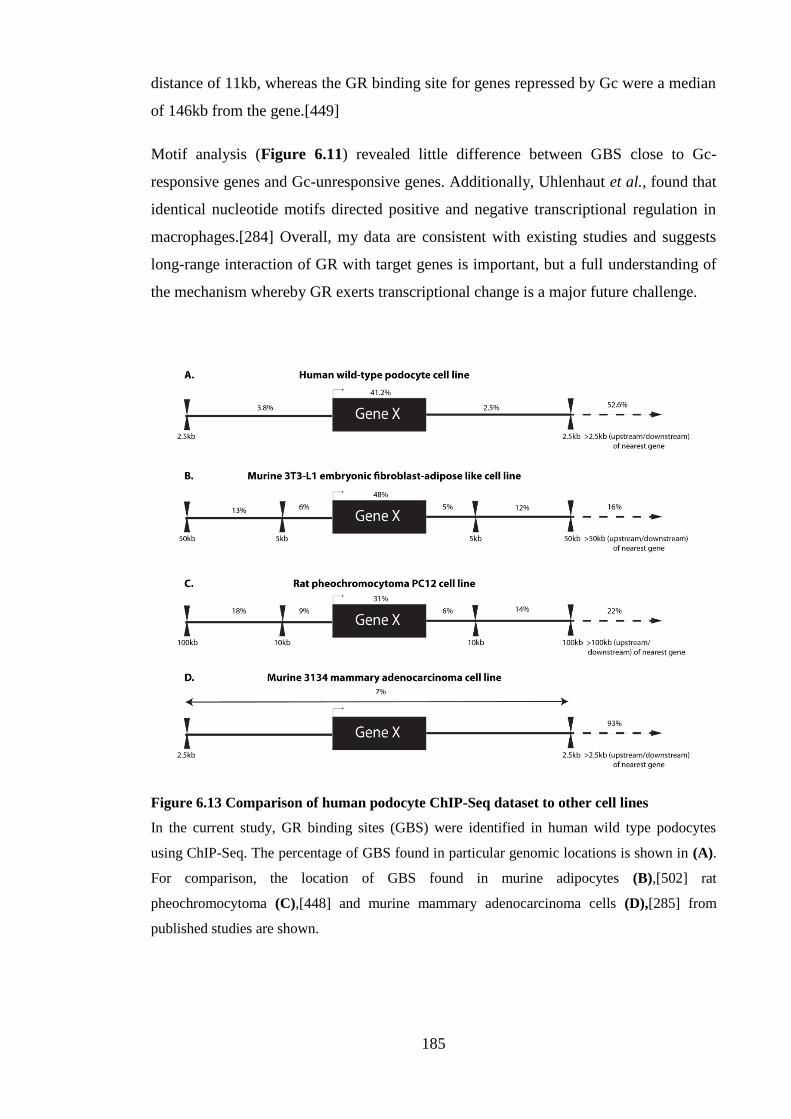
185
distance of 11kb, whereas the GR binding site for genes repressed by Gc were a median
of 146kb from the gene.[449]
Motif analysis (Figure 6.11) revealed little difference between GBS close to Gc-
responsive genes and Gc-unresponsive genes. Additionally, Uhlenhaut et al., found that
identical nucleotide motifs directed positive and negative transcriptional regulation in
macrophages.[284] Overall, my data are consistent with existing studies and suggests
long-range interaction of GR with target genes is important, but a full understanding of
the mechanism whereby GR exerts transcriptional change is a major future challenge.
Figure 6.13 Comparison of human podocyte ChIP-Seq dataset to other cell lines
In the current study, GR binding sites (GBS) were identified in human wild type podocytes
using ChIP-Seq. The percentage of GBS found in particular genomic locations is shown in (A).
For comparison, the location of GBS found in murine adipocytes (B),[502] rat
pheochromocytoma (C),[448] and murine mammary adenocarcinoma cells (D),[285] from
published studies are shown.

186
Table 6.3 Genes near multiple GR-binding sites
GR-binding sites (GBS) in human wild type podocytes were identified using ChIP-Seq, and Gc-
regulated genes were identified using microarray analysis. 1,130 GBS were found in total, and
the twenty Gc-regulated genes located with 50 kb of more than one GBS are listed below.
Gene Symbol Gene name #GR binding sites
within 50kb SERPINE1 Serpin peptidase inhibitor, clade E (nexin,
plasminogen activator inhibitor type 1),
member 1
5
FKBP5 FK506 binding protein 5 4
CRISPLD2 Cysteine-rich secretory protein LCCL domain
containing 2
3
PRKAG2 protein kinase, AMP-activated, gamma 2 non-
catalytic subunit
3
ST6GALNAC2 ST6 (alpha-N-acetyl-neuraminyl-2,3-beta-
galactosyl-1,3)-N-acetylgalactosaminide
alpha-2,6-sialyltransferase 2
3
TSC22D3 Glucocorticoid-induced leucine zipper
ACPL2 acid phosphatase-like 2 2
CFLAR CASP8 and FADD-like apoptosis regulator 2
DUSP1 Dual Specificity Phosphatase 1 2
FAM134B Family With Sequence Similarity 134,
Member B
2
JPH2 Junctophilin 2 2
KLF6 Krippel-Like Factor 6 2
LEF1 Lymphoid enhancer-binding factor 1 2
MT1M Metallothionein 1M 2
NPAS2 Neuronal PAS domain protein 2 2
PER1 Period circadian clock 1 2
RASSF4 Ras association (RalGDS/AF-6) domain
family member 4
2
RERE Arginine-glutamic acid dipeptide repeats 2
TFCP2L1 Transcription factor CP2-like 1 2
VSTM2L V-Set And Transmembrane Domain
Containing 2 Like
2

187
7 Proteomic analysis of human wild type podocytes
7.1 Overview
Characterisation of the podocyte proteome is an important step in understanding the role
this cell plays in maintaining normal glomerular function. In this chapter, I use recent
developments in label-free mass spectrometry (MS) to identify the protein constituents
of human wild type podocytes, and to identify proteins whose abundance significantly
alters following Gc exposure. These analyses reveal that the podocyte is rich in actin
cytoskeletal regulators, consistent with observations that the podocyte is a motile and
contractile cell (see Section 1.3.4). Gene ontology (GO) analysis of proteins whose
expression alters following Gc exposure validates the analysis performed on the Gc-
regulated transcriptomic data (Chapter 4), with seven of the top ten most significantly
enriched GO terms being common to both datasets. In particular, ‘cellular movement’ is
an enriched term in both datasets, suggesting Gc exerts prominent effects on podocyte
motility.

188
7.2 Chapter specific methods
7.2.1 Sample preparation
One confluent 10cm-diamater cell culture dish of fully differentiated wild type human
podocytes was used for each replicate. Twenty four hours prior to treatment cells were
placed into serum-free medium. Cells in culture medium then underwent 24 hours of
treatment with either 1µM prednisolone dissolved in methanol or an equal volume
(0.001% v/v of media) of methanol alone as a vehicle control. Cells were lysed using
radioimmunoprecipitation (RIPA) buffer [150mM NaCl, 20mM Tris pH 7.4, 2mM
MgCl2, 0.5% Triton X-100 supplemented with cOmplete protease inhibitor cocktail
tablets (Roche) and PhosSTOP protease inhibitor cocktail tablets (Roche)] to produce
whole cell extracts.
7.2.2 Digestion
Protein samples were separated by SDS-PAGE and allowed to migrate 10mm into a 4-
12% polyacrylamide gel. Following staining with InstantBlue (Expedeon), bands of
interest were excised from the gel and dehydrated using acetonitrile followed by
vacuum centrifugation. Dried gel pieces were reduced with 10 mM dithiothreitol and
alkylated with 55 mM iodoacetamide. Gel pieces were then washed alternately with 25
mM ammonium bicarbonate followed by acetonitrile. This was repeated, and the gel
pieces dried by vacuum centrifugation. Samples were digested with trypsin overnight at
37oC.
7.2.3 Mass spectrometry
Digested samples were analysed by Liquid chromatography-tandem mass
spectrometry(LC-MS/MS) using an UltiMate® 3000 Rapid Separation LC (RSLC,
Dionex Corporation) coupled to an Orbitrap Elite (Thermo Fisher Scientific) mass
spectrometer.
Peptide mixtures were separated using a gradient from 92% A (0.1% FA in water) and
8% B (0.1% FA in acetonitrile) to 33% B, in 44 min at 300 nL min-1, using a 250 mm x
75 μm i.d. 1.7 µM BEH C18, analytical column (Waters). Peptides were selected for
fragmentation automatically by data dependant analysis.

189
7.2.4 Progenesis data analysis
Profile .raw files were imported into Progenesis LC-MS (Nonlinear Dynamics) version
4.1. Alignment of chromatograms was carried out using the automatic alignment
algorithm. Progenesis created the peak list file that was exported to an in-house Mascot
server (Matrix Science).[504] Carbamidomethylation of cysteine was set as a fixed
modification and oxidation of methionine was allowed as a variable modification. Only
tryptic peptides were considered, with up to one missed cleavage permitted.
Monoisotopic precursor mass values were used and only doubly and triply charged
precursor ions were considered. Mass tolerances for precursor and fragment ions were 5
parts per million (ppm) and 0.5 Daltons (Da) respectively.
Data were re-imported in Progenesis to assign peptide identification to features. Peptide
and protein data were then exported from Progenesis as .csv files to be analysed in
Excel 2007 (Microsoft®).
7.2.5 Functional analysis of data
Proteins were only considered for further analysis if they were identified using ≥2
unique peptides.[505] Gc-regulated proteins were identified by a fold-change of >2 and
a false discovery rate adjusted p value (q value) of <0.05. Global proteomic data were
analysed using output from DAVID (Gene Ontology) version 6.7,[506, 507] coupled to
the Enrichment map plug-in on Cytoscape version 2.8.3 (p value 0.001, q value 0.05,
similarity cut-off 1.0).[508] Gene ontology (GO) analysis using the term ‘molecular and
cellular functions’ was performed using IPA® software (Ingenuity). Enriched lower-
order GO terms were ranked according to significance with a minimum threshold p
value of 0.05.

190
7.3 Results
7.3.1 Optimisation of experimental conditions
Gc-mediated effects on translational output typically occur on the scale of hours, but are
variable between specific Gc-regulated proteins.[509] In order to choose a suitable time
point for analysis of Gc-mediated effects on translational change in human podocytes, I
first performed an optimisation experiment comparing the protein content of total cell
lysate preparations obtained from podocytes following treatment with vehicle, 12 hours
of Gc, and 24 hours of Gc (biological duplicates prepared for each condition).
Samples were analysed using a Thermo Scientific Orbitrap Elite mass spectrometry
system with a 1 hour run-time per sample. Data processing with Progenesis QI software
(Nonlinear Dynamics) in conjunction with Mascot (Matrix science) to identify peptides,
revealed a raw protein identification count of 1,921. Principal component analysis
(PCA) showed vehicle-treated samples clustered together, as did samples treated for 24
hours with Gc (Figure 7.1). Samples treated with Gc for 12 hours were widely
separated, suggesting an intermediate phenotype between vehicle- and 24 hour Gc-
treated samples. Therefore, I proceeded to prepare triplicate samples to compare the
protein differences between vehicle-treated podocytes and podocytes treated with Gc for
24 hours. Additionally, MS run-times were extended to 2 hours per sample to further
improve the number of proteins identified.
7.3.2 Protein composition of human wild type podocytes
Total cell lysates from wild-type human podocytes treated with vehicle or Gc for 24
hours were prepared. Prior to MS analysis, sample quality was checked to ensure Gc-
exposure had resulted in translational change for a known Gc-regulated protein, and to
ensure minimal sample degradation had occurred during processing. As I had already
demonstrated that Gc-exposure resulted in reduced expression of GR (Chapter 3), I
performed western blotting using a GR primary antibody on sample aliquots. Western
blotting demonstrated downregulation of GR in the samples following Gc-exposure, and
I therefore proceeded with MS analysis (Figure 7.2-A).
Samples were run on a Thermo Scientific Orbitrap Elite mass spectrometer with 2 hour
run times per sample to improve the number of peptides detected and therefore proteins
identified. Data were analysed using Progenesis QI software. Progenesis produces an
ion intensity map, which is representative of the sample’s MS signal by mass/charge

191
and retention time. The software automatically selects the most appropriate sample to
act as a ‘reference’ with which other samples are aligned. Aligning ion intensity peaks
from different samples is key to quantifying differences in protein abundance.
Alignment scores >50% are generally considered acceptable, and 68.8%-90.8% were
recorded for my samples (Figure 7.2-B). PCA showed a clear separation of samples
according to treatment group (Figure 7.3).
A raw protein identification count of 3,866 was found on the 2 hour runs, in contrast to
the 1,921 proteins identified on the optimisation 1 hour sample run times. To ensure
protein identification was robust, proteins identified by less than 2 unique peptides were
discarded (Figure 7.2-C).[505] The 2,062 proteins remaining represented the
measurable protein content of podocytes. MS analysis of total cell lysates will not
produce an exhaustive list of all proteins contained in a cell, as low-abundance proteins
are likely to remain undetected. However, processing of the data observed may still be
informative. Proteins detected by MS of known importance to podocyte function[510]
included: CD2-associated protein, α-actinin 4, zonula occludens protein 1, utrophin,
erzin, integrin β1, integrin αV, and integrin β5. Important podocyte proteins that were
not detected included: nephrin, podocin, synaptopodin and podocalyxin.
In order to understand the cellular compartments from which these 2,062 proteins
originated, gene ontology analysis was performed using a combination of DAVID,[506,
507] and the Enrichment map software plug-in for Cytoscape.[508] Results are shown
in Figure 7.4 and show that proteins were sampled from a wide range of cellular
compartments including the cytosol, nucleus, mitochondria, and cell membrane. I
proceeded to investigate the function of the proteins identified, and one of the biological
processes enriched was cytoskeletal regulation (Figure 7.5).
Next I focussed on proteins whose expression changed significantly following 24 hours
of treatment with Gc. Proteins which showed a 2-fold change (either up or down) and a
false discovery rate adjusted p value (q value) of <0.05 were considered to be Gc-
regulated (Figure 7.2-C). 53 proteins were identified and are listed in Supplementary
Table 10.3. Gene ontology analysis was performed using Ingenuity software for the
term ‘molecular and cellular functions’ and ‘cell movement’ was a highly enriched term
(Figure 7.6). ‘Cell death and survival’ was the most significant term, in keeping with
previous links to Gc and apoptosis.[110, 511]

192
Figure 7.1 Principal component analysis of optimisation samples
To decide whether 12 hours or 24 hours of treatment with Gc was a more appropriate time to
assess the global translational change exerted by Gc on wild-type podocytes, total cell lysates
were prepared and compared with samples from vehicle-treated podocytes using mass
spectrometry. Principal component analysis of identified peptides revealed a clustering of 24
hour treated samples, while samples treated for 12 hours were more widely dispersed.

193
Figure 7.2 MS samples
Total cell lysates were prepared from wild type podocytes treated with vehicle (-Gc) or Gc
(+Gc) for 24 hours. Samples were analysed by mass spectrometry (MS) to define the podocyte
proteome and understand global proteomic changes exerted by Gc exposure. (A) shows western
blot of vehicle-treated samples (S1-S3) and Gc-treated samples (S4-S6) using a human GR
antibody. Reduced expression of GR is demonstrated, suggesting Gc treatment had been
effective and samples were suitable for MS analysis. (B) Data were processed using Progenesis
QI software which aligns ion intensity peaks generated by MS to allow protein quantification.
The software automatically selects a reference sample to which all others are aligned.
Alignment scores for the samples are shown; scores >50% are considered acceptable. (C) For
analysis of the global podocyte proteome, only proteins identified by 2 or more unique peptides
were used, and Gc-regulated proteins were considered to be those showing a fold change of >
2.0 and a false discovery rate adjusted p value (q value) of <0.05.

194
Figure 7.3 Principal component analysis of peptide ions detected by mass spectrometry
Mass spectrometry (MS) analysis was performed on samples from human wild type podocytes treated for 24 hours with either vehicle or
Gc. Principal component analysis of MS data was performed using Progenesis QI software, and revealed a clear separation of samples
according to group, suggesting further data analysis was warranted.

195
Figure 7.4 Sub-cellular origin of podocyte proteins identified by mass spectrometry
Mass spectrometry (MS) analysis was performed on total cell lysates from wild type human podocytes treated with vehicle or Gc for 24 hours.
2,062 proteins were identified in total. The sub-cellular localisation of these proteins was identified using a combination of the DAVID web-
based analysis tool (https://david.ncifcrf.gov/) (Gene ontology_BP) and the Enrichment map plug-in on Cytoscape.[508] Settings used in
Cytoscape were as follows: p-value 0.001, q-value 0.05, similarity cut-off (ranging from 0.5-1.0, with 0.5 being least conservative) 1.0.

196
Figure 7.5 Biological functions of proteins identifed by global mass spectrometry anlaysis
Total cell lysates from human wild type podocytes underwent mass spectrometry (MS) analysis to define the podocyte proteome. The 2,062
proteins identified were analysed using DAVID online software (Gene ontology_BP) coupled with the Enrichment map plug-in on Cytoscape
to understand the biological processes with which these proteins were involved. Settings used in Cytoscape were as follows: p-value 0.001, q-
value 0.05, similarity cut-off (ranged from 0.5-1.0, with 0.5 being least conservative) 1.0.

197
Figure 7.6 Gene ontology anlaysis of Gc-regulated proteins
Mass spectrometry analysis of wild type human podocytes treated for 24 hours with either
vehicle or Gc revealed 53 proteins which changed significantly following Gc exposure. Gene
ontology analysis (using the term ‘molecular and cellular functions’) using IPA (Ingenuity)
software revealed important functions with which the GC-regulated proteins were involved.
Terms are listed in order of significance of enrichment. Only terms with –log (p value) > 2 are
displayed.

198
7.4 Discussion
MS is frequently used to study the differential protein expression in complex biological
samples.[512] The classical method for quantitative analysis of protein mixtures
involved protein separation and comparison by two-dimensional polyacrylamide gel
electrophoresis (2D-PAGE), followed by MS.[513] However, spots on a 2D gel often
contain more than one protein, making quantification ambiguous. The development of
‘shotgun’ label-free quantitative proteomics marked a significant advance in our ability
to study complex biological samples.[512]
In this chapter, I used label-free high resolution MS quantification coupled with
Progenesis software to characterise the proteome of human wild type podocytes, and
understand the translational changes stimulated by Gc exposure. I identified 2,062
proteins obtained from podocyte total cell lysates, and demonstrated that the extraction
method isolated proteins from a range of sub-cellular localisations including the
nucleus, cell membrane and cytosol (Figure 7.4). Characterisation of the biological
functions of these podocyte constituent proteins revealed a prominent role for regulators
of the cytoskeleton (Figure 7.5).
A 2005 study from Ransom et al., analysed the proteome of a murine podocyte cell line
using 2D-PAGE to separate proteins before identification by matrix-assisted laser
desorption time-of-flight (MALDI-TOF) MS and peptide fingerprinting.[106] 88
proteins were identified in total. The group reported that the largest class of proteins
found in this group was cytoskeletal proteins, consistent with the view of the podocyte
as a contractile, motile cell (see Section 1.3.4). Podocyte proteins were also extracted 3
days after a 30-minute treatment with either dexamethasone or vehicle, although the
rationale for this time point is not clear in this study. Overall, the study identified 6
proteins, which altered following Gc treatment and none of these were found in my Gc-
regulated protein dataset. This may be due to a variety of factors including: the different
cell line used; the different GR-ligand and length of treatment; or the different MS
method.
Following developments in MS technology, a 2013 study from Boerries et al., used a
linear trap quadrupole (LTQ) Orbitrap mass spectrometer to characterise the proteome
of freshly isolated murine podocytes, and identified 1,280 proteins. In agreement with
my data, cytoskeletal and plasma membrane proteins were prominent constituents of the
podocyte proteome.

199
In order to understand the function of the proteins whose levels altered significantly
following Gc treatment in my dataset, I performed gene ontology analysis. There was a
high correlation between the enriched gene ontology terms found in the Gc-regulated
proteomic dataset and the Gc-regulated transcriptomic dataset (see Chapter 4). Seven
gene ontology terms were common to the top ten most enriched terms in both datasets:
cellular growth and proliferation, cellular development, cellular movement, cell death
and survival, cell morphology, lipid metabolism and molecular transport. The finding
that cellular movement is an enriched gene ontology term following Gc treatment at
both transcriptomic and proteomic level further emphasises the prominent effects that
Gc exposure has on altering the motility of podocytes.

200
8 Podocyte-specific GR deletion in vivo
8.1 Overview
Although Gc treatment has been used for many decades to treat nephrotic syndrome
(NS), the target cell of action has not been defined. Data presented in this thesis and
elsewhere,[102, 109, 110, 119] suggests that Gc has direct effects on the podocyte, and I
hypothesise that the podocyte is the target cell of Gc action in NS. To evaluate this, I
generated a mouse line with a podocyte-specific deletion of GR using the Cre-LoxP
site-specific system.[514]
The Cre (cyclisation recombination) gene encodes a 38 kilo Dalton (kDa) site-specific
DNA recombinase, called Cre, which recognises 34 base-pair (bp), LoxP (locus of X-
over of P1) sites and catalyses recombination between two LoxP sites, excising all DNA
sequences located between. When Cre expression is placed under the control of a tissue-
specific gene promoter, tissue-specific excision of selected genes can occur.[515]
By breeding mice expressing Cre under the control of the podocyte-specific podocin
(Nphs2) promoter, with mice harbouring two LoxP sites in the GR gene (‘GR floxed’
mice), mice with specific deletion of GR in the podocyte were generated. In this
chapter, I show that these mice show no overt baseline phenotype. This work is a
prelude to proposed experiments in which these mice will receive a proteinuria-inducing
challenge [eg, an intraperitoneal lipopolysaccharide injection (LPS)] before treating
with Gc and observing for differences in response between mice with podocyte GR
deletion and control mice.

201
8.2 Chapter-specific methods
8.2.1 Transgenic mouse lines and genotyping
Podocyte-specific GR-knockout mice (Cre+ GRfl/fl) were generated by breeding GRfl/fl
mice,[516] with Nphs2-Cre mice (Jackson Labs 008205). Both lines were on a
C57BL/6 background. Expression of Cre was assessed by reverse transcriptase
polymerase chain reaction (PCR) performed on a DNA template extracted from ear
punches (see Table 8.1 for primers). DNA was isolated using the QIAamp DNA Min
Kit (Qiagen) and PCR performed using the Go Taq Polymerase Kit (Promega)
according to the supplier instructions. Samples were separated by electrophoresis using
1.5% (w/v) agarose gels prepared in 1 X Tris-acetate-EDTA (TAE) buffer (see Section
2.2) supplemented by 1:10,000 (vol/vol) SYBR Safe DNA stain (Life Technologies).
Gels were run at 60 volts for 90 minutes, and the size of the DNA fragments was
determined by comparison with hyperladder IV (Bioline). The size of the DNA bands
are as follows: GR flox allele 275 bp; GR wild-type allele 225 bp; and Cre 600 bp.
Table 8.1 Primers used for mouse genotyping
Primer Sequence (5’ -3’)
Cre forward GGATCATCAGCTACACCAGAGACG
Cre reverse CGCAGAACCTGAAGATGTTCGCGA
GR flox forward GGCATGCACATTACTGGCCTTCT
GR reverse -4 GTGTAGCAGCCAGCTTACAGGA
GR reverse -8 CCTTCTCATTCCATGTCAGCATGT
8.2.2 Isolation of primary murine podocytes using a differential sieving technique
Mice were culled using neck dislocation, in accordance with ‘The Humane Killing of
Animals under Schedule 1 to the Animals (Scientific Procedures) Act 1986.’ Kidneys
were immediately extracted and washed in 1 X phosphate buffered saline (PBS).
Kidneys were decapsulated and the medulla was removed. After cutting the kidney
cortex into small pieces, the tissue was pressed through a 100 µm cell strainer (Becton
Dickinson) and washed with PBS. This crude isolate was then passed through a 70 µM
cell strainer (Becton Dickinson), which trapped glomeruli. Glomeruli were washed with

202
PBS and seeded onto 10-cm diameter culture dishes. Following 10 days of incubation at
37oC with 5% CO2 to allow podocyte outgrowth from glomeruli, cells underwent
immunofluorescence staining (see Section 2.8).
8.2.3 Phenotyping mice
Cre+ GRfl/fl were compared to age- and sex- matched Cre- GRfl/fl controls. 22 mice were
analysed in total (11 per group); the age range was 3 months – 13 months old; further
details are provided in Supplementary Table 10.4. Prior to cull, mice were weighed
and urine obtained (stored at 4oC). 10µL urine sample aliquots were incubated at 95oC
for 5 minutes with an equal volume of sodium dodecyl sulfate (SDS) loading buffer
before electrophoresis on a 4-12% polyacrylamide gel, and staining with InstantBlue
(Expedeon). This allowed visualisation of the degree of albuminuria.
Immediately following culling of the mice, blood samples were obtained. Blood
samples underwent centrifugation at 1,800g at 4oC for 15 minutes to obtain serum. Both
serum creatinine and the urinary protein:creatinine ratio was quantified using an ILAB
600 clinical chemistry analyser (Instrumentation Laboratory).
Kidneys were extracted from the mice. One kidney per animal was prepared for
cryosectioning; one half-kidney per animal was fixed for electron microscopy (EM); the
remaining half-kidney per animal was fixed in 4% paraformaldehyde (PFA) prior to
fixation in paraffin for Hematoxylin and eosin (H&E) staining.
8.2.3.1 Cryosections
Kidneys for cryosectioning were placed in OCT CryoCompond (Klinipath) before a 30
minute incubation on dry ice, and subsequent transfer to -80oC storage. 30µm
cryosections were obtained using a CM3050 (Leica) cryostat. Immunofluorescence
staining on cryosections involved blocking with 1.5% bovine serum albumin (BSA) in
donkey serum for 30 minutes at room temperature before overnight incubation at 4oC
with anti-mouse GR antibody [M20; Santa Cruz; rabbit immunoglobulin G (IgG)] and
anti-nephrin antibody [BP5030; Acris; guinea pig IgG], both using 1:100 dilution. Five
washes with PBS was followed by a 1 hour incubation at room temperature with 1:200
dilution of Alexa Fluor 647 (rabbit) and Alexa Fluor 488 (guinea pig) (Life
Technologies). Five further PBS washes preceeded 10 minute room temperature
incubation with 4',6-diamidino-2-phenylindole (DAPI) nuclear stain (1µg/mL) (Cell

203
Signalling). Slides were washed once with PBS, and twice with Milli Q water
(Millipore) before mounting with ProLong Gold antifade reagent (Molecular Probes).
8.2.3.2 Electron microscopy
Hemi-kidneys were placed immediately into 4% PFA/2.5% glutaraldehyde in 0.1 M 4-
(2-hydroxyethyl)-1-piperazineethanesulfonic acid (HEPES) buffer for 30 minutes at
room temperature. The renal pelvis and medulla was then removed, before specimens
were cut into 2-4 mm2 pieces. These were then re-placed into 4% PFA/2.5%
glutaraldehyde in 0.1 M HEPES for 2 hours at 4oC, before 2 washes with 0.1M HEPES.
Samples were incubated with reduced osmium (OsO4 1% + K4Fe(CN)6 1.5%) for 1
hour, followed by 1% tannic acid in 0.1 M cacodylate buffer for 1 hour and finally with
1% uranyl acetate in water overnight. The next day, samples were dehydrated in a series
of alcohols, and permeated with TAAB LV resin. Ultrathin 70 nm sections were cut
with Leica Ultracut S ultramicrotome and put on formvar/carbon-coated slot grids. The
grids were visualised using a Tecnai 12 Biotwin transmission electron microscope at 80
kV.
8.2.3.3 Hematoxylin and eosin staining
Kidney samples were fixed in 4% PFA prior to processing with a Shandon Citadel 2000
automated tissue processor (Thermo Scientific). Specimens were then embedded in wax
using a ThermoShandon Histocentre2. 5µm sections were prepared using a RM 2155
microtome (Leica).
For H&E staining, sections were deparaffinized and hydrated by incubation of the slides
in xylene, followed by decreasing ethanol series (100%, 95%, 85%, 70%), and finally
washed with PBS. Slides were stained with filtered hematoxylin for 5 seconds, rinsed
with water, dipped five times in acidic solution 1% hydrogen chloride, again rinsed with
water, dipped five times in sodium bicarbonate solution and again rinsed in water. The
slides were transferred to eosin solution for 30 seconds and dehydrated by increasing
percentage of Ethanol (80%, 90%, 100%, 100%) until the slides were incubated in
xylene. Samples were mounted using Roti Histokitt (Roth) mounting medium and
imaged using a 3D Histech Pannoramic 250 Flash II slide scanner.

204
8.3 Results
In order to investigate the role of podocyte GR in mediating the therapeutic effects of
systemic Gc treatment in nephrotic syndrome, a podocyte-specific GR knock-out mouse
line was generated using the Cre-LoxP site-specific recombination system (Figure 8.1-
A).[515] The knockout mouse was generated by crossing mice harbouring LoxP sites in
the GR gene with mice expressing Cre under the control of the gene promoter for the
podcoyte-specific marker podocin (Nphs2).
To verify the genotype of mice, PCR analysis on DNA isolated from ear punches was
performed using primers for the floxed GR gene and the podocin-Cre gene. Back-
crossing of heterozygous floxed mice generated offspring which were either
heterozygous floxed (GRfl/-) or homozygous floxed (GRfl/fl). Cre+ GRfl/fl mice were
expected to have undergone podocyte-specific GR-excision, while Cre- GRfl/fl mice
served as experimental controls (Figure 8.1-B).
To ensure GR-excision had been successful, fluorescent immunohistochemistry was
performed. This showed that GR had successfully been knocked out in Cre+ GRfl/fl
mice, but not in Cre- GRfl/fl mice (Figure 8.1-C). To validate this finding, primary
podocytes were isolated from mice using a differential sieving technique and
immunofluorescence staining was undertaken. This demonstrated the presence of GR in
primary podocytes derived from Cre- GRfl/fl mice, and in non-podocyte glomerular cells
from Cre+ GRfl/fl mice, but not in primary podocytes from Cre+ GRfl/fl mice (Figure
8.2).
These mice were generated with the intention of experimentally inducing proteinuria
(eg, using an LPS intraperitoneal injection),[517] to be followed by systemic Gc
administration and characterisation of the response of Cre+ GRfl/fl and Cre- GRfl/fl mice.
Here, I present data examining the phenotype of the mice without induced kidney
damage. Twenty-two mice (11 Cre+ GRfl/fl mice and 11 Cre- GRfl/fl age- and sex-
matched controls; see Supplementary Table 10.4) were investigated using a variety of
methods (Figure 8.3). No difference in kidney size, total body weight, degree of
proteinuria, serum creatinine (a biomarker for kidney function) or kidney structure at
light microscopy or ultrastructural level was detected (Figure 8.4).

205
Figure 8.1 Generation of Cre+ GR fl/fl mice
In order to achieve a podocyte-specific knock-out of GR, mice harbouring Cre recombinase whose
expression was driven by the podocyte-specific promoter of the NPHS2 (podocin) gene were
crossed with mice containing LoxP sites in the GR gene. Only podocytes expressed Cre, and
therefore experienced cell-specific GR knock-out (A). DNA from mice extracted from ear punches
was genotyped using polymerase chain reaction (PCR). Third generation mice contained either one
GR LoxP allele (GR fl/-) or two (GRfl/fl). Cre- GR fl/fl mice acted as controls, while Cre+ GRfl/fl mice
underwent podocyte-specific GR excision The GR flox allele was identified as a 275 base pair (bp)
band, and the wild type allele as a 225bp band following gel electrophoresis (B). To ensure GR had
been excised from podocytes in Cre+ GRfl/fl mice, fluorescence immunohistochemistry was
performed on murine kidney cryosections using antibodies for mouse GR, the podocyte-specific
marker nephrin, as well as 4',6-diamidino-2-phenylindole (DAPI) nuclear stain. Podocyte-specific
GR deletion was demonstrated in Cre+ GRfl/fl mice (C).

206
Figure 8.2 Immunofluorescence images of murine primary podocytes in culture
To verify that podocyte-specific deletion of GR had been achieved in Cre+ GRfl/fl mice but not
in control Cre- GRfl/fl mice, primary podocytes were isolated from murine kidney samples using
a differential sieving technique. Primary podocytes subsequently underwent
immunofluorescence using 4',6-diamidino-2-phenylindole (DAPI) nuclear stain, and antibodies
for mouse GR, and the podocyte-specific marker nephrin. Cre- GRfl/fl mice showed GR staining
in podocytes, while Cre+ GRfl/fl mice showed staining in non-podocyte cells of glomerular
origin, but not in podocytes, verifying the knock-out had been successful. Podocytes used for
staining in this figure were obtained from 10 month old male mice. Immunofluorescence images
were visualised on a Delta Vision (Applied Precision) restoration microscope using a 40x/ 0.85
objective and collected using a Coolsnap HQ (Photometrics) camera.

207
Figure 8.3 Phenotype of Cre+ GRfl/fl mice.
Legend on next page.

208
To understand if the loss of GR in the podocyte causes a disturbance of glomerular function
without inducing kidney damage, mice with podocyte specific deletion of GR (Cre+ GRfl/fl)
were generated and compared to age- and sex-matched controls (Cre- GRfl/fl). Twenty-two mice
were examined in total (eleven in each group). The mice varied in age from 3 months-13
months old. No difference in kidney size (A) and (B); serum creatinine (C); or body weight (D)
was observed between groups. (E) shows a 4-12% polyacrylamide gel stained with InstantBlue
after 10µL mouse urine was loaded into each lane. Bovine serum albumin (BSA) was loaded as
a control to non-quantitatively demonstrate the degree of albuminuria, which is a marker of
glomerular filtration. Total urinary protein excretion normalised to urinary to creatinine (to
correct for urinary flow rates) is shown in (F). The observation that males have a higher level of
proteinuria at baseline than females is well-known, and reproducing this finding here provides
confidence the assay is functioning adequately.[518] No gross structural glomerular defects are
observed following hematoxylin and eosin staining of mice kidney specimens. Groups in (F)
were compared using the nonparametric Mann-Whitney U test. **=p value 0.0061, *=p value
0.0106, N.S= not significant. MM=molecular marker, kDa= kilo Daltons; MUPs=major urinary
proteins.[519]

209
Figure 8.4 Glomerular ultrastructure of Cre+ GRfl/fl mice
Electron microscopy was performed on kidney specimens obtained from control mice (Cre- GRfl/fl ) (A) and mice with a podocyte specific deletion of GR
(Cre+ GRfl/fl ) (B). Glomerular ultrastructure of Cre+ GRfl/fl mice appeared normal. Images shown are from two female 11-month old mice born in the same
litter. GBM=glomerular basement membrane; FP=foot process; SD=slit diaphragm; Pod=podocyte cell body; CL=capillary lumen, Ery=erythrocyte,
EF=endothelial fenestra; MP=major process.

210
8.4 Discussion
Targeted GR deletion has been performed in several tissues using the Cre-LoxP system.
These have included GR excision from neuronal cells, which led to impairment in
regulation of the hypothalamus-pituitary-adrenal (HPA)-axis (and the development of a
Cushingoid-like phenotype),[516, 520] and the demonstration that monocyte-specific
loss of GR confers resistance to Gc-treatment in LPS-induced acute lung injury.[521]
With regards to the kidney, Goodwin et al., investigated the mechanism of Gc-induced
hypertension, which had traditionally been attributed to promiscuous activation of the
mineralocorticoid receptor (MR) by Gc. However, global MR-knockout mice still
experience a Gc-induced increase in systemic blood pressure,[522] and RU28362, a
pure GR-agonist devoid of MR-activity induces mineralocorticoid-like effects in
cultured collecting duct cells, which is blocked by Gc-, but nor MR-, antagonists.[523]
These data suggest Gc-induced hypertension is independent of MR. The group
generated mice with a GR knockout in the distal nephron, and found these mice had a
mild elevation of baseline blood pressure, but a similar hypertensive response to Gc
compared to control mice, suggesting GR in the distal nephron is not necessary for Gc-
induced hypertension.[524]
Here, I generated a mouse line with a specific GR deletion in the podocyte. These mice
do not appear to have an overt phenotype at baseline. To understand the role podocyte
GR has in mediating the therapeutically beneficial effects of systemic Gc therapy in NS,
Dr. Lennon’s group will experimentally induce proteinuria in these mice, before treating
with Gc and observing if any difference in response between Cre+ GRfl/fl mice and Cre-
GRfl/fl mice is observed. A diminished response to Gc in Cre+ GRfl/fl mice would be
strong evidence that the podocyte is the key cell mediating therapeutically beneficial
effects in NS and would help to inform future discovery of novel drug targets.

211
9 General discussion and perspectives
Work presented in this thesis has demonstrated that podocytes in vitro are directly
responsive to Gc exposure and produce effects which may be clinically relevant
(Chapter 3). Analysis of the Gc-regulated transcriptome (Chapter 4) suggested that
effects on podocyte motility may be responsible for this protective effect. Interrogation
of the mechanisms underpinning the Gc-induced hypomobile cell phenotype highlighted
a potential role for Rac1, and demonstrated that Rac1 inhibition may have a functionally
protective effect against puromycin aminonucleoside (PAN) or lipopolysaccharide
(LPS), which are both proteinuria-inducing agents (Chapter 5). The development of a
mouse line with a podocyte-specific deletion of GR (Chapter 6) may provide data in the
future addressing the importance of the podocyte in mediating therapeutically useful
anti-proteinuric effects in vivo, and contribute to an understanding of the target of novel
tissue-specific drug therapies.
Currently, the clinical response to treatment with Gc separates children with nephrotic
syndrome (NS) into two groups: a Gc-resistant group (SRNS) in which patients have a
high chance of developing chronic kidney disease (CKD), and a Gc-sensitive group
(SSNS) who typically experience a favourable long-term outcome, but risk short-term
morbidity from disease relapses and Gc-exposure.[525] Although the pathogenesis of
the disease in the two groups, and between individuals within the same group, is known
to be different in many cases,[179] the drug-therapies employed for SSNS and SRNS
are very similar.
NS has traditionally been viewed as a disease of immune system dysfunction, and
following the discovery of Gc-efficacy in the treatment of proteinuria, strategies to
identify new drug therapies have focussed on alternative immunosuppressive
agents.[525] Although the majority of agents known to be effective in NS have
immunosuppressive properties, direct podocyte-specific effects have been identified as
the key mechanism for some drugs including ciclosporin and the anti-CD20 antibody
rituximab.[103, 526] These observations have built on extensive evidence
demonstrating that the podocyte is the key target-site of injury in NS,[36, 527] and
stimulated the search for podocyte-specific therapies, which may yield more efficacious
drugs with an improved side-effect profile.

212
For example, Clement et al., noted increased podocyte expression of a hyposialylated
version of the glycoprotein angiopoietin-like-4 (Angptl4) in human minimal change
disease (see Section 1.5.1.1). The group also developed a transgenic rat model, the
NPHS2-Angpltl4 rat, and found that these rats developed classical features of NS
including proteinuria, foot process effacement and loss of glomerular basement
membrane charge. Furthermore, conversion of this hyposialylated Angptl4 to sialylated
Angptl4 in rodents using oral administration of the sialic acid precursor acetyl-D-
mannosamine (ManNAc) reduced proteinuria.[199] Sialylation-based therapies hold
promise for the treatment of NS in the future.[528]
Some evidence has implicated the p38 mitogen-activated protein kinase (p38 MAPK)
pathway in the development of NS, including the observation of increased p38 MAPK
activation in podocytes in biopsy samples from adults with NS. Additionally, treatment
with an inhibitor of the p38 MAPK pathway led to reduced proteinuria in puromycin
aminonucleoside (PAN)- and adriamycin –induced nephropathy.[529] p38 MAPK is
downstream of protein kinase C α (PKCα), and both kinases are activated by
transforming growth factor β (TGF-β).[530] It has been shown that loss of PKCα had
podocyte-protective effects in mice following streptozotocin-induced diabetic
nephropathy.[531] Therefore, inhibition of p38 MAPK and PKC α represent a potential
strategy to treat patients with NS.[525]
Stress-induced disturbance of protein-folding in the endoplasmic reticulum, called the
unfolded protein response (UPR), may have a role in some genetic forms of NS, caused
by mutations in nephrin, podocin and α–actinin-4.[532, 533] Potential future therapeutic
approaches to stabilise protein folding homeostasis in podocytes may involve increasing
the expression of relevant protein chaperones or increasing proteasome system
activity.[525] NS in some patients is caused by mutations in the TRPC6 gene (transient
receptor potential cation channel, subfamily C, member 6). The observation that
ciclosporin can downregulate TRPC6 mRNA, suggests this may be an effective
approach in patients with mutations resulting in elevated TRPC6 activity.[534]
Podocyte replacement therapy using stem cells for genetic aetiologies of NS may be
possible in the future, but this approach is in its infancy.[535]
It is not yet known whether other therapies currently used to treat NS also have effects
on Rac1, or whether this is a Gc-specific effect. An approach which may prove useful to
identify alternative medication for NS would be to investigate whether drugs currently

213
used for other indications could be ‘re-purposed ‘as anti-proteinuric agents. For
example, the thiazolidinediones are ligands of the nuclear hormone receptor peroxisome
proliferator-activated receptor γ (PPARγ), which are used for the treatment of type 2
diabetes.[525] The thiazolinedione pioglitazone has been shown to protect against the
progression of PAN-induced glomerulosclerosis in vivo,[536] and to protect cultured
podocytes against PAN-induced cytoskeletal disruption, to increase GR phosphorylation
and enhance the transcriptional activity of GR in vitro.[537] This suggests the
thiazolidinediones may have potential clinical utility as either primary or adjunctive
therapy in NS.
The transcriptomic analysis presented in Chapter 4 may act as a resource for hypothesis-
generation for other studies aiming to understand how Gc exerts an anti-migratory effect
on podocytes. Gene ontology analysis suggested Gc has prominent effects on podocyte
motility, but it is currently unclear whether this occurs through a single, key mechanism
or via multiple, contributory pathways. It is also unclear at which stage of the cell
motility cycle (cell-extracellular matrix interaction; signalling instigated by a pro-
migratory stimulus; cell polarisation; or recycling of cellular motility machinery) (see
Section 1.7.1) Gc acts. The family of small GTPases regulate many aspects of the cell
motility cycle, eg, Rac1 has roles in regulating the turnover of cell-extracellular matrix
adhesions as well as in the formation of lamellipodia.[373]
One striking feature of the transcriptomic data was the lack of guanine nucleotide
exchange factors (GEFs), GTPase-activating proteins (GAPs), and guanine nucleotide-
dissociation inhibitors (GDIs), which constitute the immediate regulators of the small
GTPases. This suggests that Gc-effects are mediated further upstream. Indeed, many of
the Gc-regulated genes identified by IPA® as having roles in cell motility would be
predicted to be regulating the interaction of the podocyte with external stimuli
(Supplementary Table 10.1). Examples of this include transforming growth factor
receptor β (TGF-β) 1 and 3, responsible for signal transduction of proteinuria-inducing
agents such as tumour necrosis factor α and TGF-β [538] and urokinase plasminogen
activator, which acts as a ligand at the urokinase-type plasminogen activator receptor
(see Section 1.5.1.1), which may affect podocyte motility via β3 integrin.[202]
In this thesis, I presented in vitro evidence suggesting Rac1 inhibition may warrant
further study as a potential novel anti-proteinuric therapy. Previous data supporting the
use of drugs affecting podocyte motility in reducing proteinuria include the use of

214
inhibitors of ROCK (a downstream effector of RhoA) in acute PAN-nephrosis in
rats,[424] as well as ROCK and Rac1 inhibition in a murine 5/6th nephrectomy model of
chronic kidney damage.[434] Furthermore, in mice with mutations in the Arhgdia gene,
which is known to cause NS in humans,[432] Rac1 inhibition has been shown to be
effective at reducing proteinuria. Whether Rac1 inhibition is effective in non-genetic
forms of NS (and genetic forms other than those arising from Arhgdia mutations) has
not been evaluated. Robust data concerning the systemic side-effect profile of Rac1
inhibition in animal models is currently lacking.
Podocyte hypermotility is a prominent feature of proteinuric kidney disease,[132] and
data in this thesis has demonstrated that Gc, which represent the first-line therapy for
NS in children, reduces podocyte motility. Although future studies targeting pathways
involving the small GTPases may uncover new and efficacious anti-proteinuric
therapies, another potential strategy which is currently unexplored may be to block pro-
migratory signals (or provide anti-migratory signals), rather than directly target the
cellular motility machinery.[539] Additionally, the potential role of selective GR
agonists (SEGRAs) in clinical practice, which preferentially induce the transrepression
and the not the transactivation function of GR, is still unclear.[540] The next step in
understanding whether Rac1 inhibition may play a role in the treatment of NS will be to
investigate whether these agents are effective in rodent models of acute proteinuria.
More broadly, a deeper understanding of the various aetiologies underpinning NS in
discrete patient groups, may one day yield not only podocyte-specific, but also patient-
specific, therapies.
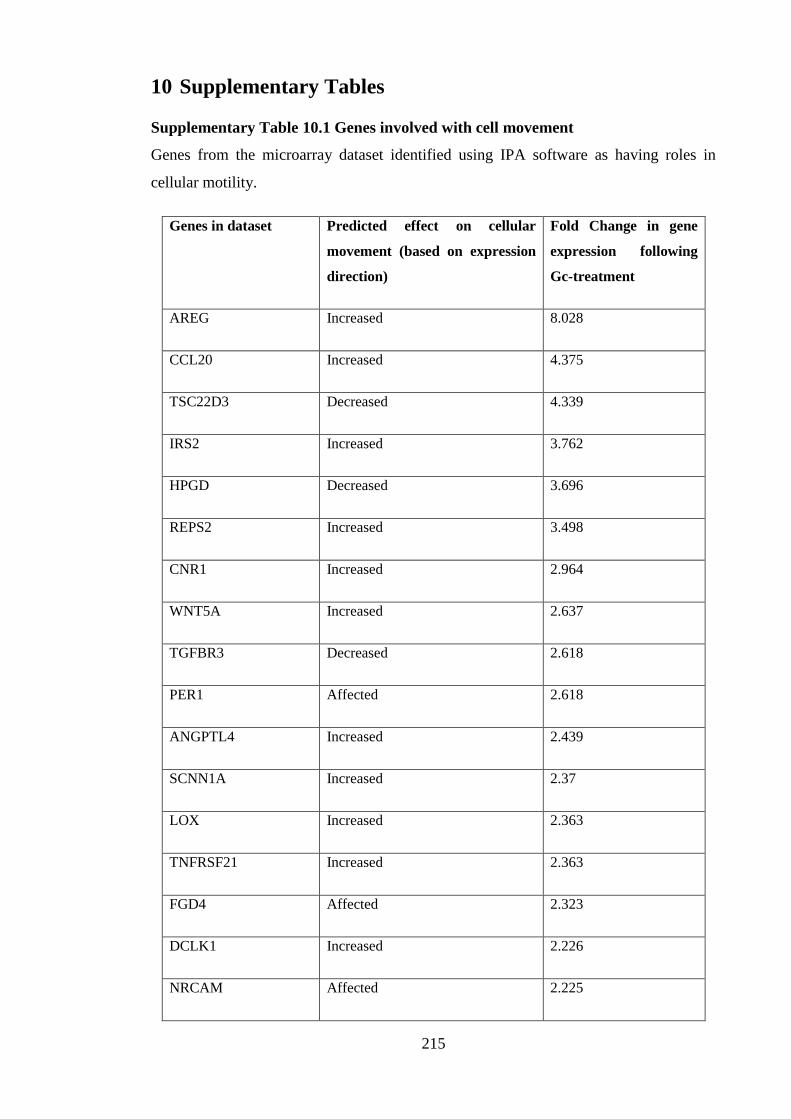
215
10 Supplementary Tables
Supplementary Table 10.1 Genes involved with cell movement
Genes from the microarray dataset identified using IPA software as having roles in
cellular motility.
Genes in dataset Predicted effect on cellular
movement (based on expression
direction)
Fold Change in gene
expression following
Gc-treatment
AREG Increased 8.028
CCL20 Increased 4.375
TSC22D3 Decreased 4.339
IRS2 Increased 3.762
HPGD Decreased 3.696
REPS2 Increased 3.498
CNR1 Increased 2.964
WNT5A Increased 2.637
TGFBR3 Decreased 2.618
PER1 Affected 2.618
ANGPTL4 Increased 2.439
SCNN1A Increased 2.37
LOX Increased 2.363
TNFRSF21 Increased 2.363
FGD4 Affected 2.323
DCLK1 Increased 2.226
NRCAM Affected 2.225

216
RGCC Decreased 2.132
TGFBR1 Increased 2.069
COL4A3 Affected 2.063
ST3GAL6 Increased 2.036
SERPINE1 Increased 2.017
TNFSF4 Increased 1.975
DNAJB4 Decreased 1.967
PDE4DIP Increased 1.95
EDN2 Increased 1.932
CCBE1 Increased 1.905
NDRG1 Decreased 1.891
NPR1 Increased 1.881
PRKX Increased 1.869
IL1R1 Increased 1.85
HRH1 Increased 1.826
DUSP1 Decreased 1.794
NEDD9 Increased 1.789
MAP2 Increased 1.773
CEBPD Increased 1.77
SLC1A3 Increased 1.751
TNFAIP3 Decreased 1.741
MYO9A Decreased 1.73

217
DCN Decreased 1.725
UNC5A Increased 1.7
CD200 Decreased 1.688
GCNT1 Increased 1.684
DKK1 Decreased 1.621
EFNB2 Increased 1.616
ITGB6 Increased 1.608
CRYAB Decreased 1.588
MALAT1 Increased 1.583
PTPN1 Decreased 1.581
APBB2 Affected 1.578
FOXC2 Increased 1.574
FPR1 Increased 1.57
PTGER4 Increased 1.568
KCNN4 Increased 1.559
LEF1 Increased 1.543
HIPK2 Increased 1.532
ST6GALNAC2 Increased 1.52
WWTR1 Increased 1.518
KLF4 Decreased 1.517
IL6ST Increased 1.516
EPB41L5 Affected 1.503

218
GATA6 Decreased -1.504
SHC4 Decreased -1.523
EGR1 Decreased -1.526
IL1B Decreased -1.535
SHC3 Affected -1.544
GDF15 Increased -1.546
KALRN Decreased -1.559
ACKR4 Decreased -1.56
GDF5 Increased -1.576
NR2F2 Affected -1.579
ARID5B Affected -1.59
VEGFC Decreased -1.593
TNFRSF9 Decreased -1.593
SPATA13 Affected -1.595
TNFRSF19 Decreased -1.596
FOXC1 Decreased -1.601
BMP6 Decreased -1.61
TFPI2 Increased -1.629
CD274 Decreased -1.67
FGF5 Decreased -1.676
SEMA3A Increased -1.693
CSF2 Decreased -1.702

219
CCL2 Decreased -1.707
TM4SF1 Decreased -1.711
GRIA3 Decreased -1.712
PLAU Decreased -1.749
SERPINB2 Decreased -1.774
SPRY2 Increased -1.8
VCAM1 Decreased -1.827
GDNF Decreased -1.859
JAG1 Increased -1.866
TBX3 Decreased -1.902
ADAMTS1 Decreased -1.905
TNFSF10 Affected -1.945
HBEGF Decreased -1.949
NOG Decreased -1.958
PTHLH Decreased -2.015
ASB2 Decreased -2.076
NPPB Increased -2.104
TRIB1 Affected -2.176
CYP1B1 Affected -2.28
TNFRSF11B Decreased -2.361
IL1A Decreased -2.57
IL11 Decreased -3.365

220
Supplementary Table 10.2 Fifty most enriched GR-binding sites
GR binding sites (GBS) were found in human wild type podocytes using ChIP-Seq. Significant peaks were considered to be those enriched
≥5 fold over background. 1,130 significant peaks were identified, and the fifty most enriched GBS are listed here.
Region Chr Start End Fold
Enrichment
Nearest gene
(bp)
Gene Symbol Gene description
1 chr2 223317027 223317545 29.1 27936 SGPP2 Sphingosine-1-phosphate
phosphatase 2
2 chr7 50569772 50571094 26.5 29192 LOC100129427 LOC100129427
3 chr1 214366320 214367099 26.4 87655 SMYD2 SET and MYND domain
containing 2
4 chr6 35569364 35570046 26.2 28417 FKBP5 FK506 binding protein 5
5 chr20 36618962 36619683 24.1 3240 AK123872 AK123872
6 chr5 172295520 172296569 24.0 2723 BX648961 BX648961
7 chr11 114033325 114035178 23.9 87600 ZBTB16 Zinc finger and BTB
domain containing 16
8 chr6 12354677 12355272 23.4 57398 EDN1 Endothelin 1

221
9 chr5 150159635 150160516 22.2 2359 C5orf62 Small integral membrane
protein 3
10 chr6 11621331 11621909 22.1 37613 TMEM170B Transmembrane protein
170B
11 chr3 183088238 183089228 21.8 56992 MCF2L2 MCF.2 cell line derived
transforming sequence-
like 2
12 chr4 154925049 154926354 21.4 215773 SFRP2 Secreted frizzled-related
protein 2
13 chr10 30235653 30236933 20.3 65672 KIAA1462 KIAA1462
14 chr6 35699388 35700360 20.3 4962 ARMC12 Armadillo repeat
containing 12
15 chr3 193586491 193587594 19.5 24912 AK091265 AK091265
16 chrY 58838291 58838985 19.2 261714 SPRY3 Sprouty homolog 3
17 chr3 138316178 138316661 19.0 3209 CEP70 Centrosomal protein
70kDa
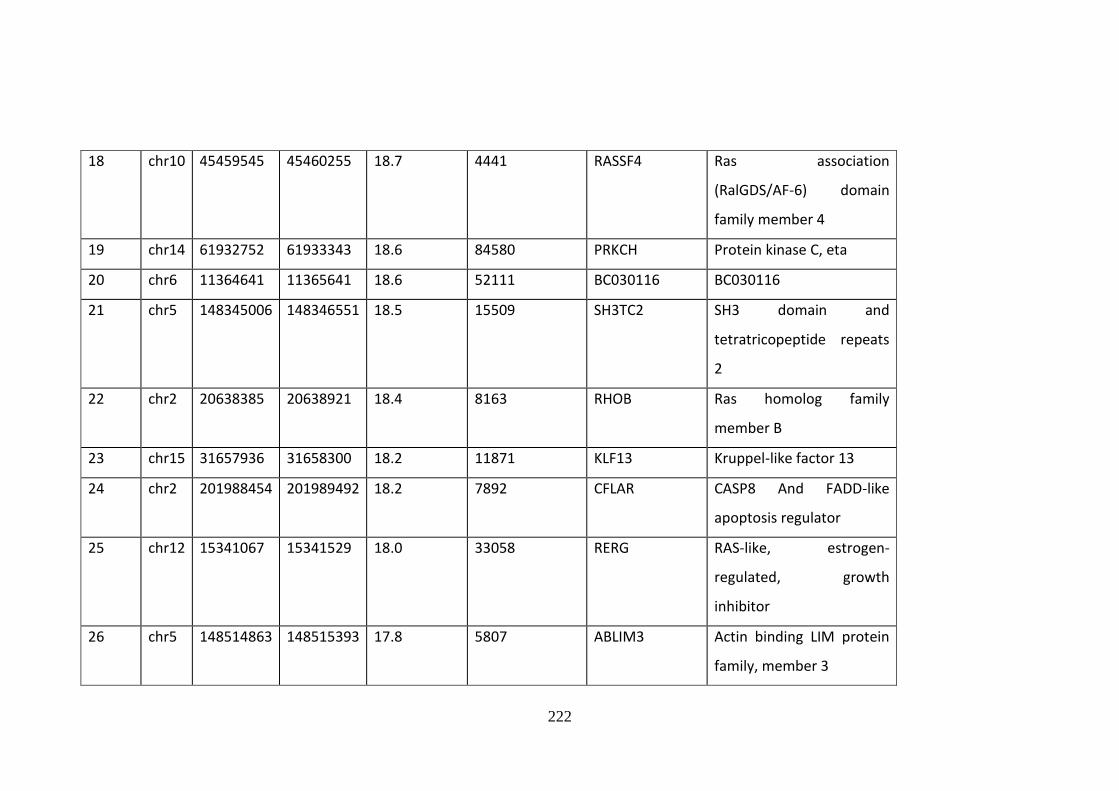
222
18 chr10 45459545 45460255 18.7 4441 RASSF4 Ras association
(RalGDS/AF-6) domain
family member 4
19 chr14 61932752 61933343 18.6 84580 PRKCH Protein kinase C, eta
20 chr6 11364641 11365641 18.6 52111 BC030116 BC030116
21 chr5 148345006 148346551 18.5 15509 SH3TC2 SH3 domain and
tetratricopeptide repeats
2
22 chr2 20638385 20638921 18.4 8163 RHOB Ras homolog family
member B
23 chr15 31657936 31658300 18.2 11871 KLF13 Kruppel-like factor 13
24 chr2 201988454 201989492 18.2 7892 CFLAR CASP8 And FADD-like
apoptosis regulator
25 chr12 15341067 15341529 18.0 33058 RERG RAS-like, estrogen-
regulated, growth
inhibitor
26 chr5 148514863 148515393 17.8 5807 ABLIM3 Actin binding LIM protein
family, member 3

223
27 chr3 156533918 156535227 17.7 93 LOC730091 LOC730091
28 chr20 45945734 45946666 17.6 968 LOC100131496 LOC100131496
29 chr11 18287113 18287811 17.5 118 SAA1 Serum amyloid A1
30 chr11 117685197 117685812 17.4 5109 FXYD6-FXYD2 FXYD6-FXYD2 readthrough
31 chr20 39876961 39877667 17.3 51181 ZHX3 Zinc fingers and
homeoboxes 3
32 chr14 95065420 95065978 17.2 6111 SERPINA5 Serpin peptidase inhibitor,
clade A (alpha-1
antiproteinase,
antitrypsin), Member 5
33 chr3 137906808 137907408 17.1 827 ARMC8 Armadillo repeat
containing 8
34 chrX 3615747 3616222 16.7 15597 PRKX Protein kinase, X-linked
35 chrX 53100807 53101239 16.7 8712 GPR173 G protein-coupled
receptor 173
36 chr2 28021744 28022146 16.5 17604 RBKS Ribokinase

224
37 chr19 3336548 3337745 16.5 29562 NFIC Nuclear factor I/C (CCAAT-
binding transcription
factor)
38 chr17 8057351 8058251 16.3 1956 PER1 Period circadian clock 1
39 chr2 95981725 95983724 16.0 18763 KCNIP3 Kv channel interacting
protein 3, calsenilin
40 chrX 106920267 106920942 15.9 26068 PRPS1 Phosphoribosyl
pyrophosphate synthetase
1
41 chr9 118412097 118412738 15.8 84114 U2 U2 (snRNA)
42 chr7 40261462 40261820 15.7 86968 C7orf10 Succinate-
hydroxymethylglutarate
CoA-transferase
43 chr3 187938677 187939318 15.7 8164 LPP LIM domain containing
preferred translocation
partner in lipoma
44 chr7 100743474 100744126 15.7 9649 TRIM56 Tripartite motif containing
56
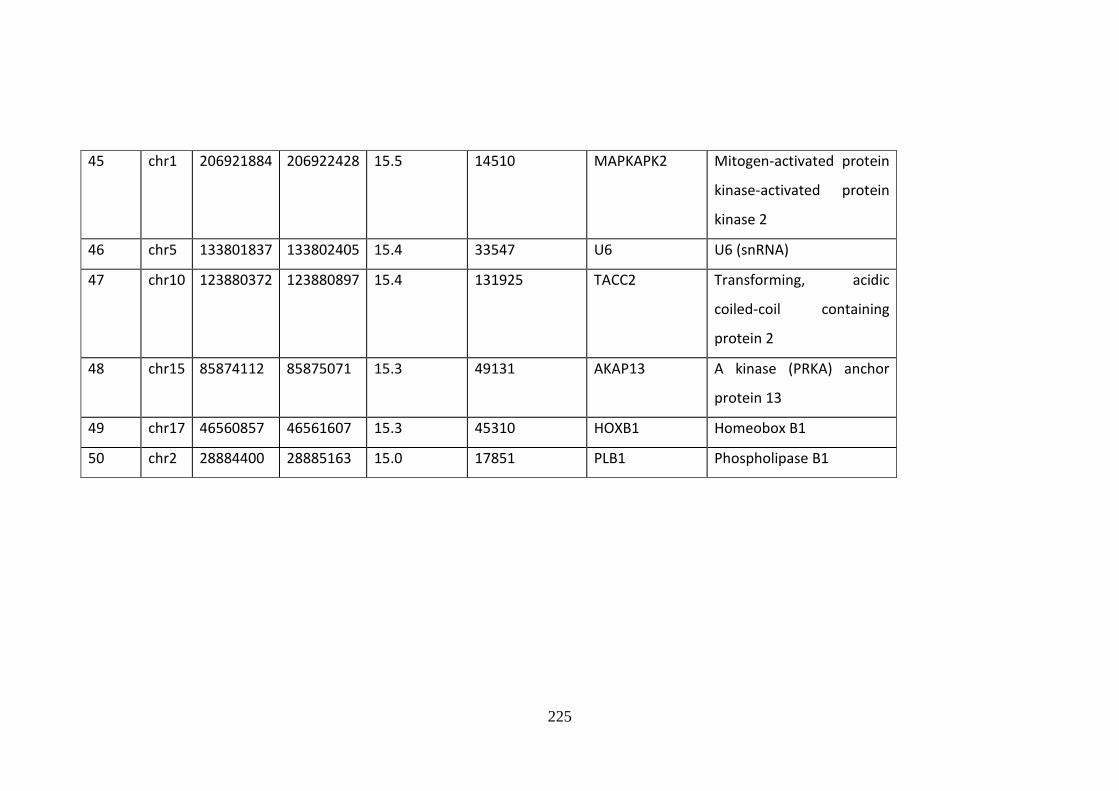
225
45 chr1 206921884 206922428 15.5 14510 MAPKAPK2 Mitogen-activated protein
kinase-activated protein
kinase 2
46 chr5 133801837 133802405 15.4 33547 U6 U6 (snRNA)
47 chr10 123880372 123880897 15.4 131925 TACC2 Transforming, acidic
coiled-coil containing
protein 2
48 chr15 85874112 85875071 15.3 49131 AKAP13 A kinase (PRKA) anchor
protein 13
49 chr17 46560857 46561607 15.3 45310 HOXB1 Homeobox B1
50 chr2 28884400 28885163 15.0 17851 PLB1 Phospholipase B1

226
Supplementary Table 10.3 Gc-regulated proteins
Human wild type podocytes were treated with Gc or vehicle for 24 hours, and proteins
significantly changing following Gc exposure were identified by mass spectrometry. In total
2,062 proteins were identified and the 53 proteins whose expression level significantly altered
following Gc treatment are listed below.
Gene Symbol Protein
Fold Change
(+Gc/-Gc)
OLA1 Obg-like ATPase 1 25.2
PPP6R3
Isoform 5 of Serine/threonine-protein
phosphatase 6 regulatory subunit 3 22.2
RTN4 Reticulon
12.0
GSR Glutathione reductase, mitochondrial 7.8
FDFT1 Squalene synthase 6.5
SAA1 Serum amyloid A-1 protein 6.5
4 SV Uncharacterized protein 6.0
SMARCC2
SWI/SNF complex subunit SMARCC2 5.9
ADK Adenosine kinase 5.9
CAPNS1 Calpain small subunit 1 5.1
CDC42 Cdc42 effector protein 1 4.8
HSP90AB3P Putative heat shock protein HSP 90-beta-3 4.8
AFG3L2 AFG3-like protein 2 4.6
HAUS6 HAUS augmin-like complex subunit 6 4.3
PSME2 Proteasome activator complex subunit 2 4.1
NAGA Alpha-N-acetylgalactosaminidase
3.9
RAB34 Ras-related protein Rab-34, isoform NARR 3.7

227
CTSD Cathepsin D 3.3
NUP93 Nuclear pore complex protein Nup93 3.2
PSMB2 Proteasome subunit beta type-2 3.1
SERPINB8 Serpin B8 3.1
LGALS1 Galectin-1 3.0
NAP1L4 Nucleosome assembly protein 1-like 4 2.8
DOK1 Docking protein 1 2.6
CCT6A T-complex protein 1 subunit zeta 2.6
GOLT1B Vesicle transport protein GOT1B 2.4
ATL3 Atlastin-3 2.4
LYPLA1 Acyl-protein thioesterase 1 2.3
NIT1 Nitrilase homolog 1 2.2
PDXK Pyridoxal kinase 2.2
AKR1A1 Alcohol dehydrogenase [NADP(+)] 2.2
NUBP2 Cytosolic Fe-S cluster assembly factor NUBP2 2.2
ERP44 Endoplasmic reticulum resident protein 44 2.1
PHB Prohibitin 2.1
CDC2
Cell division cycle 2, G1 to S and G2 to M,
isoform CRA_a 2.0
HSPD1 60 kDa heat shock protein, mitochondrial 2.0
SPTLC2 Serine palmitoyltransferase 2 0.49
TRIM25 E3 ubiquitin/ISG15 ligase TRIM25 0.49
HSPBP1 Hsp70-binding protein 1 0.47
ADH5 Alcohol dehydrogenase class-3 0.43
ABR
Active breakpoint cluster region-related
protein 0.42
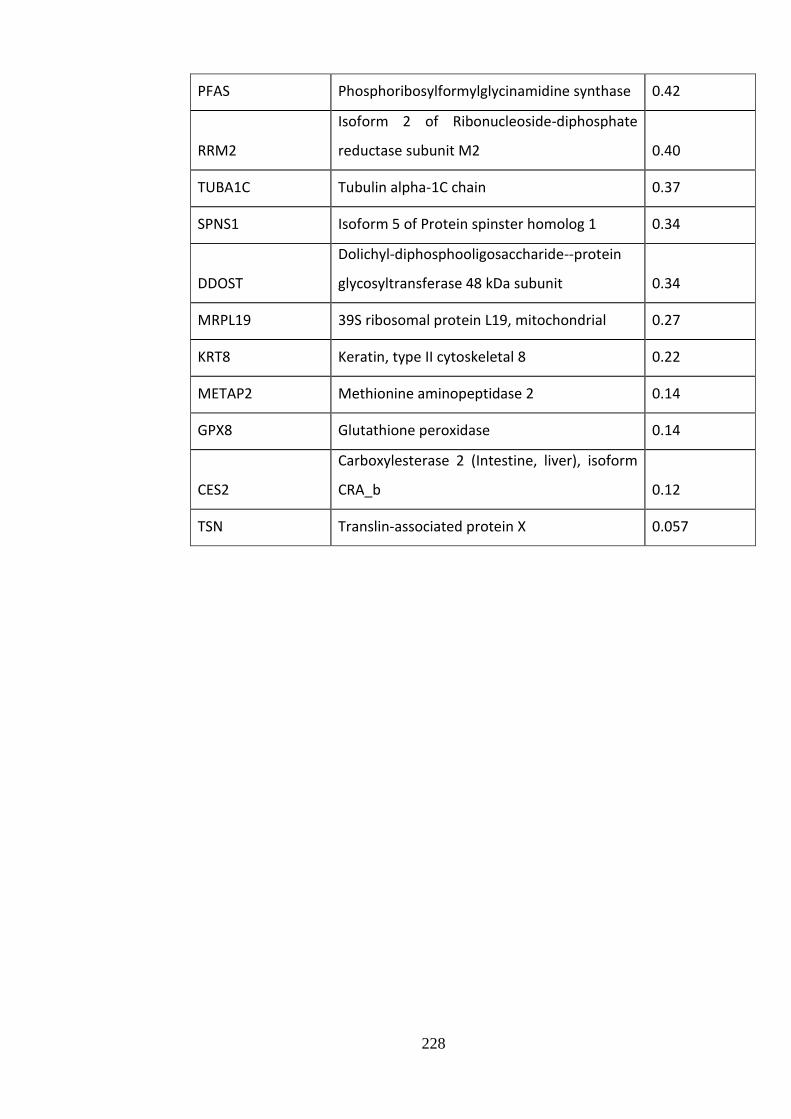
228
PFAS Phosphoribosylformylglycinamidine synthase 0.42
RRM2
Isoform 2 of Ribonucleoside-diphosphate
reductase subunit M2 0.40
TUBA1C Tubulin alpha-1C chain 0.37
SPNS1 Isoform 5 of Protein spinster homolog 1 0.34
DDOST
Dolichyl-diphosphooligosaccharide--protein
glycosyltransferase 48 kDa subunit 0.34
MRPL19 39S ribosomal protein L19, mitochondrial 0.27
KRT8 Keratin, type II cytoskeletal 8 0.22
METAP2 Methionine aminopeptidase 2 0.14
GPX8 Glutathione peroxidase 0.14
CES2
Carboxylesterase 2 (Intestine, liver), isoform
CRA_b 0.12
TSN Translin-associated protein X 0.057

229
Supplementary Table 10.4 Details of mice
Mice with a podocyte-specific deletion of GR (Cre+ GRfl/fl ) underwent a variety of analyses with control mice (Cre- GRfl/fl ) to understand if GR has a role
in maintaining baseline glomerular function. No overt phenotype was detected. Details of the mice are provided here.
Cre
- G
Rfl
/fl
Sex Age at Cull
(months)
Body
weight
(g)
Kidney
length
(mm)
Urine
protein:Cr
ratio
Serum
Creatinine
(umol/L)
Cre
+ G
Rfl
/fl
Sex Age at Cull
(months)
Body
weight
(g)
Kidney
length
(mm)
Urine
protein:Cr
ratio
Serum
Creatinine
(umol/L)
M 13 45.6 13 13.11 79 M 13 45.38 9 6.12 67
F 10 36.7 10 3.45 n/a F 10 28.1 10 4.44 n/a
F 10 30.2 11 3.01 84 F 10 36.4 11 2.58 50
F 10 28.9 10 2.02 58 F 10 28.5 10 4.44 62
M 9 30.3 13 7.61 n/a M 9 32.9 12 37.55 n/a
F 6 34.5 10 0.94 57 F 6 34.3 10 2.89 71
F 4 22.9 11 2.7 77 F 4 24.5 11 4.85 91
M 4 32.3 11 45.13 113 M 4 36.2 12 39.06 108
M 4 27.1 12 53.32 71 M 4 30.1 11 38.51 115
F 3 20.1 9 2.03 130 F 3 19.9 10 1.08 78
F 3 19.2 9 0.73 67 F 3 18.4 10 3.13 113

230
11 Formal acknowledgements
I thank Leo Zeef (Bioinformatics Chapter 4), Ian Donalson (Bioinformatics Chapter 6)
and Andy Hayes of the Bioinformatics and Genomic Technologies Core Facilities at the
University of Manchester for providing support with regard to microarrays and ChIP-
Seq.
The Bioimaging Facility microscopes used in this study were purchased with grants
from BBSRC, Wellcome and the University of Manchester Strategic Fund. Special
thanks goes to Peter March, Roger Meadows, and Steve Mardsen for their help with the
microscopy.
Thanks to David Knight, Ronan O'Cualain, and Julian Selley of the Mass Spectrometry
Core Facility who helped with experimental planning and the use of Progenesis®
software. Also to thanks to Emma Keevill who prepared the mass spectrometry samples
analysed in Chapter 7.
I am grateful to Aleksandr Mironov from the Electron Microscopy Core Facility for the
prepraration and imaging of samples, and to Peter Walker of the Histology Core Facility
for training and use of the immunohistology equipment. Thanks to all the staff at the
BSF animal facility, and Graham Morrissey in particular for use of his transgenic mouse
breeding licence. Also thanks to Cressida Moxey of Manchester Medical School, who
performed the manual cell tracking for the LPS-experiments in Chapter 5. Thanks to
Mike Randles for culturing HEK 293 and GEnC cells, and for Toryn Poolma for
culturing A549 cells, used in Chapter 3. Franziska Lausecker performed the extraction
of primary murine podocytes in Chapter 8.
Finally, thanks to my funders, without whom this PhD would not have been possible. I
was awarded an MRC Clinical Training Fellowship, supported by the North West
England Medical Research Council Fellowship Scheme in Clinical Pharmacology and
Therapeutics, which is funded by the Medical Research Council (grant number
G1000417/94909), ICON, GlaxoSmithKline, AstraZeneca and the Medical Evaluation
Unit.

231
12 References
1. Arneil, G.C. and C.N. Lam, Long-term assessment of steroid therapy in
childhood nephrosis. Lancet, 1966. 2(7468): p. 819-21.
2. Minimal change nephrotic syndrome in children: deaths during the first 5 to 15
years' observation. Report of the International Study of Kidney Disease in
Children. Pediatrics, 1984. 73(4): p. 497-501.
3. Chang, R.L., et al., Permselectivity of the glomerular capillary wall: III.
Restricted transport of polyanions. Kidney Int, 1975. 8(4): p. 212-8.
4. Hogg, R.J., et al., Evaluation and management of proteinuria and nephrotic
syndrome in children: Recommendations from a pediatric nephrology panel
established at the National Kidney Foundation Conference on Proteinuria,
Albuminuria, Risk, Assessment, Detection, and Elimination (PARADE).
Pediatrics, 2000. 105(6): p. 1242-1249.
5. Eddy, A.A. and J.M. Symons, Nephrotic syndrome in childhood. Lancet, 2003.
362(9384): p. 629-39.
6. Chapter 3: Steroid-sensitive nephrotic syndrome in children. Kidney Int Suppl
(2011), 2012. 2(2): p. 163-171.
7. Keller, G., et al., Nephron number in patients with primary hypertension. The
New England journal of medicine, 2003. 348: p. 101-8.
8. Orth, S.R. and E. Ritz, The nephrotic syndrome. N Engl J Med, 1998. 338(17):
p. 1202-11.
9. Farquhar, M.G., The glomerular basement membrane: not gone, just forgotten.
The Journal of clinical investigation, 2006. 116: p. 2090-3.
10. Salmon, A.H., C.R. Neal, and S.J. Harper, New aspects of glomerular filtration
barrier structure and function: five layers (at least) not three. Curr Opin
Nephrol Hypertens, 2009. 18(3): p. 197-205.
11. Sorensson, J., et al., Synthesis of sulfated proteoglycans by bovine glomerular
endothelial cells in culture. Am J Physiol Renal Physiol, 2003. 284(2): p. F373-
80.
12. Adamson, R.H. and G. Clough, Plasma proteins modify the endothelial cell
glycocalyx of frog mesenteric microvessels. J Physiol, 1992. 445: p. 473-86.
13. Osterloh, K., U. Ewert, and A.R. Pries, Interaction of albumin with the
endothelial cell surface. Am J Physiol Heart Circ Physiol, 2002. 283(1): p.
H398-405.
14. Kanwar, Y.S. and M.G. Farquhar, Isolation of glycosaminoglycans (heparan
sulfate) from glomerular basement membranes. Proc Natl Acad Sci U S A,
1979. 76(9): p. 4493-7.
15. Singh, A., et al., Glomerular endothelial glycocalyx constitutes a barrier to
protein permeability. J Am Soc Nephrol, 2007. 18(11): p. 2885-93.
16. Jeansson, M. and B. Haraldsson, Glomerular size and charge selectivity in the
mouse after exposure to glucosaminoglycan-degrading enzymes. J Am Soc
Nephrol, 2003. 14(7): p. 1756-65.
17. Bulger, R.E., et al., Endothelial characteristics of glomerular capillaries in
normal, mercuric chloride-induced, and gentamicin-induced acute renal failure
in the rat. J Clin Invest, 1983. 72(1): p. 128-41.
18. Haraldsson, B., J. Nystrom, and W.M. Deen, Properties of the glomerular
barrier and mechanisms of proteinuria. Physiol Rev, 2008. 88(2): p. 451-87.
19. Sugio, S., et al., Crystal structure of human serum albumin at 2.5 A resolution.
Protein Eng, 1999. 12(6): p. 439-46.

232
20. Stan, R.V., M. Kubitza, and G.E. Palade, PV-1 is a component of the fenestral
and stomatal diaphragms in fenestrated endothelia. Proc Natl Acad Sci U S A,
1999. 96(23): p. 13203-7.
21. Lennon, R., M.J. Randles, and M.J. Humphries, The importance of podocyte
adhesion for a healthy glomerulus. Front Endocrinol (Lausanne), 2014. 5: p.
160.
22. Abrahamson, D.R., et al., Cellular origins of type IV collagen networks in
developing glomeruli. J Am Soc Nephrol, 2009. 20(7): p. 1471-9.
23. Hironaka, K., et al., Pores in the glomerular basement membrane revealed by
ultrahigh-resolution scanning electron microscopy. Nephron, 1993. 64(4): p.
647-9.
24. Miner, J.H., et al., Compositional and structural requirements for laminin and
basement membranes during mouse embryo implantation and gastrulation.
Development, 2004. 131(10): p. 2247-56.
25. Hudson, B.G., et al., Alport's syndrome, Goodpasture's syndrome, and type IV
collagen. N Engl J Med, 2003. 348(25): p. 2543-56.
26. Lennon, R., et al., Global analysis reveals the complexity of the human
glomerular extracellular matrix. J Am Soc Nephrol, 2014. 25(5): p. 939-51.
27. Neal, C.R., et al., Three-dimensional reconstruction of glomeruli by electron
microscopy reveals a distinct restrictive urinary subpodocyte space. J Am Soc
Nephrol, 2005. 16(5): p. 1223-35.
28. Sterk, L.M., et al., Glomerular extracellular matrix components and integrins.
Cell Adhes Commun, 1998. 5(3): p. 177-92.
29. Has, C., et al., Integrin alpha3 mutations with kidney, lung, and skin disease. N
Engl J Med, 2012. 366(16): p. 1508-14.
30. Wartiovaara, J., et al., Nephrin strands contribute to a porous slit diaphragm
scaffold as revealed by electron tomography. J Clin Invest, 2004. 114(10): p.
1475-83.
31. Rodewald, R. and M.J. Karnovsky, Porous substructure of the glomerular slit
diaphragm in the rat and mouse. J Cell Biol, 1974. 60(2): p. 423-33.
32. Gagliardini, E., et al., Imaging of the porous ultrastructure of the glomerular
epithelial filtration slit. J Am Soc Nephrol, 2010. 21(12): p. 2081-9.
33. Kann, M., et al., Genome-Wide Analysis of Wilms' Tumor 1-Controlled Gene
Expression in Podocytes Reveals Key Regulatory Mechanisms. J Am Soc
Nephrol, 2015. 26(9): p. 2097-104.
34. Dong, L., S. Pietsch, and C. Englert, Towards an understanding of kidney
diseases associated with WT1 mutations. Kidney Int, 2015.
35. Dong, L., et al., Integration of Cistromic and Transcriptomic Analyses Identifies
Nphs2, Mafb, and Magi2 as Wilms' Tumor 1 Target Genes in Podocyte
Differentiation and Maintenance. J Am Soc Nephrol, 2015. 26(9): p. 2118-28.
36. Hinkes, B.G., et al., Nephrotic syndrome in the first year of life: two thirds of
cases are caused by mutations in 4 genes (NPHS1, NPHS2, WT1, and LAMB2).
Pediatrics, 2007. 119: p. e907-19.
37. Salmon, A.H., et al., Evidence for restriction of fluid and solute movement
across the glomerular capillary wall by the subpodocyte space. Am J Physiol
Renal Physiol, 2007. 293(6): p. F1777-86.
38. Neal, C.R., et al., Glomerular filtration into the subpodocyte space is highly
restricted under physiological perfusion conditions. Am J Physiol Renal
Physiol, 2007. 293(6): p. F1787-98.
39. Tojo, A. and H. Endou, Intrarenal handling of proteins in rats using fractional
micropuncture technique. Am J Physiol, 1992. 263(4 Pt 2): p. F601-6.

233
40. Norden, A.G., et al., Glomerular protein sieving and implications for renal
failure in Fanconi syndrome. Kidney Int, 2001. 60(5): p. 1885-92.
41. Weyer, K., et al., Mouse model of proximal tubule endocytic dysfunction.
Nephrol Dial Transplant, 2011. 26(11): p. 3446-51.
42. Russo, L.M., et al., The normal kidney filters nephrotic levels of albumin
retrieved by proximal tubule cells: retrieval is disrupted in nephrotic states.
Kidney Int, 2007. 71(6): p. 504-13.
43. Moeller, M.J. and V. Tenten, Renal albumin filtration: alternative models to the
standard physical barriers. Nat Rev Nephrol, 2013. 9(5): p. 266-77.
44. Lazzara, M.J. and W.M. Deen, Model of albumin reabsorption in the proximal
tubule. Am J Physiol Renal Physiol, 2007. 292(1): p. F430-9.
45. Comper, W.D., B. Haraldsson, and W.M. Deen, Resolved: normal glomeruli
filter nephrotic levels of albumin. J Am Soc Nephrol, 2008. 19(3): p. 427-32.
46. Tanner, G.A., Glomerular sieving coefficient of serum albumin in the rat: a two-
photon microscopy study. Am J Physiol Renal Physiol, 2009. 296(6): p. F1258-
65.
47. Peti-Peterdi, J., Independent two-photon measurements of albumin GSC give low
values. Am J Physiol Renal Physiol, 2009. 296(6): p. F1255-7.
48. Peti-Peterdi, J. and A. Sipos, A high-powered view of the filtration barrier.
Journal of the American Society of Nephrology : JASN, 2010. 21: p. 1835-41.
49. Birn, H. and E.I. Christensen, Renal albumin absorption in physiology and
pathology. Kidney Int, 2006. 69(3): p. 440-9.
50. Farquhar, M.G., Editorial: The primary glomerular filtration barrier--basement
membrane or epithelial slits? Kidney Int, 1975. 8(4): p. 197-211.
51. Ryan, G.B. and M.J. Karnovsky, Distribution of endogenous albumin in the rat
glomerulus: role of hemodynamic factors in glomerular barrier function.
Kidney Int, 1976. 9(1): p. 36-45.
52. Moeller, M.J. and C. Kuppe, Point: Proposing the electrokinetic model. Perit
Dial Int, 2015. 35(1): p. 5-8.
53. Hausmann, R., et al., The glomerular filtration barrier function: new concepts.
Curr Opin Nephrol Hypertens, 2012. 21(4): p. 441-9.
54. Hausmann, R., et al., Electrical forces determine glomerular permeability.
Journal of the American Society of Nephrology : JASN, 2010. 21: p. 2053-8.
55. Moeller, M.J. and G.A. Tanner, Reply: podocytes are key-although albumin
never reaches the slit diaphragm. Nat Rev Nephrol, 2014. 10(3): p. 180.
56. Fujigaki, Y., et al., Intra-GBM site of the functional filtration barrier for
endogenous proteins in rats. Kidney Int, 1993. 43(3): p. 567-74.
57. Pavenstadt, H., W. Kriz, and M. Kretzler, Cell biology of the glomerular
podocyte. Physiol Rev, 2003. 83(1): p. 253-307.
58. Scott, R.P. and S.E. Quaggin, The cell biology of renal filtration. J Cell Biol,
2015. 209(2): p. 199-210.
59. Faul, C., et al., Actin up: regulation of podocyte structure and function by
components of the actin cytoskeleton. Trends in cell biology, 2007. 17: p. 428-
37.
60. Reiser, J., et al., The glomerular slit diaphragm is a modified adherens junction.
J Am Soc Nephrol, 2000. 11(1): p. 1-8.
61. Kestilä, M., et al., Positionally cloned gene for a novel glomerular protein--
nephrin--is mutated in congenital nephrotic syndrome. Molecular cell, 1998. 1:
p. 575-82.
62. Khoshnoodi, J., et al., Nephrin promotes cell-cell adhesion through homophilic
interactions. Am J Pathol, 2003. 163(6): p. 2337-46.

234
63. Schwarz, K., et al., Podocin, a raft-associated component of the glomerular slit
diaphragm, interacts with CD2AP and nephrin. J Clin Invest, 2001. 108(11): p.
1621-9.
64. Shih, N.Y., et al., CD2AP localizes to the slit diaphragm and binds to nephrin
via a novel C-terminal domain. Am J Pathol, 2001. 159(6): p. 2303-8.
65. Lehtonen, S., F. Zhao, and E. Lehtonen, CD2-associated protein directly
interacts with the actin cytoskeleton. Am J Physiol Renal Physiol, 2002. 283(4):
p. F734-43.
66. Hutchings, N.J., et al., Linking the T cell surface protein CD2 to the actin-
capping protein CAPZ via CMS and CIN85. J Biol Chem, 2003. 278(25): p.
22396-403.
67. Lynch, D.K., et al., A Cortactin-CD2-associated protein (CD2AP) complex
provides a novel link between epidermal growth factor receptor endocytosis and
the actin cytoskeleton. J Biol Chem, 2003. 278(24): p. 21805-13.
68. Asanuma, K., et al., Synaptopodin regulates the actin-bundling activity of alpha-
actinin in an isoform-specific manner. The Journal of clinical investigation,
2005. 115: p. 1188-98.
69. Hartleben, B., et al., Neph-Nephrin proteins bind the Par3-Par6-atypical protein
kinase C (aPKC) complex to regulate podocyte cell polarity. J Biol Chem, 2008.
283(34): p. 23033-8.
70. Fukasawa, H., et al., Slit diaphragms contain tight junction proteins. J Am Soc
Nephrol, 2009. 20(7): p. 1491-503.
71. Shih, N.Y., et al., Congenital nephrotic syndrome in mice lacking CD2-
associated protein. Science, 1999. 286(5438): p. 312-5.
72. Pierchala, B.A., M.R. Munoz, and C.C. Tsui, Proteomic analysis of the slit
diaphragm complex: CLIC5 is a protein critical for podocyte morphology and
function. Kidney Int, 2010. 78(9): p. 868-82.
73. Yaoita, E., et al., Up-regulation of connexin43 in glomerular podocytes in
response to injury. Am J Pathol, 2002. 161(5): p. 1597-606.
74. Patrakka, J., et al., Expression and subcellular distribution of novel glomerulus-
associated proteins dendrin, ehd3, sh2d4a, plekhh2, and 2310066E14Rik. J Am
Soc Nephrol, 2007. 18(3): p. 689-97.
75. Hashimoto, T., et al., Ephrin-B1 localizes at the slit diaphragm of the
glomerular podocyte. Kidney Int, 2007. 72(8): p. 954-64.
76. Inoue, T., et al., FAT is a component of glomerular slit diaphragms. Kidney Int,
2001. 59(3): p. 1003-12.
77. Shimizu, M., et al., Expression of galectin-1, a new component of slit
diaphragm, is altered in minimal change nephrotic syndrome. Lab Invest, 2009.
89(2): p. 178-95.
78. Hirabayashi, S., et al., MAGI-1 is a component of the glomerular slit diaphragm
that is tightly associated with nephrin. Lab Invest, 2005. 85(12): p. 1528-43.
79. Lehtonen, S., et al., Cell junction-associated proteins IQGAP1, MAGI-2, CASK,
spectrins, and alpha-actinin are components of the nephrin multiprotein
complex. Proc Natl Acad Sci U S A, 2005. 102(28): p. 9814-9.
80. Donoviel, D.B., et al., Proteinuria and perinatal lethality in mice lacking
NEPH1, a novel protein with homology to NEPHRIN. Mol Cell Biol, 2001.
21(14): p. 4829-36.
81. Gerke, P., et al., NEPH2 is located at the glomerular slit diaphragm, interacts
with nephrin and is cleaved from podocytes by metalloproteinases. J Am Soc
Nephrol, 2005. 16(6): p. 1693-702.
82. Ruotsalainen, V., et al., Nephrin is specifically located at the slit diaphragm of
glomerular podocytes. Proc Natl Acad Sci U S A, 1999. 96(14): p. 7962-7.

235
83. Holthofer, H., et al., Nephrin localizes at the podocyte filtration slit area and is
characteristically spliced in the human kidney. Am J Pathol, 1999. 155(5): p.
1681-7.
84. Roselli, S., et al., Podocin localizes in the kidney to the slit diaphragm area. Am
J Pathol, 2002. 160(1): p. 131-9.
85. Schnabel, E., J.M. Anderson, and M.G. Farquhar, The tight junction protein ZO-
1 is concentrated along slit diaphragms of the glomerular epithelium. J Cell
Biol, 1990. 111(3): p. 1255-63.
86. Kurihara, H., et al., The altered glomerular filtration slits seen in puromycin
aminonucleoside nephrosis and protamine sulfate-treated rats contain the tight
junction protein ZO-1. Am J Pathol, 1992. 141(4): p. 805-16.
87. Grahammer, F., C. Schell, and T.B. Huber, The podocyte slit diaphragm--from a
thin grey line to a complex signalling hub. Nat Rev Nephrol, 2013. 9(10): p.
587-98.
88. Verma, R., et al., Fyn binds to and phosphorylates the kidney slit diaphragm
component Nephrin. The Journal of biological chemistry, 2003. 278: p. 20716-
23.
89. Jones, N., et al., Nck adaptor proteins link nephrin to the actin cytoskeleton of
kidney podocytes. Nature, 2006. 440: p. 818-23.
90. George, B., et al., Crk1/2-dependent signaling is necessary for podocyte foot
process spreading in mouse models of glomerular disease. J Clin Invest, 2012.
122(2): p. 674-92.
91. George, B., et al., Crk1/2 and CrkL form a hetero-oligomer and functionally
complement each other during podocyte morphogenesis. Kidney Int, 2014.
85(6): p. 1382-94.
92. Bisson, N., et al., The adaptor protein Grb2 is not essential for the establishment
of the glomerular filtration barrier. PLoS One, 2012. 7(11): p. e50996.
93. Huber, T.B., et al., Nephrin and CD2AP associate with phosphoinositide 3-OH
kinase and stimulate AKT-dependent signaling. Mol Cell Biol, 2003. 23(14): p.
4917-28.
94. Zhu, J., et al., Nephrin mediates actin reorganization via phosphoinositide 3-
kinase in podocytes. Kidney Int, 2008. 73(5): p. 556-66.
95. Garg, P., et al., Neph1 cooperates with nephrin to transduce a signal that
induces actin polymerization. Mol Cell Biol, 2007. 27(24): p. 8698-712.
96. Schell, C., et al., N-wasp is required for stabilization of podocyte foot processes.
J Am Soc Nephrol, 2013. 24(5): p. 713-21.
97. Fan, X., et al., Inhibitory effects of Robo2 on nephrin: a crosstalk between
positive and negative signals regulating podocyte structure. Cell Rep, 2012.
2(1): p. 52-61.
98. Robson, A.M., et al., Normal glomerular permeability and its modification by
minimal change nephrotic syndrmone. J Clin Invest, 1974. 54(5): p. 1190-9.
99. Boute, N., et al., NPHS2, encoding the glomerular protein podocin, is mutated
in autosomal recessive steroid-resistant nephrotic syndrome. Nat Genet, 2000.
24(4): p. 349-54.
100. Ciani, L., et al., Mice lacking the giant protocadherin mFAT1 exhibit renal slit
junction abnormalities and a partially penetrant cyclopia and anophthalmia
phenotype. Mol Cell Biol, 2003. 23(10): p. 3575-82.
101. Winn, M.P., et al., A mutation in the TRPC6 cation channel causes familial focal
segmental glomerulosclerosis. Science, 2005. 308(5729): p. 1801-4.
102. Xing, C.-Y., et al., Direct effects of dexamethasone on human podocytes. Kidney
international, 2006. 70: p. 1038-45.

236
103. Faul, C., et al., The actin cytoskeleton of kidney podocytes is a direct target of
the antiproteinuric effect of cyclosporine A. Nature medicine, 2008. 14: p. 931-
8.
104. Yan, K., et al., Subcellular localization of glucocorticoid receptor protein in the
human kidney glomerulus. Kidney Int, 1999. 56(1): p. 65-73.
105. Guess, A., et al., Dose- and time-dependent glucocorticoid receptor signaling in
podocytes. Am J Physiol Renal Physiol, 2010. 299(4): p. F845-53.
106. Ransom, R.F., et al., Differential proteomic analysis of proteins induced by
glucocorticoids in cultured murine podocytes. Kidney international, 2005. 67: p.
1275-85.
107. Cheng, X., et al., Microarray analyses of glucocorticoid and vitamin D3 target
genes in differentiating cultured human podocytes. PLoS One, 2013. 8(4): p.
e60213.
108. Saleem, M.a., et al., A conditionally immortalized human podocyte cell line
demonstrating nephrin and podocin expression. Journal of the American Society
of Nephrology : JASN, 2002. 13: p. 630-8.
109. Ransom, R.F., et al., Glucocorticoids protect and enhance recovery of cultured
murine podocytes via actin filament stabilization. Kidney international, 2005.
68: p. 2473-83.
110. Wada, T., et al., Dexamethasone prevents podocyte apoptosis induced by
puromycin aminonucleoside: role of p53 and Bcl-2-related family proteins.
Journal of the American Society of Nephrology : JASN, 2005. 16: p. 2615-25.
111. Tufro, A. and D. Veron, VEGF and podocytes in diabetic nephropathy. Semin
Nephrol, 2012. 32(4): p. 385-93.
112. Veron, D., et al., Overexpression of VEGF-A in podocytes of adult mice causes
glomerular disease. Kidney Int, 2010. 77(11): p. 989-99.
113. Schonenberger, E., et al., The podocyte as a direct target of immunosuppressive
agents. Nephrol Dial Transplant, 2011. 26(1): p. 18-24.
114. Simon, M., et al., Expression of vascular endothelial growth factor and its
receptors in human renal ontogenesis and in adult kidney. Am J Physiol, 1995.
268(2 Pt 2): p. F240-50.
115. Bailey, E., et al., Vascular endothelial growth factor mRNA expression in
minimal change, membranous, and diabetic nephropathy demonstrated by non-
isotopic in situ hybridisation. Journal of clinical pathology, 1999. 52: p. 735-8.
116. Huber, T.B., et al., Expression of functional CCR and CXCR chemokine
receptors in podocytes. J Immunol, 2002. 168(12): p. 6244-52.
117. Fujii, Y., et al., The effect of dexamethasone on defective nephrin transport
caused by ER stress: a potential mechanism for the therapeutic action of
glucocorticoids in the acquired glomerular diseases. Kidney international, 2006.
69: p. 1350-9.
118. Uchida, K., et al., Decreased tyrosine phosphorylation of nephrin in rat and
human nephrosis. Kidney Int, 2008. 73(8): p. 926-32.
119. Ohashi, T., et al., Dexamethasone increases the phosphorylation of nephrin in
cultured podocytes. Clinical and experimental nephrology, 2011. 15: p. 688-93.
120. Xing, Y., et al., Diversities of podocyte molecular changes induced by different
antiproteinuria drugs. Exp Biol Med (Maywood), 2006. 231(5): p. 585-93.
121. Wu, J., et al., Downregulation of microRNA-30 facilitates podocyte injury and is
prevented by glucocorticoids. J Am Soc Nephrol, 2014. 25(1): p. 92-104.
122. Endlich, N. and K. Endlich, Stretch, tension and adhesion - adaptive
mechanisms of the actin cytoskeleton in podocytes. Eur J Cell Biol, 2006. 85(3-
4): p. 229-34.

237
123. Welsh, G.I. and M.A. Saleem, The podocyte cytoskeleton--key to a functioning
glomerulus in health and disease. Nat Rev Nephrol, 2012. 8(1): p. 14-21.
124. Saleem, M.A., et al., The molecular and functional phenotype of glomerular
podocytes reveals key features of contractile smooth muscle cells. Am J Physiol
Renal Physiol, 2008. 295(4): p. F959-70.
125. Coward, R.J., et al., The human glomerular podocyte is a novel target for insulin
action. Diabetes, 2005. 54(11): p. 3095-102.
126. Friedrich, C., et al., Podocytes are sensitive to fluid shear stress in vitro. Am J
Physiol Renal Physiol, 2006. 291(4): p. F856-65.
127. Morton, M.J., et al., Human podocytes possess a stretch-sensitive, Ca2+-
activated K+ channel: potential implications for the control of glomerular
filtration. J Am Soc Nephrol, 2004. 15(12): p. 2981-7.
128. Tian, D., et al., Antagonistic regulation of actin dynamics and cell motility by
TRPC5 and TRPC6 channels. Sci Signal, 2010. 3(145): p. ra77.
129. Mundel, P. and J. Reiser, Proteinuria: an enzymatic disease of the podocyte?
Kidney international, 2010. 77: p. 571-80.
130. Kistler, A.D., M.M. Altintas, and J. Reiser, Podocyte GTPases regulate kidney
filter dynamics. Kidney international, 2012. 81: p. 1053-5.
131. Reiser, J., et al., Podocyte migration during nephrotic syndrome requires a
coordinated interplay between cathepsin L and alpha3 integrin. The Journal of
biological chemistry, 2004. 279: p. 34827-32.
132. Hackl, M.J., et al., Tracking the fate of glomerular epithelial cells in vivo using
serial multiphoton imaging in new mouse models with fluorescent lineage tags.
Nature medicine, 2013. 19: p. 1661-6.
133. Ma, H., et al., Inhibition of podocyte FAK protects against proteinuria and foot
process effacement. J Am Soc Nephrol, 2010. 21(7): p. 1145-56.
134. Harris, J.J., et al., Active proteases in nephrotic plasma lead to a podocin-
dependent phosphorylation of VASP in podocytes via protease activated
receptor-1. J Pathol, 2013. 229(5): p. 660-71.
135. Park, S.J. and J.I. Shin, Complications of nephrotic syndrome. Korean J Pediatr,
2011. 54(8): p. 322-8.
136. Iversen, P. and C. Brun, Aspiration biopsy of the kidney. The American journal
of medicine, 1951. 11: p. 324-30.
137. Churg, J., R. Habib, and R.H. White, Pathology of the nephrotic syndrome in
children: a report for the International Study of Kidney Disease in Children.
Lancet, 1970. 760: p. 1299-302.
138. Waldman, M., et al., Adult minimal-change disease: clinical characteristics,
treatment, and outcomes. Clin J Am Soc Nephrol, 2007. 2(3): p. 445-53.
139. The primary nephrotic syndrome in children. Identification of patients with
minimal change nephrotic syndrome from initial response to prednisone. A
report of the International Study of Kidney Disease in Children. J Pediatr, 1981.
98(4): p. 561-4.
140. Ferrario, F. and M.P. Rastaldi, Histopathological atlas of renal diseases:
Minimal Change disease and focal glomerulosclerosis. Journal of nephrology.
18: p. 1-4.
141. Gipson, D.S., et al., Differential risk of remission and ESRD in childhood FSGS.
Pediatric nephrology (Berlin, Germany), 2006. 21: p. 344-9.
142. Bonilla-Felix, M., et al., Changing patterns in the histopathology of idiopathic
nephrotic syndrome in children. Kidney international, 1999. 55: p. 1885-90.
143. Hoyer, J.R., et al., Recurrence of idiopathic nephrotic syndrome after renal
transplantation. Lancet, 1972. 2: p. 343-8.

238
144. Cho, M.H., et al., Pathophysiology of minimal change nephrotic syndrome and
focal segmental glomerulosclerosis. Nephrology (Carlton, Vic.), 2007. 12 Suppl
3: p. S11-4.
145. McKinney, P.A., et al., Time trends and ethnic patterns of childhood nephrotic
syndrome in Yorkshire, UK. Pediatr Nephrol, 2001. 16(12): p. 1040-4.
146. Sharples, P.M., J. Poulton, and R.H. White, Steroid responsive nephrotic
syndrome is more common in Asians. Arch Dis Child, 1985. 60(11): p. 1014-7.
147. Jalanko, H., Congenital nephrotic syndrome. Pediatr Nephrol, 2009. 24(11): p.
2121-8.
148. Ruf, R.G., et al., Patients with mutations in NPHS2 (podocin) do not respond to
standard steroid treatment of nephrotic syndrome. J Am Soc Nephrol, 2004.
15(3): p. 722-32.
149. Arneil, G.C., Treatment of nephrosis with prednisolone. Lancet, 1956. 270: p.
409-11.
150. Short versus standard prednisone therapy for initial treatment of idiopathic
nephrotic syndrome in children. Arbeitsgemeinschaft fur Padiatrische
Nephrologie. Lancet, 1988. 1(8582): p. 380-3.
151. Ehrich, J.H. and J. Brodehl, Long versus standard prednisone therapy for initial
treatment of idiopathic nephrotic syndrome in children. Arbeitsgemeinschaft fur
Padiatrische Nephrologie. Eur J Pediatr, 1993. 152(4): p. 357-61.
152. Gipson, D.S., et al., Management of childhood onset nephrotic syndrome.
Pediatrics, 2009. 124(2): p. 747-57.
153. Tarshish, P., et al., Prognostic significance of the early course of minimal
change nephrotic syndrome: report of the International Study of Kidney Disease
in Children. J Am Soc Nephrol, 1997. 8(5): p. 769-76.
154. McIntyre, P. and J.C. Craig, Prevention of serious bacterial infection in children
with nephrotic syndrome. J Paediatr Child Health, 1998. 34(4): p. 314-7.
155. Patiroglu, T., A. Melikoglu, and R. Dusunsel, Serum levels of C3 and factors I
and B in minimal change disease. Acta Paediatr Jpn, 1998. 40(4): p. 333-6.
156. Trompeter, R.S., et al., Long-term outcome for children with minimal-change
nephrotic syndrome. Lancet, 1985. 1(8425): p. 368-70.
157. Lewis, M.A., et al., Nephrotic syndrome: from toddlers to twenties. Lancet,
1989. 1(8632): p. 255-9.
158. Ruth, E.M., et al., Children with steroid-sensitive nephrotic syndrome come of
age: long-term outcome. J Pediatr, 2005. 147(2): p. 202-7.
159. Fakhouri, F., et al., Steroid-sensitive nephrotic syndrome: from childhood to
adulthood. Am J Kidney Dis, 2003. 41(3): p. 550-7.
160. Niaudet, P., Long-term outcome of children with steroid-sensitive idiopathic
nephrotic syndrome. Clin J Am Soc Nephrol, 2009. 4(10): p. 1547-8.
161. Hayasaka, Y., S. Hayasaka, and H. Matsukura, Ocular findings in Japanese
children with nephrotic syndrome receiving prolonged corticosteroid therapy.
Ophthalmologica. Journal international d'ophtalmologie. International journal of
ophthalmology. Zeitschrift für Augenheilkunde, 2006. 220: p. 181-5.
162. Abeyagunawardena, A.S., P. Hindmarsh, and R.S. Trompeter, Adrenocortical
suppression increases the risk of relapse in nephrotic syndrome. Arch Dis Child,
2007. 92(7): p. 585-8.
163. Sumboonnanonda, A., et al., Adrenal function after prednisolone treatment in
childhood nephrotic syndrome. J Med Assoc Thai, 1994. 77(3): p. 126-9.
164. Barragry, J.M., et al., Vitamin-D metabolism in nephrotic syndrome. Lancet,
1977. 2(8039): p. 629-32.
165. Gulati, S., et al., Are children with idiopathic nephrotic syndrome at risk for
metabolic bone disease? Am J Kidney Dis, 2003. 41(6): p. 1163-9.

239
166. Recommendations for the prevention and treatment of glucocorticoid-induced
osteoporosis. American College of Rheumatology Task Force on Osteoporosis
Guidelines. Arthritis Rheum, 1996. 39(11): p. 1791-801.
167. Chesney, R.W., et al., Effect of prednisone on growth and bone mineral content
in childhood glomerular disease. American journal of diseases of children
(1960), 1978. 132: p. 768-72.
168. Elzouki, A.Y. and O.P. Jaiswal, Long-term, small dose prednisone therapy in
frequently relapsing nephrotic syndrome of childhood. Effect on remission,
statural growth, obesity, and infection rate. Clin Pediatr (Phila), 1988. 27(8): p.
387-92.
169. Leonard, M.B., et al., Long-term, high-dose glucocorticoids and bone mineral
content in childhood glucocorticoid-sensitive nephrotic syndrome. N Engl J
Med, 2004. 351(9): p. 868-75.
170. Cecka, J.M., D.W. Gjertson, and P.I. Terasaki, Pediatric renal transplantation:
a review of the UNOS data. United Network for Organ Sharing. Pediatric
transplantation, 1997. 1: p. 55-64.
171. De Geest, S. and E. Sabaté, Adherence to long-term therapies: evidence for
action. European journal of cardiovascular nursing : journal of the Working
Group on Cardiovascular Nursing of the European Society of Cardiology, 2003.
2: p. 323.
172. Mekahli, D., et al., Long-term outcome of idiopathic steroid-resistant nephrotic
syndrome: a multicenter study. Pediatr Nephrol, 2009. 24(8): p. 1525-32.
173. Trautmann, A., et al., Spectrum of steroid-resistant and congenital nephrotic
syndrome in children: the PodoNet registry cohort. Clin J Am Soc Nephrol,
2015. 10(4): p. 592-600.
174. White, R.H., E.F. Glasgow, and R.J. Mills, Clinicopathological study of
nephrotic syndrome in childhood. Lancet, 1970. 1: p. 1353-9.
175. Webb, N.J., et al., Childhood steroid-sensitive nephrotic syndrome: does the
histology matter? Am J Kidney Dis, 1996. 27(4): p. 484-8.
176. Vivarelli, M., et al., Time for initial response to steroids is a major prognostic
factor in idiopathic nephrotic syndrome. J Pediatr, 2010. 156(6): p. 965-71.
177. Saleem, M.A., New developments in steroid-resistant nephrotic syndrome.
Pediatr Nephrol, 2013. 28(5): p. 699-709.
178. Heeringa, S.F., et al., COQ6 mutations in human patients produce nephrotic
syndrome with sensorineural deafness. J Clin Invest, 2011. 121(5): p. 2013-24.
179. Machuca, E., G. Benoit, and C. Antignac, Genetics of nephrotic syndrome:
connecting molecular genetics to podocyte physiology. Human molecular
genetics, 2009. 18: p. R185-94.
180. Mahan, J.D., et al., Congenital nephrotic syndrome: evolution of medical
management and results of renal transplantation. J Pediatr, 1984. 105(4): p.
549-57.
181. Norio, R., Heredity in the congenital nephrotic syndrome. A genetic study of 57
finnish FAMILIES WITH A REVIEW OF REPORTED CASES. Ann Paediatr
Fenn, 1966. 12: p. Suppl 27:1-94.
182. Niaudet, P., Genetic forms of nephrotic syndrome. Pediatr Nephrol, 2004.
19(12): p. 1313-8.
183. Schultheiss, M., et al., No evidence for genotype/phenotype correlation in
NPHS1 and NPHS2 mutations. Pediatr Nephrol, 2004. 19(12): p. 1340-8.
184. Koziell, A., et al., Genotype/phenotype correlations of NPHS1 and NPHS2
mutations in nephrotic syndrome advocate a functional inter-relationship in
glomerular filtration. Hum Mol Genet, 2002. 11(4): p. 379-88.
240
185. Landau, D., et al., Familial steroid-sensitive nephrotic syndrome in Southern
Israel: clinical and genetic observations. Pediatr Nephrol, 2007. 22(5): p. 661-9.
186. Fuchshuber, A., et al., Clinical and genetic evaluation of familial steroid-
responsive nephrotic syndrome in childhood. J Am Soc Nephrol, 2001. 12(2): p.
374-8.
187. Ruf, R.G., et al., Identification of the first gene locus (SSNS1) for steroid-
sensitive nephrotic syndrome on chromosome 2p. J Am Soc Nephrol, 2003.
14(7): p. 1897-900.
188. Weber, S., et al., NPHS2 mutation analysis shows genetic heterogeneity of
steroid-resistant nephrotic syndrome and low post-transplant recurrence.
Kidney Int, 2004. 66(2): p. 571-9.
189. Buscher, A.K., et al., Immunosuppression and renal outcome in congenital and
pediatric steroid-resistant nephrotic syndrome. Clin J Am Soc Nephrol, 2010.
5(11): p. 2075-84.
190. Hinkes, B., et al., Positional cloning uncovers mutations in PLCE1 responsible
for a nephrotic syndrome variant that may be reversible. Nature genetics, 2006.
38: p. 1397-405.
191. Montini, G., C. Malaventura, and L. Salviati, Early coenzyme Q10
supplementation in primary coenzyme Q10 deficiency. N Engl J Med, 2008.
358(26): p. 2849-50.
192. Cochat, P., et al., Disease recurrence in paediatric renal transplantation. Pediatr
Nephrol, 2009. 24(11): p. 2097-108.
193. Ding, W.Y., et al., Initial steroid sensitivity in children with steroid-resistant
nephrotic syndrome predicts post-transplant recurrence. J Am Soc Nephrol,
2014. 25(6): p. 1342-8.
194. Ali, A.A., et al., Minimal-change glomerular nephritis. Normal kidneys in an
abnormal environment? Transplantation, 1994. 58: p. 849-52.
195. Artero, M.L., et al., Plasmapheresis reduces proteinuria and serum capacity to
injure glomeruli in patients with recurrent focal glomerulosclerosis. American
journal of kidney diseases : the official journal of the National Kidney
Foundation, 1994. 23: p. 574-81.
196. Lagrue, G., et al., [Transmission of nephrotic syndrome to two neonates.
Spontaneous regression]. Presse médicale (Paris, France : 1983), 1991. 20: p.
255-7.
197. Zimmerman, S.W., Increased urinary protein excretion in the rat produced by
serum from a patient with recurrent focal glomerular sclerosis after renal
transplantation. Clinical nephrology, 1984. 22: p. 32-8.
198. Savin, V.J., et al., Circulating factor associated with increased glomerular
permeability to albumin in recurrent focal segmental glomerulosclerosis. The
New England journal of medicine, 1996. 334: p. 878-83.
199. Clement, L.C., et al., Podocyte-secreted angiopoietin-like-4 mediates
proteinuria in glucocorticoid-sensitive nephrotic syndrome. Nat Med, 2011.
17(1): p. 117-22.
200. Bakker, W.W., et al., Altered activity of plasma hemopexin in patients with
minimal change disease in relapse. Pediatric nephrology (Berlin, Germany),
2005. 20: p. 1410-5.
201. Lennon, R., et al., Hemopexin induces nephrin-dependent reorganization of the
actin cytoskeleton in podocytes. Journal of the American Society of Nephrology
: JASN, 2008. 19: p. 2140-9.
202. Wei, C., et al., Circulating urokinase receptor as a cause of focal segmental
glomerulosclerosis. Nature medicine, 2011. 17: p. 952-60.

241
203. Cobos, E., C. Jumper, and C. Lox, Pretreatment determination of the serum
urokinase plasminogen activator and its soluble receptor in advanced small-cell
lung cancer or non-small-cell lung cancer. Clin Appl Thromb Hemost, 2003.
9(3): p. 241-6.
204. Giamarellos-Bourboulis, E.J., et al., Risk assessment in sepsis: a new
prognostication rule by APACHE II score and serum soluble urokinase
plasminogen activator receptor. Crit Care, 2012. 16(4): p. R149.
205. Toldi, G., et al., Plasma soluble urokinase plasminogen activator receptor
(suPAR) levels in systemic lupus erythematosus. Biomarkers, 2012. 17(8): p.
758-63.
206. Maas, R.J., J.K. Deegens, and J.F. Wetzels, Serum suPAR in patients with
FSGS: trash or treasure? Pediatr Nephrol, 2013. 28(7): p. 1041-8.
207. Meijers, B., et al., The soluble urokinase receptor is not a clinical marker for
focal segmental glomerulosclerosis. Kidney Int, 2014. 85(3): p. 636-40.
208. Wada, T., et al., A multicenter cross-sectional study of circulating soluble
urokinase receptor in Japanese patients with glomerular disease. Kidney Int,
2014. 85(3): p. 641-8.
209. Sinha, A., et al., Serum-soluble urokinase receptor levels do not distinguish
focal segmental glomerulosclerosis from other causes of nephrotic syndrome in
children. Kidney Int, 2014. 85(3): p. 649-58.
210. Schlondorff, D., Are serum suPAR determinations by current ELISA
methodology reliable diagnostic biomarkers for FSGS? Kidney Int, 2014. 85(3):
p. 499-501.
211. Shalhoub, R.J., Pathogenesis of lipoid nephrosis: a disorder of T-cell function.
Lancet, 1974. 2: p. 556-60.
212. Sun, X., et al., Suppression of antigen-specific T cell proliferation by measles
virus infection: role of a soluble factor in suppression. Virology, 1998. 246: p.
24-33.
213. Burstein, D.M. and R.A. Rodby, Membranoproliferative glomerulonephritis
associated with hepatitis C virus infection. Journal of the American Society of
Nephrology : JASN, 1993. 4: p. 1288-93.
214. Peces, R., et al., Minimal change nephrotic syndrome associated with Hodgkin's
lymphoma. Nephrology, dialysis, transplantation : official publication of the
European Dialysis and Transplant Association - European Renal Association,
1991. 6: p. 155-8.
215. Maruyama, K., et al., Effect of supernatants derived from T lymphocyte culture
in minimal change nephrotic syndrome on rat kidney capillaries. Nephron,
1989. 51: p. 73-6.
216. Meadow, S.R. and J.K. Sarsfield, Steroid-responsive and nephrotic syndrome
and allergy: clinical studies. Archives of disease in childhood, 1981. 56: p. 509-
16.
217. Lai, K.-W., et al., Overexpression of interleukin-13 induces minimal-change-like
nephropathy in rats. Journal of the American Society of Nephrology : JASN,
2007. 18: p. 1476-85.
218. Sellier-Leclerc, A.-L., et al., A humanized mouse model of idiopathic nephrotic
syndrome suggests a pathogenic role for immature cells. Journal of the
American Society of Nephrology : JASN, 2007. 18: p. 2732-9.
219. Sahali, D., et al., Transcriptional and post-transcriptional alterations of
IkappaBalpha in active minimal-change nephrotic syndrome. Journal of the
American Society of Nephrology : JASN, 2001. 12: p. 1648-58.

242
220. Sahali, D., et al., A novel approach to investigation of the pathogenesis of active
minimal-change nephrotic syndrome using subtracted cDNA library screening.
Journal of the American Society of Nephrology : JASN, 2002. 13: p. 1238-47.
221. Shimada, M., et al., Minimal change disease: a "two-hit" podocyte immune
disorder? Pediatr Nephrol, 2011. 26(4): p. 645-9.
222. Reiser, J. and P. Mundel, Danger signaling by glomerular podocytes defines a
novel function of inducible B7-1 in the pathogenesis of nephrotic syndrome. J
Am Soc Nephrol, 2004. 15(9): p. 2246-8.
223. Reiser, J., et al., Induction of B7-1 in podocytes is associated with nephrotic
syndrome. The Journal of clinical investigation, 2004. 113: p. 1390-7.
224. Yu, C.C., et al., Abatacept in B7-1-positive proteinuric kidney disease. N Engl J
Med, 2013. 369(25): p. 2416-23.
225. Reiser, J. and N. Alachkar, Proteinuria: abate or applaud abatacept in
proteinuric kidney disease? Nat Rev Nephrol, 2014. 10(3): p. 128-30.
226. Delville, M., et al., A circulating antibody panel for pretransplant prediction of
FSGS recurrence after kidney transplantation. Sci Transl Med, 2014. 6(256): p.
256ra136.
227. Baricos, W.H., et al., Evidence suggesting a role for cathepsin L in an
experimental model of glomerulonephritis. Arch Biochem Biophys, 1991.
288(2): p. 468-72.
228. Sever, S., et al., Proteolytic processing of dynamin by cytoplasmic cathepsin L is
a mechanism for proteinuric kidney disease. J Clin Invest, 2007. 117(8): p.
2095-104.
229. Yanagida-Asanuma, E., et al., Synaptopodin protects against proteinuria by
disrupting Cdc42:IRSp53:Mena signaling complexes in kidney podocytes. The
American journal of pathology, 2007. 171: p. 415-27.
230. Duma, D., C.M. Jewell, and J.A. Cidlowski, Multiple glucocorticoid receptor
isoforms and mechanisms of post-translational modification. J Steroid Biochem
Mol Biol, 2006. 102(1-5): p. 11-21.
231. Morris, D.J., Why do humans have two glucocorticoids: A question of intestinal
fortitude. Steroids, 2015. 102: p. 32-38.
232. Wei, L., T.M. MacDonald, and B.R. Walker, Taking glucocorticoids by
prescription is associated with subsequent cardiovascular disease. Ann Intern
Med, 2004. 141(10): p. 764-70.
233. Faus, H. and B. Haendler, Post-translational modifications of steroid receptors.
Biomed Pharmacother, 2006. 60(9): p. 520-8.
234. Cole, T.J., et al., Targeted disruption of the glucocorticoid receptor gene blocks
adrenergic chromaffin cell development and severely retards lung maturation.
Genes Dev, 1995. 9(13): p. 1608-21.
235. Cole, T.J., et al., GRKO mice express an aberrant dexamethasone-binding
glucocorticoid receptor, but are profoundly glucocorticoid resistant. Mol Cell
Endocrinol, 2001. 173(1-2): p. 193-202.
236. Perogamvros, I., D.W. Ray, and P.J. Trainer, Regulation of cortisol
bioavailability--effects on hormone measurement and action. Nat Rev
Endocrinol, 2012. 8(12): p. 717-27.
237. Oakley, R.H. and J.A. Cidlowski, The biology of the glucocorticoid receptor:
new signaling mechanisms in health and disease. J Allergy Clin Immunol, 2013.
132(5): p. 1033-44.
238. Moisan, M.P., CBG: a cortisol reservoir rather than a transporter. Nat Rev
Endocrinol, 2013. 9(2): p. 78.
239. Richard, E.M., et al., Plasma transcortin influences endocrine and behavioral
stress responses in mice. Endocrinology, 2010. 151(2): p. 649-59.

243
240. Cameron, A., et al., Temperature-responsive release of cortisol from its binding
globulin: a protein thermocouple. J Clin Endocrinol Metab, 2010. 95(10): p.
4689-95.
241. Hammond, G.L., et al., A role for corticosteroid-binding globulin in delivery of
cortisol to activated neutrophils. J Clin Endocrinol Metab, 1990. 71(1): p. 34-9.
242. Mendel, C.M., The free hormone hypothesis. Distinction from the free hormone
transport hypothesis. J Androl, 1992. 13(2): p. 107-16.
243. Mendel, C.M., et al., Uptake of cortisol by the perfused rat liver: validity of the
free hormone hypothesis applied to cortisol. Endocrinology, 1989. 124(1): p.
468-76.
244. Pugeat, M.M., J.F. Dunn, and B.C. Nisula, Transport of steroid hormones:
interaction of 70 drugs with testosterone-binding globulin and corticosteroid-
binding globulin in human plasma. J Clin Endocrinol Metab, 1981. 53(1): p. 69-
75.
245. Rostin, M., et al., Pharmacokinetics of prednisolone in children with the
nephrotic syndrome. Pediatr Nephrol, 1990. 4(5): p. 470-3.
246. Frey, F.J. and B.M. Frey, Altered prednisolone kinetics in patients with the
nephrotic syndrome. Nephron, 1982. 32(1): p. 45-8.
247. Jenkins, J.S. and P.A. Sampson, Conversion of cortisone to cortisol and
prednisone to prednisolone. Br Med J, 1967. 2(5546): p. 205-7.
248. Diederich, S., et al., 11beta-hydroxysteroid dehydrogenase types 1 and 2: an
important pharmacokinetic determinant for the activity of synthetic mineralo-
and glucocorticoids. J Clin Endocrinol Metab, 2002. 87(12): p. 5695-701.
249. Rocci, M.L., Jr., et al., Effect on nephrotic syndrome on absorption and
disposition of prednisolone in children. Int J Pediatr Nephrol, 1982. 3(3): p. 159-
66.
250. Stimson, R.H. and B.R. Walker, Glucocorticoids and 11beta-hydroxysteroid
dehydrogenase type 1 in obesity and the metabolic syndrome. Minerva
Endocrinol, 2007. 32(3): p. 141-59.
251. Hult, M., H. Jornvall, and U.C. Oppermann, Selective inhibition of human type 1
11beta-hydroxysteroid dehydrogenase by synthetic steroids and xenobiotics.
FEBS Lett, 1998. 441(1): p. 25-8.
252. Tannin, G.M., et al., The human gene for 11 beta-hydroxysteroid
dehydrogenase. Structure, tissue distribution, and chromosomal localization. J
Biol Chem, 1991. 266(25): p. 16653-8.
253. Roland, B.L., Z.S. Krozowski, and J.W. Funder, Glucocorticoid receptor,
mineralocorticoid receptors, 11 beta-hydroxysteroid dehydrogenase-1 and -2
expression in rat brain and kidney: in situ studies. Mol Cell Endocrinol, 1995.
111(1): p. R1-7.
254. Chapman, K., M. Holmes, and J. Seckl, 11beta-hydroxysteroid dehydrogenases:
intracellular gate-keepers of tissue glucocorticoid action. Physiol Rev, 2013.
93(3): p. 1139-206.
255. Hirasawa, G., et al., Colocalization of 11 beta-hydroxysteroid dehydrogenase
type II and mineralocorticoid receptor in human epithelia. J Clin Endocrinol
Metab, 1997. 82(11): p. 3859-63.
256. Ferrari, P., E. Lovati, and F.J. Frey, The role of the 11beta-hydroxysteroid
dehydrogenase type 2 in human hypertension. J Hypertens, 2000. 18(3): p. 241-
8.
257. Kataoka, S., et al., 11beta-hydroxysteroid dehydrogenase type 2 is expressed in
the human kidney glomerulus. J Clin Endocrinol Metab, 2002. 87(2): p. 877-82.
258. Hellal-Levy, C., et al., Mechanistic aspects of mineralocorticoid receptor
activation. Kidney Int, 2000. 57(4): p. 1250-5.

244
259. Rosenfeld, P., et al., Ontogeny of corticosteroid receptors in the brain. Cell Mol
Neurobiol, 1993. 13(4): p. 295-319.
260. Fuller, P.J., S.S. Lim-Tio, and F.E. Brennan, Specificity in mineralocorticoid
versus glucocorticoid action. Kidney Int, 2000. 57(4): p. 1256-64.
261. Sasano, H., et al., Immunolocalization of mineralocorticoid receptor in human
kidney, pancreas, salivary, mammary and sweat glands: a light and electron
microscopic immunohistochemical study. J Endocrinol, 1992. 132(2): p. 305-10.
262. Lombes, M., et al., The mineralocorticoid receptor discriminates aldosterone
from glucocorticoids independently of the 11 beta-hydroxysteroid
dehydrogenase. Endocrinology, 1994. 135(3): p. 834-40.
263. Grossmann, C., et al., Transactivation via the human glucocorticoid and
mineralocorticoid receptor by therapeutically used steroids in CV-1 cells: a
comparison of their glucocorticoid and mineralocorticoid properties. European
journal of endocrinology / European Federation of Endocrine Societies, 2004.
151: p. 397-406.
264. Encio, I.J. and S.D. Detera-Wadleigh, The genomic structure of the human
glucocorticoid receptor. J Biol Chem, 1991. 266(11): p. 7182-8.
265. Pujols, L., et al., Expression of glucocorticoid receptor alpha- and beta-isoforms
in human cells and tissues. Am J Physiol Cell Physiol, 2002. 283(4): p. C1324-
31.
266. Oakley, R.H., et al., The dominant negative activity of the human glucocorticoid
receptor beta isoform. Specificity and mechanisms of action. J Biol Chem, 1999.
274(39): p. 27857-66.
267. Beger, C., et al., Expression and structural analysis of glucocorticoid receptor
isoform gamma in human leukaemia cells using an isoform-specific real-time
polymerase chain reaction approach. Br J Haematol, 2003. 122(2): p. 245-52.
268. Lu, N.Z. and J.A. Cidlowski, Translational regulatory mechanisms generate N-
terminal glucocorticoid receptor isoforms with unique transcriptional target
genes. Mol Cell, 2005. 18(3): p. 331-42.
269. Hollenberg, S.M. and R.M. Evans, Multiple and cooperative trans-activation
domains of the human glucocorticoid receptor. Cell, 1988. 55(5): p. 899-906.
270. Almlof, T., A.P. Wright, and J.A. Gustafsson, Role of acidic and phosphorylated
residues in gene activation by the glucocorticoid receptor. J Biol Chem, 1995.
270(29): p. 17535-40.
271. Umesono, K. and R.M. Evans, Determinants of target gene specificity for
steroid/thyroid hormone receptors. Cell, 1989. 57(7): p. 1139-46.
272. Hollenberg, S.M., et al., Primary structure and expression of a functional human
glucocorticoid receptor cDNA. Nature, 1985. 318(6047): p. 635-41.
273. Picard, D. and K.R. Yamamoto, Two signals mediate hormone-dependent
nuclear localization of the glucocorticoid receptor. EMBO J, 1987. 6(11): p.
3333-40.
274. Pratt, W.B. and D.O. Toft, Steroid receptor interactions with heat shock protein
and immunophilin chaperones. Endocr Rev, 1997. 18(3): p. 306-60.
275. Isohashi, F. and K. Okamoto, ATP-stimulated translocation promoter that
enhances the nuclear binding of activated glucocorticoid receptor complex.
Biochemical properties and its function (mini-review). Receptor, 1993. 3(2): p.
113-24.
276. Barnes, P.J., How corticosteroids control inflammation: Quintiles Prize Lecture
2005. British journal of pharmacology, 2006. 148: p. 245-54.
277. Mittelstadt, P.R. and J.D. Ashwell, Inhibition of AP-1 by the glucocorticoid-
inducible protein GILZ. J Biol Chem, 2001. 276(31): p. 29603-10.

245
278. Smoak, K.A. and J.A. Cidlowski, Mechanisms of glucocorticoid receptor
signaling during inflammation. Mech Ageing Dev, 2004. 125(10-11): p. 697-
706.
279. Morrison, N. and J. Eisman, Role of the negative glucocorticoid regulatory
element in glucocorticoid repression of the human osteocalcin promoter. J Bone
Miner Res, 1993. 8(8): p. 969-75.
280. Luecke, H.F. and K.R. Yamamoto, The glucocorticoid receptor blocks P-TEFb
recruitment by NFkappaB to effect promoter-specific transcriptional repression.
Genes Dev, 2005. 19(9): p. 1116-27.
281. McKay, L.I. and J.A. Cidlowski, Cross-talk between nuclear factor-kappa B and
the steroid hormone receptors: mechanisms of mutual antagonism. Mol
Endocrinol, 1998. 12(1): p. 45-56.
282. Stoecklin, E., et al., Specific DNA binding of Stat5, but not of glucocorticoid
receptor, is required for their functional cooperation in the regulation of gene
transcription. Mol Cell Biol, 1997. 17(11): p. 6708-16.
283. Chinenov, Y., et al., Role of transcriptional coregulator GRIP1 in the anti-
inflammatory actions of glucocorticoids. Proc Natl Acad Sci U S A, 2012.
109(29): p. 11776-81.
284. Uhlenhaut, N.H., et al., Insights into negative regulation by the glucocorticoid
receptor from genome-wide profiling of inflammatory cistromes. Mol Cell,
2013. 49(1): p. 158-71.
285. John, S., et al., Chromatin accessibility pre-determines glucocorticoid receptor
binding patterns. Nature genetics, 2011. 43: p. 264-8.
286. McNally, J.G., et al., The glucocorticoid receptor: rapid exchange with
regulatory sites in living cells. Science, 2000. 287(5456): p. 1262-5.
287. Stratmann, M. and U. Schibler, Transcription factor loading: please take my
place! Cell, 2011. 146(4): p. 497-9.
288. Voss, T.C., et al., Dynamic exchange at regulatory elements during chromatin
remodeling underlies assisted loading mechanism. Cell, 2011. 146(4): p. 544-
54.
289. Stahn, C. and F. Buttgereit, Genomic and nongenomic effects of glucocorticoids.
Nat Clin Pract Rheumatol, 2008. 4(10): p. 525-33.
290. Croxtall, J.D., Q. Choudhury, and R.J. Flower, Glucocorticoids act within
minutes to inhibit recruitment of signalling factors to activated EGF receptors
through a receptor-dependent, transcription-independent mechanism. Br J
Pharmacol, 2000. 130(2): p. 289-98.
291. Solito, E., et al., Dexamethasone induces rapid serine-phosphorylation and
membrane translocation of annexin 1 in a human folliculostellate cell line via a
novel nongenomic mechanism involving the glucocorticoid receptor, protein
kinase C, phosphatidylinositol 3-kinase, and mitogen-activated protein kinase.
Endocrinology, 2003. 144(4): p. 1164-74.
292. Samarasinghe, R.A., et al., Nongenomic glucocorticoid receptor action
regulates gap junction intercellular communication and neural progenitor cell
proliferation. Proc Natl Acad Sci U S A, 2011. 108(40): p. 16657-62.
293. Rogatsky, I., C.L. Waase, and M.J. Garabedian, Phosphorylation and inhibition
of rat glucocorticoid receptor transcriptional activation by glycogen synthase
kinase-3 (GSK-3). Species-specific differences between human and rat
glucocorticoid receptor signaling as revealed through GSK-3 phosphorylation. J
Biol Chem, 1998. 273(23): p. 14315-21.
294. Krstic, M.D., et al., Mitogen-activated and cyclin-dependent protein kinases
selectively and differentially modulate transcriptional enhancement by the
glucocorticoid receptor. Mol Cell Biol, 1997. 17(7): p. 3947-54.

246
295. Galliher-Beckley, A.J. and J.A. Cidlowski, Emerging roles of glucocorticoid
receptor phosphorylation in modulating glucocorticoid hormone action in
health and disease. IUBMB Life, 2009. 61(10): p. 979-86.
296. Wang, Z., J. Frederick, and M.J. Garabedian, Deciphering the phosphorylation
"code" of the glucocorticoid receptor in vivo. J Biol Chem, 2002. 277(29): p.
26573-80.
297. Chen, W., et al., Glucocorticoid receptor phosphorylation differentially affects
target gene expression. Mol Endocrinol, 2008. 22(8): p. 1754-66.
298. Galliher-Beckley, A.J., et al., Glycogen synthase kinase 3beta-mediated serine
phosphorylation of the human glucocorticoid receptor redirects gene expression
profiles. Mol Cell Biol, 2008. 28(24): p. 7309-22.
299. Webster, J.C., et al., Mouse glucocorticoid receptor phosphorylation status
influences multiple functions of the receptor protein. J Biol Chem, 1997.
272(14): p. 9287-93.
300. Deroo, B.J., et al., Proteasomal inhibition enhances glucocorticoid receptor
transactivation and alters its subnuclear trafficking. Mol Cell Biol, 2002.
22(12): p. 4113-23.
301. Wallace, A.D. and J.A. Cidlowski, Proteasome-mediated glucocorticoid
receptor degradation restricts transcriptional signaling by glucocorticoids. J
Biol Chem, 2001. 276(46): p. 42714-21.
302. Tian, S., et al., Small ubiquitin-related modifier-1 (SUMO-1) modification of the
glucocorticoid receptor. Biochem J, 2002. 367(Pt 3): p. 907-11.
303. Holmstrom, S., M.E. Van Antwerp, and J.A. Iniguez-Lluhi, Direct and
distinguishable inhibitory roles for SUMO isoforms in the control of
transcriptional synergy. Proc Natl Acad Sci U S A, 2003. 100(26): p. 15758-63.
304. Charmandari, E., et al., Peripheral CLOCK regulates target-tissue
glucocorticoid receptor transcriptional activity in a circadian fashion in man.
PLoS One, 2011. 6(9): p. e25612.
305. Barnes, P.J. and I.M. Adcock, Glucocorticoid resistance in inflammatory
diseases. Lancet, 2009. 373(9678): p. 1905-17.
306. Barnes, P.J., Mechanisms and resistance in glucocorticoid control of
inflammation. J Steroid Biochem Mol Biol, 2010. 120(2-3): p. 76-85.
307. Chikanza, I.C. and D.L. Kozaci, Corticosteroid resistance in rheumatoid
arthritis: molecular and cellular perspectives. Rheumatology (Oxford), 2004.
43(11): p. 1337-45.
308. Carmichael, J., et al., Corticosteroid resistance in chronic asthma. Br Med J
(Clin Res Ed), 1981. 282(6274): p. 1419-22.
309. Fuchshuber, A. and O. Mehls, Familial steroid-resistant nephrotic syndromes:
recent advances. Nephrol Dial Transplant, 2000. 15(12): p. 1897-900.
310. Hakonarson, H., et al., Profiling of genes expressed in peripheral blood
mononuclear cells predicts glucocorticoid sensitivity in asthma patients. Proc
Natl Acad Sci U S A, 2005. 102(41): p. 14789-94.
311. Donn, R., et al., Use of gene expression profiling to identify a novel
glucocorticoid sensitivity determining gene, BMPRII. The FASEB journal :
official publication of the Federation of American Societies for Experimental
Biology, 2007. 21: p. 402-14.
312. Cheong, H.I., H.G. Kang, and J. Schlondorff, GLCCI1 single nucleotide
polymorphisms in pediatric nephrotic syndrome. Pediatr Nephrol, 2012. 27(9):
p. 1595-9.
313. Lamberts, S.W., Hereditary glucocorticoid resistance. Ann Endocrinol (Paris),
2001. 62(2): p. 164-7.

247
314. Lane, S.J., et al., Chemical mutational analysis of the human glucocorticoid
receptor cDNA in glucocorticoid-resistant bronchial asthma. Am J Respir Cell
Mol Biol, 1994. 11(1): p. 42-8.
315. Han, S.H., et al., Glomerular glucocorticoid receptor expression is reduced in
late responders to steroids in adult-onset minimal change disease. Nephrology,
dialysis, transplantation : official publication of the European Dialysis and
Transplant Association - European Renal Association, 2008. 23: p. 169-75.
316. Hammad, A., et al., Low expression of glucocorticoid receptors in children with
steroid-resistant nephrotic syndrome. Pediatr Nephrol, 2013. 28(5): p. 759-63.
317. Koper, J.W., et al., Lack of association between five polymorphisms in the
human glucocorticoid receptor gene and glucocorticoid resistance. Hum Genet,
1997. 99(5): p. 663-8.
318. Russcher, H., et al., Two polymorphisms in the glucocorticoid receptor gene
directly affect glucocorticoid-regulated gene expression. J Clin Endocrinol
Metab, 2005. 90(10): p. 5804-10.
319. van Rossum, E.F., et al., Association of the ER22/23EK polymorphism in the
glucocorticoid receptor gene with survival and C-reactive protein levels in
elderly men. Am J Med, 2004. 117(3): p. 158-62.
320. Russcher, H., et al., Increased expression of the glucocorticoid receptor-A
translational isoform as a result of the ER22/23EK polymorphism. Mol
Endocrinol, 2005. 19(7): p. 1687-96.
321. van den Akker, E.L., et al., Glucocorticoid receptor polymorphism affects
transrepression but not transactivation. J Clin Endocrinol Metab, 2006. 91(7):
p. 2800-3.
322. Hamid, Q.A., et al., Increased glucocorticoid receptor beta in airway cells of
glucocorticoid-insensitive asthma. Am J Respir Crit Care Med, 1999. 159(5 Pt
1): p. 1600-4.
323. Kozaci, D.L., Y. Chernajovsky, and I.C. Chikanza, The differential expression of
corticosteroid receptor isoforms in corticosteroid-resistant and -sensitive
patients with rheumatoid arthritis. Rheumatology (Oxford), 2007. 46(4): p. 579-
85.
324. Orii, F., et al., Quantitative analysis for human glucocorticoid receptor
alpha/beta mRNA in IBD. Biochem Biophys Res Commun, 2002. 296(5): p.
1286-94.
325. He, X.J., et al., [Effect of glucocorticoid on glucocorticoid-resistant children
with primary nephrotic syndrome]. Zhonghua Er Ke Za Zhi, 2005. 43(2): p.
109-12.
326. Gagliardo, R., et al., Glucocorticoid receptor alpha and beta in glucocorticoid
dependent asthma. Am J Respir Crit Care Med, 2000. 162(1): p. 7-13.
327. Pujols, L., J. Mullol, and C. Picado, Alpha and beta glucocorticoid receptors:
relevance in airway diseases. Curr Allergy Asthma Rep, 2007. 7(2): p. 93-9.
328. Ouyang, J., et al., Abnormal expression and distribution of heat shock protein
90: potential etiologic immunoendocrine mechanism of glucocorticoid
resistance in idiopathic nephrotic syndrome. Clin Vaccine Immunol, 2006.
13(4): p. 496-500.
329. Ouyang, J., et al., Nuclear HSP90 regulates the glucocorticoid responsiveness of
PBMCs in patients with idiopathic nephrotic syndrome. Int Immunopharmacol,
2012. 14(3): p. 334-40.
330. Riebold, M., et al., A C-terminal HSP90 inhibitor restores glucocorticoid
sensitivity and relieves a mouse allograft model of Cushing disease. Nat Med,
2015. 21(3): p. 276-80.

248
331. Jafar, T., et al., Cytokine gene polymorphism in idiopathic nephrotic syndrome
children. Indian J Clin Biochem, 2011. 26(3): p. 296-302.
332. Sher, E.R., et al., Steroid-resistant asthma. Cellular mechanisms contributing to
inadequate response to glucocorticoid therapy. The Journal of clinical
investigation, 1994. 93: p. 33-9.
333. Irusen, E., et al., p38 Mitogen-activated protein kinase-induced glucocorticoid
receptor phosphorylation reduces its activity: role in steroid-insensitive asthma.
J Allergy Clin Immunol, 2002. 109(4): p. 649-57.
334. Matthews, J.G., et al., Defective glucocorticoid receptor nuclear translocation
and altered histone acetylation patterns in glucocorticoid-resistant patients. The
Journal of allergy and clinical immunology, 2004. 113: p. 1100-8.
335. Swierczewska, M., et al., Molecular basis of mechanisms of steroid resistance in
children with nephrotic syndrome. Acta Biochim Pol, 2013. 60(3): p. 339-44.
336. Santos, L., et al., Role of macrophage migration inhibitory factor (MIF) in
murine antigen-induced arthritis: interaction with glucocorticoids. Clin Exp
Immunol, 2001. 123(2): p. 309-14.
337. Stosic-Grujicic, S., I. Stojanovic, and F. Nicoletti, MIF in autoimmunity and
novel therapeutic approaches. Autoimmun Rev, 2009. 8(3): p. 244-9.
338. Berdeli, A., et al., Association of macrophage migration inhibitory factor -173C
allele polymorphism with steroid resistance in children with nephrotic
syndrome. Pediatr Nephrol, 2005. 20(11): p. 1566-71.
339. Hew, M., et al., Relative corticosteroid insensitivity of peripheral blood
mononuclear cells in severe asthma. American journal of respiratory and critical
care medicine, 2006. 174: p. 134-41.
340. Ito, K., et al., Decreased histone deacetylase activity in chronic obstructive
pulmonary disease. N Engl J Med, 2005. 352(19): p. 1967-76.
341. Ito, K., et al., Histone deacetylase 2-mediated deacetylation of the
glucocorticoid receptor enables NF-kappaB suppression. J Exp Med, 2006.
203(1): p. 7-13.
342. Xystrakis, E., et al., Reversing the defective induction of IL-10-secreting
regulatory T cells in glucocorticoid-resistant asthma patients. J Clin Invest,
2006. 116(1): p. 146-55.
343. Farrell, R.J., et al., High multidrug resistance (P-glycoprotein 170) expression in
inflammatory bowel disease patients who fail medical therapy.
Gastroenterology, 2000. 118(2): p. 279-88.
344. Tsujimura, S., et al., Overcoming drug resistance induced by P-glycoprotein on
lymphocytes in patients with refractory rheumatoid arthritis. Ann Rheum Dis,
2008. 67(3): p. 380-8.
345. Jafar, T., et al., MDR-1 gene polymorphisms in steroid-responsive versus
steroid-resistant nephrotic syndrome in children. Nephrol Dial Transplant, 2011.
26(12): p. 3968-74.
346. Choi, H.J., et al., Polymorphisms of the MDR1 and MIF genes in children with
nephrotic syndrome. Pediatr Nephrol, 2011. 26(11): p. 1981-8.
347. Youssef, D.M., et al., Soluble interleukine-2 receptor and MDR1 gene
expression levels as inflammatory biomarkers for prediction of steroid response
in children with nephrotic syndrome. Iran J Kidney Dis, 2011. 5(3): p. 154-61.
348. Stachowski, J., et al., [Resistance to therapy in primary nephrotic syndrome:
effect of MDR1 gene activity]. Pol Merkur Lekarski, 2000. 8(46): p. 218-21.
349. Chiou, Y.H., et al., Genetic polymorphisms influence the steroid treatment of
children with idiopathic nephrotic syndrome. Pediatr Nephrol, 2012. 27(9): p.
1511-7.

249
350. Yang, N., D.W. Ray, and L.C. Matthews, Current concepts in glucocorticoid
resistance. Steroids, 2012. 77(11): p. 1041-9.
351. Ridley, A.J., Rho GTPases and cell migration. J Cell Sci, 2001. 114(Pt 15): p.
2713-22.
352. Maridonneau-Parini, I., Control of macrophage 3D migration: a therapeutic
challenge to limit tissue infiltration. Immunol Rev, 2014. 262(1): p. 216-31.
353. Dong, H., et al., Inhibition of breast cancer cell migration by activation of
cAMP signaling. Breast Cancer Res Treat, 2015. 152(1): p. 17-28.
354. Coppola, J.M., et al., A small-molecule furin inhibitor inhibits cancer cell
motility and invasiveness. Neoplasia, 2008. 10(4): p. 363-70.
355. Kopp, F., et al., Salinomycin treatment reduces metastatic tumor burden by
hampering cancer cell migration. Mol Cancer, 2014. 13: p. 16.
356. Juliano, R.L., Signal transduction by cell adhesion receptors and the
cytoskeleton: functions of integrins, cadherins, selectins, and immunoglobulin-
superfamily members. Annu Rev Pharmacol Toxicol, 2002. 42: p. 283-323.
357. Lock, J.G., B. Wehrle-Haller, and S. Stromblad, Cell-matrix adhesion
complexes: master control machinery of cell migration. Semin Cancer Biol,
2008. 18(1): p. 65-76.
358. Ridley, A.J. and A. Hall, The small GTP-binding protein rho regulates the
assembly of focal adhesions and actin stress fibers in response to growth
factors. Cell, 1992. 70(3): p. 389-99.
359. Ridley, A.J., et al., Cell migration: integrating signals from front to back.
Science (New York, N.Y.), 2003. 302: p. 1704-9.
360. Ridley, A.J., Life at the leading edge. Cell, 2011. 145: p. 1012-22.
361. Mattila, P.K. and P. Lappalainen, Filopodia: molecular architecture and
cellular functions. Nat Rev Mol Cell Biol, 2008. 9(6): p. 446-54.
362. Buccione, R., G. Caldieri, and I. Ayala, Invadopodia: specialized tumor cell
structures for the focal degradation of the extracellular matrix. Cancer
Metastasis Rev, 2009. 28(1-2): p. 137-49.
363. Jacquemet, G., M.J. Humphries, and P.T. Caswell, Role of adhesion receptor
trafficking in 3D cell migration. Curr Opin Cell Biol, 2013. 25(5): p. 627-32.
364. Dozynkiewicz, M.A., et al., Rab25 and CLIC3 collaborate to promote integrin
recycling from late endosomes/lysosomes and drive cancer progression. Dev
Cell, 2012. 22(1): p. 131-45.
365. Wennerberg, K., K.L. Rossman, and C.J. Der, The Ras superfamily at a glance.
J Cell Sci, 2005. 118(Pt 5): p. 843-6.
366. Spiering, D. and L. Hodgson, Dynamics of the Rho-family small GTPases in
actin regulation and motility. Cell Adh Migr, 2011. 5(2): p. 170-80.
367. Schmidt, A. and A. Hall, Guanine nucleotide exchange factors for Rho
GTPases: turning on the switch. Genes Dev, 2002. 16(13): p. 1587-609.
368. Bernards, A. and J. Settleman, GAP control: regulating the regulators of small
GTPases. Trends Cell Biol, 2004. 14(7): p. 377-85.
369. Takai, Y., T. Sasaki, and T. Matozaki, Small GTP-binding proteins. Physiol
Rev, 2001. 81(1): p. 153-208.
370. Repasky, G.A., E.J. Chenette, and C.J. Der, Renewing the conspiracy theory
debate: does Raf function alone to mediate Ras oncogenesis? Trends Cell Biol,
2004. 14(11): p. 639-47.
371. Han, J., et al., Reconstructing and deconstructing agonist-induced activation of
integrin alphaIIbbeta3. Curr Biol, 2006. 16(18): p. 1796-806.
372. Ohta, Y., et al., The small GTPase RalA targets filamin to induce filopodia. Proc
Natl Acad Sci U S A, 1999. 96(5): p. 2122-8.

250
373. Heasman, S.J. and A.J. Ridley, Mammalian Rho GTPases: new insights into
their functions from in vivo studies. Nat Rev Mol Cell Biol, 2008. 9(9): p. 690-
701.
374. Ridley, A.J., Rho family proteins: coordinating cell responses. Trends Cell Biol,
2001. 11(12): p. 471-7.
375. Wheeler, A.P. and A.J. Ridley, Why three Rho proteins? RhoA, RhoB, RhoC,
and cell motility. Exp Cell Res, 2004. 301(1): p. 43-9.
376. Allen, W.E., et al., A role for Cdc42 in macrophage chemotaxis. J Cell Biol,
1998. 141(5): p. 1147-57.
377. Kozma, R., et al., The Ras-related protein Cdc42Hs and bradykinin promote
formation of peripheral actin microspikes and filopodia in Swiss 3T3 fibroblasts.
Mol Cell Biol, 1995. 15(4): p. 1942-52.
378. Rothmeier, E., et al., Activation of Ran GTPase by a Legionella effector
promotes microtubule polymerization, pathogen vacuole motility and infection.
PLoS Pathog, 2013. 9(9): p. e1003598.
379. Nie, Z., D.S. Hirsch, and P.A. Randazzo, Arf and its many interactors. Curr
Opin Cell Biol, 2003. 15(4): p. 396-404.
380. Schweitzer, J.K., A.E. Sedgwick, and C. D'Souza-Schorey, ARF6-mediated
endocytic recycling impacts cell movement, cell division and lipid homeostasis.
Semin Cell Dev Biol, 2011. 22(1): p. 39-47.
381. Small, J.V., The actin cytoskeleton. Electron Microsc Rev, 1988. 1(1): p. 155-
74.
382. Paterson, H.F., et al., Microinjection of recombinant p21rho induces rapid
changes in cell morphology. J Cell Biol, 1990. 111(3): p. 1001-7.
383. Riento, K. and A.J. Ridley, Rocks: multifunctional kinases in cell behaviour. Nat
Rev Mol Cell Biol, 2003. 4(6): p. 446-56.
384. Oser, M. and J. Condeelis, The cofilin activity cycle in lamellipodia and
invadopodia. J Cell Biochem, 2009. 108(6): p. 1252-62.
385. Goode, B.L. and M.J. Eck, Mechanism and function of formins in the control of
actin assembly. Annu Rev Biochem, 2007. 76: p. 593-627.
386. Pertz, O., Spatio-temporal Rho GTPase signaling - where are we now? J Cell
Sci, 2010. 123(Pt 11): p. 1841-50.
387. Vega, F.M., et al., RhoA and RhoC have distinct roles in migration and invasion
by acting through different targets. J Cell Biol, 2011. 193(4): p. 655-65.
388. Vega, F.M., et al., RhoB regulates cell migration through altered focal adhesion
dynamics. Open Biol, 2012. 2(5): p. 120076.
389. Huang, M., et al., RhoB regulates PDGFR-beta trafficking and signaling in
vascular smooth muscle cells. Arterioscler Thromb Vasc Biol, 2007. 27(12): p.
2597-605.
390. Hakem, A., et al., RhoC is dispensable for embryogenesis and tumor initiation
but essential for metastasis. Genes Dev, 2005. 19(17): p. 1974-9.
391. Shirsat, N.V., et al., A member of the ras gene superfamily is expressed
specifically in T, B and myeloid hemopoietic cells. Oncogene, 1990. 5(5): p.
769-72.
392. Haataja, L., J. Groffen, and N. Heisterkamp, Characterization of RAC3, a novel
member of the Rho family. J Biol Chem, 1997. 272(33): p. 20384-8.
393. Uhlen, M., et al., Towards a knowledge-based Human Protein Atlas. Nat
Biotechnol, 2010. 28(12): p. 1248-50.
394. Tzima, E., et al., Activation of Rac1 by shear stress in endothelial cells mediates
both cytoskeletal reorganization and effects on gene expression. EMBO J, 2002.
21(24): p. 6791-800.

251
395. Aikawa, R., et al., Reactive oxygen species in mechanical stress-induced cardiac
hypertrophy. Biochem Biophys Res Commun, 2001. 289(4): p. 901-7.
396. Nagase, M., et al., Oxidative stress causes mineralocorticoid receptor activation
in rat cardiomyocytes: role of small GTPase Rac1. Hypertension, 2012. 59(2):
p. 500-6.
397. Papaharalambus, C., et al., Tumor necrosis factor alpha stimulation of Rac1
activity. Role of isoprenylcysteine carboxylmethyltransferase. J Biol Chem,
2005. 280(19): p. 18790-6.
398. Kurokawa, K., et al., Coactivation of Rac1 and Cdc42 at lamellipodia and
membrane ruffles induced by epidermal growth factor. Mol Biol Cell, 2004.
15(3): p. 1003-10.
399. Price, L.S., et al., Activation of Rac and Cdc42 by integrins mediates cell
spreading. Mol Biol Cell, 1998. 9(7): p. 1863-71.
400. Wei, C., et al., Modification of kidney barrier function by the urokinase
receptor. Nature medicine, 2008. 14: p. 55-63.
401. Shen, E., et al., Rac1 is required for cardiomyocyte apoptosis during
hyperglycemia. Diabetes, 2009. 58(10): p. 2386-95.
402. Yi, F., et al., Homocysteine activates NADH/NADPH oxidase through ceramide-
stimulated Rac GTPase activity in rat mesangial cells. Kidney Int, 2004. 66(5):
p. 1977-87.
403. Uhlik, M.T., et al., Rac-MEKK3-MKK3 scaffolding for p38 MAPK activation
during hyperosmotic shock. Nat Cell Biol, 2003. 5(12): p. 1104-10.
404. Schmitz, U., et al., Angiotensin II-induced stimulation of p21-activated kinase
and c-Jun NH2-terminal kinase is mediated by Rac1 and Nck. J Biol Chem,
2001. 276(25): p. 22003-10.
405. Iwashima, F., et al., Aldosterone induces superoxide generation via Rac1
activation in endothelial cells. Endocrinology, 2008. 149(3): p. 1009-14.
406. Nagase, M. and T. Fujita, Role of Rac1-mineralocorticoid-receptor signalling in
renal and cardiac disease. Nat Rev Nephrol, 2013. 9(2): p. 86-98.
407. Ridley, A.J., et al., The small GTP-binding protein rac regulates growth factor-
induced membrane ruffling. Cell, 1992. 70(3): p. 401-10.
408. Nobes, C.D. and A. Hall, Rho GTPases control polarity, protrusion, and
adhesion during cell movement. J Cell Biol, 1999. 144(6): p. 1235-44.
409. Nodari, A., et al., Beta1 integrin activates Rac1 in Schwann cells to generate
radial lamellae during axonal sorting and myelination. J Cell Biol, 2007.
177(6): p. 1063-75.
410. Tan, W., et al., An essential role for Rac1 in endothelial cell function and
vascular development. FASEB J, 2008. 22(6): p. 1829-38.
411. McCarty, O.J., et al., Rac1 is essential for platelet lamellipodia formation and
aggregate stability under flow. J Biol Chem, 2005. 280(47): p. 39474-84.
412. Wu, Y.I., et al., A genetically encoded photoactivatable Rac controls the motility
of living cells. Nature, 2009. 461(7260): p. 104-8.
413. Wang, W., R. Eddy, and J. Condeelis, The cofilin pathway in breast cancer
invasion and metastasis. Nat Rev Cancer, 2007. 7(6): p. 429-40.
414. Akhtar, N. and C.H. Streuli, Rac1 links integrin-mediated adhesion to the
control of lactational differentiation in mammary epithelia. J Cell Biol, 2006.
173(5): p. 781-93.
415. Nikolova, S., et al., Rac1-NADPH oxidase-regulated generation of reactive
oxygen species mediates glutamate-induced apoptosis in SH-SY5Y human
neuroblastoma cells. Free Radic Res, 2005. 39(12): p. 1295-304.
416. Jaffe, A.B. and A. Hall, Rho GTPases: biochemistry and biology. Annu Rev
Cell Dev Biol, 2005. 21: p. 247-69.

252
417. Nobes, C.D. and A. Hall, Rho, rac, and cdc42 GTPases regulate the assembly of
multimolecular focal complexes associated with actin stress fibers, lamellipodia,
and filopodia. Cell, 1995. 81: p. 53-62.
418. Neudauer, C.L., et al., Distinct cellular effects and interactions of the Rho-family
GTPase TC10. Curr Biol, 1998. 8(21): p. 1151-60.
419. Tao, W., et al., Wrch-1, a novel member of the Rho gene family that is regulated
by Wnt-1. Genes Dev, 2001. 15(14): p. 1796-807.
420. Aspenstrom, P., A. Fransson, and J. Saras, Rho GTPases have diverse effects on
the organization of the actin filament system. Biochem J, 2004. 377(Pt 2): p.
327-37.
421. Rottner, K., A. Hall, and J.V. Small, Interplay between Rac and Rho in the
control of substrate contact dynamics. Curr Biol, 1999. 9(12): p. 640-8.
422. Machacek, M., et al., Coordination of Rho GTPase activities during cell
protrusion. Nature, 2009. 461: p. 99-103.
423. Yu, H., et al., Rac1 activation in podocytes induces rapid foot process
effacement and proteinuria. Mol Cell Biol, 2013. 33(23): p. 4755-64.
424. Shibata, S., M. Nagase, and T. Fujita, Fluvastatin ameliorates podocyte injury in
proteinuric rats via modulation of excessive Rho signaling. Journal of the
American Society of Nephrology : JASN, 2006. 17: p. 754-64.
425. Zhu, L., et al., Activation of RhoA in podocytes induces focal segmental
glomerulosclerosis. Journal of the American Society of Nephrology : JASN,
2011. 22: p. 1621-30.
426. Wang, L., et al., Mechanisms of the proteinuria induced by Rho GTPases.
Kidney international, 2012. 81: p. 1075-85.
427. Scott, R.P., et al., Podocyte-specific loss of Cdc42 leads to congenital
nephropathy. Journal of the American Society of Nephrology : JASN, 2012. 23:
p. 1149-54.
428. Blattner, S.M., et al., Divergent functions of the Rho GTPases Rac1 and Cdc42
in podocyte injury. Kidney international, 2013.
429. Le Menuet, D., et al., Alteration of cardiac and renal functions in transgenic
mice overexpressing human mineralocorticoid receptor. J Biol Chem, 2001.
276(42): p. 38911-20.
430. Ponda, M.P. and T.H. Hostetter, Aldosterone antagonism in chronic kidney
disease. Clin J Am Soc Nephrol, 2006. 1(4): p. 668-77.
431. Shibata, S., et al., Modification of mineralocorticoid receptor function by Rac1
GTPase: implication in proteinuric kidney disease. Nature medicine, 2008. 14:
p. 1370-6.
432. Gee, H.Y., et al., ARHGDIA mutations cause nephrotic syndrome via defective
RHO GTPase signaling. The Journal of clinical investigation, 2013. 123: p.
3243-53.
433. Hsu, H.H., et al., Mechanisms of angiotensin II signaling on cytoskeleton of
podocytes. J Mol Med (Berl), 2008. 86(12): p. 1379-94.
434. Babelova, A., et al., Activation of Rac-1 and RhoA contributes to podocyte
injury in chronic kidney disease. PLoS One, 2013. 8(11): p. e80328.
435. Ohta, Y., J.H. Hartwig, and T.P. Stossel, FilGAP, a Rho- and ROCK-regulated
GAP for Rac binds filamin A to control actin remodelling. Nature cell biology,
2006. 8: p. 803-14.
436. Akilesh, S., et al., Arhgap24 inactivates Rac1 in mouse podocytes, and a mutant
form is associated with familial focal segmental glomerulosclerosis. The Journal
of clinical investigation, 2011. 121: p. 4127-37.

253
437. Satchell, S.C., et al., Conditionally immortalized human glomerular endothelial
cells expressing fenestrations in response to VEGF. Kidney Int, 2006. 69(9): p.
1633-40.
438. Jangani, M., et al., The methyltransferase WBSCR22/Merm1 enhances
glucocorticoid receptor function and is regulated in lung inflammation and
cancer. J Biol Chem, 2014. 289(13): p. 8931-46.
439. Byron, A., et al., Glomerular cell cross-talk influences composition and
assembly of extracellular matrix. J Am Soc Nephrol, 2014. 25(5): p. 953-66.
440. Welsh, G.I., et al., Insulin signaling to the glomerular podocyte is critical for
normal kidney function. Cell Metab, 2010. 12(4): p. 329-40.
441. Saif, Z., et al., Expression of eight glucocorticoid receptor isoforms in the
human preterm placenta vary with fetal sex and birthweight. Placenta, 2015.
36(7): p. 723-30.
442. Kim, Y.H., et al., Podocyte depletion and glomerulosclerosis have a direct
relationship in the PAN-treated rat. Kidney Int, 2001. 60(3): p. 957-68.
443. Rosewicz, S., et al., Mechanism of glucocorticoid receptor down-regulation by
glucocorticoids. J Biol Chem, 1988. 263(6): p. 2581-4.
444. Vedeckis, W.V., M. Ali, and H.R. Allen, Regulation of glucocorticoid receptor
protein and mRNA levels. Cancer Res, 1989. 49(8 Suppl): p. 2295s-2302s.
445. Breslin, M.B., C.D. Geng, and W.V. Vedeckis, Multiple promoters exist in the
human GR gene, one of which is activated by glucocorticoids. Mol Endocrinol,
2001. 15(8): p. 1381-95.
446. Sathiyaa, R. and M.M. Vijayan, Autoregulation of glucocorticoid receptor by
cortisol in rainbow trout hepatocytes. Am J Physiol Cell Physiol, 2003. 284(6):
p. C1508-15.
447. Schiller, B.J., et al., Glucocorticoid receptor binds half sites as a monomer and
regulates specific target genes. Genome Biol, 2014. 15(7): p. 418.
448. Polman, J.A., et al., A genome-wide signature of glucocorticoid receptor binding
in neuronal PC12 cells. BMC Neurosci, 2012. 13: p. 118.
449. Reddy, T.E., et al., Genomic determination of the glucocorticoid response
reveals unexpected mechanisms of gene regulation. Genome Res, 2009. 19(12):
p. 2163-71.
450. Gibbs, J., et al., An epithelial circadian clock controls pulmonary inflammation
and glucocorticoid action. Nature medicine, 2014. 20: p. 919-26.
451. Miller, P.F., et al., Pharmacokinetics of prednisolone in children with nephrosis.
Arch Dis Child, 1990. 65(2): p. 196-200.
452. Lu, N.Z. and J.A. Cidlowski, Glucocorticoid receptor isoforms generate
transcription specificity. Trends Cell Biol, 2006. 16(6): p. 301-7.
453. Sanchez-Vega, B., et al., Glucocorticoid receptor transcriptional isoforms and
resistance in multiple myeloma cells. Mol Cancer Ther, 2006. 5(12): p. 3062-70.
454. Krett, N.L., et al., A variant glucocorticoid receptor messenger RNA is
expressed in multiple myeloma patients. Cancer Res, 1995. 55(13): p. 2727-9.
455. de Lange, P., et al., Expression in hematological malignancies of a
glucocorticoid receptor splice variant that augments glucocorticoid receptor-
mediated effects in transfected cells. Cancer Res, 2001. 61(10): p. 3937-41.
456. Alangari, A.A., Genomic and non-genomic actions of glucocorticoids in asthma.
Ann Thorac Med, 2010. 5(3): p. 133-9.
457. Pufall, M.A., Glucocorticoids and Cancer. Adv Exp Med Biol, 2015. 872: p.
315-33.
458. Li, C. and W.H. Wong, Model-based analysis of oligonucleotide arrays:
expression index computation and outlier detection. Proc Natl Acad Sci U S A,
2001. 98(1): p. 31-6.

254
459. Bolstad, B.M., et al., A comparison of normalization methods for high density
oligonucleotide array data based on variance and bias. Bioinformatics, 2003.
19(2): p. 185-93.
460. Quackenbush, J., Computational analysis of microarray data. Nat Rev Genet,
2001. 2(6): p. 418-27.
461. Smyth, G.K., Linear models and empirical bayes methods for assessing
differential expression in microarray experiments. Stat Appl Genet Mol Biol,
2004. 3: p. Article3.
462. Storey, J.D. and R. Tibshirani, Statistical significance for genomewide studies.
Proc Natl Acad Sci U S A, 2003. 100(16): p. 9440-5.
463. Wu, D.Y., et al., Distinct, genome-wide, gene-specific selectivity patterns of four
glucocorticoid receptor coregulators. Nucl Recept Signal, 2014. 12: p. e002.
464. Ehrchen, J., et al., Glucocorticoids induce differentiation of a specifically
activated, anti-inflammatory subtype of human monocytes. Blood, 2007. 109(3):
p. 1265-74.
465. Whirledge, S., X. Xu, and J.A. Cidlowski, Global gene expression analysis in
human uterine epithelial cells defines new targets of glucocorticoid and
estradiol antagonism. Biol Reprod, 2013. 89(3): p. 66.
466. Gupta, V., et al., Global gene profiling reveals novel glucocorticoid induced
changes in gene expression of human lens epithelial cells. Mol Vis, 2005. 11: p.
1018-40.
467. Onesto, C., et al., Characterization of EHT 1864, a novel small molecule
inhibitor of Rac family small GTPases. Methods Enzymol, 2008. 439: p. 111-29.
468. Palmer, T.D., et al., Targeting tumor cell motility to prevent metastasis. Adv
Drug Deliv Rev, 2011. 63(8): p. 568-81.
469. Kassis, J., et al., Tumor invasion as dysregulated cell motility. Semin Cancer
Biol, 2001. 11(2): p. 105-17.
470. Sahai, E. and C.J. Marshall, Differing modes of tumour cell invasion have
distinct requirements for Rho/ROCK signalling and extracellular proteolysis.
Nat Cell Biol, 2003. 5(8): p. 711-9.
471. Amano, M., et al., Formation of actin stress fibers and focal adhesions
enhanced by Rho-kinase. Science, 1997. 275(5304): p. 1308-11.
472. Weiger, M.C., et al., Real-time motion analysis reveals cell directionality as an
indicator of breast cancer progression. PLoS One, 2013. 8(3): p. e58859.
473. Dujardin, D.L., et al., A role for cytoplasmic dynein and LIS1 in directed cell
movement. J Cell Biol, 2003. 163(6): p. 1205-11.
474. Danen, E.H., et al., Integrins control motile strategy through a Rho-cofilin
pathway. J Cell Biol, 2005. 169(3): p. 515-26.
475. Weiner, O.D., Regulation of cell polarity during eukaryotic chemotaxis: the
chemotactic compass. Curr Opin Cell Biol, 2002. 14(2): p. 196-202.
476. Duning, K., et al., KIBRA modulates directional migration of podocytes. J Am
Soc Nephrol, 2008. 19(10): p. 1891-903.
477. Van Haastert, P.J. and P.N. Devreotes, Chemotaxis: signalling the way forward.
Nat Rev Mol Cell Biol, 2004. 5(8): p. 626-34.
478. Srinivasan, S., et al., Rac and Cdc42 play distinct roles in regulating
PI(3,4,5)P3 and polarity during neutrophil chemotaxis. J Cell Biol, 2003.
160(3): p. 375-85.
479. Pankov, R., et al., A Rac switch regulates random versus directionally persistent
cell migration. J Cell Biol, 2005. 170(5): p. 793-802.
480. Kaneto, N., et al., RAC1 inhibition as a therapeutic target for gefitinib-resistant
non-small-cell lung cancer. Cancer Sci, 2014. 105(7): p. 788-94.

255
481. Kawarazaki, W., et al., Angiotensin II- and salt-induced kidney injury through
Rac1-mediated mineralocorticoid receptor activation. J Am Soc Nephrol, 2012.
23(6): p. 997-1007.
482. Zambelli, F., G. Pesole, and G. Pavesi, PscanChIP: Finding over-represented
transcription factor-binding site motifs and their correlations in sequences from
ChIP-Seq experiments. Nucleic Acids Res, 2013. 41(Web Server issue): p.
W535-43.
483. Lee, T.I., S.E. Johnstone, and R.A. Young, Chromatin immunoprecipitation and
microarray-based analysis of protein location. Nature protocols, 2006. 1: p.
729-48.
484. Grontved, L., et al., C/EBP maintains chromatin accessibility in liver and
facilitates glucocorticoid receptor recruitment to steroid response elements.
Embo j, 2013. 32(11): p. 1568-83.
485. O'Geen, H., et al., A genome-wide analysis of Cas9 binding specificity using
ChIP-seq and targeted sequence capture. Nucleic Acids Res, 2015. 43(6): p.
3389-404.
486. Bittencourt, D., et al., G9a functions as a molecular scaffold for assembly of
transcriptional coactivators on a subset of glucocorticoid receptor target genes.
Proc Natl Acad Sci U S A, 2012. 109(48): p. 19673-8.
487. Rada-Iglesias, A., et al., A unique chromatin signature uncovers early
developmental enhancers in humans. Nature, 2011. 470(7333): p. 279-83.
488. Hajarnis, S.S., et al., Transcription Factor HNF-1beta Regulates MicroRNA-200
Expression Through a Long Noncoding RNA. J Biol Chem, 2015.
489. Diepenbruck, M., et al., Tead2 expression levels control the subcellular
distribution of Yap and Taz, zyxin expression and epithelial-mesenchymal
transition. J Cell Sci, 2014. 127(Pt 7): p. 1523-36.
490. Rodriguez-Fontenla, C., M. Calaza, and A. Gonzalez, Genetic distance as an
alternative to physical distance for definition of gene units in association
studies. BMC Genomics, 2014. 15: p. 408.
491. Zhang, K., et al., i-GSEA4GWAS: a web server for identification of
pathways/gene sets associated with traits by applying an improved gene set
enrichment analysis to genome-wide association study. Nucleic Acids Res,
2010. 38(Web Server issue): p. W90-5.
492. Wang, K., M. Li, and M. Bucan, Pathway-based approaches for analysis of
genomewide association studies. Am J Hum Genet, 2007. 81(6): p. 1278-83.
493. Chen, L.S., et al., Insights into colon cancer etiology via a regularized approach
to gene set analysis of GWAS data. Am J Hum Genet, 2010. 86(6): p. 860-71.
494. Holmans, P., et al., Gene ontology analysis of GWA study data sets provides
insights into the biology of bipolar disorder. Am J Hum Genet, 2009. 85(1): p.
13-24.
495. Eleftherohorinou, H., et al., Pathway-driven gene stability selection of two
rheumatoid arthritis GWAS identifies and validates new susceptibility genes in
receptor mediated signalling pathways. Hum Mol Genet, 2011. 20(17): p. 3494-
506.
496. Liu, J.Z., et al., A versatile gene-based test for genome-wide association studies.
Am J Hum Genet, 2010. 87(1): p. 139-45.
497. Nyholt, D.R., et al., Genome-wide association meta-analysis identifies new
endometriosis risk loci. Nat Genet, 2012. 44(12): p. 1355-9.
498. Tang, W., et al., Genetic associations for activated partial thromboplastin time
and prothrombin time, their gene expression profiles, and risk of coronary
artery disease. Am J Hum Genet, 2012. 91(1): p. 152-62.

256
499. Vijai, J., et al., Susceptibility loci associated with specific and shared subtypes of
lymphoid malignancies. PLoS Genet, 2013. 9(1): p. e1003220.
500. Wei, S., et al., Genome-wide gene-environment interaction analysis for asbestos
exposure in lung cancer susceptibility. Carcinogenesis, 2012. 33(8): p. 1531-7.
501. Biddie, S.C., et al., Transcription factor AP1 potentiates chromatin accessibility
and glucocorticoid receptor binding. Molecular cell, 2011. 43: p. 145-55.
502. Yu, C.Y., et al., Genome-wide analysis of glucocorticoid receptor binding
regions in adipocytes reveal gene network involved in triglyceride homeostasis.
PLoS One, 2010. 5(12): p. e15188.
503. Jin, F., et al., A high-resolution map of the three-dimensional chromatin
interactome in human cells. Nature, 2013. 503(7475): p. 290-4.
504. Perkins, D.N., et al., Probability-based protein identification by searching
sequence databases using mass spectrometry data. Electrophoresis, 1999.
20(18): p. 3551-67.
505. Jones, R.C., et al., Relative quantitative comparisons of the extracellular protein
profiles of Staphylococcus aureus UAMS-1 and its sarA, agr, and sarA agr
regulatory mutants using one-dimensional polyacrylamide gel electrophoresis
and nanocapillary liquid chromatography coupled with tandem mass
spectrometry. J Bacteriol, 2008. 190(15): p. 5265-78.
506. Huang da, W., B.T. Sherman, and R.A. Lempicki, Systematic and integrative
analysis of large gene lists using DAVID bioinformatics resources. Nat Protoc,
2009. 4(1): p. 44-57.
507. Huang da, W., B.T. Sherman, and R.A. Lempicki, Bioinformatics enrichment
tools: paths toward the comprehensive functional analysis of large gene lists.
Nucleic Acids Res, 2009. 37(1): p. 1-13.
508. Merico, D., et al., Enrichment map: a network-based method for gene-set
enrichment visualization and interpretation. PLoS One, 2010. 5(11): p. e13984.
509. Reeves, E.K., et al., Proteomic profiling of glucocorticoid-exposed myogenic
cells: Time series assessment of protein translocation and transcription of
inactive mRNAs. Proteome Sci, 2009. 7: p. 26.
510. Mundel, P. and S.J. Shankland, Podocyte biology and response to injury. J Am
Soc Nephrol, 2002. 13(12): p. 3005-15.
511. Liles, W.C., D.C. Dale, and S.J. Klebanoff, Glucocorticoids inhibit apoptosis of
human neutrophils. Blood, 1995. 86(8): p. 3181-8.
512. Zhu, W., J.W. Smith, and C.M. Huang, Mass spectrometry-based label-free
quantitative proteomics. J Biomed Biotechnol, 2010. 2010: p. 840518.
513. Issaq, H. and T. Veenstra, Two-dimensional polyacrylamide gel electrophoresis
(2D-PAGE): advances and perspectives. Biotechniques, 2008. 44(5): p. 697-8,
700.
514. Nagy, A., Cre recombinase: the universal reagent for genome tailoring.
Genesis, 2000. 26(2): p. 99-109.
515. Sauer, B. and N. Henderson, Site-specific DNA recombination in mammalian
cells by the Cre recombinase of bacteriophage P1. Proc Natl Acad Sci U S A,
1988. 85(14): p. 5166-70.
516. Laryea, G., G. Schutz, and L.J. Muglia, Disrupting hypothalamic glucocorticoid
receptors causes HPA axis hyperactivity and excess adiposity. Mol Endocrinol,
2013. 27(10): p. 1655-65.
517. Comper, W.D., Is the LPS-mediated proteinuria mouse model relevant to human
kidney disease? Nat Med, 2009. 15(2): p. 133; author reply 133-4.
518. Finlayson, J.S. and C.A. Baumann, Mouse proteinuria. Am J Physiol, 1958.
192(1): p. 69-72.

257
519. Cheetham, S.A., et al., Limited variation in the major urinary proteins of
laboratory mice. Physiol Behav, 2009. 96(2): p. 253-61.
520. Tronche, F., et al., Disruption of the glucocorticoid receptor gene in the nervous
system results in reduced anxiety. Nat Genet, 1999. 23(1): p. 99-103.
521. Vettorazzi, S., et al., Glucocorticoids limit acute lung inflammation in concert
with inflammatory stimuli by induction of SphK1. Nat Commun, 2015. 6: p.
7796.
522. Schulz-Baldes, A., et al., Induction of the epithelial Na+ channel via
glucocorticoids in mineralocorticoid receptor knockout mice. Pflugers Arch,
2001. 443(2): p. 297-305.
523. Naray-Fejes-Toth, A. and G. Fejes-Toth, Glucocorticoid receptors mediate
mineralocorticoid-like effects in cultured collecting duct cells. Am J Physiol,
1990. 259(4 Pt 2): p. F672-8.
524. Goodwin, J.E., et al., The glucocorticoid receptor in the distal nephron is not
necessary for the development or maintenance of dexamethasone-induced
hypertension. Biochem Biophys Res Commun, 2010. 394(2): p. 266-71.
525. Greenbaum, L.A., R. Benndorf, and W.E. Smoyer, Childhood nephrotic
syndrome--current and future therapies. Nat Rev Nephrol, 2012. 8(8): p. 445-
58.
526. Fornoni, A., et al., Rituximab targets podocytes in recurrent focal segmental
glomerulosclerosis. Sci Transl Med, 2011. 3(85): p. 85ra46.
527. Patrakka, J. and K. Tryggvason, New insights into the role of podocytes in
proteinuria. Nat Rev Nephrol, 2009. 5(8): p. 463-8.
528. Chugh, S.S., et al., Angiopoietin-like 4 based therapeutics for proteinuria and
kidney disease. Front Pharmacol, 2014. 5: p. 23.
529. Koshikawa, M., et al., Role of p38 mitogen-activated protein kinase activation in
podocyte injury and proteinuria in experimental nephrotic syndrome. J Am Soc
Nephrol, 2005. 16(9): p. 2690-701.
530. Schiffer, M., et al., Apoptosis in podocytes induced by TGF-beta and Smad7. J
Clin Invest, 2001. 108(6): p. 807-16.
531. Menne, J., et al., Diminished loss of proteoglycans and lack of albuminuria in
protein kinase C-alpha-deficient diabetic mice. Diabetes, 2004. 53(8): p. 2101-9.
532. Kitamura, M., Endoplasmic reticulum stress and unfolded protein response in
renal pathophysiology: Janus faces. Am J Physiol Renal Physiol, 2008. 295(2):
p. F323-34.
533. Henderson, J.M., M.P. Alexander, and M.R. Pollak, Patients with ACTN4
mutations demonstrate distinctive features of glomerular injury. J Am Soc
Nephrol, 2009. 20(5): p. 961-8.
534. Bensman, A. and P. Niaudet, Non-immunologic mechanisms of calcineurin
inhibitors explain its antiproteinuric effects in genetic glomerulopathies. Pediatr
Nephrol, 2010. 25(7): p. 1197-9.
535. Mathieson, P.W., The podocyte as a target for therapies--new and old. Nat Rev
Nephrol, 2012. 8(1): p. 52-6.
536. Yang, H.C., et al., Peroxisome proliferator-activated receptor-gamma agonist is
protective in podocyte injury-associated sclerosis. Kidney Int, 2006. 69(10): p.
1756-64.
537. Agrawal, S., et al., Comparison of direct action of thiazolidinediones and
glucocorticoids on renal podocytes: protection from injury and molecular
effects. Mol Pharmacol, 2011. 80(3): p. 389-99.
538. Lee, H.S. and C.Y. Song, Effects of TGF-beta on podocyte growth and disease
progression in proliferative podocytopathies. Kidney Blood Press Res, 2010.
33(1): p. 24-9.

258
539. Wells, A., et al., Targeting tumor cell motility as a strategy against invasion and
metastasis. Trends Pharmacol Sci, 2013. 34(5): p. 283-9.
540. Schacke, H., et al., Dissociation of transactivation from transrepression by a
selective glucocorticoid receptor agonist leads to separation of therapeutic
effects from side effects. Proc Natl Acad Sci U S A, 2004. 101(1): p. 227-32.
Copyright © 2022 FDOKUMEN