PLATE MAPPING: USING DRAWINGS OF FOODS TO EXAMINE ...
127
PLATE MAPPING: USING DRAWINGS OF FOODS TO EXAMINE ASSOCIATIONS OF PLATEWARE WITH PERCEPTIONS, PREDICTIONS, AND RECALLS OF MEAL SIZE AND MEAL COMPOSITION A Dissertation Presented to the Faculty of the Graduate School of Cornell University In Partial Fulfillment of the Requirements for the Degree of Doctor of Philosophy by David Erickson Sharp August 2015
-
Upload
khangminh22 -
Category
Documents
-
view
4 -
download
0
Transcript of PLATE MAPPING: USING DRAWINGS OF FOODS TO EXAMINE ...
PLATE MAPPING: USING DRAWINGS OF FOODS TO EXAMINE
ASSOCIATIONS OF PLATEWARE WITH PERCEPTIONS, PREDICTIONS, AND
RECALLS OF MEAL SIZE AND MEAL COMPOSITION
A Dissertation
Presented to the Faculty of the Graduate School
of Cornell University
In Partial Fulfillment of the Requirements for the Degree of
Doctor of Philosophy
by
David Erickson Sharp
August 2015

© 2015 David Erickson Sharp
PLATE MAPPING: USING DRAWINGS OF FOODS TO EXAMINE ASSOCIATIONS OF
PLATEWARE WITH PERCEPTIONS, PREDICTIONS, AND RECALLS OF MEAL SIZE
AND MEAL COMPOSITION
David Erickson Sharp, Ph.D.
Cornell University 2015
People eat meals rather than nutrients or food groups. Meals are typically eaten
off of plates in American households. Plate size may influence meal size, meal
composition, and food type. To examine the effects of plate size on meals, a new
method called plate mapping was developed to analyze how participants responded to
varying plate sizes and shapes. Four unique studies were developed and analyzed that
used plate mapping to examine how various plates affected participant’s estimations of
food portion size and meal size. Two quasi-experimental studies asked participants to
accurately draw and label a dinner on either a 9" or 11" standard paper plate. One
quasi-experimental study asked participants to complete the same study design using
either a 9.5” or 10.5” plate divided into three compartments. To validate plate mapping,
a quasi-experimental study was conducted that asked participants in a college cafeteria
to draw their self-purchased lunch at either pre-consumption or post-consumption time
points on either a 9" or 11" paper plate.
Three studies were done on the campus of a large college in the Northeastern
United States (n=270, n=248, & n=98) and a fourth study recruited adults from a
medium sized city in the Northeastern United States (n=281). The independent variable
was plate size. Dependent variables were meal size, meal plate coverage, individual
sizes of foods by food type and portion, and temporal condition of a meal (pre- or post-
consumption). Gender was a moderating variable.
Overall, the size of plate drawings was highly correlated with the size of actual
foods when the size of the plate drawn on was equivalent to the size of the plate
containing the food. This provides support for the validity of the method of plate
mapping and suggests that researchers must be cognizant of plate size whenever
conducting research involving plates. Participants reported larger meal sizes whenever
larger plates were provided, suggesting that participants are sensitive to the size of the
plate and predict or recall meals as larger in the presence of larger plates. Gender
moderated meal size drawings, with women generally drawing meals that were more
highly correlated and similarly sized to actual meals than men. The effects from differing
plate sizes appears to be more powerful for males than females and may encourage
larger food servings by men. These findings suggest plate mapping can be used to
reflect meal conceptualizations and assess sensitivity to plate size. Further research
examining plate sizes influence on meals is needed to increase understanding of how
participant estimations of “proper” meal sizes are developed and maintained.
i
BIOGRAPHICAL SKETCH
David Sharp earned his Bachelor of Arts degree in Cultural Anthropology from
The University of Santa Cruz in 2007. In 2009 he joined the doctoral program in
Community Nutrition at Cornell University.
While pursuing his degree, Dr. Sharp created and organized Dr. Jeffery Sobal’s
Built Environment lab. During his years at Cornell, he also ran Dr. Anthony Ong’s
Resilience and Lifespan Development lab and served as a researcher for Dr. Brian
Wansink’s Food and Brand Lab.
Dr. Sharp has been the recipient of numerous honors and awards including a
Student Scholarship from the Society of Nutrition Education and Behavior Foundation
and a Barnes Alumni Fellowship from Cornell University. He was also selected as an
NIH NIDDK Cornell Nutrition Training Grant Trainee.
Dr. Sharp has presented his research at the Society for Nutrition Education and
Behavior and the Association for the Study of Food and Society conferences and has
published his dissertation research in the journals Appetite and Eating Behaviors.
Dr Sharp’s dissertation, Plate Mapping: Using drawn representations of food to
explore the effects of plateware on prediction, recall, and perceptions of meal size, was
supervised by Dr. Jeffery Sobal.

ii
To my wonderful children in the hopes that they one day will be inspired to read it and
understand.

iii
ACKNOWLEDGMENTS
Words do not do justice to the people listed on this page for their contributions towards
my Ph.D. Nor is there enough space to list everyone who has supported me through
this endeavor. First and foremost, I thank Dr. Jeffery Sobal for having so much trust and
patience. The rest of my committee, Drs. Brian Wansink, Anthony Ong, and Jere Haas,
are to be commended as well for their skilled mentoring. I also acknowledge the staff,
students, and faculty at Cornell University’s Division of Nutritional Sciences and the
National Institute of Diabetes, Digestive, and Kidney Diseases for their support through
Grant Number T32DK007158. In addition to the excellent mentoring I received at
Cornell, there were many teachers along the way that helped lay my foundation.
Drs. Melissa Caldwell and Nathaniel Dominy at UC Santa Cruz provided the catalyst I
needed in order to turn my interests towards doctoral work. Frank White, Dorothy
Bruntz, and Neil Rothschild, were instrumental during my more formative years in
instilling humor, confidence, and confidence in my abilities both as a person and as a
student and my high school Principal Dr. Robert Saunders saw leadership potential in
me and went out of his way to put me in situations that allowed that skill to blossom.
My family also deserves credit for both their support and their patience, none more than
my wife, Erin Sharp, our children, Devlin Gibson Sharp and Emerson Balam Sharp, and
both of our parents- Evan and Rebecca Brown and Ron and Linda Sharp.
Finally, I acknowledge Coffee for making all of the above possible.
iv
TABLE OF CONTENTS
Chapter 1: Introduction………………………………………………………………….page 1
Chapter 2: Using plate mapping to examine sensitivity to plate size in food
portions and meal composition among college students………………...…………page 17
Chapter 3: Representations of dinner meals vary by the size of the plate:
Using plate mapping to examine meal size and meal composition among
adult men and women ………………………………………………………………….page 43
Chapter 4: Validating the Plate Mapping Method: Comparing Drawn
Foods and Actual Foods of University Students in a Cafeteria…………………….page 63
Chapter 5: Using Plate Mapping to Examine Portion Size and Plate
Composition for Large and Small Divided Plates ………………….…………...……page 87
Chapter 6: Conclusion…………………………………………………………………page 107
Appendix…………………………………………………………………...……...……page 113
v
LIST OF FIGURES
Figure 1.1 Hypothesized relationship between plate size, serving
size, and consumption volume, and gender………………….………....…page 7
Figure 1.2 The Delboeuf illusion, dinnerware size, and meal size…...…..………page 10
Figure 2.1 Mean size of food item by plate size and gender………..…………….page 27
Figure 3.1 Food course size by plate size and gender…………..………………..page 51
Figure 3.2 Food type size by plate size and gender………….…………………...page 52
Figure 4.1 Males comparison of real and drawn meal size for
pre-consumption 9” plates………………………………………….……..….page 74
Figure 4.2 Males comparison of real and drawn meal size for
pre-consumption 11” plates……………………………………………………page 75
Figure 4.3 Males comparison of real and drawn meal size for
post-consumption 9” plates……………………………………………………page 76
Figure 4.4 Males comparison of real and drawn meal size for
post-consumption 11” plates…………………………………………………..page 77
Figure 4.5 Females comparison of real and drawn meal size for
pre-consumption 9” plates……………………………………………………page 78
Figure 4.6 Females comparison of real and drawn meal size for
pre-consumption 11” plates……………………………………………………page 79
Figure 4.7 Females comparison of real and drawn meal size for
post-consumption 9” plates……………………………………….……………page 80
Figure 4.8 Females comparison of real and drawn meal size for
post-consumption 11” plates………..…………………………………………page 81
vi
LIST OF TABLES
Table 2.1 Demographic, plate sensitivity, food portion, and food type
results from 11” and 9” plate respondents………………..…………..page 27
Table 3.1 Demographics, plate drawing coverage, food types, and food
items by plate size……………………………………………….………page 53
Table 3.2 Plate drawing coverage, food types, and food items by plate
size and gender………………………………………………….………page 54
Table 4.1 Comparison of drawn and actual food portion and meal size
for pre- and post-consumption males……………………….…………page 72
Table 4.2 Comparison of drawn and actual food portion and meal size
for pre- and post-consumption females………………....…………….page 73
Table 5.1 Demographics, plate coverage, food type, and food size for
large and small divided plates………………………………………….page 97
Table 5.2 Demographics, plate coverage, food type, and food size for
large and small divided plates by gender……………...……………..page 98-99
1
CHAPTER 1: INTRODUCTION
Obesity is a prevalent health problem in the United States and globally (WHO,
2000; Ogden, Carroll, Kit, & Flegal, 2013). Excess body weight has been connected to
increases in morbidity and mortality and a reduction in the overall quality of life (Flegal,
Kit, Orpana, & Graubard, 2013). One influence on obesity is the overconsumption of
food (Rennie, Johnson, & Jebb, 2005; Young & Nestle, 2003). With the prevalence of
super-sized food portions, max-pack food containers, and cheap, high-calorie snacks
readily available in homes, grocery stores, and restaurants, the United States has
become saturated with food calories. An excessive availability of food, when combined
with the environmental cues to eat that come from radio, television, internet, and
billboards, create a landscape where it is difficult for an individual to not be constantly in
a state of looking at or thinking about food.
There is extensive research about environmental variables that may impact food
consumption (Sobal & Wansink, 2007). Some of these environmental variables may
influence us in ways that we are not aware of or fail to actively monitor (Rozin, Dow,
Moscovitch, & Rajaram, 1998). These factors may drive food intake without individuals
even knowing that they have been affected. One such factor includes the size of the
vessel in which food is served (Kallbekken & Sælen, 2013). While the USDA offers
guidelines about appropriate eating practices (U.S. Department of Agriculture & U.S.
Department of Health and Human Services, 2010), it does not have similar guidelines
for the plates and bowls that those portions are served in to. Even to experts, proper
portion size can be hard to discern when seen on different sized vessels.
2
Larger serving vessels are associated with people taking larger food portions in
several studies. For example, Wansink, van Ittersum, & Painter (2006) examined
whether bowl size could influence portion size selection of ice cream by nutrition
experts. In a 2x2 study design, 85 nutrition professionals were randomly given either a
large or a small bowl and a large spoon or a small spoon. The participants who were
given the larger bowl served themselves, on average, 31% more ice cream than
participants provided with a smaller bowl. These findings have also been observed in
children (Fisher & Kral, 2008). Similar results were found when van Kleef, Shimizu, &
Wansink (2012) provided participants with two sizes of serving bowls filled with pasta
but did not change the size of the vessel that participants used to eat from. Participants
in the larger serving bowl condition self-served themselves 77% more pasta when
compared to the portions served from the smaller serving bowl. DiSantis et al. (2013)
found that children’s self-served portion sizes increased when the sizes of both plates
and bowls increased. Wansink, Payne, & Werle (2008) have shown that children’s self-
served portion sizes of cereal increased when the available bowl size increased. All of
these studies illustrate that the size of the bowls and plates in which people eat from
can influence the size of self-served portions.
Large pre-served portion sizes encouraged greater food consumption in several
studies (Rolls, Morris, & Roe, 2002; Scheibehenne, Todd, & Wansink, 2010). A study
that utilized inconspicuous self-refilling bowls found that participants given the self-
refilling bowl consumed 73% more than those with a normal fixed amount bowl
(Wansink, Painter, & North, 2005). Participants who consumed more reported that they
had not perceived that they ate more than those with the non-refilling bowls. These
3
participants who did not report knowing that they consumed more soup also did not
indicate that they were more satiated. In combination with the findings of van Kleef, &
Wansink (2012), these results suggest that participants who self-serve larger portions
may not result in increased feelings of satiation even though participants consumed
more food. This association between portion size and intake was found to operate when
portion sizes were decreased as well. For example, Rolls, Roe, Halverson, & Meengs
(2006) reported that decreasing portion size and energy density decreased energy
intake without changing hunger and fullness ratings.
While prior research finds evidence for a relationship between portion size and
energy intake, recent literature reviews report mixed findings about the relationship
between vessel size and real or imagined portion size (Libotte et al 2014; Wadhera &
Capabaldi-Phillips, 2014). Prior studies have generally shown a relationship between
three dimensional vessels such as drinking glasses and bowls and portion sizes where
even individuals considered “experts” in portion or serving sizes like bartenders
(Wansink and van Ittersum, 2005) and nutrition faculty (Wansink et al., 2006) self-serve
differently sized portions depending on the shape or size their vessel. Drinking glasses
have been shown to promote size miss-estimating depending on whether the
participants were given a tall, thin glass or a short, wide glass (Wansink & van Ittersum,
2005). A majority of the studies that do identify an effect of vessel size on portion size
and consumption utilize bowls as the dishware in which food is served (Wansink &
Cheney, 2005; Wansink, van Ittersum, & Painter, 2006; Wansink & van Ittersum, 2007;
Van Ittersum & Wansink, 2012. These studies suggest that there may be an association
between vessel size and consumption. Like larger bowls, larger plates increase the size

4
of food that people can serve themselves, and having more food available on a plate
increases the opportunity for a person to consume more food.
While bowls and glasses have generally been shown to influence portion size,
there are mixed reports about the capacity for plates to influence portion size in a similar
fashion (Libotte et al., 2014). Shah, Schroeder, Winn, & Adams-Huet (2011) performed
a pilot study to observe if plate size influences consumption in normal and overweight or
obese women. They utilized two different size plates (8.5” and 10.8”) and a crossover
study design to study potential differences in total energy intake from a single food item.
This pilot study found that plate size did not affect intake in normal weight and obese
women. Similarly, Yip, Wiessing, Budgett, & Poppitt (2013) found that using a smaller
plate did not decrease consumption in overweight women eating in a buffet setting.
Additionally, Koh & Pliner (2009) found that plate size altered consumption when a
secondary measurement, degree of acquaintance, was added to the equation. A recent
meta-analysis of plate size studies concluded that the difference in food consumption
between small and large plates was marginally statistically significant and the
magnitude of effect was small (Robinson et al., 2014). They concluded that plate size’s
effect on public health was still unknown and more research was required before
recommendations could be made.
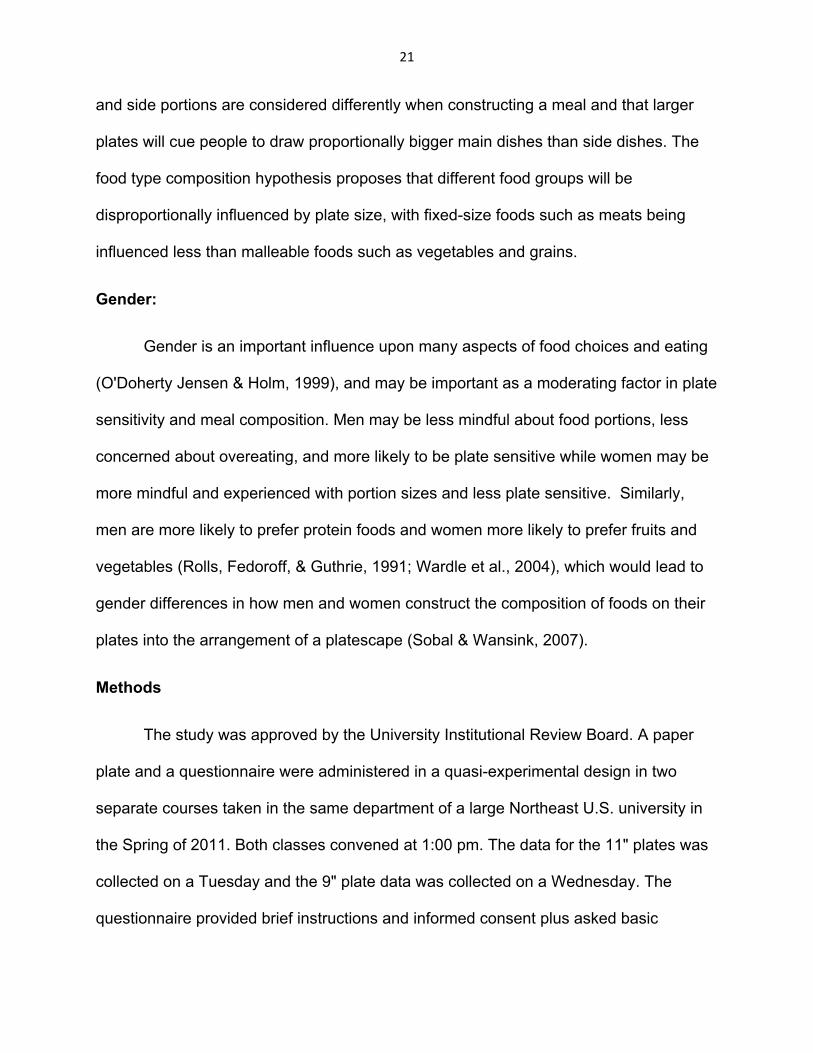
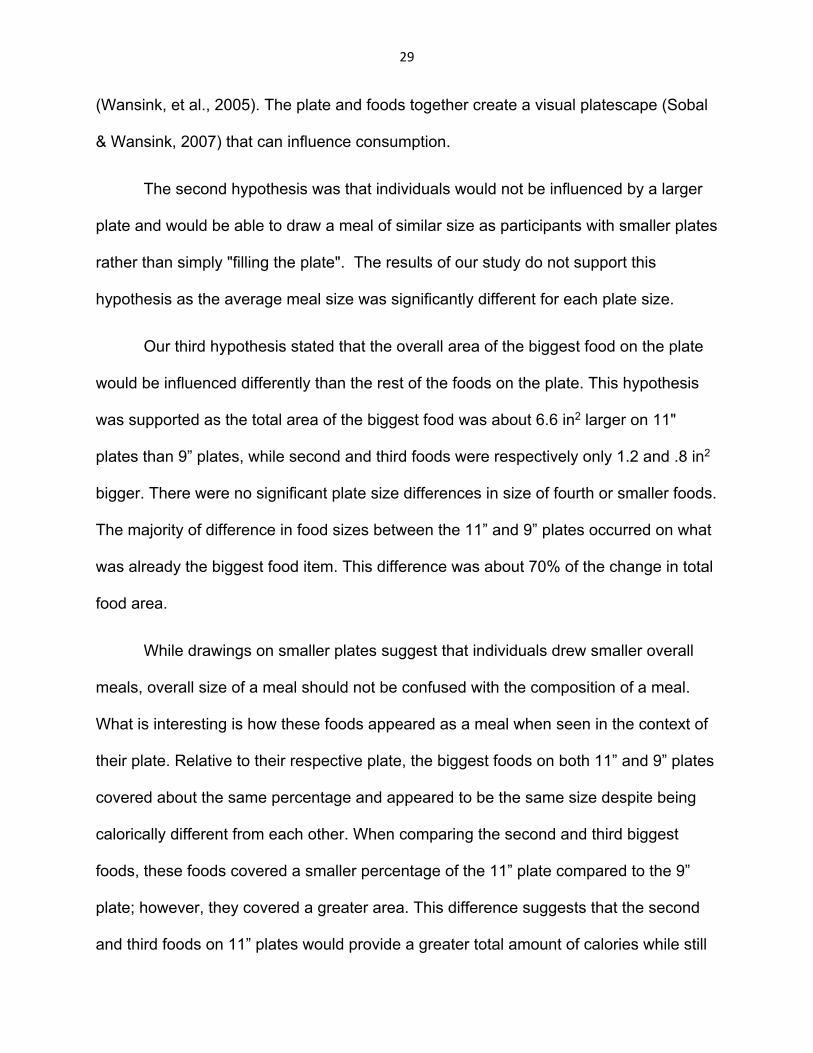
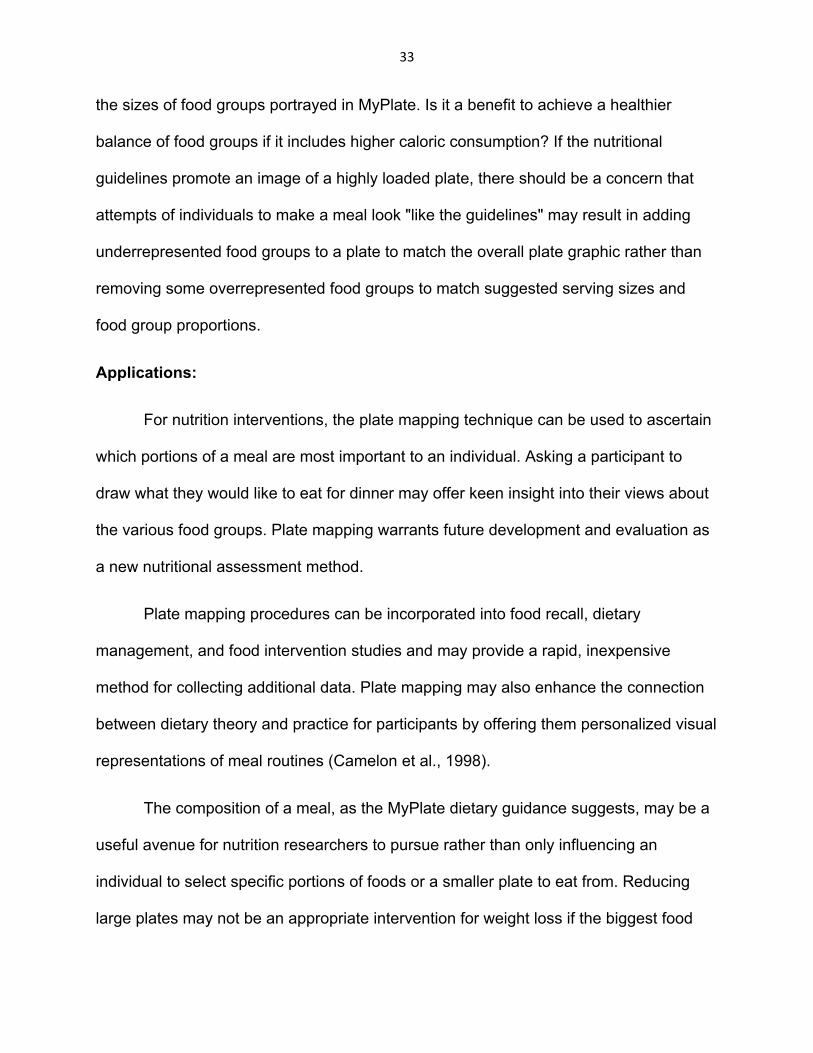
Given the current research status regarding the effects on consumption volume,
Figure 1.1 shows the factors previously connected to consumption volume as well as
the hypothesized relationships that plate size has with gender and portion size (Yuhas,
Bolland, & Bolland, 1989; Brunstrom, Rogers, Pothos, Calitri, & Tapper, 2008) when
influencing consumption. The potential interactions between plate size and gender,

5
especially on serving size and consumption volume, underline the importance of better
understanding the effects of plate size on meals.
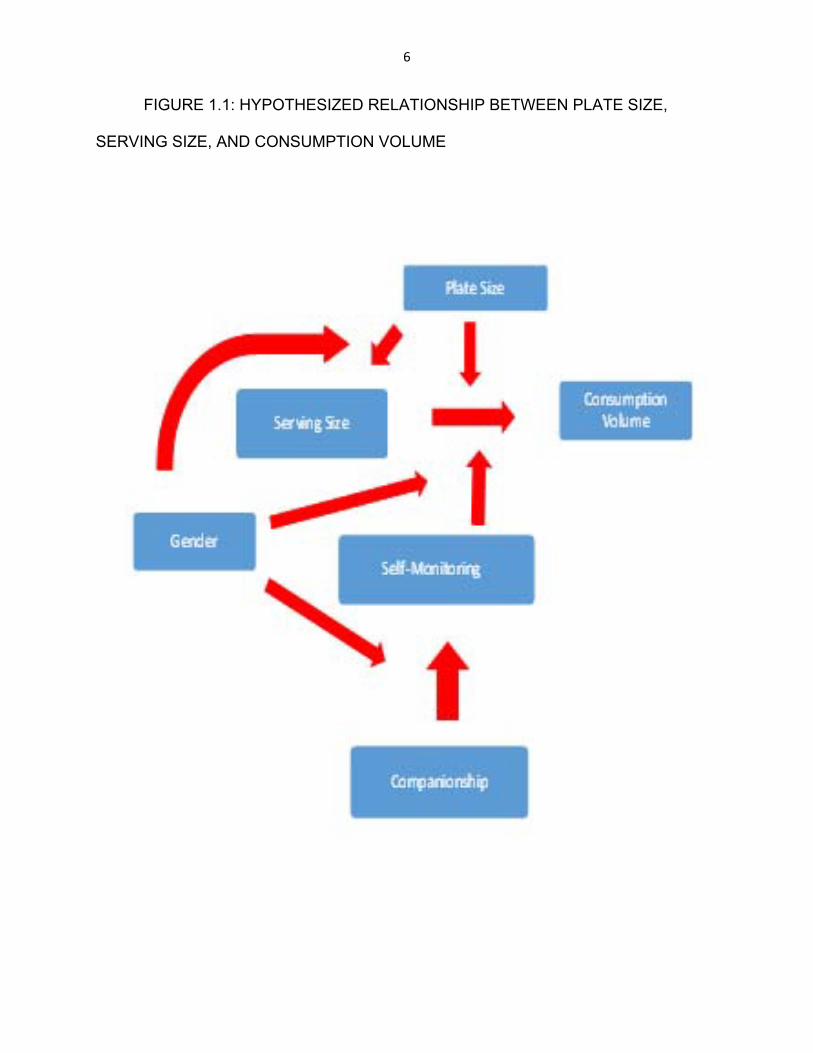
6
FIGURE 1.1: HYPOTHESIZED RELATIONSHIP BETWEEN PLATE SIZE,
SERVING SIZE, AND CONSUMPTION VOLUME

7
Plate Mapping
Plate mapping is a way to measure an individual’s meal conceptualization (Sharp
& Sobal, 2012; Sharp, Sobal, & Wansink, 2014). The plate mapping method was
developed by the Built Environment and Nutrition Lab in the Division of Nutritional
Sciences at Cornell University. Plate mapping measures meal conceptualization by
asking participants to draw foods on a paper plate that correspond with their estimation
of a meal that they have eaten, will eat, would like to eat, or are currently observing. The
use of drawing is supported by studies that show that drawings of food on the horizontal
plane can be used as a reasonable alternative to food models or actual food (Pratt,
Croager, & Rosenberg, 2012). Steyn et al. (2006) found that two-dimensional drawings
of food provided better estimates of actual energy and fat than three-dimensional
models. These drawings may have been accurate because of individuals’ perceptions of
the size of an object anchoring on a single linear dimension, even if more than one
dimension is available (Krider, Raghubir, and Krishna 2001).
Drawing on plates has previously been used by health educators in Canada as a
training tool in conjunction with education to enhance the relationship between nutrition
education and healthy eating in persons with diabetes (Camelon et al. 1998). Van
Ittersum and Wansink (2012) also used plate drawings to examine the perceptual bias
known as the Delboeuf illusion.
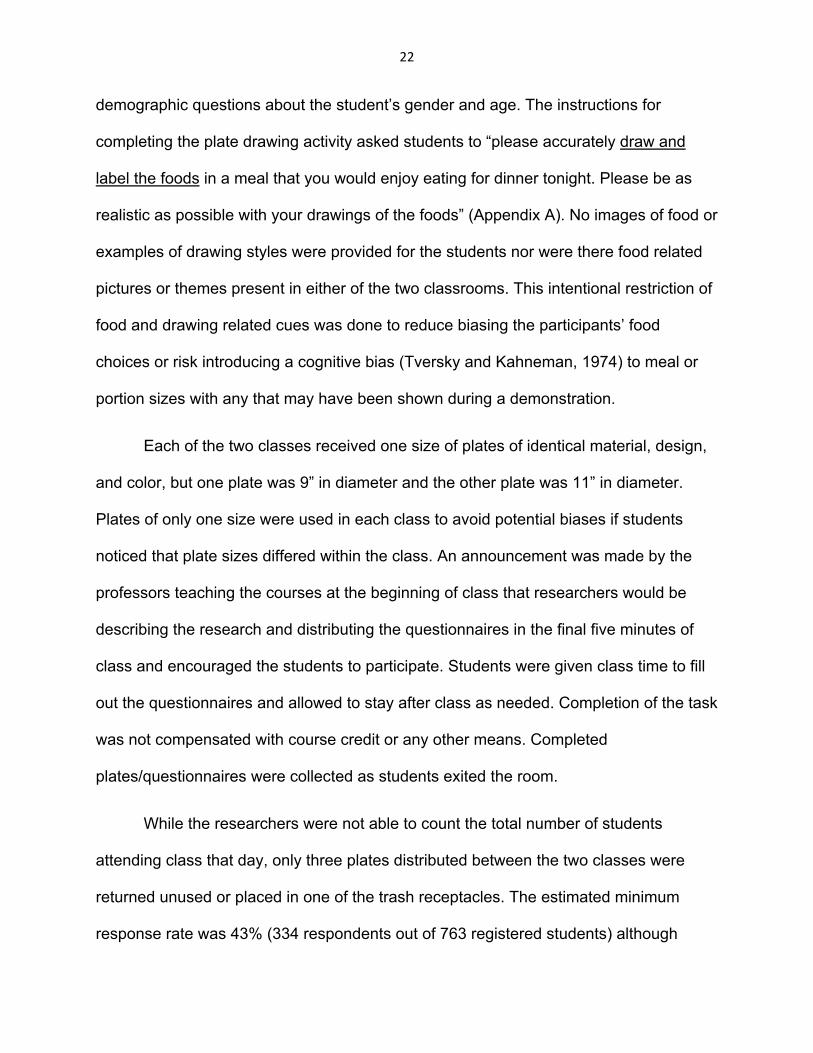
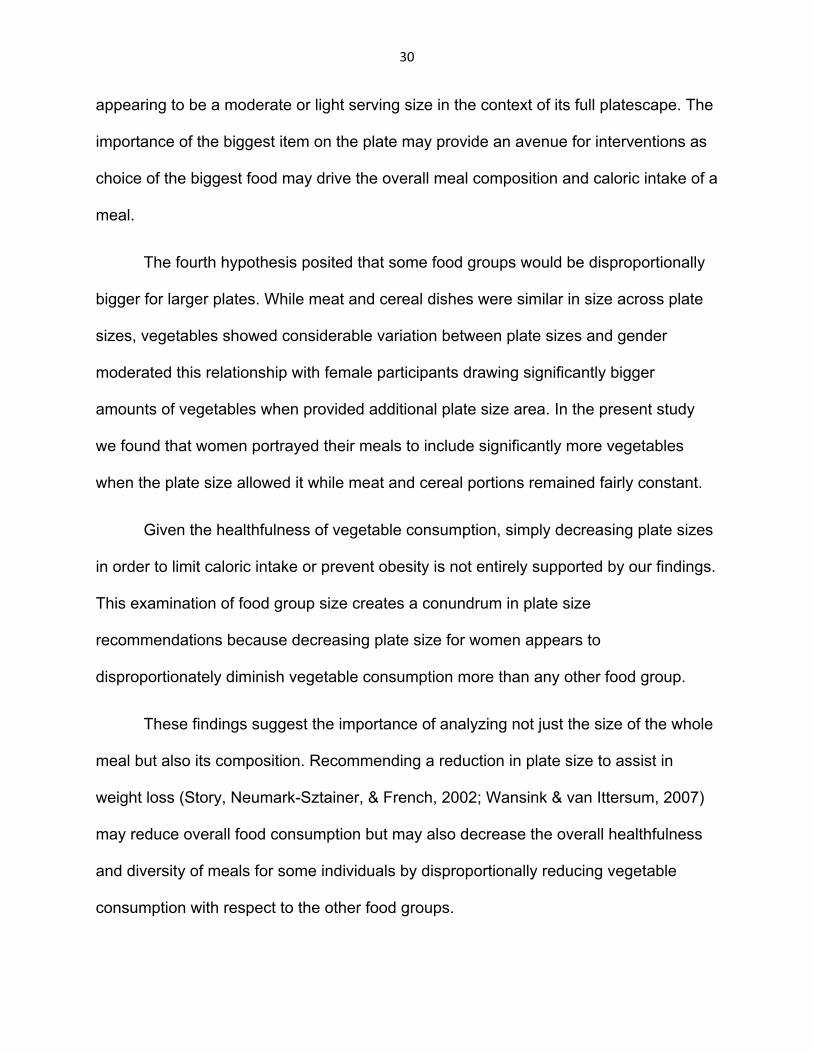
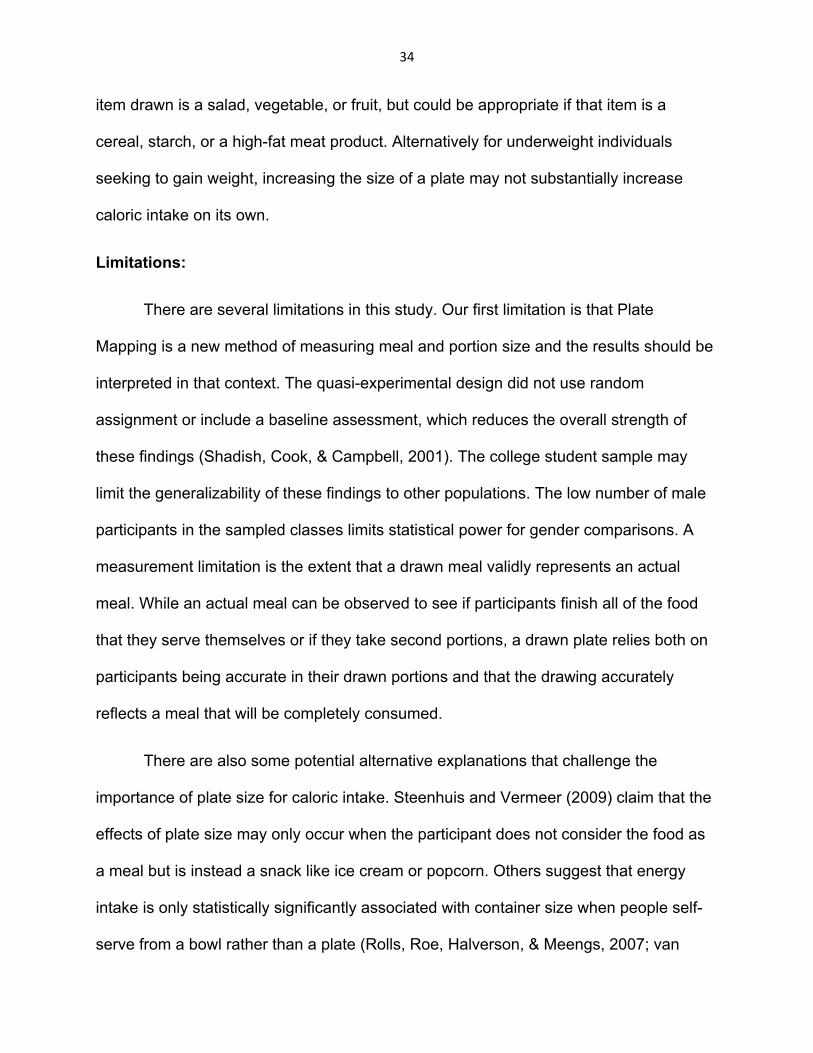
Over 150 years ago, Delbeouf (1865) reported a visual illusion where two
identically sized circles would appear to be of different sized depending on their
immediate surroundings. If a small ring surrounded it, the circle appeared larger then
when compared to the same circle with a larger ring surrounded it. This illusion is based
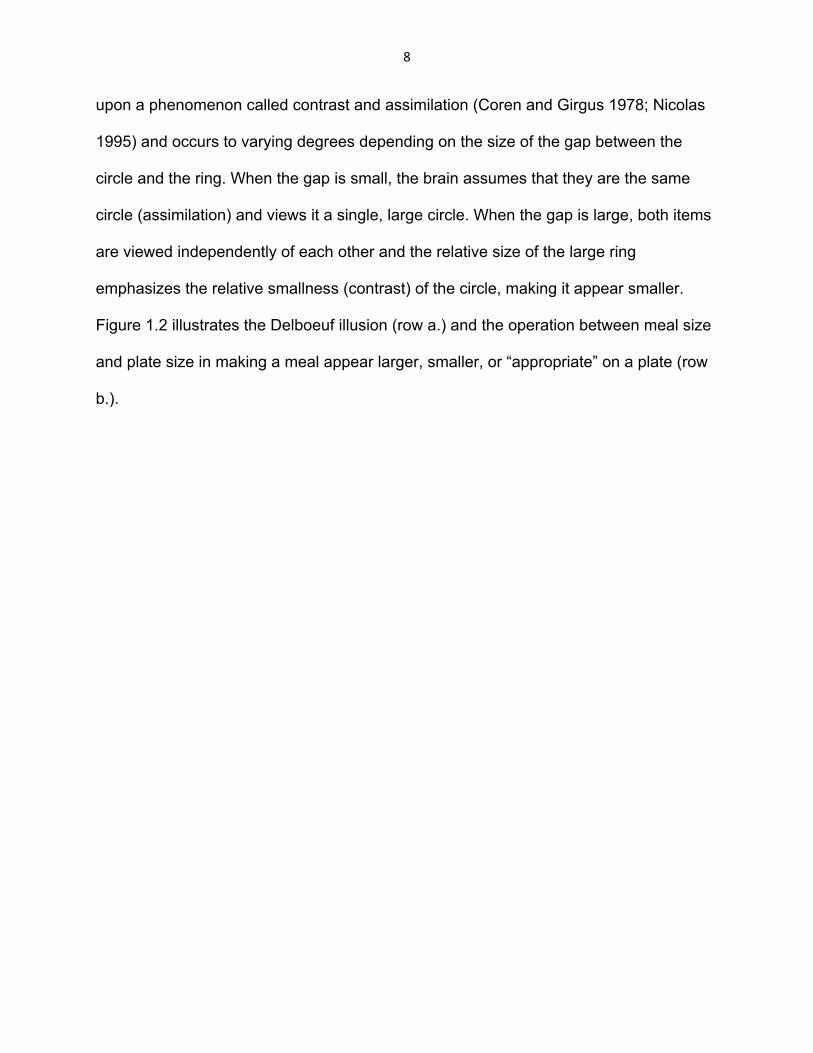
8
upon a phenomenon called contrast and assimilation (Coren and Girgus 1978; Nicolas
1995) and occurs to varying degrees depending on the size of the gap between the
circle and the ring. When the gap is small, the brain assumes that they are the same
circle (assimilation) and views it a single, large circle. When the gap is large, both items
are viewed independently of each other and the relative size of the large ring
emphasizes the relative smallness (contrast) of the circle, making it appear smaller.
Figure 1.2 illustrates the Delboeuf illusion (row a.) and the operation between meal size
and plate size in making a meal appear larger, smaller, or “appropriate” on a plate (row
b.).
9
FIGURE 1.2: THE DELBOEUF ILLUSION, DINNERWARE SIZE, AND MEAL
SIZE
a.
b.
10
Current research examining portion size has previously relied upon either real
food or imitation food such as plastic food models or food images to collect data. Both of
these options may guide the subject into thinking about specific foods or specific
portions (Herman & Polivy, 2005; Levitsky, Obarzanek, Mrdjenovic, & Strupp, 2005).
These external food cues provided by the researchers can anchor an individual's
perceptions of portion size and may bias their food choice responses (Sobal & Bisogni,
2009; Wansink, Painter, & North, 2005). By incorporating the Delboeuf illusion into
nutrition research and limiting external food cues, it should be possible to examine plate
size’s relationships to portion and meal size and add an under-investigated and
important topic of how meals are shaped. Since there were no existing data sets
available that looked at two dimensional visual representations of food portions and
meal size, new research protocols were designed to add depth and better understand
these influences on real and perceived food.
Four unique studies were used to collect primary data and examine the plate
size’s relationships with participants’ ability to accurately estimate food portion and meal
size, accuracy in predicting portion and meal size, accuracy in recalling food portion and
meal size, and sensitivity to external influences on food portion and meal size.
Participant sensitivity to the external effects of plate size on food portions and meal size
is examined in college students in Chapter 2 and adults in Chapter 3. Real and
perceived food portions and meal sizes are examined in Chapter 4 as both a proof of
concept that participants can draw their foods immediately prior to and directly after
consuming a meal and to measure the accuracy of those drawings. Chapter 5
manipulates the composition of the platescape and examines sensitivity to plate size

11
using small and large divided plates. Finally, implications of the research and
concluding summaries of the work are presented in Chapter 6.
12
References Brunstrom, J.M., Rogers, P.J., Pothos, E.M., Calitri, R., & Tapper, K. (2008). Estimating
everyday portion size using a “method of constant stimuli”: In a student sample, portion size is predicted by gender, dietary behaviour, and hunger, but not BMI. Appetite. 51(2), 296-301.
Camelon, K.M., Hådell, K., Jämsén, P.T., Ketonen, K.J., Kohtamäki, H.M., Mäkimatilla,
S., Törmälä, M.L., & Valve, R.H. (1998). The Plate Model: a visual method of teaching meal planning. DAIS Project Group. Diabetes Atherosclerosis Intervention Study. J. Am. Diet Assoc. 98(10),1155-1158.
Coren, S., & Girgus, J.S. (1978). Seeing is Deceiving: The psychology of visual
illusions, Hillsdale, NH: Erlbaum. Delboeuf, Franz Joseph (1865). “Note sur certaines illusions d’optique: Essai d’une
théorie psychophysique de la manière dont l’oeil apprécie les distances et les angles” [Note on certain optical illusions: Essay on a psychophysical theory concerning the way in which the eye evaluates distances and angles], Bulletins de l’Académie Royale des Sciences, Lettres et Beaux-arts de Belgique, 19, 2nd ser., 195–216.
DiSantis, K.I., Birch, L.L., Davey, A., Serrano, E.L., Zhang, J., Bruton, Y., & Fisher, J.O.
(2013). Plate size and children’s appetite: Effects of larger dishware on self-served portions and intake. Pediatrics, 131(5), 1-8.
Flegal, K.M., Kit, B.K., Orpana, H., & Graubard, B.I. (2013). Association of All-Cause
Mortality With Overweight and Obesity Using Standard Body Mass Index Categories: A Systematic Review and Meta-analysis. JAMA. 309(1), 71-82.
Fisher, J.O. & Kral, T.V. (2008). Super-size me: Portion size effects on young children’s eating. Physiology and Behavior, 94, 39-47.
Herman, C. P., & Polivy, J. (1984). A boundary model for the regulation of eating. Res
Publ Assoc Res Nerv Ment Dis, 62, 141-156. Kallbekken, S., & Sælen, H. (2013) ‘Nudging hotel guests to reduce food waste as a
win-win environmental measure. Economics Letters, 119, 325-327. Koh, J., & Pliner, P. (2009). The effects of degree of acquaintance, plate size, and
sharing on food intake. Appetite, 52(3), 595-602
Krider, R.E., Raghubir, P., & Krishna, A. (2001). Pizzas: Pi or Square? Psychophysical Biases in Area Comparisons. Marketing Science, 20(4) 405-425.
13
Levitsky, D.A., Obarzanek, E., Mrdjenovix, G., & Strupp, B.J. (2005), Imprecise control of energy intake: absense of a reduction in food intake following overfeeding in young adults. Physiol Behav, 84, 669-675.
Libotte, E., Siegrist, M., & Bucher, T. (2014). The influence of plate size and meal composition. Literature review and experiment. Appetite. 82:91-96.
Nicolas, S. (1995), Joseph Delboeuf on Visual Illusions: A Historical Sketch. American Journal of Psychology, 104, 563–74.
Ogden, C. L., Carroll, M. D., Kit, B. K., & Flegal, K. M. (2012). Prevalence of obesity and trends in body mass index among US children and adolescents, 1999-2010. JAMA, 307(5), 483-490.
Pratt, I. S., Croager, E. J., & Rosenberg, M. (2011). The mathematical relationship
between dishware size and portion size. Appetite, 58(1), 299-302.
Rennie, K.L., Johnson, L., & Jebb, S.A. (2005). Behavioral determinants of obesity. Best Pract Res Clin Endocrinol Metab, 19(3): 343-358.
Robinson, E., Nolan, S., Tudur-Smith, C., Boyland, E.G., Harrold, J.A., Handman, C.A., & Halford, J.C.G. (2014). Will smaller plates lead to smaller wastes? A systematic review and meta analysis of the effect that experimental manipulation of dishware has on energy consumption. Obes Rev 15, 812–821.
Rolls, B.J., Morris, E.L., & Roe, L.S. (2002). Portion size of food affects energy intake in normal-weight and overweight men and women. Am J Clin Nutr, 76, 1207-1213.
Rolls, B. J., Roe, L. S., Halverson, K. H., & Meengs, J. S. (2007). Using a smaller plate did not reduce energy intake at meals. Appetite, 49(3), 652-660.
Rozin, P., Dow, S., Moscovitch, M., & Rajaram, S. (1998). What Causes Humans to
Begin and End a Meal? A Role for Memory for What Has Been Eaten, as Evidenced by a Study of Multiple Meal Eating in Amnesic Patients. Psych Sci, 9(5), 392-396.
Scheibehenne, B., Todd, P.M., & Wansink, B. (2010). Dining in the dark. The
importance of visual cues for food consumption and satiety. Appetite, 55(3), 710-713.
Shah, M., Schroeder, R., Winn, W., & Adams-Huet, B. (2011). A pilot study to
investigate the effect of plate size on meal energy in normal weight and overweight/obese women. Journal of Human Nutrition and Dietetics, 24, 612-615.
Sharp, D.E. & Sobal, J. (2012). Using plate mapping to examine sensitivity to plate size
in food portions and meal composition among college students. Appetite, 59(3), 639-645.
14
Sharp, D.E., Sobal, J., & Wansink, B. (2014). Using plate mapping to examine portion size and plate composition for large and small divided plates. Eat Behav, 15(4) 658-663.
Sobal, J., & Bisogni, C. A. (2009). Constructing food choice decisions. Annals Behavioral Medicine, 38 Suppl 1, S37-46.
Sobal, J., & Wansink, B. (2007). Kitchenscapes, Tablescapes, Platescapes, and
Foodscapes. Environment and Behavior, 39(1), 124-142. Steyn, N.P., Senekal, M., Norris, S.A., Whati, L., Mackeown J.M., & Nel, J.H. (2006).
How well do adolescents determine portion sizes of foods and beverages? Asia Pacific Journal of Clinical Nutrition, 15, 35–42.
Van Ittersum, K.V. & Wansink, B. (2012). Plate size and color suggestibility: The
Delboef Illusion’s bias on serving and eating behavior. J Consumer Research, 39, 215-228.
van Kleef, E., Shimizu, M., & Wansink, B. (2011). Serving Bowl Selection Biases the Amount of Food Served. J Nutr Educ Behav. 44(1), 66-70.
U.S. Department of Agriculture and the U.S. Department of Health and Human
Services. Dietary Guidelines for Americans (2010). 7th Edition, Washington, D.C: U.S. Government Printing Office, December 2010.
Wadhera, D., & Capaldi-Phillips, E. D. (2014). A review of visual cues associated with
food on food acceptance and consumption. Eat Behav, 15(1), 132-143.
Wansink, B. & Cheney, M.M., (2005). Super Bowls: Serving Bowl Size and Food Consumption. JAMA, 293 (14). 1723-1728.
Wansink, B., Painter, J. E., & North, J. (2005). Bottomless bowls: why visual cues of
portion size may influence intake. Obesity, 13(1), 93-100. Wansink, B., Payne, C., & Werle, C. (2008). Consequences of belonging to the “clean
plate club”. Arch pediatr Adolesc Med, 162(10): 994-995. Wansink, B. & van Ittersum, K. (2005) Shape of glass and amount of alcohol poured:
comparative study of effect of practice and concentration. BMJ. 331(7531):1512-1514.
Wansink, B., & van Ittersum, K. (2007). Portion size me: downsizing our consumption norms. Journal of American Dietetic Association, 107(7), 1103-1106.
Wansink, B., van Ittersum, K., & Painter, J., (2006). Ice Cream Illusions: Bowls, Spoons,
and Self-Served Portion Sizes. American Journal of Preventative Medicine, 31(3), 240-243.
15
World Health Organization Technical Report Series (2000) Obesity: preventing and managing the global epidemic. Report of a WHO consultation. 894:1-253.
Yip, W., Wiessing, K.R., Budgett, S., & Poppitt, S.D. (2013). Using a smaller dining plate
does not suppress food intake from a buffet lunch meal in overweight, unrestrained women. Appetite, 69, 102-107.
Young, L.R. & Nestle, M. (2003). Expanding portion sizes in the US marketplace:
implications for nutrition counseling. J Am Diet Assoc, 103, 231-234.
Yuhas, J. A., Bolland, J. E., & Bolland, T. W. (1989). The impact of training, food type, gender, and container size on the estimation of food portion sizes. Journal of the American Dietetic Association, 89(10), 1473-1477.
16
CHAPTER 2: USING PLATE MAPPING TO EXAMINE SENSITIVITY TO PLATE SIZE IN FOOD PORTIONS AND MEAL COMPOSITION AMONG COLLEGE STUDENTS*
*Sharp, D. & Sobal, J. (2012) Using plate mapping to examine sensitivity to plate size in food portions and meal composition among college students. Appetite. 59(3):639-645.
Introduction
Nutritionists promote and educate the public about calorie counts, serving sizes
and food guidelines such as the MyPlate dietary tool (Post, Haven, & Maniscalco,
2012). Despite efforts to engage people in maintaining healthy diets, however, the
prevalence of obesity has continued to rise (Ogden, Carroll, Kit, & Flegal, 2012) and a
majority of Americans are not meeting federal dietary recommendations (Krebs-Smith,
Guenther, Subar, Kirkpatrick, & Dodd, 2010). In addition, methods for assessing food
intake, such as the 24-hour food recall and food frequency questionnaires, remain the
usual technique for obtaining eating data in spite of their known limitations and time
demands on participants (IOM, 2005). These disparities suggest an incongruity between
data collection and recommendations about eating practices. Nutrition education
focuses on food groups and nutrients, but eating practices primarily occur as individually
constructed meals.
A ‘proper’ meal in Western cultures traditionally consists of one core food and
two secondary foods, usually defined in Britain and America as a protein dish, a starch
dish, and a vegetable dish (Douglas, 1972). This meal structure is embedded in our
culture yet many nutrition assessment methods focus on individual food items or food
groups. Nutrition interventions promote adding healthy foods that may be new or
unusual for the participant without acknowledging the meal context in which each of
17
these individual foods are embedded. Our study develops a method for eliciting an
individual’s personal conceptualization of a meal while being sensitive to influences
from internal scripts and external environmental cues.
Previous studies have found that government recommended serving sizes often
do not match estimated or actual portions consumed (Bolland, Ward, & Bolland, 1990;
Bolland, Yuhas, & Bolland, 1988; Harnack, Steffen, Arnett, Gao, & Luepker, 2004) and
that students made substantial errors in reporting food consumption (Rumpler, Kramer,
Rhodes, Moshfegh, & Paul, 2008). Two thirds of the portions consumed in a study of
college aged adults were substantially bigger than the recommended portion sizes
(Burger, Kern, & Coleman, 2007). A self-served portions experiment revealed that only
45% of portions at breakfast and 32% of portions at lunch or dinner were either 25%
bigger or 25% smaller that the recommended portion size, with a majority of those
portions being bigger (Schwartz & Byrd-Bredbenner, 2006). People who serve
themselves bigger portions or who are served bigger portions tend to consume more
(Diliberti, Bordi, Conklin, Roe, & Rolls, 2004; Levitsky & Youn, 2004; Raynor & Wing,
2007; Rolls, Morris, & Roe, 2002; Rolls, Roe, Kral, Meengs, & Wall, 2004) and food
choice is important when determining the preferences (Zampollo, Kniffin, Wansink, &
Shimizu, 2012) and number of foods available at a meal (Levitsky, Iyer, & Pacanowski,
2012).
Current research about portion sizes and meal satiation generally relies upon
external cues such as real foods, plastic food models, or images of foods to guide the
subject into thinking about specific foods or specific portions (Herman & Polivy, 2005;
Levitsky, Obarzanek, Mrdjenovic, & Strupp, 2005). These external food cues can
18
anchor an individual's perceptions of portion size and limit their food choice responses
to those based on available types and amounts of foods, instead of involving the
person's cultural ideals, personal preferences, or individual experiences (Sobal &
Bisogni, 2009; Wansink, Painter, & North, 2005). Size misestimating was evidenced in
an experiment where participants who were influenced to be thirsty and primed with the
knowledge that drinking a glass of water would achieve the goal of being satiated
perceived the glass to be larger in size and thus contain more water than unprimed
controls (Veltkamp, Aarts, & Custers, 2008). This link between goal motivation and size
misestimating has been well established and is not unique to food and eating (Brendl,
Markman, & Messner, 2003; Bruner & Goodman, 1947; Bruner & Postman, 1948).
Our study asked individuals to draw the types and sizes of foods of a meal in the
absence of as many food cues as possible. We then observed whether portion size,
meal composition, and overall meal size vary with the size of plate provided. We used a
method we call Plate Mapping to study plate sensitivity and meal composition and
examined gender differences.
Plate Mapping:
Plate mapping is a new method of eliciting what foods a person may eat for a
meal by having them draw on a plate. This activity provides a projection of how the
individual conceptualizes and represents a meal. Understanding the conceptualization
of a meal requires knowledge of the cultural scripts for meals and environmental factors
influencing meals. Time of day, plate and utensil size and type, eating partners, and
foods available influence what we eat, how much we eat, and what priority we place on
particular foods or food groups. This experiment manipulated the size of the plate to
19
observe how it affects people’s scripting of a dinner meal into large main food portions
that are predominant on the plate and smaller side food portions that complement the
main portion.
A review of current literature shows some justification for using food drawings,
which rely on the horizontal plane to estimate size, as a reasonable proxy for actual
food or food models. While not drawn by the adolescents being examined, Steyn,
Senekal, Norris, Whati, Nackeown, and Nel (2006) found that two-dimensional plate
drawings could provide a better estimate of actual energy, fat, and carbohydrates than
three-dimensional ones did. These drawings may have been accurate on account of
individuals’ perceptions of the size of an object anchoring on a single linear dimension,
even if more than one dimension is available (Krider, Raghubir, and Krishna 2001) and
mathematical modeling shows that horizontal plane calculations are fairly accurate
estimators of food area for moderately sized portions (Pratt, Croager, and Rosenburg
2011). Drawing on plates has also been used as a learning tool in conjunction with
pictures, displays, and education as a means of enhancing the connection between
nutrition education promoting healthy eating in persons with diabetes (Camelon et al.
1998) as well as to reinforce the perceptual bias known as the Delboeuf Illusion (Van
Ittersum and Wansink 2011).
Plate Sensitivity:
Plate sensitivity is the concept that people select and serve themselves foods for
a meal based on the eating cues provided by their plate such as size, shape, depth, and
color. This concept addresses the research question "To what extent do participants
draw food in proportion to their internal conception of an appropriately sized meal or in
20
proportion to the size or form of plate?" We examine if individuals are sensitive to the
size of the plate provided, specifically whether they draw a meal that corresponds to
how food fits on the plate rather than the amount they want to eat or feel they should
eat. Our first hypothesis, the plate sensitivity hypothesis, is that larger plates will
influence participants to portray their meals as being bigger and smaller plates will
influence participants to portray their meals as smaller. This hypothesis will be
supported if the amount of food drawn is influenced by the amount of food the plate size
can hold.
We are also interested in determining if there is a sensitivity to how much a plate
needs to be filled in order for a participant to consider the drawings on their plates to be
an appropriate depiction of their dinner. When drawing a meal, participants may be
sensitive to the “food appropriateness” of their dinner and will consider plates that look
too empty to appear insufficient and plates too full to appear excessive. Our second
hypothesis is that people have established internalized standards for the size of a meal
and that the percentage of a plate covered will be independent of the size of the plate
provided. If this hypothesis is supported, the mean amount of food drawn should be
independent of plate size and represent a participant’s idealized meal size rather than a
meal that attempts to look appropriate on the provided plate.
Plate Composition:
Plate composition deals with judgments about main courses and side courses in
meals. Main courses dominate the meal while being complemented or accented by
secondary or supporting foods both in flavor and appearance. Based on this idea, we
propose two hypotheses. The meal composition hypothesis proposes that main portions
21
and side portions are considered differently when constructing a meal and that larger
plates will cue people to draw proportionally bigger main dishes than side dishes. The
food type composition hypothesis proposes that different food groups will be
disproportionally influenced by plate size, with fixed-size foods such as meats being
influenced less than malleable foods such as vegetables and grains.
Gender:
Gender is an important influence upon many aspects of food choices and eating
(O'Doherty Jensen & Holm, 1999), and may be important as a moderating factor in plate
sensitivity and meal composition. Men may be less mindful about food portions, less
concerned about overeating, and more likely to be plate sensitive while women may be
more mindful and experienced with portion sizes and less plate sensitive. Similarly,
men are more likely to prefer protein foods and women more likely to prefer fruits and
vegetables (Rolls, Fedoroff, & Guthrie, 1991; Wardle et al., 2004), which would lead to
gender differences in how men and women construct the composition of foods on their
plates into the arrangement of a platescape (Sobal & Wansink, 2007).
Methods
The study was approved by the University Institutional Review Board. A paper
plate and a questionnaire were administered in a quasi-experimental design in two
separate courses taken in the same department of a large Northeast U.S. university in
the Spring of 2011. Both classes convened at 1:00 pm. The data for the 11" plates was
collected on a Tuesday and the 9" plate data was collected on a Wednesday. The
questionnaire provided brief instructions and informed consent plus asked basic
22
demographic questions about the student’s gender and age. The instructions for
completing the plate drawing activity asked students to “please accurately draw and
label the foods in a meal that you would enjoy eating for dinner tonight. Please be as
realistic as possible with your drawings of the foods” (Appendix A). No images of food or
examples of drawing styles were provided for the students nor were there food related
pictures or themes present in either of the two classrooms. This intentional restriction of
food and drawing related cues was done to reduce biasing the participants’ food
choices or risk introducing a cognitive bias (Tversky and Kahneman, 1974) to meal or
portion sizes with any that may have been shown during a demonstration.
Each of the two classes received one size of plates of identical material, design,
and color, but one plate was 9” in diameter and the other plate was 11” in diameter.
Plates of only one size were used in each class to avoid potential biases if students
noticed that plate sizes differed within the class. An announcement was made by the
professors teaching the courses at the beginning of class that researchers would be
describing the research and distributing the questionnaires in the final five minutes of
class and encouraged the students to participate. Students were given class time to fill
out the questionnaires and allowed to stay after class as needed. Completion of the task
was not compensated with course credit or any other means. Completed
plates/questionnaires were collected as students exited the room.
While the researchers were not able to count the total number of students
attending class that day, only three plates distributed between the two classes were
returned unused or placed in one of the trash receptacles. The estimated minimum
response rate was 43% (334 respondents out of 763 registered students) although
23
since not all registered students attend each class, the response rate of attending
students was higher based on researcher observation and collection of unused plates.
Of the 334 returned questionnaires, a total of 270 were analyzed after excluding 56
respondents who did not accurately follow instructions, 3 who were minors under the
age of 18, and 5 who did not provide an age.
Completed plates were coded to construct indicators for the concepts in the
hypotheses. Drawn foods were coded into food groups (cereal, dessert, fruit, legume,
meat, vegetable, and other). Drawn foods that included multiple food groups were
placed into the food group that provided the most calories (a hamburger was coded in
the food group meat) or into the food group that took up the most space when calories
were uncertain (a salad with lettuce, tomatoes, feta cheese, and shrimp was coded in
the food group vegetable). Foods were rated by size to avoid presumptions about which
foods were main courses or side dishes and were then sorted into largest to smallest
portions for each individual based on their circumference. For each drawn food, the
horizontal dimensions of circumference and area were used as an indicator of the size
of drawn foods based on mathematical modeling showing that horizontal area is an
acceptable estimate of overall food volume (Pratt, Croager, & Rosenberg, 2011).
Dependent outcome variables for this analysis were plate coverage (percent of plate
covered), food size coverage (circumference and area), food item size (largest to
smallest for the five largest foods), and food item type (food groups). The independent
predictor variable for this analysis was plate size.
Results
24
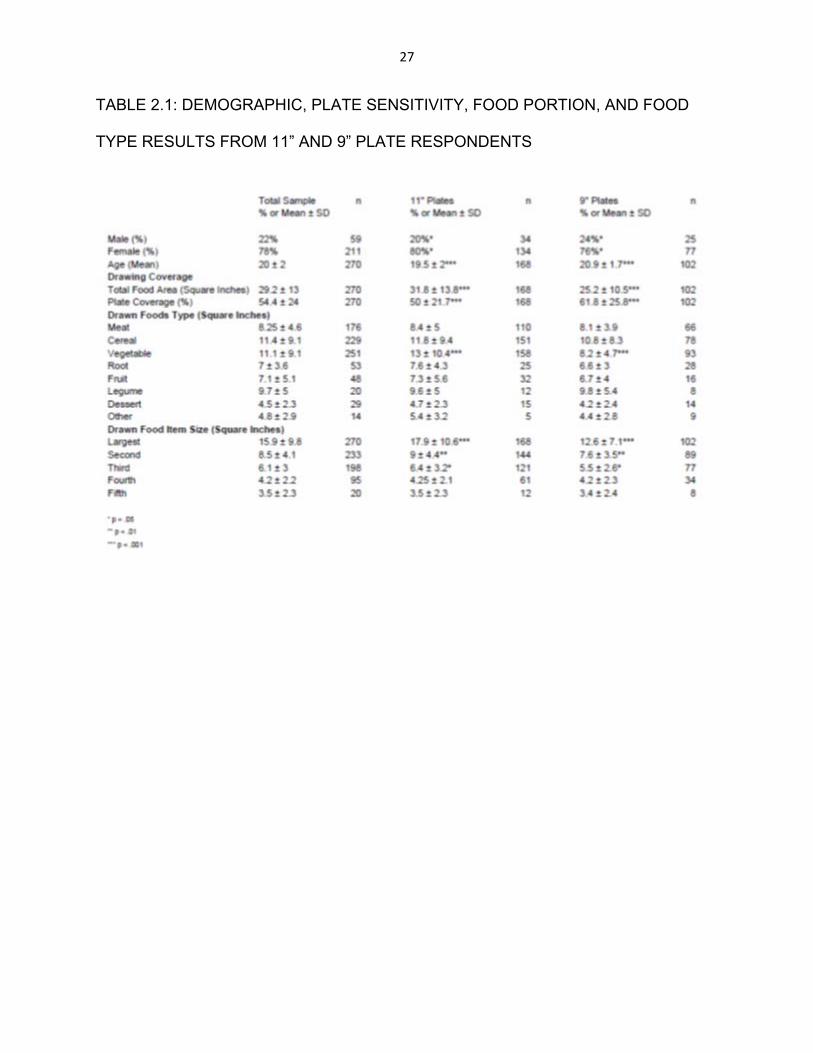
The 270 plates analyzed here included 38% (n=102) from the class drawing on
9" plates and 62% (n=168) from the class drawing on 11" plates. The classes differed in
gender and age. The 9" class was 68% (n=77) female and the 11" class was 75%
(n=134) female (p < .05). The mean age in the 9" class was 21 ± 2 years while the
mean age in the 11" class was 19.5 ± 2 years (p < .01). Table 2.1 presents the
composite data of our results. Food groups that were underrepresented in our study
(fruits, legumes, roots, desserts, and other) and food courses that showed no
statistically significant variation (4th and 5th largest foods) were reported in Table 2.1
but not further discussed.
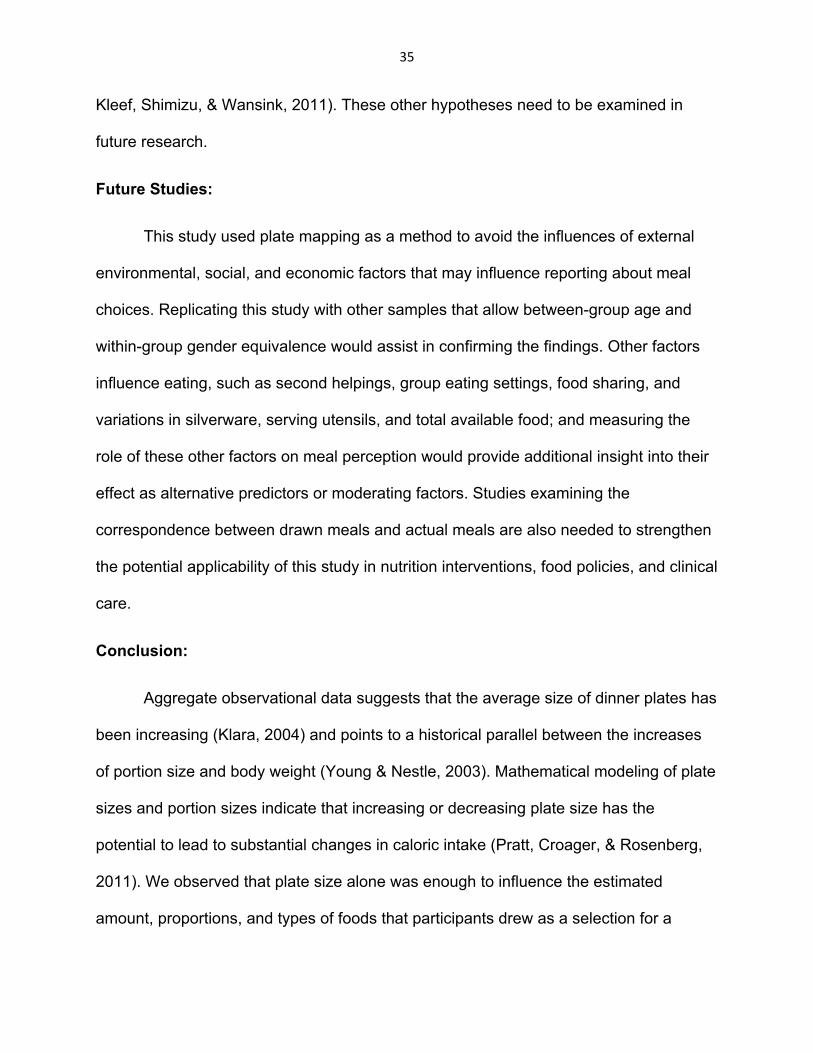
Our first plate sensitivity hypothesis was that larger plates would invoke larger
food drawings. Table 2.1 shows that the mean total food area on the 11” plate was 26%
bigger than the mean total food area on the 9” plate (p< .001). This increase meant that
larger plates had about 6.6 in2 more of food, which approximates the cross-sectional
area of a deck of playing cards. There was no significant gender moderation of the main
plate sensitivity effect.
Our second hypothesis was that participants would draw their meals without
regard to the size of the provided plate. This hypothesis was not supported by the
results. When comparing the overall percentage of plate space covered, we found a
difference between the amount of food drawn and the amount of plate covered (Table
2.1). Our sample had a mean coverage of 62% for the 9” plates while the 11” plates
only covered 50% (p< .01). The large plates, while having significantly more food drawn
on them, appeared 12% less filled than the smaller plates. There was no significant
gender moderation of plate coverage.
25
Our third hypothesis was that main portions and side portions are considered
differently when constructing a meal and that larger plates will cue people to draw
proportionally bigger main dishes than side dishes. This hypothesis was supported as
the size of the biggest drawn food item averaged 42% bigger for the 11" plate than the
9" plate (p < .001) even though the foods covered a similar overall percentage, around
30%, of their respective plates (Table 2.1). The second biggest foods were 18% bigger
in 11" plates (p < .01) while third foods were 16% bigger in 11" plates (p < .05). There
were no significant interactions of gender with course and plate size, indicating that
main and side dish meal composition were not modified or moderated by gender.
Our fourth hypothesis stated that not all food types are equally influenced by
plate size and that some food types would be affected differently by a larger plate size.
Meat and cereal portions did not differ significantly by plate size, but vegetable portions
were 62% bigger on 11" plates (p < .001).
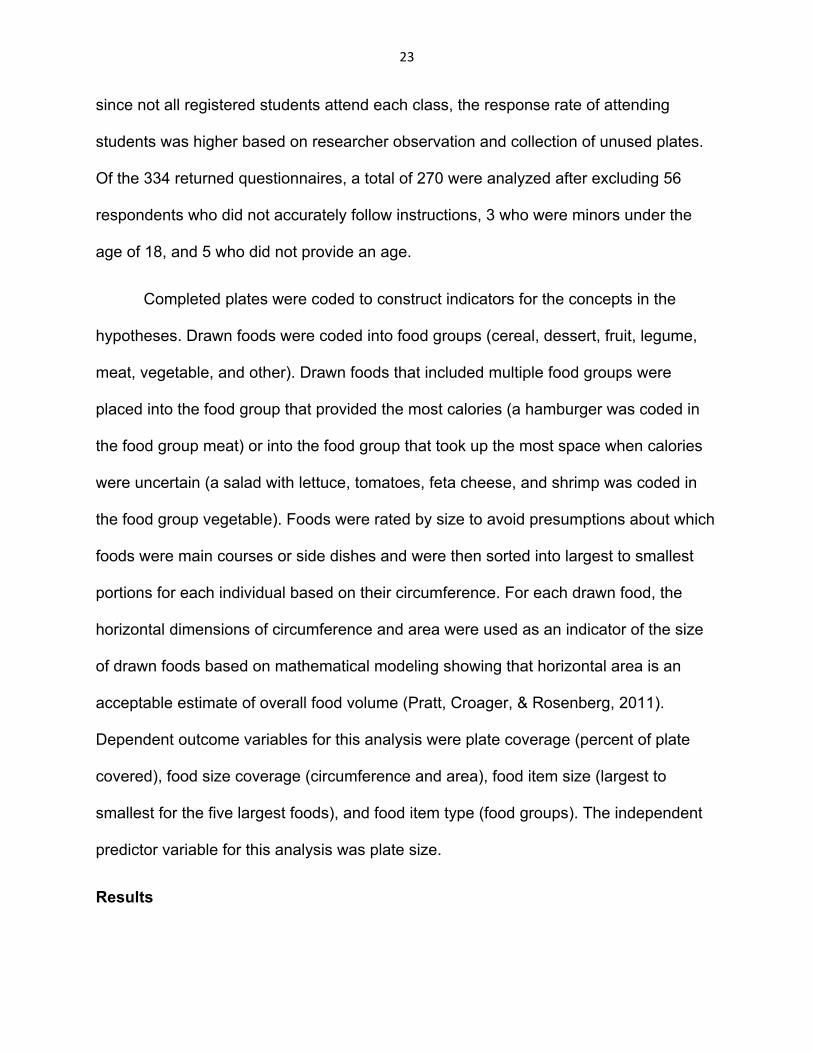
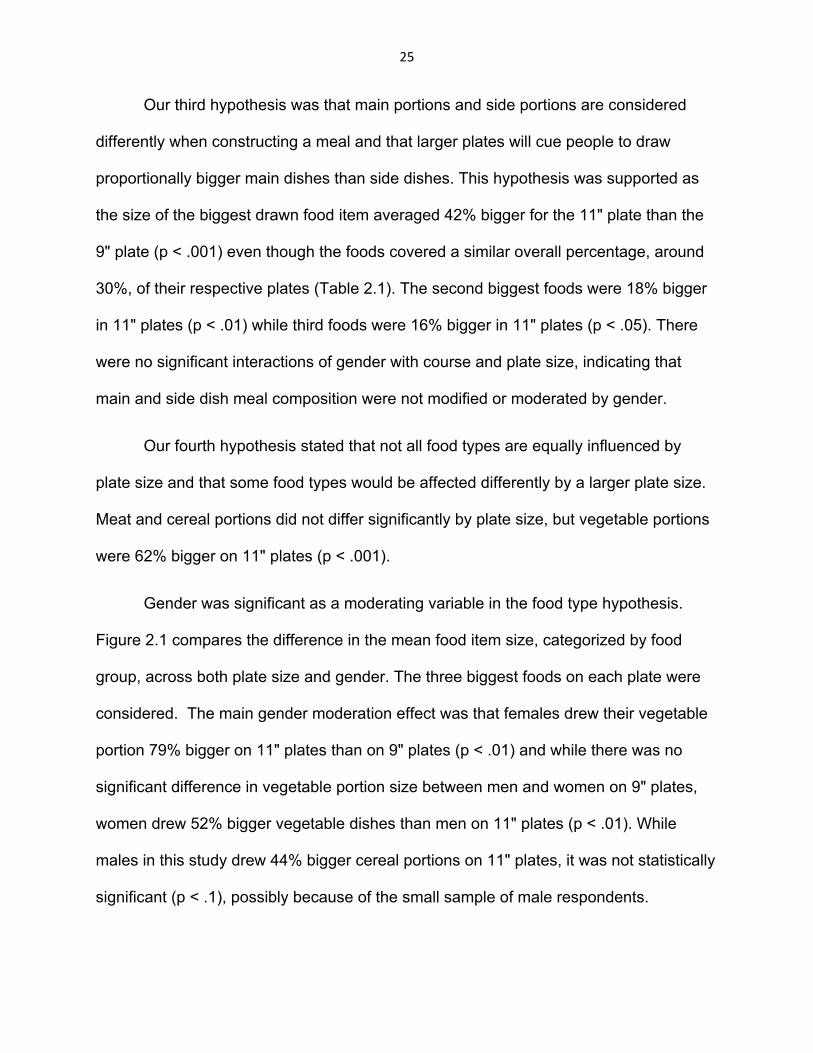
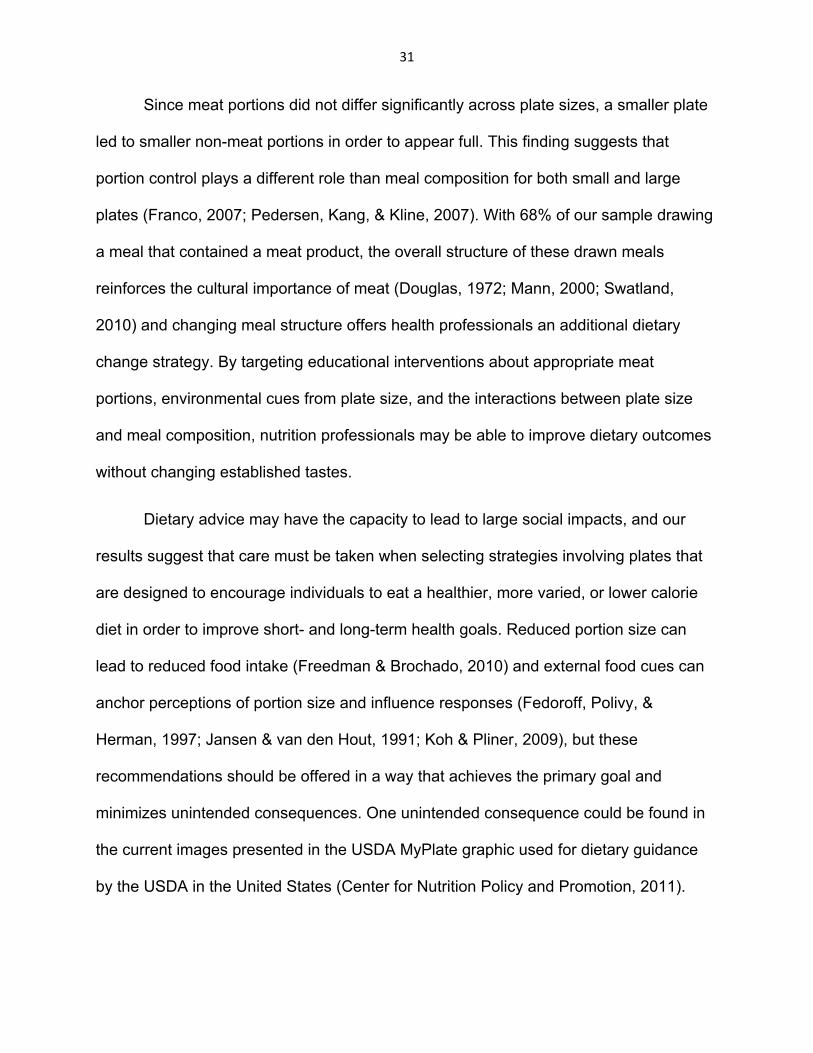
Gender was significant as a moderating variable in the food type hypothesis.
Figure 2.1 compares the difference in the mean food item size, categorized by food
group, across both plate size and gender. The three biggest foods on each plate were
considered. The main gender moderation effect was that females drew their vegetable
portion 79% bigger on 11" plates than on 9" plates (p < .01) and while there was no
significant difference in vegetable portion size between men and women on 9" plates,
women drew 52% bigger vegetable dishes than men on 11" plates (p < .01). While
males in this study drew 44% bigger cereal portions on 11" plates, it was not statistically
significant (p < .1), possibly because of the small sample of male respondents.
26
FIGURE 2.1: MEAN SIZE OF FOOD ITEM BY PLATE SIZE AND GENDER
27
TABLE 2.1: DEMOGRAPHIC, PLATE SENSITIVITY, FOOD PORTION, AND FOOD
TYPE RESULTS FROM 11” AND 9” PLATE RESPONDENTS
28
Discussion
Overall, data from this study showed that plate size can shape
conceptualizations of appropriate meal and portion sizes that exist before foods are
actually selected for dinner. We also found that the influence of plate size can be
assessed with the new technique of plate mapping in the absence of normative external
cues about foods. Participants with larger plates drew significantly bigger meals than
their small plate counterparts. Also, gender appeared to play a role in influencing meal
composition.
Our first hypothesis, that participants would be sensitive to the size of the plate
and draw bigger amounts of food on larger plates to reflect the available space, was
supported by data about the average plate coverage. We found that the difference in
overall mean food coverage between 9" and 11" plates was 6.6 in2. A piece of lean beef
this size would provide about 275 additional kilocalories while similarly sized cooked
mixed vegetables would supply about 35 additional kilocalories. This overall plate
coverage pattern may be useful for managing food consumption. The Delboeuf illusion
may explain these plate coverage findings. Delboeuf showed that an item surrounded
by similar items larger than it will appear much smaller than an item surrounded by
similar items that are smaller than it (Jaeger & Lorden, 1980). For example, a big steak
that appears to be an imposing food item on a small plate will appear more manageable
on a large plate. This illusion of food appearing smaller on a large plate provides an
explanation to justify why larger plates entice consumers to mindlessly eat more food
while not feeling more full than if they had eaten an identical meal on a smaller plate
29
(Wansink, et al., 2005). The plate and foods together create a visual platescape (Sobal
& Wansink, 2007) that can influence consumption.
The second hypothesis was that individuals would not be influenced by a larger
plate and would be able to draw a meal of similar size as participants with smaller plates
rather than simply "filling the plate". The results of our study do not support this
hypothesis as the average meal size was significantly different for each plate size.
Our third hypothesis stated that the overall area of the biggest food on the plate
would be influenced differently than the rest of the foods on the plate. This hypothesis
was supported as the total area of the biggest food was about 6.6 in2 larger on 11"
plates than 9” plates, while second and third foods were respectively only 1.2 and .8 in2
bigger. There were no significant plate size differences in size of fourth or smaller foods.
The majority of difference in food sizes between the 11” and 9” plates occurred on what
was already the biggest food item. This difference was about 70% of the change in total
food area.
While drawings on smaller plates suggest that individuals drew smaller overall
meals, overall size of a meal should not be confused with the composition of a meal.
What is interesting is how these foods appeared as a meal when seen in the context of
their plate. Relative to their respective plate, the biggest foods on both 11” and 9” plates
covered about the same percentage and appeared to be the same size despite being
calorically different from each other. When comparing the second and third biggest
foods, these foods covered a smaller percentage of the 11” plate compared to the 9”
plate; however, they covered a greater area. This difference suggests that the second
and third foods on 11” plates would provide a greater total amount of calories while still
30
appearing to be a moderate or light serving size in the context of its full platescape. The
importance of the biggest item on the plate may provide an avenue for interventions as
choice of the biggest food may drive the overall meal composition and caloric intake of a
meal.
The fourth hypothesis posited that some food groups would be disproportionally
bigger for larger plates. While meat and cereal dishes were similar in size across plate
sizes, vegetables showed considerable variation between plate sizes and gender
moderated this relationship with female participants drawing significantly bigger
amounts of vegetables when provided additional plate size area. In the present study
we found that women portrayed their meals to include significantly more vegetables
when the plate size allowed it while meat and cereal portions remained fairly constant.
Given the healthfulness of vegetable consumption, simply decreasing plate sizes
in order to limit caloric intake or prevent obesity is not entirely supported by our findings.
This examination of food group size creates a conundrum in plate size
recommendations because decreasing plate size for women appears to
disproportionately diminish vegetable consumption more than any other food group.
These findings suggest the importance of analyzing not just the size of the whole
meal but also its composition. Recommending a reduction in plate size to assist in
weight loss (Story, Neumark-Sztainer, & French, 2002; Wansink & van Ittersum, 2007)
may reduce overall food consumption but may also decrease the overall healthfulness
and diversity of meals for some individuals by disproportionally reducing vegetable
consumption with respect to the other food groups.
31
Since meat portions did not differ significantly across plate sizes, a smaller plate
led to smaller non-meat portions in order to appear full. This finding suggests that
portion control plays a different role than meal composition for both small and large
plates (Franco, 2007; Pedersen, Kang, & Kline, 2007). With 68% of our sample drawing
a meal that contained a meat product, the overall structure of these drawn meals
reinforces the cultural importance of meat (Douglas, 1972; Mann, 2000; Swatland,
2010) and changing meal structure offers health professionals an additional dietary
change strategy. By targeting educational interventions about appropriate meat
portions, environmental cues from plate size, and the interactions between plate size
and meal composition, nutrition professionals may be able to improve dietary outcomes
without changing established tastes.
Dietary advice may have the capacity to lead to large social impacts, and our
results suggest that care must be taken when selecting strategies involving plates that
are designed to encourage individuals to eat a healthier, more varied, or lower calorie
diet in order to improve short- and long-term health goals. Reduced portion size can
lead to reduced food intake (Freedman & Brochado, 2010) and external food cues can
anchor perceptions of portion size and influence responses (Fedoroff, Polivy, &
Herman, 1997; Jansen & van den Hout, 1991; Koh & Pliner, 2009), but these
recommendations should be offered in a way that achieves the primary goal and
minimizes unintended consequences. One unintended consequence could be found in
the current images presented in the USDA MyPlate graphic used for dietary guidance
by the USDA in the United States (Center for Nutrition Policy and Promotion, 2011).
32
The principle goal of the MyPlate image is to be a mealtime symbol to remind
Americans to eat healthfully. Intended to represent the recommendations from the
Dietary Guidelines for Americans (2010) rather than provide recommendations for a
specific meal, the MyPlate image is a simple and useful visual graphic for encouraging a
balanced diet. One issue that has largely been overlooked, however, is that with respect
to the intended use of the graphic, the MyPlate name suggests a single meal rather
than a pattern of daily intake and the image represents a plate that is almost completely
full. Because of this, we used the same method of analysis for measuring our participant
generated data to analyze what a MyPlate plate of food would actually look like.
In order to estimate the size of the MyPlate plate image, we measured 20 forks
and found the average fork to be about 7.25” long. When scaling the MyPlate image
based on a 7.25” fork, the MyPlate plate appears to represent a plate that is 10” in
diameter and that food covers about 70% of the surface. The area of the MyPlate plate,
assuming no plate lip, is 78.5 in2. Based on these numbers, the MyPlate image appears
to have protein covering 11.5 in2 (15% of the plate), vegetables covering 16 in2 (20%),
grains covering 14.7 in2 (19%), and fruit covering 12.6 in2 (16%). The area of food
represented on the plate totals about 55 in2, which is 72% more food than the average
food area drawn by students in this study on 11” plates and more than twice the area of
food drawn on 9” plates. In our study, college students drew their dinners with the plates
on average 55% to 63% covered and were influenced by the size of their plate.
In the MyPlate image, the USDA may have provided a powerful external cue for
people to not just eat healthful combinations and relative portions of food groups, but
also to serve themselves more than they previously may have been in order to achieve
33
the sizes of food groups portrayed in MyPlate. Is it a benefit to achieve a healthier
balance of food groups if it includes higher caloric consumption? If the nutritional
guidelines promote an image of a highly loaded plate, there should be a concern that
attempts of individuals to make a meal look "like the guidelines" may result in adding
underrepresented food groups to a plate to match the overall plate graphic rather than
removing some overrepresented food groups to match suggested serving sizes and
food group proportions.
Applications:
For nutrition interventions, the plate mapping technique can be used to ascertain
which portions of a meal are most important to an individual. Asking a participant to
draw what they would like to eat for dinner may offer keen insight into their views about
the various food groups. Plate mapping warrants future development and evaluation as
a new nutritional assessment method.
Plate mapping procedures can be incorporated into food recall, dietary
management, and food intervention studies and may provide a rapid, inexpensive
method for collecting additional data. Plate mapping may also enhance the connection
between dietary theory and practice for participants by offering them personalized visual
representations of meal routines (Camelon et al., 1998).
The composition of a meal, as the MyPlate dietary guidance suggests, may be a
useful avenue for nutrition researchers to pursue rather than only influencing an
individual to select specific portions of foods or a smaller plate to eat from. Reducing
large plates may not be an appropriate intervention for weight loss if the biggest food
34
item drawn is a salad, vegetable, or fruit, but could be appropriate if that item is a
cereal, starch, or a high-fat meat product. Alternatively for underweight individuals
seeking to gain weight, increasing the size of a plate may not substantially increase
caloric intake on its own.
Limitations:
There are several limitations in this study. Our first limitation is that Plate
Mapping is a new method of measuring meal and portion size and the results should be
interpreted in that context. The quasi-experimental design did not use random
assignment or include a baseline assessment, which reduces the overall strength of
these findings (Shadish, Cook, & Campbell, 2001). The college student sample may
limit the generalizability of these findings to other populations. The low number of male
participants in the sampled classes limits statistical power for gender comparisons. A
measurement limitation is the extent that a drawn meal validly represents an actual
meal. While an actual meal can be observed to see if participants finish all of the food
that they serve themselves or if they take second portions, a drawn plate relies both on
participants being accurate in their drawn portions and that the drawing accurately
reflects a meal that will be completely consumed.
There are also some potential alternative explanations that challenge the
importance of plate size for caloric intake. Steenhuis and Vermeer (2009) claim that the
effects of plate size may only occur when the participant does not consider the food as
a meal but is instead a snack like ice cream or popcorn. Others suggest that energy
intake is only statistically significantly associated with container size when people self-
serve from a bowl rather than a plate (Rolls, Roe, Halverson, & Meengs, 2007; van
35
Kleef, Shimizu, & Wansink, 2011). These other hypotheses need to be examined in
future research.
Future Studies:
This study used plate mapping as a method to avoid the influences of external
environmental, social, and economic factors that may influence reporting about meal
choices. Replicating this study with other samples that allow between-group age and
within-group gender equivalence would assist in confirming the findings. Other factors
influence eating, such as second helpings, group eating settings, food sharing, and
variations in silverware, serving utensils, and total available food; and measuring the
role of these other factors on meal perception would provide additional insight into their
effect as alternative predictors or moderating factors. Studies examining the
correspondence between drawn meals and actual meals are also needed to strengthen
the potential applicability of this study in nutrition interventions, food policies, and clinical
care.
Conclusion:
Aggregate observational data suggests that the average size of dinner plates has
been increasing (Klara, 2004) and points to a historical parallel between the increases
of portion size and body weight (Young & Nestle, 2003). Mathematical modeling of plate
sizes and portion sizes indicate that increasing or decreasing plate size has the
potential to lead to substantial changes in caloric intake (Pratt, Croager, & Rosenberg,
2011). We observed that plate size alone was enough to influence the estimated
amount, proportions, and types of foods that participants drew as a selection for a
36
dinner. Eating behaviors and food choice may be structured activities, but easily
integrated environmental changes such as changing plate size could be a method for
better understanding meal preferences and encouraging more appropriate eating habits
(Camelon et al., 1998).
Many external and internal factors influence what individuals eat. This study
suggests that people can portray dinner size and composition by drawing a meal, that
plate maps differ between larger and smaller plates, and that plate maps may also differ
between genders. Drawings on larger plates appeared emptier while actually portraying
a greater area of food than drawings on smaller plates. This visual illusion may prompt
an individual to consume more food. The results of this study suggest that
conceptualizations of dinner can be influenced by plate size even if actual food is not
smelled, seen, or touched.
37
References
Bolland, J. E., Ward, J. Y., & Bolland, T. W. (1990). Improved accuracy of estimating food quantities up to 4 weeks after training. Journal of The American Dietetic Association, 90(10), 1402-1404, 1407.
Bolland, J. E., Yuhas, J. A., & Bolland, T. W. (1988). Estimation of food portion sizes:
effectiveness of training. Journal of the American Dietetic Association, 88(7), 817-821.
Brendl, C. M., Markman, A. B., & Messner, C. (2003). The Devaluation Effect: Activating
a need devalues unrelated objects. Journal of Consumer Research, 29(4), 463-473.
Bruner, J. S., & Goodman, C. C. (1947). Value and need as organizing factors in
perception. Journal of Abnormal Psychology, 42(1), 33-44. Bruner, J. S., & Postman, L. (1948). Symbolic value as an organizing factor in
perception. Journal of Social Psychology, 27(2), 203-208. Burger, K. S., Kern, M., & Coleman, K. J. (2007). Characteristics of self-selected portion
size in young adults. Journal of The American Dietetic Association, 107(4), 611-618.
Camelon, K. M., Hadell, K., Jamsen, P. T., Ketonen, K. J., Kohtamaki, H. M.,
Makimatilla, S., et al. (1998). The Plate Model: a visual method of teaching meal planning. DAIS Project Group. Diabetes Atherosclerosis Intervention Study. Journal of The American Dietetic Association, 98(10), 1155-1158.
Center for Nutrition Policy and Promotion. (2011). ChooseMyPlate.gov. Washington,
DC: U.S. Department of Agriculture (USDA). Diliberti, N., Bordi, P. L., Conklin, M. T., Roe, L. S., & Rolls, B. J. (2004). Increased
portion size leads to increased energy intake in a restaurant meal. Obesity, 12(3), 562-568.
Douglas, M. (1972). Deciphering a Meal. Daedalus, 101(1), 61-81. Fedoroff, I. C., Polivy, J., & Herman, C. P. (1997). The effect of pre-exposure to food
cues on the eating behavior of restrained and unrestrained eaters. Appetite, 28(1), 33-47.
Franco, L. J. (2007). A portion-control plate was effective for weight loss in obese
patients with type 2 diabetes mellitus. ACP Journal Club, 147(3), 68. Freedman, M. R., & Brochado, C. (2010). Reducing portion size reduces food intake
and plate waste. Obesity, 18(9), 1864-1866.
38
Harnack, L., Steffen, L., Arnett, D. K., Gao, S., & Luepker, R. V. (2004). Accuracy of
estimation of large food portions. Journal of The American Dietetic Association, 104(5), 804-806.
Herman, C. P., & Polivy, J. (2005). Normative influences on food intake. Physiology and
Behavior, 86(5), 762-772. IOM. (2005). Dietary reference intakes for energy, carbohydrate, fiber, fat, fatty acids,
cholesterol, protein, and amino acids. Washington, D.C.: National Academies Press.
Jaeger, T., & Lorden, R. (1980). Delboeuf illusions: contour or size detector
interactions? Perceptual and Motor Skills, 50(2), 376-378. Jansen, A., & van den Hout, M. (1991). On being led into temptation:
"counterregulation" of dieters after smelling a "preload". Addictive Behaviors, 16(5), 247-253.
Klara, R. (2004). Table the Issue. Restaurant Business, 103(18), 14-15. Koh, J., & Pliner, P. (2009). The effects of degree of acquaintance, plate size, and
sharing on food intake. Appetite, 52(3), 595-602. Krebs-Smith, S. M., Guenther, P. M., Subar, A. F., Kirkpatrick, S. I., & Dodd, K. W.
(2010). Americans do not meet federal dietary recommendations. Journal of Nutrition, 140(10), 1832-1838.
Krider, R., Raghubir, P., and Krishna, A. (2001) Pizza: Pi or Squared? Psychophysical
biases in area comparisons. Marketing Science 20(4): 405-425 Levitsky, D. A., Iyer, S., & Pacanowski, C. R. (2012). Number of foods available at a
meal determines the amount consumed. Eating Behaviors 13(3) 183-187. Levitsky, D. A., Obarzanek, E., Mrdjenovic, G., & Strupp, B. J. (2005). Imprecise control
of energy intake: absence of a reduction in food intake following overfeeding in young adults. Physiology and Behavior, 84(5), 669-675.
Levitsky, D. A., & Youn, T. (2004). The more food young adults are served, the more
they overeat. Journal of Nutrition, 134(10), 2546-2549. Mann, N. (2000). Dietary lean red meat and human evolution. European Journal of
Nutrition, 39(2), 71-79. O'Doherty Jensen, K., & Holm, L. (1999). Preferences, quantities and concerns: socio-
cultural perspectives on the gendered consumption of foods. European Journal of Clinical Nutrition, 53(5), 351-359.
39
Ogden, C. L., Carroll, M. D., Kit, B. K., & Flegal, K. M. (2012). Prevalence of obesity and
trends in body mass index among US children and adolescents, 1999-2010. JAMA, 307(5), 483-490.
Pedersen, S. D., Kang, J., & Kline, G. A. (2007). Portion control plate for weight loss in
obese patients with type 2 diabetes mellitus: a controlled clinical trial. Archives of Internal Medicine, 167(12), 1277-1283.
Post, R., Haven, J., & Maniscalco, S. (2012). Putting MyPlate to work for nutrition
educators. Journal of Nutrition Education and Behavior, 44(2), 98-99. Pratt, I. S., Croager, E. J., & Rosenberg, M. (2011). The mathematical relationship
between dishware size and portion size. Appetite, 58(1), 299-302. Raynor, H. A., & Wing, R. R. (2007). Package unit size and amount of food: do both
influence intake? Obesity, 15(9), 2311-2319. Rolls, B. J., Fedoroff, I. C., & Guthrie, J. F. (1991). Gender differences in eating
behavior and body weight regulation. Health Psychology, 10(2), 133-142. Rolls, B. J., Morris, E. L., & Roe, L. S. (2002). Portion size of food affects energy intake
in normal-weight and overweight men and women. American Journal of Clinical Nutrition, 76(6), 1207-1213.
Rolls, B. J., Roe, L. S., Halverson, K. H., & Meengs, J. S. (2007). Using a smaller plate
did not reduce energy intake at meals. Appetite, 49(3), 652-660. Rolls, B. J., Roe, L. S., Kral, T. V., Meengs, J. S., & Wall, D. E. (2004). Increasing the
portion size of a packaged snack increases energy intake in men and women. Appetite, 42(1), 63-69.
Rumpler, W. V., Kramer, M., Rhodes, D. G., Moshfegh, A. J., & Paul, D. R. (2008).
Identifying sources of reporting error using measured food intake. European Journal of Clinical Nutrition, 62(4), 544-552.
Schwartz, J., & Byrd-Bredbenner, C. (2006). Portion distortion: typical portion sizes
selected by young adults. Journal of The American Dietetic Association, 106(9), 1412-1418.
Shadish, W. R., Cook, T. D., & Campbell, D. T. (2001). Experimental and quasi-
experimental designs for generalized causal inference. Boston: Houghton Mifflin. Sobal, J., & Bisogni, C. A. (2009). Constructing food choice decisions. Annals of
Behavioral Medicine, 38 Suppl 1, S37-46.
40
Sobal, J., & Wansink, B. (2007). Kitchenscapes, Tablescapes, Platescapes, and Foodscapes: Influences of microscale built environments on food intake. Environment and Behavior, 39(1), 124-142.
Steenhuis, I. H., & Vermeer, W. M. (2009). Portion size: review and framework for
interventions. Internation Journal of Behavioral Nutrition and Physical Activity, 6, 58.
Steyn, N.P., Senekal, M., Norris, S.A., Whati, L., Mackeown J.M., & Nel, J.H. (2006).
How well do adolescents determine portion sizes of foods and beverages? Asia Pacific Journal of Clinical Nutrition, 15, 35–42.
Story, M., Neumark-Sztainer, D., & French, S. (2002). Individual and environmental
influences on adolescent eating behaviors. Journal of American Dietetic Association, 102(3 Suppl), S40-51.
Swatland, H. J. (2010). Meat products and consumption culture in the West. Meat
Science, 86(1), 80-85. Tversky, A. & Kahneman, D. (1974). Judgement under uncertainty: Heuristics and
biases. Science, 185, 1124-1130. U.S. Department of Agriculture and the U.S. Department of Health and Human
Services. Dietary Guidelines for Americans (2010). 7th Edition, Washington, D.C: U.S. Government Printing Office, December 2010.
Van Kleef, E., Shimizu, M., & Wansink, B. (2011). Serving bowl selection biases the
amount of food served. Journal Nutrition Educationand Behavior. Van Ittersum, K. & Wansink, B., (2012). Plate size and color suggestibility: The
Delboeuf Illusion's bias on serving and eating behavior. Journal of Consumer Research, 39(2), 215-228.
Veltkamp, M., Aarts, H., & Custers, R. (2008). Perception in the service of goal pursuit:
Motivation to attain goals enhances the perceived size of goal-instrumental objects. Social Cognition, 26(6), 720-736.
Wansink, B., Painter, J. E., & North, J. (2005). Bottomless bowls: why visual cues of
portion size may influence intake. Obesity, 13(1), 93-100. Wansink, B., & van Ittersum, K. (2007). Portion size me: downsizing our consumption
norms. Journal of The American Dietetic Association, 107(7), 1103-1106. Wardle, J., Haase, A. M., Steptoe, A., Nillapun, M., Jonwutiwes, K., & Bellisle, F. (2004).
Gender differences in food choice: the contribution of health beliefs and dieting. Annals Behavioral Medicine, 27(2), 107-116.
41
World Health Organization Technical Report Series (2000). Obesity: preventing and managing the global epidemic. Report of a WHO consultation. 894:1-253.
Young, L. R., & Nestle, M. (2003). Expanding portion sizes in the US marketplace:
implications for nutrition counseling. Journal of American Dietetic Association, 103(2), 231-234.
Zampollo, F., Kniffin, K. M., Wansink, B., & Shimizu, M. (2012). Food plating
preferences of children: the importance of presentation on desire for diversity. Acta Paediatrica, 101(1), 61-66.
42
CHAPTER 3: REPRESENTATIONS OF DINNER MEALS VARY BY THE SIZE OF THE PLATE: USING PLATE MAPPING TO EXAMINE SIZE AND MEAL COMPOSITION AMONG ADULT MEN AND WOMEN Introduction
People in Western societies usually consume foods grouped on tableware, often
plates. Plate size may influence how much and which types of food a person serves
themselves or is served, which may affect portion size and food type (Wansink, van
Ittersum, & Painter (2006). Changing plate size may be a potential public health strategy
to alter food intake. This study examined whether community dwelling adults portrayed
how much and what types of foods they planned to eat differently on bigger or smaller
plates.
Most studies of the effects of tableware on food selection manipulate plate, bowl,
glass, or serving utensil size as individuals serve themselves foods (Wansink & van
Ittersum, 2005; Raynor & Wing 2007; Wansink & van Ittersum 2010; Fisher, Birch,
Zhang, Grusak, & Hughes, 2013). An alternative research technique, labeled “plate-
mapping” (Sharp & Sobal, 2012), has individuals draw a meal on differently-sized
plates.
In an initial study using plate mapping (Sharp and Sobal, 2012), researchers
asked college students to draw a meal on either a 9” or 11” diameter paper plate. The
findings revealed that students exhibited plate sensitivity because they drew about 26%
more food on the larger plate than students given the smaller plate. The larger plates
had about 50% more available space to draw upon, which made the food drawings on
the larger plates appear smaller when observed within the context of the plate. Gender
of the students moderated the relationship between plate size and meal composition in
43
that initial study as indicated by the size of food types, with women drawing 36% bigger
vegetable portions than men on larger plates.
Previous studies of plate size and food intake report mixed results (Libotte et al
2014; Robinson et al., 2014; Wadhera & Capabaldi-Phillips, 2014). Some report no
difference in energy intake between those using larger and smaller plates (Rolls, Roe,
Halverson, & Meengs 2007). However, while Koh and Pliner (2009) did not find a main
effect of plate size on amount of food served and consumed, there was an interaction
between plate size and food sharing, where those who shared foods and used small
plates served and consumed less food than those not sharing and using small plates.
These prior studies of plate size and food intake were conducted primarily in laboratory
settings and may not reflect actual behavior in households.
The present study used plate mapping to examine plate sensitivity and meal
composition in the homes of a community-dwelling population whose behaviors may be
shaped by their family roles and other experiences. Using a plate mapping protocol in
an adult community sample is important for both proof of concept of plate size sensitivity
and generalizability of findings into households; because the college environment does
not necessarily represent practices that will be continued past graduation from
academic institutions (Cooper, McCord, & Socha, 2011). Adults' cooking skills, financial
constraints, time availability, and interactions with other family members are all part of
the external environment involved in food selection (Sobal & Bisogni, 2009). This more
complex environment for food selection may affect typical meal composition and serving
size of different types of food.
44
We propose four hypotheses about plate sizes and plate mapping. 1) The plate
sensitivity hypothesis posits that people are “mindless” about portion size and fill plates
to capacity, drawing bigger overall meal sizes on larger plates than smaller plates. 2)
The meal norms hypothesis posits that people draw meals to conform to normative
micro-level built environment conceptions (Sobal & Wansink, 2007) about how full a
plate should be; filling plates to levels that seem appropriate to the plate size, with the
same percentage of area covered by food on larger and smaller plates. 3) The meal
composition hypothesis posits that plate size influences servings of different kinds of
foods, with the type of food sub-hypothesis proposing that bigger vegetable dishes will
be drawn on larger plates and the food course sub-hypothesis proposing that bigger
main courses will be drawn on larger plates than smaller plates. 4) The gender
moderation hypothesis posits that there are gender differences in size and type of food
selection (Rolls, Federoff, & Guthrie, 1991; Wardle, Haase, Steptoe, Nillapun,
Jonwutiwes, & Bellisle, 2004; Emanuel, McCully, Gallagher, & Updegraff, 2012), with
men more sensitive to plate size than are women, and men drawing larger main
courses on plates than women draw on plates.
Materials and Methods
Data for this study was collected as a component of a larger study in the homes
of adult volunteers with children recruited by local U.S.D.A. Cooperative Extension
Service workers and internet and radio advertisements in one medium sized city in the
Northeastern U.S. As part of this larger study, participants were asked to do plate
mapping by drawing what they planned to eat for dinner that night on either a 9” or 11”
paper plate. Interviewers provided the plates and orally administered instructions for this
45
study. The instructions were to “Accurately draw and label the foods that you expect to
be eating for dinner tonight. Be as realistic as possible with the sizes of the foods that
you are drawing.” Investigators did not provide examples of how to complete this task,
nor were any food-related cues provided to assist participants in determining meal or
portion size. A random number generator was used to determine which differently sized
but otherwise identical paper plate, either 9” in diameter or 11” in diameter, was
provided to each participant. People in homes with multiple participants were each
given the same sized plates to avoid potential plate size recognition bias. Participants
were interviewed in separate rooms to avoid discussions between them about the study
protocol or dinner plans. Both partners in these couples were included as individual
units of analysis in the data based on analyses showing that stratification revealed no
significant differences between married/cohabiting and unmarried individuals with
respect to the major study outcomes. This study was approved by the Cornell University
Institutional Review Board.
Of the 309 participants recruited, 281 (91%) took part in the plate mapping task.
A total of 164 were cohabitating adults or married couples. Reasons for nonparticipation
included participants not completing a usable plate drawing (19), interviewer omission
errors (5), or the participants were initially enrolled over the telephone (4).
Participants self-labelled all of the foods they drew to provide accurate
information about type of food. Drawn foods were first coded by food type (meat, grain,
vegetable, root vegetable or tuber, fruit, legume, dessert, other) and then were
organized by size based on their overall drawn area (most to least plate area covered).
Foods were coded by area (Largest, second largest, etc.) rather than by course
46
(appetizer, main courses, side course, salad, dessert, etc.) for two reasons. First,
participants were not instructed to label their foods by course because this could have
influenced participants to draw a meal guided by Western cultural ideals about main
courses and side courses (Douglas, 1972) rather than their actual anticipated meal.
Second, investigators did not want to presume which foods constituted main courses or
side courses. The horizontal dimension of area was used as an indicator of overall size
of each drawn food and these sizes were then coded starting with the biggest food on
each plate. The appropriateness of using horizontal measurement of area as an
indication of overall food volume was based on mathematical modeling of food sizes
(Pratt, Croager, & Rosenberg, 2011) as well as prior research suggesting that
individuals focus on the serving diameter rather than the serving height of food (Krider,
Raghubir, and Krishna 2001). Four coders performed the initial coding, and then two of
the coders verified the initial coding for area, food type, and food size.
The independent variable was plate size. Dependent outcome variables were
overall plate coverage (as total area and as percent of plate covered by food), individual
food size coverage by area, food item size (largest course to smallest course for the five
biggest foods), and food item type. Gender was examined as a moderating variable.
Age was assessed as a demographic variable to characterize the sample.
Results
Among the 281 participants, 50% (n=139) drew on 11” plates and 50% (n=142)
on 9” plates. Table 3.1 summarizes all study variables. Most participants were female
and middle aged. Men and women comprised about the same percentage of the 11”
plate group and the 9” plate group. Most people (84%) drew three foods as comprising
47
a complete dinner. Root vegetables, fruits, legumes, desserts, and other were
infrequently drawn and showed little variation as were the sizes of fourth and fifth
biggest foods, so these were reported in Table 3.1 but were not analyzed further. No
participants in this study requested a second plate to supplement the drawn size of their
dinner.
Our first hypothesis (plate sensitivity) was that larger plates would influence
participants to draw bigger dinners than the drawings on smaller plates. This hypothesis
was supported, with individuals drawing about 8 in2 more area of food on 11” plates (p<
.001) (Table 3.1). Participants drew their meals to be an average of 25% bigger when
provided the larger of the two plates.
Our second hypothesis (meal norms) was that the participants would be
influenced by normative conceptions about the percentage of the plate that should be
covered by food. This hypothesis was not supported by the data for men and women
combined. Overall meal sizes were bigger with larger plates, but percent of plate
coverage was statistically different by plate size with 9” plates appearing on average
76% full and 11” plates appearing 60% full (Table 3.1). While more food was drawn on
larger plates, the larger plates did not produce greater size of meals to the extent that
both plates appeared to be equally filled with food.
Our third hypothesis (meal composition) was that meal courses and food types
would be differentially influenced by plate size. The hypothesis was supported.
Drawings of individual courses covered a larger percentage of space on the 9” plates
when compared to the 11” plates, with the largest food covering 6% more of the smaller
plate (p < .001), the second largest food covering 6% more (p < .005), and the third
48
largest food covering about 4% more (p < .001) (Table 3.1). While the smaller 9” plates
were drawn to appear more full, the 11” plate food drawings were still bigger with main
courses drawn to be on average 4.9 in2 or 34% bigger, the second course drawn to be 2
in2 or 21% bigger, and third courses drawn to be 1.4 in2 or 20% bigger. More than half
of the overall size differences between plates was due to a greater size of the biggest
food. When food types were compared between plate sizes (Table 3.1), three food
types were drawn significantly bigger when given a larger plate: meat courses were 4.2
in2 bigger (p < .001), grain courses were 2.6 in2 bigger (p < .01) and vegetable courses
were 2.7 in2 bigger (p < .001).
Our fourth hypothesis (gender moderation) was that gender would moderate the
influences of plate sensitivity and plate composition, with men responding to larger
plates by drawing bigger portions than women drew. The hypothesis was partially
supported. Men with larger plates drew meals that averaged about 11.9 in2 bigger
(p=.001) and while men’s smaller plates were about 6% more full, this was not
statistically significant (p < .13). Women with larger plates drew significantly bigger
overall meals, with a 4.2 in2 difference in meal size (p < .012) while the composition of
the smaller plates appeared to be 19% more “full” (p < .001) when the women’s drawn
meal was examined in the context of the size of the plate (Figure 3.1). Comparing
genders within the same plate size, men’s drawn dinners were 8.5in2 bigger than
dinners of women when given a large 11” plate (p < .001) but there was no significant
difference in size between genders for a small 9” plate (p < .39). For the plate
consistency hypothesis, men covered 13% more of their 11” plates with food than
women did (p <.001), but men did not cover more of the smaller 9” plates than women

49
did (p< .34). Analyses of food type by plate size and gender revealed significantly bigger
men’s drawings of meat size, vegetable size, and grain size than women’s drawings
with 11” plates, but no significant gender differences for 9” plates (Figure 3.2).
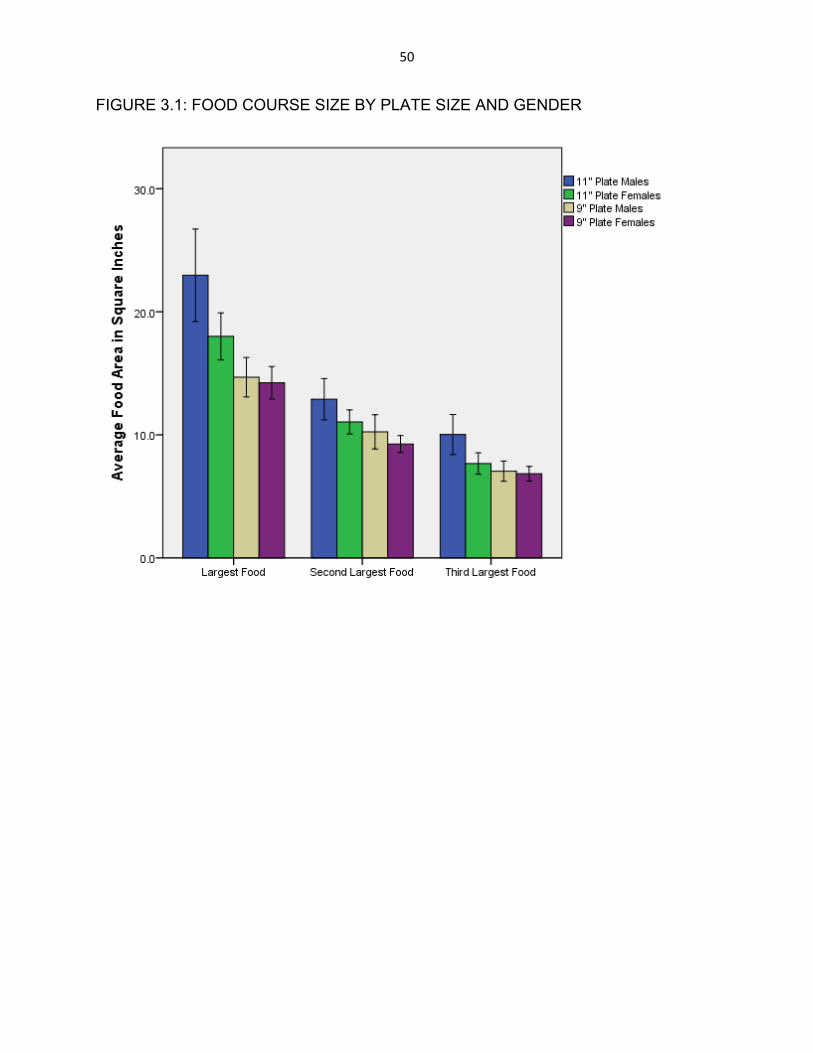
50
FIGURE 3.1: FOOD COURSE SIZE BY PLATE SIZE AND GENDER
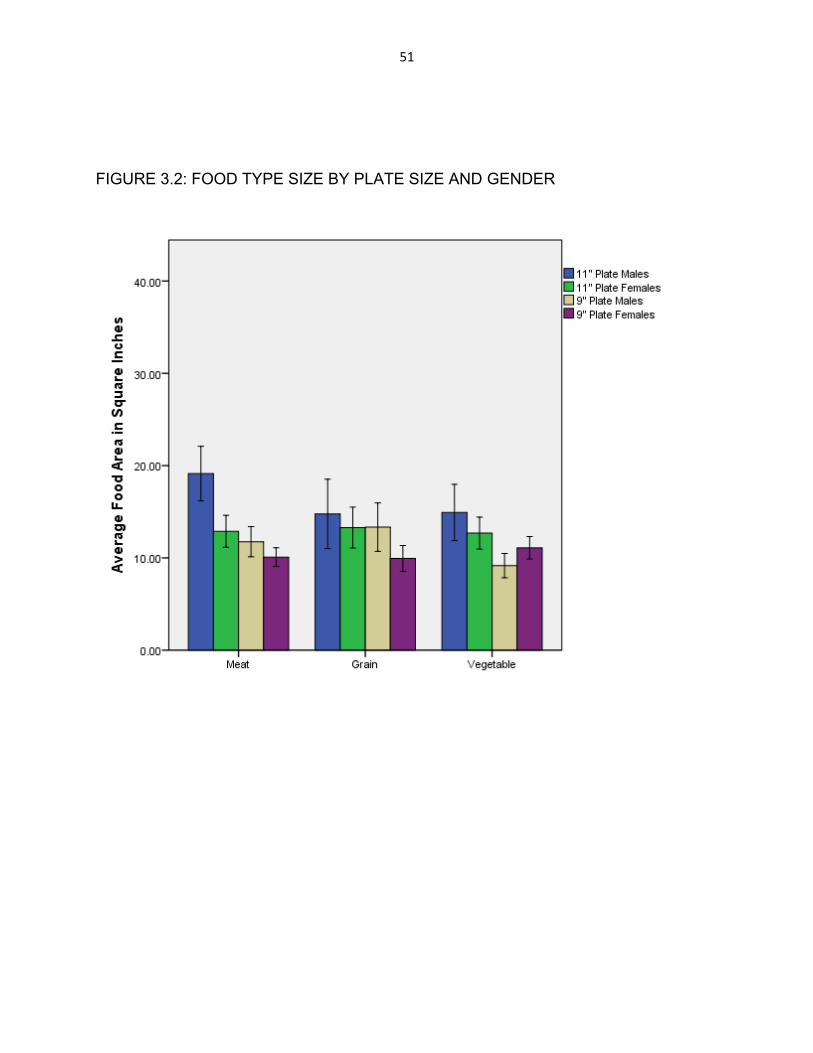
51
FIGURE 3.2: FOOD TYPE SIZE BY PLATE SIZE AND GENDER

52
TABLE 3.1: DEMOGRAPHICS, PLATE DRAWING COVERAGE, FOOD TYPES, AND
FOOD ITEMS BY PLATE SIZE
Total Sample
n 11" Plates n 9" Plates n
Demographics Male
31%
86
34%
47
27%
39
Female 69% 195 66% 92 73% 103 Age (years) 38.6+ 9.6 281 38.3 139 39.1 142 Drawing Coverage
Total Food Area (in2)
34.6+ 13.4
281
38.5+15.9***
139
30.9 + 9.1***
142
Plate Coverage 68% + 25% 281 60% + 25%*** 139 76% + 22%***
142
Drawn Foods Type
Meat (in2)
12.5 + 7
243
14.6 + 8.3***
119
10.4 + 4.7***
124
Grain (in2) 11.8 + 7.4 192 13.1 + 8.7** 91 10.5 + 5.8** 101 Vegetable (in2) 11.2 + 7.1 289 12.6 + 8.4*** 119 9.9 + 5.3*** 147 Roots (in2) 9.6 + 6.2 84 10.5 + 7.6 44 8.6 + 4 40 Fruit (in2) 7.4 + 5.1 24 9.2 + 7.4 8 6.5 + 3.4 16 Legume (in2) 8 + 2.2 8 7.7 + 2.2 4 8.3 + 2.5 4 Dessert (in2) 2.3 + 2.1 3 2.3 + 2.1 3 0 Other (in2) 15 + 13.9 9 24 + 17.9 2 12.4 + 12.9 7 Drawn Foods Item Size
Biggest (in2)
17 + 8.7
281
19.2+ 10.3***
139
14.3 + 6***
142
Second (In2) 10.7 + 4.3 273 11.5+ 4.8*** 134 9.5 + 3.7*** 139 Third (in2) 7.7 + 3.6 254 8.2+ 4.3*** 124 6.9 + 2.6*** 130 Fourth (in2) 5.2 + 2.2 44 5.6+ 2.4 19 5 + 2.2 25 Fifth (in2) 2 + .01 5 4.2 + 1.2 2 3.5 + 2.6 3
Differences between 9” and 11” plates using chi-square and t-tests * p < .05, ** p < .01, *** p < .001
(in2) equals inches squared
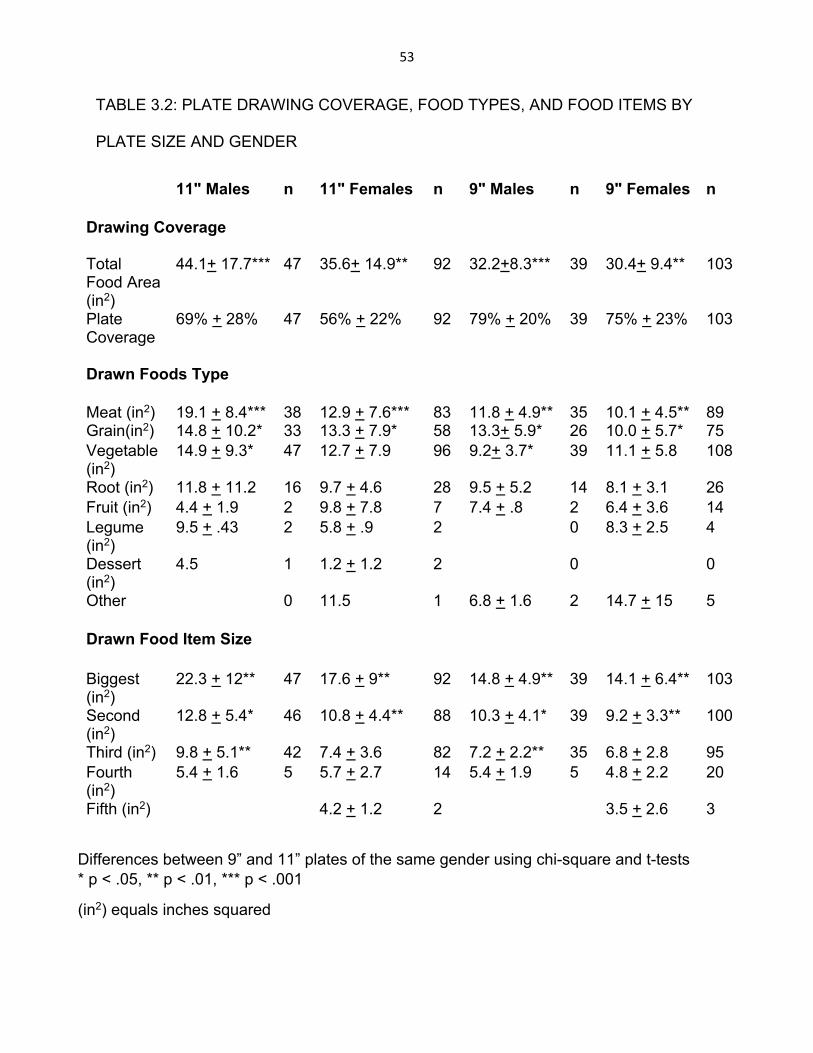
53
TABLE 3.2: PLATE DRAWING COVERAGE, FOOD TYPES, AND FOOD ITEMS BY
PLATE SIZE AND GENDER
11" Males n 11" Females n 9" Males n 9" Females n Drawing Coverage
Total Food Area (in2)
44.1+ 17.7***
47
35.6+ 14.9**
92
32.2+8.3***
39
30.4+ 9.4**
103
Plate Coverage
69% + 28% 47 56% + 22% 92 79% + 20% 39 75% + 23% 103
Drawn Foods Type Meat (in2)
19.1 + 8.4***
38
12.9 + 7.6***
83
11.8 + 4.9**
35
10.1 + 4.5**
89
Grain(in2) 14.8 + 10.2* 33 13.3 + 7.9* 58 13.3+ 5.9* 26 10.0 + 5.7* 75 Vegetable (in2)
14.9 + 9.3* 47 12.7 + 7.9 96 9.2+ 3.7* 39 11.1 + 5.8 108
Root (in2) 11.8 + 11.2 16 9.7 + 4.6 28 9.5 + 5.2 14 8.1 + 3.1 26 Fruit (in2) 4.4 + 1.9 2 9.8 + 7.8 7 7.4 + .8 2 6.4 + 3.6 14 Legume (in2)
9.5 + .43 2 5.8 + .9 2 0 8.3 + 2.5 4
Dessert (in2)
4.5 1 1.2 + 1.2 2 0 0
Other 0 11.5 1 6.8 + 1.6 2 14.7 + 15 5 Drawn Food Item Size
Biggest (in2)
22.3 + 12**
47
17.6 + 9**
92
14.8 + 4.9**
39
14.1 + 6.4**
103
Second (in2)
12.8 + 5.4* 46 10.8 + 4.4** 88 10.3 + 4.1* 39 9.2 + 3.3** 100
Third (in2) 9.8 + 5.1** 42 7.4 + 3.6 82 7.2 + 2.2** 35 6.8 + 2.8 95 Fourth (in2)
5.4 + 1.6 5 5.7 + 2.7 14 5.4 + 1.9 5 4.8 + 2.2 20
Fifth (in2) 4.2 + 1.2 2 3.5 + 2.6 3
Differences between 9” and 11” plates of the same gender using chi-square and t-tests * p < .05, ** p < .01, *** p < .001
(in2) equals inches squared
54
Discussion
Overall, this study showed that plate size can influence portrayals of appropriate
meal and portion sizes. Meals, food portions, and food types can be assessed with plate
mapping in the absence of normative external cues about foods among adults.
Participants with bigger plates drew meals significantly larger than their small plate
counterparts. Gender appeared to play a role in influencing meal size and composition.
Our first hypothesis, that participants would be sensitive to the size of the plate
and draw greater amounts of food on larger plates to reflect the available space, was
supported by data about the average plate area coverage. We found the difference
between larger and smaller plates in overall mean food size to be about 8 in2, or the
area covered by a deck of cards. Depending on which food type created this difference
and assuming the height was also equivalent to a deck of cards, this could represent a
substantial amount of extra calories if the food is a meat (up to 300 calories) rather than
a vegetable (about 40 calories). This increase in size also represents a full serving of
meat or a half-cup of vegetables with respect to fulfilling the recommendations of the
United States Department of Agriculture (USDA, 2011).
Our second hypothesis, that meal norms would influence participants to
represent similar proportions of their plates filled with food was only found to be
supported by the data when gender was considered. Men appear to be grounded in the
norms that a certain portion of the plate should be covered by food, while women
appear to be more cognizant of the area of the food itself than the vessel upon which
the food is served.
55
Our third hypothesis considered course size and food type size differences
across plates. We found that the first three food courses were bigger in size on larger
plates, but 60% of the difference in meal size came from the biggest food being greater
in size. Meat, grain, and vegetable courses all were drawn significantly bigger on 11”
plates, with meat being about 4 in2 bigger and grains and vegetables about 2.5 in2
bigger.
The analyses of the gender moderation hypothesis showed that while both men
and women drew bigger meals on larger plates, there were significant differences
between men and women in the overall size, food type, and food course drawings. We
used an Independent Samples T-Test to compare the differences in drawn foods and
found the difference between larger and small plates for overall size of food drawn by
men to be about 11.9 in2 (p=.001) and for women to be about 5.2 in2 (p=.002). Since
about 60% of the plate size difference occurred for both genders in what was already
the biggest food, the caloric difference between average drawings could be as low as
about 30 calories (female drawing more vegetables) and as high as about 450 calories
(male drawing a larger steak). These findings suggest an asymmetrical gender
response to plates as environmental influences, with men being more sensitive to plate
size in their plate composition than were women. Men also tended to draw far bigger
meat portions than grain or vegetable portions when given a bigger plate, while women
were more balanced in their meal drawings on different sized plates.
These findings about plate mapping in adults were similar to those found in
college students (Sharp & Sobal, 2012). When provided 11” plates, participants from
both studies drew 25% more food on their plates when compared to the overall area of
56
food that was drawn on the 9” plates. Both studies found similar patterns in coverage
percentage, with the 9” plates appearing to be more covered by food while actually
having a smaller amount of food on them when compared to 11” plates. These two
studies also support the hypothesis that a majority of the difference in meal size
between plates would be found in the biggest food. These two studies differed in the
average sizes of foods being drawn by the participants. While the college student
sample had significant differences in drawn vegetable size when comparing female
drawings on 9” and 11” plates, our present study of adults living in the community found
significant differences in food size for both genders in meats and grains and for men in
vegetables.
Implications and Applications
Assessment of dietary intake of individuals outside of laboratory settings is
difficult to obtain for a week, 24 hour period, or even a single meal. In order to acquire
data about an individual’s eating patterns, 24 hour food recalls and Food Frequency
Questionnaires (FFQ) are often used despite their limitations and time demands on
participants (IOM, 2005; Rumpler, Kramer, Rhodes, Moshfegh, & Paul, 2008). In a
comparison of reported protein and energy consumption accuracy, Schatzkin et al.
(2003) found that individuals using the FFQ underreported their protein and energy
intakes by 30% while individuals using 24 hour recalls underreported these numbers by
10-20%. Some tools, such as food photographs or digital food images (Robson &
Livingstone, 2000; Foster et al., 2006; Baranowski et al., 2011; Brito, Guimaraes, &
Pereira, 2014), can be used to increase accuracy or speed of an individual’s recall and
size estimation. In addition to these tools, plate mapping offers another method.
57
Plate mapping is an inexpensive and rapid method for collecting data about
meals, portions, and foods, and may be used in conjunction with other types of food
intake assessments. Plate mapping may also be useful for screening and prioritizing
meal preference and food type importance at an individual level by offering insights
about a person’s conceptions of meal size, food preferences, or food aversions. Asking
a participant to draw what they ate, plan to eat, or would like to eat for dinner may also
enhance the connection between dietary theory and practice for participants by offering
them a personalized visual representation of their meal preferences and routines
(Camelon et al., 1998). Plate mapping offers an additional method for assessing eating
preferences to provide information about meal-related characteristics and how portion
sizes can be influenced.
When nutrition researchers consider which processes may increase or decrease
caloric intake, understanding meal composition is important for deciding if an
intervention protocol like changing plate size would be effective for everyone to the
same degree. If changing plate size can influence portion servings (Wansink & van
Ittersum, 2013), then knowing beforehand if a participant prefers higher calorie grains
and meats or lower calorie vegetables and fruits as well as their interpretations of an
appropriate meal size can help identify which nutrition interventions may provide the
best results.
There are several limitations in this study. Plate mapping is a new measurement
method and these results should be interpreted cautiously. The volunteer sample
included relatively few male participants, which limits generalizability to men and
statistical power for analyzing gender differences. The quasi-experimental research

58
design involved only between-person comparisons, and should be replicated using
within-person and longitudinal study designs.
Conclusion
We observed that plate size was associated with the amount and proportions of
food that participants portrayed they would be eating for dinner that night. Some
environmental modifications require little additional effort from participants and can have
an impact on dietary behaviors (Engbers et al., 2005; van Kleef, Shimizu, & Wansink,
2011; Cowan & Devine, 2013), and changing plate size may help change food intake.
Easily integrated environmental changes such as plate size change could be a useful
method for modifying meal preferences and encouraging more appropriate eating habits
(Camelon et al., 1998).
Individuals’ consumption amounts, composition, and patterns can be influenced
by many internal and external factors (Wadhera & Capaldi-Phillips, 2014). This study
suggests that that people can portray their estimated dinner size and composition as a
two dimensional drawing and these portrayals of meal size can be influenced by the
size of the plate and are moderated by gender. Meal drawings on larger plates
appeared emptier in the context of the plate and may influence participants to serve
themselves more food or go back for second helpings. Our results suggest participants’
estimates of dinner size may be influenced by plate size. This plate size effect appears
to be more powerful for males than females and may encourage an asymmetrical
difference in men's and women's consumption from larger plates.
59
References
Baranowski,T., Baranowski, J.C., Watson, K.B., Martin, S., Beltran, A., Islam, N., Dadabhoy, H., Adame, S., Cullen, K., Thompson, D., Buday, R., & Subar, A. (2011) Children’s accuracy of portion size estimation using digital food images: effects of interface design and size of image on computer screen. Public Health Nutr. 14:418-425.
Brito, A.P., Guimarães, C.P., & Pereira, R.A. (2014) Evaluation of photographs supporting an FFQ developed for adolescents. Public Health Nutr. 17:139-144.
Camelon, K.M., Hådell, K., Jämsén, P.T., Ketonen, K.J., Kohtamäki, H.M., Mäkimatilla, S., Törmälä, M.L., & Valve, R.H. (1998) The Plate Model: a visual method of teaching meal planning. DAIS Project Group. Diabetes Atherosclerosis Intervention Study. J. Am. Diet Assoc. 98(10):1155-1158.
Cooper, C.A., McCord, D.M., & Socha, A. (2011) Evaluating the college sophomore problem: the case of personality and politics. J. Psychol. 145(1):23-37.
Cowan, J.A. & Devine, C.M. (2013) Diet and body composition outcomes of an environmental and educational intervention among men in treatment for substance addiction. J. Nutr. Educ. Behav. 45(2):154-158.
Douglas, M. (1972) Deciphering a meal. Daedalus. 101(1):61-81.
Emanuel, A.S., McCully, S.N., Gallagher, K.M., & Updegraff, J.A. (2012) Theory of Planned Behavior explains gender difference in fruit and vegetable consumption. Appetite. 59(3):693-697.
Engbers, L.H., van Poppel, M.N., Chin A Paw, M.J., & van Mechelen, W. (2005) Worksite health promotion programs with environmental changes: a systematic review. Am. J. Prev. Med. 29(1):61-70.
Fisher, J.O., Birch, L.L., Zhang, J., Grusak, M.A., & Hughes, S.O. (2013) External influences on children's self-served portions at meals. Int. J. Obes. 37:954-960.
Foster, E., Matthews, J.N.S., Nelson, M., Harris, J.M., Mathers, J.C., & Adamson, A.J. (2006) Accuracy of estimates of food portion size using food photographs – the importance of using age-appropriate tools. Public Health Nutr. 9:509-514.
Institute of Medicine. (2005). Dietary reference intakes for energy, carbohydrate, fiber, fat, fatty acids, cholesterol, protein, and amino acids. Washington, D.C.: National Academies Press.
Koh, J. & Pliner, P. (2009) The effects of degree of acquaintance, plate size, and sharing on food intake. Appetite. 52(3):595-602.
60
Krider, R.E., Raghubir, P., & Krishna, A. (2001). Pizzas: Pi or Square? Psychophysical Biases in Area Comparisons. Marketing Science, 20(4) 405-425.
Libotte, E., Siegrist, M., & Bucher, T. (2014). The influence of plate size and meal composition. Literature review and experiment. Appetite. 82:91-96.
Pratt, I.S., Croager, E.J., & Rosenberg, M. (2011) The mathematical relationship between dishware size and portion size. Appetite. 58(1):299-302.
Raynor, H.A. & Wing, R.R. (2007) Package unit size and amount of food: do both influence intake? Obesity. 15(9):2311-2319.
Robson, P.J. & Livingstone, M.B.E. (2000). An evaluation of food photographs as a tool for quantifying food and nutrient intakes. Public Health Nutr. 3:183-192.
Rolls, B.J., Fedoroff, I.C., Guthrie, J.F. (1991) Gender differences in eating behavior and body weight regulation. Health Psychol. 10(2):133-142.
Rolls, B.J., Roe, L.S., Halverson, K.H., & Meengs, J.S. (2007) Using a smaller plate did not reduce energy intake at meals. Appetite. 49(3):652-660.
Rumpler WV, Kramer M, Rhodes DG, Moshfegh AJ, Paul DR. (2008). Identifying sources of reporting error using measured food intake. Eur J Clin Nutr. 62(4):544-552.
Schatzkin, A., Kipnis, V., Carroll, R.J., Midthune, D., Subar, A.F., Bingham, S., Schoeller, D.A., Troiano, R.P., & Freedman, L.S. (2003) A comparison of a food frequency questionnaire with a 24-hour recall for use in an epidemiological cohort study: results from the biomarker-based Observing Protein and Energy Nutrition (OPEN) study. Int J Epidemiol. 32(6):1054-1062.
Shah, M., Schroeder, R., Winn, W., & Adams-Huet, B. (2011) A pilot study to investigate the effect of plate size on meal energy intake in normal weight and overweight/obese women. J. Hum. Nutr. Diet. 24(6):612-615.
Sharp, D. & Sobal, J. (2012) Using plate mapping to examine sensitivity to plate size in food portions and meal composition among college students. Appetite. 59(3):639-645.
Sobal, J., & Bisogni, C. A. (2009). Constructing food choice decisions. Annals Behavioral Medicine, 38 Suppl 1, S37-46.
Sobal, J. & Wansink, B. (2007) Kitchenscapes, tablescapes, platescapes, and foodscapes: Influences of micro-level built environments on food intake. Environ. Behav. 39(1):124-142.
USDA's MyPlate - Home Page. "Choose MyPlate.gov." USDA, 11 Sept. 2011. Web. 14 July 2014.
61
van Kleef, E., Shimizu, M., & Wansink, B. (2011) Serving bowl selection biases the amount of food served. J. Nutr. Educ. Behav. 44(1):66-70.
Wadhera, D. & Capaldi-Phillips, E.D. (2014) A review of visual cues associated with food on food acceptance and consumption. Eat. Behav. 15:132-143
Wansink, B. & van Ittersum, K. (2005) Shape of glass and amount of alcohol poured: comparative study of effect of practice and concentration. BMJ. 331(7531):1512-1514.
Wansink, B., van Ittersum, K., & Painter, J.E. (2006) Ice cream illusions: bowls, spoons, and self-served portion sizes. Am. J. Prev. Med. 31(3):240-243.
Wansink, B. & van Ittersum, K. (2010) Spoons systematically bias dosing of liquid medicine. Ann. Intern. Med. 152(1):66-67.
Wansink, B. & van Ittersum, K. (2013) Portion size me: Plate-size induced consumption norms and win-win solutions for reducing food intake and waste. J. Exp. Psych.: Applied. 19(4):320-332.
Wardle, J., Haase, A.M., Steptoe, A., Nillapun, M., Jonwutiwes, K. & Bellisle, F. (2004) Gender differences in food choice: the contribution of health beliefs and dieting. Ann. Behav. Med. 27(2):107-116.
62
CHAPTER 4: VALIDATING THE PLATE MAPPING METHOD: COMPARING DRAWN FOODS AND ACTUAL FOODS OF UNIVERSITY STUDENTS IN A CAFETERIA
Introduction
While the USDA offers guidelines that educate the public about recommended
eating practices (U.S. Department of Agriculture & U.S. Department of Health and
Human Services, 2010), there is a dissonance between nutrition education and
personal behavior. Environmental variables can influence food consumption (Sobal &
Wansink, 2007). Plate size and portion size may influence the amount of food an
individual consumes, with increases in plate or portion size consistently correlated with
increased food intake (Diliberti et al., 2004; Fisher & Kral, 2008; Van Ittersum &
Wansink, 2012). Some environmental modifications require little additional effort from
participants to impact dietary behaviors (Engbers et al., 2005; van Kleef et al., 2011;
Cowan & Devine, 2013). One potential environmental influence is the size of the vessel
in which food is served (Kallbekken & Sælen, 2013).
Larger serving vessels are associated with people taking larger food portions
(Sobal & Wansink, 2007; Wadhera & Capaldi-Phillips, 2014). An individual can select
how much food is ordered or served onto a plate, but there is rarely much opportunity
for the size of the plate or bowl itself to be altered or selected. While there is a distinct
lack of range in plate sizes offered during a meal, research suggests that there is a
range of overall caloric intake that can be consumed without the individual feeling overly
hungry or overly full (Herman and Polivy,1984; Rolls, Bell, & Waugh, 2000) . If
individuals can be influenced to marginally reduce the size of a meal, then altering or

63
removing the food norms and cues present in the environment that promote larger
meals may provide a low-involvement change that may influence body weight.
An initial study by Sharp and Sobal (2012) reported that the method labelled
plate mapping could be used as a tool to understand meal portrayals by asking college
students to draw what they would like to eat for dinner on a paper plate that was either
11” or 9” in diameter. They found that college students given an 11” plate drew an
average total area of food that was 26% greater than those given a 9” plate. The largest
food drawn on each size of plate was found to be the primary factor in the difference in
area between plate sizes, with 70% of the total difference in meal size coming from the
largest food drawn on plates. While the area of the largest food increased when
comparing 11” plate drawings to 9” plate drawings, the relative percentage of plate area
covered by the largest food on each size of plates remained the same. Gender was
found to influence portrayals of meals in plate maps, with women drawing bigger
vegetable portions than men when given larger plates.
In a similar study, Sharp, Sobal, Wethington, & Wansink (Submitted) used the
same plate mapping protocols on a sample of adults in a medium sized city and found
that the amount of food drawn was associated with the size of the plate provided when
participants were asked to draw what they were planning to eat for dinner that evening.
They found that while men and women both portrayed their estimated dinners to be
bigger when using a larger 11” plate, men appeared to be more influenced by the size
of their plates and drew more food (40% more) than women did (14% more) when
compared to meal drawings on 9” plates.
64
The present study examines the construct validity (Markus & Lin, 2010) of plate
mapping measurement by investigating capacity of college students to draw their meal
in two-dimensions on two differently sized plates just prior to or just after consuming a
lunchtime meal at a cafeteria on their campus. Using a plate mapping protocol to
compare actual food portions and meals sizes to participant generated drawings of food
portion and meal sizes can examine construct validity of plate mapping and quantify the
degree that plate mapping can precisely measure participant perceptions of meal size in
the context of a particular plate. Results of mathematical modeling to examine how dish
size affects the potential energy available in a meal suggests that a small increase in
dishware size can lead to a substantial increase in energy available to be consumed
(Pratt, Croager, & Rosenberg, 2012). This reinforces the need to consider dishware size
when developing strategies to prevent over-consumption.
We propose four hypotheses about how participants respond to the plate size
and pre-versus post- meal temporal variations in this study. 1) Participants will be able
to accurately draw the overall estimated sizes of the meal and food components they
are about to consume. 2) Participants drawing their meals post-consumption will be less
accurate in drawing on plates than participants drawing their meals pre-consumption. 3)
Participants drawing on plates larger than the ones they were served their meals on will
be less accurate in drawing their food portions and meal size as participants drawing on
plates that were identical in size to the ones they were served their meals on. 4) Gender
will moderate the accuracy of plate drawing, with women producing more accurate plate
drawings than do men.
Methods
65
In a quasi-experimental design at one on-campus dining facility, a paper plate
and a questionnaire were administered to students who had purchased a meal at a
large university in the Northeastern U.S. For sixteen weekdays, students were
approached during between the hours of 11:30 am and 1:30 pm either 1) as soon as
they sat down to eat but before they had started eating (pre-consumption) or 2) after
they had finished their meal but before they had gotten up from the table to leave the
dining hall (post-consumption). The questionnaire consisted of a consent form and
requested basic student demographics. When the questionnaire was completed,
researchers instructed participants to “please accurately draw and label the foods in the
meal that you (are about to/have just) consume(d). Please be as realistic as possible
with the sizes of the foods on your plate” (APPENDIX B).
Each participant received one size of plates of identical material, design, and
color, but one plate was 9” in diameter and the other plate was 11” in diameter. The 9”
plate was selected to match the size and color of the plates currently used in the dining
facility. Only one size of plate and pre- or post-meal assessment was used to collect
data on any given day with each plate size and meal time being collected on four out of
the sixteen total days. A random number generator was used to determine the order of
plate collection. Completed plates and questionnaires were collected immediately after
the student was finished. Of the 291 plates collected, 248 were analyzed after excluding
40 students for not reporting the size of the salad purchased (small or large container)
and 3 who were minors under the age of 18. Of the 248 plates analyzed, all plate
drawings completely matched foods on the plates, with no student who omitted drawing
any purchased food that had been recorded as being on their plate by one of the
66
researchers. Participants were not compensated in any way for their time. The study
was approved by the Cornell University Institutional Review Board.
Participants self-labelled the food items that they drew in order to confirm the
contents of their meal and a researcher covertly recorded the food items on the actual
plate. This was done to confirm that participants had correctly recalled their meal as well
as to match drawn participant food estimations with research food measurements
during data analysis.
Completed plates were coded to construct indicators for the concepts in the
hypotheses. Foods were rated by size to avoid presumptions about which foods were
main courses or side dishes and were then sorted into largest to smallest portions
based on the size of their circumference. The horizontal dimensions of drawn food,
specifically circumference and area, were used as a proxy for actual size of drawn foods
based on mathematical modeling showing that horizontal area is an acceptable
estimate of overall volume (Pratt, Croager, & Rosenberg, 2011). The independent
variables were plate size and pre-consumption and post-consumption timing.
Dependent outcome variables for this analyses were plate coverage (percent of plate
covered), the food course (largest to smallest), and food size coverage (circumference
and area). Moderating variables were size of plates used for drawing (9" or 11") and
gender.
To compare participant drawings with estimated food size, the dining facility
allowed us to observe their staff preparing each meal collected during the study so that
measurements of food size could be obtained and a photograph could be taken for
reference. For most foods, repeated measurements of the same food type were taken
67
and the average size was used when comparing actual food size with drawn food size.
Two researchers measured each food in order to verify the accuracy of measurements.
A Pearson’s r correlation was then used to measure the relationships between the
participant drawn food portions and meal size and the actual measurements of food
portions collected by the researchers. According to Cohen (1988), the guidelines for
effect size categorization of correlation strength is r=.10 for a small effect, r=.30 for a
medium effect, and r=.50 for a large effect. We use this categorization when evaluating
the extent that participants were able to draw their meals and foods with relative
accuracy. The significance threshold for all statistical analyses was set at .05.
Results
Among the 248 participants, 52% (n=130) drew on 9” plates and 48% (n=118)
drew on 11” plates. Men and women comprised 50% each of the pre-consumption
group while there were more men (59% n=61) than women (41% n=43) in the post-
consumption group. Table 4.1 summarizes the results of male responses to plate size
and temporal variables and Table 4.2 summarizes the results female responses to plate
size and temporal variables. Results are reported by gender to examine if there were
differences in how each group completed this task.
For pre-consumption males who drew on plates that were the same 9” diameter
plates as their actual meal was on, there was a strong positive correlation between the
overall size of the actual meal and participant’s drawn meal (r=.80) as well as for the
largest three foods on the plate (r=.87, r=.56, & r=.69) on the plate. There were not
68
enough participants drawing four or more foods on their plate to provide enough cases
to appropriately consider the correlation between participant drawings and actual food
sizes. Fourth and fifth foods on a participant’s plate are listed in the Tables but will
otherwise not be discussed further. Pre-consumption females on 9” plates also showed
strong positive correlation for the overall size of the meal (r=.75) as well as the three
largest food (r=.79, r=.73, & r=.70).
Pre-consumption males with the larger 11” plates were moderately positively
correlated between overall meal size and overall meal estimates (r=.76). The largest
food estimate showed strong positive correlation (r=.81) but none of the other foods
drawn on the plates showed significant correlations. Females in this group also showed
strong positive correlation between overall meal size and meal drawing (r=.82) as well
as a moderate positive correlation between the largest food estimate (r=.65) but no
other significant correlations.
Participants who had consumed their meals and were required to immediately
recall the size of their food portions were also appeared to be able to adequately
estimate their actual meal size by drawing them on the provided plates. Post-
consumption males on 9” plates showed moderate positive correlations for meal size
and the first two largest food portions (r= .68, r=.59, & r=.56) and strong positive
correlation for the third largest food (r=.84). Post-consumption females also showed
strong positive correlation for all measurements (r=.74, r=.70, r=.88, & r=.80) when
provided the same 9” diameter plated as they used for their actual meal.
Post-consumption males who were given larger 11” plates to draw their meals
were strongly positively correlated in overall meal size (r=.76) but were only moderately
69
positively correlated in estimating the size of their largest food (r=.38) and there was no
statistically significant correlation for second and third food items. Post-consumption
females were strongly positively correlated with overall meal size and first largest food
(r=.73 & r=.58) but had no statistically significant correlation for second and third food
items.
Our first hypothesis was that all participants would be able to accurately recall
and draw the meals they have in front of them and are about to consume. This
hypothesis was supported for all of our conditions, with participants drawing overall
meal sizes with strong a positive correlation of r=.50 or greater.
Our third hypothesis was that participants drawing on their plates post-
consumption will draw less accurately than participants drawing on their plates pre-
consumption. This hypothesis was not supported as participants drew their overall meal
sizes with a strong positive correlation of r=.50 or greater, although many of the
correlations were lower for the post-consumption participants than the pre-consumption
participants.
Our second hypothesis was that participants drawing on plates larger than the
ones they were served their meals on will be less accurate in drawing their food portions
and meal size as participants drawing on plates that were identical in size to the ones
they were served their meals on. This hypothesis was not uniformly supported by the
data as all participants were able to accurately draw the overall size of their meals,
although many of the correlations were lower for the 11" plates than the 9" plates. The
hypothesis was supported when considering the accuracy of drawings for the second
and third largest foods. Participants given the 9” plates were able to draw their entire
70
meals and the first three largest foods with a significant correlation of r=.50 or greater.
Participants with the larger 11” plates drew the entire meal and largest food with a
significant correlation of r=.50 or greater but did not draw their second or third largest
foods with significance.
Our fourth hypothesis was that gender will moderate the accuracy of plate
mapping, with women producing more accurate plate drawings than men. This
hypothesis was supported when participants were given the larger 11” plates. Figures
4.1-4.8 summarize the R2 values of participant’s drawn and real meal sizes. Paired T-
tests were used to determine the differences between drawn and actual meals. This
analysis reported of men provided with 11” plates drew meals that were significantly
larger than they had consumed. The overestimation of meal size resulted in men
drawing, on average, meals on 11” plates that 3.1 square inches bigger (p=.007) than
their meal pre-consumption and 5.1 square inches bigger (p=.023) than their meal post-
consumption. Women provided with 11” plates did not draw significantly larger meals
when tested pre-consumption (p=.208) or post-consumption (0=.251).
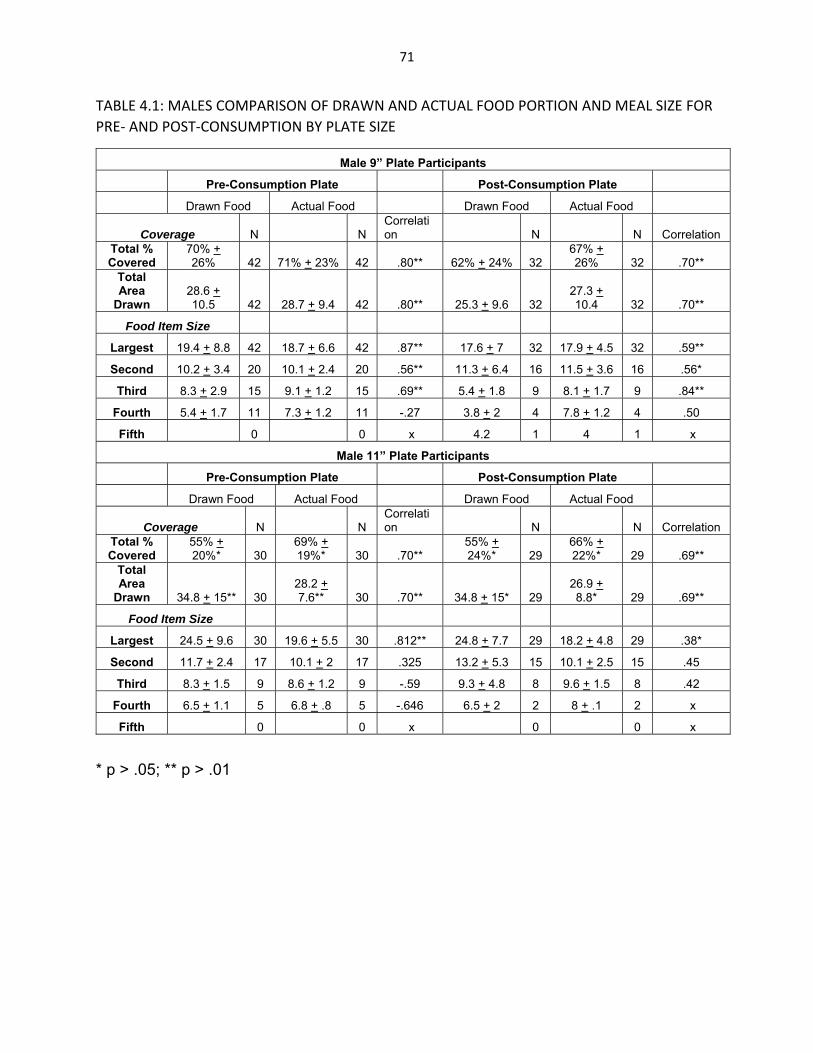
71
TABLE 4.1: MALES COMPARISON OF DRAWN AND ACTUAL FOOD PORTION AND MEAL SIZE FOR
PRE‐ AND POST‐CONSUMPTION BY PLATE SIZE
Male 9” Plate Participants
Pre-Consumption Plate Post-Consumption Plate
Drawn Food Actual Food Drawn Food Actual Food
Coverage N N Correlation N N Correlation
Total % Covered
70% + 26% 42 71% + 23% 42 .80** 62% + 24% 32
67% + 26% 32 .70**
Total Area
Drawn 28.6 + 10.5 42 28.7 + 9.4 42 .80** 25.3 + 9.6 32
27.3 + 10.4 32 .70**
Food Item Size
Largest 19.4 + 8.8 42 18.7 + 6.6 42 .87** 17.6 + 7 32 17.9 + 4.5 32 .59**
Second 10.2 + 3.4 20 10.1 + 2.4 20 .56** 11.3 + 6.4 16 11.5 + 3.6 16 .56*
Third 8.3 + 2.9 15 9.1 + 1.2 15 .69** 5.4 + 1.8 9 8.1 + 1.7 9 .84**
Fourth 5.4 + 1.7 11 7.3 + 1.2 11 -.27 3.8 + 2 4 7.8 + 1.2 4 .50
Fifth 0 0 x 4.2 1 4 1 x
Male 11” Plate Participants
Pre-Consumption Plate Post-Consumption Plate
Drawn Food Actual Food Drawn Food Actual Food
Coverage N N Correlation N N Correlation
Total % Covered
55% + 20%* 30
69% + 19%* 30 .70**
55% + 24%* 29
66% + 22%* 29 .69**
Total Area
Drawn 34.8 + 15** 30 28.2 + 7.6** 30 .70** 34.8 + 15* 29
26.9 + 8.8* 29 .69**
Food Item Size
Largest 24.5 + 9.6 30 19.6 + 5.5 30 .812** 24.8 + 7.7 29 18.2 + 4.8 29 .38*
Second 11.7 + 2.4 17 10.1 + 2 17 .325 13.2 + 5.3 15 10.1 + 2.5 15 .45
Third 8.3 + 1.5 9 8.6 + 1.2 9 -.59 9.3 + 4.8 8 9.6 + 1.5 8 .42
Fourth 6.5 + 1.1 5 6.8 + .8 5 -.646 6.5 + 2 2 8 + .1 2 x
Fifth 0 0 x 0 0 x
* p > .05; ** p > .01
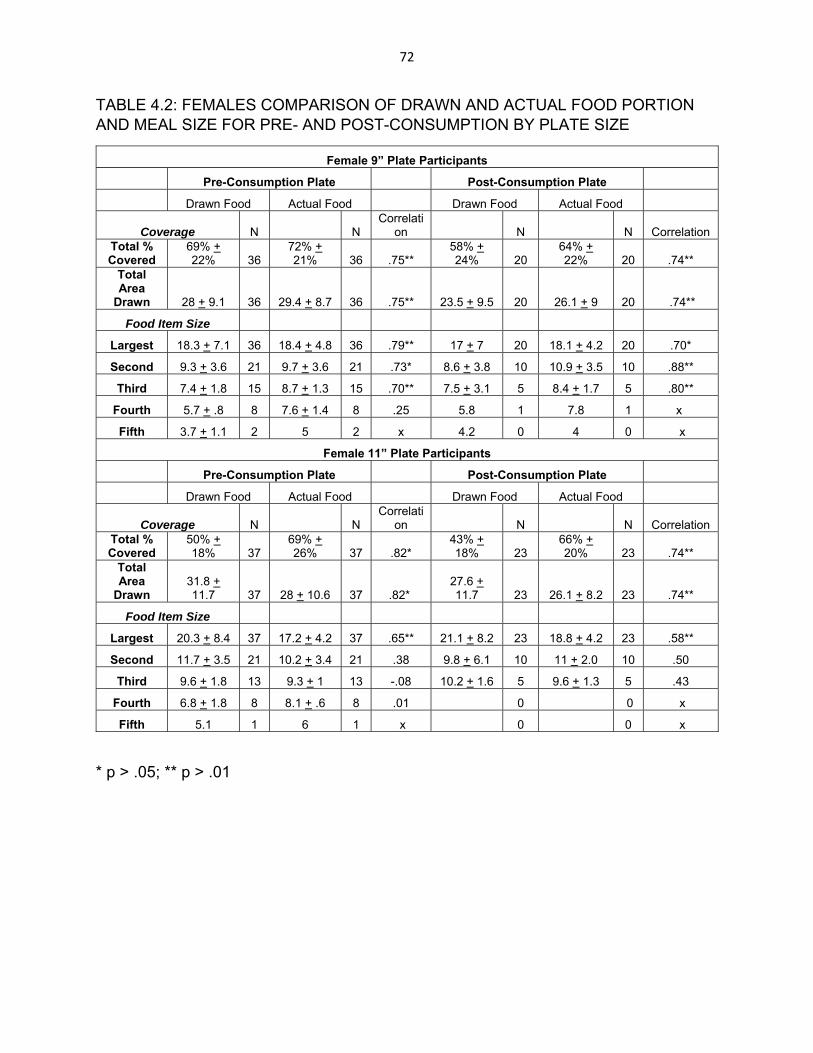
72
TABLE 4.2: FEMALES COMPARISON OF DRAWN AND ACTUAL FOOD PORTION AND MEAL SIZE FOR PRE- AND POST-CONSUMPTION BY PLATE SIZE
Female 9” Plate Participants
Pre-Consumption Plate Post-Consumption Plate
Drawn Food Actual Food Drawn Food Actual Food
Coverage N N Correlati
on N N Correlation Total % Covered
69% + 22% 36
72% + 21% 36 .75**
58% + 24% 20
64% + 22% 20 .74**
Total Area
Drawn 28 + 9.1 36 29.4 + 8.7 36 .75** 23.5 + 9.5 20 26.1 + 9 20 .74**
Food Item Size
Largest 18.3 + 7.1 36 18.4 + 4.8 36 .79** 17 + 7 20 18.1 + 4.2 20 .70*
Second 9.3 + 3.6 21 9.7 + 3.6 21 .73* 8.6 + 3.8 10 10.9 + 3.5 10 .88**
Third 7.4 + 1.8 15 8.7 + 1.3 15 .70** 7.5 + 3.1 5 8.4 + 1.7 5 .80**
Fourth 5.7 + .8 8 7.6 + 1.4 8 .25 5.8 1 7.8 1 x
Fifth 3.7 + 1.1 2 5 2 x 4.2 0 4 0 x
Female 11” Plate Participants
Pre-Consumption Plate Post-Consumption Plate
Drawn Food Actual Food Drawn Food Actual Food
Coverage N N Correlati
on N N Correlation Total % Covered
50% + 18% 37
69% + 26% 37 .82*
43% + 18% 23
66% + 20% 23 .74**
Total Area
Drawn 31.8 + 11.7 37 28 + 10.6 37 .82*
27.6 + 11.7 23 26.1 + 8.2 23 .74**
Food Item Size
Largest 20.3 + 8.4 37 17.2 + 4.2 37 .65** 21.1 + 8.2 23 18.8 + 4.2 23 .58**
Second 11.7 + 3.5 21 10.2 + 3.4 21 .38 9.8 + 6.1 10 11 + 2.0 10 .50
Third 9.6 + 1.8 13 9.3 + 1 13 -.08 10.2 + 1.6 5 9.6 + 1.3 5 .43
Fourth 6.8 + 1.8 8 8.1 + .6 8 .01 0 0 x
Fifth 5.1 1 6 1 x 0 0 x
* p > .05; ** p > .01
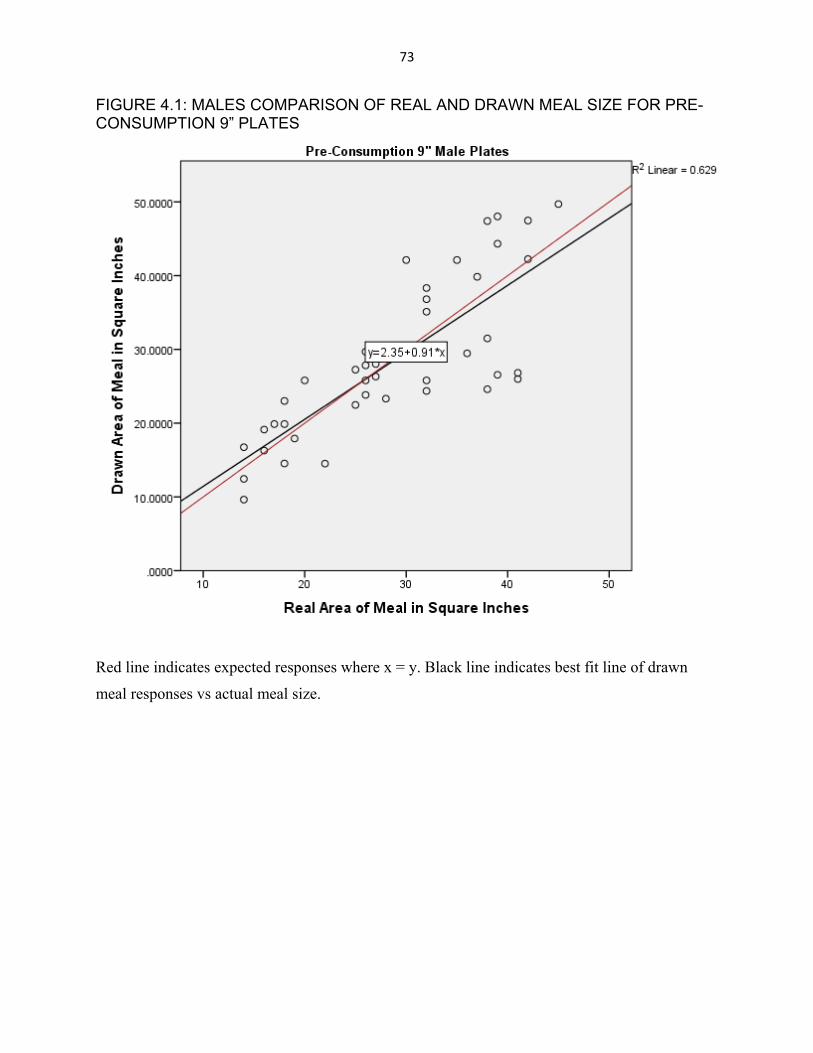
73
FIGURE 4.1: MALES COMPARISON OF REAL AND DRAWN MEAL SIZE FOR PRE-CONSUMPTION 9” PLATES
Red line indicates expected responses where x = y. Black line indicates best fit line of drawn
meal responses vs actual meal size.
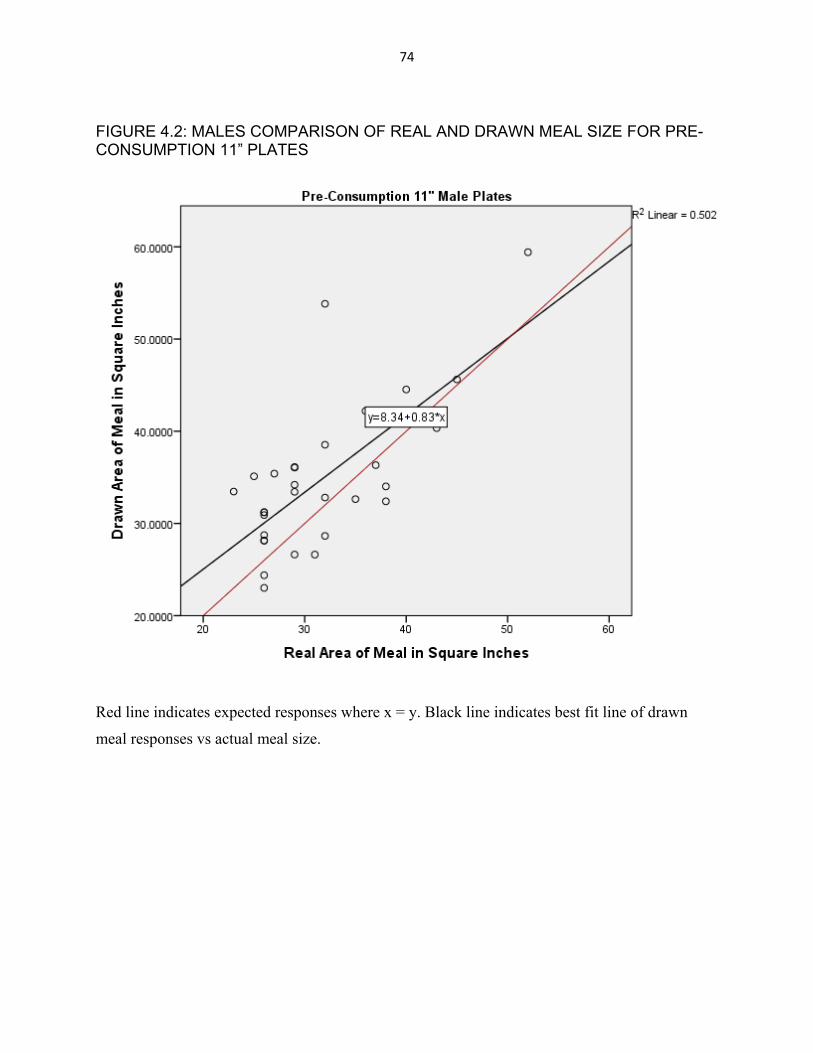
74
FIGURE 4.2: MALES COMPARISON OF REAL AND DRAWN MEAL SIZE FOR PRE-CONSUMPTION 11” PLATES
Red line indicates expected responses where x = y. Black line indicates best fit line of drawn
meal responses vs actual meal size.
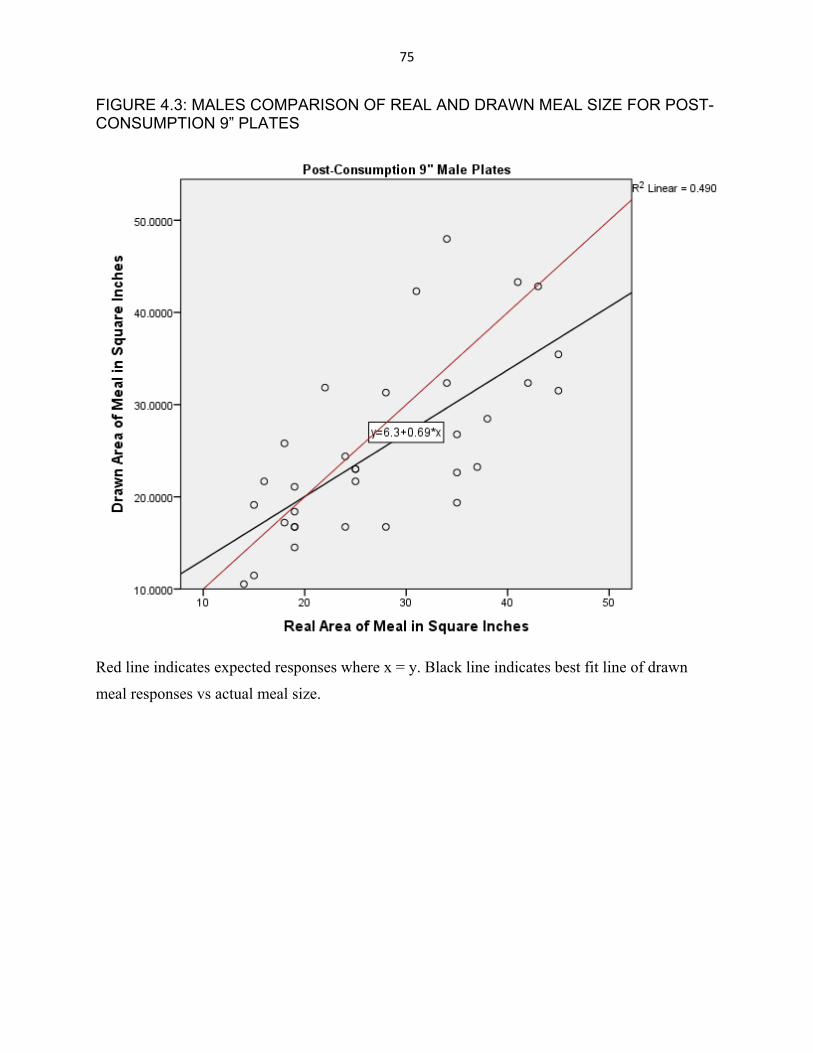
75
FIGURE 4.3: MALES COMPARISON OF REAL AND DRAWN MEAL SIZE FOR POST-CONSUMPTION 9” PLATES
Red line indicates expected responses where x = y. Black line indicates best fit line of drawn
meal responses vs actual meal size.
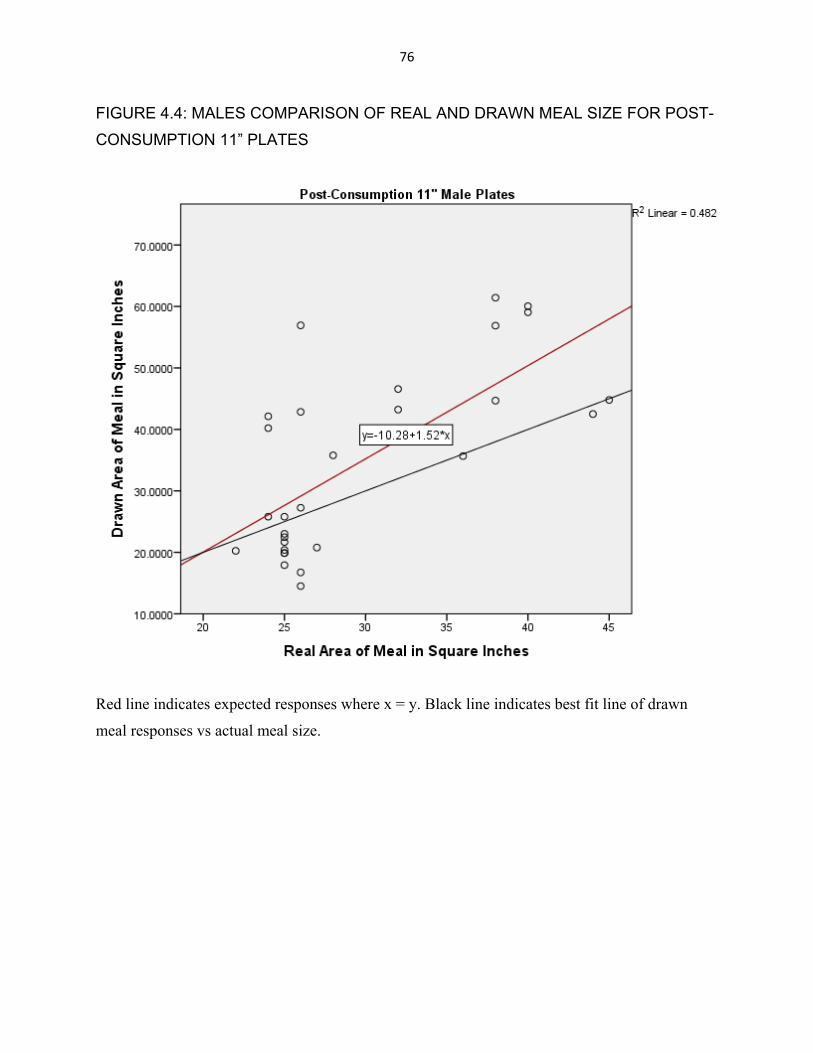
76
FIGURE 4.4: MALES COMPARISON OF REAL AND DRAWN MEAL SIZE FOR POST-
CONSUMPTION 11” PLATES
Red line indicates expected responses where x = y. Black line indicates best fit line of drawn
meal responses vs actual meal size.
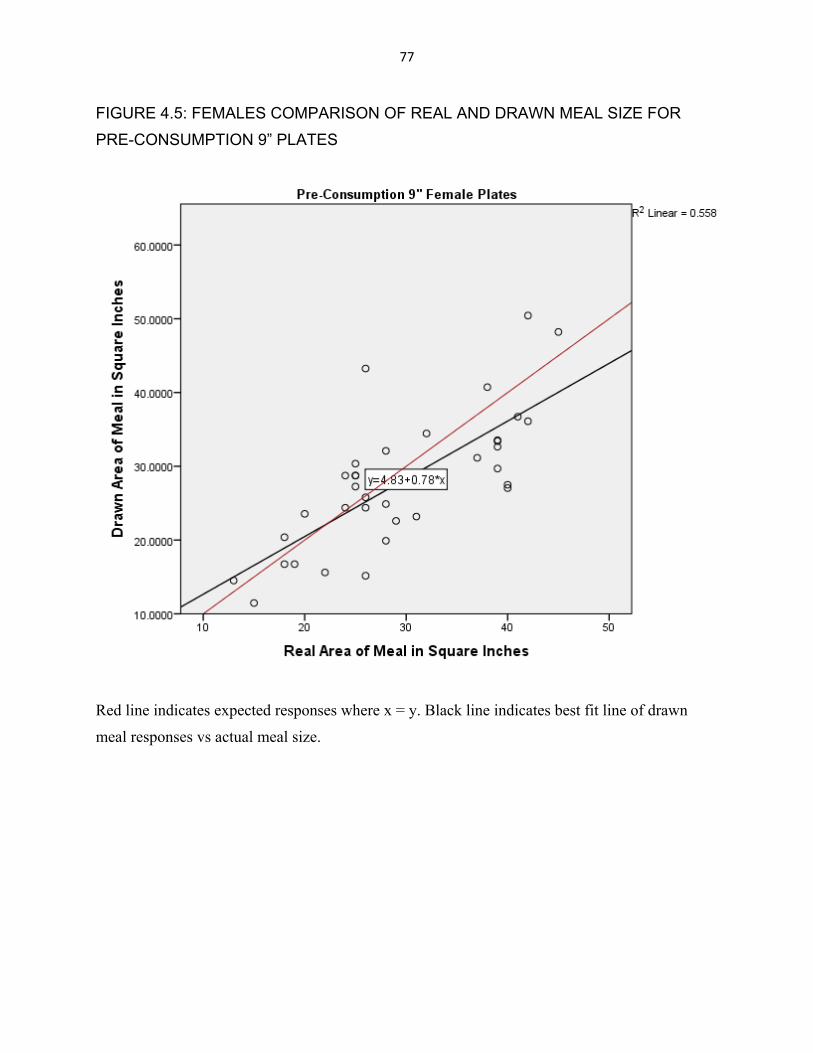
77
FIGURE 4.5: FEMALES COMPARISON OF REAL AND DRAWN MEAL SIZE FOR
PRE-CONSUMPTION 9” PLATES
Red line indicates expected responses where x = y. Black line indicates best fit line of drawn
meal responses vs actual meal size.
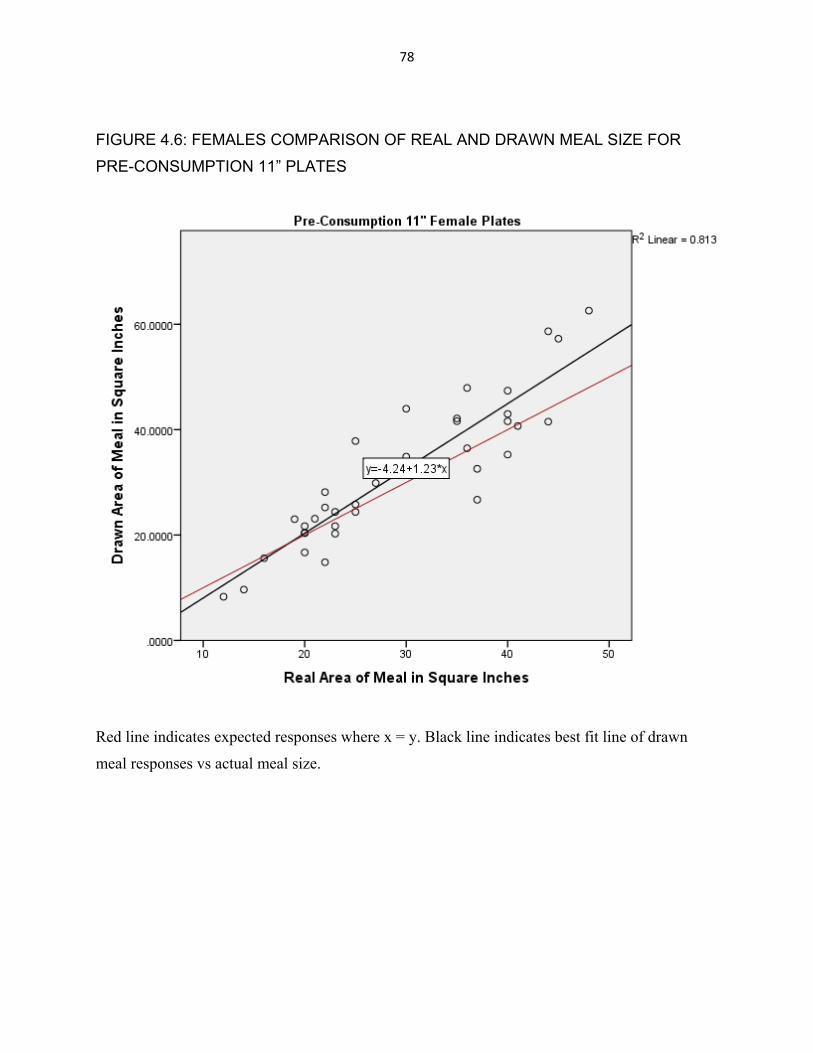
78
FIGURE 4.6: FEMALES COMPARISON OF REAL AND DRAWN MEAL SIZE FOR
PRE-CONSUMPTION 11” PLATES
Red line indicates expected responses where x = y. Black line indicates best fit line of drawn
meal responses vs actual meal size.
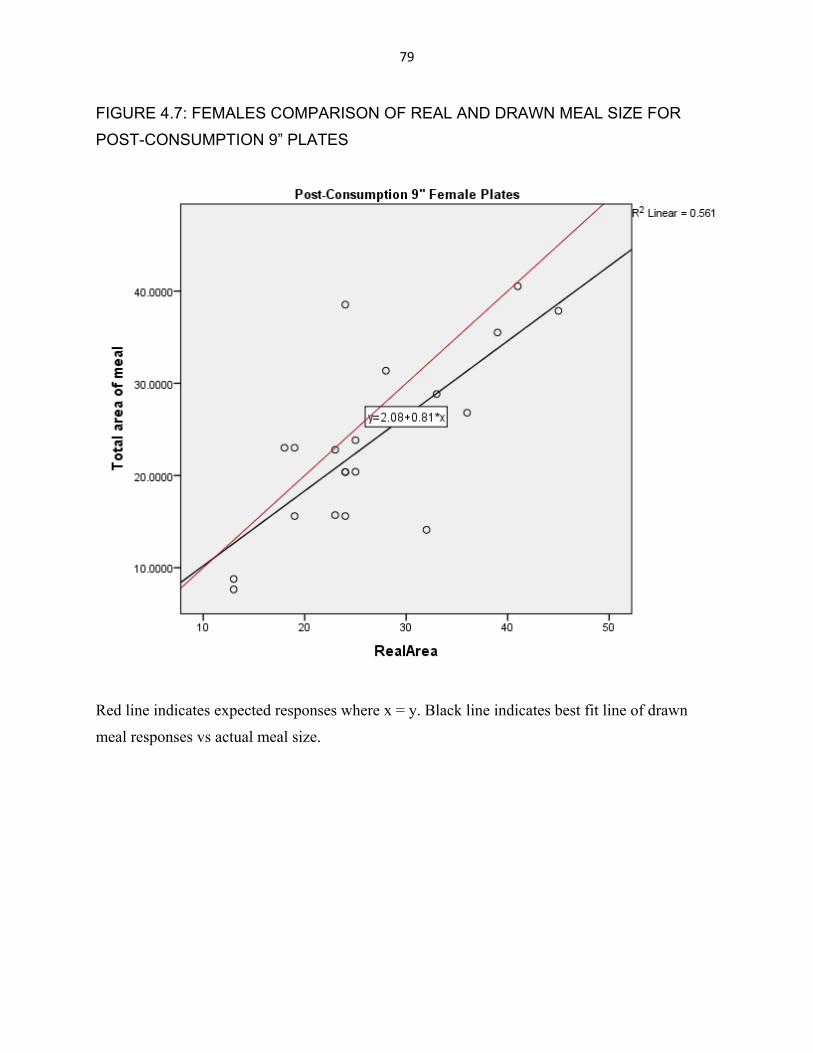
79
FIGURE 4.7: FEMALES COMPARISON OF REAL AND DRAWN MEAL SIZE FOR
POST-CONSUMPTION 9” PLATES
Red line indicates expected responses where x = y. Black line indicates best fit line of drawn
meal responses vs actual meal size.
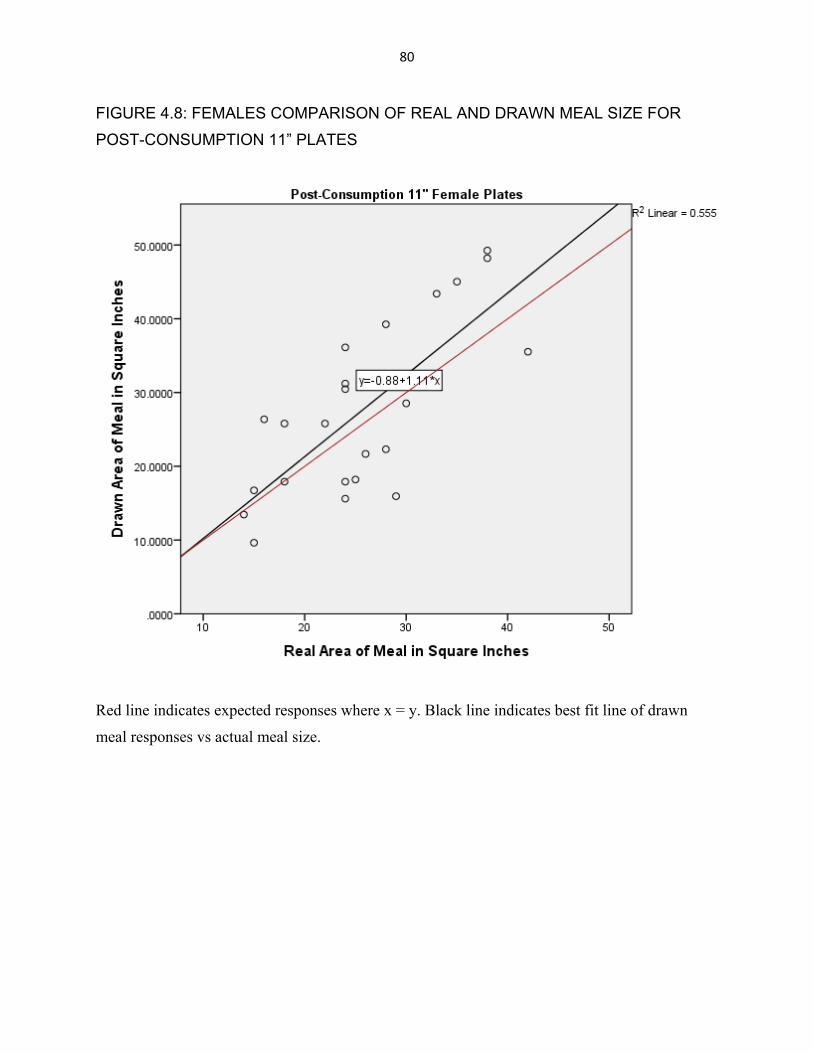
80
FIGURE 4.8: FEMALES COMPARISON OF REAL AND DRAWN MEAL SIZE FOR
POST-CONSUMPTION 11” PLATES
Red line indicates expected responses where x = y. Black line indicates best fit line of drawn
meal responses vs actual meal size.

81
Discussion
This study examined the usefulness of plate mapping as a technique for
representing foods. These findings suggest that students could draw appropriately sized
foods on a paper plate when the plate was the same size as an actual plate of food. The
drawings of the overall meal size and largest course were strongly correlated with actual
meal and food size for identical sized plates, but participants, especially males, had
difficulty drawing appropriately sized food on plates that were larger than the actual
plates even when the food could be observed while they drew. There appears to be an
asymmetrical gender response to plate size as an environmental influence, where men
focus more on their foods looking proportionally appropriate to the provided plate while
women are better at drawing actual portion size. The more correlated meal drawings on
the 9” diameter plates when compared to the larger 11” plates reinforces the concept
that plate size may be an important environmental influence both on how much we
estimate that we will eat as well as how much we estimate that we ate.
While there was no statistically significant difference in the mean overall size of
the actual meals that all participants purchased for lunch, males appeared to be
sensitive to the size of the provided plate when drawing their meals. On average, post-
consumption males provided with 11” plates drew about 5 square inches (p < .01), or
nearly the size of a standard business card, more food than males provided with a 9”
plate. This difference occurred, but to a lesser effect, when the male participant was
able to use his physical meal as a reference and draw prior to eating. This finding
reinforces prior research showing that individuals provided with larger vessels have
82
previously been associated with larger serving food portions (Sobal & Wansink, 2007;
Wadhera & Capaldi-Phillips, 2014; Wansink, 2004).
Applications
It has been suggested that an increase in portion sizes has been associated with
body weight increases (Young & Nestle, 2002; Ledikwe, Ello-Martin, & Rolls, 2005).
Changing plate size may be a potential public health strategy to alter food intake and
influence how much and which types of food a person will serve or is served. Dietary
advice may have the potential to have large social impacts, so strategies that observe
or alter consumption norms should focus on encouraging individuals to eat healthier,
more varied, or lower calorie foods. Reduced portion sizes lead to reduced food intake
(Jeffery et al., 2007; Freedman & Brochado, 2010) and external food cues anchor
individual perceptions of portion size and influence responses (Fedoroff, Polivy, &
Herman, 1997; Jansen & van den Hout, 1991; Koh & Pliner, 2009). Plates are micro-
level built environments that offer visible platescapes (Sobal & Wansink, 2007) for
individuals to use as a base for the size of their food portions and total meal size. Larger
plates may influence the amount and types of foods served onto them, shaping food
intake and nutrient ingestion.
Health workers seeking to gather information about a participant’s dietary
practices may also benefit from understanding potential inaccuracies that arise from
trying to collect data on an unusually sized plate. Attention to plate size and providing
participants with the opportunity to draw an example meal may be useful for examining
meal preferences and the importance of specific foods. This increased knowledge may
offer insights into a person’s views of meal size, food preferences, or meal aversions
83
and provide a culinary starting point for dietary recommendations. This study shows that
asking a person to estimate meal size on a larger than appropriate plate can lead to
overestimated meal sizes even when the meal to be estimated is placed directly in front
of a participant during the drawing task.
Limitations
There are several limitations in this study. Plate mapping is a newly developed
measurement procedure and needs further testing and refinement. A measurement
limitation is that this study did not record self-reported feelings of hunger or satiety
before or after the experiment, leaving open the questions of whether or not hunger
levels influenced the accuracy of drawn meal size in participants pre-consumption or if
levels of satiety influenced the accuracy of drawn meal recall in participants post-
consumption. The use of a college student sample may limit generalizability of these
results to other populations.
Conclusion
Overall, this study found that the technique of plate mapping, where people draw meals
on a paper plate, adequately represents actual meals if the paper plate is the same size
as the actual plate. The similarity of female’s drawings on both same sized and larger
plates suggests that women are less plate sensitive and men are more influenced by
plate size. Future studies are needed to examine caloric differences due to
environmental influences like plate size, and whether health professionals can
manipulate plate size differences to improve positive healthy food choices.
84
References
Cohen J. (1988). Statistical power analysis for the behavioral sciences. 2nd ed. Hillsdale, NJ: Erlbaum
Diliberti, N., Bordi, P.L., Conklin, M.T., Roe, L.S., & Rolls, B.J. (2004). Increased portion size leads to increased intake in a restaurant meal. Obesity Research, 12, 562-568.
Engbers, L.H., van Poppel, M.N., Chin A Paw, M.J., & van Mechelen, W. (2005) Worksite health promotion programs with environmental changes: a systematic review. Am. J. Prev. Med. 29(1):61-70.
Fisher, J.O. & Kral, T.V. (2008). Super-size me: Portion size effects on young children’s eating. Physiology and Behavior, 94, 39-47.
Herman, C. P., & Polivy, J. (1984). A boundary model for the regulation of eating. Res Publ Assoc Res Nerv Ment Dis, 62, 141-156.
Jeffery, R. W., Rydell, S., Dunn, C. L., Harnack, L. J., Levine, A. S., Pentel, P. R.,
Walsh, E. M. (2007). Effects of portion size on chronic energy intake. Int J Behav Nutr Phys Act, 4, 27.
Kallbekken, S., & Sælen, H. (2013) ‘Nudging hotel guests to reduce food waste as a win-win environmental measure. Economics Letters, 119, 325-327.
Ledikwe, J.H., Ello-Martin, J.A., & Rolls, B.J., (2005) Portion sizes and the Obesity
Epidemic. J Nutr, 135(4), 905-909.
Markus, K., & Lin, Chia-Ying, L., (2010) Construct Validity. In Salkind, N. Encyclopedia of Research Design. (229-233) Thousand Oaks, CA: SAGE Publications, Inc.
Pratt, I. S., Croager, E. J., & Rosenberg, M. (2011). The mathematical relationship between dishware size and portion size. Appetite, 58(1), 299-302.
Rolls, B.J., Bell, E.A., & Waugh, B.A. (2000). Increasing the volume of a food by incorporating air affects satiety in men. Am J Clin Nutr. 72, 361-368.
Sharp, D.E. & Sobal, J. (2012). Using plate mapping to examine sensitivity to plate size in food portions and meal composition among college students. Appetite, 59(3), 639-645.
Sharp, D.E., Sobal, J., Wethington, E., & Wansink, B.C. (Submitted). Representations of Dinner Meals vary by the Size of the Plate: Using Plate Mapping to Examine Meal Size and Meal Composition among Adult Men and Women.
Sobal, J., & Wansink, B.C. (2007). Kitchenscapes, tablescapes, platescapes, and foodscapes: Influences of micro-level built environments on food intake. Environ Behav, 39(1), 124-142.
85
Van Ittersum, K.V. & Wansink, B. (2012). Plate size and color suggestibility: The Delboef Illusion’s bias on serving and eating behavior. J Consumer Research, 39, 215-228.
van Kleef, E., Shimizu, M., & Wansink, B. (2011) Serving bowl selection biases the amount of food served. J. Nutr. Educ. Behav. 44(1):66-70.
Wadhera, D., & Capaldi-Phillips, E. D. (2014). A review of visual cues associated with food on food acceptance and consumption. Eat Behav, 15(1), 132-143.
Wansink, B. (2004). Environmental factors that increase the food intake and consumption volume unknowing consumers. Annu Rev Nutr, 24, 455-479.
Young, L.R. & Nestle, M. (2003). Expanding portion sizes in the US marketplace: implications for nutrition counseling. J Am Diet Assoc, 103, 231-234.
86
CHAPTER 5: USING PLATE MAPPING TO EXAMINE PORTION SIZE AND PLATE COMPOSITION FOR LARGE AND SMALL DIVIDED PLATES* *Sharp, D.E., Sobal, J., & Wansink, B. (2014). Using plate mapping to examine portion
size and plate composition for large and small divided plates. Eat Behav, 15(4) 658-663.
Introduction
Food portion size is an important influence upon what people eat and the
nutrients that enter their bodies. Plates are containers for serving and holding foods for
consumption, and the size and shape of plates can influence how much food people put
on their plates. While past studies have only focused on undivided plates, this study
examined how people portrayed meals on different sized divided plates. Moreover, it
expands upon a new method – plate mapping – that offers a potentially useful technique
for the next generation of research involving the serving of food.
Divided plates segregate a plate surface into separate areas using raised ridges.
Plates are objects of material culture into which eating values and norms are physically
inscribed. Most plates are circular, and most divided plates have three compartments.
One compartment is usually larger than the other two, representing social norms of a
core “main course” (often a meat/protein food) plus two secondary “side dishes” (often a
starch food and vegetable food) as represented by the cultural formula for a meal
structure of A+2b (Charles and Kerr, 1988; Douglas, 1972; Murcott, 1982). Divided
plates are also known as compartmentalized, partitioned, or segmented plates, and are
commonly used for feeding children, institutional foodservice, and informal outdoor
eating events. Prior studies have used divided plates and manipulated the size of foods
87
in compartments (Kral, Kabay, Roe, & Rolls, 2012), but have not quantitatively
examined the relationship of divided plate size with conceptions of appropriate food
servings. This study used divided plates to examine how food portions and meal
composition are associated with plate size.
Plate mapping asks participants to accurately draw and label the foods in a meal
on a paper plate (Sharp & Sobal, 2012) to represent their cognitive schema of a
platescape (Sobal & Wansink, 2007). Plate maps project cultural scripts for appropriate
meal portions and sizes of food into plate drawings. Plate mapping has been previously
used among college students (Sharp & Sobal, 2012) to examine plate sensitivity and
plate composition.
Plate sensitivity refers to how people react to different types and sizes of plates.
Research about plate size for non-divided plates shows that people draw bigger
portions of specific foods and bigger overall meal sizes on larger plates (Sharp & Sobal,
2012). Laboratory studies, however, report mixed plate size effects on food serving and
consumption (DeSantis et al., 2013; Koh & Pliner, 2009; Rolls et al.; Shah et al.; Yip et
al.)
Plate composition describes the types of foods on plates as represented by the
number of main and side dishes and the proportions of main and side dishes. Research
about non-divided plate size has shown that people draw bigger main courses and
vegetable portions on larger plates (Sharp & Sobal, 2012).
88
Plate size communicates information about the types and amount of food
expected to be served on and eaten from a plate. Overall, larger plates and other food
containers encourage people to serve and eat more food (Wansink, 2006) and different
types of foods (Sharp and Sobal, 2012). Previous studies of plate size have largely
been conducted in laboratory settings (DiSantis et al., 2013; Koh & Pliner, 2009; Rolls,
Roe, Halverson, & Meengs, 2007; Shah, Schroeder, Winn, & Adams-Huet, 2011; Yip,
Wiessing, Budgett, & Poppitt, 2013), but such direct observational methods are time
consuming, expensive, and involve high response burden for participants. An alternative
procedure for evaluating plate size is “plate mapping” (Sharp & Sobal, 2012).
Gender has been studied in food and eating and shown to have an influence on
both food choices and eating (O’Doherty, Jensen, & Holme, 1999). Men appear to be
less concerned about health and may be more sensitive than women about plate size
when they make food choices, selecting less healthy foods like meats rather than fruits
and vegetables (Rolls, Federoff, & Guthrie, 1991; Wardle et al., 2004). Gender may
operate as a moderating variable in relationships between plate size and the sizes and
types of foods on a plate, with women drawing bigger vegetable portions on larger non-
divided plates (Sharp & Sobal, 2012). A review of previous plate sensitivity articles
suggest that gender moderation has not been well represented in this literature. Koh
and Plinter (2009), Yip et al. (2013), and Shah et al. (2011) all reported results using
female participants while Penaforte et al. (2013) and Wansink, van Ittersum, and Painter
(2006) state their findings from a mixed gender sample without reporting if responses
differed significantly by gender. While Rolls et al. (2007) examined gender and found no
significance in food consumption amounts when plate size was changed, Sharp and
89
Sobal (2012) found that gender differences were significant when estimating expected
meal size.
Divided plates have rarely been studied in food choice research. To fill this gap in
knowledge, we used plate mapping to compare large and small divided plates. We
propose four hypotheses about divided plate sizes and plate mapping 1) plate
sensitivity, 2) meal norms, 3) meal composition (type of food and food course), and 4)
gender moderation.
The plate sensitivity hypothesis posits that people are mindless about portion
size and fill divided plates to capacity, drawing bigger overall meal sizes on larger
divided plates. The plate sensitivity hypothesis proposes that larger plates will be
covered with more food than are smaller plates.
The meal norms hypothesis posits that people draw meals to conform to
normative conceptions about how full a plate should be, filling divided plates to levels
that seem appropriate to the plate size. The meal norms hypothesis proposes that the
same percentage of larger and smaller divided plates will be covered with food.
The meal composition hypothesis posits that plate size influences serving of
different foods in uneven ways. The hypothesis has two parts. The type of food
hypothesis proposes that bigger vegetable dishes will be drawn on larger divided plates.
The food course hypothesis proposes that bigger main courses will be drawn on larger
plates than smaller plates.
The gender moderation hypothesis posits that gender differences occur in plate
size effects upon food choice. The gender moderation hypothesis proposes that men
90
are more sensitive to plate size than are women, with men drawing larger main courses
on plates than women draw on plates.
Methods
Students attending one university course in 2011 and students attending the
same course in 2012 taught by the same instructor were asked to participate in this
study. In 2011 students were asked to draw on a large divided plate and in 2012
students drew on a small divided plate in this quasi-experimental design (Shadish,
Cook, & Campbell, 2001). Each class got plates of only one size to avoid potential
biases if students noticed that plate sizes differed among members of the class.
The large plate had a total outside diameter of 10.25” and a depth of 1”, had a 1”
wide outer rim and the interior dividing ridges of the plate were .25” wide, making the
total usable food area of 52.5 square inches, with 29.5 square inches in the main
compartment and 11.5 square inches in each of the two symmetrical side
compartments. The small plate had a total outside diameter of 9.5” and a depth of .5”,
had a 1” wide outer rim and interior divisions of the plate were .25” wide, making the
total usable food area 43 square inches, with 21.7 square inches in the main
compartment and 10.5 square inches in each of the two symmetrical side
compartments.
At the beginning of class, one paper plate and an attached questionnaire were
given to each student as they entered the classroom. The questionnaire provided
consent information plus demographic questions about age and gender. The
instructions for the plate drawing asked students to “Please accurately draw and label
91
the foods in a meal that you would enjoy eating for dinner tonight. Please be as realistic
as possible with your drawings of the foods” (Appendix C) No images of foods or
examples of drawings were provided to avoid cues that could bias the food drawings
(Tversky & Kahneman, 1974). Each class received one size of plate that was from the
same manufacturer (Chinet, De Soto, Kansas, USA) using the same material, design,
and color to prevent potential biases if students had been given two different sizes or
types of plates in the same classroom. Students were given class time to complete the
plate drawing and questionnaire and turn in their materials. No compensation of course
credit or other forms was given for participation. The University Institutional Review
Board deemed this study exempt.
The researchers were not able to count the exact number of students attending
each class session. The minimum estimated response rate was 76% in 2011 and 64%
in 2012 based on the number of returned plates divided by the number of students
officially registered for the course, although often registered students do not attend
class. Based on researcher observations that 0 unused plates in 2011 and 2 in 2012
were returned after class, the response rate was higher than this minimum. Of the 55
plates returned completed in 2011 and 54 in 2012, 98 (90%) were analyzed after
excluding 4 plates in 2011 and 5 plates in 2012 who did not follow the written protocols.
No plates were excluded because participants were minors under age 18 or omitted
their age in the questionnaire.
The completed plate maps were coded by manually measuring the
circumference of each drawn food on the plate to calculate the size of each separate
food portion, following the procedure of earlier plate mapping studies (Sharp & Sobal,
92
2012). Horizontal food area is an appropriate estimate of food item volume (Pratt,
Croager, & Rosenberg, 2011). Coders were trained, monitored, and checked by double
coding each plate. Sums of all the food portions on each plate were calculated to
represent the total plate area covered to examine the plate sensitivity hypothesis. The
proportion of plate coverage was calculated to examine the meal norms hypothesis.
Food items were coded by food type into the categories of meat, cereal grain,
vegetable, root vegetable and tuber, fruit, legume, dessert, and other to examine the
meal composition hypothesis. Drawn foods that included more than one different food
were classified as the type that included the most calories or took up the most space.
Foods were also coded into categories by size ranging from the largest food in the meal
to the fifth largest, which were used to represent the main course and side courses. The
number of compartments in these plates containing food was also coded.
In this study the independent variable was plate size, and the dependent
outcome variables were meal area, percent of plate covered, food type, and food item
size. Gender was examined as a moderating variable and age was assessed to
characterize the sample.
Analyses first produced descriptive statistics for all variables using percentages
and means + standard deviations. Next, bivariate comparisons of larger and smaller
plates were made using Chi-square and t-tests to examine the plate sensitivity, meal
norms, and plate composition hypotheses. Finally, further bivariate comparisons
between gender, plate size, and the plate drawing variables were performed to examine
the gender moderation hypothesis.
93
Results
A total of 98 plates were included in the analysis. Men drew 32 (33%) plate maps
and women drew 66 (67%) (Table 5.1). Similar numbers of larger plates (n=49, 50%)
and smaller plates (n=49, 50%) were analyzed. The mean age of the sample was about
21 years.
All three compartments on the plates had food drawn in them on 84% (84) of all
plates, 79% (42) among large plates and 79% (41) among small plates. The main
compartment and only one side compartment had food drawn on 12% (12) of plates,
14% (7) of large and 10% (5) of small plates. When the main compartment was facing
the eater, empty compartments occurred on the left side for 5% (5) of plates, 4% (2)
among large plates and 6% (3) among small plates. Empty compartments occurred on
the right side for 8% (4) of the total sample, 2% (1) among large plates and 6% (3)
among small plates. Only the main compartment had food drawn on 2% (2) of all plates,
none among large plates and 4% (2) among small plates. Zero plates included food
drawings in side compartments but not the main compartments.
The plate sensitivity hypothesis that larger plates would elicit larger food area
drawings than smaller plates was supported by these data. The total area of food drawn
on larger plates was 37% bigger than food drawn on smaller plates (Table 5.1).
The meal norms hypothesis that the proportion of plate coverage would be the
same between larger and smaller plates was supported. The percentage of the plate
covered by drawn food was nearly significant between larger and smaller plates (Table
5.1).
94
Overall, 305 different food items were drawn on this sample of 98 plates (Table
5.1). The most frequent food type was vegetables (98), followed by meats (79), and
then cereals (71). Fewer people drew roots (26) or fruits (14), and some drew a variety
of other food types (17). Most people drew three food items, with 98 drawings of the
largest food, 96 the second largest food, and 84 of the third largest food. Only 22 people
drew a fourth food and 3 a fifth food.
The plate composition hypothesis predicted that the food types would differ
between larger and smaller plates, with bigger vegetable portions and bigger main
courses on larger plates, and the hypothesis was supported by the data. The area
covered by drawn vegetables was 46% (3.4 square inches) bigger on large plates than
small plates, but the drawn areas of meats, cereals, and root vegetables did not differ
significantly between large and small plates (Table 5.1). Food items sizes differed
significantly between large and small plates, with the largest food 35% (4.2 square
inches) bigger on large plates, the second largest food 38% (2.1 square inches) bigger,
and third largest food 25% (1.4 square inches) bigger (Table 5.1).
The gender moderation hypothesis predicted that men would be more sensitive
to plate size, especially main courses. There were no significant differences between
men and women in total food area or proportion of plate covered for large and small
plates. No significant gender differences occurred in food item size or most food types,
except for meat on large plates (Table 5.2). Men drew 50% bigger meat portions (15.4
square inches) than women drew (10.3 square inches) on large plates, but there were
no significant gender differences in food item sizes drawn on small plates. Comparing
each gender between plates, we observed that men and women both drew bigger

95
overall dinners on larger plates with a majority of the difference in size occurring in the
largest plate compartment on the dish. Men drew significantly larger meat and
vegetable portions when controlling for plate size and women drew significantly larger
vegetable portions (Table 5.2).
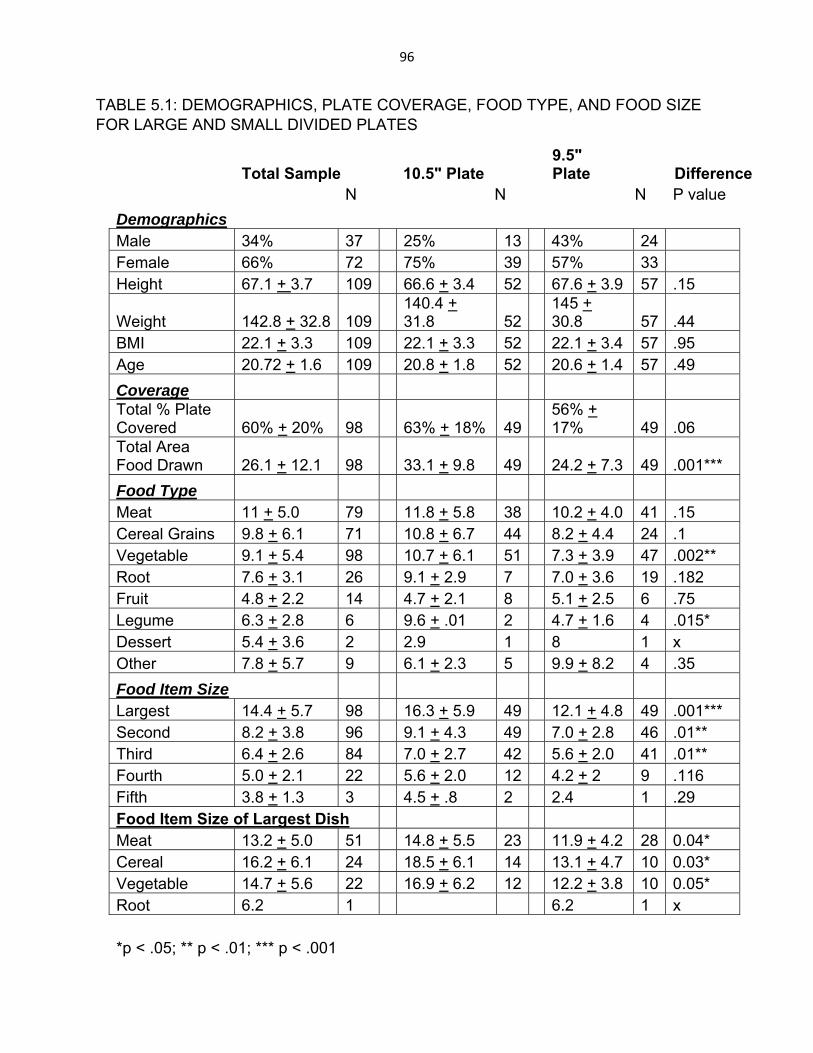
96
TABLE 5.1: DEMOGRAPHICS, PLATE COVERAGE, FOOD TYPE, AND FOOD SIZE FOR LARGE AND SMALL DIVIDED PLATES
Total Sample 10.5" Plate 9.5" Plate Difference
N N N P value
Demographics Male 34% 37 25% 13 43% 24 Female 66% 72 75% 39 57% 33 Height 67.1 + 3.7 109 66.6 + 3.4 52 67.6 + 3.9 57 .15
Weight 142.8 + 32.8 109 140.4 + 31.8 52
145 + 30.8 57 .44
BMI 22.1 + 3.3 109 22.1 + 3.3 52 22.1 + 3.4 57 .95 Age 20.72 + 1.6 109 20.8 + 1.8 52 20.6 + 1.4 57 .49
Coverage Total % Plate Covered 60% + 20% 98 63% + 18% 49
56% + 17% 49 .06
Total Area Food Drawn 26.1 + 12.1 98 33.1 + 9.8 49 24.2 + 7.3 49 .001***
Food Type Meat 11 + 5.0 79 11.8 + 5.8 38 10.2 + 4.0 41 .15 Cereal Grains 9.8 + 6.1 71 10.8 + 6.7 44 8.2 + 4.4 24 .1 Vegetable 9.1 + 5.4 98 10.7 + 6.1 51 7.3 + 3.9 47 .002** Root 7.6 + 3.1 26 9.1 + 2.9 7 7.0 + 3.6 19 .182 Fruit 4.8 + 2.2 14 4.7 + 2.1 8 5.1 + 2.5 6 .75 Legume 6.3 + 2.8 6 9.6 + .01 2 4.7 + 1.6 4 .015* Dessert 5.4 + 3.6 2 2.9 1 8 1 x Other 7.8 + 5.7 9 6.1 + 2.3 5 9.9 + 8.2 4 .35
Food Item Size Largest 14.4 + 5.7 98 16.3 + 5.9 49 12.1 + 4.8 49 .001*** Second 8.2 + 3.8 96 9.1 + 4.3 49 7.0 + 2.8 46 .01** Third 6.4 + 2.6 84 7.0 + 2.7 42 5.6 + 2.0 41 .01** Fourth 5.0 + 2.1 22 5.6 + 2.0 12 4.2 + 2 9 .116 Fifth 3.8 + 1.3 3 4.5 + .8 2 2.4 1 .29 Food Item Size of Largest Dish Meat 13.2 + 5.0 51 14.8 + 5.5 23 11.9 + 4.2 28 0.04* Cereal 16.2 + 6.1 24 18.5 + 6.1 14 13.1 + 4.7 10 0.03* Vegetable 14.7 + 5.6 22 16.9 + 6.2 12 12.2 + 3.8 10 0.05* Root 6.2 1 6.2 1 x *p < .05; ** p < .01; *** p < .001
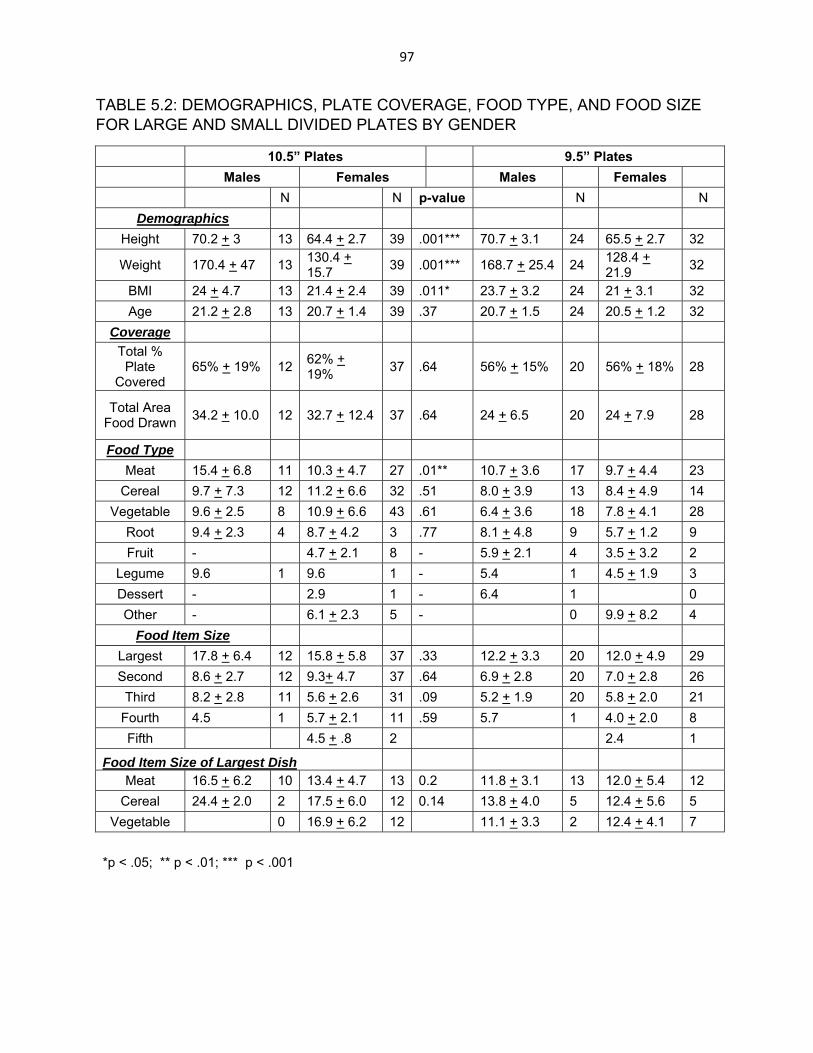
97
TABLE 5.2: DEMOGRAPHICS, PLATE COVERAGE, FOOD TYPE, AND FOOD SIZE FOR LARGE AND SMALL DIVIDED PLATES BY GENDER
10.5” Plates 9.5” Plates
Males Females Males Females
N N p-value N N
Demographics
Height 70.2 + 3 13 64.4 + 2.7 39 .001*** 70.7 + 3.1 24 65.5 + 2.7 32
Weight 170.4 + 47 13 130.4 + 15.7
39 .001*** 168.7 + 25.4 24 128.4 + 21.9
32
BMI 24 + 4.7 13 21.4 + 2.4 39 .011* 23.7 + 3.2 24 21 + 3.1 32
Age 21.2 + 2.8 13 20.7 + 1.4 39 .37 20.7 + 1.5 24 20.5 + 1.2 32
Coverage
Total % Plate
Covered 65% + 19% 12
62% + 19%
37 .64 56% + 15% 20 56% + 18% 28
Total Area Food Drawn
34.2 + 10.0 12 32.7 + 12.4 37 .64 24 + 6.5 20 24 + 7.9 28
Food Type
Meat 15.4 + 6.8 11 10.3 + 4.7 27 .01** 10.7 + 3.6 17 9.7 + 4.4 23
Cereal 9.7 + 7.3 12 11.2 + 6.6 32 .51 8.0 + 3.9 13 8.4 + 4.9 14
Vegetable 9.6 + 2.5 8 10.9 + 6.6 43 .61 6.4 + 3.6 18 7.8 + 4.1 28
Root 9.4 + 2.3 4 8.7 + 4.2 3 .77 8.1 + 4.8 9 5.7 + 1.2 9
Fruit - 4.7 + 2.1 8 - 5.9 + 2.1 4 3.5 + 3.2 2
Legume 9.6 1 9.6 1 - 5.4 1 4.5 + 1.9 3
Dessert - 2.9 1 - 6.4 1 0
Other - 6.1 + 2.3 5 - 0 9.9 + 8.2 4
Food Item Size
Largest 17.8 + 6.4 12 15.8 + 5.8 37 .33 12.2 + 3.3 20 12.0 + 4.9 29
Second 8.6 + 2.7 12 9.3+ 4.7 37 .64 6.9 + 2.8 20 7.0 + 2.8 26
Third 8.2 + 2.8 11 5.6 + 2.6 31 .09 5.2 + 1.9 20 5.8 + 2.0 21
Fourth 4.5 1 5.7 + 2.1 11 .59 5.7 1 4.0 + 2.0 8
Fifth 4.5 + .8 2 2.4 1
Food Item Size of Largest Dish
Meat 16.5 + 6.2 10 13.4 + 4.7 13 0.2 11.8 + 3.1 13 12.0 + 5.4 12
Cereal 24.4 + 2.0 2 17.5 + 6.0 12 0.14 13.8 + 4.0 5 12.4 + 5.6 5
Vegetable 0 16.9 + 6.2 12 11.1 + 3.3 2 12.4 + 4.1 7
*p < .05; ** p < .01; *** p < .001
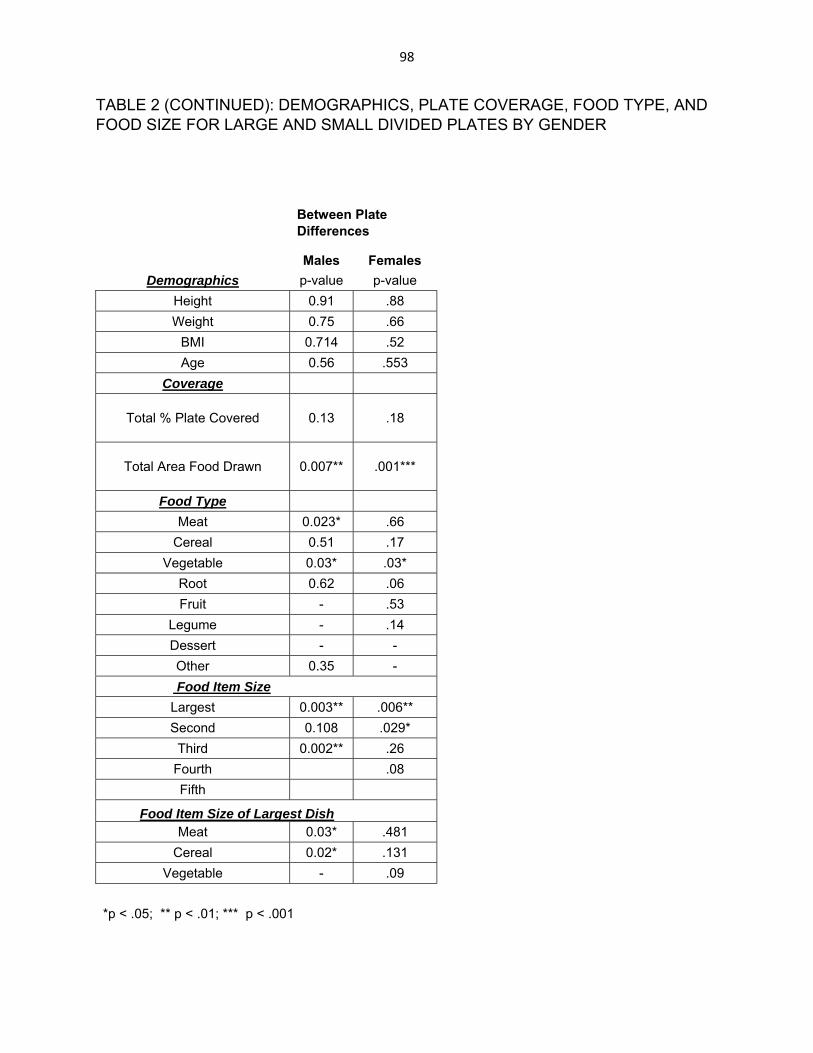
98
TABLE 2 (CONTINUED): DEMOGRAPHICS, PLATE COVERAGE, FOOD TYPE, AND FOOD SIZE FOR LARGE AND SMALL DIVIDED PLATES BY GENDER
Between Plate Differences
Males Females
Demographics p-value p-value
Height 0.91 .88
Weight 0.75 .66
BMI 0.714 .52
Age 0.56 .553
Coverage
Total % Plate Covered 0.13 .18
Total Area Food Drawn 0.007** .001***
Food Type
Meat 0.023* .66
Cereal 0.51 .17
Vegetable 0.03* .03*
Root 0.62 .06
Fruit - .53
Legume - .14
Dessert - -
Other 0.35 -
Food Item Size Largest 0.003** .006**
Second 0.108 .029*
Third 0.002** .26
Fourth .08
Fifth
Food Item Size of Largest Dish Meat 0.03* .481
Cereal 0.02* .131
Vegetable - .09
*p < .05; ** p < .01; *** p < .001
99
Discussion
Plates are common in many meals, and they may influence what and how much
food people eat and their subsequent calorie and nutrient intake. We studied divided
plates and found that their size was associated with drawn food portion sizes and types.
The plate sensitivity hypothesis was supported for divided plates. This may be
explained by the DelBoeuf illusion where an object appears smaller when surrounded
by larger items (Van Ittersum & Wansink, 2012; Wansink, Painter, & North 2005), with
foods looking larger when they are on a smaller plate. While plates were covered with
about the same percent of food, the larger plates held on average about 9.5” in2 more
food on them. In drawing bigger overall amounts of food, our large plate participants
reinforce how environmental cues can be relevant when discussing food and nutrition
The meal norms hypothesis was supported for divided plates. People appear to
cover about the same proportion of larger and smaller plates with drawn foods. This
makes the plates appear contextually similar while offering differently sized meals.
The meal composition hypothesis was supported for divided plates. Larger plates
had bigger main courses and vegetable dishes on them, congruent with prior studies of
undivided plates (Sharp & Sobal, 2011). The overall larger vegetable dishes was
primarily influenced by the high proportion of females in the sample, with women having
more favorable attitudes toward vegetables and consuming them more often (Baker &
Wardle, 2003; Emanuel, McCully, Gallagher, & Updegraff, 2012). In a similar fashion,
100
the significant difference in predicted meat dish size in men across plate sizes is a topic
that would benefit from additional scrutiny.
The gender moderation hypothesis was partially supported for divided plates.
Men drew bigger meat portions on larger plates but no other significant food size
differences were seen in this sample. When selecting foods, men with larger plates
predominantly drew meat dishes in the main compartment, with 83% electing to do so.
Women drawing on larger plates were more varied with meat, cereal, and vegetable
dishes each being drawn as the main compartment dish about 33% of the time. This
suggests the men in our study who were given large plates considered meat to be a
main course and vegetables to be a side dish while women given large plates were
more willing to use meat as a side dish and vegetables as a main course.
When comparing the largest foods on each plate, we found that individuals given
the larger plates drew significantly bigger foods in the main compartment than
individuals given the smaller plates. This size difference was also significant after
controlling for gender. There may be a priming effect (Levitsky, Iyer, & Pacanowski,
2012) of larger plates that elicits bigger estimated portions than smaller plates even in
the absence of any other tangible food cues.
Plate mapping was useful in examining plate size differences for divided plates.
Participants quickly and inexpensively drew plate maps, and very few did not produce
usable maps. Plate mapping may be a useful addition to other forms of dietary
assessment (Gibson, 2005).
101
Comparing the findings of the present study of plate mapping on divided plates to
prior data about plate mapping using non-divided open plate formats (Sharp & Sobal,
2012) revealed several differences in food choices between these two plate types in
college students. Divided plates had more plate sensitivity, with a 1 inch difference in
divided plate size diameter (equivalent to a 9.5 inches2 area increase in overall size)
producing the same increase in overall meal size (8.9 inches2 versus 10 inches2) on
divided than open plates with a 2 inch difference in diameter (equivalent to a 23 inches2
increase in overall area). Divided plates exhibited more meal norm effects, with 52% of
divided plate participants producing an A+2b format drawing compared to 36% of open
plate participants drawing meals fitting the A+2b meal format. Divided plates had more
meal composition differences, with the 84% of divided plate participants drawing at least
three food items compared to 73% of open plates, and 96% of divided plates having at
least two food items compared with 86% of open plates. With divided plates there was a
significant difference in the size of meat and vegetables on large plates when gender
was controlled, while on open plates there was no difference in the size of meats but
there were gender differences in the size of vegetables drawn.
There were several limitations of this study. The quasi-experimental design was
not as strong as a randomized controlled trial or cross-over design. Plate mapping is a
newly developed measurement procedure and needs further testing and refinement.
The sample was small, included only students, and had few men. Future studies should
use different designs, measures, and samples to more fully understand divided plates,
plate sizes, and food choices. There are also a number of cultural issues that could be
explored. A study of plating preferences of Americans, Italians, and Japanese showed a
102
wide range of how many items they preferred to have on their plate as well as the
preferred location of main courses (meat) compared to side dishes (Zampollo, Wansink,
Kniffin, Shimizu, & Omori, 2012). A similar study involving parents and children showed
that the children prefer the plating of food that has multiple separate piles of food (such
as two small piles of each item instead of one larger pile) which do not touch each other
(Zampollo, Kniffin, Wansink, & Shimizu, 2012).
Implications of these findings for practice suggest that changing plate size and
compartmentalization may modify meal size and composition. Plates are micro-level
built environments that offer visible platescapes (Sobal & Wansink, 2007) where people
construct meals. The size and format of plates may influence the amount and types of
foods served, shaping food intake and nutrient ingestion. Some have recommended
that reducing plate size may be used to manage body weight (e.g. Story & French,
2002), and divided plates may encourage selection and consumption of more distinct
foods which leads to less food consumption and weight loss (Chang et al., 2012).
However, further experimental studies are needed to support implementation of plate
sizes and formats as interventions. For instance, compartmentalization might be a
successful way to introduce children to a wider range of foods and to give meals an
element of challenge to clean one’s plate in a more discrete manner than if it is one
larger group of food (Zampollo et al.).
In conclusion, this study replicated prior use of plate mapping, with many similar
findings. Use of divided plates adds information about that type of plate design to the
literature, and suggests that divided plates may have some different influences on food
choices than non-divided plates.
103
References
Baker, A.H., & Wardle, J. (2003). Sex differences in fruit and vegetable intake in older adults. Appetite, 40, 269-275.
Chang, U.J., Suh, H.J., Yang, S.O., Hong, Y.H., Kim, Y.S., Kim, J.M., & Jung, E.Y. (2012). Distinct foods with smaller unit would be an effective approach to achieve sustainable weight loss. Eating Behaviors, 13, 74-77.
Charles, N., & Kerr, M. (1988). Women, food and families. Manchester UK: Manchester University Press.
DiSantis, K.I., Birch, L.L., Davey, A., Serrano, E.L., Zhang, J., Bruton, Y., & Fisher, J.O. (2013). Plate size and children’s appetite: Effects of larger dishware on self-served portions and intake. Pediatrics, 131(5), 1-8.
Douglas, M. (1972). Deciphering a meal. Daedalus, 101(1), 61-81.
Emanuel, A.S., McCully, S.N., Gallagher, K.M., & Updegraff, J.A. (2012). Theory of planned behavior explains gender difference in fruit and vegetable consumption. Appetite, 59, 693-697.
Gibson, R.S. (2005). Principles of Nutritional Assessment. 2nd Ed. Oxford, UK: Oxford University Press.
Koh, J., & Pliner, P. (2009). The effects of degree of acquaintance, plate size, and sharing on food intake. Appetite, 52, 595-602.
Kral, T., Kabay, A.C., Roe, L.S., & Rolls, B.J. (2010). Effects of doubling the portion size of fruit and vegetable side dishes on children’s intake at a meal. Obesity, 8, 521-527.
Levitsky, D.A., Iyer, S., & Pacanowski, C.R. (2012). Number of foods available at a meal determines the amount consumed. Eating Behaviors, 13, 183-187.
Murcott, A. (1982). On the social significance of the “cooked dinner” in South Wales. Social Science Information, 21(4/5), 671-695.
O’Doherty Jensen, K., & Holme, L. (1999). Preferences, quantities, and concerns: Sociocultural perspectives on the gendered consumption of foods. European Journal of Clinical Nutrition, 53(5), 351-359.
Penaforte, F.R.O., Japur, C.C., Diez-Garcia, R.W., Hernandez, J.C., Palmma-Linares, I., & Chiarello, P.G., (2013). Plate size does not affect perception of food portion size. Journal of Human Nutrition and Dietetics. doi:10.1111/jhn.12111
104
Pratt, I.S., Croager, E.J., & Rosenberg, M. (2011). The mathematical relationship between dishware size and portion size. Appetite, 58(1), 299-302.
Robinson, E., Nolan, S., Tudur-Smith, C., Boyland, E.J., Harrold, J.A., Hardman, C.A., & Halford, J.C. (2014). Will smaller plates lead to smaller waists? A systematic review and meta-analysis of the effect that experimental manipulation of dishware size has on energy consumption. Obes Rev, 15(10):812-821.
Rolls, B.J., Fedoroff, I.C., & Guthrie, J.F. (1991). Gender differences in eating behavior and body weight regulation. Health Psychology, 10(2), 133-142.
Rolls, B.J., Roe, L.S., Halverson, K.H., & Meengs, J.S. (2007). Using a smaller plate did not reduce energy intake at meals. Appetite, 49, 652-660.
Shadish, W.R., Cook, T.D., & Campbell, D.T. (2001). Experimental and quasi-experimental designs for generalized causal inference. New York: Wadsworth.
Shah, M., Schroeder, R., Winn, W., & Adams-Huet, B. (2011). A pilot study to investigate the effect of plate size on meal energy in normal weight and overweight/obese women. Journal of Human Nutrition and Dietetics, 24, 612-615.
Sharp, D., & Sobal, J. (2012). Using plate mapping to examine sensitivity to plate size in food portions and meal composition. Appetite, 59, 639-645.
Sobal, J., & Wansink, B. (2007). Kitchenscapes, tablescapes, platescapes, and foodscapes: Influences of microscale built environments on food intake. Environment and Behavior, 39(1), 124-142.
Story, M., Neumark-Sztainer, D., & French, S. (2002). Individual and environmental influences on adolescent eating behaviors. Journal of the American Dietetic Association, 102(Supplement 3), S40-S51.
Tversky, A., & Kahneman, D. (1974). Judgement under uncertainty: Heuristics and biases. Science, 185, 1124-1130.
Van Ittersum, K., & Wansin, B. (2012). Plate size and color suggestibility: The DelBoeuf Illusion’s bias on serving and eating behavior. Journal of Consumer Research, 39(2), 215-228.
Wansink, B. (2006). Mindless eating: Why we eat more than we think. New York: Bantam.
Wansink, B., van Ittersum, K., & Painter, J., (2006). Ice Cream Illusions: Bowls, Spoons, and Self-Served Portion Sizes. American Journal of Preventative Medicine, 31(3), 240-243.
105
Wansink, B., Painter, J.E., & North, J. (2005). Bottomless bowls: Why visual cues of portion size may influence food intake. Obesity, 13(1), 93-100.
Wardle, J., Haase, A.M., Steptoe, A., Nillapun, M., Jonwutiwes, K., & Bellisle, F. (2004). Gender differences in food choice: The contribution of health beliefs and dieting. Annals of Behavioral Medicine, 27(2), 107-116.
Yip, W., Wiessing, K.R., Budgett, S., & Poppitt, S.D. (2013). Using a smaller dining plate does not suppress food intake from a buffet lunch meal in overweight, unrestrained women. Appetite, 69, 102-107.
Zampollo, F., Wansink, B., Kniffin, K., Shimizu, M., and Omori, A., (2012a). Looks Good Enough to Eat: How Food Plating Preferences Differ Across Cultures and Continents. Cross-Cultural Research, 46:1, 31-49.
Zampollo, F., Kniffin, K., Wansink, B., Shimizu, M., (2012b), Food Plating Preferences of Children: The Importance of Presentation on Desire for Diversity. Acta Paediatrica, 101:1, 61-66.

106
CHAPTER 6: CONCLUSION
Several important relationships between plate size and portion size were seen
through the lens of plate mapping. When provided a larger plate, participants
consistently drew more food on average than those given smaller plates. This occurred
whether the participants were asked to estimate the size of a meal they were going to
eat later that day, to estimate the size of a meal in front of them that they were about to
consume, or to estimate the size of a meal that they had just consumed. The biggest
food item on the plate was usually greater in size when drawn on the larger 11” plate.
Men appeared to be more sensitive than women to the size of the plate and often
provided less accurate meal drawings on a larger plate for the meal that they had just
eaten or were about to eat. Men also drew much larger meals that they intended to eat
that night than women did on 11” plates, while men who were given the smaller 9”
plates drew similar sized meals to those drawn by women. There also was a gendered
difference in the types of foods drawn on 11” plates as women often increased the size
of their vegetable portions while men did not.
Knowledge gained from using plate mapping links health-related factors to the
nutrition literature. By illustrating how plate size and gender can modify the types and
amounts of food an individual expects to put on their plate, this research provides
insights about potential mechanism’s in the relationship between portion size and
consumption size. Plate mapping research also increases understanding of
relationships of environmental influences with food portion sizes and reinforces the
understanding the environment can be used in favor of or opposed to healthy food
choices. Gaining a better understanding of the mechanisms and processes that
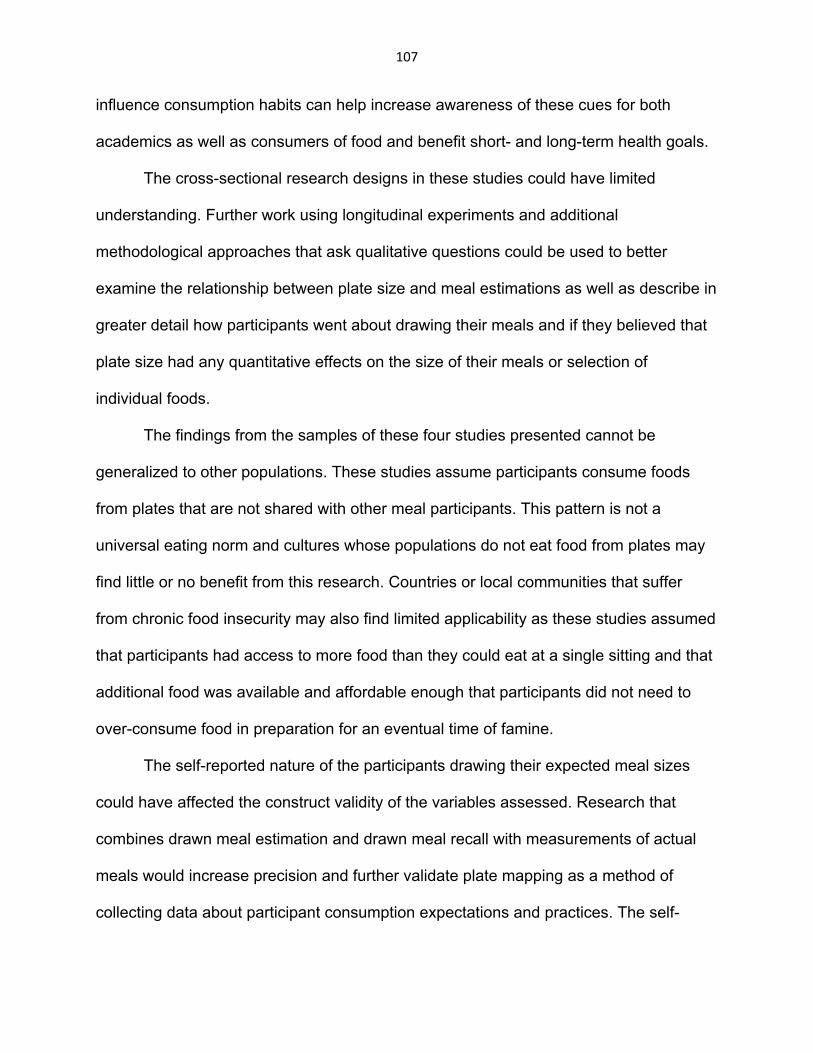
107
influence consumption habits can help increase awareness of these cues for both
academics as well as consumers of food and benefit short- and long-term health goals.
The cross-sectional research designs in these studies could have limited
understanding. Further work using longitudinal experiments and additional
methodological approaches that ask qualitative questions could be used to better
examine the relationship between plate size and meal estimations as well as describe in
greater detail how participants went about drawing their meals and if they believed that
plate size had any quantitative effects on the size of their meals or selection of
individual foods.
The findings from the samples of these four studies presented cannot be
generalized to other populations. These studies assume participants consume foods
from plates that are not shared with other meal participants. This pattern is not a
universal eating norm and cultures whose populations do not eat food from plates may
find little or no benefit from this research. Countries or local communities that suffer
from chronic food insecurity may also find limited applicability as these studies assumed
that participants had access to more food than they could eat at a single sitting and that
additional food was available and affordable enough that participants did not need to
over-consume food in preparation for an eventual time of famine.
The self-reported nature of the participants drawing their expected meal sizes
could have affected the construct validity of the variables assessed. Research that
combines drawn meal estimation and drawn meal recall with measurements of actual
meals would increase precision and further validate plate mapping as a method of
collecting data about participant consumption expectations and practices. The self-
108
reported drawings may provide an additional avenue of nutrition intervention as health
educators could use this method as an ice-breaker activity to warm up to participants
and get them thinking about food and food choices.
It would be useful to pursue this vein of research and examine plate mapping in a
more physical manifestation. Designing a series of incremental plate size interventions
to examine a more subtle form of plate size manipulations than the larger step-wise
versions previously published (Rolls et al., 2007; Shah et al., 2011; Libotte, Siegrist, &
Bucher, 2014; Robinson et al., 2014) may reduce a participant’s recognition of or
resistance to meal size changes. Complimentary qualitative research that asks
participants to review and explain their plate drawings may provide an increased
understanding of and help construct a narrative of how portion and meal sizes were
estimated.
Better understanding the effects of plate size on food portion and overall meal
size may not only help explain our nation’s current struggle with overweight and obesity
related health issues but may also lead to the creation of more accurate nutrition
research and more effective and more personalized nutrition interventions for dieticians
and nutrition educators. Researchers who are aware of the environmental effects of
micro-built environments (Sobal & Wansink, 2007) such as plate size can specify and
control these mechanisms in their research to increase the accuracy of their results.
In similar fashion, dieticians and other nutrition and health educators can
highlight plate size in nutrition and health programs as one of many small or “effortless”
behavioral nudges that could have noticeable long-term benefits for health. As package
size and serving sizes have increased due to reduced manufacturing costs and
109
increased product availability, it is possible that these much larger food items have led
to an increase in our own perceptions of how much food is required to become sated
(Poothullil, 2002). By incorporating plate size changes into the education narrative
alongside with portion size changes, participants may become more aware of the
relationship between the environmental and consumption norms and actively seek to rid
themselves of these small but important obesogenic influences. While behavioral
choices, such as how much food to put on the plate, have to be made at every meal,
changing the environment, such as replacing a large plate set with a more moderate
one, needs to only be done once.
Change may also come from commercial operations that are not typically
discussed when considering potential nutrition interventions such a large department
and housewares stores. For example, there has been a 36% increase in the diameter of
the American dinner plate in recent decades (Wansink, 2006). This size increase
represents a doubling of the overall area of the plate available to place food on (about
65 inches squared vs. about 113 inches squared). Having double the space means that
double the calories can be served on the larger plates before they are full to capacity.
While the case has not been made that individuals have doubled their caloric intake
based on the area available on plates, the research reported here suggests that, in
general, larger 11” plates would influence the amount of self-serving that is greater than
on the smaller 9” plates. That difference may be as small as 60 calories per dinner, but
if only the 9” dinner plates that our parents or grandparents used were available for
purchase at department stores, an individual could potentially reduce an their caloric
intake by 10,950 calories or about 3 pounds per year.
110
This work also reinforces how broad and multidisciplinary nutrition
research and nutrition interventions can be and contributes to the field of nutrition by
increasing our knowledge of individual perceptions of food size and presentations of a
meal. It also provides information about how individuals estimate meal size before,
during, and after a meal in order to better understand meal projection and recall. Using
easily integrated environmental changes, dietary advice, and graphics similar to the
MyPlate icon could reinforce nutrition education messages with visual representations
and provide a better understanding of meal preferences while encouraging more
appropriate eating habits. Dietary advice may have the capacity to lead to large social
impacts, and these results suggest strategies designed to encourage individuals to eat
a healthier, more varied, or lower calorie diet may benefit from involving plate size and
design.
While many people look for a pill or diet program that would improve our nation’s
health profile, it is possible that a series of smaller, less newsworthy changes to culture,
environment, physical activity, education, and behavior may provide the motivation and
capacity for individuals to control their expanding waistlines. Understanding the causes
of our current unhealthy population are vital to being able to promote solutions rather
than just making assumptions. This research about plate mapping provides a unique but
important step in the drive towards reducing mindless overconsumption and improving
our national short- and long-term health goals.
111
References:
Libotte E., Siegrist M., Bucher T., (2014). The influence of plate size on meal composition. Literature review and experiment. Appetite, (82)91-96.
Poothullil, J.M., (2002). Role of oral sensory signals in determining meal size in lean women. Nutrition. 18:479-483.
Robinson, E., Nolan, S., Tudur-Smith, C., Boyland, E.J., Harrold, J.A., Hardman, C.A., & Halford, J.C. (2014). Will smaller plates lead to smaller waists? A systematic review and meta-analysis of the effect that experimental manipulation of dishware size has on energy consumption. Obes Rev, 15(10):812-821.
Rolls, B.J., Roe, L.S., Halverson, K.H., & Meengs, J.S. (2007). Using a smaller plate did not reduce energy intake at meals. Appetite, 49, 652-660.
Shah, M., Schroeder, R., Winn, W., & Adams-Huet, B. (2011). A pilot study to investigate the effect of plate size on meal energy in normal weight and overweight/obese women. Journal of Human Nutrition and Dietetics, 24, 612-615.
Sobal, J., & Wansink, B. (2007). Kitchenscapes, tablescapes, platescapes, and foodscapes: Influences of microscale built environments on food intake. Environment and Behavior, 39(1), 124-142.
Wansink, B. (2006). Mindless eating: Why we eat more than we think. New York: Bantam.
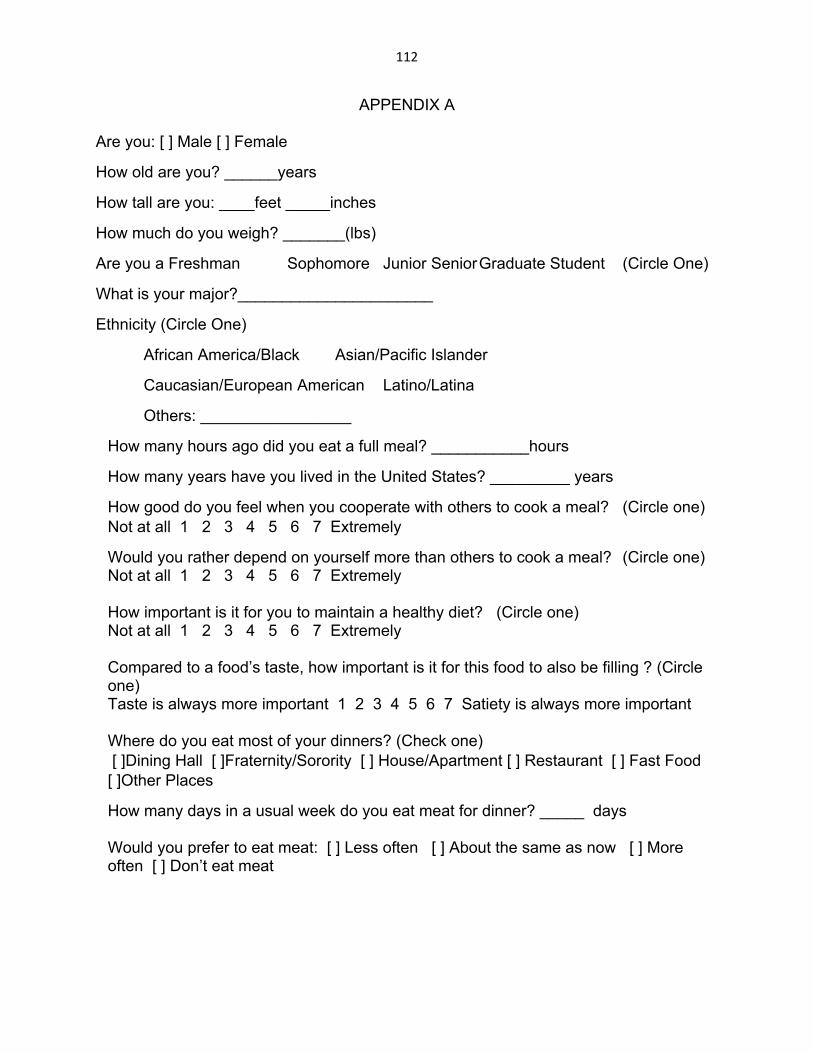
112
APPENDIX A
Are you: [ ] Male [ ] Female
How old are you? ______years
How tall are you: ____feet _____inches
How much do you weigh? _______(lbs)
Are you a Freshman Sophomore Junior Senior Graduate Student (Circle One)
What is your major?______________________
Ethnicity (Circle One)
African America/Black Asian/Pacific Islander
Caucasian/European American Latino/Latina
Others: _________________
How many hours ago did you eat a full meal? ___________hours
How many years have you lived in the United States? _________ years
How good do you feel when you cooperate with others to cook a meal? (Circle one) Not at all 1 2 3 4 5 6 7 Extremely
Would you rather depend on yourself more than others to cook a meal? (Circle one) Not at all 1 2 3 4 5 6 7 Extremely How important is it for you to maintain a healthy diet? (Circle one) Not at all 1 2 3 4 5 6 7 Extremely Compared to a food’s taste, how important is it for this food to also be filling ? (Circle one) Taste is always more important 1 2 3 4 5 6 7 Satiety is always more important Where do you eat most of your dinners? (Check one) [ ]Dining Hall [ ]Fraternity/Sorority [ ] House/Apartment [ ] Restaurant [ ] Fast Food [ ]Other Places
How many days in a usual week do you eat meat for dinner? _____ days Would you prefer to eat meat: [ ] Less often [ ] About the same as now [ ] More often [ ] Don’t eat meat

113
On the provided plate we would like you to accurately draw and label the foods in a meal that you would enjoy eating for dinner tonight. Be as realistic as
possible with the sizes of your food drawings. Thank you for your participation.

114
APPENDIX B
Are you: [ ] Male [ ] Female
How old are you? ______years
How tall are you: ____feet _____inches
How much do you weigh? _______(lbs)
Are you a Freshman Sophomore Junior Senior Graduate Student (Circle One)
Please accurately draw and label the foods in the meal that you have just
consumed. Please be as realistic as possible with the sizes of the foods on your plate.
Thank you for your participation.

115
Are you: [ ] Male [ ] Female
How old are you? ______years
How tall are you: ____feet _____inches
How much do you weigh? _______(lbs)
Are you a Freshman Sophomore Junior Senior Graduate Student (Circle One)
Please accurately draw and label the foods in the meal that you are about to consume. Please be as realistic as possible with the sizes of the foods on
your plate. Thank you for your participation.

116
APPENDIX C
Please tell us about yourself!
Last 4 digits of your student ID __________
Are you: [ ] Male [ ] Female
How old are you? ______years
How tall are you: ____feet _____inches or ____________centimeters
How much do you weigh? _______(lbs)
Are you a Freshman Sophomore Junior Senior Graduate Student (Circle One)
What is your major?______________________
What is your Ethnicity?____________________
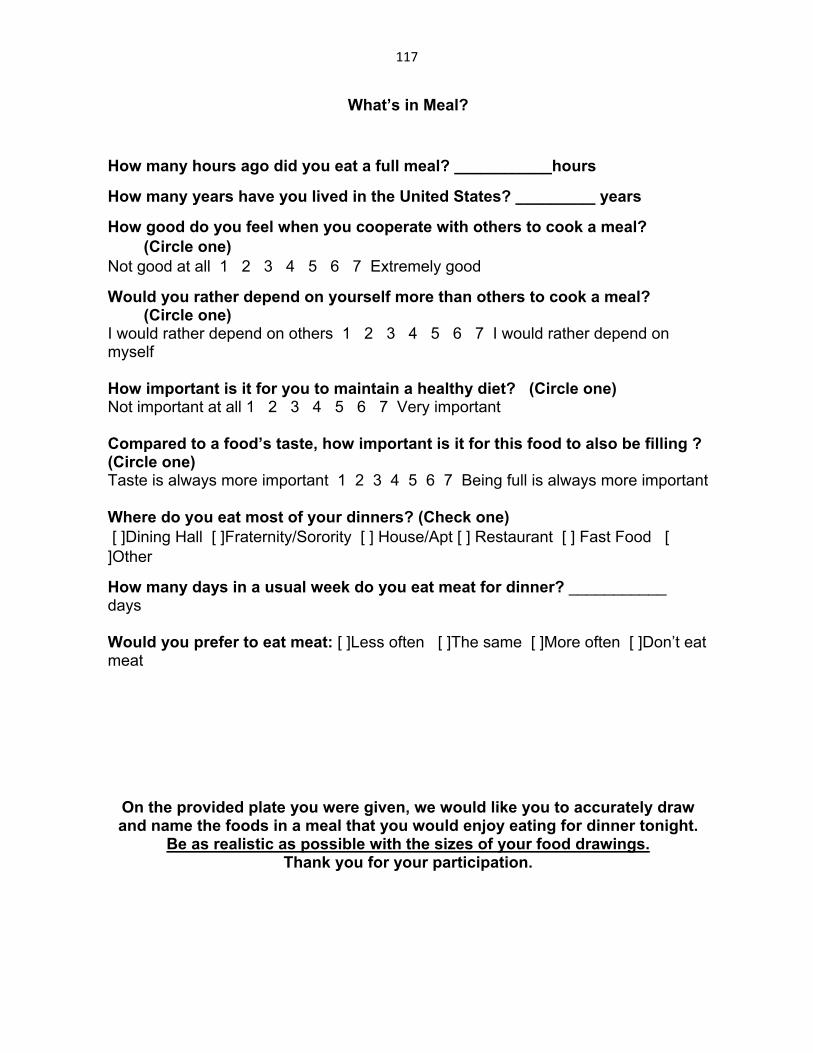
117
What’s in Meal?
How many hours ago did you eat a full meal? ___________hours
How many years have you lived in the United States? _________ years
How good do you feel when you cooperate with others to cook a meal? (Circle one) Not good at all 1 2 3 4 5 6 7 Extremely good
Would you rather depend on yourself more than others to cook a meal? (Circle one) I would rather depend on others 1 2 3 4 5 6 7 I would rather depend on myself How important is it for you to maintain a healthy diet? (Circle one) Not important at all 1 2 3 4 5 6 7 Very important Compared to a food’s taste, how important is it for this food to also be filling ? (Circle one) Taste is always more important 1 2 3 4 5 6 7 Being full is always more important Where do you eat most of your dinners? (Check one) [ ]Dining Hall [ ]Fraternity/Sorority [ ] House/Apt [ ] Restaurant [ ] Fast Food [ ]Other
How many days in a usual week do you eat meat for dinner? ___________ days Would you prefer to eat meat: [ ]Less often [ ]The same [ ]More often [ ]Don’t eat meat
On the provided plate you were given, we would like you to accurately draw and name the foods in a meal that you would enjoy eating for dinner tonight.
Be as realistic as possible with the sizes of your food drawings. Thank you for your participation.