plasma processing of cellulose surfaces and their interactions ...
211
PLASMA PROCESSING OF CELLULOSE SURFACES AND THEIR INTERACTIONS WITH FLUIDS A Dissertation Presented to The Academic Faculty by Balamurali Balu In Partial Fulfillment of the Requirements for the Degree Doctor of Philosophy in the School of Chemical & Biomolecular Engineering Georgia Institute of Technology December 2009 COPYRIGHT 2009 BY BALAMURALI BALU
-
Upload
khangminh22 -
Category
Documents
-
view
0 -
download
0
Transcript of plasma processing of cellulose surfaces and their interactions ...
PLASMA PROCESSING OF CELLULOSE SURFACES AND THEIR
INTERACTIONS WITH FLUIDS
A Dissertation Presented to
The Academic Faculty
by
Balamurali Balu
In Partial Fulfillment of the Requirements for the Degree
Doctor of Philosophy in the School of Chemical & Biomolecular Engineering
Georgia Institute of Technology December 2009
COPYRIGHT 2009 BY BALAMURALI BALU
PLASMA PROCESSING OF CELLULOSE SURFACES AND THEIR
INTERACTIONS WITH FLUIDS
Approved by: Dr. Dennis W. Hess, Advisor School of Chemical & Biomolecular Engineering Georgia Institute of Technology
Dr. Victor Breedveld, Advisor School of Chemical & Biomolecular Engineering Georgia Institute of Technology
Dr. Yulin Deng School of Chemical & Biomolecular Engineering Georgia Institute of Technology
Dr. Preet Singh Materials Science and Engineering Georgia Institute of Technology
Dr. Cyrus K. Aidun School of Mechanical Engineering Georgia Institute of Technology
Date Approved: October 14, 2009

To my lovely daughter, Athira Balu
ACKNOWLEDGEMENTS
First of all, I would like to express my sincere gratitude to my advisors Dr. Dennis
W. Hess and Dr. Victor Breedveld for their invaluable guidance and support. I always
admire their continuous encouragement which helped me to be very creative and
innovative at research. They taught me how to apply the right proportions of hard- and
smart-work to be extremely productive and successful at research. I cannot forget the
numerous discussions I had with them - which lasted for hours at times - about the
doctorate of philosophy and the philosophy of life, by and large. As I always say my PhD
life can never be better without them. I would also like to thank my committee members,
Dr. Yulin Deng, Dr. Preet Singh and Dr. Cyrus K. Aidun for serving on my committee
and for providing valuable suggestions. I am thankful to Dr. Tim Patterson for providing
valuable insights about paper making techniques and guiding me with handsheet
preparations.
I am grateful to all the past and present members of Dr. Hess’ and Dr.
Breedveld’s research group, Dr. Galit Levitin, Dr. Ashwini Sinha, Dr. Prabhakar
Tamirisa, Dr. Ingu Song, Dr. Lingbho Zhu, Dr. Shantanu C. Pathak, Dr. Yonghao Xiu,
Ashish Pande, Fangyu Wu, Sonam Sherpa, Dr. Jun Sato, Dr. Ryan Slopek, Dr. Jae Kyu
Cho, Kayode Olanrewaju, Tracie Owens, Dr. Santosh Rahane, Dr. Vikram Prasad and
Dr. Jeng-Shiung Jan, for helping me with ideas and making my graduate life a wonderful
learning experience. In particular many thanks to Dr. Ashwini sinha for helping me with
XPS and for kindly donating the Pentafluoroethane gas, to Dr. Yonghao Xiu for his
iv
assistance in contact angle measurements, to Dr. Prabhakar Tamirisa and Dr. Shantanu C.
Pathak for their assistance in plasma processing, and Dr. Jae Kyu cho and Dr. Jun Sato
for helping me with IDL coding and microscope analysis. I am thankful to the undergrad
researchers worked with me, Nisha Kurian, Katie Taylor, Jong Suk Kim, Eunhye Jeong,
Jeongwoo Lee, Adam D. Berry, Kanak T. Patel for their help with experimental work. A
special thanks to Josie Giles, for being a pseudo-group member, who kindly helped me
with patterning the superhydrophobic paper. In addition, members from other research
group have also been very supportive during my research. Many thanks to Gary Dobbs
for helping me with ATR-FTIR studies, Christine Kranz for helping me with FIB milling
studies, Justyna Wiedemair for collaborating with me in the AFM-SECM project, and
Yan Liu for helping me with contact angle measurements.
I owe a lot to my wife, Uma. Together we have gone through so many happy and
difficult moments of life. Her endless love, support and encouragement have always been
there for me and I am the luckiest to have her in my life. I would also like to thank my
parents and sister for their constant love and support. My father, a successful mechanical
engineer, is the sole reason for my early fascination towards science and engineering.
Special thanks to my mother for listening and supporting me through all of the tough
times. She is the sole reason for why I'm doing what I am doing now. Special thanks to
my sister, Janani Subash, for her never-ending love and support. Last but not the least; I
am grateful to all my friends from all around the globe for their love and encouragement.
I cannot imagine a life without them.
v
TABLE OF CONTENTS
Page
ACKNOWLEDGEMENTS iv
LIST OF TABLES xi
LIST OF FIGURES xii
LIST OF SYMBOLS AND ABBREVIATIONS xvi
SUMMARY xx
CHAPTER
1 Introduction 1
1.1 Background 1
1.1.1 Paper 1
1.1.2 Surface modification of paper 5
1.1.3 Plasma processing 7
1.1.4 Plasma processing of paper surfaces 9
1.1.4.1 Hydrophilicity 10
1.1.4.2 Hydrophobicity 12
1.1.4.3 Adhesion 16
1.1.4.4 Bioactivity 18
1.2 Motivation and objectives 20
1.3 Thesis organization 26
References 28
2 Fabrication of “Roll-off” and “Sticky” Superhydrophobic Cellulose Surfaces via Plasma Processing 37
vi
2.1 Introduction 37
2.2 Experimental 41
2.2.1 Handsheet formation 41
2.2.2 Plasma processing 42
2.2.3 SEM 45
2.2.4 X-ray photoelectron spectroscopy 45
2.2.5 ATR-FTIR 46
2.2.6 FIB 46
2.2.7 Contact angle goniometer 46
2.3 Results and discussion 47
2.3.1 XPS 47
2.3.2 ATR-FTIR 50
2.3.3 FIB 51
2.3.4 “Roll-off” and “sticky” superhydrophobicity 53
2.3.5 Oxygen plasma etching of amorphous cellulose domains 58
2.3.6 Significance of the natural topography of the cellulose fibers for the two extreme behaviors 60
2.3.7 Robustness and stability of the superhydrophobic paper substrates62
2.4 Conclusions 64
References 65
3 Tunability of the adhesion of water drops on a superhydrophobic paper surface72
3.1 Introduction 72
3.2 Experimental 77
3.2.1 Handsheet formation 77
3.2.2 Plasma etching/deposition 77
vii

3.2.3 SEM 78
3.2.4 Water contact angle measurements 78
3.3 Results and discussion 78
3.3.1 Tunability of the stickiness 78
3.3.2 Mechanism for tenability of the stickiness 84
3.3.3 Significance of nanoscale roughness on the tunability of
stickiness 87
3.4 Conclusions 90
References 92
4 Insights into the design of superhydrophobic paper surfaces 98
4.1 Introduction 98
4.2 Experimental 99
4.2.1 Paper substrates 99
4.2.2 Plasma etching/deposition 99
4.2.3 SEM 100
4.2.4 Water contact angle measurements 100
4.2.5 Microscopic imaging of the contact line 100
4.3 Results and discussion 101
4.3.1 Effects of papermaking parameters on achievement of superhydrophobicity 101
4.3.1.1 Effects of fiber type 101
4.3.1.2 Effects of paper making 103
4.3.2 Design of superhydrophobic paper surfaces via control of fiber type and plasma processing conditions 110
viii
4.3.3 Discussion of the effect of drop size on contact angle and edge geometry 111
4.4 Conclusions 115
References 116
5 Patterning of superhydrophobic paper to control the mobility of micro-liter drops for two-dimensional lab-on-paper applications 117
5.1 Introduction 117
5.2 Experimental 122
5.2.1 Superhydrophobic paper 122
5.2.2 Patterning 122
5.2.3 Water contact angle measurements 123
5.2.4 Sliding drop experiments 123
5.2.5 Drop transfer experiments 123
5.3 Results and discussion 124
5.3.1 Adhesion on patterned paper 124
5.3.1.1 Sliding drops on sticky islands 124
5.3.1.2 Transfer of drops between substrates 135
5.3.2 Functional unit operations with patterned substrates 141
5.3.2.1 Storage 142
5.3.2.2 Transfer 143
5.3.2.3 Mixing 143
5.3.2.4 Sampling/ splitting 144
5.3.3 Integrated lab on paper concepts based on HELP substrates 146
5.4 Conclusions 148
References 150
ix
6 Directional mobility and adhesion of water drops on patterned superhydrophobic surfaces 155
6.1 Introduction 155
6.2 Experimental 158
6.2.1 Superhydrophobic paper 158
6.2.2 Patterning 158
6.2.3 Image analysis 159
6.2.4 Sliding drop experiments 160
6.3 Results and discussion 160
6.3.1 Control of directionality 160
6.3.1.1 Design for directional sliding 160
6.3.1.2 Different types of directional sliding 167
6.3.2 Control of adhesion 173
6.4 Conclusions 177
References 179
7 Conclusions and recommendations 183
7.1 Conclusions 183
7.2 Recommendations 187
References 189
VITA 190
x
LIST OF TABLES
Page
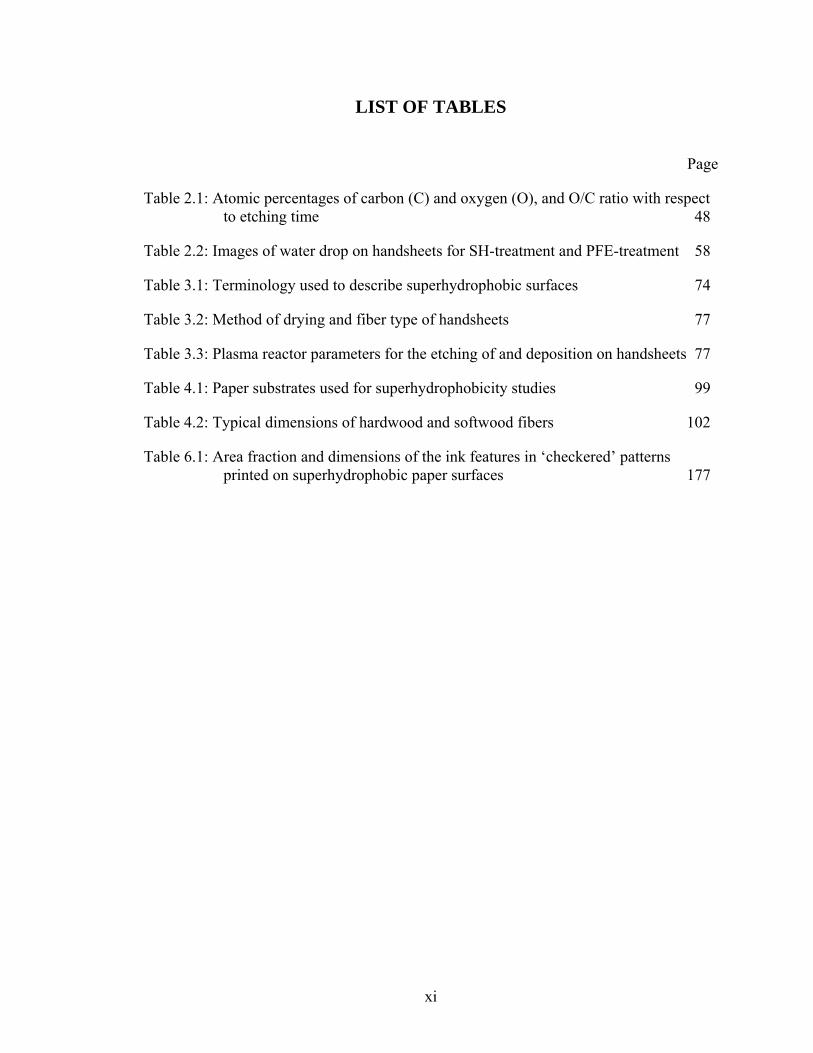
Table 2.1: Atomic percentages of carbon (C) and oxygen (O), and O/C ratio with respect to etching time 48
Table 2.2: Images of water drop on handsheets for SH-treatment and PFE-treatment 58
Table 3.1: Terminology used to describe superhydrophobic surfaces 74
Table 3.2: Method of drying and fiber type of handsheets 77
Table 3.3: Plasma reactor parameters for the etching of and deposition on handsheets 77
Table 4.1: Paper substrates used for superhydrophobicity studies 99
Table 4.2: Typical dimensions of hardwood and softwood fibers 102
Table 6.1: Area fraction and dimensions of the ink features in ‘checkered’ patterns printed on superhydrophobic paper surfaces 177
xi
LIST OF FIGURES
Page
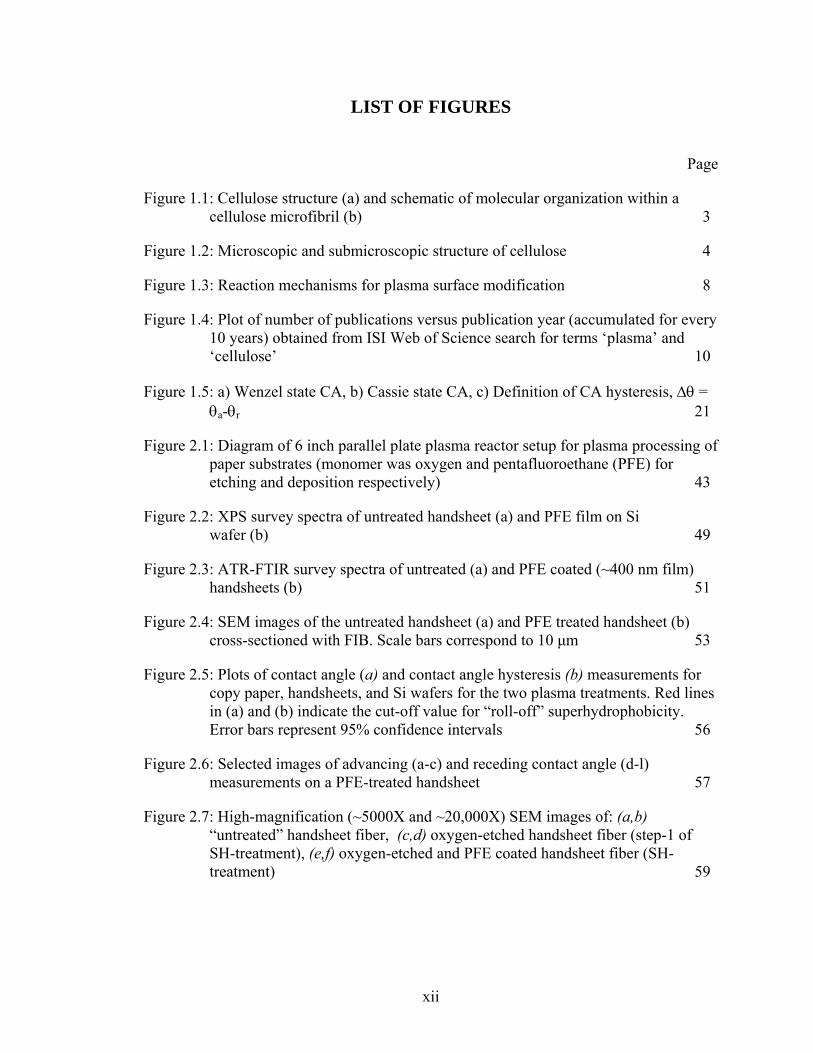
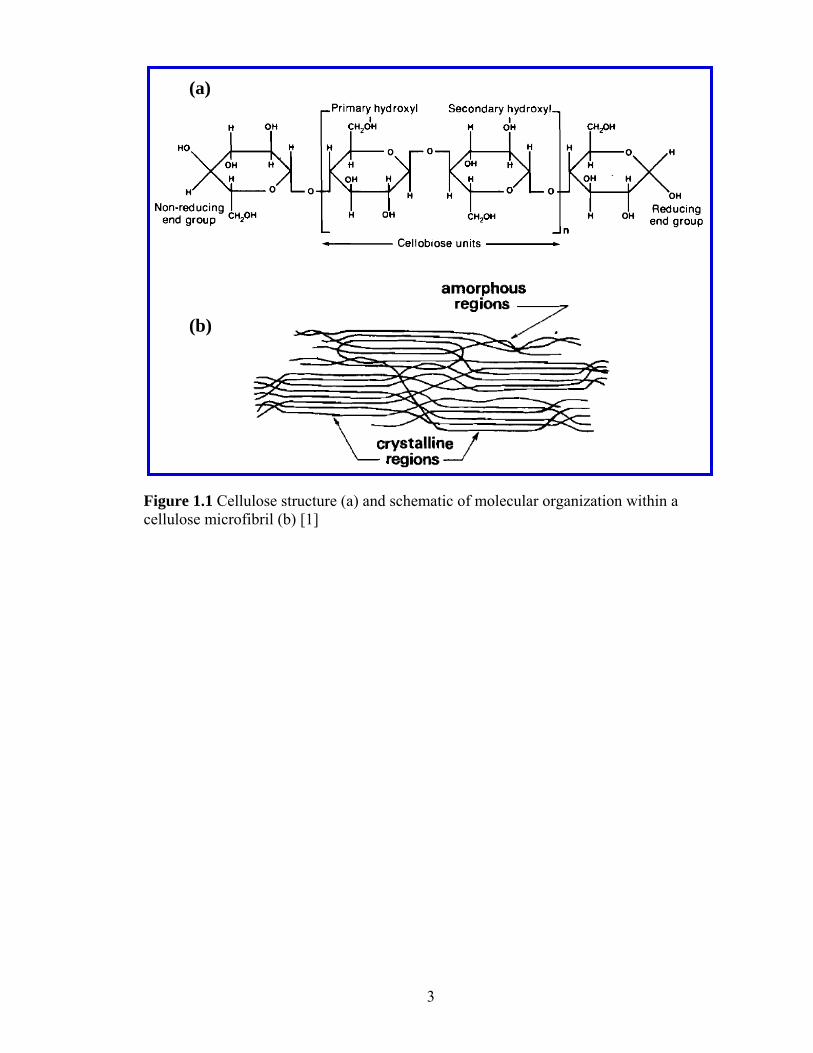
Figure 1.1: Cellulose structure (a) and schematic of molecular organization within a cellulose microfibril (b) 3
Figure 1.2: Microscopic and submicroscopic structure of cellulose 4
Figure 1.3: Reaction mechanisms for plasma surface modification 8
Figure 1.4: Plot of number of publications versus publication year (accumulated for every 10 years) obtained from ISI Web of Science search for terms ‘plasma’ and ‘cellulose’ 10
Figure 1.5: a) Wenzel state CA, b) Cassie state CA, c) Definition of CA hysteresis, Δθ = θa-θr 21
Figure 2.1: Diagram of 6 inch parallel plate plasma reactor setup for plasma processing of paper substrates (monomer was oxygen and pentafluoroethane (PFE) for etching and deposition respectively) 43
Figure 2.2: XPS survey spectra of untreated handsheet (a) and PFE film on Si wafer (b) 49
Figure 2.3: ATR-FTIR survey spectra of untreated (a) and PFE coated (~400 nm film) handsheets (b) 51
Figure 2.4: SEM images of the untreated handsheet (a) and PFE treated handsheet (b) cross-sectioned with FIB. Scale bars correspond to 10 μm 53
Figure 2.5: Plots of contact angle (a) and contact angle hysteresis (b) measurements for copy paper, handsheets, and Si wafers for the two plasma treatments. Red lines in (a) and (b) indicate the cut-off value for “roll-off” superhydrophobicity. Error bars represent 95% confidence intervals 56
Figure 2.6: Selected images of advancing (a-c) and receding contact angle (d-l) measurements on a PFE-treated handsheet 57
Figure 2.7: High-magnification (~5000X and ~20,000X) SEM images of: (a,b) “untreated” handsheet fiber, (c,d) oxygen-etched handsheet fiber (step-1 of SH-treatment), (e,f) oxygen-etched and PFE coated handsheet fiber (SH-treatment) 59
xii
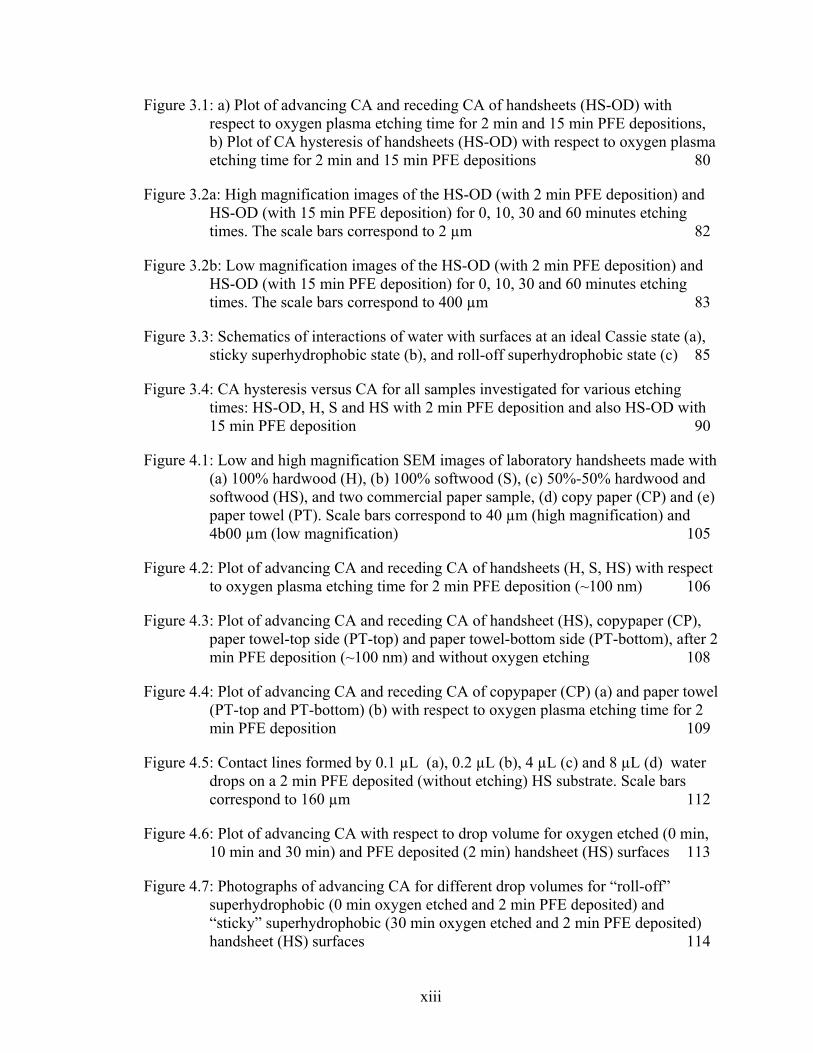
Figure 3.1: a) Plot of advancing CA and receding CA of handsheets (HS-OD) with respect to oxygen plasma etching time for 2 min and 15 min PFE depositions, b) Plot of CA hysteresis of handsheets (HS-OD) with respect to oxygen plasma etching time for 2 min and 15 min PFE depositions 80
Figure 3.2a: High magnification images of the HS-OD (with 2 min PFE deposition) and HS-OD (with 15 min PFE deposition) for 0, 10, 30 and 60 minutes etching times. The scale bars correspond to 2 µm 82
Figure 3.2b: Low magnification images of the HS-OD (with 2 min PFE deposition) and HS-OD (with 15 min PFE deposition) for 0, 10, 30 and 60 minutes etching times. The scale bars correspond to 400 µm 83
Figure 3.3: Schematics of interactions of water with surfaces at an ideal Cassie state (a), sticky superhydrophobic state (b), and roll-off superhydrophobic state (c) 85
Figure 3.4: CA hysteresis versus CA for all samples investigated for various etching times: HS-OD, H, S and HS with 2 min PFE deposition and also HS-OD with 15 min PFE deposition 90
Figure 4.1: Low and high magnification SEM images of laboratory handsheets made with (a) 100% hardwood (H), (b) 100% softwood (S), (c) 50%-50% hardwood and softwood (HS), and two commercial paper sample, (d) copy paper (CP) and (e) paper towel (PT). Scale bars correspond to 40 µm (high magnification) and 4b00 µm (low magnification) 105
Figure 4.2: Plot of advancing CA and receding CA of handsheets (H, S, HS) with respect to oxygen plasma etching time for 2 min PFE deposition (~100 nm) 106
Figure 4.3: Plot of advancing CA and receding CA of handsheet (HS), copypaper (CP), paper towel-top side (PT-top) and paper towel-bottom side (PT-bottom), after 2 min PFE deposition (~100 nm) and without oxygen etching 108
Figure 4.4: Plot of advancing CA and receding CA of copypaper (CP) (a) and paper towel (PT-top and PT-bottom) (b) with respect to oxygen plasma etching time for 2 min PFE deposition 109
Figure 4.5: Contact lines formed by 0.1 µL (a), 0.2 µL (b), 4 µL (c) and 8 µL (d) water drops on a 2 min PFE deposited (without etching) HS substrate. Scale bars correspond to 160 µm 112
Figure 4.6: Plot of advancing CA with respect to drop volume for oxygen etched (0 min, 10 min and 30 min) and PFE deposited (2 min) handsheet (HS) surfaces 113
Figure 4.7: Photographs of advancing CA for different drop volumes for “roll-off” superhydrophobic (0 min oxygen etched and 2 min PFE deposited) and “sticky” superhydrophobic (30 min oxygen etched and 2 min PFE deposited) handsheet (HS) surfaces 114
xiii
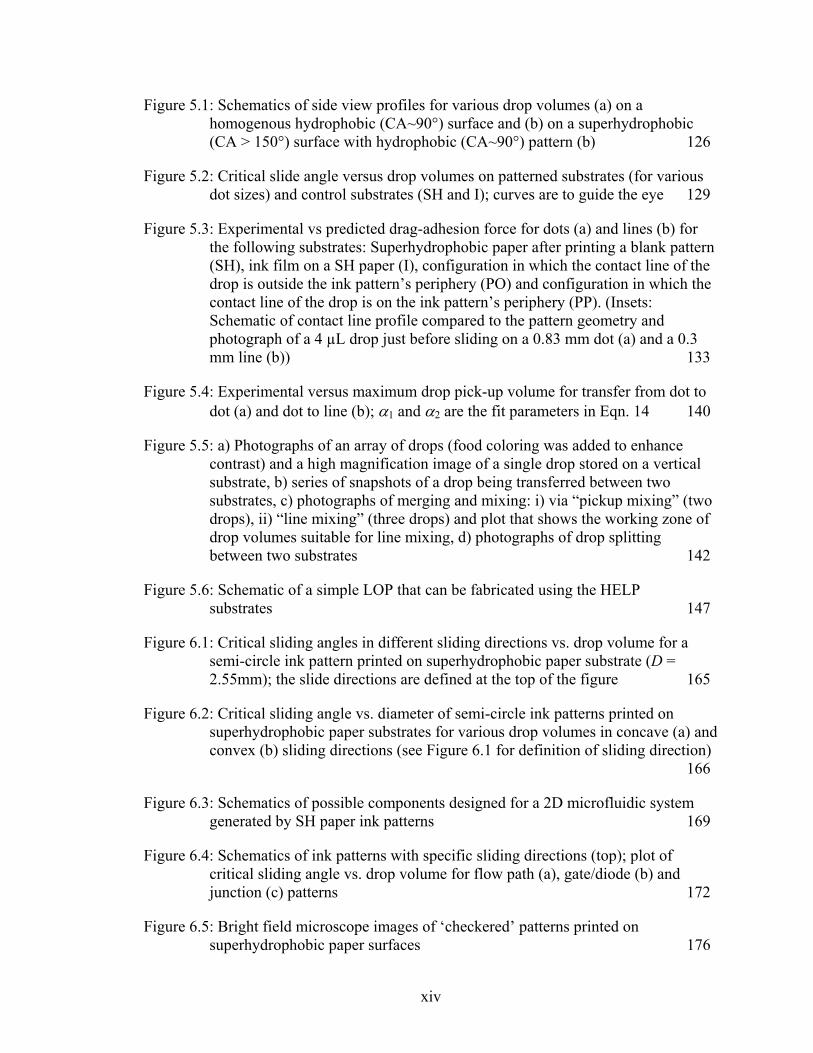
Figure 5.1: Schematics of side view profiles for various drop volumes (a) on a homogenous hydrophobic (CA~90°) surface and (b) on a superhydrophobic (CA > 150°) surface with hydrophobic (CA~90°) pattern (b) 126
Figure 5.2: Critical slide angle versus drop volumes on patterned substrates (for various dot sizes) and control substrates (SH and I); curves are to guide the eye 129
Figure 5.3: Experimental vs predicted drag-adhesion force for dots (a) and lines (b) for the following substrates: Superhydrophobic paper after printing a blank pattern (SH), ink film on a SH paper (I), configuration in which the contact line of the drop is outside the ink pattern’s periphery (PO) and configuration in which the contact line of the drop is on the ink pattern’s periphery (PP). (Insets: Schematic of contact line profile compared to the pattern geometry and photograph of a 4 µL drop just before sliding on a 0.83 mm dot (a) and a 0.3 mm line (b)) 133
Figure 5.4: Experimental versus maximum drop pick-up volume for transfer from dot to dot (a) and dot to line (b); α1 and α2 are the fit parameters in Eqn. 14 140
Figure 5.5: a) Photographs of an array of drops (food coloring was added to enhance contrast) and a high magnification image of a single drop stored on a vertical substrate, b) series of snapshots of a drop being transferred between two substrates, c) photographs of merging and mixing: i) via “pickup mixing” (two drops), ii) “line mixing” (three drops) and plot that shows the working zone of drop volumes suitable for line mixing, d) photographs of drop splitting between two substrates 142
Figure 5.6: Schematic of a simple LOP that can be fabricated using the HELP substrates 147
Figure 6.1: Critical sliding angles in different sliding directions vs. drop volume for a semi-circle ink pattern printed on superhydrophobic paper substrate (D = 2.55mm); the slide directions are defined at the top of the figure 165
Figure 6.2: Critical sliding angle vs. diameter of semi-circle ink patterns printed on superhydrophobic paper substrates for various drop volumes in concave (a) and convex (b) sliding directions (see Figure 6.1 for definition of sliding direction) 166
Figure 6.3: Schematics of possible components designed for a 2D microfluidic system generated by SH paper ink patterns 169
Figure 6.4: Schematics of ink patterns with specific sliding directions (top); plot of critical sliding angle vs. drop volume for flow path (a), gate/diode (b) and junction (c) patterns 172
Figure 6.5: Bright field microscope images of ‘checkered’ patterns printed on superhydrophobic paper surfaces 176
xiv
Figure 6.6: Plot of critical sliding angle vs. drop volume for the different ‘checker’ patterns (a, b, c and d) as shown in Figure 6.5, ink film, SH-control and SH-virgin 177
xv
LIST OF SYMBOLS AND ABBREVIATIONS
θ* Contact angle of on rough surface
θ Contact angle of on flat surface
r Roughness factor
f Fraction of solid water interface
θA Advancing contact angle
θR Receding contact angle
CAadv Advancing contact angle
CArec Receding contact angle
γSV Interfacial energies between solid-vapor
γSL Interfacial energies between solid-liquid
γLV Interfacial energies between liquid-vapor
µL Microliter
F Force exerted on the drop
Wdrop Width of the drop perpendicular to the direction of sliding
Wdot Width of the ink dot
Wline Width of the ink line
ρ Density of the liquid
V Volume of the drop
g Acceleration due to gravity
α Critical sliding angle
FE Experimental force for a drop to slide
FP Predicted force for a drop to slide
FPO Predicted force for a drop to slide in “outside” configuration
FPP Predicted force for a drop to slide in “perimeter” configuration
xvi

FI Predicted force for a drop to slide on ink film
FSH Predicted force for a drop to slide on SH paper
θRI Receding contact angle on ink
θRSH Receding contact angle on SH paper
θAI Advancing contact angle on ink
θASH Advancing contact angle on SH paper
Wadh Work of adhesion
Lchar Characteristic length scale
Vpredicted Predicted volume
β Proportionality constant
W Width of ink pattern
σ Area fraction
MEMS Micro-electromechanical systems
LOC Lab on a Chip
CTMP Chemothermomechanical pulp
FTMS Fluorotrimethylsilane
PFPDMS Pentafluorophenyldimethylsilane
FDA Food and drug administration
PTFE Polytetrafluoroethylene
HDMS Hexamethyldisilazane
SH Superhydrophobic
CA Contact angle
ATRP Atom transfer radical polymerization
AKD Alkyl ketene dimer
POC Point of care
xvii
LOP Lab on a paper
SEM Scanning electron microscope
ATR Attenuated total reflectance
FTIR Fourier transform infrared
XPS X-ray photoelectron spectroscopy
PECVD Plasma-enhanced chemical vapor deposition
PFE Pentafluoroethane
RH Relative humidity
RF Radio frequency
FIB Focused ion beam
ASTM American society for testing and materials
HS-OD Handsheet - overnight drying (50% hardwood and 50% softwood)
HS Handsheet (50% hardwood and 50% softwood)
H Handsheet (100% hardwood)
S Handsheet (100% softwood)
sccm Standard cubic centimeter
TAPPI Technical association of pulp and paper
CP Copy paper
PT Paper towel
PDMS Polydimethylsiloxane
PMMA Polymethylmethacrylate
OEW Optoelectrowetting
2D Two-dimensional
3D Three-dimensional
HELP Hysteresis enabled lab-on-paper
xviii
I Inkfilm
ACNT Aligned carbon nanotubes
xix
SUMMARY
Cellulose is a biodegradable, renewable, flexible, inexpensive, biopolymer which is
abundantly present in nature. In spite of these inherent advantages, cellulose fibers cannot
be used directly in a number of potential industrial applications because of their
hydrophilic nature; a surface modification is often required to alter the surface properties
of cellulose. This thesis work reports a fabrication method that results in
superhydrophobic properties (contact angle (CA) > 150°) on cellulose (paper) surfaces.
Superhydrophobicity was obtained by domain-selective etching of amorphous portions of
the cellulose fiber in an oxygen plasma, and by subsequently coating the etched surface
with a thin fluorocarbon film deposited via plasma enhanced chemical vapor deposition
from a pentafluoroethane precursor. Two forms of superhydrophobicity with vastly
different degrees of adhesion were obtained by varying the plasma treatment conditions,
in particular the duration of oxygen etching: “roll-off” (contact angle (CA): 166.7° ± 0.9°
and CA hysteresis: 3.4° ± 0.1°) and “sticky” (CA: 153.4° ± 4.7° and CA hysteresis:
149.8±5.8°) superhydrophobicity. The CA hysteresis could be tuned between the two
extremes by adjusting the oxygen etching time to control the formation of nano-scale
features on the cellulose fibers. The effects of fiber types (soft vs. hard wood) and paper
making parameters on fabricating superhydrophobic paper were also investigated. There
were no significant differences in the formation of the nano-scale features created via
oxygen etching on paper substrates obtained from different fiber types and paper making
parameters. Because “roll-off” superhydrophobicity is primarily determined by the nano-
scale roughness, this property is therefore not significantly affected by the fiber types or
xx
xxi
paper making parameters. While the fiber type does not affect “roll-off” or “sticky”
superhydrophobicity, paper making process parameters affect the structure of the paper
web on the micro-scale and thus lead to variations in “sticky” superhydrophobicity.
Superhydrophobic paper substrates were patterned with high surface energy ink deposited
using a commercial desktop printer. The patterns could be used to manipulate the drag
and extensional adhesion of water drops on the substrates. Classic ‘drag’ and
‘extensional’ adhesion expressions were used to model the behavior of water drops on
basic dot and line patterns of variable dimensions. A fundamental understanding of the
adhesive forces of water drops as a function of pattern shape and size was thus obtained.
Based on this knowledge, patterned paper substrates were then designed and fabricated to
perform simple unit operations, such as storage, transfer, mixing and merging of water
drops. These basic functionalities were combined in the design of a simple two-
dimensional lab-on-paper (LOP) device. Further studies of more complicated pattern
shapes led to the generation of patterns that allowed directional mobility and tunable
adhesion of water drops. These developments are critical for designing novel components
for two-dimensional LOP devices such as flow paths, gates/diodes, junctions and drop
size filters.
CHAPTER 1
INTRODUCTION
1.1 Background
1.1.1 Paper
Paper is one of the most significant inventions in the history of mankind. Applications
range from toilet tissues to currency bills. Paper is defined as a felted sheet formed on a
fine mesh from an aqueous suspension of cellulose fibers. The word paper derives its
name from the Greek term papyrus, the stem of a reedy plant used as a writing material in
ancient Egypt [1]. The first authenticated papermaking originated in China in 105 CE [2].
Paper making was considered an art for several centuries after that until it was extended
to other parts of the world. In the 1700s, the introduction of science and engineering to
the paper making process resulted in great advances with respect to both production and
usage. In 2002, the world-wide production of paper exceeded 300 million tons and it is
expected to reach 500 million tons by 2013 [1, 3]. For the past two centuries, a very large
fraction of paper and paperboard production was used for printing, writing and packaging
applications. Currently, paper is more than just a substrate for writing, printing and
packaging; recent scientific research has established its potential as an inexpensive,
biodegradable, renewable, flexible polymer substrate. Innovative concepts of paper-based
devices include transistors [4, 5], batteries [6, 7], super-capacitors [7], MEMS devices
[8], sensors [9] and lab-on-chip (LOC) microfluidic devices [10-16].
1
The fibers used to make paper come from a variety of sources such as wood, straws,
grasses, canes, reeds and bamboos. In spite of the diversity of sources, all fibers contain
the following three components: cellulose, hemicellulose, and lignin. Of the above,
cellulose is the single most important component for papermaking [1]. As shown in
Figure 1.1a, cellulose molecules (C6H10O5)n are essentially polymer chains of β-d-glucose
residues covalently coupled via glucosidal linkages [17, 18]. The ‘n’ value, also known as
the degree of polymerization (DP), varies from 600 to 1500 depending on the fiber source
and treatment techniques applied [1]. Cellulose molecules form long segments in several
ordered levels of orientation developing crystalline and amorphous domains as shown in
Figure 1.1b [19-22]. The crystalline segments constitute the microfibrils which are
bundled together to form macrofibils as shown in Figure 1.2 [20, 21, 23, 24]. A single
fiber is made up of several aggregated macrofibrils. Hemi-celluloses are shorter-chain
polysaccharide molecules with DP between 15 and 90. They constitute five different
sugars to constitute the polymer chains: glucose, mannose, galactose, xylose and
arabinose [1]. Lignins are complex amorphous polymers made from phenylpropane units
[25] and give plants their brown color. Lignin’s principal role in the wood is to cement
the fibers together;it is thus responsible for the rigidity of the plants [26]. In addition to
the three primary components, wood contains miscellaneous constituents such as resin
acids, fats, terpenes and alcohols which can be extracted with water or organic solvents
such as ethanol, acetone or dichloromethane and are thus termed ‘extractives’.
2
(a)
(b)
Figure 1.1 Cellulose structure (a) and schematic of molecular organization within a cellulose microfibril (b) [1]
3
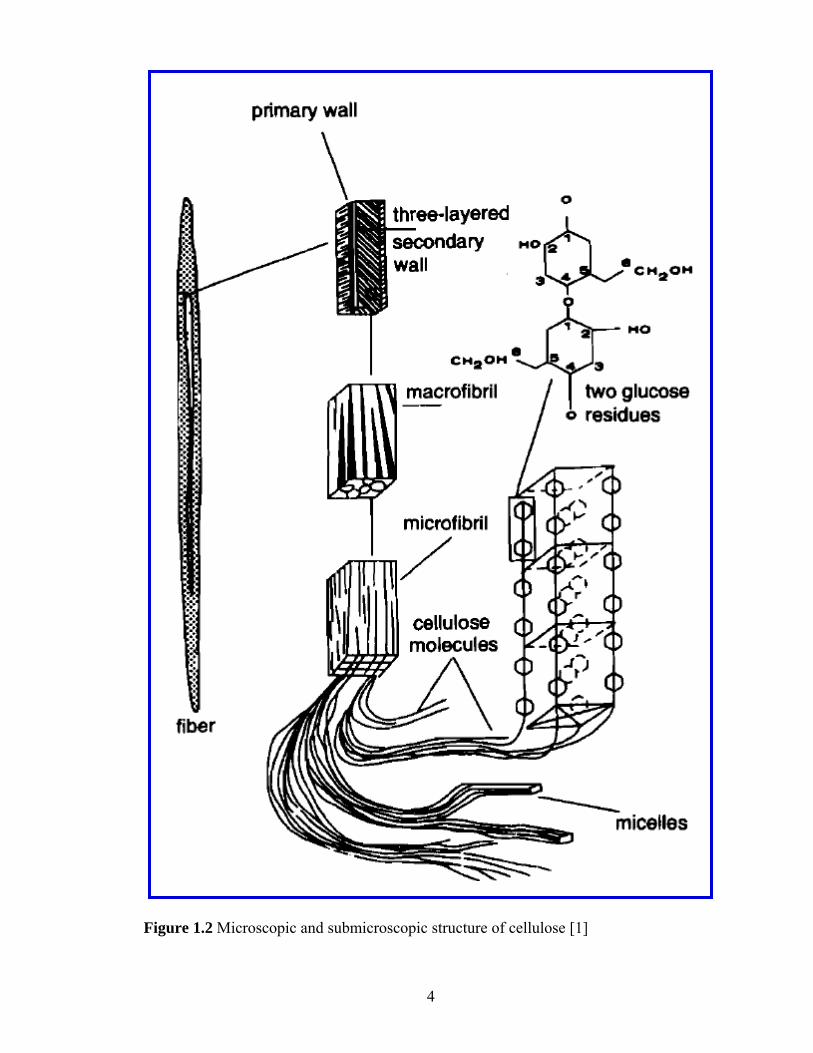
Figure 1.2 Microscopic and submicroscopic structure of cellulose [1]
4
1.1.2 Surface modification of paper
The hydrophilic nature of cellulose is critical in the paper making process [27] , since it is
this property that bonds the fibers together, thereby allowing the production of paper.
However, the surface chemistry and morphology of the cellulose fibers also restrict its
use in a number of important industrial applications. Hence, the ability to modify
cellulose fibers to tailor their physical and chemical properties without changing bulk
paper properties is of considerable importance. Such a process whereby the surface
morphology and chemistry of the solid surfaces are changed to control the interfacial
interactions between solid-solid, solid-liquid and solid-gas, without modifying the bulk
properties of the solid is known as surface modification.
Two important properties essential to all applications and that therefore drive research on
the surface modification of paper are wettability and adhesion. Wettability is determined
by the contact angle (θ) displayed by a liquid drop on a surface. If the liquid is water, a
surface can be classified as hydrophilic (θ < 90°), hydrophobic (θ > 90°), or
superhydrophobic (θ > 150°) based on the contact angle values. The wettability of paper
surfaces is critical for applications such as printing and packaging. On the other hand,
adhesion between fibers or to additives in the paper is critical in determining the internal
bonding strength of paper and in making fiber reinforced composites with various
polymer matrices.
Sizing is one of the traditional surface treatments applied to paper in order to control the
wettability. Sizing methods can be classified into two categories [1]: internal sizing and
5
surface sizing. Internal sizing is accomplished by adding natural (rosin based) or
synthetic (alkylketene dimer and alkenyl succinic anhydride) sizing agents to pulp
slurries before forming the paper [28]. Surface sizing is performed in later stages of the
process by filling the pores of the paper with starch and waxes, thereby retarding the rate
of liquid penetration. The adhesion strength between fibers can be improved by adding
starches, gums and resins to the pulp [1]. Cellulose fibers can also be modified via
mechanical treatments (roughening and polishing), wet chemical treatments, and vapor
phase treatments to obtain a variety of surface properties.
The traditional surface modification techniques are quite effective when considering
traditional paper applications such as printing, writing and packaging. However, as
mentioned in the previous section, applications of paper have expanded in the past
decade, and the paper industry must implement innovations in their manufacturing
processes to allow competition with plastics and biomaterials. Such considerations
suggest that so called ‘out of the box thinking’ is needed to develop and implement novel
surface treatment techniques that can ensure paper substrate compatibility with a variety
of liquids and solid materials.
Vapor phase treatment, in particular cold plasma processing, has gained popularity in the
past few decades because of its versatility to impart cellulose surfaces with various
desirable surface properties by choosing the appropriate chemical reactants and
experimental parameters. Moreover, since plasmas or glow discharges represent solvent
free processes, they have been recently included in the list of “green” technologies [29].
6
The following sections will discuss the reaction mechanisms involved in plasma
processing and will describe applications of plasmas to paper surface modifications.
1.1.3 Plasma processing
A plasma is a partially ionized quasineutral gas containing electrons (0-10 eV), ions (10-
30 eV), photons (200-400 nm) and a variety of neutral species [30]. Irving Langmuir first
observed this phenomenon in his lab in 1927 when he tried to strike an electrical
discharge in a gas. In naming this interesting phenomenon, several suggestions were
made by his research group: ‘uniform discharge’, ‘homogenous discharge’, ‘equilibrium
discharge’, ‘auras’ and ‘haloes’. Finally, Langmuir suggested the term ‘plasma’, as the
way the electric discharge carries the electrons, ions, neutrals and gas impurities
reminded him of the way the ‘blood plasma’ carries red corpuscles, white corpuscles and
germs [31, 32].
Typically, in plasma processing, organic gases or vapors are partially ionized by an
electric discharge resulting in the creation of highly reactive species. Thus, by using
electrical energy, even at room temperatures, highly reactive species can be generated
that otherwise can only be obtained at higher temperatures via thermal excitation.
Generation of reactive species at low temperatures is a significant advantage when
treating paper fibers which will decompose at high temperatures. For instance, the degree
of polymerization (DP) of Kraft paper decreases by a factor of 7 around 150° C [33]. In
plasmas the highly reactive species at ambient temperatures provide the capability to
perform surface modification of paper without the loss of mechanical properties [30].
7
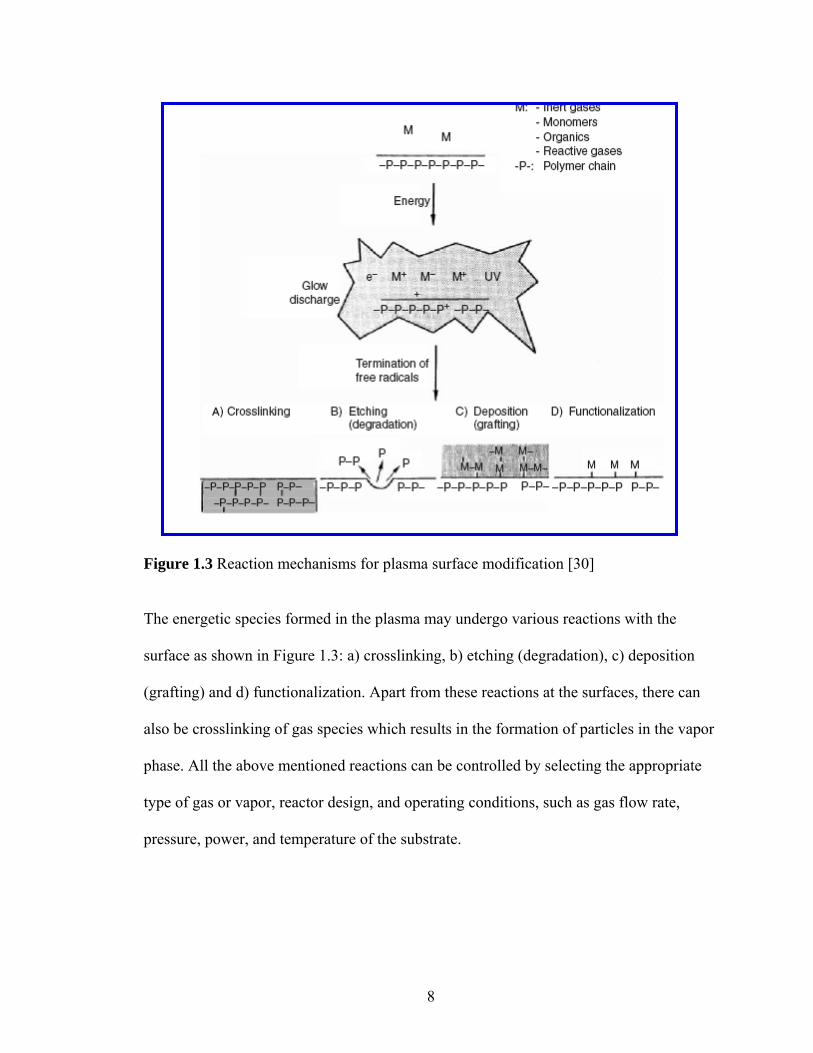
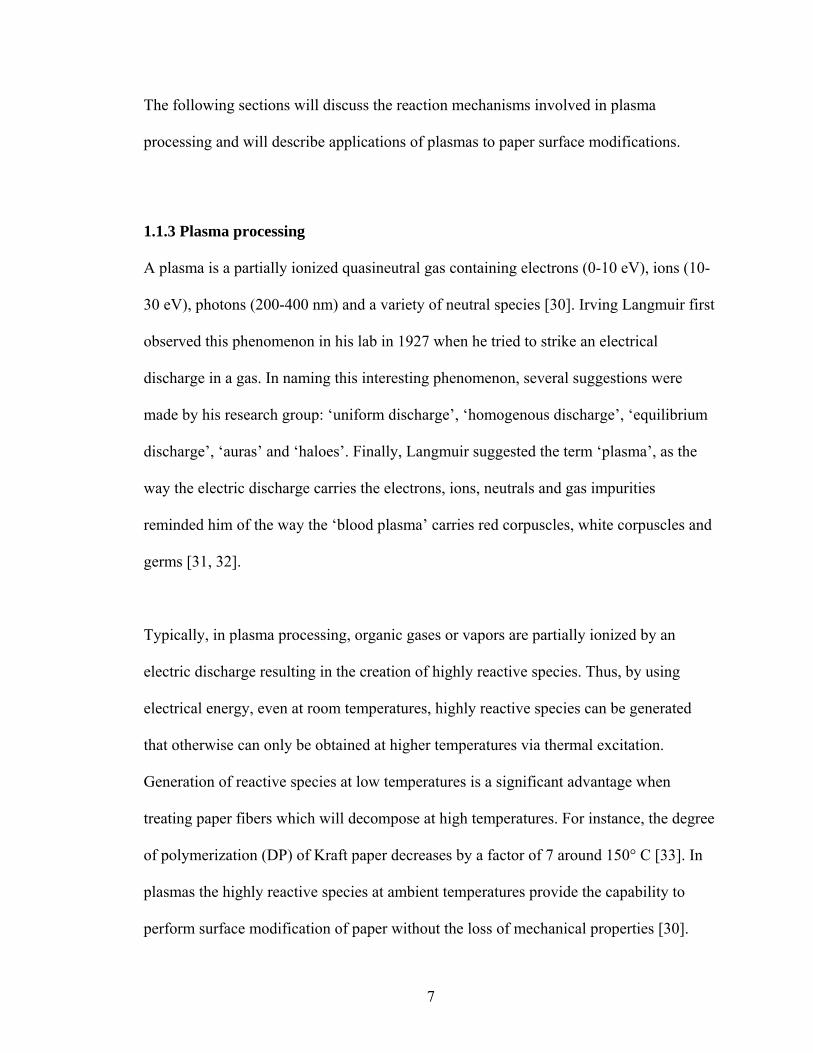
Figure 1.3 Reaction mechanisms for plasma surface modification [30]
The energetic species formed in the plasma may undergo various reactions with the
surface as shown in Figure 1.3: a) crosslinking, b) etching (degradation), c) deposition
(grafting) and d) functionalization. Apart from these reactions at the surfaces, there can
also be crosslinking of gas species which results in the formation of particles in the vapor
phase. All the above mentioned reactions can be controlled by selecting the appropriate
type of gas or vapor, reactor design, and operating conditions, such as gas flow rate,
pressure, power, and temperature of the substrate.
8
1.1.4 Plasma processing of paper surfaces
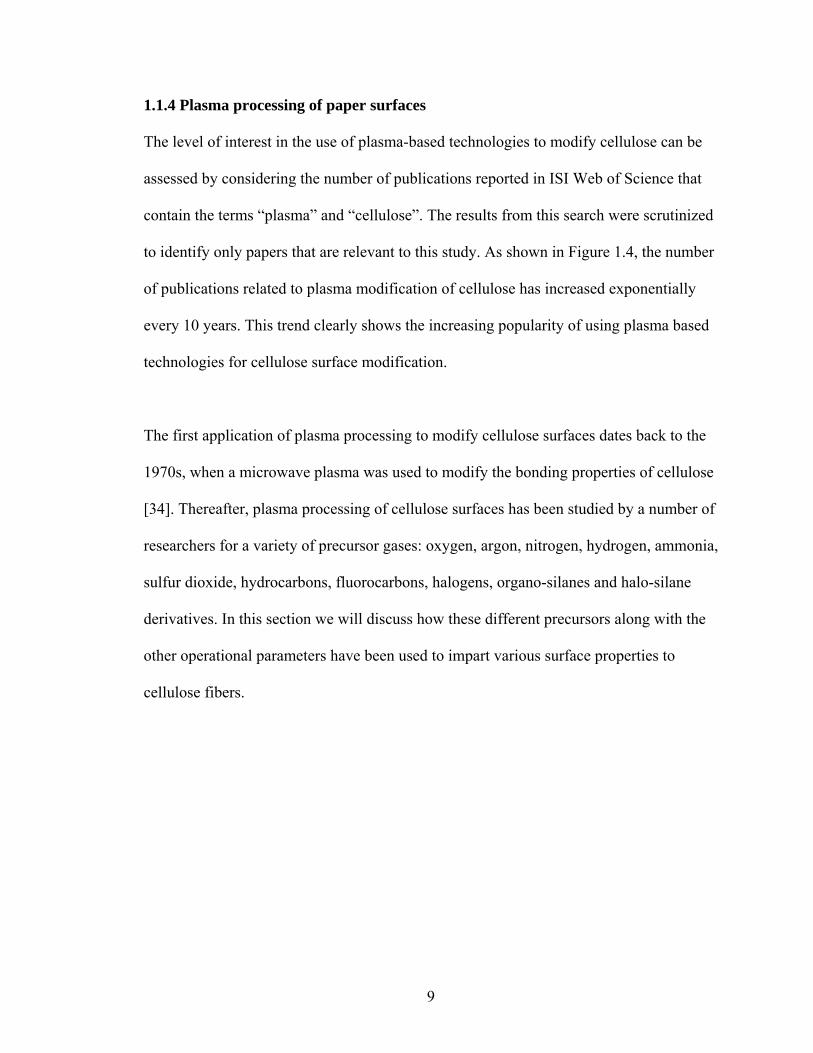
The level of interest in the use of plasma-based technologies to modify cellulose can be
assessed by considering the number of publications reported in ISI Web of Science that
contain the terms “plasma” and “cellulose”. The results from this search were scrutinized
to identify only papers that are relevant to this study. As shown in Figure 1.4, the number
of publications related to plasma modification of cellulose has increased exponentially
every 10 years. This trend clearly shows the increasing popularity of using plasma based
technologies for cellulose surface modification.
The first application of plasma processing to modify cellulose surfaces dates back to the
1970s, when a microwave plasma was used to modify the bonding properties of cellulose
[34]. Thereafter, plasma processing of cellulose surfaces has been studied by a number of
researchers for a variety of precursor gases: oxygen, argon, nitrogen, hydrogen, ammonia,
sulfur dioxide, hydrocarbons, fluorocarbons, halogens, organo-silanes and halo-silane
derivatives. In this section we will discuss how these different precursors along with the
other operational parameters have been used to impart various surface properties to
cellulose fibers.
9
0
20
40
60
80
100
1960 1970 1980 1990 2000 2010
Num
ber o
f pub
licat
ions
Publication year Figure 1.4 Plot of number of publications versus publication year (accumulated for every 10 years) obtained from ISI Web of Science search for terms ‘plasma’ and ‘cellulose’
1.1.4.1 Hydrophilicity
Although hydrophilicity and hydrophobicity are defined as displaying a water contact
angle less than and greater than 90° respectively, these terms should be considered only
in a relative sense. Therefore, in the following sections, we will refer to modification of
paper to impart hydrophilic or hydrophobic properties will indicate simply that the
surface energy of the paper has been increased or decreased, respectively.
As mentioned previously, pure cellulose is hydrophilic in nature with a water contact
angle of ~20°. But, depending upon the pulping techniques used, the pulp will contain
different proportions of cellulose lignin, hemicellulose and extractives which may affect
the wettability of the final paper. Controlled hydrophilicity of the paper is critical because
10
this property determines dye uptake and printability efficiency. Plasma treatments of
paper have been effective in altering the wettability of cellulose fibers. Carlsson et al.
[35, 36] studied the effects of oxygen plasma treatment on three kraft pulps with different
proportions of lignins and extractives. They reported that the oxygen plasma oxidizes the
lignin and extractives present on the fiber surface, resulting in increased hydrophilicity
and water sorption characteristics. They also studied the effects of a hydrogen plasma
treatment on a resin-rich paper. For a specific reaction time, hydrogen plasma sputters the
light molecular weight resins from the fiber surface leading to an increase in the O/C
ratio, which resulted in enhanced wettability. In another study, the same researchers[37]
reported that an oxygen plasma treatment increased the hydrophilicity of Chemical
Thermo Mechanical Pulp (CTMP) paper that had high lignin content. [37]
In some cases internal sizing is added during one of the steps in the paper making
process, which creates the need to make the paper hydrophilic during post-treatment for
specific applications. Vesel et al. [38] reported that ink jet paper, which is moderately
hydrophobic due to the addition of alkyl ketene dimer (AKD) during the paper making
process, can be rendered hydrophilic using an oxygen plasma treatment. Denes et al. [39]
studied the effects of both SiCl4 and oxygen plasmas on sized security paper. Both SiCl4
and oxygen plasmas increased the oxygen content on the surface and thus decreased the
contact angles of water on these substrates.
11
1.1.4.2 Hydrophobicity
Plasma processing techniques have been successfully implemented to make paper
surfaces hydrophobic by depositing hydrophobic polymer films. The advantage of plasma
assisted deposition is that with sufficiently thin polymer film deposition, the coating
covers only the individual fibers and thus does not block the intrafiber pores.
In the 1980s, many researchers attempted to fluorinate various polymer surfaces using
fluorocarbon plasmas. Along this line, Sapieha [27, 40] first attempted to fluorinate paper
surfaces using tetrafluoromethane plasmas to yield hydrophobic properties. In this work,
paper surfaces were treated with different ratios of CF4 and O2 feed gases and
hydrophobicity was measured in terms of absorption time of water on the treated paper
surfaces. The water absorption time increased with increasing CF4 fraction in the feed
gas. The increase in hydrophobicity was attributed to the incorporation of CF2 groups on
the fiber surfaces. Adding to this contribution, Sahin et al. [41] reported that the atomic
fluorine concentration on the paper surface can be controlled by the external plasma
parameters such as power, pressure and reaction time.
Surface properties of a paper substrate differ on its two sides depending on whether it is
on the felt or wire side during the paper formation process. This leads to a difference in
the surface morphology on the micro-scale between the two sides of the paper, often
referred to as “two-sideness”. Sahin [42] studied the effect of this “two-sideness” on the
fluorination of papers by CF4 plasmas. He reported that the felt side which has coarse
12
fibrous materials usually is more prone to fluorination than is the wire side containing
fiber fines.
Mukhopadyay et al. [43] carried out an extensive study on the treatment of paper fibers
with a variety of fluorocarbon precursors: penta-deca-fluoro-octyl-acrylate, per-fluoro-
dodecene, tri-deca-fluoro-octene and per-fluoro-methyl-cyclo-hexane. They concluded
that all these precursors resulted in the incorporation of the CF2 and CF3 groups which
are key to obtaining hydrophobic properties. They also concluded that a minimum of
15% surface fluorine concentration is sufficient to impart hydrophobicity on the paper
surface, irrespective of the monomers used. The chemical composition of the paper
fibers, which is determined by the paper making parameters, does not have a significant
impact on plasma fluorination. Soon after Sahin et al. [41] reported the hydrophobization
of bleached kraft paper, Navarro et al. [44] reported the hydrophobization of
chemothermomechanical pulp (CTMP) by treating it in a fluorotrimethylsilane (FTMS)
plasma environment. The hydrophobicity of the treated surfaces was attributed to the
formation of C-Si-F and C-O-Si-F groups. The same researchers later used a
pentafluorophenyldimethylsilane (PFPDMS) precursor and were successful in replicating
the hydrophobic properties on the CTMP substrate [45].
Vaswani et al. [46] reported the deposition of fluoropolymer thin films from
pentafluoroethane (CF3CHF2) and octafluorocyclobutane (C4F8) precursors onto paper
surfaces. The treatment made the substrates water repellant (hydrophobic), but allowed
water vapor to diffuse through the film and substrate readily. The researchers reported
13
that for cellulose surfaces, a minimum of a 70 nm thick fluorocarbon film was required to
obtain a uniform fiber coating that completely retarded the absorption of water into the
paper. They also observed that treated paper showed good resistance against the
permeation of oleic acid and grease after the plasma treatments (lipophobicity).
An interesting aspect of the fluorocarbon precursors is that they simultaneously provide
polymerization and etching environments when excited in the plasma environment.
While the CFx species are responsible for polymerization, fluorine free radicals can etch
the paper surfaces. The rate of etching and deposition can be controlled by adjusting the
ratio of fluorine to carbon in the precursor and by tuning various reactor parameters such
as power, pressure, substrate temperature and residence time. It is worth mentioning that
if the critical experimental parameters were not properly selected, the plasma treatments
mentioned above would not have resulted in a fluorocarbon film on the paper surfaces;
rather these plasmas may have etched the paper surfaces.
There is a general concern within the scientific community regarding the incorporation of
fluorine containing compounds into the hydrophobic coatings; these coatings may make
the product less environmental friendly [47]. Food packing is one of the most sensitive
applications of plasma fluorinated paper coatings. The Food and Drug Administration
(FDA) regulations indicate that fluorine can be used in a water or oil repellant material
with a basis weight of 0.22-2.44 g/m2 depending upon the chemical form in which it is
present. The plasma deposited fluorocarbon films are often referred to as Teflon-like
films because of their chemical and physical properties being similar to those of PTFE.
14
Hence, it is reasonable to assume a density of ~2 g/cc (typical for PTFE film) for the
plasma deposited fluorocarbon films. Studies have suggested that a ~100 nm
fluorocarbon film is sufficient to inhibit liquid water absorption. For this film thickness
(~100 nm) the basis weight corresponds to ~ 0.2 g/ m2 which falls well within the
specified limits. In spite of this compliance with FDA regulations, there has been an
increased interest in the use of non-fluorinated precursors for rendering paper surfaces
hydrophobic. Tu et al. [48] first reported the use of cyclohexane, a hydrocarbon
precursor, to yield hydrophobicity on cellulose fibers. However, these coatings were not
conformal on the fibers and formed bridges between the fibers that altered the porosity of
the treated paper [47]. Organic silicone compounds were also investigated as precursors
to obtain conformal fluorine-less hydrophobic films. Organic silicone compounds have
stronger adhesion to cellulose surfaces than do hydrocarbon moieties because of the
formation Si-O bonds at the interface. Tan et al. [47] and Mahlberg et al. [49] reported
the hydrophobization of paper surfaces using hexamethyldisilazane (HDMS) precursors
which yielded conformal film coatings. Tan et al. [47] also proposed a dual film
deposition method in which a double layer film was obtained by first depositing HDMS,
followed by a deposition of n-hexane. The double layer was reported to have good
mechanical stability because of the presence of HDMS film at the interface (between n-
hexane and cellulose) and also cost effective because of using n-hexane. With the
increasing interest in green technologies, Gaiolas et al. [29] very recently reported the
hydrophobization of paper using renewable, natural precursors such as limonene and
myrcene.
15

Apart from using polymerizable precursors to decrease the surface free energy of paper,
non-polymer forming gases have also been used as precursors to functionalize paper
surfaces. Carlsson et al.[35] reported that hydrogen plasma treatment of paper surfaces
reduced the hydroxyl functional groups of the cellulose and created low molecular
weight, low polarity functional groups, which resulted in an increase in the time needed
for water absorption. Deslandes et al. [50] studied the effects of nitrogen plasma
treatments on paper surfaces and found that the paper became more hydrophobic, as
indicated by increased water absorption times. However, in this case the change in the
surface energy was attributed to plasma induced degradation of the cellulose molecules
and not to the incorporation of nitrogen containing functional groups on the cellulose
surfaces.
1.1.4.3 Adhesion
The adhesion between cellulose and other polymers is critical for the use of cellulose
fibers as reinforcing elements in macromolecular composites. As discussed previously,
cellulose fibers have a non-polar surface due to the presence of OH groups. However,
most polymer matrices for making reinforced composites are hydrophobic, which results
in a low interfacial compatibility with cellulose fibers. Furthermore, the loss of
mechanical properties of cellulose fibers when exposed to moisture is also not desirable
in these applications [51]. Hence, cellulose fibers need to be surface modified to retard
moisture absorption and increase their interfacial adhesion with the polymer matrices.
Plasma processing of fibers can increase the adhesion in the following ways [52]: 1) by
introducing polar groups and radical sites to enhance bonding with the matrix, 2) by
16
forming a new polymer layer which can form covalent bonds with the matrix and 3) by
creating roughness on the fiber surface to increase mechanical interlocks between the
fiber and the matrix.
Wertheim et al. [34] first reported improvement of adhesion between cellulose and
polyethylene using a microwave discharge. Zanini et al. [53] studied the effects of argon
plasma treatments on lignocellulosic fibers in an attempt to create radical sites on the
fiber surfaces for improved fiber adhesion. Results from electron paramagnetic resonance
(EPR) spectroscopy confirmed the presence of phenoxy radicals on the fiber surface after
the plasma treatment. Morales et al. [54] extended this idea by creating radical sites on a
thin film of polymer deposited on the fiber surface. They synthesized radical rich
polystyrene-like films on the cellulose surface which provided a strong interface between
the fiber and the polystyrene matrix, resulting in good fiber-matrix adhesion. Ahlblad et
al. [55] reported the grafting of cellulose fibers with butadiene or divinylbenzene by
plasma treatment which increased the adhesion between the cellulose and polymer.
Young et al. [56] provided new insight regarding the improvement of adhesion between
cellulose fibers and polymers. A cyclohexane plasma was chosen in an attempt to make
the cellulose fiber surface rich in non-polar functional groups to enhance adhesion with a
non-polar polypropylene surface. Counter-intuitively, T-peel strength (hot pressing two
substrates together and peeling in a direction orthogonal to the substrate’s surface; the
structure looks like a “T” while peeling the substrates) results showed that the
cyclohexane plasma treatment did not significantly enhance the adhesion. On the other
17
hand, when the polypropylene was treated with an oxygen and argon plasma, the T-peel
strength increased significantly. From these results, Young et al. concluded that making
the cellulose surface non-polar is not sufficient to increase the adhesion strength;
however, enhancing the surface polarity can increase the adhesion strength. Possible
reasons for such observations were not discussed. Carlsson and Strom [36, 59] reported
that reduction of a cellulose surface in a hydrogen plasma environment, which decreases
the number of polar surface groups, does not have an effect on the adhesion of cellulose
to polyethylene. Additionally, they reported a decrease in adhesion that was attributed to
a weak boundary layer formed between the low molecular weight degradation products of
cellulose and polymer. They also reported that an oxygen plasma treatment of cellulose
enhances the cellulose-polymer adhesion because the oxygen plasma removed low
molecular weight resin-compounds on fibers which enhanced adhesion. Finally, some
researchers have reported an enhancement of adhesion with non-polar compounds by
adding polar groups to the cellulose surfaces; these observations are in opposition to the
concepts described in the beginning of this section. Interestingly, this counter-intuitive
conclusion has received little opposition to date.
1.1.4.4 Bioactivity
Recently, there has been an increased interest in the fabrication of bioactive paper
substrates [16]. Anti-bacterial paper finds potential applications in cost-effective lab
accessories and medical textiles. Jampala et al. [57] reported the synthesis of quaternary
ammonium groups on cellulose surfaces by using plasma processing techniques to obtain
bactericidal properties. They first treated the paper surfaces with an ethylenediamine
18
plasma to create secondary and tertiary amines on the surface, which were then treated
with hexyl bromide and methyl iodide to yield immobilized quaternary ammonium
groups. The treated paper surface inactivated 98.7% and 96.8% of S. aureus and K.
pneumoniae, respectively. Vasile et al. [58] reported the surface modification of
cellulose fibers using a variety of carboxylic acids to obtain anti-bacterial and anti-
allergic properties via the formation of cellulose esters.
Plasma modified cellulose surfaces also find application as a biomaterial (e.g.,
hemodialysis membrane). Poncin-Epaillard [59] proposed that treatment of cellulose
surfaces with CF4 plasmas reduced the bio-activation for use in hemodialysis membranes
by decreasing surface OH groups on the cellulose surfaces.
Plasma treatments have also been used for the removal of microbial contaminations from
paper substrates that contained printed cultural relics, in an attempt to protect the cultural
heritage available in books and paintings. In 2001, Vohrer et al. [60] reported the removal
of Bacillus subtilis and Aspergillus niger contamination on naturally aged ground paper
from the 1950s using oxygen and hydrogen precursors.
19
1.2 Motivation and objectives
Many living organisms exhibit unusual wettability behavior that causes water drops to be
repelled and roll off the surface; examples are plants [61, 62] (lotus leaves, cabbage,
Indian cress, etc) and insects wings [61-63] (butterflies, cicada, etc.). There has been a
significant interest in fabricating such water repellant surfaces by artificial means since
the late 1930s. A surface is generally classified as superhydrophobic (SH) if it has a static
water contact angle (CA) greater than 150° [61, 63, 64].
When the free energy of a homogeneous, flat surface is lowered through modifications of
its chemical composition, the water CA increases [63, 64]. However, the CA values of
chemically modified flat surfaces are bound by certain limits: the highest water CA
recorded on a flat surface was 120°, with a free energy of 6.7 mJ/m2 [63-65]. The water
CA can be further enhanced only by creating some type of roughness or patterns on the
hydrophobic surface.
Wenzel [66, 67] proposed a model (Figure 1.5a) describing the increased CA due to
surface roughness as follows:
θθ coscos * r=
(1.1)
where θ*and θ are the macroscopic contact angles of the rough substrate and of a flat
substrate of the same chemical composition, respectively; r is the roughness factor which
is defined as the ratio of the actual area of the rough surface to the geometrically
20
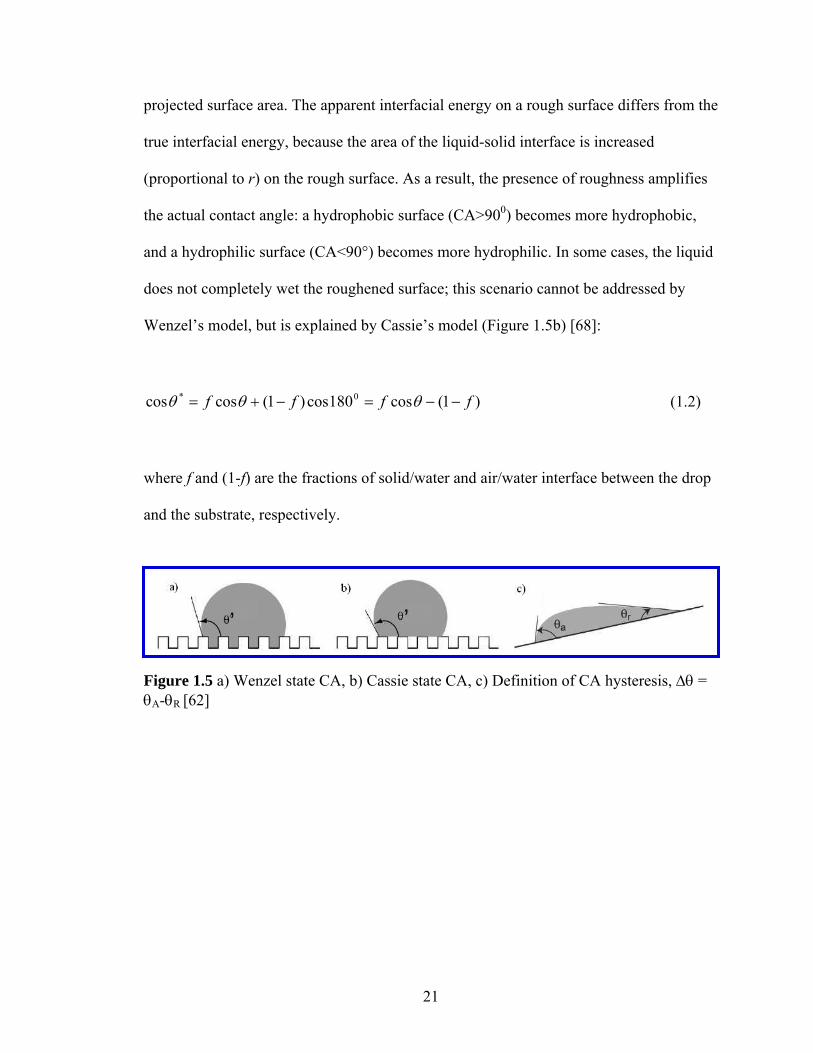
projected surface area. The apparent interfacial energy on a rough surface differs from the
true interfacial energy, because the area of the liquid-solid interface is increased
(proportional to r) on the rough surface. As a result, the presence of roughness amplifies
the actual contact angle: a hydrophobic surface (CA>900) becomes more hydrophobic,
and a hydrophilic surface (CA<90°) becomes more hydrophilic. In some cases, the liquid
does not completely wet the roughened surface; this scenario cannot be addressed by
Wenzel’s model, but is explained by Cassie’s model (Figure 1.5b) [68]:
)1(cos180cos)1(coscos 0* ffff −−=−+= θθθ (1.2)
where f and (1-f) are the fractions of solid/water and air/water interface between the drop
and the substrate, respectively.
Figure 1.5 a) Wenzel state CA, b) Cassie state CA, c) Definition of CA hysteresis, Δθ = θA-θR [62]
21
Although the sliding of a water drop is typically visualized as the movement of the water
molecules at the solid-liquid interface, only the interfacial (solid-liquid) water molecules
at the three-phase contact line move. All other interfacial (solid-liquid) water molecules
remain stationary, thus obeying the no-slip boundary condition of fluid mechanics [69,
70]. When a drop slides on a surface, the contact line on the front edge advances over the
surface and the contact line on the trailing edge recedes over the surface. Any kinetic
energy barrier to the movement of the receding contact lines results in a difference in
contact line dynamics for the two drop edges, which is referred to as hysteresis [71]. Such
kinetic energy barriers can be caused by physical heterogeneity (roughness) and/or
chemical heterogeneity. Figure 1.5c describes the definition of CA hysteresis. This value
is a measure of the stickiness of the water drop to the surface. A lower value of CA
hysteresis implies that the water drop can easily slide off the surface. Johnson and Dettre
[72-74] pointed out that the hysteresis is a balance between energy barrier heights of
between metastable states and the vibrational energy of the drop. They formulated a
mathematical model in which the height of the energy barriers was changed to obtain
different hysteresis values. Nevertheless, they could not use this model to quantitatively
predict the hysteresis on their real surfaces and gave only qualitative explanations.
Recently, Chen et al.[75] pointed out that the energy barrier can be attributed to the line
tension of the contact line at the three-phase interface. To date, kinetic energy barriers for
movement of the contact line (causing the hysteresis) and/or the line tension has not been
modeled mathematically; thus, prediction of the hysteresis for a drop sliding on a surface
has not been possible.
22
Superhydrophobic paper opens a new window of applications for paper substrates as a
substitute for polymers in textile, chemical and biomedical industries. As described in the
previous sections, two hundred years of surface modification of paper (including plasma
processing) have resulted mainly in turning hydrophilic paper hydrophobic; at the start of
this project in 2006, fabrication of superhydrophobic paper had not been reported. The
main reason is that research efforts had concentrated on changing the surface energy of
paper by changing the surface chemistry; the surface roughness aspect which is critical in
achieving surface superhydrophobicity, had been neglected.
Contemporary to this thesis work a couple of other research groups also started focusing
on making paper superhydrophobic: in one study, in-situ atom transfer radical
polymerization (ATRP) was used to graft and grow a polymer layer with nanoscale
roughness on a fiber surface, which led to superhydrophobicity (water contact angles
>160°) [76]. In another study, polymethylsilsesquioxane coatings were covalently
bonded onto the cellulose fiber surfaces via a polycondensation reaction between the
hydroxyl groups of silanol and cellulose. Deposition of this low surface energy film also
resulted in the formation of nano-scale roughness resulting in a superhydrophobic paper
surface with a contact angle of 157° [77]. However, because the nanoscale roughness of
the surfaces in the above two methods is associated with a deformable polymer film,
robustness and durability are limited. Superhydrophobicity was also imparted onto paper
surfaces by depositing nano-scale silica particles on the fibers using sol-gel approaches
and fluorinating the resulting surface using perfluorooctyltriethoxysilane to obtain low
surface energy [78]. In another study, fine micron-sized particles of alkyl ketene dimer
23
(AKD) were formed by rapid expansion of AKD solutions in supercritical carbon
dioxide. The deposited AKD layer had the appropriate roughness scale for
superhydrophobicity and yielded a contact angle of 173° [79].
In all the above referenced work, surface roughness was obtained by depositing an
additional material onto paper. This raises concerns about the adhesion of those materials
to the cellulose fiber surfaces and the mechanical robustness. It would be advantageous to
change the surface topography of cellulose fibers inherently, instead of though deposition
of a foreign material. This thesis project aimed to address this issue by uncovering the
inherent roughness scales present on fiber surfaces by plasma etching and by depositing a
thin fluorocarbon film via plasma polymerization. Thus, there would be no need to
deposit foreign materials to obtain roughness. Also, the above mentioned methods
(reported by other researchers) used a solvent based approach in at least one of the
fabrication steps; this approach is not ideal because of safety and environmental
considerations [80]. The current project uses a more environmentally friendly plasma
processing (vapor-based) approach which has been recently included in the list of “green”
technologies [29].
In principle, different levels of adhesion (’stickiness’) can be achieved on a
superhydrophobic surface depending on the sizes and shapes of the roughness scales.
This tunability has not been reported on any superhydrophobic surface to date, including
superhydrophobic paper. The current thesis project investigated approaches to obtaining
24
tunable ‘stickiness’ on superhydrophobic paper surfaces by manipulating plasma
processing parameters.
Out of approximately 6.1 billion people in the world, one-third of them do not have
access to electricity,[81] nearly one-fourth live below the poverty line of $1.25/day[82]
and one-sixth are not educated enough to read or write their names.[83] In spite of this,
the focus of biomedical research is primarily on industrialized nations which is
notoriously referred as the ‘10/90 gap’.[84] Considering these facts, lab-on-chip (LOC)
biomedical diagnostic devices targeted for developing countries must be made as simple
and affordable as possible in order for them to be handled by less skilled technicians in
resource limited point-of-care (POC)[81] environments. Recently, paper-based lab-on-
Chip (LOC) devices (also referred to as lab-on-paper (LOP)[16]) have emerged as a
promising alternative technology for the commercially available LOC microfluidic
devices. In a recent report on the top ten biotechnologies for improving health in
developing countries “modified molecular technologies for affordable, simple diagnosis
of infectious diseases” was ranked as the number one priority [85, 86]. Another report on
the grand challenges for global health ranked the development of technologies to
“measure disease and health status accurately and economically in poor countries” first
among the top 14 priorities [86, 87]. Due to their affordability and potentially simple
fabrication technology, LOP devices may offer improved global availability of medical
technology. This thesis project aimed to develop a two-dimensional LOP device capable
of storage, transfer, mixing and sampling of liquid drops by decorating superhydrophobic
paper substrates with high surface energy ink patterns.
25
With the brief introduction of the goals described above, the specific objectives of the
thesis project were:
a) To fabricate superhydrophobic paper surfaces via plasma processing
b) To obtain tunability of adhesion of water drops on superhydrophobic paper
surfaces by controlling the etching and deposition times
c) To study the effect of fiber types and paper making parameters in rendering paper
superhydrophobic
d) To pattern superhydrophobic paper with phaser printer inks to control the
mobility and adhesion of micro-liter drops and thus obtain a two-dimensional
droplet manipulation device
e) To optimize the patterning geometries to control the directional mobility and
adhesion of water drops on a two-dimensional droplet manipulation device
1.3 Thesis organization
Chapter 2 (Objective a) describes the appropriate plasma processing conditions to impart
superhydrophobic property to paper surfaces. The characterization of superhydrophobic
paper surfaces via SEM, ATR-FTIR, XPS and contact angle goniometry is presented.
Chapter 3 (Objective b) describes methods to obtain tunable adhesion of water drops on
superhydrophobic paper surfaces. The fundamental wettability mechanisms that control
the tunability of the stickiness are discussed in detail. Chapter 4 (Objective c) discusses
the effect of fiber source and other paper making parameters on the ability to make paper
superhydrophobic using plasma processing and this work provides additional insight that
is useful for designing superhydrophobic paper. Chapter 5 (Objective d) describes the
26
methods to pattern superhydrophobic paper surfaces with high surface energy islands to
obtain tunability in adhesion forces for water drops. The adhesion forces with respect to
the island sizes and geometries are extensively studied and the mobility of water drops on
these patterned substrates is modeled using classical adhesion force expressions. The
fabrication of a two-dimensional lab-on-paper device using the patterned
superhydrophobic papers is described. Chapter 6 (Objective e) discusses the optimization
of patterning geometries on superhydrophobic paper surfaces in order to maximize
control over the directional mobility and adhesion of drops. Chapter 7 presents the
overall summary and conclusions of the project, as well as recommendations for future
research.
27
REFERENCES
1. Smook, G.A., Handhook for Pulp & Paper Technologists. 3rd ed. 2002, Vancouver, B.C.: Angus Wilde Publications Inc.
2. Wikipedia, History of Paper, in http://en.wikipedia.org/wiki/History_of_paper#cite_note-1. 2009.
3. Canopy. Seeking Responsible Paper Production Worldwide. http://www.canopyplanet.org/index.php?page=global-forest-spotlights 2009.
4. Lim, W., E.A. Douglas, S.H. Kim, D.P. Norton, S.J. Pearton, F. Ren, H. Shen, and W.H. Chang, High Mobility Ingazno4 Thin-Film Transistors on Paper. Applied Physics Letters, 2009. 94(7): p. 072103-1 - 072103-3.
5. Martins, R., P. Barquinha, L. Pereira, N. Correia, G. Goncalves, I. Ferreira, and E. Fortunato, Write-Erase and Read Paper Memory Transistor. Applied Physics Letters, 2008. 93(20): p. 203501-1 - 203501-3.
6. Murphy, M., Paper and Urine Battery May Find Medical Use. Chemistry & Industry, 2005(17): p. 10-10.
7. Rigby, P., Bendy Battery Made from Paper. Materials Today, 2007. 10(10): p. 9-9.
8. Kim, J., S. Yun, and Z. Ounaies, Discovery of Cellulose as a Smart Material. Macromolecules, 2006. 39(12): p. 4202-4206.
9. Nilsson, D., T. Kugler, P.O. Svensson, and M. Berggren, An All-Organic Sensor-Transistor Based on a Novel Electrochemical Transducer Concept Printed Electrochemical Sensors on Paper. Sensors and Actuators B-Chemical, 2002. 86(2-3): p. 193-197.
10. Abe, K., K. Suzuki, and D. Citterio, Inkjet-Printed Microfluidic Multianalyte Chemical Sensing Paper. Analytical Chemistry, 2008. 80(18): p. 6928-6934.
28
11. Bruzewicz, D.A., M. Reches, and G.M. Whitesides, Low-Cost Printing of Poly(Dimethylsiloxane) Barriers to Define Microchannels in Paper. Analytical Chemistry, 2008. 80(9): p. 3387-3392.
12. Martinez, A.W., S.T. Phillips, M.J. Butte, and G.M. Whitesides, Patterned Paper as a Platform for Inexpensive, Low-Volume, Portable Bioassays. Angewandte Chemie-International Edition, 2007. 46(8): p. 1318-1320.
13. Martinez, A.W., S.T. Phillips, E. Carrilho, S.W. Thomas, H. Sindi, and G.M. Whitesides, Simple Telemedicine for Developing Regions: Camera Phones and Paper-Based Microfluidic Devices for Real-Time, Off-Site Diagnosis. Analytical Chemistry, 2008. 80(10): p. 3699-3707.
14. Martinez, A.W., S.T. Phillips, and G.M. Whitesides, Three-Dimensional Microfluidic Devices Fabricated in Layered Paper and Tape. Proceedings of the National Academy of Sciences of the United States of America, 2008. 105(50): p. 19606-19611.
15. Martinez, A.W., S.T. Phillips, B.J. Wiley, M. Gupta, and G.M. Whitesides, Flash: A Rapid Method for Prototyping Paper-Based Microfluidic Devices. Lab on a Chip, 2008. 8(12): p. 2146-2150.
16. Zhao, W.A. and A. van den Berg, Lab on Paper. Lab on a Chip, 2008. 8(12): p. 1988-1991.
17. Sponsler, O.L., X-Ray Methods Used in Determining Structure of Cellulose Fibers - Organomolecular Investigations. Industrial and Engineering Chemistry, 1928. 20(1): p. 1060-1062.
18. Walker, W.H., A Recent Development in the Chemistry of Cellulose. Journal of the Franklin Institute, 1907. 164: p. 131-140.
19. Deraman, M., S. Zakaria, and J.A. Murshidi, Estimation of Crystallinity and Crystallite Size of Cellulose in Benzylated Fibres of Oil Palm Empty Fruit Bunches by X-Ray Diffraction. Japanese Journal of Applied Physics, Part 1: Regular Papers and Short Notes and Review Papers, 2001. 40(5 A): p. 3311-3314.
20. Ranby, B., Recent Progress on Structure and Morphology of Cellulose. Advances in Chemistry Series, 1969(95): p. 139-151.
29
21. Zhao, H.B., J.H. Kwak, Z.C. Zhang, H.M. Brown, B.W. Arey, and J.E. Holladay, Studying Cellulose Fiber Structure by Sem, Xrd, Nmr and Acid Hydrolysis. Carbohydrate Polymers, 2007. 68(2): p. 235-241.
22. McKeown, J.J. and W.I. Lyness, Evidence for Retention of the Crystalline-Amorphous Ratio of Cellulose During Heterogeneous Acid Hydrolysis. Journal of Polymer Science, 1960. 47(0149): p. 9-17.
23. Manley, R.S.J., Fine Structure of Native Cellulose Microfibrils. Nature, 1964. 204(496): p. 1155-1157.
24. Ranby, B., Morphology of Native Cellulose Related to the Biological Synthesis. Cellulose Chemistry and Technology, 1997. 31(1/2): p. 3-16.
25. Sjostrom, E., Wood Chemistry: Fundamentals and Applications. 1981, London: Academic Press, Inc. .
26. Paper-on-Web. Properties of Wood. http://www.paperonweb.com/wood.htm 2009.
27. Sapieha, S., M. Verreault, J.E. Klemberg-Sapieha, E. Sacher, and M.R. Wertheimer, X-Ray Photoelectron Study of the Plasma Fluorination of Lignocellulose. Applied Surface Science, 1990. 44(2): p. 165-169.
28. Wang, F. and H. Tanaka, Aminated Poly-N-Vinylformamide as a Modern Retention Aid of Alkaline Paper Sizing with Acid Rosin Sizes. Journal of Applied Polymer Science, 2000. 78(10): p. 1805-1810.
29. Gaiolas, C., M.N. Belgacem, L. Silva, W. Thielemans, A.P. Costa, M. Nunes, and M.J.S. Silva, Green Chemicals and Process to Graft Cellulose Fibers. Journal of Colloid and Interface Science, 2009. 330(2): p. 298-302.
30. Mukhopadhyay, S. and R. Fangueiro, Physical Modification of Natural Fibers and Thermoplastic Films for Composites - a Review. Journal of Thermoplastic Composite Materials, 2009. 22(2): p. 135-162.
31. Mott-Smith, H.M., History Of "Plasmas". Nature, 1971. 233: p. 219-219.
30
32. Bioelectrochemistry. Biographies of Famous Electrochemists and Physicists Contributed to Understanding of Electricity. http://www.geocities.com/bioelectrochemistry/index.htm 2003.
33. Levchik, S., J. Scheirs, G. Camino, W. Tumiatti, and M. Avidano, Depolymerization Processes in the Thermal Degradation of Cellulosic Paper Insulation in Electrical Transformers. Polymer Degradation and Stability, 1998. 61(3): p. 507-511.
34. Wertheim.Mr, G. Suranyi, and D.A.I. Goring, Improvement in Bonding Properties of Cellulose and Polyethylene by Treatment in a Microwave Discharge. Tappi, 1972. 55(12): p. 1707.
35. Carlsson, C.M.G. and G. Strom, Reduction and Oxidation of Cellulose Surfaces by Means of Cold-Plasma. Langmuir, 1991. 7(11): p. 2492-2497.
36. Carlsson, G., G. Strom, and G. Annergren, Water Sorption and Surface Composition of Untreated or Oxygen Plasma-Treated Chemical Pulps. Nordic Pulp & Paper Research Journal, 1995. 10(1): p. 17-23.
37. Carlsson, C.M.C., G. Strom, I. Eriksson, and E. Lindstrom, Improved Wettability of Ctmp by Oxygen-Plasma Treatment. Nordic Pulp & Paper Research Journal, 1994. 9(2): p. 72-75.
38. Vesel, A., M. Mozetic, A. Hladnik, J. Dolenc, J. Zule, S. Milosevic, N. Krstulovic, M. Klanjsek-Gunde, and N. Hauptmann, Modification of Ink-Jet Paper by Oxygen-Plasma Treatment. Journal of Physics D-Applied Physics, 2007. 40(12): p. 3689-3696.
39. Denes, F., Z.Q. Hua, E. Barrios, R.A. Young, and J. Evans, Influence of Rf-Cold Plasma Treatment on the Surface-Properties of Paper. Journal of Macromolecular Science-Pure and Applied Chemistry, 1995. A32(8-9): p. 1405-1443.
40. Sapieha, S., A.M. Wrobel, and M.R. Wertheimer, Plasma-Assisted Etching of Paper. Plasma Chemistry and Plasma Processing, 1988. 8(3): p. 331-346.
41. Sahin, H.T., S. Manolache, R.A. Young, and F. Denes, Surface Fluorination of Paper in Cf4-Rf Plasma Environments. Cellulose, 2002. 9(2): p. 171-181.
31

42. Sahin, H.T., Rf-Cf4 Plasma Surface Modification of Paper: Chemical Evaluation of Two Sidedness with Xps/Atr-Ftir. Applied Surface Science, 2007. 253(9): p. 4367-4373.
43. Mukhopadhyay, S.M., P. Joshi, S. Datta, and J. Macdaniel, Plasma Assisted Surface Coating of Porous Solids. Applied Surface Science, 2002. 201(1-4): p. 219-226.
44. Navarro, F., F. Davalos, F. Denes, L.E. Cruz, R.A. Young, and J. Ramos, Highly Hydrophobic Sisal Chemithermomechanical Pulp (Ctmp) Paper by Fluorotrimethylsilane Plasma Treatment. Cellulose, 2003. 10(4): p. 411-424.
45. Navarro, F., F. Davalos, R. Gonzalez-Cruz, F. Lopez-Dellamary, R. Manriquez, J. Turrado, and J. Ramos, Sisal Chemo-Thermomechanical Pulp Paper with a Strongly Hydrophobic Surface Coating Produced by a Pentafluorophenyldimethylsilane Cold Plasma. Journal of Applied Polymer Science, 2009. 112(1): p. 479-488.
46. Vaswani, S., J. Koskinen, and D.W. Hess, Surface Modification of Paper and Cellulose by Plasma-Assisted Deposition of Fluorocarbon Films. Surface & Coatings Technology, 2005. 195(2-3): p. 121-129.
47. Tan, I.H., M.L.P. da Silva, and N.R. Demarquette, Paper Surface Modification by Plasma Deposition of Double Layers of Organic Silicon Compounds. Journal of Materials Chemistry, 2001. 11(4): p. 1019-1025.
48. Tu, X., R.A. Young, and F. Denes, Improvement of Bonding between Cellulose and Polypropylene by Plasma Treatment. Cellulose, 1994. 1(1): p. 87-106.
49. Mahlberg, R., H.E.M. Niemi, F. Denes, and R.M. Rowell, Effect of Oxygen and Hexamethyldisiloxane Plasma on Morphology, Wettability and Adhesion Properties of Polypropylene and Lignocellulosics. International Journal of Adhesion and Adhesives, 1998. 18(4): p. 283-297.
50. Deslandes, Y., G. Pleizier, E. Poiré, S. Sapieha, M.R. Wertheimer, and S. E., The Surface Modification of Pure Cellulose Paper Induced by Low-Pressure Nitrogen Plasma Treatment. Plasmas and Polymers, 1998. 3(2): p. 61-76.
32

51. Belgacem, M.N. and A. Gandini, The Surface Modification of Cellulose Fibres for Use as Reinforcing Elements in Composite Materials. Composite Interfaces, 2005. 12(1-2): p. 41-75.
52. Li, R.Z., L. Ye, and Y.W. Mai, Application of Plasma Technologies in Fibre-Reinforced Polymer Composites: A Review of Recent Developments. Composites Part a-Applied Science and Manufacturing, 1997. 28(1): p. 73-86.
53. Zanini, S., C. Riccardi, C. Canevali, M. Orlandi, L. Zoia, and E.L. Tolppa. Modifications of Lignocellulosic Fibers by Ar Plasma Treatments in Comparison with Biological Treatments. 2005: Elsevier Science Sa.
54. Morales, J., M.G. Olayo, G.J. Cruz, P. Herrera-Franco, and R. Olayo, Plasma Modification of Cellulose Fibers for Composite Materials. Journal of Applied Polymer Science, 2006. 101(6): p. 3821-3828.
55. Ahlblad, G., A. Kron, and B. Stenberg, Effects of Plasma Treatment on Mechanical-Properties of Rubber/Cellulose Fiber Composites. Polymer International, 1994. 33(1): p. 103-109.
56. Young, R.A., F. Denes, Z.-Q. Hua, H. Sbharwal, and L. Nielsen. Cold Plasma Modification of Lignocellulosic Materials. in The 8th International Symposium on Wood and Pulping Chemistry. 1995. Helsinki, Finland.
57. Jampala, S.N., M. Sarmadi, E.B. Somers, A.C.L. Wong, and F.S. Denes, Plasma-Enhanced Synthesis of Bactericidal Quaternary Ammonium Thin Layers on Stainless Steel and Cellulose Surfaces. Langmuir, 2008. 24(16): p. 8583-8591.
58. Vasile, C., M. Totolin, and M.C. Tibirna, Grafting of Some Bio-Fibres with Carboxylic Acids under Cold Plasma Conditions. Journal of the Balkan Tribological Association, 2008. 14(1): p. 107-137.
59. Poncinepaillard, F., G. Legeay, and J.C. Brosse, Plasma Modification of Cellulose Derivatives as Biomaterials. Journal of Applied Polymer Science, 1992. 44(9): p. 1513-1522.
60. Vohrer, U., I. Trick, J. Bernhardt, C. Oehr, and H. Brunner. Plasma Treatment - an Increasing Technology for Paper Restoration? 2001: Elsevier Science Sa.
33
61. Ma, M.L. and R.M. Hill, Superhydrophobic Surfaces. Current Opinion in Colloid & Interface Science, 2006. 11(4): p. 193-202.
62. Callies, M., Y. Chen, F. Marty, A. Pepin, and D. Quere, Microfabricated Textured Surfaces for Super-Hydrophobicity Investigations. Microelectronic engineering, 2005. 78(79): p. 100-105.
63. Sun, T.L., L. Feng, X.F. Gao, and L. Jiang, Bioinspired Surfaces with Special Wettability. Accounts of Chemical Research, 2005. 38(8): p. 644-652.
64. Nakajima, A., K. Hashimoto, and T. Watanabe, Recent Studies on Super-Hydrophobic Films. Monatshefte Fur Chemie, 2001. 132(1): p. 31-41.
65. Nishino, T., M. Meguro, K. Nakamae, M. Matsushita, and Y. Ueda, The Lowest Surface Free Energy Based on -Cf3 Alignment. Langmuir, 1999. 15(13): p. 4321-4323.
66. Wenzel, R.N., Resistance of Solid Surfaces to Wetting by Water. Ind. Eng. Chem., 1936. 28: p. 988-994.
67. Wenzel, R.N., Surface Roughness and Contact Angle. J Phys. Colloid Chem., 1949. 53(9): p. 1466-1467.
68. Cassie, A.B.D. and S. Baxter, Wettability of Porous Surfaces. Transactions of the Faraday Society, 1944. 40: p. 546-550.
69. Gao, L.C. and T.J. McCarthy, The "Lotus Effect" Explained: Two Reasons Why Two Length Scales of Topography Are Important. Langmuir, 2006. 22(7): p. 2966-2967.
70. Gao, L.C. and T.J. McCarthy, "Artificial Lotus Leaf" Prepared Using a 1945 Patent and a Commercial Textile. Langmuir, 2006. 22(14): p. 5998-6000.
71. Youngblood, J.P. and T.J. McCarthy, Ultrahydrophobic Polymer Surfaces Prepared by Simultaneous Ablation of Polypropylene and Sputtering of Poly(Tetrafluoroethylene) Using Radio Frequency Plasma. Macromolecules, 1999. 32(20): p. 6800-6806.
34
72. Johnson Jr., R.E. and R.H. Dettre, Contact Angle Hysteresis .3. Study of an Idealized Heterogeneous Surface. Journal of Physical Chemistry, 1964. 68(7): p. 1744-1750.
73. Johnson Jr., R.E. and R.H. Dettre, Contact Angle Hysteresis I. Study of an Idealized Rough Surface, in Contact Angle, Wettability and Adhesion; Adv. Chem. Ser., R.F. Gould, Editor. 1964, Amer. Chem. Soc., Washington D. C. p. 112-135.
74. Johnson Jr., R.E., R.H. Dettre, and D.A. Brandreth, Dynamic Contact Angles and Contact-Angle Hysteresis. Journal of Colloid and Interface Science, 1977. 62(2): p. 205-212.
75. Chen, W., A.Y. Fadeev, M.C. Hsieh, D. Oner, J. Youngblood, and T.J. McCarthy, Ultrahydrophobic and Ultralyophobic Surfaces: Some Comments and Examples. Langmuir, 1999. 15(10): p. 3395-3399.
76. Nystrom, D., J. Lindqvist, E. Ostmark, A. Hult, and E. Malmstrom, Superhydrophobic Bio-Fibre Surfaces Via Tailored Grafting Architecture. Chemical Communications, 2006(34): p. 3594-3596.
77. Li, S.H., S.B. Zhang, and X.H. Wang, Fabrication of Superhydrophobic Cellulose-Based Materials through a Solution-Immersion Process. Langmuir, 2008. 24(10): p. 5585-5590.
78. Yang, H. and Y. Deng, Preparation and Physical Properties of Superhydrophobic Papers. Journal of Colloid and Interface Science, 2008. 325(2): p. 588-593.
79. Quan, C., O. Werner, L. Wagberg, and C. Turner, Generation of Superhydrophobic Paper Surfaces by a Rapidly Expanding Supercritical Carbon Dioxide-Alkyl Ketene Dimer Solution. Journal of Supercritical Fluids, 2009. 49(1): p. 117-124.
80. Liston, E.M., L. Martinu, and M.R. Wertheimer, Plasma Surface Modification of Polymers for Improved Adhesion - a Critical-Review. Journal of Adhesion Science and Technology, 1993. 7(10): p. 1091-1127.
81. Yager, P., T. Edwards, E. Fu, K. Helton, K. Nelson, M.R. Tam, and B.H. Weigl, Microfluidic Diagnostic Technologies for Global Public Health. Nature, 2006. 442(7101): p. 412-418.
35
36
82. Schifferes, S. World Poverty 'More Widespread' 2008; Available from: http://povertynewsblog.blogspot.com/2008/08/world-poverty-more-widespread.html.
83. Boaz, D. Illiteracy -- the Bad News and the Good. 1999; Available from: http://www.cato.org/pub_display.php?pub_id=5551.
84. Feachem, R.G.A. 10/90 Report on Health Research 2003-2004. 2004; Available from: http://www.globalforumhealth.org/Site/002__What%20we%20do/005__Publications/001__10%2090%20reports.php.
85. Daar, A.S., H. Thorsteinsdottir, D.K. Martin, A.C. Smith, S. Nast, and P.A. Singer, Top Ten Biotechnologies for Improving Health in Developing Countries. Nature Genetics, 2002. 32(2): p. 229-232.
86. Chin, C.D., V. Linder, and S.K. Sia, Lab-on-a-Chip Devices for Global Health: Past Studies and Future Opportunities. Lab on a Chip, 2007. 7(1): p. 41-57.
87. Varmus, H., R. Klausner, E. Zerhouni, T. Acharya, A.S. Daar, and P.A. Singer, Grand Challenges in Global Health. Science, 2003. 302(5644): p. 398-399.
CHAPTER 2
FABRICATION OF “ROLL-OFF” AND “STICKY”
SUPERHYDROPHOBIC CELLULOSE SURFACES VIA PLASMA
PROCESSING*
2.1 Introduction
As mentioned in the previous chapter, it has long been recognized that superhydrophobic
surfaces [1] (water contact angle >150°) require a unique combination of two
fundamental properties: 1) surface roughness and 2) low surface energy. To date,
superhydrophobic surfaces have been fabricated with a variety of length scales, e.g.
single length scale (nanometer range [2-4] or micrometer range [5-7]) or hierarchical
combination of length scales (micrometer-micrometer [8] or micrometer-nanometer [9-
11]) with various topographies. Since the late 1930s, significant interest has existed in
designing water repellant surfaces by artificially generating these two properties on a
variety of materials. From a processing viewpoint, the desired combination can be
obtained via several routes: 1) add roughness to an inherently low surface energy
material; 2) add roughness to a hydrophilic surface and then modify it with a hydrophobic
surface treatment; or 3) modify a surface with a low surface energy material which adds
___________________________
* Material from this chapter has been published as part of the following publications: 1) Balu, B., Breedveld, V., and Hess, D.W., Fabrication of "roll-off" and "sticky" superhydrophobic cellulose surfaces via plasma processing. Langmuir, 2008. 24(9): p. 4785-4790. 2) Balu, B., Kim, J.S., Breedveld, V., and Hess, D.W., Tunability of the Adhesion of Water Drops on a Superhydrophobic Paper Surface Via Selective Plasma Etching. Journal of Adhesion Science & Technology, 2009. 23: p. 361-380.
37
inherent roughness, for example the deposition of hydrophobic nanoparticles. Surface
roughness at nano- and micro-meter scales has been obtained through a variety of
methods: controlled crystallization [12], plasma etching [13], laser etching [14], plasma
enhanced chemical vapor deposition [15], lithography [16], electro-spinning and
spraying [17], sol-gel processing [18], stretching [19], nanocasting [20], and graft-on-
graft polymerization [21]. Similarly, there are numerous ways to modify the surface
chemistry, such as sol-gel processing [18], graft polymerization [21], electrochemical
deposition [22], plasma enhanced chemical vapor deposition [23], chemical vapor
deposition [13], and atomic layer deposition [24]. The selection of the appropriate
method to create roughness and/or low surface energy depends on the mechanical and
physiochemical properties of the substrate.
Artificial superhydrophobic surfaces have been fabricated on a variety of organic and
inorganic substrates, e.g. polymers [8, 13, 25-27], Si wafers [5, 9, 11], glass slides [10,
28], metals [29, 30]. With the increased environmental interest in the use of renewable
resources and biodegradable materials, the inorganic substrates listed above are less than
ideal. Moreover, they are not mechanically flexible, which limits their processability and
therefore the range of potential applications. Organic polymer substrates, on the other
hand, are flexible, but they tend to be fairly expensive and often lack biodegradability and
renewability. Hence, the search for alternative substrates for superhydrophobic surfaces
is important. Cellulose, a biodegradable, renewable, inexpensive, biopolymer, which is
abundantly present in nature, has been targeted as a candidate. If cellulose-based paper
substrates can be rendered superhydrophobic by simple processing schemes, they will
38
offer a promising alternative to conventional superhydrophobic substrates. Due to
relatively low cost and mechanical flexibility, these surface-modified materials could
have applications in a vast array of products, including fast food and microwavable food
packages, beverage containers, self-cleaning cartons, labels, paper boards, textiles, heat
transfer surfaces (to remove condensed water quickly), microfluidic devices and
membranes with low degrees of surface fouling.
Paper surfaces have micrometer roughness due to the network of overlapping fibers, but
lack the smaller nanoscale roughness that is usually associated with superhydrophobicity.
As mentioned in section 1.2 (Chapter 1), it would be advantageous to change the surface
topography of cellulose fibers inherently, instead of achieving roughness via a deposited
surface layer. To proceed in this direction, it is essential to understand the internal
structure of cellulose fibers; considerable information has been published on this topic
[31-37]. As shown in Figure 1.2 (Chapter 1) each cellulose fiber consists of several
microfibril-bundles, which in turn are composed of microfibrils that have diameters
ranging from 3 to 30 nm [31, 32, 34, 36]. In combination with the already mentioned
micrometer length scale of the fiber network, the microfibrils could therefore provide the
necessary additional length scale for superhydrophobicity. Because the surface of native
cellulose fibers is relatively smooth, the challenge is to find a method to roughen the
surface by exposing the microfibrils. One key characteristic of the microfibrils is that
they contain mostly crystalline cellulose moieties, while the matrix surrounding the
microfibrils is predominantly amorphous in nature [31-33, 38]. Taking advantage of this
inherent difference in material properties may offer a viable approach to generate
39
superhydrophobicity on cellulose surfaces. Unfortunately, cellulose fibers represent a
relatively complex substrate and their properties, in particular their water absorbency,
stretchability, compressibility, porosity, non-uniform surface chemistry and thermal
degradability, inhibit the use of most of the commonly used techniques for creating
smaller characteristic length scales (see above discussion).
Domain-selective etching has been used to create surface roughness on polymer
substrates with crystalline and amorphous domains [13, 27, 39, 40]. In these studies,
etching was performed by a vapor phase plasma process at low temperature, under
solvent-free conditions. Selectivity is based on the premise that amorphous domains of
polymer substrates will be more susceptible to reactive plasma etching than crystalline
domains. Etching thus preferentially erodes the amorphous domains, leaving behind the
crystalline domains. This process ultimately results in a roughened polymer surface with
a characteristic length scale that is determined by the size of and distance between
crystalline domains. Because of the difference in crystallinity between microfibrils and
surrounding matrix, the hypothesis is that selective etching should also be possible on
cellulose fibers, provided that the appropriate etching conditions are generated. Previous
studies applied plasma-assisted etching of paper surfaces to investigate interfiber
bonding, internal structures of fibers, and coating distribution within the paper [41]. The
focus of these studies was to establish plasma processing conditions that were agressive
(using CF4 and O2 gases), so that the etching process served as a fine microtome to
generate a z-directional cross-section of the paper for analysis of various properties with
respect to depth. This Chapter focuses on surface modification (altering only the top
40
layers of fibers) while maintaining bulk paper properties. As a result, this investigation
invoked considerably less aggressive plasma etching conditions to achieve selective
etching of the surface layers of cellulose fibers in order to generate appropriate roughness
scales for superhydrophobicity. However, as discussed previously, roughness is not
sufficient to establish superhydrophobicity. The inherently hydrophilic cellulose fibers
must also be hydrophobized. The hydrophobization was imparted by plasma-enhanced
chemical vapor deposition (PECVD) of a fluorocarbon coating.
In this chapter we demonstrate that superhydrophobic properties can be created on paper
surfaces via a combination of selective etching by an oxygen plasma and deposition of a
fluorocarbon film (~100 nm on Si wafer) from pentafluoroethane (PFE) monomer via
plasma-enhanced chemical vapor deposition (PECVD). Because both steps alter
primarily the surface properties of cellulose fibers, it is expected that the bulk material
properties remain unchanged. Also, because the approach relies on uncovering roughness
present inherently on cellulose fibers, the roughness obtained by this approach should be
more mechanically robust than roughness generated from foreign materials that have
been used previously to impart superhydrophobicity to paper.
2.2 Experimental
2.2.1 Handsheet formation
Commercial paper contains filler particles and other additives to enhance its physical and
optical properties[42]. In order to initially avoid the interaction of these particles with the
surface modification techniques employed, control samples were used, generally referred
41
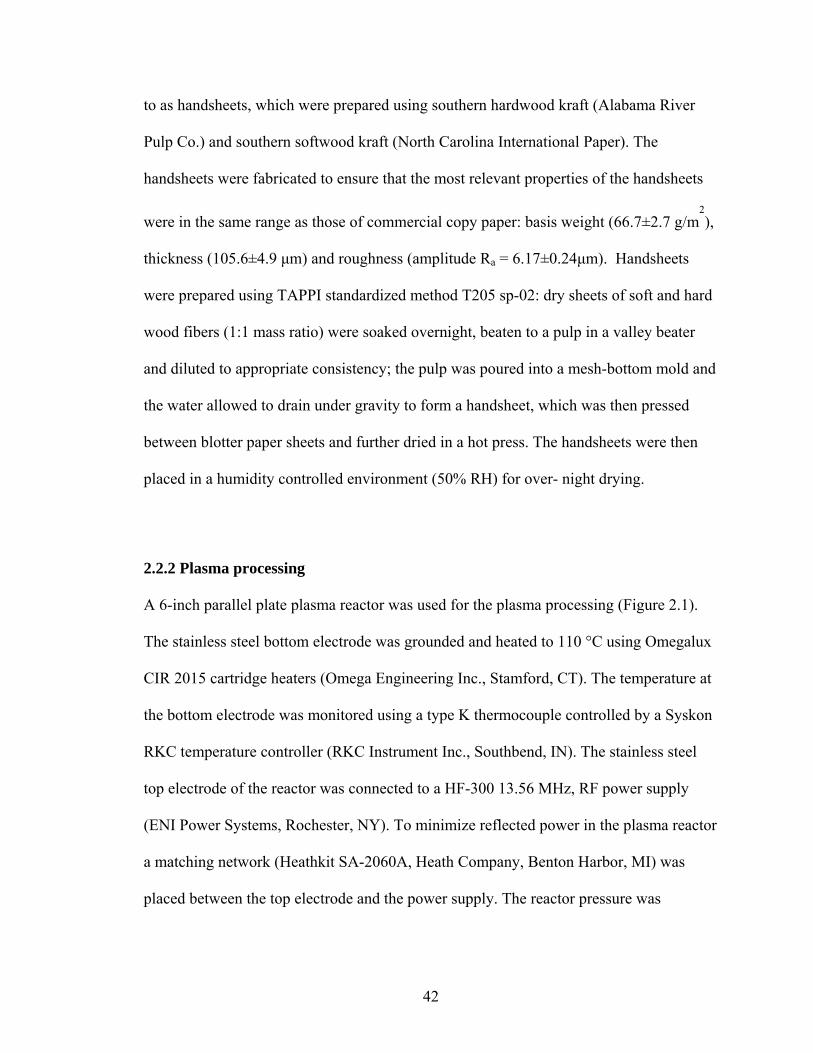
to as handsheets, which were prepared using southern hardwood kraft (Alabama River
Pulp Co.) and southern softwood kraft (North Carolina International Paper). The
handsheets were fabricated to ensure that the most relevant properties of the handsheets
were in the same range as those of commercial copy paper: basis weight (66.7±2.7 g/m2),
thickness (105.6±4.9 μm) and roughness (amplitude Ra = 6.17±0.24μm). Handsheets
were prepared using TAPPI standardized method T205 sp-02: dry sheets of soft and hard
wood fibers (1:1 mass ratio) were soaked overnight, beaten to a pulp in a valley beater
and diluted to appropriate consistency; the pulp was poured into a mesh-bottom mold and
the water allowed to drain under gravity to form a handsheet, which was then pressed
between blotter paper sheets and further dried in a hot press. The handsheets were then
placed in a humidity controlled environment (50% RH) for over- night drying.
2.2.2 Plasma processing
A 6-inch parallel plate plasma reactor was used for the plasma processing (Figure 2.1).
The stainless steel bottom electrode was grounded and heated to 110 °C using Omegalux
CIR 2015 cartridge heaters (Omega Engineering Inc., Stamford, CT). The temperature at
the bottom electrode was monitored using a type K thermocouple controlled by a Syskon
RKC temperature controller (RKC Instrument Inc., Southbend, IN). The stainless steel
top electrode of the reactor was connected to a HF-300 13.56 MHz, RF power supply
(ENI Power Systems, Rochester, NY). To minimize reflected power in the plasma reactor
a matching network (Heathkit SA-2060A, Heath Company, Benton Harbor, MI) was
placed between the top electrode and the power supply. The reactor pressure was
42
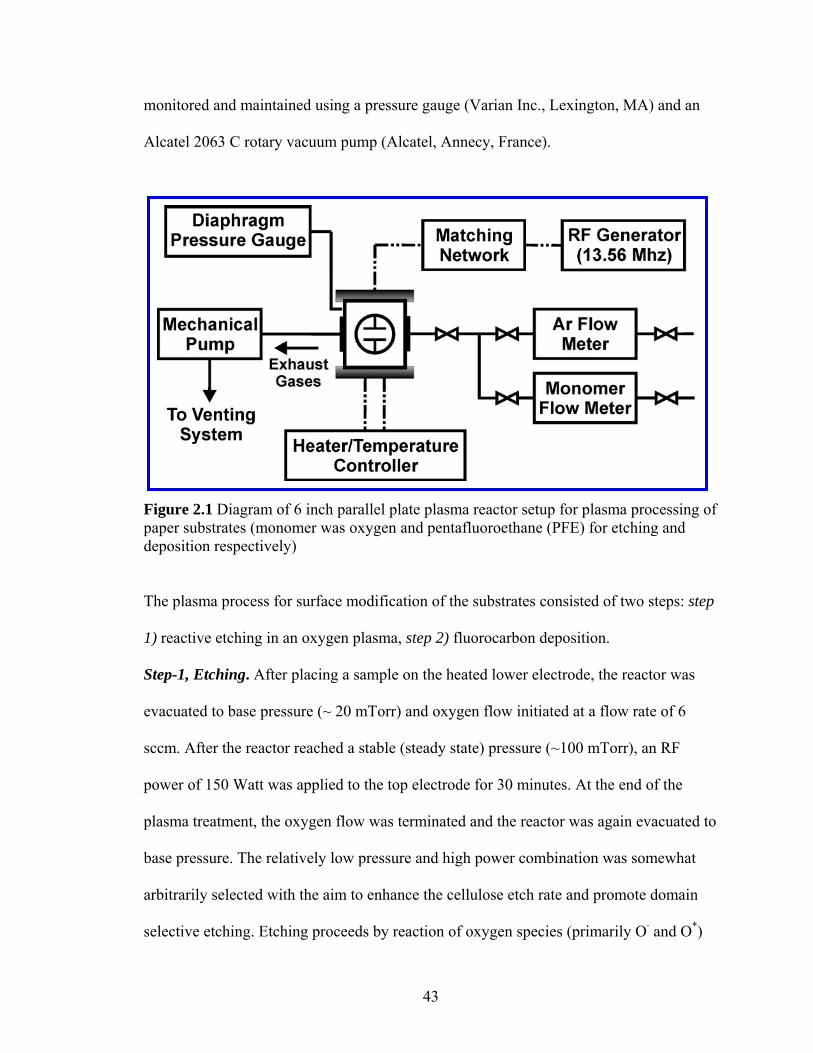
monitored and maintained using a pressure gauge (Varian Inc., Lexington, MA) and an
Alcatel 2063 C rotary vacuum pump (Alcatel, Annecy, France).
Figure 2.1 Diagram of 6 inch parallel plate plasma reactor setup for plasma processing of paper substrates (monomer was oxygen and pentafluoroethane (PFE) for etching and deposition respectively)
The plasma process for surface modification of the substrates consisted of two steps: step
1) reactive etching in an oxygen plasma, step 2) fluorocarbon deposition.
Step-1, Etching. After placing a sample on the heated lower electrode, the reactor was
evacuated to base pressure (~ 20 mTorr) and oxygen flow initiated at a flow rate of 6
sccm. After the reactor reached a stable (steady state) pressure (~100 mTorr), an RF
power of 150 Watt was applied to the top electrode for 30 minutes. At the end of the
plasma treatment, the oxygen flow was terminated and the reactor was again evacuated to
base pressure. The relatively low pressure and high power combination was somewhat
arbitrarily selected with the aim to enhance the cellulose etch rate and promote domain
selective etching. Etching proceeds by reaction of oxygen species (primarily O· and O*)
43
with cellulose (P) to form water vapor, CO, and CO2, thereby removing material from the
surface according to the following reactions [41]:
P + O* P* + OH (2.1)
P* + O· P’O+ CO + CO2 (2.2)
Step-2, Deposition. A thin fluorocarbon film was then deposited onto the substrates. The
deposition gas mixture consisted of a precursor gas (pentafluoroethane [PFE] flowing at
20 sccm), and a carrier gas (argon flowing at 75 sccm). After the reactor reached a stable
(steady state) pressure (1 Torr), an RF power of 120 Watts was applied to the top
electrode for 2 minutes. Electron impact collisions with the precursor form various
CxFyHz moieties, which react primarily at the substrate surface to form an adherent cross-
linked fluorocarbon film [43-45]. At the end of the deposition, the plasma power was
turned off and the reactor evacuated to base pressure. Finally, the reactor was
repressurized to atmospheric pressure by backfilling with N2 gas and the sample was
removed from the reactor for surface characterization. Under these conditions, the
thickness of the deposited fluorocarbon film on a silicon wafer, which can readily be
measured via ellipsometry, was ~100 nm. The full process, including step-1 (etching) and
step-2 (deposition) will be referred to as superhydrophobic (SH)-treatment in this report.
In addition to this treatment, some samples were exposed only to step-2 (fluorocarbon
deposition), thereby eliminating step-1 entirely; this treatment is termed PFE-treatment.
44
Pentafluoroethane (PFE) monomer gas (N4 grade, 99.99%) was donated by Dupont
(Wilmington, DL). Argon carrier gas (Ultra High Purity, 99.99%) was purchased from
Air Products and Chemicals Inc. (Allentown, PA). Nitrogen (Ultra High Purity, 99.999%)
and oxygen (Ultra Pure Carrier, 99.996%) were purchased from Airgas Inc. (Radnor,
PA).
2.2.3 SEM
SEM measurements were obtained with a LEO scanning electron microscope (model
1530, Carl Zeiss SMT Inc., Peabody, MA) operated at a pressure of ~1.0 х 10-7 Torr at
room temperature. The operating voltage was adjusted between 5 and 10 kV depending
on the magnifications used to avoid damaging the paper samples. Since both the paper
and PFE film are insulators, the substrates were sputtercoated (EMS 350; Electron
Microscopy Sciences, Hatfield, PA) with a thin gold film (~15 nm) prior to SEM
imaging.
2.2.4 X-Ray photoelectron spectroscopy (XPS)
Spectra were collected using a PHI model 1600 spectrometer (Physical Instruments, Inc.,
Chanhassen, MN) with Al Kα X-rays operated at a power of 350 W. The operational
pressure was typically held below 5 x 10⁻⁹ Torr. Further details of this equipment can be
found elsewhere [45].
45
2.2.5 ATR-FTIR
FTIR spectra were obtained with a Bruker Equinox 55 FT-IR spectrometer (Bruker
Optics Inc., Billerica, MA), equipped with a nitrogen cooled MCT detector. Further
details of this equipment can be found elsewhere [46]. A thin strip of the substrate (0.76
cm by 6.35 cm) was cut and pressed against a ZnSe ATR crystal using a flat metal strip.
The pressure on the sample was controlled by a set screw and kept approximately
constant for all the samples.
2.2.6 FIB
The focused ion beam (FIB) milling steps and SEM images were obtained using Quanta
200 3D and Nova 200 NanoLab Dual Beam FIB/SEM systems (FEI Company, Hillsboro,
OR).
2.2.7 Contact angle goniometer
Water contact angle measurements were performed with a Rame-Hart contact angle
goniometer (model 100, Netcong, NJ). The substrate was placed on a translation stage, a
4μL drop suspended from a needle was brought into contact, and the stage was moved in
the x-direction (left to right) [47]. The CA on the advancing and receding sides of the
drop was measured. The advantage of this dynamic method is that it scans a large
substrate area and thus yields better statistically averaged values of CA, especially for
heterogeneous substrates like paper. One of the disadvantages of this method is that
receding CA values of less than 10° cannot be measured, because the drop can break
apart while being dragged on the surface [47]. For the paper substrates which had
46

undergone PFE-treatment, the receding CA was in this range and the breakup of drops
was observed. In these cases, the standard volume increment/decrement method for
measuring advancing and receding CAs was used. The droplet volume was increased
from 4 μL to 12 μL in increments of 4 μL to measure the advancing CA. Thereafter,
small decrements of 0.17 μL were used to measure the receding CA.
2.3 Results and discussion
Before measuring the wetting properties of the modified substrates, the substrates were
subjected to basic physicochemical tests to determine their physical and chemical
properties after oxygen etching and PFE deposition in the plasma reactor.
2.3.1 XPS
Cellulose handsheet surfaces were characterized after etching and deposition of PFE
layers by XPS analysis. As described in Chapter 1, cellulose molecules (C6H10O5)n are
essentially polymer chains of β-d-glucose residues covalently coupled via glucosidal
linkages [48, 49]. Consistent with this molecular structure, the XPS survey spectrum of
the cellulose handsheet (Figure 2.2a) displays two intense peaks assigned to O1s
(oxygen) and C1s (carbon). Moreover, the theoretical O/C ratio of cellulose (0.83)
correlates well with the ratio of 0.84 ± 0.01 determined by XPS, which indicates that the
fabricated handsheets do not contain fillers or other impurities found in commercial
paper, and therefore that the handsheets can be used as model substrates for cellulose
fibers.
47
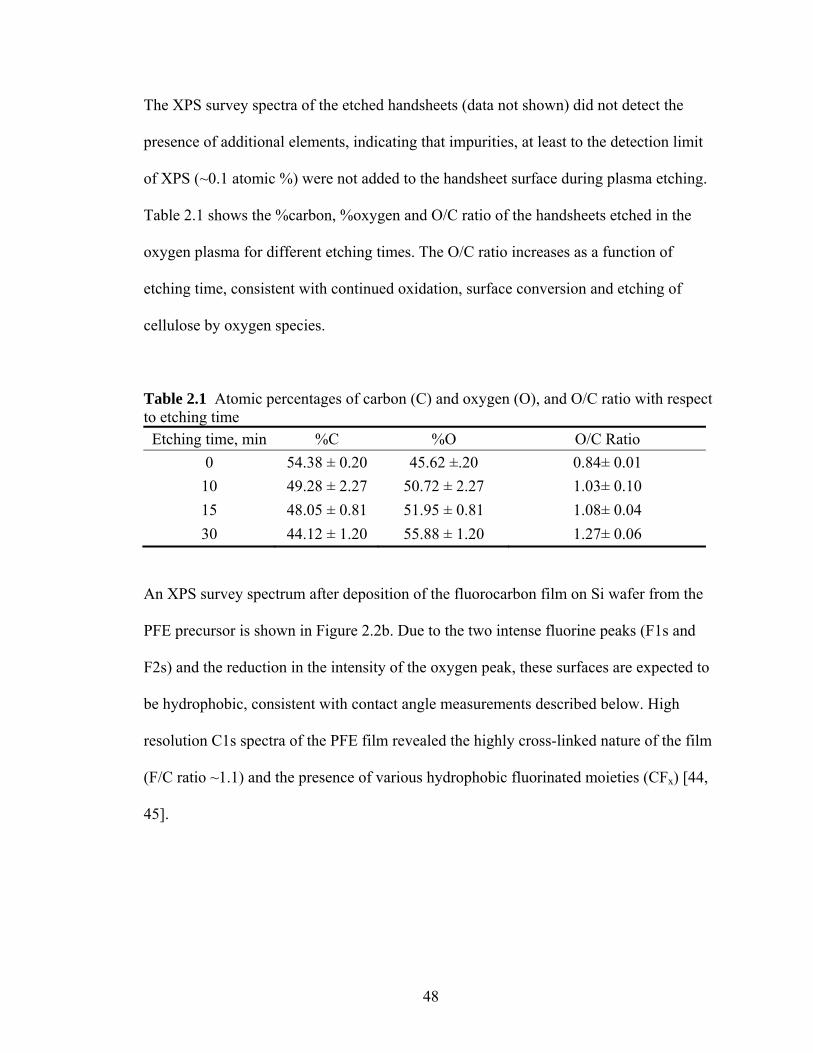
The XPS survey spectra of the etched handsheets (data not shown) did not detect the
presence of additional elements, indicating that impurities, at least to the detection limit
of XPS (~0.1 atomic %) were not added to the handsheet surface during plasma etching.
Table 2.1 shows the %carbon, %oxygen and O/C ratio of the handsheets etched in the
oxygen plasma for different etching times. The O/C ratio increases as a function of
etching time, consistent with continued oxidation, surface conversion and etching of
cellulose by oxygen species.
Table 2.1 Atomic percentages of carbon (C) and oxygen (O), and O/C ratio with respect to etching time
Etching time, min %C %O O/C Ratio 0 54.38 ± 0.20 45.62 ±.20 0.84± 0.01 10 49.28 ± 2.27 50.72 ± 2.27 1.03± 0.10 15 48.05 ± 0.81 51.95 ± 0.81 1.08± 0.04 30 44.12 ± 1.20 55.88 ± 1.20 1.27± 0.06
An XPS survey spectrum after deposition of the fluorocarbon film on Si wafer from the
PFE precursor is shown in Figure 2.2b. Due to the two intense fluorine peaks (F1s and
F2s) and the reduction in the intensity of the oxygen peak, these surfaces are expected to
be hydrophobic, consistent with contact angle measurements described below. High
resolution C1s spectra of the PFE film revealed the highly cross-linked nature of the film
(F/C ratio ~1.1) and the presence of various hydrophobic fluorinated moieties (CFx) [44,
45].
48
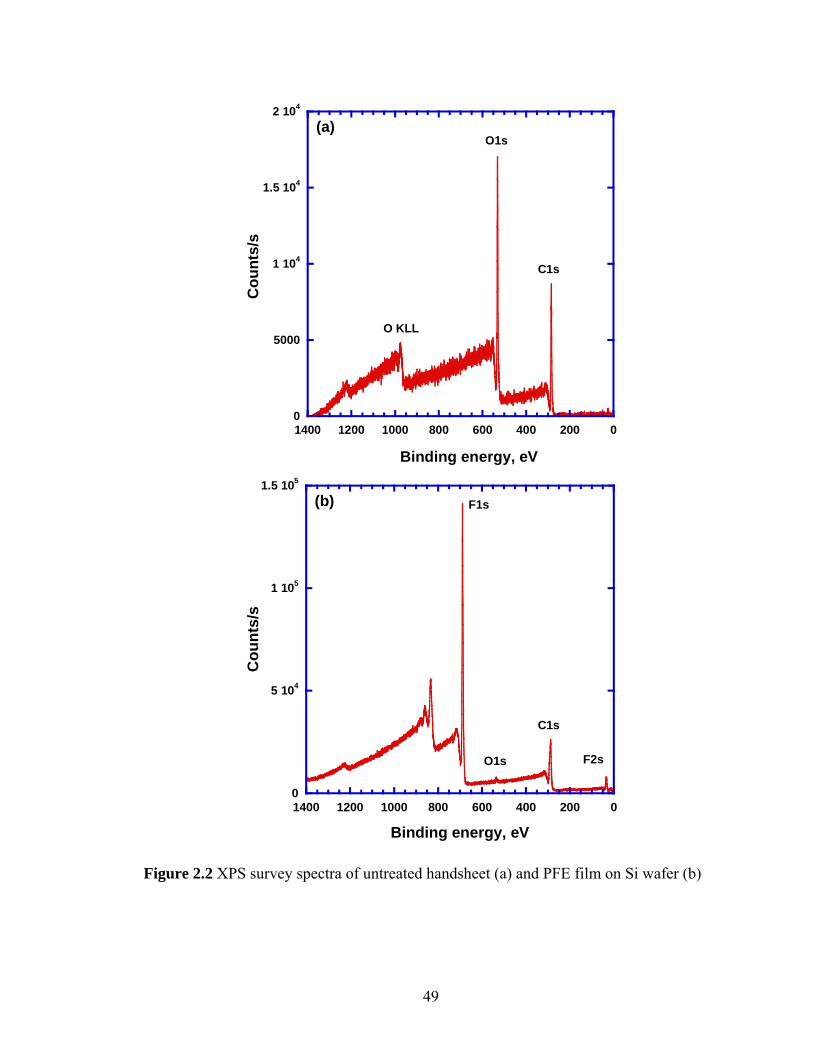
0
5000
1 104
1.5 104
2 104
0200400600800100012001400
Cou
nts/
s
Binding energy, eV
O1s
C1s
O KLL
(a)
0
5 104
1 105
1.5 105
0200400600800100012001400
Cou
nts/
s
Binding energy, eV
O1s
C1s
F1s
F2s
(b)
Figure 2.2 XPS survey spectra of untreated handsheet (a) and PFE film on Si wafer (b)
49
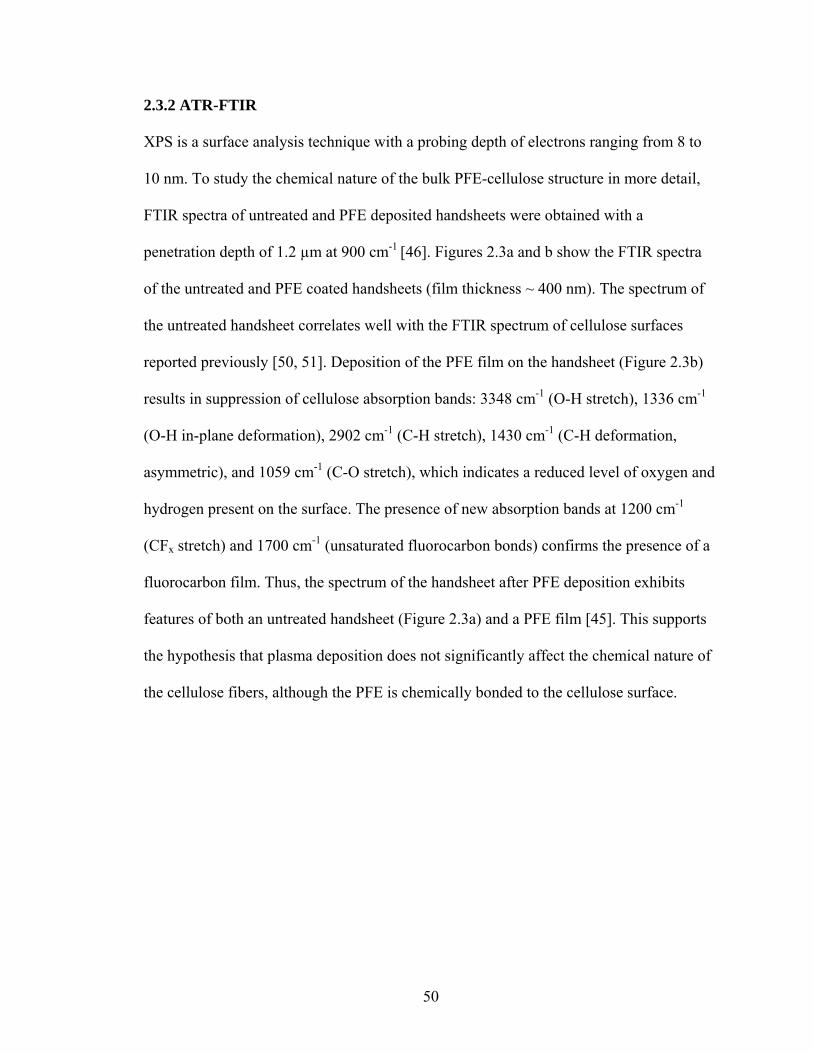
2.3.2 ATR-FTIR
XPS is a surface analysis technique with a probing depth of electrons ranging from 8 to
10 nm. To study the chemical nature of the bulk PFE-cellulose structure in more detail,
FTIR spectra of untreated and PFE deposited handsheets were obtained with a
penetration depth of 1.2 µm at 900 cm-1 [46]. Figures 2.3a and b show the FTIR spectra
of the untreated and PFE coated handsheets (film thickness ~ 400 nm). The spectrum of
the untreated handsheet correlates well with the FTIR spectrum of cellulose surfaces
reported previously [50, 51]. Deposition of the PFE film on the handsheet (Figure 2.3b)
results in suppression of cellulose absorption bands: 3348 cm-1 (O-H stretch), 1336 cm-1
(O-H in-plane deformation), 2902 cm-1 (C-H stretch), 1430 cm-1 (C-H deformation,
asymmetric), and 1059 cm-1 (C-O stretch), which indicates a reduced level of oxygen and
hydrogen present on the surface. The presence of new absorption bands at 1200 cm-1
(CFx stretch) and 1700 cm-1 (unsaturated fluorocarbon bonds) confirms the presence of a
fluorocarbon film. Thus, the spectrum of the handsheet after PFE deposition exhibits
features of both an untreated handsheet (Figure 2.3a) and a PFE film [45]. This supports
the hypothesis that plasma deposition does not significantly affect the chemical nature of
the cellulose fibers, although the PFE is chemically bonded to the cellulose surface.
50
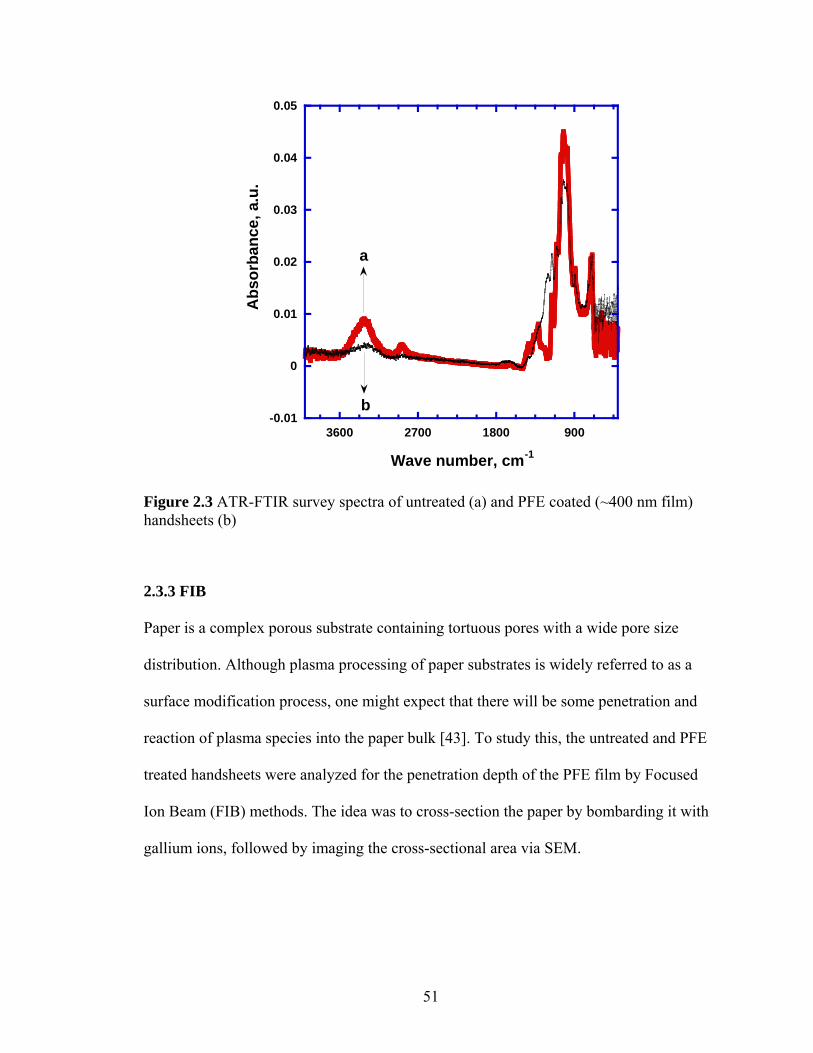
-0.01
0
0.01
0.02
0.03
0.04
0.05
900180027003600
Abs
orba
nce,
a.u
.
Wave number, cm-1
a
b
Figure 2.3 ATR-FTIR survey spectra of untreated (a) and PFE coated (~400 nm film) handsheets (b)
2.3.3 FIB
Paper is a complex porous substrate containing tortuous pores with a wide pore size
distribution. Although plasma processing of paper substrates is widely referred to as a
surface modification process, one might expect that there will be some penetration and
reaction of plasma species into the paper bulk [43]. To study this, the untreated and PFE
treated handsheets were analyzed for the penetration depth of the PFE film by Focused
Ion Beam (FIB) methods. The idea was to cross-section the paper by bombarding it with
gallium ions, followed by imaging the cross-sectional area via SEM.
51
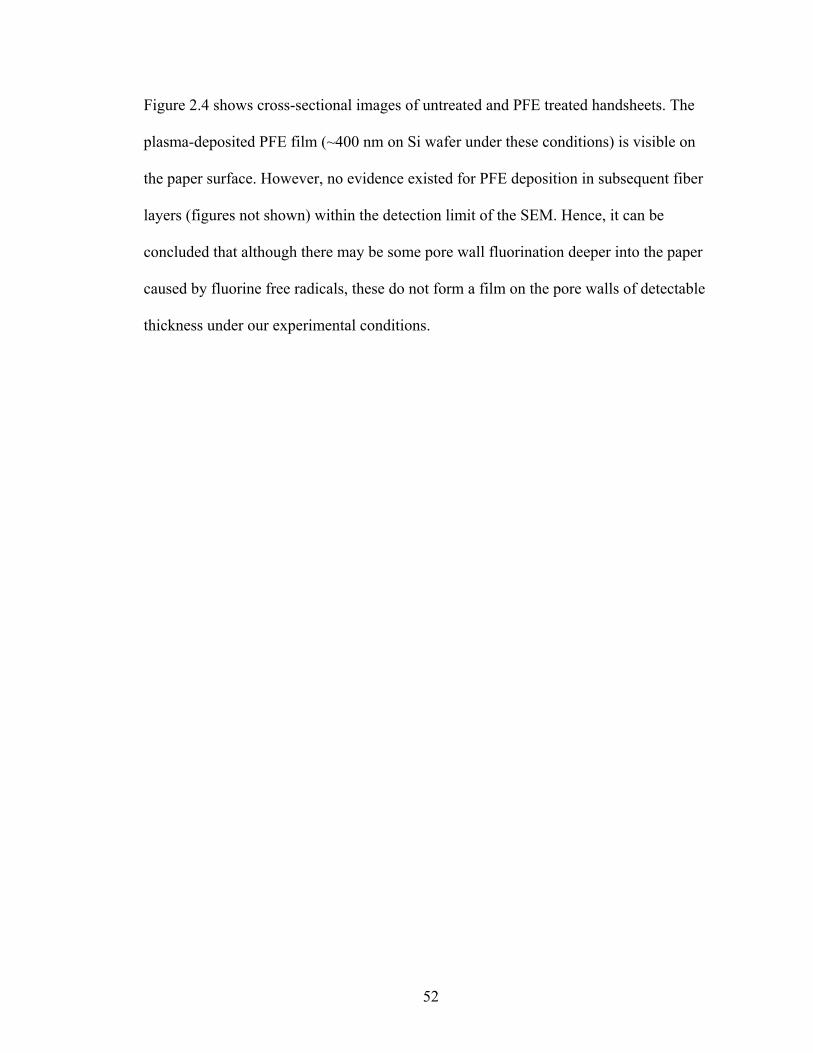
Figure 2.4 shows cross-sectional images of untreated and PFE treated handsheets. The
plasma-deposited PFE film (~400 nm on Si wafer under these conditions) is visible on
the paper surface. However, no evidence existed for PFE deposition in subsequent fiber
layers (figures not shown) within the detection limit of the SEM. Hence, it can be
concluded that although there may be some pore wall fluorination deeper into the paper
caused by fluorine free radicals, these do not form a film on the pore walls of detectable
thickness under our experimental conditions.
52
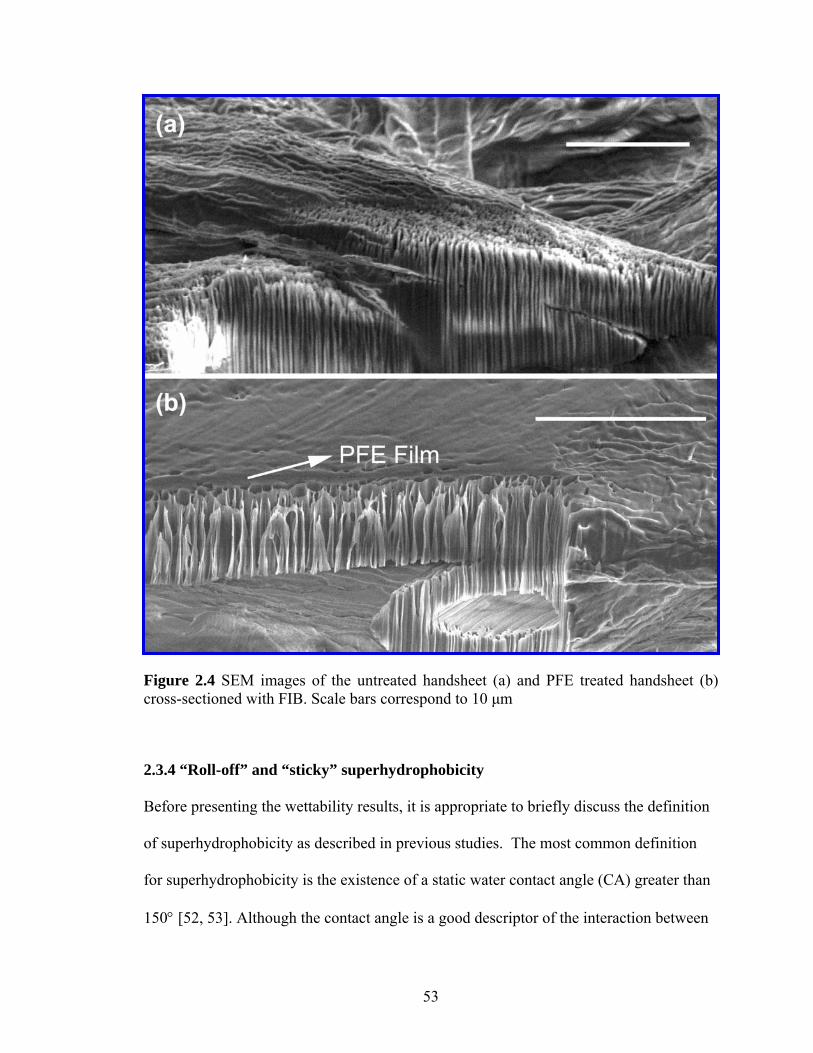
Figure 2.4 SEM images of the untreated handsheet (a) and PFE treated handsheet (b) cross-sectioned with FIB. Scale bars correspond to 10 μm
2.3.4 “Roll-off” and “sticky” superhydrophobicity
Before presenting the wettability results, it is appropriate to briefly discuss the definition
of superhydrophobicity as described in previous studies. The most common definition
for superhydrophobicity is the existence of a static water contact angle (CA) greater than
150° [52, 53]. Although the contact angle is a good descriptor of the interaction between
53
water and solid surfaces, the threshold of 150° is not sufficient to guarantee the water
repellant behavior associated with lotus leaves, i.e. droplet roll-off and self-cleaning
properties. In order to predict the mobility of water droplets, it is also necessary to
determine the contact angle hysteresis, i.e. the difference between advancing and
receding contact angles at the leading and trailing edge of a moving droplet. It has been
found that for a CA hysteresis less than 10°, water drops roll off surfaces, while for a
hysteresis greater than 10° drops tend to stick to the surface, even if such a surface has a
CA greater than 150°. In previous publications, surfaces have been considered
superhydrophobic purely based on the criterion of contact angles >150°, with hysteresis
values greater than 10°[5, 9, 16, 54-56], less than 10° [8, 10, 11, 15, 16, 26], or even
unreported [12, 19, 40]. A debate exists on whether or not to include CA hysteresis in the
definition of superhydrophobicity [15]. In this thesis, both the water CA and CA
hysteresis will be included to categorize the interactions of hydrophobic substrates with
liquids.
The charts in Figure 2.5 show a comparison of the water CA and CA hysteresis of copy
paper, handsheet, and silicon wafer subjected to two tests: 1) SH-treatment, and 2) PFE-
treatment. The copy paper used in this study was a standard copy-grade paper purchased
from Office Depot ("Premium white copy paper"; brightness: 104, weight 76 g/m2). The
results for substrates without PFE deposition are not presented in the chart. CA
measurements on untreated and oxygen plasma treated (only step-1 of SH-treatment)
copy paper showed a CA of 81.9° ± 3.6°, while for untreated and oxygen plasma treated
handsheets the water drop was absorbed into the paper in less than one second, so that the
54
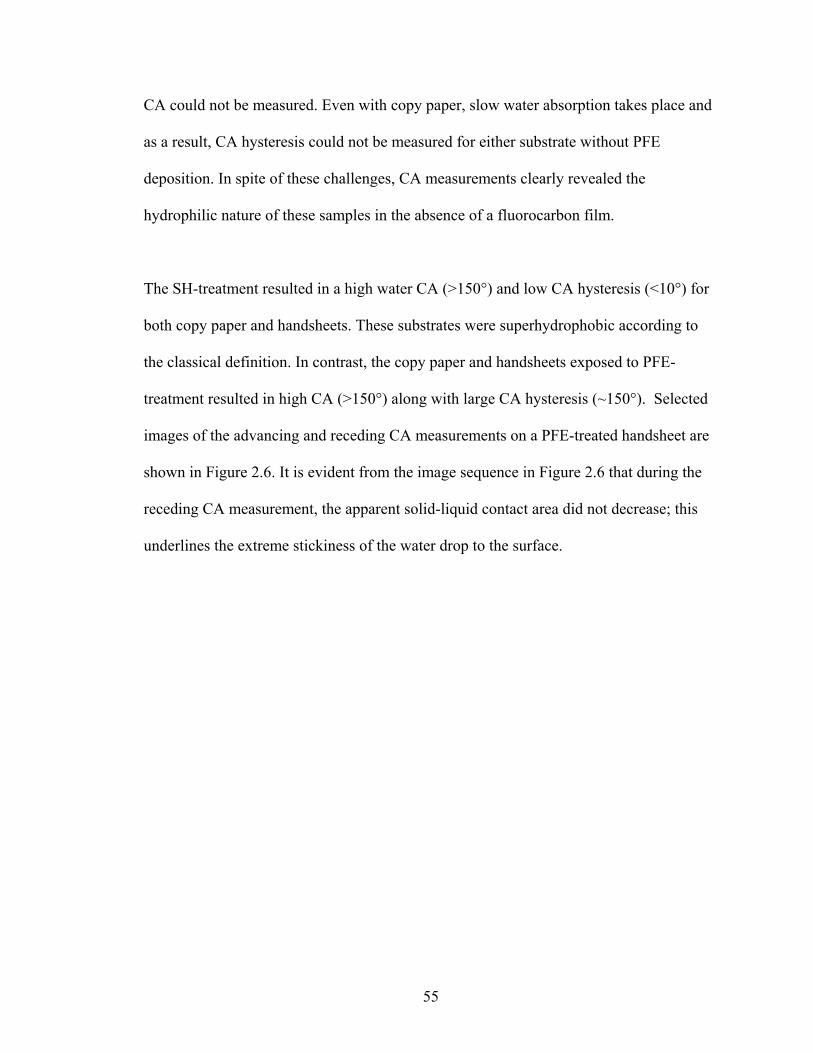
CA could not be measured. Even with copy paper, slow water absorption takes place and
as a result, CA hysteresis could not be measured for either substrate without PFE
deposition. In spite of these challenges, CA measurements clearly revealed the
hydrophilic nature of these samples in the absence of a fluorocarbon film.
The SH-treatment resulted in a high water CA (>150°) and low CA hysteresis (<10°) for
both copy paper and handsheets. These substrates were superhydrophobic according to
the classical definition. In contrast, the copy paper and handsheets exposed to PFE-
treatment resulted in high CA (>150°) along with large CA hysteresis (~150°). Selected
images of the advancing and receding CA measurements on a PFE-treated handsheet are
shown in Figure 2.6. It is evident from the image sequence in Figure 2.6 that during the
receding CA measurement, the apparent solid-liquid contact area did not decrease; this
underlines the extreme stickiness of the water drop to the surface.
55
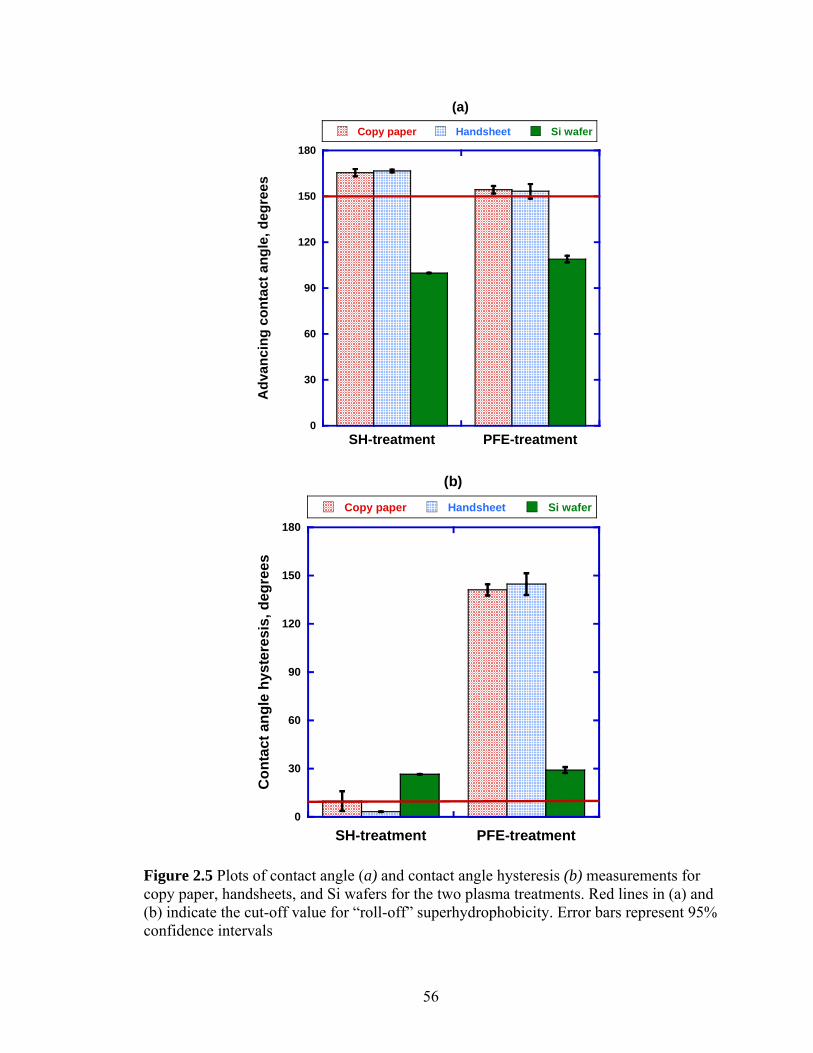
0
30
60
90
120
150
180
SH-treatment PFE-treatment
Copy paper Handsheet Si wafer
Adv
anci
ng c
onta
ct a
ngle
, deg
rees
(a)
0
30
60
90
120
150
180
SH-treatment PFE-treatment
Copy paper Handsheet Si wafer
Con
tact
ang
le h
yste
resi
s, d
egre
es
(b)
Figure 2.5 Plots of contact angle (a) and contact angle hysteresis (b) measurements for copy paper, handsheets, and Si wafers for the two plasma treatments. Red lines in (a) and (b) indicate the cut-off value for “roll-off” superhydrophobicity. Error bars represent 95% confidence intervals
56
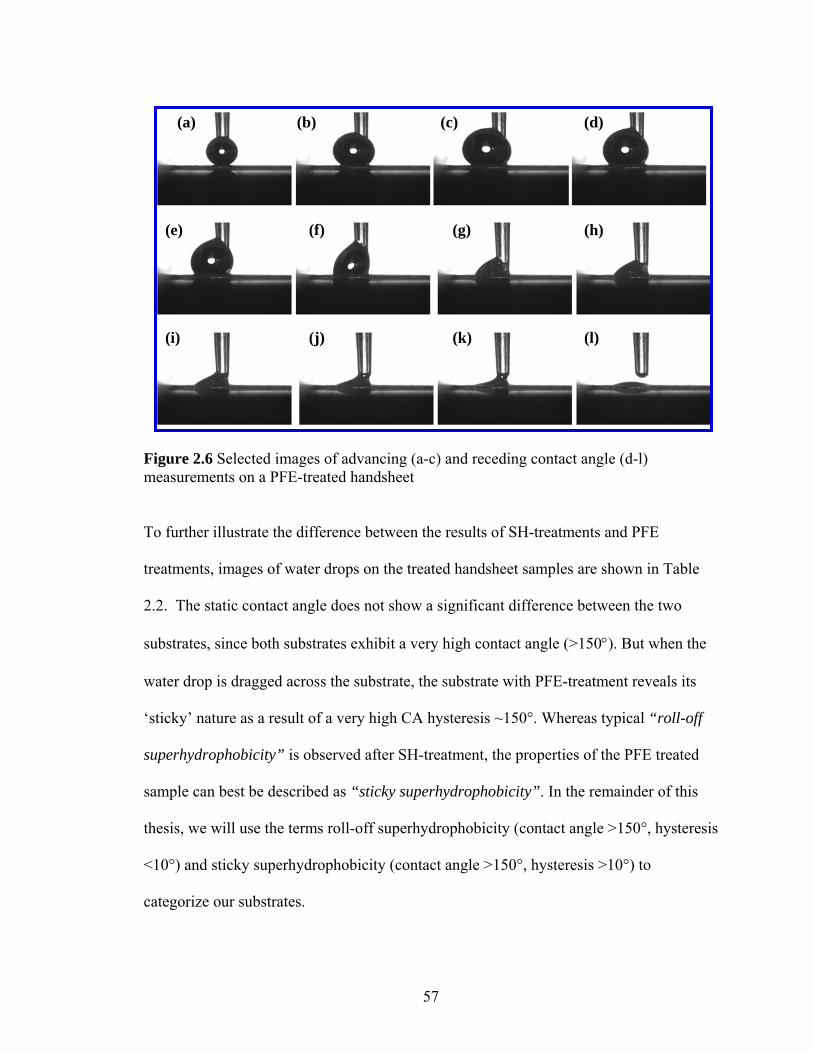
(a) (b) (c) (d)
(e) (f) (g) (h)
(k) (j) (i) (l)
Figure 2.6 Selected images of advancing (a-c) and receding contact angle (d-l) measurements on a PFE-treated handsheet
To further illustrate the difference between the results of SH-treatments and PFE
treatments, images of water drops on the treated handsheet samples are shown in Table
2.2. The static contact angle does not show a significant difference between the two
substrates, since both substrates exhibit a very high contact angle (>150°). But when the
water drop is dragged across the substrate, the substrate with PFE-treatment reveals its
‘sticky’ nature as a result of a very high CA hysteresis ~150°. Whereas typical “roll-off
superhydrophobicity” is observed after SH-treatment, the properties of the PFE treated
sample can best be described as “sticky superhydrophobicity”. In the remainder of this
thesis, we will use the terms roll-off superhydrophobicity (contact angle >150°, hysteresis
<10°) and sticky superhydrophobicity (contact angle >150°, hysteresis >10°) to
categorize our substrates.
57
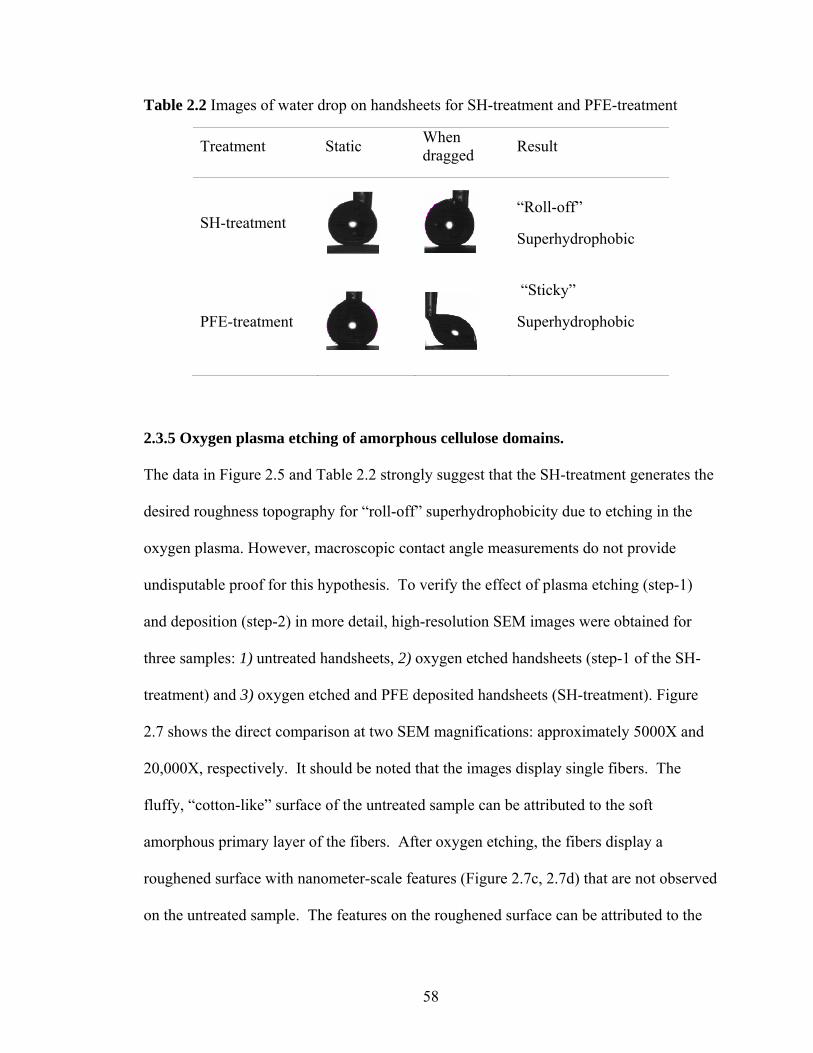
Table 2.2 Images of water drop on handsheets for SH-treatment and PFE-treatment
Treatment Static When dragged Result
SH-treatment
“Roll-off”
Superhydrophobic
PFE-treatment
“Sticky”
Superhydrophobic
2.3.5 Oxygen plasma etching of amorphous cellulose domains.
The data in Figure 2.5 and Table 2.2 strongly suggest that the SH-treatment generates the
desired roughness topography for “roll-off” superhydrophobicity due to etching in the
oxygen plasma. However, macroscopic contact angle measurements do not provide
undisputable proof for this hypothesis. To verify the effect of plasma etching (step-1)
and deposition (step-2) in more detail, high-resolution SEM images were obtained for
three samples: 1) untreated handsheets, 2) oxygen etched handsheets (step-1 of the SH-
treatment) and 3) oxygen etched and PFE deposited handsheets (SH-treatment). Figure
2.7 shows the direct comparison at two SEM magnifications: approximately 5000X and
20,000X, respectively. It should be noted that the images display single fibers. The
fluffy, “cotton-like” surface of the untreated sample can be attributed to the soft
amorphous primary layer of the fibers. After oxygen etching, the fibers display a
roughened surface with nanometer-scale features (Figure 2.7c, 2.7d) that are not observed
on the untreated sample. The features on the roughened surface can be attributed to the
58
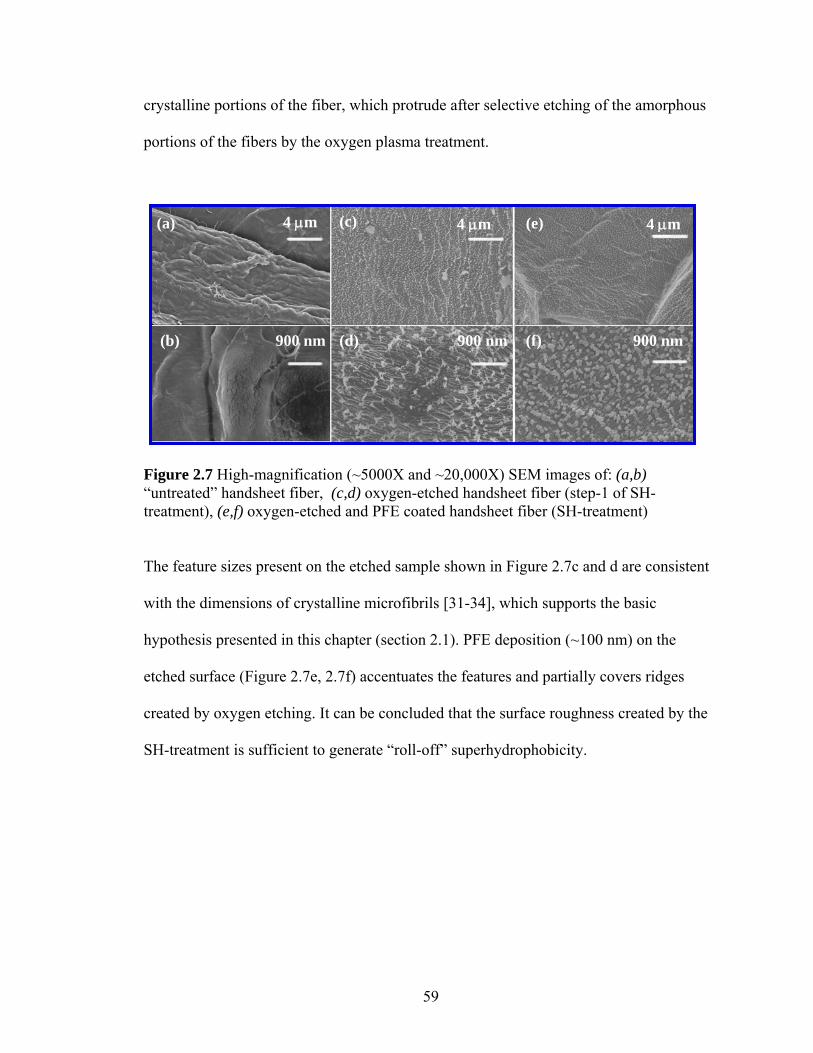
crystalline portions of the fiber, which protrude after selective etching of the amorphous
portions of the fibers by the oxygen plasma treatment.
μm 4
(a)
(b)
(c) (e)
(d) (f) 900 nm 900 nm
4 μm 4 μm 4 μm
900 nm
Figure 2.7 High-magnification (~5000X and ~20,000X) SEM images of: (a,b) “untreated” handsheet fiber, (c,d) oxygen-etched handsheet fiber (step-1 of SH-treatment), (e,f) oxygen-etched and PFE coated handsheet fiber (SH-treatment)
The feature sizes present on the etched sample shown in Figure 2.7c and d are consistent
with the dimensions of crystalline microfibrils [31-34], which supports the basic
hypothesis presented in this chapter (section 2.1). PFE deposition (~100 nm) on the
etched surface (Figure 2.7e, 2.7f) accentuates the features and partially covers ridges
created by oxygen etching. It can be concluded that the surface roughness created by the
SH-treatment is sufficient to generate “roll-off” superhydrophobicity.
59
2.3.6 Significance of the natural topography of the cellulose fibers for the two
extreme behaviors
The fundamental difference between the SH treatment and the PFE treatment is that in
the latter substrates are not subjected to oxygen etching, which creates nanometer scale
roughness in addition to the natural micrometer scale roughness of paper surfaces. Since
paper is a porous substrate, both samples are considered to be physically heterogeneous
(air pockets at the interface) irrespective of their different roughness scales. Thus, the
superhydrophobic behavior observed in the “roll-off” and “sticky” superhydrophobic
paper surfaces is expected to be modeled by Cassie’s model [57], which assumes that a
liquid does not completely wet rough hydrophobic surfaces and which attributes the
increased CA to the presence of air pockets (composite surface) at the liquid-solid
interface. However, recent studies [58] have reported different contact angles for the
same wetted surface fraction merely by changing surface topography. The variation in
contact angles was attributed to differences in the contact line topology and tension.
Thus, both the three-phase contact line topology and the wetted surface fraction are
involved in establishing the contact angle; such considerations were not addressed by
Cassie[58, 59]. It can therefore be concluded that the higher contact angles obtained for
the “roll-off” and “sticky” superhydrophobic samples are likely due to the decreased
wetted surface fraction and the difference in surface topography which changes the
contact line topology.
It has been reported that the contact angle hysteresis of a superhydrophobic surface
primarily depends upon two properties [8, 27], 1) metastable state energy, 2) barrier
60
energy for the drop to move from one metastable state to another metastable state. These
two energies depend on the chemical heterogeneity, contact line topology, roughness and
the wetted fraction of the surface [6, 27]. The “roll-off” superhydrophobic paper
possesses a high metastable state energy and a low barrier energy which may be due to
the increased contact line tension and roughness, and decreased wetted surface fraction.
This energy combination causes water drops to “hop” or “skid” on the surface in search
of a lower energy state, thereby causing roll-off with a CA hysteresis of 3.4°. In
comparison, the “sticky” superhydrophobic paper possesses a relatively low metastable
state and a very high barrier energy combination. This may be due to the decreased
contact line tension and roughness, increased wetted surface fraction and chemical
heterogeneity. As a result, the water drop remains pinned at the initial lower energy
location without the ability to move, thereby displaying a high CA hysteresis of ~150°.
Silicon wafers are flat and should not be affected significantly by treatment with oxygen
plasma. Indeed, the CA and hysteresis were found to be the same for both treatment
methods, with higher CA and lower hysteresis than for an untreated sample as a result of
the fluorocarbon coating. It can therefore be concluded that the natural micrometer
topography of the paper surface is responsible for the “sticky” superhydrophobicity. In
order to obtain “roll-off” superhydrophobicity, a secondary nanoscale roughness must be
added, which was achieved by uncovering the implicit nanostructure of microfibrils via
oxygen etching. Both “roll-off” and “sticky” substrates are of considerable interest for
applications in which it is important to manipulate the mobility of water droplets; a key
61
question that will be addressed in the following chapter (Chapter 3) is whether it is
possible to tune contact angle hysteresis between these extremes.
2.3.7 Robustness and stability of the superhydrophobic paper substrates
As discussed previously, a critical property of superhydrophobic paper substrates for
practical applications is the robustness of the small micron and submicron scale features.
Even if a substrate is superhydrophobic immediately after creation, several operational
factors can affect stability by decreasing the water CA and/or increasing CA hysteresis:
condensation of water vapor in the air pockets at the liquid-solid interface, external
pressure applied to the liquid, which compresses the air pockets, and damage to the
fragile nanometer-scale features. The first two issues are related to the application in
which the substrates will be used. With regards to the issue of mechanical robustness, it is
expected that the robustness of the roughness generated by our process, which originates
from the internal morphology of cellulosic fibers, should be better than for structures
created by traditional polymer grafting or nanoparticle deposition. To confirm this
hypothesis, the robustness of the surface was tested with a standardized scotch tape test
(ASTM) [60, 61]. The result was damage to the paper substrate, with a layer of fibers
adhering to the scotch tape. Apparently, adhesion failure occurred at fiber-fiber interfaces
rather than fiber-PFE interfaces, which demonstrates that the PFE film has excellent
adhesive bonding to the fibers. This observation is consistent with the fact that cellulose
has numerous -OH moieties which can serve as reaction sites for covalent bonding to a
crosslinked PFE film. This covalent bonding is stronger than the fiber-fiber hydrogen
bonding. After failure of the scotch tape test to confirm the robustness of the topology of
62
the modified surface, we performed another simple wear test on the roll-off
superhydrophobic handsheet by pressing it firmly with a bare finger. Although this is not
a standardized test, the procedure closely replicates common handling of paper and
paperboard and therefore offers insight into practical use of the modified paper surfaces.
After this test, the handsheet showed an average CA and CA hysteresis of 157.1°± 4.2°
and 21.4°± 14.5°, respectively, which indicates that the superhydrophobicity was
retained. The slight decrease of CA, increase of CA hysteresis and increased variability
of both parameters after the wear test is likely due to contamination of the surface by
grease/dust from the finger, although partial destruction of the nanometer-scale structures
cannot be excluded. It was also observed that the superhydrophobicity of these paper
substrates was retained even after feeding the treated paper substrates through a desktop
printer (Xerox Phaser®) showing an average CA and CA hysteresis of 165.1±2° and
29.8±2.9° respectively. The robustness of the superhydrophobic paper substrates makes it
possible to pattern these substrates with different surface energy ink islands via desktop
printing to control the mobility of the drops. Patterning of superhydrophobic papers will
be discussed in greater detail in Chapters 5 and 6. In addition, CA and CA hysteresis
values of SH-treated handsheets and copy paper were constant after storage for several
weeks under ambient conditions (T ~25° C, relative humidty ~40%). These studies
establish the stability of the PFE film under ambient conditions against surface oxidation
by atmospheric oxygen.
63
2.4 Conclusions
A two step (etching and deposition) process was used to fabricate superhydrophobic
surfaces. The first step was the domain selective etching of the amorphous portions of the
cellulose in an oxygen plasma to expose the crystalline cellulose structures. The second
step was to coat the etched surface with a thin film of pentafluoroethane deposited via
plasma enhanced chemical vapor deposition. Two types of superhydrophobicity were
obtained by varying the oxygen plasma etch time: “roll-off” (contact angle (CA): 166.7°
± 0.9° and CA hysteresis: 3.4° ± 0.1°) and “sticky” (CA: 153.4° ± 4.7° and CA
hysteresis: 149.8±5.8°) superhydrophobicity.
The superhydrophobic paper surfaces are robust, flexible, breathable, biodegradable [21]
and may also be recyclable. Such conclusions are partly derived from previous studies in
our group that have demonstrated that plasma deposited fluorocarbon films are flexible
and breathable [44]. Preliminary studies also suggest that due to the hydrophobic nature
of the fluorocarbon layer, the coated fibers can easily be separated through froth
floatation during paper recycling. Hence, the approach described to fabricate
superhydrophobic paper surfaces may lead to applications of superhydrophobic substrates
that were thus far uneconomical. Specifically, these results should find application in
textile, packaging, printing, de-inking (paper recycling), biomedical and chemical
industries.
64
REFERENCES
1. Li, X.M., D. Reinhoudt, and M. Crego-Calama, What Do We Need for a Superhydrophobic Surface? A Review on the Recent Progress in the Preparation of Superhydrophobic Surfaces. Chemical Society Reviews, 2007. 36(9): p. 1529-1529.
2. Martines, E., K. Seunarine, H. Morgan, N. Gadegaard, C.D.W. Wilkinson, and M.O. Riehle, Superhydrophobicity and Superhydrophilicity of Regular Nanopatterns. Nano Letters, 2005. 5(10): p. 2097-2103.
3. Feng, L., S.H. Li, H.J. Li, J. Zhai, Y.L. Song, L. Jiang, and D.B. Zhu, Super-Hydrophobic Surface of Aligned Polyacrylonitrile Nanofibers. Angewandte Chemie-International Edition, 2002. 41(7): p. 1221-1223.
4. Hosono, E., S. Fujihara, I. Honma, and H.S. Zhou, Superhydrophobic Perpendicular Nanopin Film by the Bottom-up Process. Journal of the American Chemical Society, 2005. 127(39): p. 13458-13459.
5. Oner, D. and T.J. McCarthy, Ultrahydrophobic Surfaces. Effects of Topography Length Scales on Wettability. Langmuir, 2000. 16(20): p. 7777-7782.
6. Gao, L.C. and T.J. McCarthy, Contact Angle Hysteresis Explained. Langmuir, 2006. 22(14): p. 6234-6237.
7. Bico, J., C. Marzolin, and D. Quere, Pearl Drops. Europhysics Letters, 1999. 47(2): p. 220-226.
8. Gao, L.C. and T.J. McCarthy, "Artificial Lotus Leaf" Prepared Using a 1945 Patent and a Commercial Textile. Langmuir, 2006. 22(14): p. 5998-6000.
9. Gao, L.C. and T.J. McCarthy, The "Lotus Effect" Explained: Two Reasons Why Two Length Scales of Topography Are Important. Langmuir, 2006. 22(7): p. 2966-2967.
10. Xiu, Y.H., L.B. Zhu, D.W. Hess, and C.P. Wong, Biomimetic Creation of Hierarchical Surface Structures by Combining Colloidal Self-Assembly and Au Sputter Deposition. Langmuir, 2006. 22(23): p. 9676-9681.
65
11. Zhu, L.B., Y.H. Xiu, J.W. Xu, P.A. Tamirisa, D.W. Hess, and C.P. Wong, Superhydrophobicity on Two-Tier Rough Surfaces Fabricated by Controlled Growth of Aligned Carbon Nanotube Arrays Coated with Fluorocarbon. Langmuir, 2005. 21(24): p. 11208-11212.
12. Lu, X.Y., C.C. Zhang, and Y.C. Han, Low-Density Polyethylene Superhydrophobic Surface by Control of Its Crystallization Behavior. Macromolecular Rapid Communications, 2004. 25(18): p. 1606-1610.
13. Teshima, K., H. Sugimura, Y. Inoue, O. Takai, and A. Takano, Transparent Ultra Water-Repellent Poly(Ethylene Terephthalate) Substrates Fabricated by Oxygen Plasma Treatment and Subsequent Hydrophobic Coating. Applied Surface Science, 2005. 244(1-4): p. 619-622.
14. Jin, M.H., X.J. Feng, J.M. Xi, J. Zhai, K.W. Cho, L. Feng, and L. Jiang, Super-Hydrophobic Pdms Surface with Ultra-Low Adhesive Force. Macromolecular Rapid Communications, 2005. 26(22): p. 1805-1809.
15. Chen, W., A.Y. Fadeev, M.C. Hsieh, D. Oner, J. Youngblood, and T.J. McCarthy, Ultrahydrophobic and Ultralyophobic Surfaces: Some Comments and Examples. Langmuir, 1999. 15(10): p. 3395-3399.
16. Callies, M., Y. Chen, F. Marty, A. Pepin, and D. Quere, Microfabricated Textured Surfaces for Super-Hydrophobicity Investigations. Microelectronic engineering, 2005. 78(79): p. 100-105.
17. Jiang, L., Y. Zhao, and J. Zhai, A Lotus-Leaf-Like Superhydrophobic Surface: A Porous Microsphere/Nanofiber Composite Film Prepared by Electrohydrodynamics. Angewandte Chemie-International Edition, 2004. 43(33): p. 4338-4341.
18. Shirtcliffe, N.J., G. McHale, M.I. Newton, C.C. Perry, and P. Roach, Porous Materials Show Superhydrophobic to Superhydrophilic Switching. Chemical Communications, 2005(25): p. 3135-3137.
19. Zhang, J.L., J.A. Li, and Y.C. Han, Superhydrophobic Ptfe Surfaces by Extension. Macromolecular Rapid Communications, 2004. 25(11): p. 1105-1108.
20. Sun, T.L., L. Feng, X.F. Gao, and L. Jiang, Bioinspired Surfaces with Special Wettability. Accounts of Chemical Research, 2005. 38(8): p. 644-652.
66
21. Nystrom, D., J. Lindqvist, E. Ostmark, A. Hult, and E. Malmstrom, Superhydrophobic Bio-Fibre Surfaces Via Tailored Grafting Architecture. Chemical Communications, 2006(34): p. 3594-3596.
22. Zhang, X., F. Shi, X. Yu, H. Liu, Y. Fu, Z.Q. Wang, L. Jiang, and X.Y. Li, Polyelectrolyte Multilayer as Matrix for Electrochemical Deposition of Gold Clusters: Toward Super-Hydrophobic Surface. Journal of the American Chemical Society, 2004. 126(10): p. 3064-3065.
23. Sahin, H.T., S. Manolache, R.A. Young, and F. Denes, Surface Fluorination of Paper in Cf4-Rf Plasma Environments. Cellulose, 2002. 9(2): p. 171-181.
24. Sinha, A., D.W. Hess, and C.L. Henderson, Area Selective Atomic Layer, Deposition of Titanium Dioxide: Effect of Precursor Chemistry. Journal of Vacuum Science & Technology B, 2006. 24(6): p. 2523-2532.
25. Teshima, K., H. Sugimura, Y. Inoue, O. Takai, and A. Takano, Wettability of Poly(Ethylene Terephthalate) Substrates Modified by a Two-Step Plasma Process: Ultra Water-Repellent Surface Fabrication. Chemical Vapor Deposition, 2004. 10(6): p. 295-297.
26. Lee, J.A. and T.J. McCarthy, Polymer Surface Modification: Topography Effects Leading to Extreme Wettability Behavior. Macromolecules, 2007. 40(11): p. 3965-3969.
27. Youngblood, J.P. and T.J. McCarthy, Ultrahydrophobic Polymer Surfaces Prepared by Simultaneous Ablation of Polypropylene and Sputtering of Poly(Tetrafluoroethylene) Using Radio Frequency Plasma. Macromolecules, 1999. 32(20): p. 6800-6806.
28. Chang, K.C., Y.K. Chen, and H. Chen, Preparation of Superhydrophobic Silica-Based Films by Using Polyethylene Glycol and Tetraethoxysilane. Journal of Applied Polymer Science, 2007. 105(3): p. 1503-1510.
29. Qian, B.T. and Z.Q. Shen, Fabrication of Superhydrophobic Surfaces by Dislocation-Selective Chemical Etching on Aluminum, Copper, and Zinc Substrates. Langmuir, 2005. 21(20): p. 9007-9009.
67
30. Li, M., J.H. Xu, and Q.H. Lu, Creating Superhydrophobic Surfaces with Flowery Structures on Nickel Substrates through a Wet-Chemical-Process. Journal of Materials Chemistry, 2007. 17(45): p. 4772-4776.
31. Ranby, B., Recent Progress on Structure and Morphology of Cellulose. Advances in Chemistry Series, 1969(95): p. 139-151.
32. Zhao, H.B., J.H. Kwak, Z.C. Zhang, H.M. Brown, B.W. Arey, and J.E. Holladay, Studying Cellulose Fiber Structure by Sem, Xrd, Nmr and Acid Hydrolysis. Carbohydrate Polymers, 2007. 68(2): p. 235-241.
33. Deraman, M., S. Zakaria, and J.A. Murshidi, Estimation of Crystallinity and Crystallite Size of Cellulose in Benzylated Fibres of Oil Palm Empty Fruit Bunches by X-Ray Diffraction. Japanese Journal of Applied Physics, Part 1: Regular Papers and Short Notes and Review Papers, 2001. 40(5 A): p. 3311-3314.
34. Manley, R.S.J., Fine Structure of Native Cellulose Microfibrils. Nature, 1964. 204(496): p. 1155-1157.
35. Simon, I., L. Glasser, H.A. Scheraga, and R.S. Manley, Structure of Cellulose .2. Low-Energy Crystalline Arrangements. Macromolecules, 1988. 21(4): p. 990-998.
36. Ranby, B., Rydholm, S.A., , Polymer Processes, in High Polymers. 1956, Interscience: New York. p. 351.
37. Smook, G.A., Handbook of Pulp and Paper Technology. 1990: Vancouver ; Bellingham : Wangus Wilde Publications.
38. McKeown, J.J. and W.I. Lyness, Evidence for Retention of the Crystalline-Amorphous Ratio of Cellulose During Heterogeneous Acid Hydrolysis. Journal of Polymer Science, 1960. 47(0149): p. 9-17.
39. Kim, S., K.J. Lee, and Y. Seo, Polyetheretherketone (Peek) Surface Functionalization by Low-Energy Ion-Beam Irradiation under a Reactive O-2 Environment and Its Effect on the Peek/Copper Adhesives. Langmuir, 2004. 20(1): p. 157-163.
68
40. Teshima, K., H. Sugimura, Y. Inoue, O. Takai, and A. Takano, Ultra-Water-Repellent Poly(Ethylene Terephthalate) Substrates. Langmuir, 2003. 19(25): p. 10624-10627.
41. Sapieha, S., A.M. Wrobel, and M.R. Wertheimer, Plasma-Assisted Etching of Paper. Plasma Chemistry and Plasma Processing, 1988. 8(3): p. 331-346.
42. Conners, T.E. and S. Banerjee, Surface Analysis of Paper. 1995, Boca Raton, FL, United States: CRC Press. 346-346.
43. Mukhopadhyay, S.M., P. Joshi, S. Datta, J.G. Zhao, and P. France, Plasma Assisted Hydrophobic Coatings on Porous Materials: Influence of Plasma Parameters. J. Phys. D-Appl. Phys., 2002. 35(16): p. 1927-1933.
44. Vaswani, S., J. Koskinen, and D.W. Hess, Surface Modification of Paper and Cellulose by Plasma-Assisted Deposition of Fluorocarbon Films. Surface & Coatings Technology, 2005. 195(2-3): p. 121-129.
45. Agraharam, S., D.W. Hess, P.A. Kohl, and S.A.B. Allen, Plasma Chemistry in Fluorocarbon Film Deposition from Pentafluoroethane/Argon Mixtures. Journal of Vacuum Science & Technology A, 1999. 17(6): p. 3265-3271.
46. Dobbs, G.T., B. Balu, C. Young, C. Kranz, D.W. Hess, and B. Mizaikoff, Mid-Infrared Chemical Sensors Utilizing Plasma-Deposited Fluorocarbon Membranes. Analytical Chemistry, 2007. 79(24): p. 9566-9571.
47. Gaudin, A.M., A.F. Witt, and T.G. Decker, Contact Angle Hysteresis - Principles and Application of Measuremen Methods. Transactions of the Society of Mining Engineers of AIME, 1963. 226: p. 107-112.
48. Sponsler, O.L., X-Ray Methods Used in Determining Structure of Cellulose Fibers - Organomolecular Investigations. Industrial and Engineering Chemistry, 1928. 20(1): p. 1060-1062.
49. Walker, W.H., A Recent Development in the Chemistry of Cellulose. Journal of the Franklin Institute, 1907. 164: p. 131-140.
69
50. Ferrero, F. and R. Bongiovanni, Improving the Surface Properties of Cellophane by Air Plasma Treatment. Surface & Coatings Technology, 2006. 200(16-17): p. 4770-4776.
51. Oh, S.Y., D.I. Yoo, Y. Shin, and G. Seo, Ftir Analysis of Cellulose Treated with Sodium Hydroxide and Carbon Dioxide. Carbohydrate Research, 2005. 340(3): p. 417-428.
52. Ma, M.L. and R.M. Hill, Superhydrophobic Surfaces. Current Opinion in Colloid & Interface Science, 2006. 11(4): p. 193-202.
53. Nakajima, A., K. Hashimoto, and T. Watanabe, Recent Studies on Super-Hydrophobic Films. Monatshefte Fur Chemie, 2001. 132(1): p. 31-41.
54. Jin, M.H., X.J. Feng, L. Feng, T.L. Sun, J. Zhai, T.J. Li, and L. Jiang, Superhydrophobic Aligned Polystyrene Nanotube Films with High Adhesive Force. Advanced Materials, 2005. 17(16): p. 1977-1981.
55. Morra, M., E. Occhiello, and F. Garbassi, Contact-Angle Hysteresis in Oxygen Plasma Treated Poly(Tetrafluoroethylene). Langmuir, 1989. 5(3): p. 872-876.
56. Tadanaga, K., N. Katata, and T. Minami, Super-Water-Repellent Al2o3 Coating Films with High Transparency. Journal of the American Ceramic Society, 1997. 80(4): p. 1040-1042.
57. Cassie, A.B.D. and S. Baxter, Wettability of Porous Surfaces. Transactions of the Faraday Society, 1944. 40: p. 546-550.
58. Anantharaju, N., M.V. Panchagnula, S. Vedantam, S. Neti, and S. Tatic-Lucic, Effect of Three-Phase Contact Line Topology on Dynamic Contact Angles on Heterogeneous Surfaces. Langmuir, 2007. 23(23): p. 11673-11676.
59. Gao, L.C. and T.J. McCarthy, How Wenzel and Cassie Were Wrong. Langmuir, 2007. 23(7): p. 3762-3765.
60. ASTM, Scotch Tape Test. Ann Book ASTM Standards.
70
71
61. Chwa, S.O. and K.H. Kim, Adhesion Property of Copper Nitride Film to Silicon Oxide Substrate. Journal of Materials Science Letters, 1998. 17(21): p. 1835-1838.
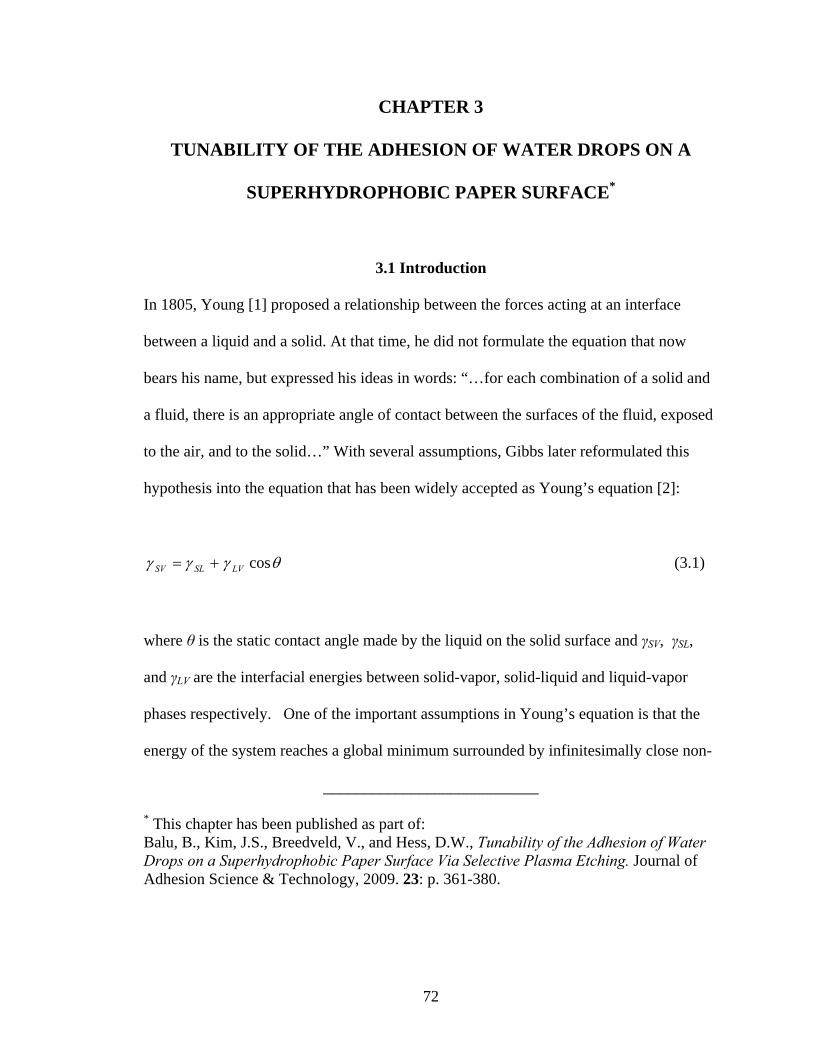
CHAPTER 3
TUNABILITY OF THE ADHESION OF WATER DROPS ON A
SUPERHYDROPHOBIC PAPER SURFACE*
3.1 Introduction
In 1805, Young [1] proposed a relationship between the forces acting at an interface
between a liquid and a solid. At that time, he did not formulate the equation that now
bears his name, but expressed his ideas in words: “…for each combination of a solid and
a fluid, there is an appropriate angle of contact between the surfaces of the fluid, exposed
to the air, and to the solid…” With several assumptions, Gibbs later reformulated this
hypothesis into the equation that has been widely accepted as Young’s equation [2]:
θγγγ cosLVSLSV += (3.1)
where θ is the static contact angle made by the liquid on the solid surface and γSV, γSL,
and γLV are the interfacial energies between solid-vapor, solid-liquid and liquid-vapor
phases respectively. One of the important assumptions in Young’s equation is that the
energy of the system reaches a global minimum surrounded by infinitesimally close non-
___________________________
* This chapter has been published as part of: Balu, B., Kim, J.S., Breedveld, V., and Hess, D.W., Tunability of the Adhesion of Water Drops on a Superhydrophobic Paper Surface Via Selective Plasma Etching. Journal of Adhesion Science & Technology, 2009. 23: p. 361-380.
72
equilibrium states in the energy landscape [2]. However, this scenario is not realistic for
real surfaces because of the presence of physical and chemical heterogeneities, whichgive
rise to the presence of local minima surrounding the global energy minimum. As a result,
most real surfaces exhibit a variety of contact angles for a particular solid-liquid-vapor
combination, rather than a unique “…appropriate angle of contact…” as proposed by
Young. Although Wenzel [3, 4] and Cassie [5] modified Young’s equation for physical
and chemical heterogeneities respectively, the inherent assumption of the system being in
the global energetic minimum still exists. Indeed, Johnson and Dettre [2, 6-8] described
the limitations that may be encountered when applying Young’s hypothesis, as well as
other mathematical formulations (e.g., Wenzel’s and Cassie’s equations), to real surfaces.
More than one hundred years after Young’s essay, the first observation of multiple
contact angle (CA) values for the same solid-liquid-vapor system was reported [9].
Despite the observation of various CA values, well-defined maximum and minimum
contact angles could be identified and the term “contact angle hysteresis” was introduced
to designate the difference between these two contact angles [9]. The maximum and
minimum contact angles were later termed advancing and receding contact angles,
respectively. In order to properly characterize the wetting properties of all substrates, it is
critical to take contact angle hysteresis into account.
The presence of hysteresis becomes critical with regards to superhydrophobic surfaces
(as defined by a static or advancing CA > 150°). Superhydrophobic surfaces are often
correlated with water repellency, but the presence of hysteresis on a superhydrophobic
73

surface might disguise such behavior as it causes water drops to stick to the surface.
Water droplets easily roll off superhydrophobic surfaces if the CA hysteresis is below ~
10°, depending on the size of the drops. For larger CA hysteresis, water droplets tend to
stick even to superhydrophobic substrates with advancing CA greater than ~150°. As a
result, the functional classification of superhydrophobic substrates depends on CA
hysteresis. Approximately 10 years ago it was noted that for the characterization of
(super)hydrophobic substrates it is necessary to determine both the advancing and
receding CAs (i.e., hysteresis) [10, 11]. Over the past few decades various names have
been used to describe surfaces with static or advancing CA larger than 150° (Table 3.1).
Table 3.1 Terminology used to describe superhydrophobic surfaces
Static or advancing CA
CA hysteresis Terms used to describe superhydrophobicity
>150° <10° Absolutely hydrophobic [12], Water-repellant [5], Ultrahydrophobic [10, 13] and Superhydrophobic [14-16]
>150° >10° Super water-repellent [17], Highly hydrophobic [18], Water repulsive [19, 20] and Superhydrophobic[21-24]
>150° NA reported
Ultra water-repellant [25-27], Ultrahydrophobic [28, 29], and Superhydrophobic [15, 30]
A recent review on superhydrophobicity indicates that only surfaces with both an
advancing CA greater than 150° and CA hysteresis less than 10° should be termed
superhydrophobic [31] ; however, this strict definition excludes surfaces with CA
hysteresis > 10°, which exhibit interesting behavior. In the previous chapter (Chapter 2)
superhydrophobic substrates with vastly different CA hysteresis values were reported
and, to avoid confusion, simple terms were proposed to describe two limiting cases of
74
superhydrophobicity: roll-off superhydrophobicity (CA > 150° and CA hysteresis < 10°)
and sticky superhydrophobicity (CA > 150° and CA hysteresis > 10°).
“Roll-off” superhydrophobic surfaces have been extensively investigated in reference to
self-cleaning substrates, often referred to as surfaces mimicking the lotus effect. By
comparison, much less information has been reported on the fabrication of “sticky”
superhydrophobic surfaces that possess a unique combination of high adhesion force and
small liquid-solid contact area. The mobility of water droplets on such sticky
superhydrophobic surfaces can, in principle, be manipulated by tuning the adhesion force,
which may enable novel applications in the chemical and biomedical arenas. Examples
are the development of “tweezers” for liquid drops, controlled mobility of liquid drops
for lab-on- chip (LOC) applications, selective permeability in membranes, as well as
proteomics and genomics microarrays.
To our knowledge, the first sticky superhydrophobic surface was fabricated by Johnson
and Dettre [7], and displayed an advancing CA ~160° with CA hysteresis ~100°; this
discovery has gone largely unnoticed, because of the lack of knowledge about possible
applications at that time. More recently, a number of publications have appeared that
report superhydrophobic surfaces with high hysteresis values [12, 13, 17, 21]. In addition,
a number of publications have reported superhydrophobic surfaces that are able to
immobilize water droplets up to various tilt angles [18, 21, 32-36], without actually
reporting CA hysteresis values. Finally, several publications have reported the stickiness
of a superhydrophobic surface in terms of adhesion forces [22-24, 37]. Because the
75

adhesion force of a droplet to a surface depends on factors like surface inclination angle
and drop size [33, 38-41], CA hysteresis is a more appropriate parameter to enable
comparison of surface characteristics.
So far, there have been no reports regarding the fabrication of superhydrophobic surfaces
that can be tuned from sticky to roll-off behavior by simplycontrolling the receding
contact angles from superhydrophilic (<10°) to superhydrophobic (>150°). The
publications on sticky superhydrophobic surfaces referenced in the preceding paragraph
suggest that droplets can be removed completely from a sticky substrate if the applied
force is sufficiently large. However, if the receding contact angle is superhydrophilic
(<10°), the droplet forms a bridge and breaks during its separation from the sticky
superhydrophobic surface. Reports to date have indicated only a small window for
hysteresis tunability, with the maximum hysteresis less than 100° [7, 12, 13, 21, 32].
This chapter reports a methodology for tuning CA hysteresis (i.e., stickiness) of
superhydrophobic paper surfaces between 149.8±5.8° and 3.5±1.1°. This was achieved
by controlling the formation of physical heterogeneities (roughness) of the paper fibers
during selective etching of the amorphous cellulose domains in an oxygen plasma. Low
surface energy is obtained by depositing a thin film of fluorocarbon onto the etched paper
surfaces using pentafluoroethane (PFE) monomer from a plasma environment (as
described in Section 2.2.2).
76
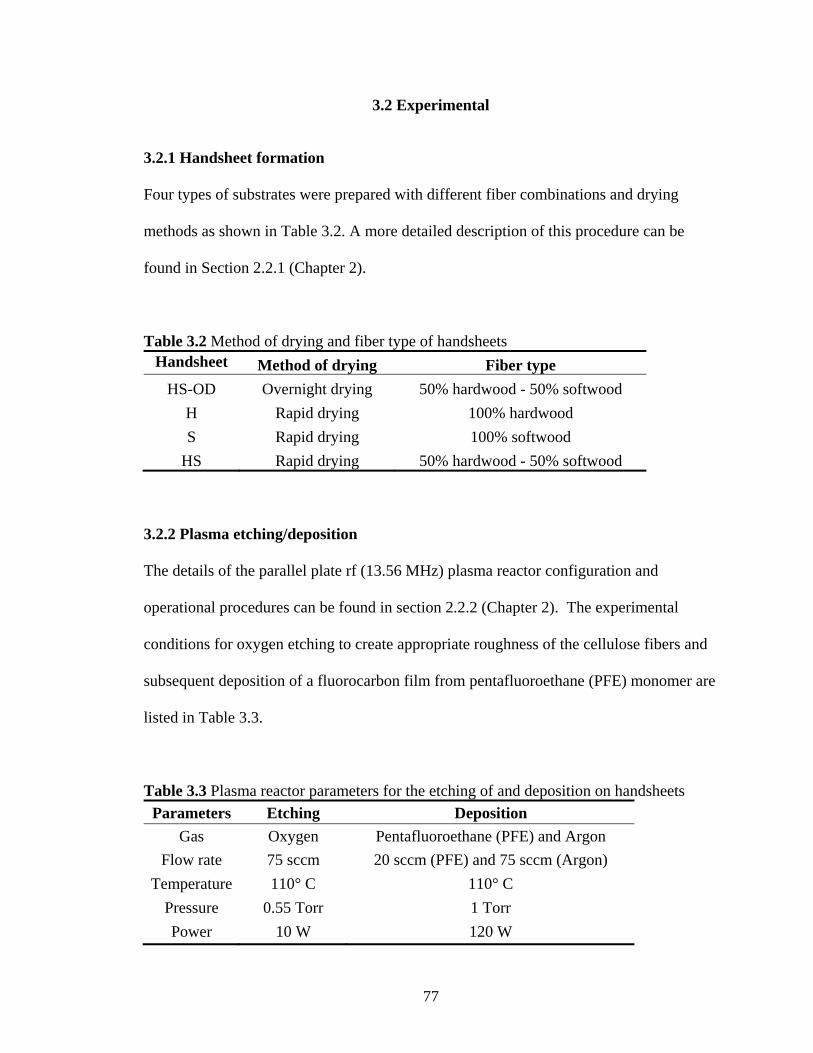
3.2 Experimental
3.2.1 Handsheet formation
Four types of substrates were prepared with different fiber combinations and drying
methods as shown in Table 3.2. A more detailed description of this procedure can be
found in Section 2.2.1 (Chapter 2).
Table 3.2 Method of drying and fiber type of handsheets Handsheet Method of drying Fiber type
HS-OD Overnight drying 50% hardwood - 50% softwood H Rapid drying 100% hardwood S Rapid drying 100% softwood
HS Rapid drying 50% hardwood - 50% softwood
3.2.2 Plasma etching/deposition
The details of the parallel plate rf (13.56 MHz) plasma reactor configuration and
operational procedures can be found in section 2.2.2 (Chapter 2). The experimental
conditions for oxygen etching to create appropriate roughness of the cellulose fibers and
subsequent deposition of a fluorocarbon film from pentafluoroethane (PFE) monomer are
listed in Table 3.3.
Table 3.3 Plasma reactor parameters for the etching of and deposition on handsheets Parameters Etching Deposition
Gas Oxygen Pentafluoroethane (PFE) and Argon Flow rate 75 sccm 20 sccm (PFE) and 75 sccm (Argon)
Temperature 110° C 110° C Pressure 0.55 Torr 1 Torr Power 10 W 120 W
77
3.2.3 SEM
SEM analysis was performed on the treated paper substrates after depositing a thin layer
or gold (~15 nm). A more detailed description of this method and apparatuses used can
be found in section 2.2.3 (Chapter 2).
3.2.4 Water contact angle measurements
A more detailed description of this method can be found in section 2.2.7 (Chapter 2).
3.3 Results and discussion
3.3.1 Tunability of the stickiness
In the previous chapter (Chapter 2), the fabrication of “sticky” and “roll-off”
superhydrophobic paper surfaces with contact angle hysteresis of ~4° and ~150°,
respectively, was reported. After establishing these extreme values of hysteresis for the
sticky and roll-off superhydrophobic paper substrates, this work focuses on
systematically varying the hysteresis. It was expected that the stickiness (hysteresis)
could be manipulated by controlling the physical heterogeneity of the paper surfaces.
This was achieved by selectively etching the amorphous portions of the cellulose fibers
by selective oxygen etching (explained in Chapter 2). To investigate this process,
handsheets (HS-OD) were etched in an oxygen plasma for different durations (0 to 60
minutes). Fluorocarbon film deposition was then performed onto the handsheets (HS-
OD) for 2 and 15 minutes to form thin PFE films.
Figure 3.1 shows the advancing CAs, receding CAs and CA hysteresis for handsheets
(HS-OD) processed for different etching times. It is evident from Figure 3.1 that while
78
the advancing CA remains in the superhydrophobic regime for all samples (>150°), the
receding CA gradually increases with etching time from a superhydrophilic value of
8.4±6.8° to superhydrophobic value of 155.4±1.6°. This smooth transition of the receding
CA results in tunable CA hysteresis values from 147.2±6.8° (sticky) to 7.6±1.6° (roll-
off). Controlling the oxygen etching times thus enables the generation of paper surfaces
with various degrees of stickiness.
79
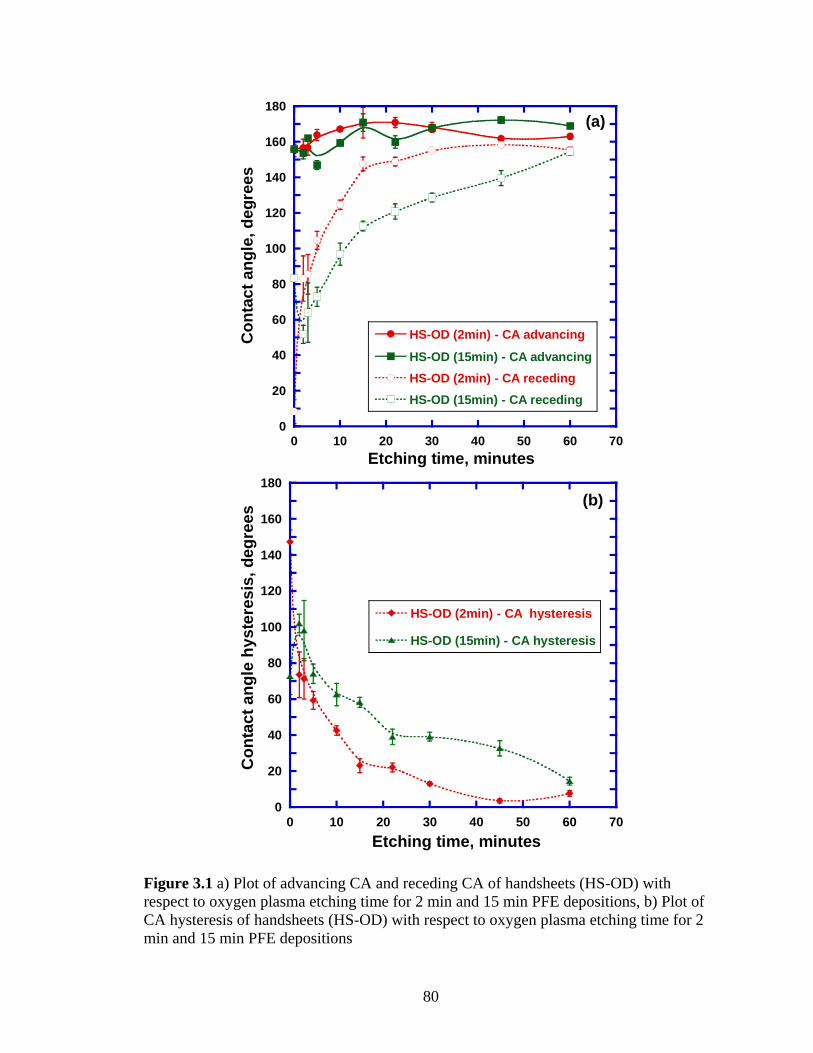
0
20
40
60
80
100
120
140
160
180
0 10 20 30 40 50 60 70
HS-OD (2min) - CA advancing
HS-OD (15min) - CA advancingHS-OD (2min) - CA recedingHS-OD (15min) - CA receding
Con
tact
ang
le, d
egre
es
Etching time, minutes
(a)
0
20
40
60
80
100
120
140
160
180
0 10 20 30 40 50 60 70
HS-OD (2min) - CA hysteresis
HS-OD (15min) - CA hysteresis
Con
tact
ang
le h
yste
resi
s, d
egre
es
Etching time, minutes
(b)
Figure 3.1 a) Plot of advancing CA and receding CA of handsheets (HS-OD) with respect to oxygen plasma etching time for 2 min and 15 min PFE depositions, b) Plot of CA hysteresis of handsheets (HS-OD) with respect to oxygen plasma etching time for 2 min and 15 min PFE depositions
80
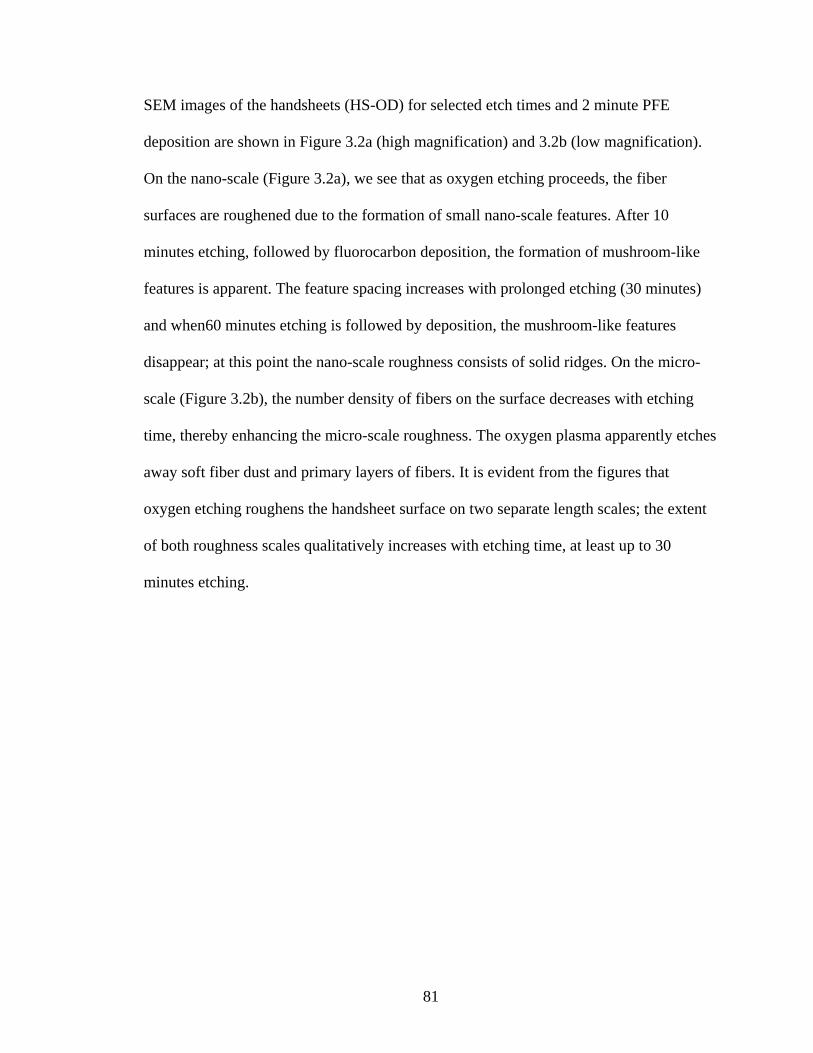
SEM images of the handsheets (HS-OD) for selected etch times and 2 minute PFE
deposition are shown in Figure 3.2a (high magnification) and 3.2b (low magnification).
On the nano-scale (Figure 3.2a), we see that as oxygen etching proceeds, the fiber
surfaces are roughened due to the formation of small nano-scale features. After 10
minutes etching, followed by fluorocarbon deposition, the formation of mushroom-like
features is apparent. The feature spacing increases with prolonged etching (30 minutes)
and when60 minutes etching is followed by deposition, the mushroom-like features
disappear; at this point the nano-scale roughness consists of solid ridges. On the micro-
scale (Figure 3.2b), the number density of fibers on the surface decreases with etching
time, thereby enhancing the micro-scale roughness. The oxygen plasma apparently etches
away soft fiber dust and primary layers of fibers. It is evident from the figures that
oxygen etching roughens the handsheet surface on two separate length scales; the extent
of both roughness scales qualitatively increases with etching time, at least up to 30
minutes etching.
81
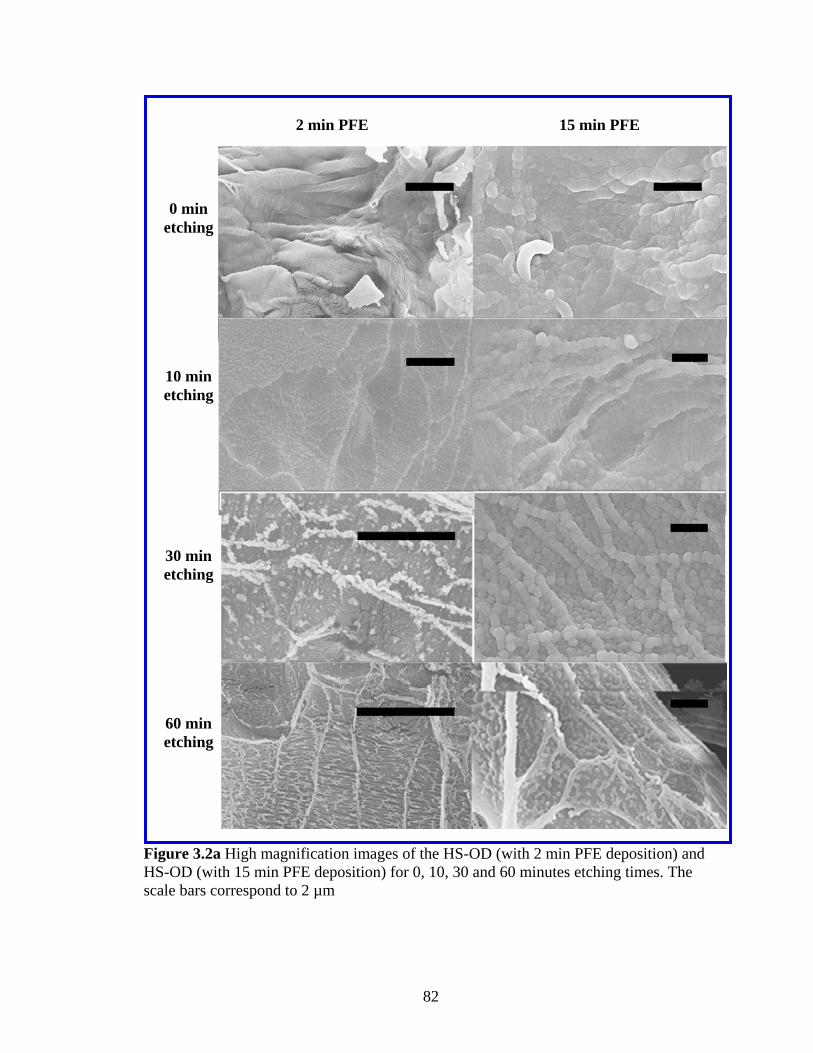
Figure 3.2a High magnification images of the HS-OD (with 2 min PFE deposition) and HS-OD (with 15 min PFE deposition) for 0, 10, 30 and 60 minutes etching times. The scale bars correspond to 2 µm
15 min PFE
60 min etching
30 min etching
10 min etching
0 min etching
2 min PFE
82
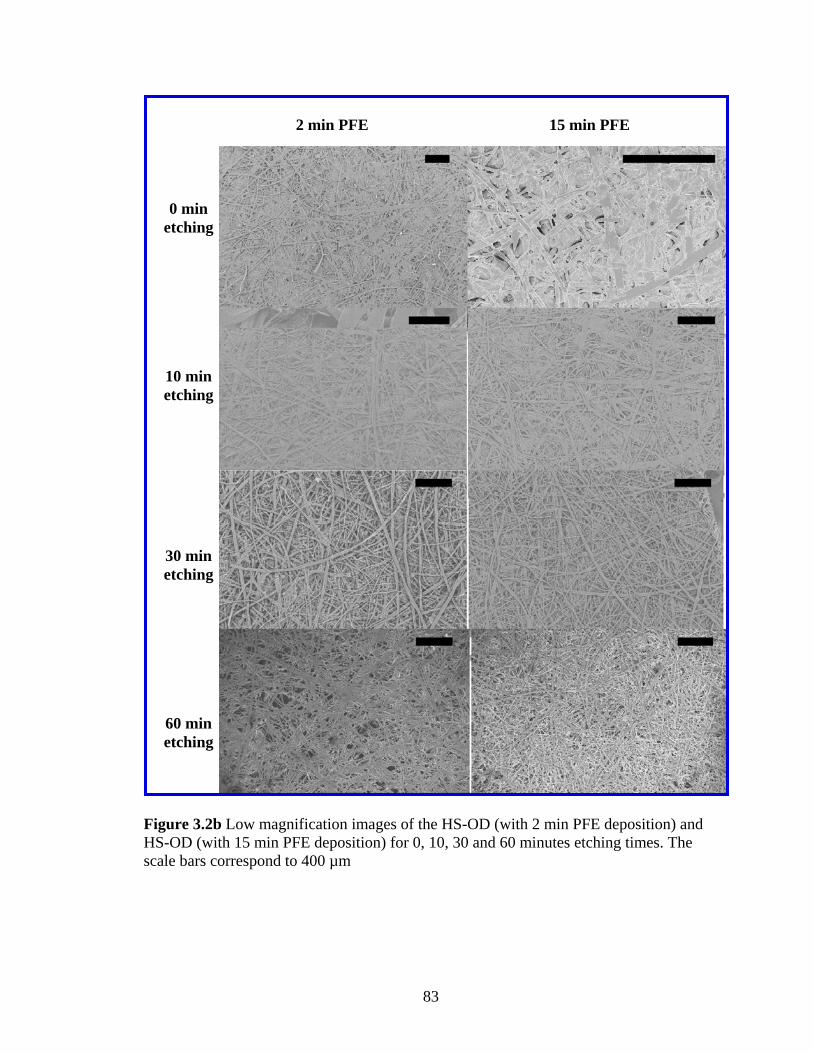
60 min etching
30 min etching
0 min etching
10 min etching
2 min PFE
15 min PFE
Figure 3.2b Low magnification images of the HS-OD (with 2 min PFE deposition) and HS-OD (with 15 min PFE deposition) for 0, 10, 30 and 60 minutes etching times. The scale bars correspond to 400 µm
83
3.3.2 Mechanism for tunability of the stickiness
The interactions of a liquid drop with a physically heterogeneous (rough) solid surface
can be explained by two classic equations: the Wenzel [3] and Cassie [5] equations.
When a liquid fully penetrates into the rough grooves of the surface, the apparent contact
angle made by the liquid drop with the surface is described by Wenzel [3] (Equation 1.1).
On the other hand, when the liquid does not completely penetrate into the solid grooves,
leaving air voids at the apparent solid-liquid interface, the apparent contact angle of the
liquid drop with the surface was described by Cassie and Baxter [5] (Equation 1.2).
Johnson and Dettre [2, 7] later combined these two equations (1.1 and 1.2) to model the
transition from a Wenzel type wetting to a Cassie type wetting as a function of roughness.
They concluded that for a hydrophobic surface, the CA hysteresis increases with
roughness if the wetting is governed by the Wenzel state. On the other hand, the CA
hysteresis decreases with roughness if the wetting is governed by the Cassie state.
Paper is a porous substrate and consists of many tortuous pores formed by the complex
network of cellulose fibers. When a thin PFE film is deposited (~100 nm), only the
individual fibers are coated and the porosity and roughness of the paper substrate remain
essentially unchanged [42]. Therefore, even without the presence of roughness created by
oxygen etching, an inherent micro-scale roughness of the paper surface results from the
network of fibers and the porosity of the paper; this causes the interaction of a liquid drop
with paper to be in the Cassie regime. From Figure 3.1 it is evident that the hysteresis of
the handsheets (HS-OD) decreases with respect to the etching time, which suggests that
the etched handsheets are in the Cassie regime.
84
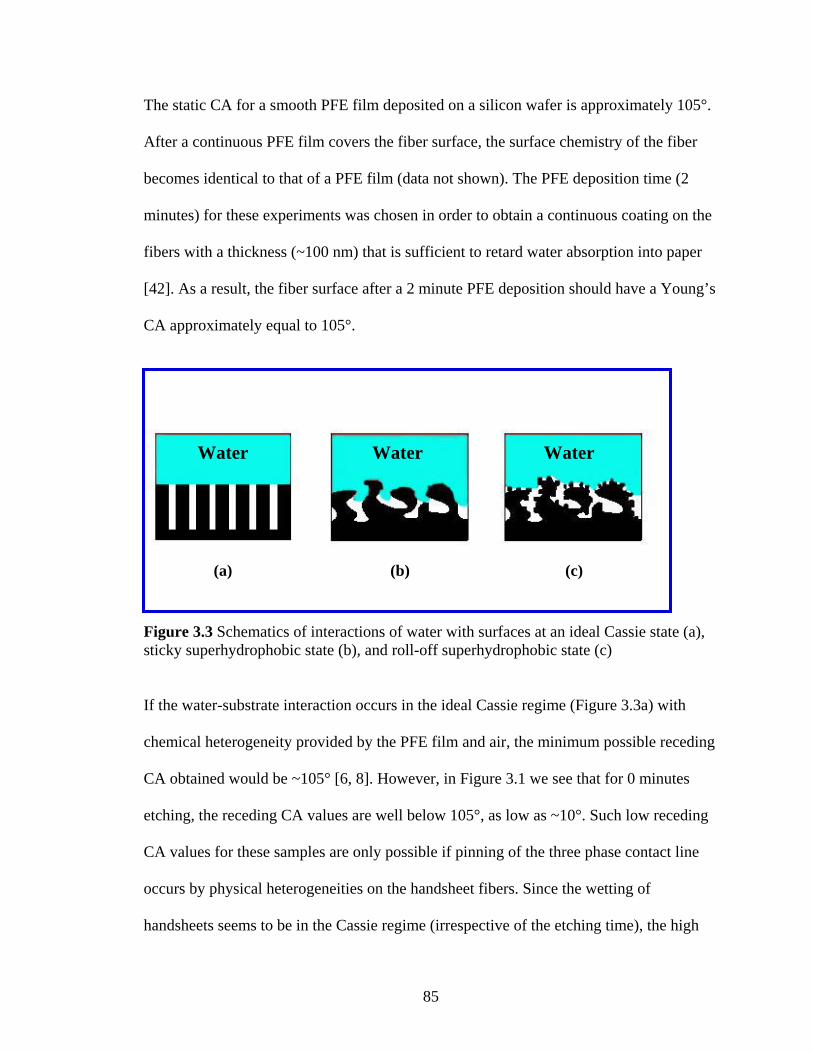
The static CA for a smooth PFE film deposited on a silicon wafer is approximately 105°.
After a continuous PFE film covers the fiber surface, the surface chemistry of the fiber
becomes identical to that of a PFE film (data not shown). The PFE deposition time (2
minutes) for these experiments was chosen in order to obtain a continuous coating on the
fibers with a thickness (~100 nm) that is sufficient to retard water absorption into paper
[42]. As a result, the fiber surface after a 2 minute PFE deposition should have a Young’s
CA approximately equal to 105°.
Water Water Water
(a) (b) (c)
Figure 3.3 Schematics of interactions of water with surfaces at an ideal Cassie state (a), sticky superhydrophobic state (b), and roll-off superhydrophobic state (c)
If the water-substrate interaction occurs in the ideal Cassie regime (Figure 3.3a) with
chemical heterogeneity provided by the PFE film and air, the minimum possible receding
CA obtained would be ~105° [6, 8]. However, in Figure 3.1 we see that for 0 minutes
etching, the receding CA values are well below 105°, as low as ~10°. Such low receding
CA values for these samples are only possible if pinning of the three phase contact line
occurs by physical heterogeneities on the handsheet fibers. Since the wetting of
handsheets seems to be in the Cassie regime (irrespective of the etching time), the high
85
hysteresis could result only if there is a possibility of a nano-scale Wenzel state [3, 4] on
the top of each fiber of the handsheet, characterized by an enhanced liquid-substrate
contact area (figure 3.3b). This type of interaction would increase the energy barrier
between metastable states. For a surface with a very low solid-liquid contact area, a
higher energy barrier greatly decreases the receding CA while only slightly increasing the
advancing CA [8], as we observe for the handsheets. These types of interactions occur in
the unetched handsheet with 2 min PFE deposition, resulting in a high, superhydrophobic
advancing CA and a low, superhydrophilic receding CA. This type of substrate can be
categorized as Cassie state on the micro-scale and Wenzel state on the nano-scale. The
unique combination of Cassie and Wenzel states provides a large energy barrier for the
movement of the three phase contact line, resulting in a very low receding CA, in spite of
a superhydrophobic advancing CA. Similar types of interactions for different roughness
scales are also referred to as “air pocket trapping” [43], “Cassie impregnation” [37, 44],
“petal effect”[37], “transitional superhydrophobic state between Wenzel’s and Cassie’s
states”[45] and “Cassie–Wenzel wetting transition” [44, 46-50].
After etching, the formation of the nano-scale features on the fiber surface (see e.g. 30
minutes in Figure 3.2) provides a different liquid-solid interface. The additional
roughness created by the nano-scale features results in Cassie state wetting at the nano-
scale (Figure 3.3c). These nano-scale features greatly reduce the wetting area, as well as
the energy barrier between metastable states. As a result, the vibration energy of the drop
is now high enough to overcome the energy barriers, giving rise to roll-off behavior (low
CA hysteresis). This type of interaction can be classified as Cassie regime on the nano-
86
and micro- scale. This type of interaction is commonly referred to as the “lotus state”
[45], in reference to its natural occurrence on the leaves of lotus plants.
The schematics in Figure 3.3b and Figure 3.3c can be directly compared with the SEM
images (Figure 3.2a and 3.2b) for 0 minutes and 60 minutes etched handsheets (HS-OD).
Figure 3.1 shows that by varying the etching time, the hysteresis can be tuned from a
sticky superhydrophobic to a roll-off superhydrophobic value. It is believed that this
tunability is obtained by a smooth transition from the Wenzel to Cassie state at the nano-
scale (fiber surface) due to the evolution of the nano-scale features. This conclusion is
supported by the SEM images in Figure 3.2a and 3.2b (2 min PFE). The transition of a
drop’s interaction from Cassie state to Wenzel state has been previously obtained by
inducing pressure [51] and vibration[44, 46, 48-50]. Here, we obtain this transition
without using an external stimulus by controlling the topography of the fibers or, in other
words, by evolution of the nano-scale features. In conclusion, the unique combination of
transition in wetting that occurs at the nano-scale, while maintaining a Cassie state at the
micro-scale results in variable receding CA while maintaining a superhydrophobic
advancing CA.
3.3.3 Significance of nano -scale roughness on the tunability of stickiness
Fiber diameters in the handsheet range from 10 to 40 µm. Thus, a PFE film thickness of
less than ~1 µm would not be expected to affect the micro-scale roughness. Two PFE
deposition times were used to coat the etched handsheets (2 and 15 minutes) to study the
effect of nano-scale roughness on tunability. As explained previously, the 2 minute PFE
87
deposition (~100 nm) was chosen because it just exceeds the minimum thickness to
retard water absorption [42]. The 15 minute PFE deposition (~1 µm) was chosen because
we believe this relatively thick film would not disturb the micro-scale features.
Comparisons of the advancing CA, receding CA and CA hysteresis for the 2 min and 15
min PFE deposited handsheets (HS-OD) are shown in Figure 3.1a and 3.1b. The 15 min
PFE deposition on an unetched paper results in a CA hysteresis of 72.6 ±10° which is
lower than the value obtained for a 2 min PFE deposition. This observation is consistent
with the SEM images in Figure 3.2a. With increased PFE deposition time (15 minutes),
the presence of globular features is visible on the unetched handsheets (0 min). It is
believed that these nano-scale features decrease the hysteresis by enhancing roughness.
On the other hand, the CA hysteresis goes through a maximum value after 2 minutes
etching and then decreases, following the same trend as the handsheets with 2 min PFE
deposition. As explained previously, hysteresis increases with roughness if the interaction
between the water drop and surface is in the Wenzel state. Hence, it can be concluded
that 2 minutes etching increases the roughness scales (from 0 minutes etching)
appropriate for Wenzel state wetting. After 3 minutes etching, the fiber topography is
appropriate for wetting in the Cassie regime, resulting in a decrease in the CA hysteresis
with respect to etching (roughness). It is evident from Figures 3.1a and 3.1b that the
hysteresis values for the etched fibers with 15 min of PFE deposition are consistently
higher than for 2 min PFE deposition. This increased hysteresis may be attributed to the
larger nano-scale features observed on handsheets after 15 min PFE deposition (Figure
3.2a) which provide a larger solid-liquid contact area.
88
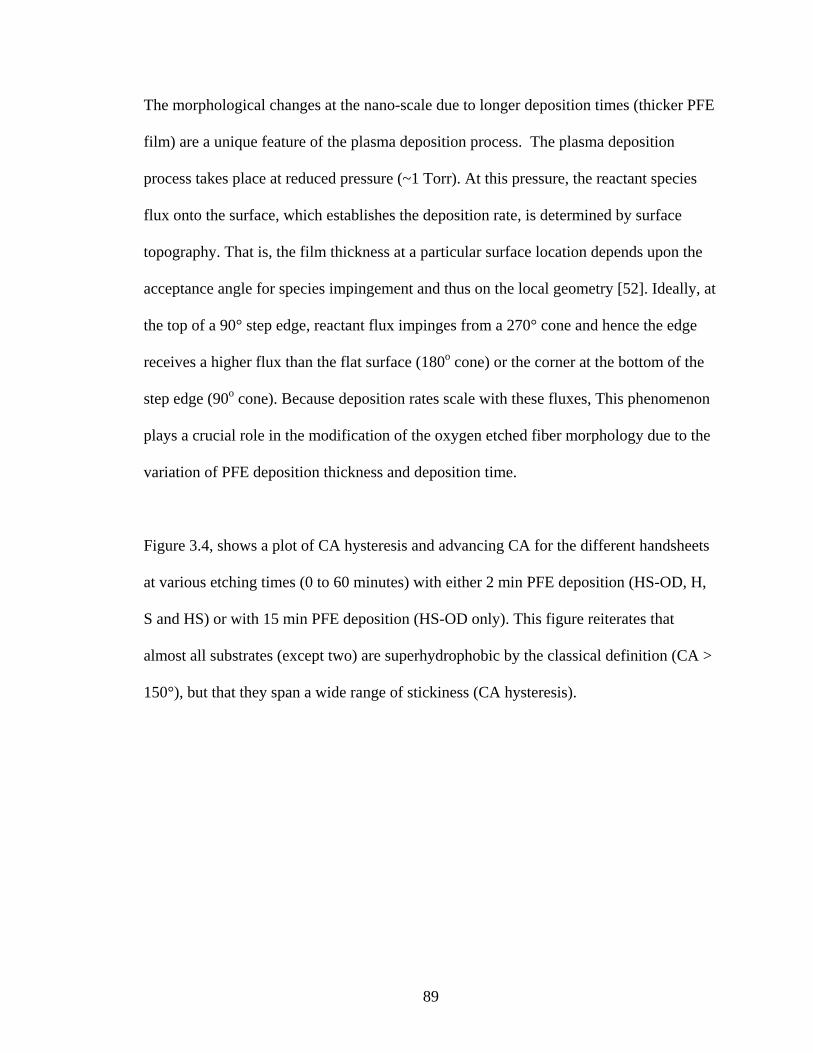
The morphological changes at the nano-scale due to longer deposition times (thicker PFE
film) are a unique feature of the plasma deposition process. The plasma deposition
process takes place at reduced pressure (~1 Torr). At this pressure, the reactant species
flux onto the surface, which establishes the deposition rate, is determined by surface
topography. That is, the film thickness at a particular surface location depends upon the
acceptance angle for species impingement and thus on the local geometry [52]. Ideally, at
the top of a 90° step edge, reactant flux impinges from a 270° cone and hence the edge
receives a higher flux than the flat surface (180o cone) or the corner at the bottom of the
step edge (90o cone). Because deposition rates scale with these fluxes, This phenomenon
plays a crucial role in the modification of the oxygen etched fiber morphology due to the
variation of PFE deposition thickness and deposition time.
Figure 3.4, shows a plot of CA hysteresis and advancing CA for the different handsheets
at various etching times (0 to 60 minutes) with either 2 min PFE deposition (HS-OD, H,
S and HS) or with 15 min PFE deposition (HS-OD only). This figure reiterates that
almost all substrates (except two) are superhydrophobic by the classical definition (CA >
150°), but that they span a wide range of stickiness (CA hysteresis).
89
0
30
60
90
120
150
180
0 30 60 90 120 150 180
CA
hys
tere
sis,
deg
rees
CA advancing, degrees
Hydrophilic Hydrophobic
"Roll-off" Superhydrophobic
"Sticky"Superhydrophobic
Figure 3.4 CA hysteresis versus CA for all samples investigated for various etching times: HS-OD, H, S and HS with 2 min PFE deposition and also HS-OD with 15 min PFE deposition
3.4 Conclusions
The fabrication of superhydrophobic paper surfaces with a wide range of contact angle
hysteresis values has been achieved, which results in variable stickiness of water drops on
these substrates. The tunability of hysteresis was obtained by creating physical
heterogeneity (roughness) on the cellulose fibers via selective oxygen plasma etching.
Tunable stickiness of water drops on paper-based substrates can be important in
controlling the mobility of drops on the surface. Sticky superhydrophobic surfaces can
also be a used to make “tweezers” for liquid drops that allow the transfer of a large
90
volume of liquid with low solid-liquid contact area. These concepts may open new
windows of opportunity in chemical and biomedical research areas such as microfluidics,
lab-on-Paper (LOP), MEMS, proteomics and genomics. In addition, generation of tunable
surface properties on biodegradable, inexpensive, recyclable paper substrates may widen
the scope of these possible applications.
91
REFERENCES
1. Young, T., An Essay on the Cohesion of Fluids. Philosophical Trans. Royal Soc. London, 1805. 95: p. 65-87.
2. Johnson Jr., R.E. and R.H. Dettre, Contact Angle Hysteresis I. Study of an Idealized Rough Surface, in Contact Angle, Wettability and Adhesion; Adv. Chem. Ser. 1964, Amer. Chem. Soc., Washington D. C. p. 112-135.
3. Wenzel, R.N., Resistance of Solid Surfaces to Wetting by Water. Ind. Eng. Chem., 1936. 28: p. 988-994.
4. Wenzel, R.N., Surface Roughness and Contact Angle. J Phys. Colloid Chem., 1949. 53(9): p. 1466-1467.
5. Cassie, A.B.D. and S. Baxter, Wettability of Porous Surfaces. Transactions of the Faraday Society, 1944. 40: p. 546-550.
6. Dettre, R.H. and R.E. Johnson Jr., Contact Angle Hysteresis .4. Contact Angle Measurements on Heterogeneous Surfaces. Journal of Physical Chemistry, 1965. 69(5): p. 1507-.
7. Dettre, R.H. and R.E. Johnson Jr., Contact Angle Hysteresis Ii. Contact Angle Measurements on Rough Surfaces, in Contact Angle, Wettability and Adhesion; Adv. Chem. Ser. 1964, Amer. Chem. Soc., Washington D. C. p. 136-144.
8. Johnson Jr., R.E. and R.H. Dettre, Contact Angle Hysteresis .3. Study of an Idealized Heterogeneous Surface. Journal of Physical Chemistry, 1964. 68(7): p. 1744-1750.
9. Gaudin, A.M., A.F. Witt, and T.G. Decker, Contact Angle Hysteresis - Principles and Application of Measuremen Methods. Transactions of the Society of Mining Engineers of AIME, 1963. 226: p. 107-112.
10. Chen, W., A.Y. Fadeev, M.C. Hsieh, D. Oner, J. Youngblood, and T.J. McCarthy, Ultrahydrophobic and Ultralyophobic Surfaces: Some Comments and Examples. Langmuir, 1999. 15(10): p. 3395-3399.
92
11. Oner, D. and T.J. McCarthy, Ultrahydrophobic Surfaces. Effects of Topography Length Scales on Wettability. Langmuir, 2000. 16(20): p. 7777-7782.
12. Morra, M., E. Occhiello, and F. Garbassi, Contact-Angle Hysteresis in Oxygen Plasma Treated Poly(Tetrafluoroethylene). Langmuir, 1989. 5(3): p. 872-876.
13. Youngblood, J.P. and T.J. McCarthy, Ultrahydrophobic Polymer Surfaces Prepared by Simultaneous Ablation of Polypropylene and Sputtering of Poly(Tetrafluoroethylene) Using Radio Frequency Plasma. Macromolecules, 1999. 32(20): p. 6800-6806.
14. Callies, M., Y. Chen, F. Marty, A. Pepin, and D. Quere, Microfabricated Textured Surfaces for Super-Hydrophobicity Investigations. Microelectronic engineering, 2005. 78(79): p. 100-105.
15. Zhang, J.L., J.A. Li, and Y.C. Han, Superhydrophobic Ptfe Surfaces by Extension. Macromolecular Rapid Communications, 2004. 25(11): p. 1105-1108.
16. Zhu, L.B., Y.H. Xiu, J.W. Xu, P.A. Tamirisa, D.W. Hess, and C.P. Wong, Superhydrophobicity on Two-Tier Rough Surfaces Fabricated by Controlled Growth of Aligned Carbon Nanotube Arrays Coated with Fluorocarbon. Langmuir, 2005. 21(24): p. 11208-11212.
17. Tadanaga, K., N. Katata, and T. Minami, Super-Water-Repellent Al2o3 Coating Films with High Transparency. Journal of the American Ceramic Society, 1997. 80(4): p. 1040-1042.
18. Winkleman, A., G. Gotesman, A. Yoffe, and R. Naaman, Immobilizing a Drop of Water: Fabricating Highly Hydrophobic Surfaces That Pin Water Droplets. Nano Letters, 2008. 8(4): p. 1241-1245.
19. Miller, J.D., S. Veeramasuneni, J. Drelich, M.R. Yalamanchili, and G. Yamauchi, Effect of Roughness as Determined by Atomic Force Microscopy on the Wetting Properties of Ptfe Thin Films. Polymer Engineering and Science, 1996. 36(14): p. 1849-1855.
20. Veeramasuneni, S., J. Drelich, J.D. Miller, and G. Yamauchi, Hydrophobicity of Ion-Plated Ptfe Coatings. Progress in Organic Coatings, 1997. 31(3): p. 265-270.
93
21. Di Mundo, R., F. Palumbo, and R. d'Agostino, Nanotexturing of Polystyrene Surface in Fluorocarbon Plasmas: From Sticky to Slippery Superhydrophobicity. Langmuir, 2008. 24(9): p. 5044-5051.
22. Guo, Z.G. and W.M. Liu, Sticky Superhydrophobic Surface. Applied Physics Letters, 2007. 90(22): p. 223111-1 - 223111-3.
23. Hong, X., X.F. Gao, and L. Jiang, Application of Superhydrophobic Surface with High Adhesive Force in No Lost Transport of Superparamagnetic Microdroplet. Journal of the American Chemical Society, 2007. 129(6): p. 1478-1479.
24. Jin, M.H., X.J. Feng, L. Feng, T.L. Sun, J. Zhai, T.J. Li, and L. Jiang, Superhydrophobic Aligned Polystyrene Nanotube Films with High Adhesive Force. Advanced Materials, 2005. 17(16): p. 1977-1981.
25. Hozumi, A. and O. Takai, Preparation of Ultra Water-Repellent Films by Microwave Plasma-Enhanced Cvd. Thin Solid Films, 1997. 303(1-2): p. 222-225.
26. Onda, T., S. Shibuichi, N. Satoh, and K. Tsujii, Super-Water-Repellent Fractal Surfaces. Langmuir, 1996. 12(9): p. 2125-2127.
27. Shibuichi, S., T. Onda, N. Satoh, and K. Tsujii, Super Water-Repellent Surfaces Resulting from Fractal Structure. Journal of Physical Chemistry, 1996. 100(50): p. 19512-19517.
28. Kunugi, Y., T. Nonaku, Y.B. Chong, and N. Watanabe, Electroorganic Reactions on Organic Electrodes .18. Electrolysis Using Composite-Plated Electrodes .7. Preparation of Ultrahydrophobic Electrodes and Their Electrochemical Properties. Journal of Electroanalytical Chemistry, 1993. 353(1-2): p. 209-215.
29. Ogawa, K., M. Soga, Y. Takada, and I. Nakayama, Development of a Transparent and Ultrahydrophobic Glass Plate. Japanese Journal of Applied Physics Part 2-Letters, 1993. 32(4B): p. L614-L615.
30. Schakenraad, J.M., I. Stokroos, H. Bartels, and H.J. Busscher, Patency of Small Caliber, Superhydrophobic E-Ptfe Vascular Grafts - a Pilot-Study in the Rabbit Carotid-Artery. Cells Mater., 1992. 2(3): p. 193-199.
94
31. Roach, P., N.J. Shirtcliffe, and M.I. Newton, Progess in Superhydrophobic Surface Development. Soft Matter, 2008. 4(2): p. 224-240.
32. Yao, Y., X. Dong, S. Hong, H. Ge, and C.C. Han, Shear-Controlled Micro/Nanometer-Scaled Super-Hydrophobic Surfaces with Tunable Sliding Angles from Single Component Isotactic Poly (Propylene). Macromolecular Rapid Communications, 2006. 27(19): p. 1627-1631.
33. Quere, D., M.J. Azzopardi, and L. Delattre, Drops at Rest on a Tilted Plane. Langmuir, 1998. 14(8): p. 2213-2216.
34. Liao, K.S., A. Wan, J.D. Batteas, and D.E. Bergbreiter, Superhydrophobic Surfaces Formed Using Layer-by-Layer Self-Assembly with Aminated Multiwall Carbon Nanotubes. Langmuir, 2008. 24(8): p. 4245-4253.
35. Li, Y.B., M.J. Zheng, L. Ma, M. Zhong, and W.Z. Shen, Fabrication of Hierarchical Zno Architectures and Their Superhydrophobic Surfaces with Strong Adhesive Force. Inorganic Chemistry, 2008. 47(8): p. 3140-3143.
36. Boduroglu, S., M. Cetinkaya, W.J. Dressick, A. Singh, and M.C. Demirel, Controlling the Wettability and Adhesion of Nanostructured Poly-(P-Xylylene) Films. Langmuir, 2007. 23(23): p. 11391-11395.
37. Feng, L., Y. Zhang, J. Xi, Y. Zhu, N. Wang, F. Xia, and L. Jiang, Petal Effect: A Superhydrophobic State with High Adhesive Force. Langmuir, 2008. 24(8): p. 4114-4119.
38. Dussan V., E.B. and R.T.P. Chow, On the Ability of Drops or Bubbles to Stick to Non-Horizontal Surfaces of Solids. Journal of Fluid Mechanics, 1983. 137(DEC): p. 1-29.
39. Dussan V., E.B., On the Ability of Drops to Stick to Surfaces of Solids .3. The Influences of the Motion of the Surrounding Fluid on Dislodging Drops. Journal of Fluid Mechanics, 1987. 174: p. 381-397.
40. Dussan V., E.B., On the Ability of Drops or Bubbles to Stick to Non-Horizontal Surfaces of Solids .2. Small Drops or Bubbles Having Contact Angles of Arbitrary Size. Journal of Fluid Mechanics, 1985. 151(FEB): p. 1-20.
95
41. Callies, M. and D. Quere, On Water Repellency. Soft Matter, 2005. 1(1): p. 55-61.
42. Vaswani, S., J. Koskinen, and D.W. Hess, Surface Modification of Paper and Cellulose by Plasma-Assisted Deposition of Fluorocarbon Films. Surface & Coatings Technology, 2005. 195(2-3): p. 121-129.
43. de Gennes, P.G., F. Brochard-Wyart, and, and D. Quéré, Capillarity and Wetting Phenomena: Drops, Bubbles, Pearls, Waves. 2003, New York, NY: Springer.
44. Bormashenko, E., R. Pogreb, G. Whyman, Y. Bormashenko, and M. Erlich, Vibration-Induced Cassie-Wenzel Wetting Transition on Rough Surfaces. Applied Physics Letters, 2007. 90(20): p. 2.
45. Wang, S. and L. Jiang, Definition of Superhydrophobic States. Advanced Materials, 2007. 19(21): p. 3423-3424.
46. Bormashenko, E., Y. Bormashenko, T. Stein, and G. Whyman, Why Do Pigeon Feathers Repel Water? Hydrophobicity of Pennae, Cassie-Baxter Wetting Hypothesis and Cassie-Wenzel Capillarity-Induced Wetting Transition. Journal of Colloid and Interface Science, 2007. 311(1): p. 212-216.
47. Bormashenko, E., Y. Bormashenko, T. Stein, G. Whyman, and R. Pogreb, Environmental Scanning Electron Microscopy Study of the Fine Structure of the Triple Line and Cassie-Wenzel Wetting Transition for Sessile Drops Deposited on Rough Polymer Substrates. Langmuir, 2007. 23(8): p. 4378-4382.
48. Bormashenko, E., R. Pogreb, T. Stein, G. Whyman, M. Erlich, A. Musin, V. Machavarianib, and D. Aurbach, Characterization of Rough Surfaces with Vibrated Drops. Physical Chemistry Chemical Physics, 2008. 10: p. 4056-4061.
49. Bormashenko, E., R. Pogreb, G. Whyman, and M. Erlich, Cassie-Wenzel Wetting Transition in Vibrating Drops Deposited on Rough Surfaces: Is the Dynamic Cassie-Wenzel Wetting Transition a 2d or 1d Affair? Langmuir, 2007. 23(12): p. 6501-6503.
50. Bormashenko, E., R. Pogreb, G. Whyman, and M. Erlich, Resonance Cassie-Wenzel Wetting Transition for Horizontally Vibrated Drops Deposited on a Rough Surface. Langmuir, 2007. 23(24): p. 12217-12221.
96
97
51. Lafuma, A. and D. Quere, Superhydrophobic States. Nature Materials, 2003. 2(7): p. 457-460.
52. Chin, B.L. and E.P. Van de Ven, Plasma Teos Process for Interlayer Dielectric Applications. Solid state technology, 1988. 31(4): p. 119-122.
CHAPTER 4
INSIGHTS INTO THE DESIGN OF SUPERHYDROPHOBIC PAPER
SURFACES*
4.1 Introduction
Paper/cellulose is an inexpensive commercial polymer which, depending upon the
specific application, is manufactured in different forms as determined by the choice of
fiber source and paper making method. Hence, it is reasonable to expect that different
types of paper will display significant differences in micro- and nano-scale roughness,
which are key factors in determining their superhydrophobic behavior. In this chapter, the
impact of variations in fiber type and paper making process on the superhydrophobic
properties of paper surfaces is investigated. These experiments provide insight into the
appropriate plasma processing conditions for the design and fabrication of
superhydrophobic paper surfaces for particular applications. In addition, the effect of
water drop size on contact angle and contact line geometry as observed in
superhydrophobicity measurements on heterogeneous porous substrates such as paper is
discussed.
___________________________
* This chapter has been published as: Balu, B., et al., Design of Superhydrophobic Paper/Cellulose Surfaces via Plasma Enhanced Etching and Deposition, in Contact Angle Wettability and Adhesion, K. Mittal, Editor. 2009, Koninklijke Brill NV: Leiden (Netherlands).
98
4.2 Experimental
4.2.1 Paper substrates
Five types of paper substrates were used for superhydrophobicity studies as described in
Table 4.1. Handsheets (H, S, HS) were fabricated following the TAPPI method T205 sp-
02 with southern hardwood kraft (Alabama River Pulp co.) and/or southern softwood
kraft (North Carolina International Paper). A more detailed description of the preparation
of these handsheets is given in Sections 2.2.1 (Chapter 2) and 3.2.1 (Chapter 3).
Commercial copy paper substrates, "Premium white copy paper", were obtained from
Office Depot. Commercial paper towels, SCOTT® High Capacity Hard Roll Towels
(product code 01000) manufactured by Kimberly-Clark Professional were also used.
Table 4.1 Paper substrates used for superhydrophobicity studies Substrates Description
H Handsheet (100% hardwood fibers) S Handsheet (100% softwood fibers)
HS Handsheet (50% hardwood - 50% softwood) CP Copy paper PT Paper towel
4.2.2 Plasma etching/deposition
A 6 inch parallel plate rf (13.56 MHz) plasma reactor was used for plasma etching and
deposition sequences; substrates were heated to 110° C. Details of the reactor
configuration and operational procedures for the treatment of paper substrates can be
found in section 2.2.2 (Chapter 2). Experimental conditions for oxygen etching and
fluorocarbon (pentafluoroethane (PFE)) film deposition are listed in Table 3.3 (Chapter
3).
99
4.2.3 SEM
SEM micrographs were obtained using a LEO scanning electron microscope after
sputtercoating (EMS 350) the paper substrates with a thin gold film (~15 nm). A more
detailed description of the method and apparatus can be found in section 2.2.3 (Chapter
2).
4.2.4 Water contact angle measurements
For standard contact angle measurements, a 4 μL water drop was used. Advancing and
receding contact angles were measured by moving the substrate left to right with respect
to the drop, following the methodology discussed by Gaudin et al. [1]. For substrates
with receding CAs less than 10°, the standard “volume decrement” method was used. A
more detailed description of the methods used to measure contact angles can be found in
section 2.2.7 (Chapter 2).
4.2.5 Microscopic imaging of the contact line
Water drops with appropriate volumes were dispensed onto sticky superhydrophobic
paper (HS) surfaces that had been attached to microscope slides. The existence of a
superhydrophobic contact angle made it impossible to obtain a clear image of the three-
phase contact line with the microscope due to lensing effects of the drop. The water drops
were therefore allowed to evaporate until a hydrophilic contact angle was observed and
the contact line was then imaged with a Leica microscope (DM4500 B; Leica
Microsystems, Inc., Bannockburn, IL) using a 10X objective.
100
4.3 Results and discussion
4.3.1 Effects of papermaking parameters on achievement of superhydrophobicity
The superhydrophobicity imparted to paper substrates results from the combination of a
low surface energy film and two-scale roughness (nano-scale and micro-scale). The nano-
scale roughness originates from the exposure of crystalline domains on fiber surfaces by
selective plasma etching/removal of the surrounding amorphous domains as discussed
extensively in Chapters 1 and 2. On the other hand, the micro-scale roughness is
determined by the topography of the paper fibers, in particular the fiber size and mesh
size of the cellulose web. In this study, the effect of paper making parameters on the
evolution of surface roughness length scales and the resulting superhydrophobicity of the
paper substrates is investigated. The two main categories by which paper fabrication
parameters can be classified are: 1) fiber source (chemical composition and physical
characteristics) and 2) paper making technology used during processing, including
pulping and paper machine configuration. The current work indicates how these
parameters affect the conversion of a hydrophilic paper/cellulose surface into “sticky”
and “roll-off” superhydrophobic surfaces using plasma treatments.
4.3.1.1 Effects of fiber type
Cellulose paper is typically produced from hardwood fibers, softwood fibers, or a
combination of both. This classification of cellulose fibers is based on the trees from
which they are obtained: hardwood fibers come from angiosperm trees (e.g., American
yew, Common juniper, Douglas fir), and softwood fibers originate from gymnosperm
trees (e.g., wild plum, peach, pear) [2, 3]. Both fiber types have approximately the same
101
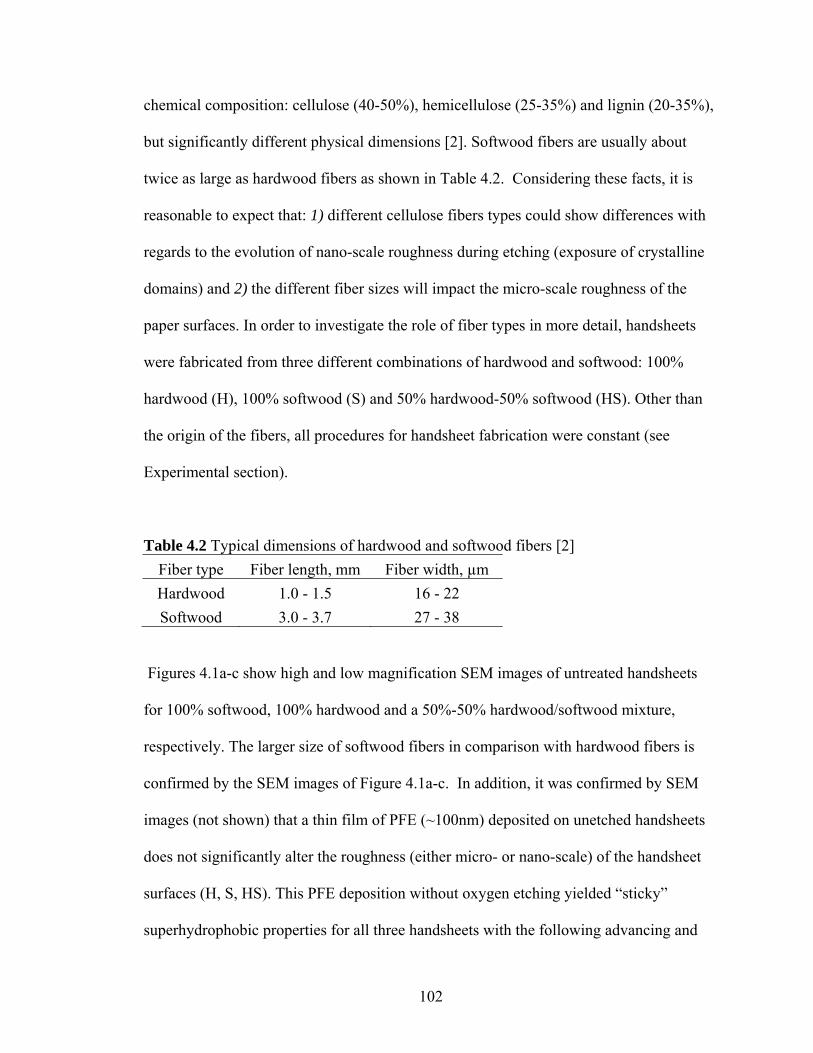
chemical composition: cellulose (40-50%), hemicellulose (25-35%) and lignin (20-35%),
but significantly different physical dimensions [2]. Softwood fibers are usually about
twice as large as hardwood fibers as shown in Table 4.2. Considering these facts, it is
reasonable to expect that: 1) different cellulose fibers types could show differences with
regards to the evolution of nano-scale roughness during etching (exposure of crystalline
domains) and 2) the different fiber sizes will impact the micro-scale roughness of the
paper surfaces. In order to investigate the role of fiber types in more detail, handsheets
were fabricated from three different combinations of hardwood and softwood: 100%
hardwood (H), 100% softwood (S) and 50% hardwood-50% softwood (HS). Other than
the origin of the fibers, all procedures for handsheet fabrication were constant (see
Experimental section).
Table 4.2 Typical dimensions of hardwood and softwood fibers [2] Fiber type Fiber length, mm Fiber width, µm Hardwood 1.0 - 1.5 16 - 22 Softwood 3.0 - 3.7 27 - 38
Figures 4.1a-c show high and low magnification SEM images of untreated handsheets
for 100% softwood, 100% hardwood and a 50%-50% hardwood/softwood mixture,
respectively. The larger size of softwood fibers in comparison with hardwood fibers is
confirmed by the SEM images of Figure 4.1a-c. In addition, it was confirmed by SEM
images (not shown) that a thin film of PFE (~100nm) deposited on unetched handsheets
does not significantly alter the roughness (either micro- or nano-scale) of the handsheet
surfaces (H, S, HS). This PFE deposition without oxygen etching yielded “sticky”
superhydrophobic properties for all three handsheets with the following advancing and
102
receding CAs: H (CAadv/CArec) - 154.3°±1.9°/12.5°±5.0°, S (CAadv/CArec) –
149.0°±2.5°/8.5°±5.0° and HS (CAadv/CArec) - 159.4°±7.7°/9.7°±5.8°. The fact that the
advancing and receding CAs are similar for the three handsheets shows that differences
in micro- and nano-scale roughness due to variations in fiber type do not significantly
affect the “sticky” superhydrophobic behavior.
In subsequent experiments, handsheets were etched in an oxygen plasma for different
durations before depositing the PFE film. Figure 4.2 displays plots of advancing and
receding CA for the different handsheets as a function of oxygen etching time. The graph
shows the transition from “sticky” to “roll-off” superhydrophobicity (CA hysteresis <
10°) after ~30 minutes of etching for all substrates. The curves in Figure 4.2 overlap,
showing that the rate of change of advancing and receding CAs, which is closely
connected to the evolution of nano-scale features, was indistinguishable for the three
handsheets within experimental error. Indeed, there were no noticeable differences
between the sizes of nano-scale features formed on etched hardwood and softwood fibers
(SEM images not shown). These results provide further evidence that there is no
significant difference between the nano-scale features formed on fibers of different types.
In conclusion, different fiber types do not affect the superhydrophobic behavior provided
that the paper making procedures are constant.
4.3.1.2 Effects of paper making:
The pulping process and the paper machine configuration vary from mill to mill in order
to optimize paper properties for specific applications [2]. The process involves the
103
following steps: after wood chips are pulped and bleached, the paper web is formed in the
paper machine, after which it undergoes a variety of mechanical treatments (pressing,
drying and calendering) before finally being collected on a large roll [4, 5]. All steps of
the papermaking process ultimately affect the roughness of the final paper surface. In this
section, the impact of the paper making process conditions on imparting
superhydrophobicity to paper surfaces is explored. Two different paper types (in addition
to laboratory-made handsheets) were used that were fabricated for unique applications: 1)
a commercial copy paper (CP), which is moderately hydrophobic to yield good
printability and 2) a paper towel (PT), which is extremely hydrophilic to yield good
absorptivity.
The SEM images in Figures 4.1d and 4.1e show high and low magnification SEM images
of untreated CP and PT, respectively. Of these two samples, copy paper is most similar to
the handsheets; the main difference is the presence of (inorganic) filler particles on the
fiber surface (shown in Figure 4.1d). The paper towels have a noticeably more porous
surface with very loosely cross-linked fibers; these substrates are designed for superior
absorption properties. From the SEM images it is evident that these substrates have very
different surface roughness values prior to plasma treatment.
104
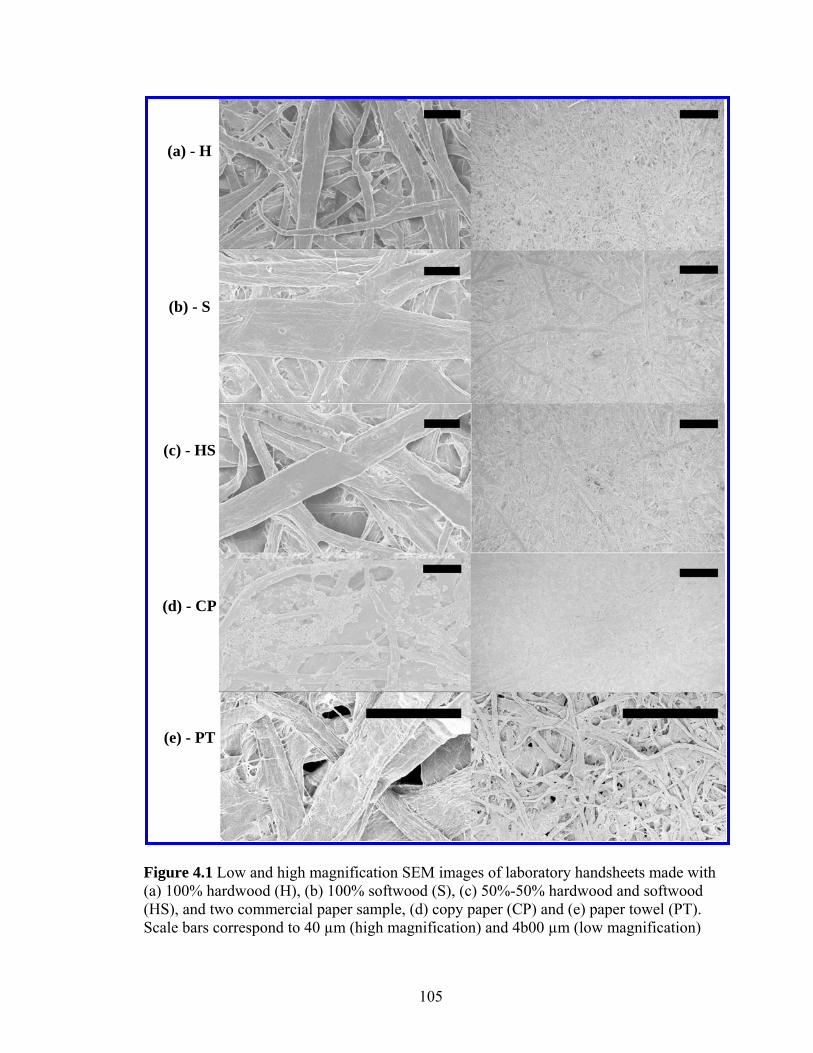
(a) - H
S
(b) - S
(c) - HS
(d) - CP
(e) - PT
Figure 4.1 Low and high magnification SEM images of laboratory handsheets made with (a) 100% hardwood (H), (b) 100% softwood (S), (c) 50%-50% hardwood and softwood (HS), and two commercial paper sample, (d) copy paper (CP) and (e) paper towel (PT). Scale bars correspond to 40 µm (high magnification) and 4b00 µm (low magnification)
105
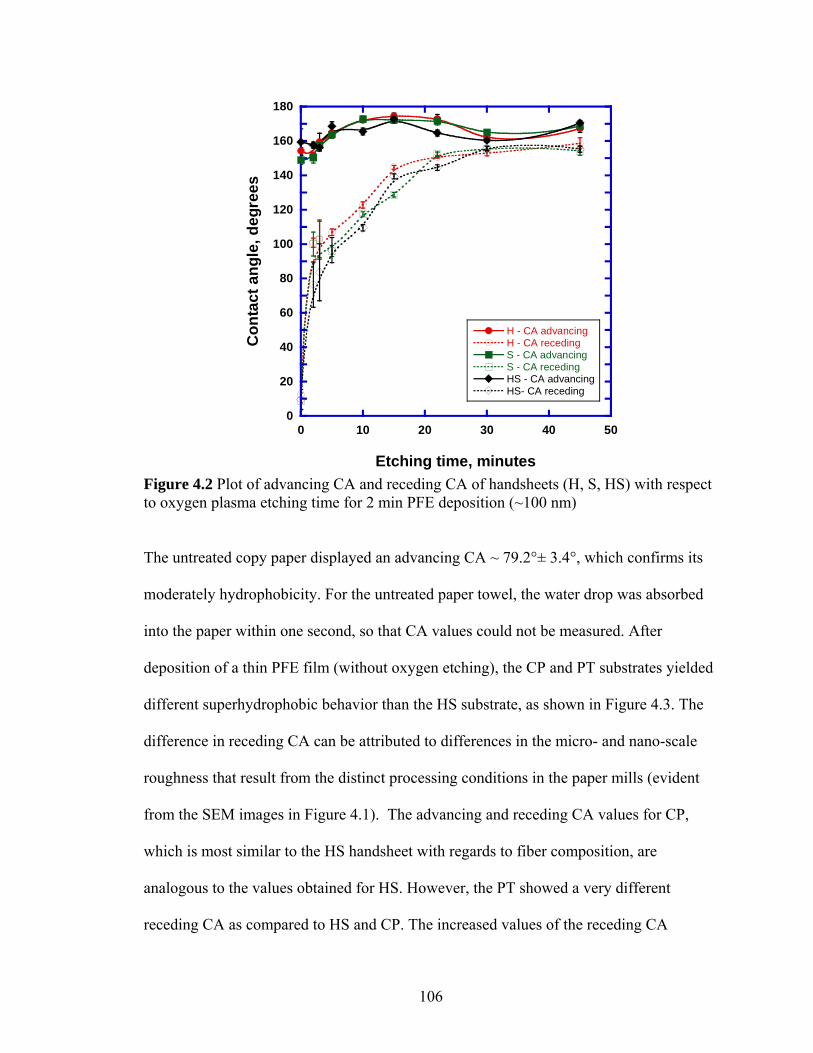
0
20
40
60
80
100
120
140
160
180
0 10 20 30 40 50
H - CA advancingH - CA recedingS - CA advancingS - CA recedingHS - CA advancingHS- CA receding
Con
tact
ang
le, d
egre
es
Etching time, minutes Figure 4.2 Plot of advancing CA and receding CA of handsheets (H, S, HS) with respect to oxygen plasma etching time for 2 min PFE deposition (~100 nm)
The untreated copy paper displayed an advancing CA ~ 79.2°± 3.4°, which confirms its
moderately hydrophobicity. For the untreated paper towel, the water drop was absorbed
into the paper within one second, so that CA values could not be measured. After
deposition of a thin PFE film (without oxygen etching), the CP and PT substrates yielded
different superhydrophobic behavior than the HS substrate, as shown in Figure 4.3. The
difference in receding CA can be attributed to differences in the micro- and nano-scale
roughness that result from the distinct processing conditions in the paper mills (evident
from the SEM images in Figure 4.1). The advancing and receding CA values for CP,
which is most similar to the HS handsheet with regards to fiber composition, are
analogous to the values obtained for HS. However, the PT showed a very different
receding CA as compared to HS and CP. The increased values of the receding CA
106
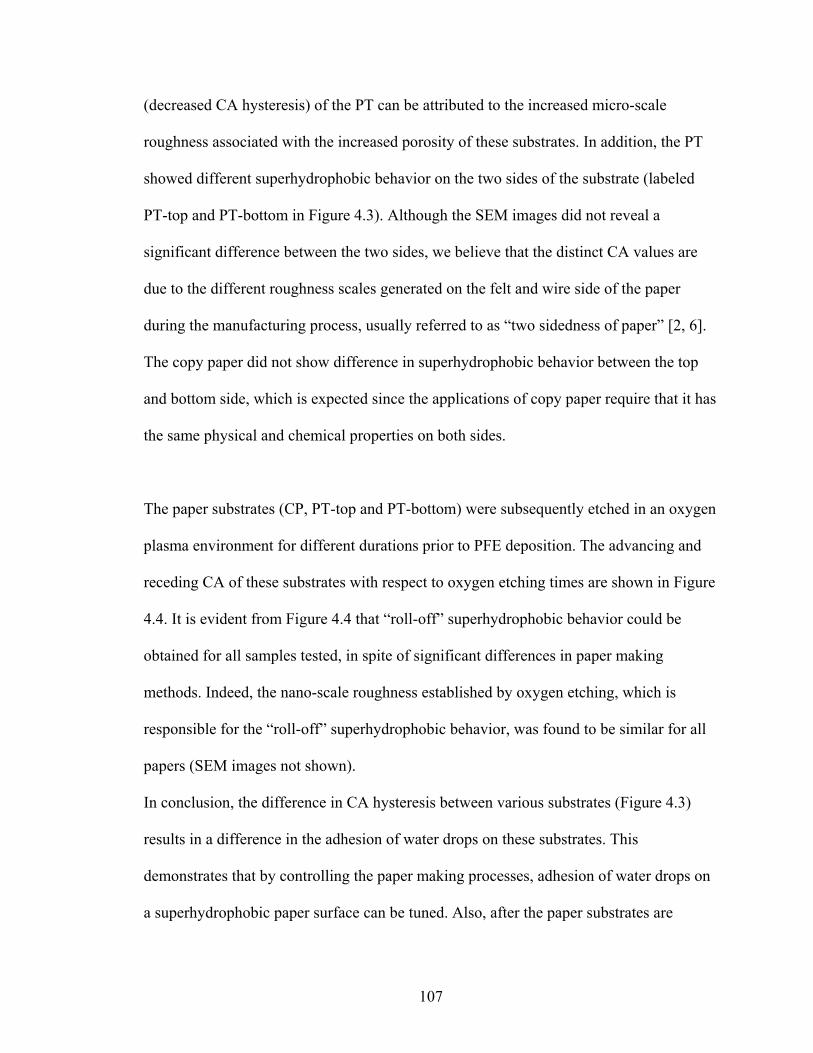
(decreased CA hysteresis) of the PT can be attributed to the increased micro-scale
roughness associated with the increased porosity of these substrates. In addition, the PT
showed different superhydrophobic behavior on the two sides of the substrate (labeled
PT-top and PT-bottom in Figure 4.3). Although the SEM images did not reveal a
significant difference between the two sides, we believe that the distinct CA values are
due to the different roughness scales generated on the felt and wire side of the paper
during the manufacturing process, usually referred to as “two sidedness of paper” [2, 6].
The copy paper did not show difference in superhydrophobic behavior between the top
and bottom side, which is expected since the applications of copy paper require that it has
the same physical and chemical properties on both sides.
The paper substrates (CP, PT-top and PT-bottom) were subsequently etched in an oxygen
plasma environment for different durations prior to PFE deposition. The advancing and
receding CA of these substrates with respect to oxygen etching times are shown in Figure
4.4. It is evident from Figure 4.4 that “roll-off” superhydrophobic behavior could be
obtained for all samples tested, in spite of significant differences in paper making
methods. Indeed, the nano-scale roughness established by oxygen etching, which is
responsible for the “roll-off” superhydrophobic behavior, was found to be similar for all
papers (SEM images not shown).
In conclusion, the difference in CA hysteresis between various substrates (Figure 4.3)
results in a difference in the adhesion of water drops on these substrates. This
demonstrates that by controlling the paper making processes, adhesion of water drops on
a superhydrophobic paper surface can be tuned. Also, after the paper substrates are
107
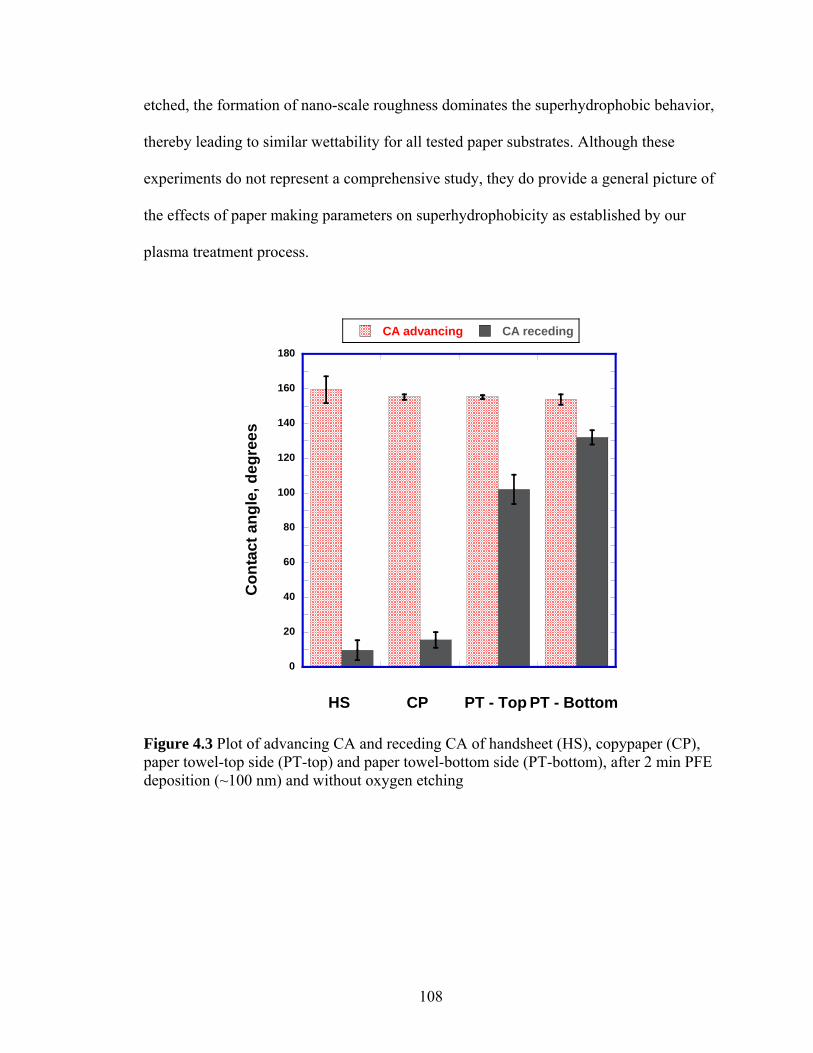
etched, the formation of nano-scale roughness dominates the superhydrophobic behavior,
thereby leading to similar wettability for all tested paper substrates. Although these
experiments do not represent a comprehensive study, they do provide a general picture of
the effects of paper making parameters on superhydrophobicity as established by our
plasma treatment process.
0
20
40
60
80
100
120
140
160
180
HS CP PT - Top PT - Bottom
CA advancing CA receding
Con
tact
ang
le, d
egre
es
Figure 4.3 Plot of advancing CA and receding CA of handsheet (HS), copypaper (CP), paper towel-top side (PT-top) and paper towel-bottom side (PT-bottom), after 2 min PFE deposition (~100 nm) and without oxygen etching
108
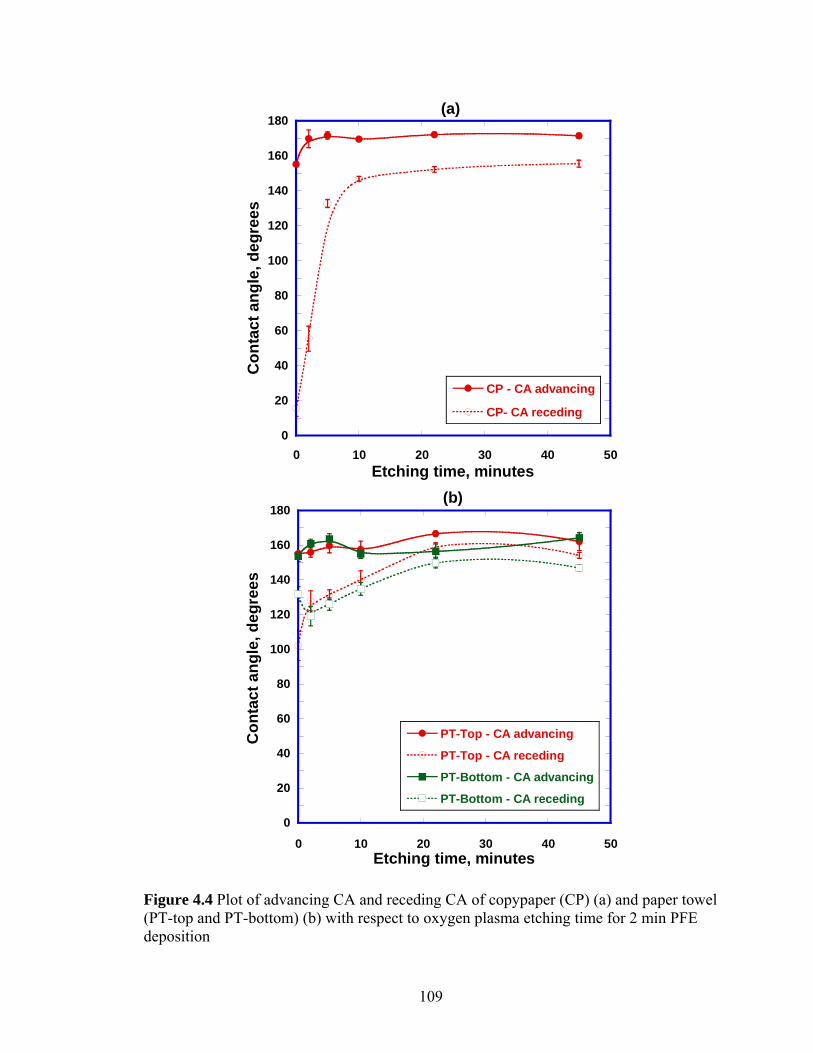
0
20
40
60
80
100
120
140
160
180
0 10 20 30 40 50
CP - CA advancing
CP- CA receding
Con
tact
ang
le, d
egre
es
Etching time, minutes
(a)
0
20
40
60
80
100
120
140
160
180
0 10 20 30 40 50
PT-Top - CA advancing
PT-Top - CA receding
PT-Bottom - CA advancing
PT-Bottom - CA receding
Con
tact
ang
le, d
egre
es
Etching time, minutes
(b)
Figure 4.4 Plot of advancing CA and receding CA of copypaper (CP) (a) and paper towel (PT-top and PT-bottom) (b) with respect to oxygen plasma etching time for 2 min PFE deposition
109
4.3.2 Design of superhydrophobic paper surfaces via control of fiber type and
plasma processing conditions
Longer softwood fibers are usually responsible for paper strength, while shorter
hardwood fibers are predominantly responsible for paper shininess because of reduced
roughness [7]. Experimental results indicate that oxygen etching ultimately reduces the
shininess of the paper by creating nano-scale roughness, so that the presence of hardwood
fibers no longer provides enhanced optical properties in the etched handsheets. Therefore,
fabrication of superhydrophobic paper based on softwood fibers is the most desirable
approach because of the expected increase in physical strength.
For longer PFE deposition times, roll-off superhydrophobic behavior can only be
achieved after 60 minutes etching (data not shown), while for 2 min PFE deposition times
roll-off is observed after much shorter etching times (~30 minutes) (Chapter 2). These
results are due to smoothing of the topography of the roughened surface that occurs
during the deposition of a thicker PFE film. Since prolonged oxygen etching damages the
fiber surfaces, it has a significant negative impact on the strength of the paper, which is
undesirable. Therefore, it is most desirable to obtain roll-off superhydrophobicity at
reduced etch times. It is expected that an optimum PFE thickness exists: thick enough to
retard the absorption of water, yet thin enough to prevent smoothing of the morphology
created by oxygen etching. Results suggest that a ~100 nm film obtained from a 2 min
PFE deposition is a near-optimum thickness to achieve a roll-off superhydrophobic paper
surface with good physical properties. Of course, optimizing the papermaking process to
tune the micro-scale roughness may offer an additional degree of freedom for the design
of superhydrophobic paper surfaces.
110
4.3.3 Discussion of the effect of drop size on contact angle and edge geometry
Measurement of contact angles on rough surfaces is more complex when the drop sizes
are comparable to the roughness length scale of the substrate. Advances in drop dispense
technologies have made it possible to vary the dispensed volume of a water drop in a
controlled manner from a few picoliters to a few microliters. This section describes the
significance of the water drop size when measuring CAs on paper surfaces.
Figure 4.5 shows the contact lines established by water drops of four different volumes
on a HS handsheet with CA characteristics shown in Figure 4.3. Solid lines were drawn
along the three-phase contact lines to highlight the contact line geometry. Clearly, the
contact line is more distorted by the topography of the fiber network for smaller drops
(Figures 4.5a and 4.5b) than for larger drops (4.5c and 4.5d).
In order to determine the effect of contact line distortion on CA measurement, the drop
volume was varied from 0.1 µL to 16 µL, and the advancing CA values were measured.
Figure 4.6 shows the advancing CA as a function of drop volume for HS substrates
etched for three different etching durations. Figure 4.7 shows the images of water drops
corresponding to a 30 min etched HS (“roll-off” superhydrophobic) and 0 min etched HS
(“sticky” superhydrophobic). From the data in the graph it can be concluded that the
advancing CA increases significantly up to a volume of ~2 µL. This suggests a lower
limit of drop volume that should be used to measure CA on superhydrophobic paper
surfaces. On the other hand, the upper limit is determined by the angular resolution of the
CA goniometer. As the drop volume increases, the drop flattens due to gravity, which
makes it difficult to locate the three phase contact point from a side view of the drop.
This limitation can greatly affect the accuracy of CA values, which is consistent with the
111
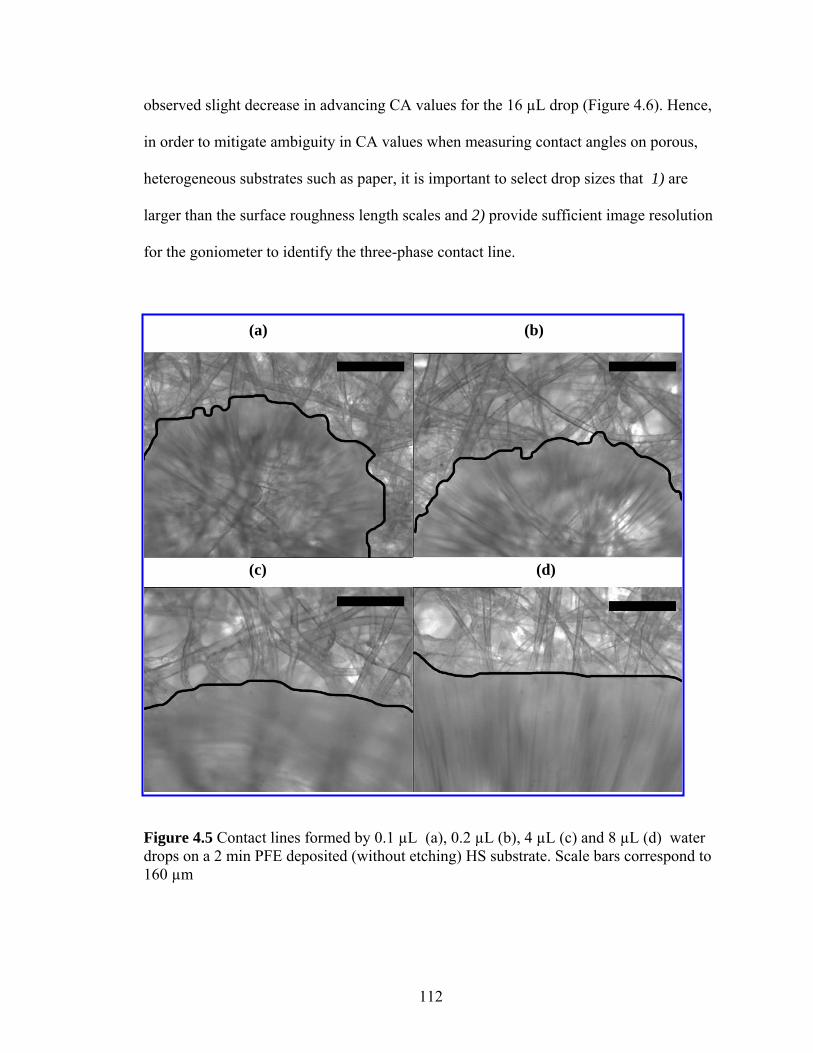
observed slight decrease in advancing CA values for the 16 µL drop (Figure 4.6). Hence,
in order to mitigate ambiguity in CA values when measuring contact angles on porous,
heterogeneous substrates such as paper, it is important to select drop sizes that 1) are
larger than the surface roughness length scales and 2) provide sufficient image resolution
for the goniometer to identify the three-phase contact line.
(a) (b)
(c) (d)
Figure 4.5 Contact lines formed by 0.1 µL (a), 0.2 µL (b), 4 µL (c) and 8 µL (d) water drops on a 2 min PFE deposited (without etching) HS substrate. Scale bars correspond to 160 µm
112
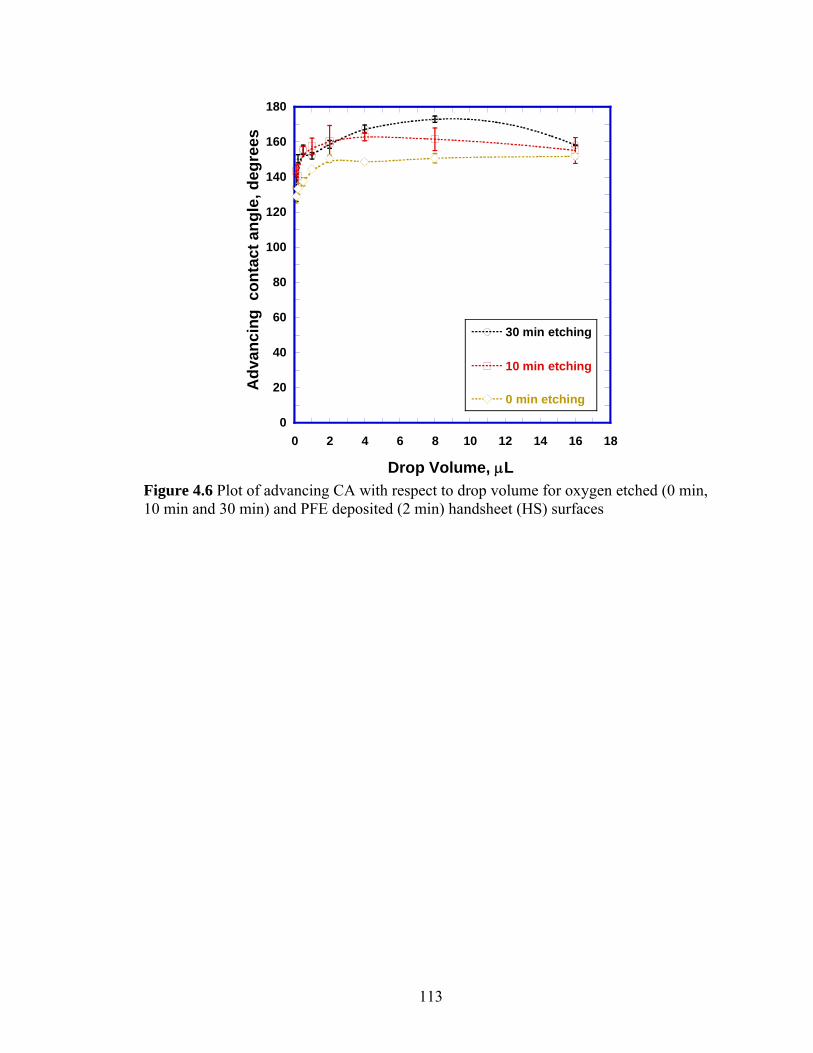
0
20
40
60
80
100
120
140
160
180
0 2 4 6 8 10 12 14 16 18
30 min etching
10 min etching
0 min etching
Adv
anci
ng c
onta
ct a
ngle
, deg
rees
Drop Volume, μL Figure 4.6 Plot of advancing CA with respect to drop volume for oxygen etched (0 min, 10 min and 30 min) and PFE deposited (2 min) handsheet (HS) surfaces
113
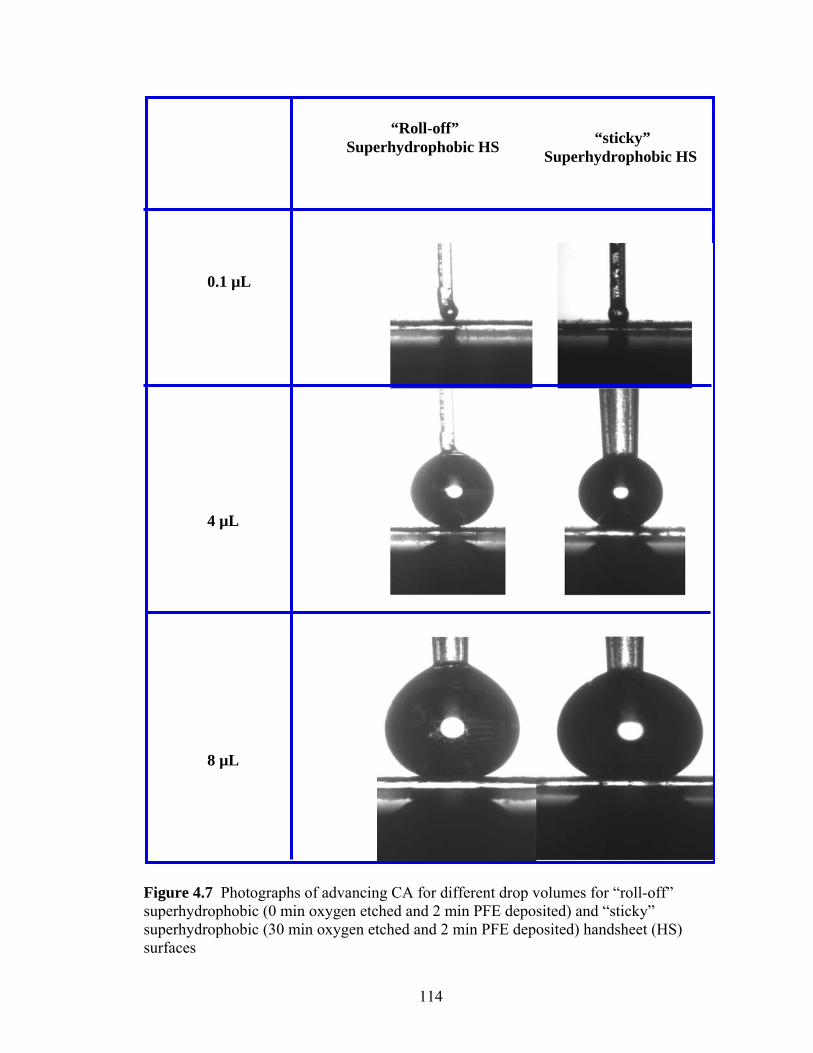
0.1 µL
4 µL
8 µL
“sticky” Superhydrophobic HS
“Roll-off”
Superhydrophobic HS
Figure 4.7 Photographs of advancing CA for different drop volumes for “roll-off” superhydrophobic (0 min oxygen etched and 2 min PFE deposited) and “sticky” superhydrophobic (30 min oxygen etched and 2 min PFE deposited) handsheet (HS) surfaces
114
4.4 Conclusions
The effects of fiber types and paper making parameters on the creation of
superhydrophobic paper surfaces were studied. While the fiber type does not significantly
affect superhydrophobicity, the paper making process plays a significant role in
determining the microscale roughness, and thus the superhydrophobic behavior of paper
substrates. Paper made from softwood fibers is likely to be more suitable for
superhydrophobic applications because of improved physical properties with this fiber
type, in particular paper strength. A PFE film of ~100nm PFE represents a near-optimum
thickness to obtain superhydrophobicity. The importance of water drop volume in the
measurement of CAs on superhydrophobic surfaces fabricated on heterogeneous and
porous substrates such as paper has been discussed. It was concluded that drop sizes that
are larger than the surface roughness length scales and provide sufficient image
resolution for the goniometer to identify the three-phase contact line are critical in
obtaining unambiguous results while measuring CA values for porous substrates.
115
116
REFERENCES
1. Gaudin, A.M., A.F. Witt, and T.G. Decker, Contact Angle Hysteresis - Principles and Application of Measuremen Methods. Society of Mining Engineers, 1963. 226: p. 107-112.
2. Goyal, H. Pulp & Paper Resources & Information Site. 2007.
3. Fewless, G. Trees of Wisconsin. 2006.
4. Company, A.W.C. Paper Machine. 2008.
5. Smook, G.A., Handhook for Pulp & Paper Technologists. 3rd ed. 2002, Vancouver, B.C.: Angus Wilde Publications Inc.
6. Sahin, H.T., S. Manolache, R.A. Young, and F. Denes, Surface Fluorination of Paper in Cf4-Rf Plasma Environments. Cellulose, 2002. 9(2): p. 171-181.
7. Patterson, T., Hardwood and Softwood Fibers - Ipst Lecture Notes B. Balu, Editor. 2006, Hardwood and softwood fibers - IPST lecture notes, IPST: Atlanta.
CHAPTER 5
PATTERNING OF SUPERHYDROPHOBIC PAPER TO CONTROL
THE MOBILITY OF MICRO-LITER DROPS FOR TWO-
DIMENSIONAL LAB-ON-PAPER APPLICATIONS*
5.1 Introduction
This chapter describes patterning methods that provide local control over droplet
adhesion on superhydrophobic paper and an approach to develop novel paper-based LOC
microfluidic devices that enable manipulation (storage, transport, mixing and sampling)
of drops of test fluids on the substrate, without absorption of these fluids into the porous
paper. These two-dimensional devices can be used for qualitative analytical fluid testing,
as well as storage of large arrays of drops for transportation and further quantitative
analysis.
In the early stages of their development, LOC microfluidic devices were fabricated with
technologies originally developed for the microelectronics industry, in particular
photolithography and etching, and thus were fabricated from silicon wafers or glass
substrates [1]. Subsequently, researchers began investigating polymers as substrates
(especially PDMS) in combination with soft lithography techniques because of the
___________________________
* This chapter has been published as: Balu, B., A.D. Berry, D.W. Hess, and V. Breedveld, Patterning of Superhydrophobic Paper to Control the Mobility of Micro-Liter Drops for Two-Dimensional Lab-on-Paper Applications. Lab on a Chip, DOI:10.1039/B909868B
117
advantages of these substrates over silicon- or glass-based devices: transparency,
flexibility, biochemical compatibility and permeability [1-4]. However, even PDMS-
based devices require the use of clean room facilities for the fabrication and incorporation
of complex components such as valves, pumps and mixers [1, 5-7]. Fluid actuation in
these devices relies mostly on electrokinetic or pneumatic actuation, which requires an
external power source (high voltage power supply, batteries, or compressed gas/vacuum
sources [8, 9]). Overall, in spite of breakthrough advances in LOC concepts, most of the
devices remain unsuitable for low-tech applications like biomedical diagnostics in
developing countries due to the lack of simplicity and affordability.
Paper-based LOC devices (also referred to as lab-on-paper (LOP) [10]) have emerged as
a promising alternative technology. For fluid actuation on these devices one can rely on
capillary forces inside the porous paper and thus avoid external power sources. In a
recent report on the top ten biotechnologies for improving health in developing countries
“modified molecular technologies for affordable, simple diagnosis of infectious diseases”
was ranked as the number one priority [8, 11]. Another report on the grand challenges for
global health ranked the development of technologies to “measure disease and health
status accurately and economically in poor countries” first among the top 14 priorities [8,
12]. Due to their affordability and potentially simple fabrication technology, LOP
devices may offer improved global availability of medical technology.
In its simplest form, the concept of LOP dates back to the 1950s, when paper-based strips
[13-18] were first used for biomedical diagnostics. However, applications of these LOPs
118
were limited by the fact that they could not perform multiplex analysis: i.e., it was
impossible to perform multiple biochemical analyses on a single sample with the same
strip. This limitation inspired the fabrication of multiple channels with barriers within a
paper substrate, analogous to a microfluidic device, to enable multiplex analysis. Creation
of hydrophilic channels with hydrophobic barrier layers for biochemical assay devices
was originally proposed in 1995 and 2003 [19, 20]. More recently, this concept has been
adapted by using modern photolithography techniques to create hydrophobic photoresist
barriers [21-23]. This work has since been expanded to three-dimensional LOP devices
by layering sheets of patterned paper with perforated barrier tape to guide the exchange
of liquids between paper layers [24]. A disadvantage of these LOPs was the limited
flexibility due to the use of rigid photoresists (SU-8 or PMMA), which has been
addressed by printing PDMS as a barrier polymer using a desktop plotter, thus creating
flexible LOP devices [25]. However, the low surface tension of uncrosslinked PDMS
limits the spatial resolution of the patterns, resulting in broad and irregularly shaped
barrier wall structures [25, 26]. A new two-step method for patterning straight barrier
walls was proposed: hydrophobize the entire paper substrate with Alkyl Ketene Dimer
(AKD) and then create hydrophilic channels via a plasma patterning process [26].
Although both PDMS- and AKD-based LOPs are flexible, the channels are relatively
wide (1-2 mm) because of the patterning limitations [25, 26]. Controlled fabrication of
channels with widths of several hundred micrometers has been achieved by printing
hydrophilic patterns via inkjet printing [27]. The use of widely available technology to
design LOP devices, for example a standard desktop printer, clearly offers substantially
enhanced versatility, since it enables end-users to “program” LOP devices according to
119
specific needs. A recent report has noted that programmable LOCs would be the next
critical innovation in this technology [28]. Most current LOP technologies limit the
ability of non-expert users to program their own devices because of the complex
chemicals, methods, and/or equipment needed for device fabrication. Furthermore, all the
LOP concepts discussed above depend on absorption of test fluids into the hydrophilic
areas of porous paper and use capillary forces for fluid actuation. As a result, the products
of reactions occurring inside a LOP cannot easily be extracted for further biochemical
analysis. This is particularly important because the analysis in LOPs is currently semi-
quantitative at best; the accuracy and sensitivity cannot compete with traditional
analytical equipment [10].
One option to overcome this issue is to prevent absorption of the liquids into the paper
matrix. By restricting droplets to the surface of the substrate, the samples are accessible
for post-processing and quantitative analysis in a centralized testing center [8], while
simple qualitative biochemical characterizations can still be performed at the point-of-
care (POC). In order to achieve this, droplets must be manipulated on a two dimensional
substrate that enables basic unit operations: storage, guided transport, mixing and
sampling. 2D microfluidic lab-on-chip devices have been previously obtained via
electrowetting [29, 30] and optoelectrowetting (OEW) [31-33], but these approaches
require external power sources for operation and complicated fabrication methods.
Ideally, a 2D LOP should be inexpensive, enable design flexibility and operate without
an external power source.
120

An approach to develop a 2D LOP device capable of storage, transfer, mixing and
sampling of liquid drops by decorating superhydrophobic paper substrates with high
surface energy ink patterns (lines and dots) is discussed in this chapter. Surface energy
and gravitational forces are used to manipulate and transfer drops, thus eliminating the
need for an external power source. The key feature of this device is that patterning
changes the local contact angle (CA) hysteresis, resulting in sticky ink spots on non-
sticky superhydrophobic paper; the substrates are therefore referred to as Hysteresis
Enabled Lab-on-Paper (HELP) substrates. This study demonstrates that patterns to
manipulate microliter drops can be designed using standard word processing software
and a commercially available desktop printing process that deposits waxy inks. The
simplicity of the soft- and hard-ware ensures that end-users can readily develop their own
patterns to achieve desired functionality of the LOP devices [28]. Finally, the HELP
substrates can serve as an inexpensive storage medium for test fluids, reagents and/ or
reaction products in the form of arrays of drops, which can then be transported to the
centralized testing centers for detailed quantitative analysis after initial semi-quantitative
on-chip analysis.
This chapter demonstrates the fundamental principles behind our LOP concept by
measuring and modeling the adhesion of water drops on patterned substrates, and applies
this basic knowledge to the design of LOP building blocks with advanced functionality,
such as droplet storage, transfer, merger, mixing and sampling.
121
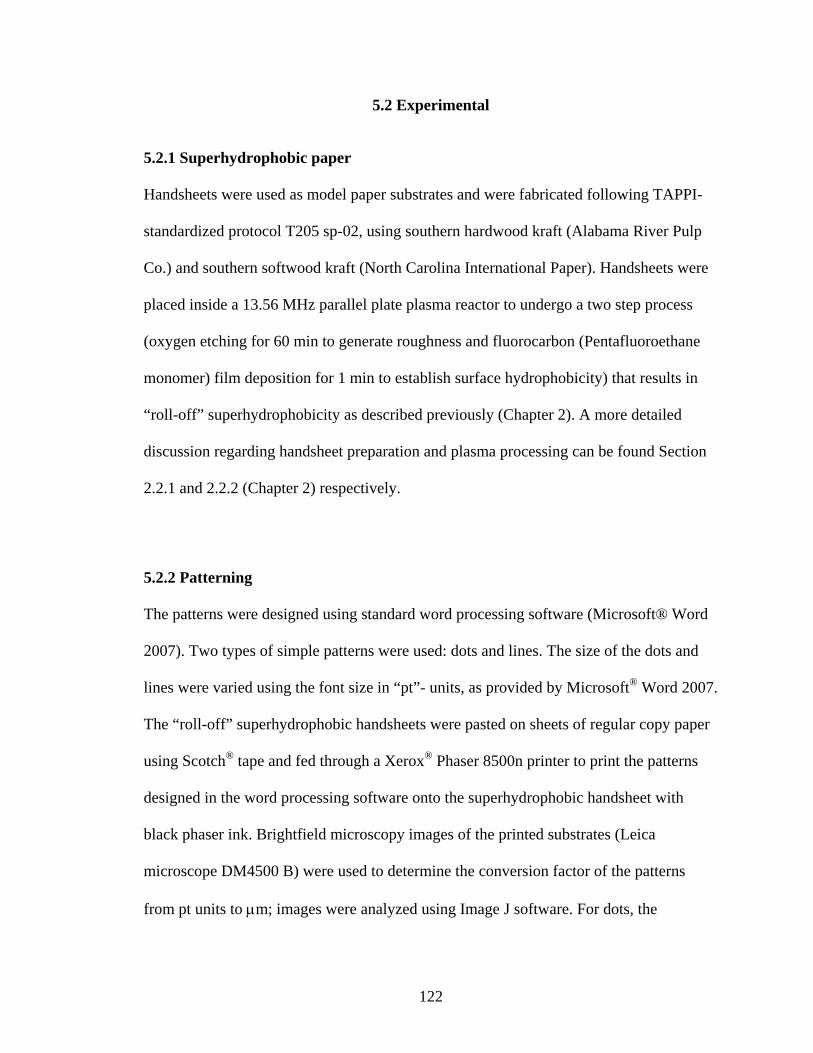
5.2 Experimental
5.2.1 Superhydrophobic paper
Handsheets were used as model paper substrates and were fabricated following TAPPI-
standardized protocol T205 sp-02, using southern hardwood kraft (Alabama River Pulp
Co.) and southern softwood kraft (North Carolina International Paper). Handsheets were
placed inside a 13.56 MHz parallel plate plasma reactor to undergo a two step process
(oxygen etching for 60 min to generate roughness and fluorocarbon (Pentafluoroethane
monomer) film deposition for 1 min to establish surface hydrophobicity) that results in
“roll-off” superhydrophobicity as described previously (Chapter 2). A more detailed
discussion regarding handsheet preparation and plasma processing can be found Section
2.2.1 and 2.2.2 (Chapter 2) respectively.
5.2.2 Patterning
The patterns were designed using standard word processing software (Microsoft® Word
2007). Two types of simple patterns were used: dots and lines. The size of the dots and
lines were varied using the font size in “pt”- units, as provided by Microsoft® Word 2007.
The “roll-off” superhydrophobic handsheets were pasted on sheets of regular copy paper
using Scotch® tape and fed through a Xerox® Phaser 8500n printer to print the patterns
designed in the word processing software onto the superhydrophobic handsheet with
black phaser ink. Brightfield microscopy images of the printed substrates (Leica
microscope DM4500 B) were used to determine the conversion factor of the patterns
from pt units to μm; images were analyzed using Image J software. For dots, the
122
conversion factor for the dot diameter was found to be 118.5 μm/pt; the conversion factor
for line width was 404.9 μm/pt.
5.2.3 Water contact angle measurements
Water contact angle measurements were obtained with a Rame-Hart contact angle
goniometer (model 100, Netcong, NJ). Advancing and receding contact angles were
measured by placing a drop of known volume on the substrate and dragging the paper
substrate left to right with respect to the drop; a more detailed description of this method
can be found in section 2.2.7 (Chapter 2). Values of the advancing and receding CAs of
non-patterned SH paper (after passage through the printer) are θASH=165.1±2° and
θRSH=135.3±2.9°; for a substrate with full coverage of the ink film, θAI=113.8±2.7° and
θRI =84.7±2°.
5.2.4 Sliding drop experiments
The substrates were mounted on a flat surface attached to a rotating optical stage. The
plate was tilted gradually until the drop rolled-off. The angle (in degrees) at which the
drop started to slide was defined as the critical sliding angle.
5.2.5 Drop transfer experiments
The drop was placed on a horizontally placed paper substrate which had the “from”
pattern (dot). Another substrate having the “to” pattern (line or dot) was then inverted and
manually aligned to the drop, to obtain a configuration in which the drop touched the ink
123
patterns on both substrates, which were placed parallel to each other. Then the “to”
substrate was carefully lifted in a direction perpendicular to the “from” substrate and the
resulting drop dynamics was recorded.
5.3 Results and Discussion
5.3.1 Adhesion on patterned paper
5.3.1.1 Sliding drops on sticky islands
In the middle of the 20th century, four research groups independently reported that for a
drop sliding on a homogeneous surface, the ratio of the force exerted on the drop (F) to
the width of the drop perpendicular to the direction of sliding (Wdrop) is constant [34-37]:
1sin
drop drop
F Vg KW W
ρ α= = (5.1)
where ρ is the density of the liquid drop, V is the volume of the drop, g is the acceleration
due to gravity, and α is the critical sliding angle. The constant K1 was then related to the
work functions associated with wetting (γLV (1+ cos θA)) and dewetting (γLV (1+ cos θR))
of the substrate by the drop [35, 36]:
( ARLVdropW
Vg θθγ )αρ coscossin−= (5.2)
124
where γLV is the surface tension of the liquid, and θA and θR are the advancing and
receding contact angles of the drop on the surface. This semi-empirical equation,
hypothesized by Bikerman [34] in 1950 and derived by Kawasaki [36] in 1960, is
popularly known as the Furmidge equation [35], in reference to the researcher who
reiterated it in 1962. This equation is based on a force balance calculation on the receding
and advancing edges of a 2D drop sliding on an inclined surface. For a 3D drop, the
contact angle varies continuously along the three-phase contact line, which complicates
mathematical analysis. Currently, some disagreement exists in literature as to whether the
local contact angles at the advancing and receding edge of the sliding drop are equal to
the experimentally measured maximum (θA) and minimum (θR) contact angles [38]. In
spite of this ambiguity, it has been demonstrated that the Furmidge equation is a good
empirical approximation for 3D sliding drops [39] and the Furmidge equation is used by
most researchers [38]. After rearranging Eqn. 2 we obtain:
( )gW
V ARLV
drop ρθθγα coscossin −
= (5.3)
For a specific liquid-surface combination, the right hand side of Equation 5.3 is constant.
On homogeneous substrates, the volume (V) and width (Wdrop) of a drop are typically
connected via simple geometrical relations, so that each drop size corresponds to a unique
sliding angle α. This work aims at disrupting this one-to-one correspondence with the
objective to independently control the critical sliding angle (α) and the drop volume (V).
Eqn. 3 suggests one possible route to achieve this: by making the drop width (Wdrop)
125
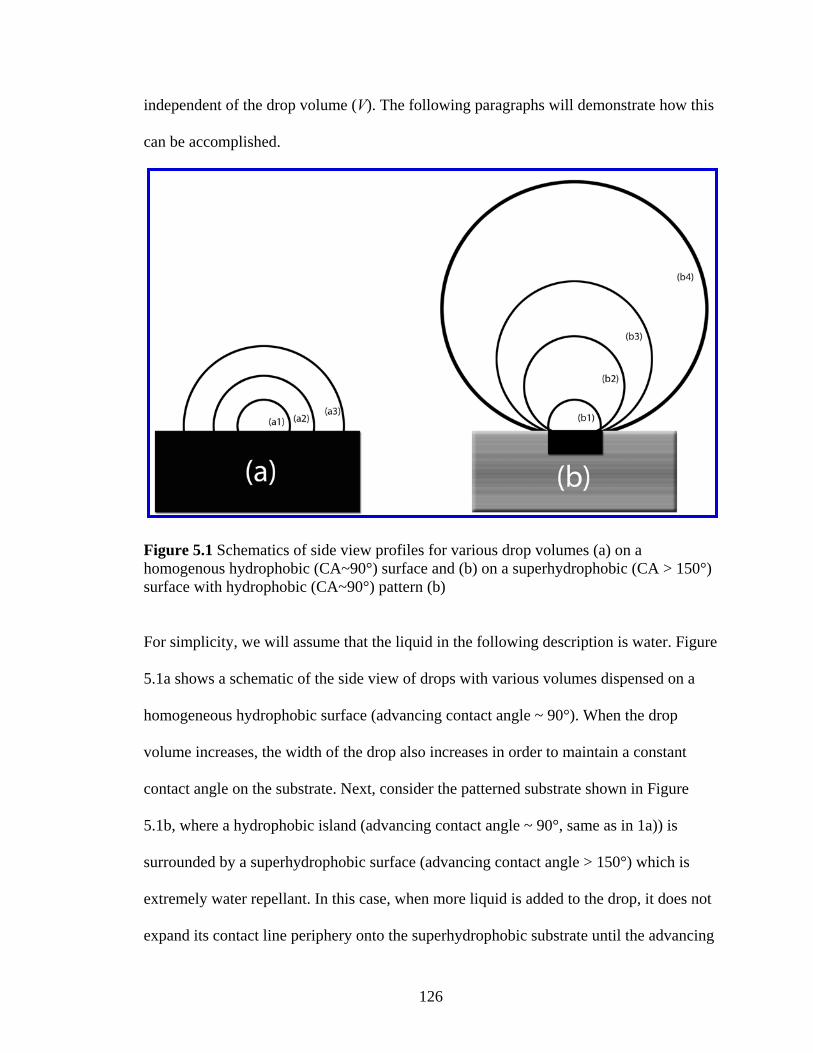
independent of the drop volume (V). The following paragraphs will demonstrate how this
can be accomplished.
Figure 5.1 Schematics of side view profiles for various drop volumes (a) on a homogenous hydrophobic (CA~90°) surface and (b) on a superhydrophobic (CA > 150°) surface with hydrophobic (CA~90°) pattern (b)
For simplicity, we will assume that the liquid in the following description is water. Figure
5.1a shows a schematic of the side view of drops with various volumes dispensed on a
homogeneous hydrophobic surface (advancing contact angle ~ 90°). When the drop
volume increases, the width of the drop also increases in order to maintain a constant
contact angle on the substrate. Next, consider the patterned substrate shown in Figure
5.1b, where a hydrophobic island (advancing contact angle ~ 90°, same as in 1a)) is
surrounded by a superhydrophobic surface (advancing contact angle > 150°) which is
extremely water repellant. In this case, when more liquid is added to the drop, it does not
expand its contact line periphery onto the superhydrophobic substrate until the advancing
126
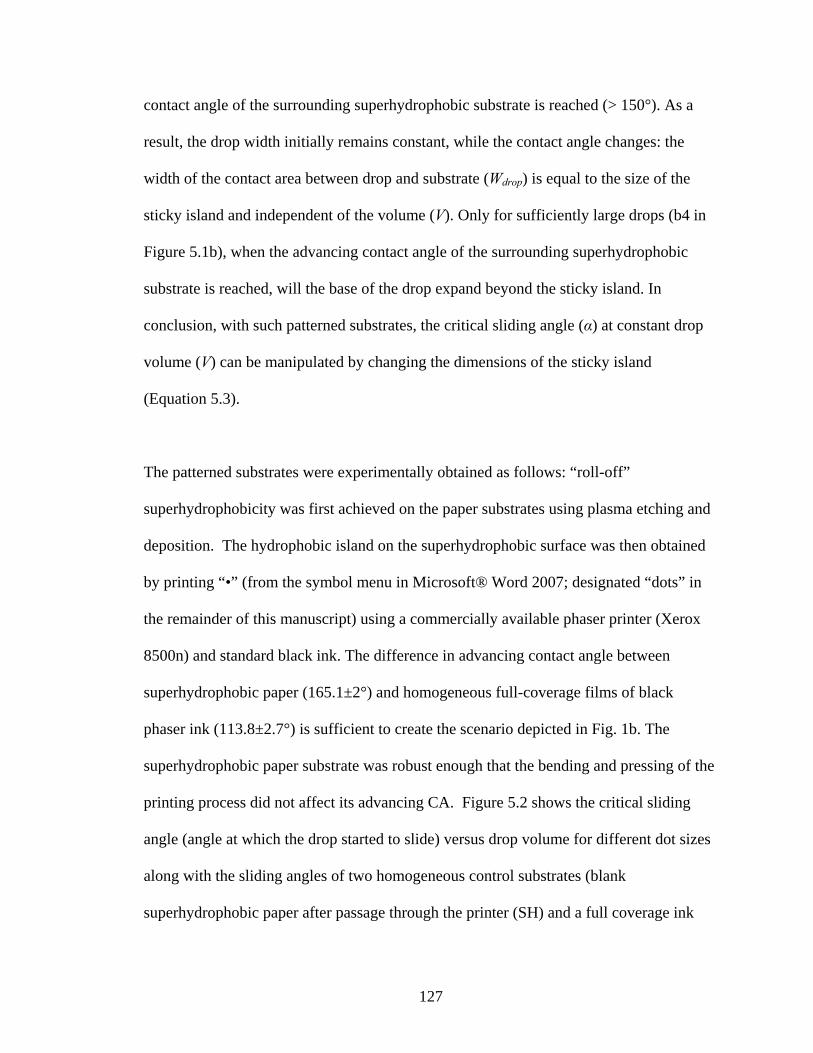
contact angle of the surrounding superhydrophobic substrate is reached (> 150°). As a
result, the drop width initially remains constant, while the contact angle changes: the
width of the contact area between drop and substrate (Wdrop) is equal to the size of the
sticky island and independent of the volume (V). Only for sufficiently large drops (b4 in
Figure 5.1b), when the advancing contact angle of the surrounding superhydrophobic
substrate is reached, will the base of the drop expand beyond the sticky island. In
conclusion, with such patterned substrates, the critical sliding angle (α) at constant drop
volume (V) can be manipulated by changing the dimensions of the sticky island
(Equation 5.3).
The patterned substrates were experimentally obtained as follows: “roll-off”
superhydrophobicity was first achieved on the paper substrates using plasma etching and
deposition. The hydrophobic island on the superhydrophobic surface was then obtained
by printing “•” (from the symbol menu in Microsoft® Word 2007; designated “dots” in
the remainder of this manuscript) using a commercially available phaser printer (Xerox
8500n) and standard black ink. The difference in advancing contact angle between
superhydrophobic paper (165.1±2°) and homogeneous full-coverage films of black
phaser ink (113.8±2.7°) is sufficient to create the scenario depicted in Fig. 1b. The
superhydrophobic paper substrate was robust enough that the bending and pressing of the
printing process did not affect its advancing CA. Figure 5.2 shows the critical sliding
angle (angle at which the drop started to slide) versus drop volume for different dot sizes
along with the sliding angles of two homogeneous control substrates (blank
superhydrophobic paper after passage through the printer (SH) and a full coverage ink
127
film printed on the superhydrophobic paper surface (I)). Data points on the line that
marks the critical slide angle of 90° represent the largest drop that did not slide from
vertical substrates. Drop behavior on the control substrates (SH and I) was in good
agreement with predictions from a modified Furmidge equation, as will be discussed later
in this section. As expected, for each substrate, the critical slide angle decreases
monotonically with increasing drop volume (within experimental error). When
comparing the results for patterned substrates with the homogeneous control substrates, it
is evident from Figure 5.2 that at a constant drop volume (V), the critical slide angle (α)
increases with increasing dot width. Another interesting observation is that patterned
surfaces with large dot sizes (e.g., 2.37 and 4.22 mm) require larger slide angles (i.e.,
surfaces are more sticky) than a homogenous ink substrate.
128
0
10
20
30
40
50
60
70
80
90
0 10 20 30 40 50 60
0.48 mm
0.83 mm
1.45 mm
1.84 mm
2.37 mm
4.22 mm
SH
I
Crit
ical
Slid
e an
gle,
deg
rees
Volume, µL Figure 5.2 Critical slide angle versus drop volumes on patterned substrates (for various dot sizes) and control substrates (SH and I); curves are to guide the eye
Since a continuous ink film essentially is a dot with infinite width, one might have
expected that α for the ink film would be higher than for all printed dots. However, this
apparent anomaly can be explained using the Furmidge equation. For a drop to slide on a
surface, it must deform so that the advancing and receding edge of the drop both reach
the experimentally measured advancing and receding CA, respectively, for that substrate.
If the drop slides from a printed dot, the advancing CA is set by the superhydrophobic
paper, while the receding CA is that of the ink film. In contrast, for homogeneous
substrates both advancing and receding contact angles are for the same surface material.
For experiments with the smaller dots (< 2.37 mm) the initial CA of the drop after
129
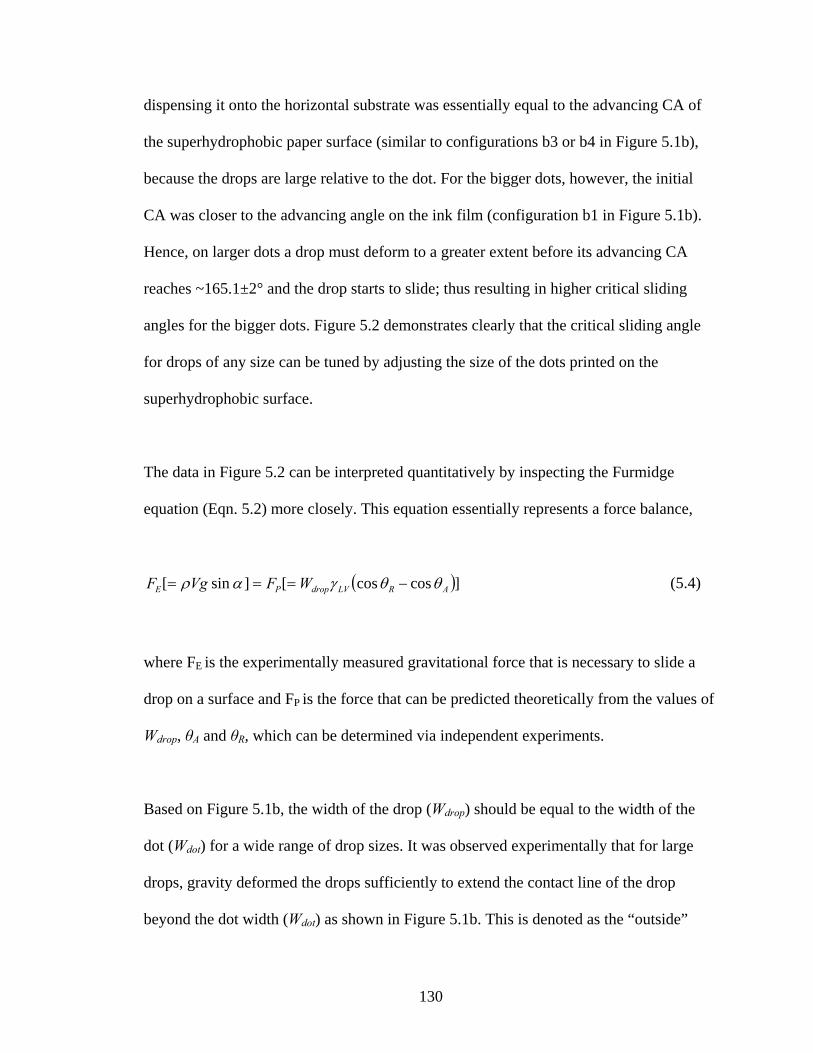
dispensing it onto the horizontal substrate was essentially equal to the advancing CA of
the superhydrophobic paper surface (similar to configurations b3 or b4 in Figure 5.1b),
because the drops are large relative to the dot. For the bigger dots, however, the initial
CA was closer to the advancing angle on the ink film (configuration b1 in Figure 5.1b).
Hence, on larger dots a drop must deform to a greater extent before its advancing CA
reaches ~165.1±2° and the drop starts to slide; thus resulting in higher critical sliding
angles for the bigger dots. Figure 5.2 demonstrates clearly that the critical sliding angle
for drops of any size can be tuned by adjusting the size of the dots printed on the
superhydrophobic surface.
The data in Figure 5.2 can be interpreted quantitatively by inspecting the Furmidge
equation (Eqn. 5.2) more closely. This equation essentially represents a force balance,
( )]coscos[]sin[ ARLVdropPE WFVgF θθγαρ −=== (5.4)
where FE is the experimentally measured gravitational force that is necessary to slide a
drop on a surface and FP is the force that can be predicted theoretically from the values of
Wdrop, θA and θR, which can be determined via independent experiments.
Based on Figure 5.1b, the width of the drop (Wdrop) should be equal to the width of the
dot (Wdot) for a wide range of drop sizes. It was observed experimentally that for large
drops, gravity deformed the drops sufficiently to extend the contact line of the drop
beyond the dot width (Wdot) as shown in Figure 5.1b. This is denoted as the “outside”
130
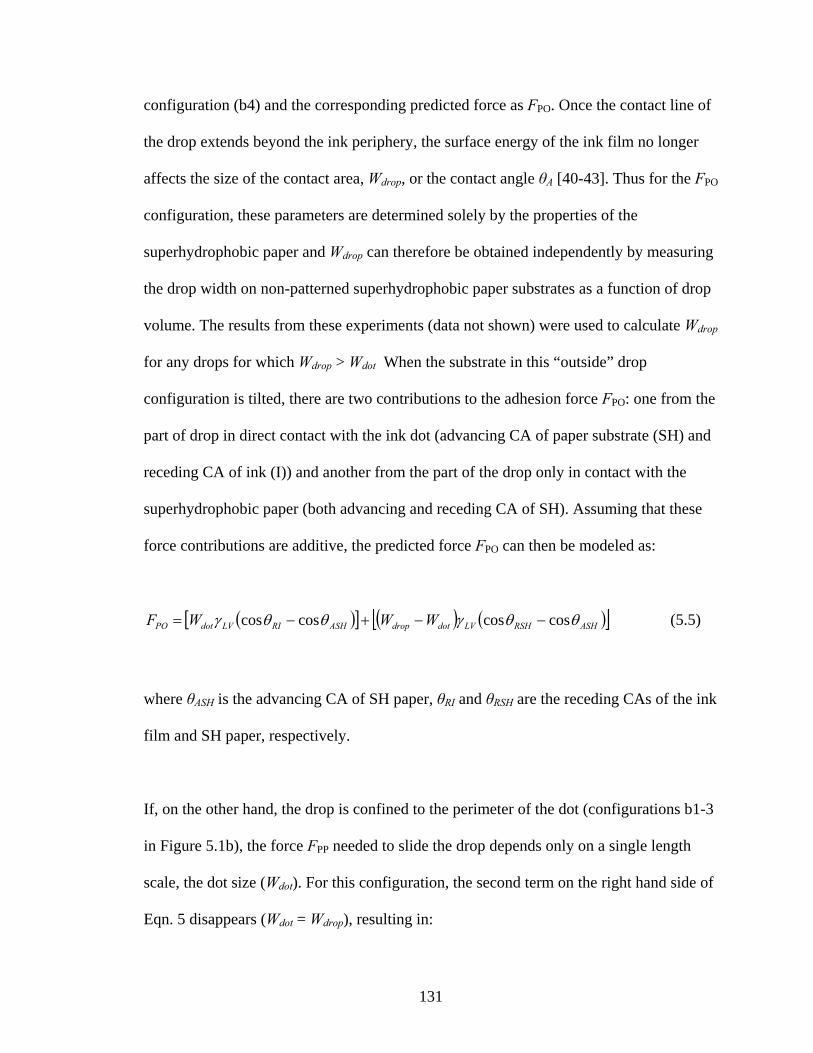
configuration (b4) and the corresponding predicted force as FPO. Once the contact line of
the drop extends beyond the ink periphery, the surface energy of the ink film no longer
affects the size of the contact area, Wdrop, or the contact angle θA [40-43]. Thus for the FPO
configuration, these parameters are determined solely by the properties of the
superhydrophobic paper and Wdrop can therefore be obtained independently by measuring
the drop width on non-patterned superhydrophobic paper substrates as a function of drop
volume. The results from these experiments (data not shown) were used to calculate Wdrop
for any drops for which Wdrop > Wdot When the substrate in this “outside” drop
configuration is tilted, there are two contributions to the adhesion force FPO: one from the
part of drop in direct contact with the ink dot (advancing CA of paper substrate (SH) and
receding CA of ink (I)) and another from the part of the drop only in contact with the
superhydrophobic paper (both advancing and receding CA of SH). Assuming that these
force contributions are additive, the predicted force FPO can then be modeled as:
( )[ ] ( ) ( )[ ]ASHRSHLVdotdropASHRILVdotPO WWWF θθγθθγ coscoscoscos −−+−= (5.5)
where θASH is the advancing CA of SH paper, θRI and θRSH are the receding CAs of the ink
film and SH paper, respectively.
If, on the other hand, the drop is confined to the perimeter of the dot (configurations b1-3
in Figure 5.1b), the force FPP needed to slide the drop depends only on a single length
scale, the dot size (Wdot). For this configuration, the second term on the right hand side of
Eqn. 5 disappears (Wdot = Wdrop), resulting in:
131
([ ASHRILVdotPP WF )]θθγ coscos −= (5.6)
The scenario for which Wdrop< Wdot was not encountered with the dot sizes and drop
volumes in this study. For homogeneous control substrates (I and SH) there is no need to
modify the original Furmidge equation (Eqn. 5.3), provided that the appropriate CA
values are used to calculate the adhesion force (FI for ink film and FSH for SH paper).
132
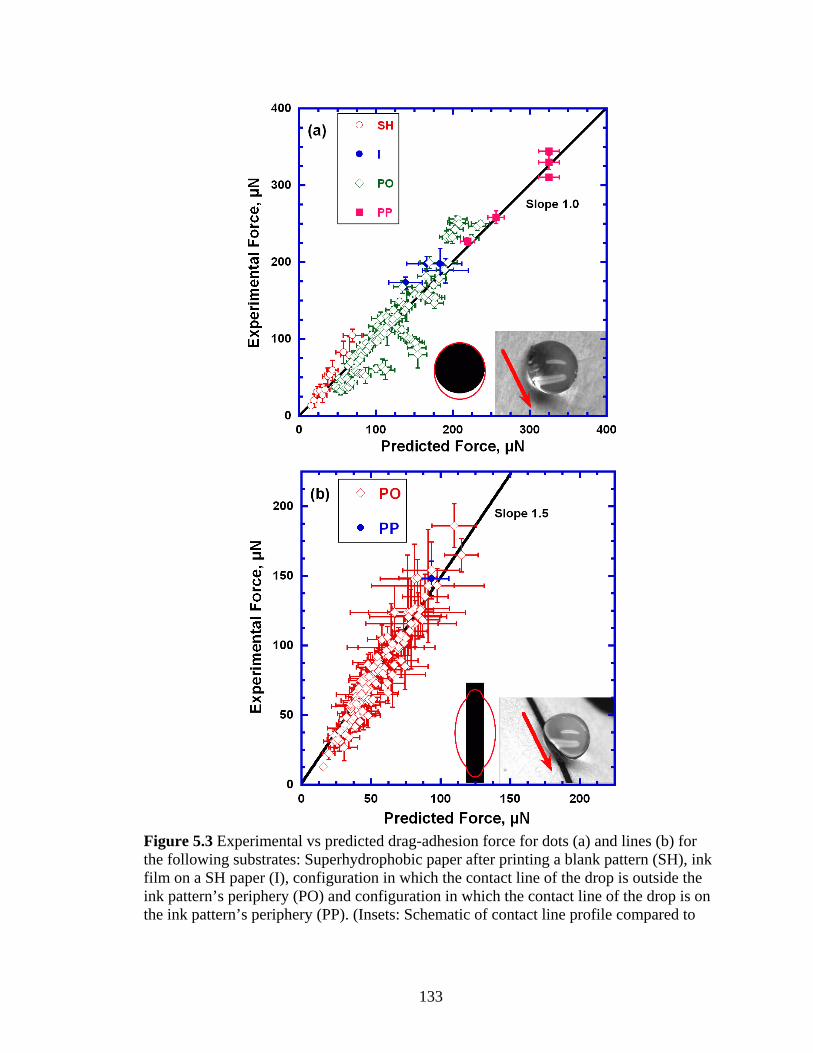
Figure 5.3 Experimental vs predicted drag-adhesion force for dots (a) and lines (b) for the following substrates: Superhydrophobic paper after printing a blank pattern (SH), ink film on a SH paper (I), configuration in which the contact line of the drop is outside the ink pattern’s periphery (PO) and configuration in which the contact line of the drop is on the ink pattern’s periphery (PP). (Insets: Schematic of contact line profile compared to
133
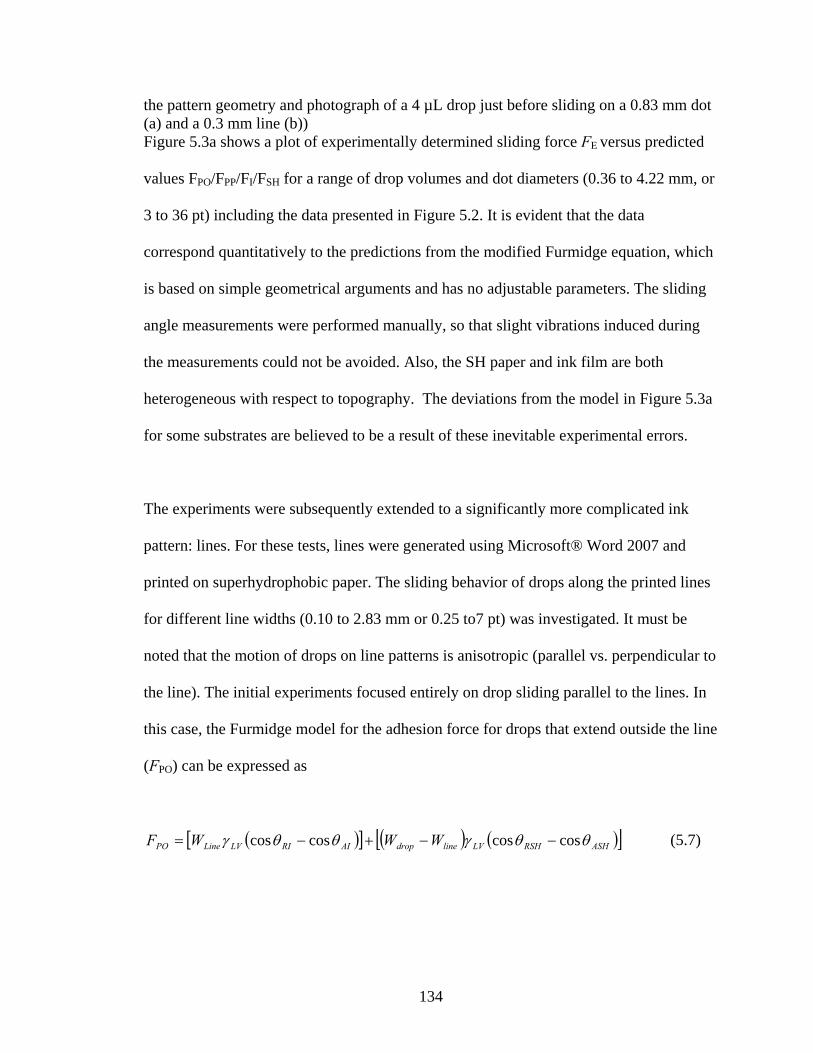
the pattern geometry and photograph of a 4 µL drop just before sliding on a 0.83 mm dot (a) and a 0.3 mm line (b)) Figure 5.3a shows a plot of experimentally determined sliding force FE versus predicted
values FPO/FPP/FI/FSH for a range of drop volumes and dot diameters (0.36 to 4.22 mm, or
3 to 36 pt) including the data presented in Figure 5.2. It is evident that the data
correspond quantitatively to the predictions from the modified Furmidge equation, which
is based on simple geometrical arguments and has no adjustable parameters. The sliding
angle measurements were performed manually, so that slight vibrations induced during
the measurements could not be avoided. Also, the SH paper and ink film are both
heterogeneous with respect to topography. The deviations from the model in Figure 5.3a
for some substrates are believed to be a result of these inevitable experimental errors.
The experiments were subsequently extended to a significantly more complicated ink
pattern: lines. For these tests, lines were generated using Microsoft® Word 2007 and
printed on superhydrophobic paper. The sliding behavior of drops along the printed lines
for different line widths (0.10 to 2.83 mm or 0.25 to7 pt) was investigated. It must be
noted that the motion of drops on line patterns is anisotropic (parallel vs. perpendicular to
the line). The initial experiments focused entirely on drop sliding parallel to the lines. In
this case, the Furmidge model for the adhesion force for drops that extend outside the line
(FPO) can be expressed as
( )[ ] ( ) ( )[ ]ASHRSHLVlinedropAIRILVLinePO WWWF θθγθθγ coscoscoscos −−+−= (5.7)
134
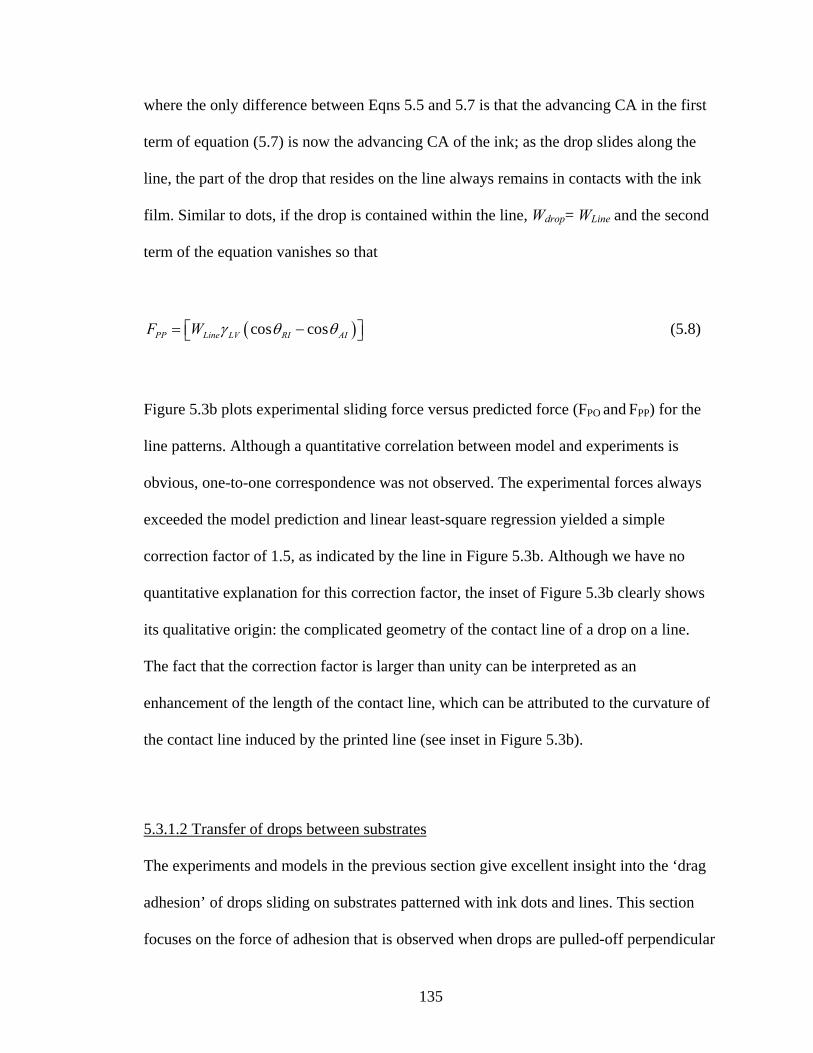
where the only difference between Eqns 5.5 and 5.7 is that the advancing CA in the first
term of equation (5.7) is now the advancing CA of the ink; as the drop slides along the
line, the part of the drop that resides on the line always remains in contacts with the ink
film. Similar to dots, if the drop is contained within the line, Wdrop= WLine and the second
term of the equation vanishes so that
( )cos cosPP Line LV RI AIF W γ θ θ= −⎡⎣ ⎤⎦ (5.8)
Figure 5.3b plots experimental sliding force versus predicted force (FPO and FPP) for the
line patterns. Although a quantitative correlation between model and experiments is
obvious, one-to-one correspondence was not observed. The experimental forces always
exceeded the model prediction and linear least-square regression yielded a simple
correction factor of 1.5, as indicated by the line in Figure 5.3b. Although we have no
quantitative explanation for this correction factor, the inset of Figure 5.3b clearly shows
its qualitative origin: the complicated geometry of the contact line of a drop on a line.
The fact that the correction factor is larger than unity can be interpreted as an
enhancement of the length of the contact line, which can be attributed to the curvature of
the contact line induced by the printed line (see inset in Figure 5.3b).
5.3.1.2 Transfer of drops between substrates
The experiments and models in the previous section give excellent insight into the ‘drag
adhesion’ of drops sliding on substrates patterned with ink dots and lines. This section
focuses on the force of adhesion that is observed when drops are pulled-off perpendicular
135
to the patterned substrates. This kind of adhesion is referred to as ‘extensional adhesion’.
The objective of these experiments was to capitalize on differences in extensional
adhesion between different patterned substrates to permit transfer of drops between
substrates.
In 1896, Dupré rearranged Young’s classical contact angle equation to describe the work
of adhesion for a drop to detach from a surface [44, 45]:
(1 cos )γ θ= +adh LVW (5.9)
where θ is the equilibrium CA of the liquid drop on the surface. At that time, the
scientific community did not define maximum (advancing) and minimum (receding) CAs
[46]. When a drop detaches from a surface in a direction perpendicular to the plane of the
surface, the contact line of the drop experiences a receding CA value rather than the
equilibrium CA [47]. As a result, the above equation must be adapted to
( )1 cosγ θ= +adh LV RW (5.10)
This work of adhesion can be converted to the force of adhesion by multiplying the right
hand side of the equation by a characteristic length scale, Lchar:
( )1 cosγ θ= +char LV RF L (5.11)
136
It is reasonable to assume that this length scale is proportional to the characteristic size of
the ink pattern (dot diameter or line width). Hence, Equation 5.11 becomes:
( )( ) 1 cosLV RIF Wβ γ θ= + (5.12)
Where β is the proportionally constant and W is the width of the ink pattern. Therefore, it
is expected that a drop positioned on a small ink island will experience a smaller force of
adhesion than the same drop sitting on a relatively large ink island. This fact inspired us
to determine whether this difference in adhesion force can be used to overcome gravity
and transfer a drop from a substrate with a smaller ink island to a substrate with a larger
ink island. The resulting force balance between gravity on the drop and adhesive forces
of the two substrates is:
1 1 2 2(1 cos ) (1 cos )LV RI LV RVg W W Iρ β γ θ β γ θ= + − + (5.13)
where the subscripts 1 and 2 denotes the large and small ink islands, respectively. By
rearranging the above equation, one can predict the maximum volume of the drop that
can be transferred between two substrates:
1 1 2 2(1 cos ) (1 cos )LV RI LV RIpredicted
W WVg
β γ θ β γρ
+ − +=
θ (5.14)
137
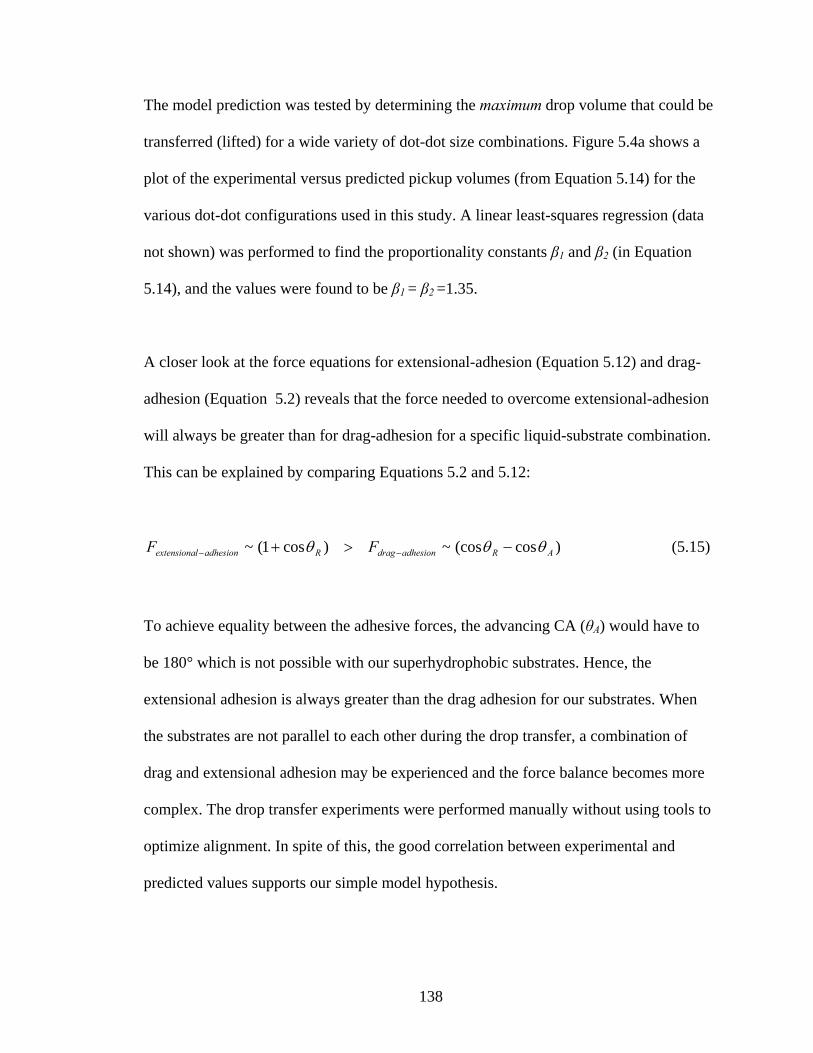
The model prediction was tested by determining the maximum drop volume that could be
transferred (lifted) for a wide variety of dot-dot size combinations. Figure 5.4a shows a
plot of the experimental versus predicted pickup volumes (from Equation 5.14) for the
various dot-dot configurations used in this study. A linear least-squares regression (data
not shown) was performed to find the proportionality constants β1 and β2 (in Equation
5.14), and the values were found to be β1 = β2 =1.35.
A closer look at the force equations for extensional-adhesion (Equation 5.12) and drag-
adhesion (Equation 5.2) reveals that the force needed to overcome extensional-adhesion
will always be greater than for drag-adhesion for a specific liquid-substrate combination.
This can be explained by comparing Equations 5.2 and 5.12:
)cos(cos~)cos1(~ ARadhesiondragRadhesionlextensiona FF θθθ −>+ −− (5.15)
To achieve equality between the adhesive forces, the advancing CA (θA) would have to
be 180° which is not possible with our superhydrophobic substrates. Hence, the
extensional adhesion is always greater than the drag adhesion for our substrates. When
the substrates are not parallel to each other during the drop transfer, a combination of
drag and extensional adhesion may be experienced and the force balance becomes more
complex. The drop transfer experiments were performed manually without using tools to
optimize alignment. In spite of this, the good correlation between experimental and
predicted values supports our simple model hypothesis.
138
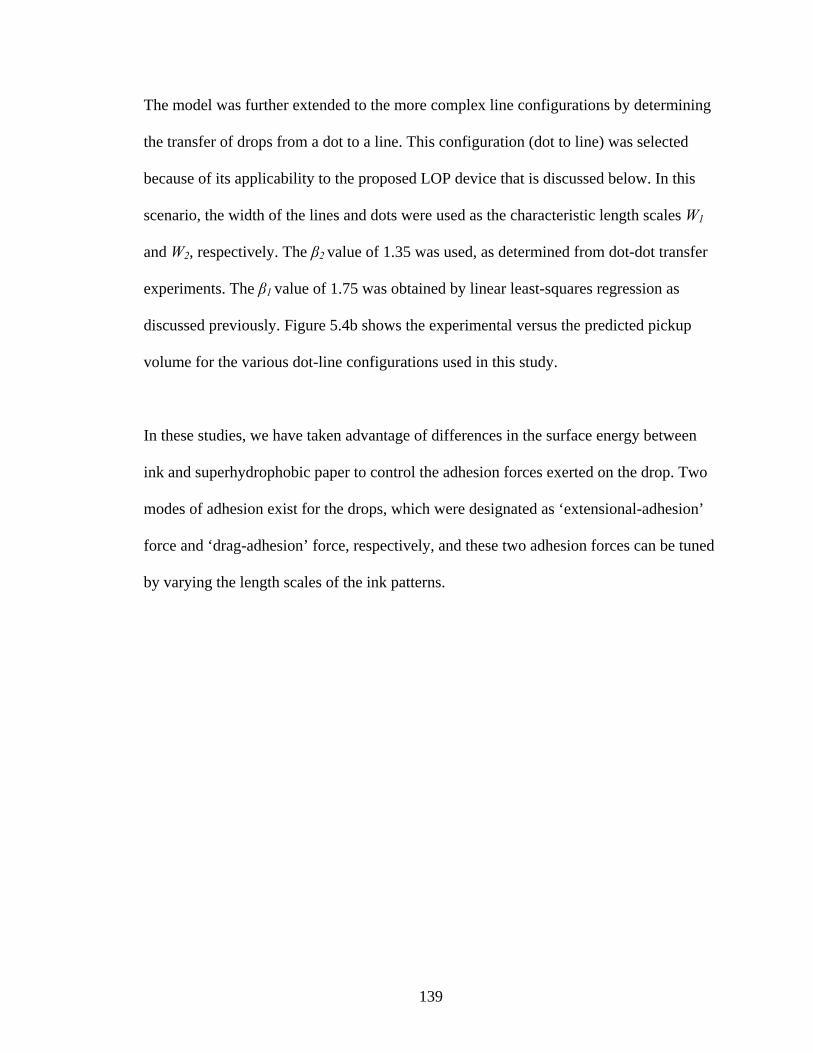
The model was further extended to the more complex line configurations by determining
the transfer of drops from a dot to a line. This configuration (dot to line) was selected
because of its applicability to the proposed LOP device that is discussed below. In this
scenario, the width of the lines and dots were used as the characteristic length scales W1
and W2, respectively. The β2 value of 1.35 was used, as determined from dot-dot transfer
experiments. The β1 value of 1.75 was obtained by linear least-squares regression as
discussed previously. Figure 5.4b shows the experimental versus the predicted pickup
volume for the various dot-line configurations used in this study.
In these studies, we have taken advantage of differences in the surface energy between
ink and superhydrophobic paper to control the adhesion forces exerted on the drop. Two
modes of adhesion exist for the drops, which were designated as ‘extensional-adhesion’
force and ‘drag-adhesion’ force, respectively, and these two adhesion forces can be tuned
by varying the length scales of the ink patterns.
139
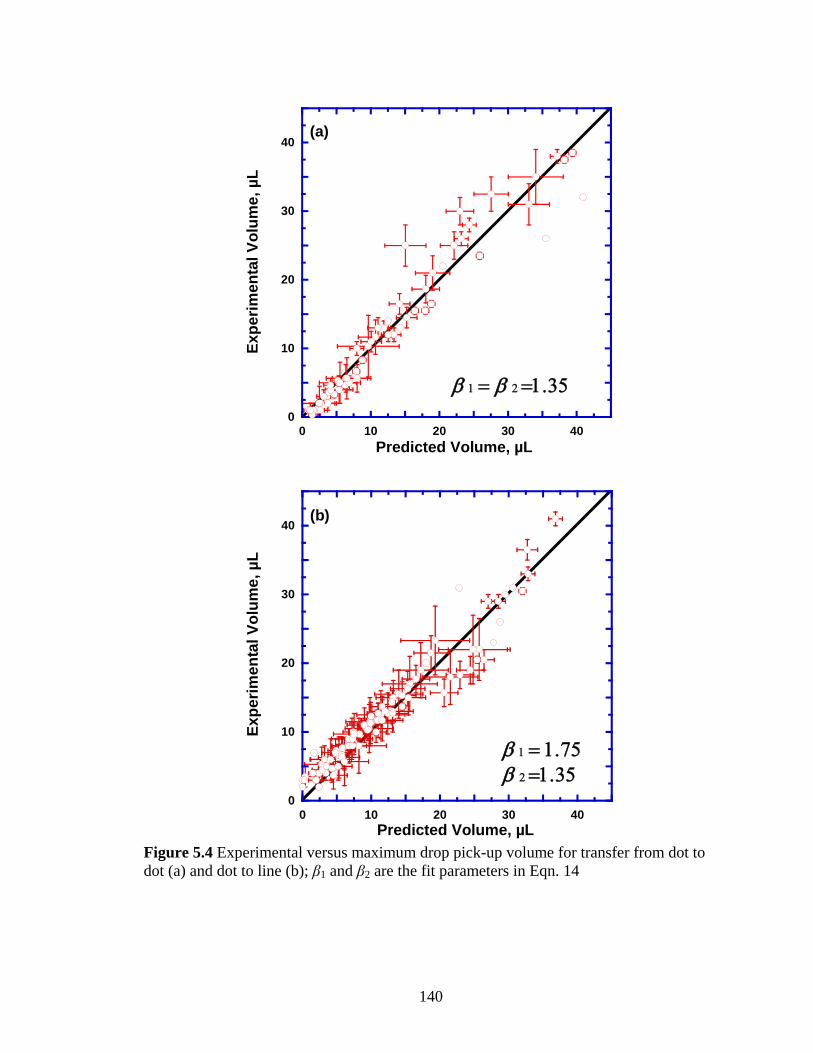
0
10
20
30
40
0 10 20 30 40
Exp
erim
enta
l Vol
ume,
µL
Predicted Volume, µL
(a)
β 1 = β 2 =1.35
0
10
20
30
40
0 10 20 30 40
Exp
erim
enta
l Vol
ume,
µL
Predicted Volume, µL
(b)
β 1 = 1.75β 2 =1.35
Figure 5.4 Experimental versus maximum drop pick-up volume for transfer from dot to dot (a) and dot to line (b); β1 and β2 are the fit parameters in Eqn. 14
140
5.3.2 Functional unit operations with patterned substrates
In the previous section, it was shown that patterned superhydrophobic paper substrates
can be used to control the mobility of liquid drops on these substrates, both parallel and
perpendicular to the substrate. The underlying mechanism is that the ink patterns locally
increase the contact angle hysteresis on a low hysteresis superhydrophobic surface.
Therefore these patterned substrates are referred to as Hysteresis Enabled Lab-on-Paper
(HELP) substrates. In this section, we will discuss how the fundamental wetting
properties of these substrates can be used to engineer unit operations that can then be
combined in lab-on-paper devices. The following paragraphs discuss the implementation
of four basic functionalities that are critical for any device based on droplet manipulation:
storage, transfer, mixing and sampling. The complete list of possible functionalities is
certainly longer, especially when more complex ink patterns and modifications in ink
chemistry are considered.
141
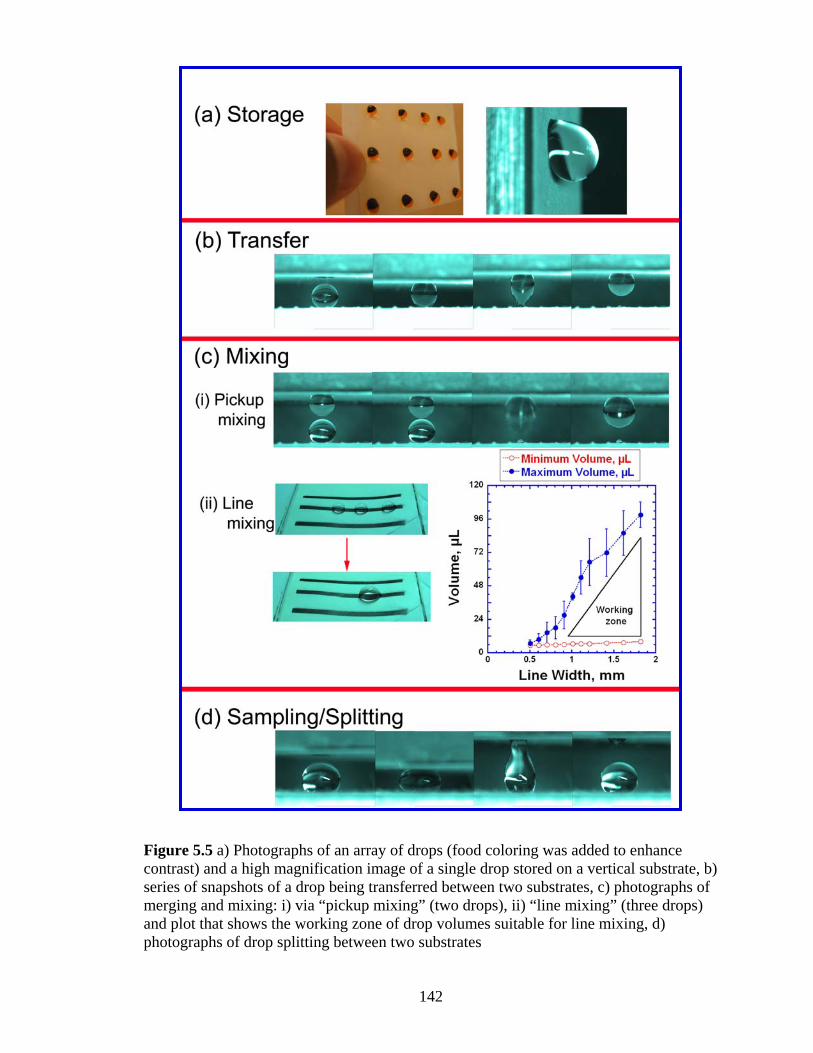
Figure 5.5 a) Photographs of an array of drops (food coloring was added to enhance contrast) and a high magnification image of a single drop stored on a vertical substrate, b) series of snapshots of a drop being transferred between two substrates, c) photographs of merging and mixing: i) via “pickup mixing” (two drops), ii) “line mixing” (three drops) and plot that shows the working zone of drop volumes suitable for line mixing, d) photographs of drop splitting between two substrates
142
5.3.2.1 Storage
The patterned paper substrates have a peculiar combination of two extreme wetting
properties: minimal contact area between liquid and substrate due to high advancing
contact angles and good adhesion due to hysteresis. It is believed that these properties
make HELP substrates potential candidates to serve as storage media for arrays of
microliter drops of test fluids and reagents. This type of storage is generally achieved
with more expensive well plates that confine liquids in 3D wells with larger interfacial
contact areas. It is believed that our patterned substrates can provide an inexpensive
replacement for current technologies for the storage of array of drops for high throughput
screening. The photograph on the left in Figure 5.5a shows an array of water drops
(colored using food coloring) stored on a vertical substrate. The three rows had dot sizes
of 1.84, 2.37 and 3.32 mm and drops volumes of 15, 20 and 25 µL, respectively. The
photograph on the right in Figure 5.5a shows a high magnification image of a 12µL water
drop stored on a vertically placed substrate with a 1.7 mm dot. In spite of the low
interfacial contact area, the drop withstands a tilt of 90 degrees.
5.3.2.2 Transfer
In Section 1.2, the transfer of microliter drops between two patterned substrates with
different pattern dimensions was investigated. It was also demonstrated that the
maximum drop volume that can be transferred between substrates can be predicted using
the modified Young- Dupré equation. Figure 5.5b shows a sequence of frames from a
movie that captured the transfer of a 4µL water drop from a 0.4 mm dot to a 1.45 mm
dot. This functionality enables selective transfer of drops from an array by carefully
143
tuning the size and location of dots on a pick-up substrate; the superhydrophobicity of the
base paper will guarantee that no transfer will occur in non-patterned areas of the pick-up
substrate.
5.3.2.3 Mixing
The patterned paper substrates can also be used to merge and mix liquid drops. Two
strategies for drop mixing were explored, which are referred to as pickup mixing and line
mixing. Figure 5.5c (i) shows how two 4 µL water drops (attached to the “from” (0.4
mm) and “to” (1.45 mm) substrates, respectively) are merged into a single drop using
pickup mixing. After the two drops are roughly aligned and the substrates are brought
together, the drops touch and merge. The final position of the merged drop depends upon
the competing adhesive forces of the upper “from” and lower “to” dots. As demonstrated
in Section 1.2, the size of “from” and “to” substrates can be tailored to enable pickup
mixing for a variety of drop volumes.
The second mixing strategy, line mixing (Figure 5.5c (ii)), enables mixing of two or more
drops on a line by taking advantage of the fact that the mobility of the drop on the line
depends on the drop’s configuration on the line. There are three basic configurations that
are important for line mixing. 1) If the drop is positioned on the line without touching the
end points of the line, the force needed to induce sliding along the line is given by
Equation 5.7 or 5.8, as discussed previously and shown in Figure 5.3b. 2) When a drop
slides and reaches the end of the line, its advancing edge contacts the SH paper and hence
θAI in Equation 5.7 and 5.8 must be replaced by θASH, which results in a significantly
144
increased value of FPO and FPP. Therefore, the sliding angle for a drop at the end of a line
is always greater than at other positions. 3) The mobility of a drop perpendicular to the
line is much lower than along the line for the same reasons, which restricts drop
movement to the line. These considerations concerning drop mobility on a line can be
used to design a mixing strategy for drops positioned on the line, by simply tilting the
line back and forth drops can be moved towards the line edge, where they become
pinned, so that trailing drops can merge. Subsequent rocking of the substrate then moves
the merged drop back and forth along the line, which induces internal mixing of the drop.
Figure 5.5c (ii) shows pictures of the merging and mixing of three 20 µL drops into a
single 60 µL drop via this line mixing strategy.
There are some limitations to this type of mixing. When drops start sliding, they initially
accelerate along the line; if their momentum becomes too large, the adhesive force at the
end of the line may be insufficient to ensure adherence to the line edge. Similarly,
vibrations can provide energy for the drop to break away from the line. Both effects will
limit the maximum drop size for line mixing, but it is beyond the scope of this work to
model these phenomena in detail. Instead, the overall effect was explored by evaluating
the reproducibility of drop size limits for line mixing. Three individuals with different
levels of experience and skill sets performed line mixing experiments and independently
determined the minimum and maximum drop volumes that could be mixed for different
line widths. The plot in Figure 5.5c (ii) shows the results of these tests; the ‘working
zone’ drawn between the two curves denotes the drop volume range for mixing as a
function of line width. It is important to point out that these experiments were performed
145
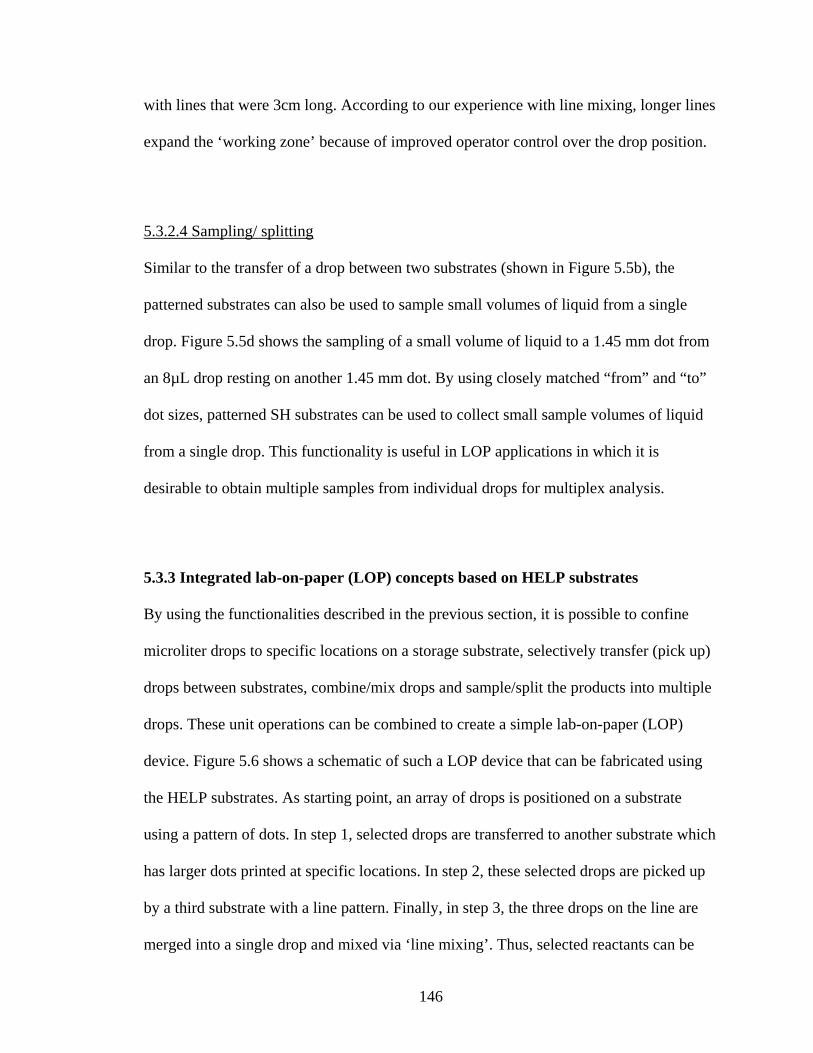
with lines that were 3cm long. According to our experience with line mixing, longer lines
expand the ‘working zone’ because of improved operator control over the drop position.
5.3.2.4 Sampling/ splitting
Similar to the transfer of a drop between two substrates (shown in Figure 5.5b), the
patterned substrates can also be used to sample small volumes of liquid from a single
drop. Figure 5.5d shows the sampling of a small volume of liquid to a 1.45 mm dot from
an 8µL drop resting on another 1.45 mm dot. By using closely matched “from” and “to”
dot sizes, patterned SH substrates can be used to collect small sample volumes of liquid
from a single drop. This functionality is useful in LOP applications in which it is
desirable to obtain multiple samples from individual drops for multiplex analysis.
5.3.3 Integrated lab-on-paper (LOP) concepts based on HELP substrates
By using the functionalities described in the previous section, it is possible to confine
microliter drops to specific locations on a storage substrate, selectively transfer (pick up)
drops between substrates, combine/mix drops and sample/split the products into multiple
drops. These unit operations can be combined to create a simple lab-on-paper (LOP)
device. Figure 5.6 shows a schematic of such a LOP device that can be fabricated using
the HELP substrates. As starting point, an array of drops is positioned on a substrate
using a pattern of dots. In step 1, selected drops are transferred to another substrate which
has larger dots printed at specific locations. In step 2, these selected drops are picked up
by a third substrate with a line pattern. Finally, in step 3, the three drops on the line are
merged into a single drop and mixed via ‘line mixing’. Thus, selected reactants can be
146
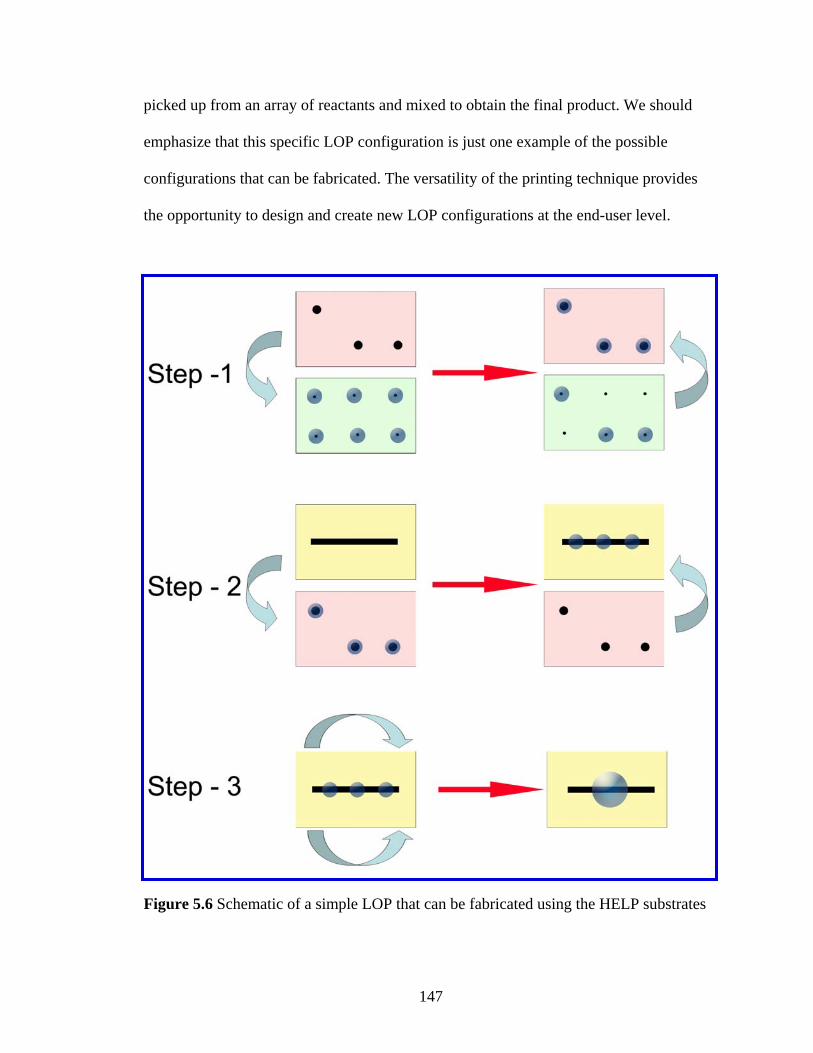
picked up from an array of reactants and mixed to obtain the final product. We should
emphasize that this specific LOP configuration is just one example of the possible
configurations that can be fabricated. The versatility of the printing technique provides
the opportunity to design and create new LOP configurations at the end-user level.
Figure 5.6 Schematic of a simple LOP that can be fabricated using the HELP substrates
147
5.4 Conclusions
A commercially available phaser printing technology was used to pattern
superhydrophobic paper substrates with high-hysteresis ink patterns (dots and lines). By
tuning the shape and size of the ink patterns, the drag-adhesion and extensional adhesion
of liquid drops to the substrate can be controlled. Experimental results for the adhesive
forces of water drops on these patterned substrates are in good agreement with classical
models for drag-adhesion (Furmidge equation) and extensional-adhesion (modified
Dupré equation) over a wide range of pattern sizes and drop volumes. Fundamental
knowledge of the dependence of adhesive forces on pattern parameters and the resulting
control over drop mobility were then used to design substrates for four basic
functionalities that are relevant for lab-on-paper (LOP) applications: drop storage, drop
transfer, drop mixing and sampling.
Previous LOP devices depended on the capillary forces inside the paper to enable the
transfer and mixing of test fluids. Hence, this approach rules out the possibility to extract
multiple samples of the reaction products for various analyses. Using HELP substrates,
the required unit operations were obtained by merely manipulating the liquid drops on
top of the substrate by tuning adhesive forces. Another unique advantage of the HELP
substrates over existing LOP devices is the ability to store liquid drops after initial,
qualitative on-chip analysis for further testing with specialized methods at centralized
testing centers, which would be relevant for bioanalytical applications in resource-limited
settings [1]. The substrates can also be used as a disposable storage medium in
148
conjunction with high-throughput screening and potentially replace well plate
technology.
Finally, the simplicity of the patterning techniques using commercially available desk top
printing technology and standard word processing software provides extreme flexibility
in substrate design. End-users can easily program their own substrates according to
specific needs, using the design rules presented in this paper, which represents the first
step towards creating successful LOP devices. Further success of this technology can be
achieved by developing custom printing ink formulations to enhance compatibility with
various test fluids and facilitate deposition of reagent species.
149
REFERENCES
1. Whitesides, G.M., The Origins and the Future of Microfluidics. Nature, 2006. 442(7101): p. 368-373.
2. Ng, J.M.K., I. Gitlin, A.D. Stroock, and G.M. Whitesides, Components for Integrated Poly(Dimethylsiloxane) Microfluidic Systems. Electrophoresis, 2002. 23(20): p. 3461-3473.
3. Whitesides, G.M. and A.D. Stroock, Flexible Methods for Microfluidics. Physics Today, 2001. 54(6): p. 42-48.
4. Nguyen, N.T. and Z.G. Wu, Micromixers - a Review. Journal of Micromechanics and Microengineering, 2005. 15(2): p. R1-R16.
5. Weibel, D.B., M. Kruithof, S. Potenta, S.K. Sia, A. Lee, and G.M. Whitesides, Torque-Actuated Valves for Microfluidics. Analytical Chemistry, 2005. 77(15): p. 4726-4733.
6. Nguyen, N.T., X.Y. Huang, and T.K. Chuan, Mems-Micropumps: A Review. Journal of Fluids Engineering-Transactions of the Asme, 2002. 124(2): p. 384-392.
7. Gunther, A., M. Jhunjhunwala, M. Thalmann, M.A. Schmidt, and K.F. Jensen, Micromixing of Miscible Liquids in Segmented Gas-Liquid Flow. Langmuir, 2005. 21(4): p. 1547-1555.
8. Chin, C.D., V. Linder, and S.K. Sia, Lab-on-a-Chip Devices for Global Health: Past Studies and Future Opportunities. Lab on a Chip, 2007. 7(1): p. 41-57.
9. Sia, S.K., V. Linder, B.A. Parviz, A. Siegel, and G.M. Whitesides, An Integrated Approach to a Portable and Low-Cost Immunoassay for Resource-Poor Settings. Angewandte Chemie-International Edition, 2004. 43(4): p. 498-502.
10. Zhao, W.A. and A. van den Berg, Lab on Paper. Lab on a Chip, 2008. 8(12): p. 1988-1991.
150
11. Daar, A.S., H. Thorsteinsdottir, D.K. Martin, A.C. Smith, S. Nast, and P.A. Singer, Top Ten Biotechnologies for Improving Health in Developing Countries. Nature Genetics, 2002. 32(2): p. 229-232.
12. Varmus, H., R. Klausner, E. Zerhouni, T. Acharya, A.S. Daar, and P.A. Singer, Grand Challenges in Global Health. Science, 2003. 302(5644): p. 398-399.
13. Comer, J.P., Semiquantitative Specific Test Paper for Glucose in Urine. Analytical Chemistry, 1956. 28(11): p. 1748-1750.
14. Delacruz, N., K.F. Button, and S.R. Gambino, A 1-Minute Paper-Strip Assay for Leukocytes in Urine. American Journal of Clinical Pathology, 1983. 80(1): p. 118-118.
15. Reinhartz, A., S. Alajem, A. Samson, and M. Herzberg, A Novel Rapid Hybridization Technique - Paper-Chromatography Hybridization Assay (Pacha). Gene, 1993. 136(1-2): p. 221-226.
16. Tsuda, S., M. Kameyaiwaki, K. Hanada, Y. Kouda, M. Hikata, and K. Tomaru, A Novel Detection and Identification Technique for Plant-Viruses - Rapid Immunofilter Paper Assay (Ripa). Plant Disease, 1992. 76(5): p. 466-469.
17. Yeoh, H.H., L.S. Lim, and H.C. Woo, An Enzyme-Bound Linamarin Indicator Paper Strip for the Semi-Quantitative Estimation of Linamarin. Biotechnology Techniques, 1996. 10(5): p. 319-322.
18. Zhao, W.A., M.M. Ali, S.D. Aguirre, M.A. Brook, and Y.F. Li, Paper-Based Bioassays Using Gold Nanoparticle Colorimetric Probes. Analytical Chemistry, 2008. 80(22): p. 8431-8437.
19. Allen, M.P., Laminated Assay Device. 1995, Chemtrak Inc., U.S. Patent 5,409,664.
20. Hardman, J.D., J.H. Slater, A.G. Reid, W.K. Lang, and J.R. Jackson, Biochemical and Immunochemical Assay Device 2003, Diamatrix Limited, U.S. Patent 6,573,108.
151
21. Martinez, A.W., S.T. Phillips, M.J. Butte, and G.M. Whitesides, Patterned Paper as a Platform for Inexpensive, Low-Volume, Portable Bioassays. Angewandte Chemie-International Edition, 2007. 46(8): p. 1318-1320.
22. Martinez, A.W., S.T. Phillips, E. Carrilho, S.W. Thomas, H. Sindi, and G.M. Whitesides, Simple Telemedicine for Developing Regions: Camera Phones and Paper-Based Microfluidic Devices for Real-Time, Off-Site Diagnosis. Analytical Chemistry, 2008. 80(10): p. 3699-3707.
23. Martinez, A.W., S.T. Phillips, B.J. Wiley, M. Gupta, and G.M. Whitesides, Flash: A Rapid Method for Prototyping Paper-Based Microfluidic Devices. Lab on a Chip, 2008. 8(12): p. 2146-2150.
24. Martinez, A.W., S.T. Phillips, and G.M. Whitesides, Three-Dimensional Microfluidic Devices Fabricated in Layered Paper and Tape. Proceedings of the National Academy of Sciences of the United States of America, 2008. 105(50): p. 19606-19611.
25. Bruzewicz, D.A., M. Reches, and G.M. Whitesides, Low-Cost Printing of Poly(Dimethylsiloxane) Barriers to Define Microchannels in Paper. Analytical Chemistry, 2008. 80(9): p. 3387-3392.
26. Li, X., J.F. Tian, T. Nguyen, and W. Shen, Paper-Based Microfluidic Devices by Plasma Treatment. Analytical Chemistry, 2008. 80(23): p. 9131-9134.
27. Abe, K., K. Suzuki, and D. Citterio, Inkjet-Printed Microfluidic Multianalyte Chemical Sensing Paper. Analytical Chemistry, 2008. 80(18): p. 6928-6934.
28. Gale, S.F. (2009) Lab-on-a-Chip: Vast Promises,Real Restraint. Small times, 18-20.
29. Abdelgawad, M. and A.R. Wheeler, The Digital Revolution: A New Paradigm for Microfluidics. Advanced Materials, 2009. 21(8): p. 920-925.
30. Wheeler, A.R., Chemistry - Putting Electrowetting to Work. Science, 2008. 322(5901): p. 539-540.
152
31. Chiou, P.Y., H. Moon, H. Toshiyoshi, C.J. Kim, and M.C. Wu, Light Actuation of Liquid by Optoelectrowetting. Sensors and Actuators A-Physical 2003. 104: p. 222-228.
32. Chiou, P.Y., S.Y. Park, and M.C. Wu, Continuous Optoelectrowetting for Picoliter Droplet Manipulation. Applied Physics Letters, 2008. 93(22): p. 221110
33. Chuang, H.S., A. Kumar, and S.T. Wereley, Open Optoelectrowetting Droplet Actuation. Applied Physics Letters, 2008. 93(6): p. 064104.
34. Bikerman, J.J., Sliding of Drops from Surfaces of Different Roughnesses. Journal of Colloid Science, 1950. 5(4): p. 349-359.
35. Furmidge, G.C.L., Studies at Phase Interfaces I. The Sliding of Liquid Drops on Solid Surfaces and a Theory for Spray Retention. Journal of Colloid and Interface Science, 1962. 17: p. 309-324.
36. Kawasaki, K., Study of Wettability of Polymers by Sliding of Water Drop. Journal of Colloid Science, 1960. 15(5): p. 402-407.
37. Macdougall, G. and C. Ockrent, Surface Energy Relations in Liquid/Solid Systems I. The Adhesion of Liquids to Solids and a New Method of Determining the Surface Tension of Liquids. Proceedings of the Royal Society of London Series a-Mathematical and Physical Sciences, 1942. 180(A981): p. 0151-0173.
38. Krasovitski, B. and A. Marmur, Drops Down the Hill: Theoretical Study of Limiting Contact Angles and the Hysteresis Range on a Tilted Plate. Langmuir, 2005. 21(9): p. 3881-3885.
39. Roura, P. and J. Fort, Comment On "Effects of the Surface Roughness on Sliding Angles of Water Droplets on Superhydrophobic Surfaces". Langmuir, 2002. 18(2): p. 566-569.
40. Gao, L.C. and T.J. McCarthy, How Wenzel and Cassie Were Wrong. Langmuir, 2007. 23(7): p. 3762-3765.
41. Gao, L.C. and T.J. McCarthy, Reply To "Comment on How Wenzel and Cassie Were Wrong by Gao and Mccarthy". Langmuir, 2007. 23(26): p. 13243-13243.
153

154
42. McHale, G., Cassie and Wenzel: Were They Really So Wrong? Langmuir, 2007. 23(15): p. 8200-8205.
43. Panchagnula, M.V. and S. Vedantam, Comment on How Wenzel and Cassie Were Wrong by Gao and Mccarthy. Langmuir, 2007. 23(26): p. 13242-13242.
44. Hondros, E.D., Dr. Thomas Young - Natural Philosopher. Journal of Materials Science, 2005. 40(9-10): p. 2119-2123.
45. Wu, S., Polymer Interface and Adhesion. 1982, New York: Marcel Dekker, Inc.
46. Gaudin, A.M., A.F. Witt, and T.G. Decker, Contact Angle Hysteresis - Principles and Application of Measuremen Methods. Transactions of the Society of Mining Engineers of AIME, 1963. 226: p. 107-112.
47. De Souza, E.J., L. Gao, T.J. McCarthy, E. Arzt, and A.J. Crosby, Effect of Contact Angle Hysteresis on the Measurement of Capillary Forces. Langmuir, 2008. 24(4): p. 1391-1396.
CHAPTER 6
DIRECTIONAL MOBILITY AND ADHESION OF WATER DROPS
ON PATTERNED SUPERHYDROPHOBIC SURFACES*
6.1 Introduction
The intriguing self-cleaning property of the lotus leaf was identified and studied
extensively in the 1970s and has been termed “lotus effect”. On a lotus leaf, water drops
easily slide off in all directions. But there are also several natural surfaces where
directionality is observed in droplet roll-off behavior. For instance, rice leaves exhibit
anisotropic dewetting: the adhesion to drop sliding depends on whether the drop moves
perpendicular or parallel to the orientation of micropapillae [1]. Similar anisotropic drop
sliding behavior has been observed in bamboo, screw pine and some grasses; for these
plants, water can roll off only along the length of the leaf [2]. On duck and goose
feathers, water drop roll-off can only occur along the vein of the feather outward [3].
Drop mobility on the wings of butterflies is even more intriguing; in addition to uni-
directional drop sliding, the wing surface can also reverse the direction of sliding based
on its posture (upward or downward) [4]. Finally, on the petals of the red rose (rosea
Rehd), water drops with volumes less than 10 μL do not roll-off in any direction despite
near-spherical droplet shapes with a high contact angle (CA ~ 152.4°) [5].
___________________________
* This chapter has been published as: Balu, B., Berry, A.D., Patel, K. T., Breedveld, V., and Hess, D.W., Directional Mobility and Adhesion of Water Drops on Patterned Superhydrophobic Surfaces. Journal of Adhesion Science and Technology (Special Edition), Submitted, 2009.
155

Many properties of natural materials have served as motivating factors for research,
which has become evident through the emergence of the field of biomimetics. Advances
in nanofabrication technology over the past few decades have enabled the fabrication of
artificial surfaces that mimic the behaviors listed above on a variety of organic and
inorganic substrates. For instance, the ‘lotus effect’ (advancing CA>150° and CA
hysteresis <10°), which is also classified as ‘roll-off’ superhydrophobicity, has been
obtained on a variety of surfaces [6-11]. The fabrication of ‘sticky’ superhydrophobic
surfaces (advancing CA>150° and CA hysteresis > 10°) that mimic the behavior of a
‘rose petal’ has also been reported [5, 12-14]. Chapter 2 described the fabrication
techniques for obtaining roll-off and sticky superhydrophobic behaviors on paper
surfaces via plasma processing. Chapter 3 and 4 described the ability to tune adhesion
forces on superhydrophobic paper surfaces between two extremes (roll-off and sticky) by
controlling the topography of the cellulose fibers by means of selective plasma-enhanced
etching, fiber types and paper making techniques.
Recently, there has been increased interest in fabricating superhydrophobic surfaces with
directional preference in the drop sliding behavior [15]. Although there have been
numerous studies that report anisotropic drop sliding [16-18] and wetting [2, 19-24] on
artificial hydrophobic surfaces, directional drop sliding behavior on superhydrophobic
surfaces has not been extensively studied. Superhydrophobic surfaces with parallel,
grooved microtextures were fabricated to create anisotropic drop sliding behavior:
aligned carbon nanotubes (ACNT) were grown with ordered pillar patterns similar to the
topology of a rice leaf and hydrophobized; these structures mimic the anisotropic sliding
156
behavior observed on rice leaves [1]. Other studies created an S-shaped surface pattern on
a roll-off superhydrophobic glass surface using a cutting blade [25]. With the proper tilt
angle, a water drop (4 µL) was able to slide along the S-shaped curve. In both these
cases, directional adhesion was obtained by changing surface topography. For anisotropic
sliding behavior on ACNT films, the difference between orthogonal critical sliding angles
was small due to the weak adhesion forces [1]. Similarly, for patterned glass slides,
droplet manipulation was not successful for volumes larger than 20 µL and for tilt angles
larger than 45° because of the limited adhesion force exerted by the difference in
topography [25]. To the authors’ knowledge, superhydrophobic surfaces that offer
directional drop mobility with a large difference between sliding angles for a wide range
of drop volumes, have not been reported
In Chapter 5, we discussed the ability to control drag and extensional adhesion of water
drops on superhydrophobic paper surfaces by patterning the surfaces using a commercial
desktop printer. In that work, the difference in surface energy between the
superhydrophobic paper substrate and the less hydrophobic ink film was exploited to
manipulate the adhesion and mobility of water drops. The objective of this chapter is to
create surfaces with anisotropic drop mobility by using ink patterns on superhydrophobic
paper. The guiding hypothesis is that directionality can be obtained by imposing
geometrical constraints on the movement of the three-phase contact line between drop,
paper and air through the shape of the ink patterns. In addition, we investigated the
tunability of sliding angle by creating chemical heterogeneity in the form of ‘checkered’
ink patterns. Controlled anisotropic drop mobility and adhesion on superhydrophobic
157
surfaces has potential application in the formation of fundamental components for 2D
microfluidic devices, such as flow paths, gates/diodes, junctions and drop size filters.
6.2 Experimental
6.2.1 Superhydrophobic paper
Paper handsheets were prepared with a combination of 50% hardwood and 50% softwood
fibers according to TAPPI standardized method T205 sp-02. The handsheets were
selectively plasma etched with oxygen gas (0.55 torr) and a thin (100 nm) fluorocarbon
film was subsequently deposited onto the etched surface by plasma-assisted deposition (1
torr) using pentafluoroethane (PFE) as precursor. A more detailed discussion of the
methods to fabricate superhydrophobic paper can be found in Section 2.2.1 and 2.2.2
(Chapter 2).
6.2.2 Patterning
All printed ink patterns other than the ‘checkered’ ones were designed with Adobe
Photoshop (version 7.0; Adobe Systems Inc., San Jose, CA). The ‘checkered’ patterns
were designed through MATLAB (version 7.6.0; The MathWorks Inc., Natick MA). For
the ‘checkered’ patterns in Figure 6.5a, 6.5b, 6.5c and 6.5d a predefined square area was
divided into square matrices with 750 X 750, 250 X 250, 1400 X 1400 and 1200 X 1200
cells, respectively. All pixels constituting the cells of the matrix were designated ‘white’
([R B G] = [255 255 255]) to ensure a white background. For Figures 6.5a and 6.5b,
starting from the left top cell (0, 0), the pixels in every second cell (in both x and y
158

directions) were designated ‘black’ ([R B G] = [0 0 0]). For Figures 6.5c and 6.5d,
starting from the left top cell (0, 0), the pixels in every fourth cell (in both x and y
directions) were designated ‘black’ ([R B G] = [0 0 0]).
The SH paper was pasted on a piece of copy paper using Scotch® Tape and fed through a
Xerox Phaser 8500n (Xerox Corporation, Norwalk CT) printer to generate the patterns.
6.2.3 Image Analysis
‘Checkered’ patterns with variable areal ink fractions were imaged with a Leica
microscope (DM4500 B) using a 2.5X objective as described in Section 4.2.5 (Chapter
4). The images were then processed using Image-J (Java-based image processing
program developed at the National Institutes of Health). For all imaged ‘checkered’
substrates, a threshold was manually set for the pixel brightness to differentiate ‘ink’
pixels from the SH paper background. Then the ‘area’ and ‘area fraction’ of the ink were
obtained using the “Analyze particles” feature in Image-J. The ‘area’ value obtained from
the Image-J was divided by the number of features present on the image and the square
root of this ratio was taken to calculate the size of the ink features. The distance between
features was calculated by measuring the distance (x value, in pixels) at the center of two
adjacent features and converting the difference to units of µm using the microscope
conversion factor. This procedure was repeated for a variety of pixel pairs to obtain
statistically averaged values.
159

6.2.4 Sliding drop measurements
The patterned SH paper substrates were mounted on a flat surface attached to a rotating
optical stage. For the directional substrates, a drop with a specific volume was placed at
the center of the pattern. For the ‘checkered’ pattern substrates, a drop with a specific
volume was placed randomly. After placing the drop on the horizontal substrate, the plate
was tilted gradually until roll-off was observed; the critical sliding angle was obtained
from the angular scale of the optical stage.
6.3 Results and discussion
6.3.1 Control of directionality
6.3.1.1 Design for directional sliding
It has been well-established that drop sliding on a surface is primarily governed by
movement of the three-phase liquid/solid/vapor contact line [16, 26]. This contact line
can be divided into segments with advancing and receding contact lines, as observed at
the advancing and receding edges of a sliding drop. The sliding of drops on inclined
surfaces was extensively studied and modeled in the mid-twentieth century [27-30]. In
1962, Furmidge [28] surveyed the literature at that time and formulated a semi-empirical
force balance (Equation 5.3). After rearranging this equation, we get:
( )Vg
W ARdropLV
ρθθγ
αcoscos
sin−
= (6.1)
160
where α is the critical sliding angle, γLV is the surface tension of the liquid, Wdrop is the
width of the drop perpendicular to the direction of sliding, θA and θR are the advancing
and receding contact angles of the drop on the surface, ρ is the density of the liquid drop,
V is the volume of the drop and g is the acceleration due to gravity . From Equation (6.1)
it is clear that the contact angles established at the advancing (θA) and receding (θR)
contact lines are critical in determining the drop sliding behavior.
Consider a semi-circular ink pattern with diameter D printed on superhydrophobic (SH)
paper, as depicted in Figure 6.1. The surface energy of the ink film is higher than that of
the SH paper, leading to advancing and receding CAs on the ink film that are always
lower than those on the SH paper. If a water drop with a foot print diameter equal to the
diameter of the semi-circle is placed on the paper substrate, the semi-circle will be
aligned with the contact line of the drop. When the substrate is tilted towards the concave
or convex direction of the pattern, the advancing contact line of the drop always
experiences the advancing CA on the SH paper. However, the receding contact line of the
drop experiences different interactions with the ink pattern depending upon the sliding
direction. For sliding in the concave direction, the ink curvature embraces the receding
contact line of the drop; as a result, the receding contact line experiences the receding CA
on the ink until drop detachment from the pattern occurs. During sliding in the convex
direction, the receding contact line is more complex: the receding contact line and the
semi-circular ink pattern appear as two intersecting semi-circles. When the drop finally
detaches from the pattern, the contact line and the pattern touch each other at a single
point, similar to contact between two hard-spheres. In other words, when a drop slides in
161
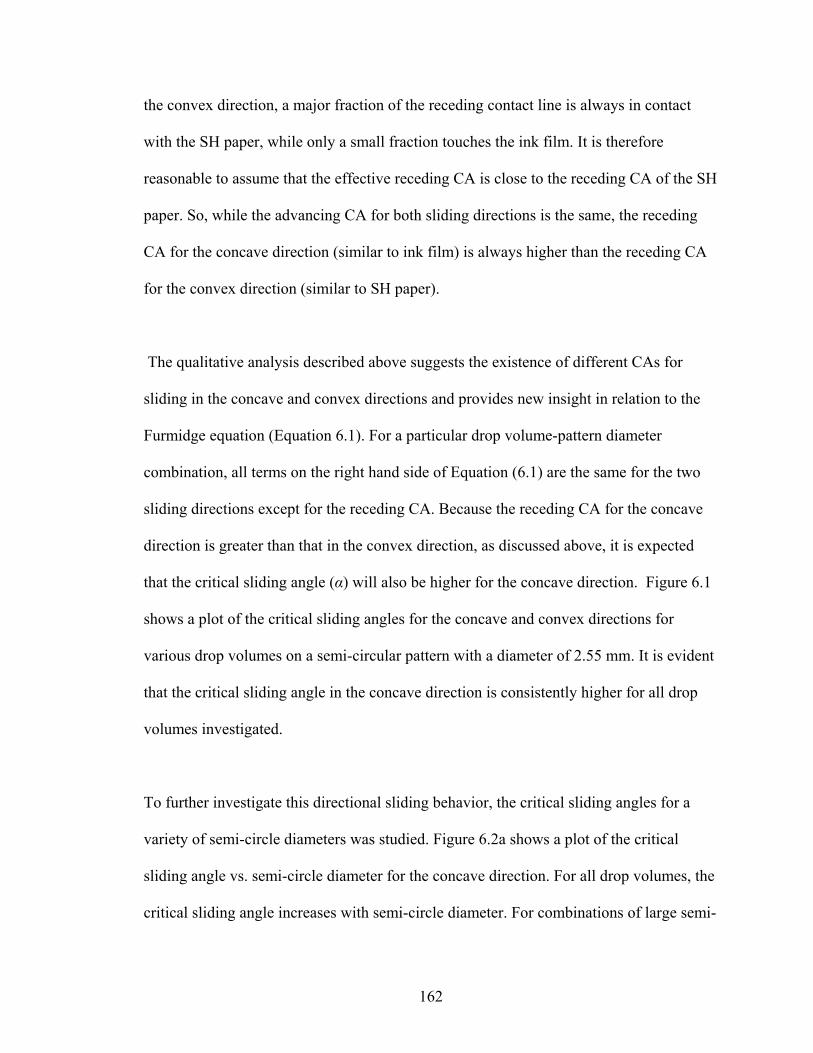
the convex direction, a major fraction of the receding contact line is always in contact
with the SH paper, while only a small fraction touches the ink film. It is therefore
reasonable to assume that the effective receding CA is close to the receding CA of the SH
paper. So, while the advancing CA for both sliding directions is the same, the receding
CA for the concave direction (similar to ink film) is always higher than the receding CA
for the convex direction (similar to SH paper).
The qualitative analysis described above suggests the existence of different CAs for
sliding in the concave and convex directions and provides new insight in relation to the
Furmidge equation (Equation 6.1). For a particular drop volume-pattern diameter
combination, all terms on the right hand side of Equation (6.1) are the same for the two
sliding directions except for the receding CA. Because the receding CA for the concave
direction is greater than that in the convex direction, as discussed above, it is expected
that the critical sliding angle (α) will also be higher for the concave direction. Figure 6.1
shows a plot of the critical sliding angles for the concave and convex directions for
various drop volumes on a semi-circular pattern with a diameter of 2.55 mm. It is evident
that the critical sliding angle in the concave direction is consistently higher for all drop
volumes investigated.
To further investigate this directional sliding behavior, the critical sliding angles for a
variety of semi-circle diameters was studied. Figure 6.2a shows a plot of the critical
sliding angle vs. semi-circle diameter for the concave direction. For all drop volumes, the
critical sliding angle increases with semi-circle diameter. For combinations of large semi-
162
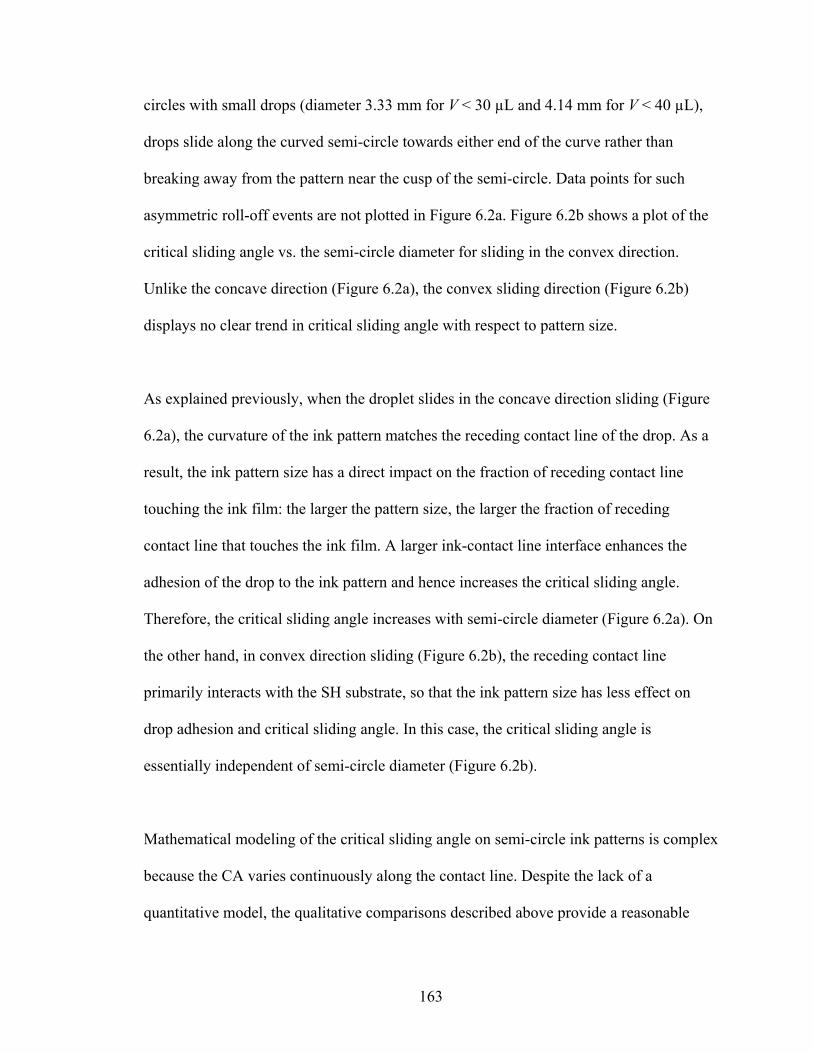
circles with small drops (diameter 3.33 mm for V < 30 µL and 4.14 mm for V < 40 µL),
drops slide along the curved semi-circle towards either end of the curve rather than
breaking away from the pattern near the cusp of the semi-circle. Data points for such
asymmetric roll-off events are not plotted in Figure 6.2a. Figure 6.2b shows a plot of the
critical sliding angle vs. the semi-circle diameter for sliding in the convex direction.
Unlike the concave direction (Figure 6.2a), the convex sliding direction (Figure 6.2b)
displays no clear trend in critical sliding angle with respect to pattern size.
As explained previously, when the droplet slides in the concave direction sliding (Figure
6.2a), the curvature of the ink pattern matches the receding contact line of the drop. As a
result, the ink pattern size has a direct impact on the fraction of receding contact line
touching the ink film: the larger the pattern size, the larger the fraction of receding
contact line that touches the ink film. A larger ink-contact line interface enhances the
adhesion of the drop to the ink pattern and hence increases the critical sliding angle.
Therefore, the critical sliding angle increases with semi-circle diameter (Figure 6.2a). On
the other hand, in convex direction sliding (Figure 6.2b), the receding contact line
primarily interacts with the SH substrate, so that the ink pattern size has less effect on
drop adhesion and critical sliding angle. In this case, the critical sliding angle is
essentially independent of semi-circle diameter (Figure 6.2b).
Mathematical modeling of the critical sliding angle on semi-circle ink patterns is complex
because the CA varies continuously along the contact line. Despite the lack of a
quantitative model, the qualitative comparisons described above provide a reasonable
163
understanding of water drop sliding behavior on the ink patterns. Clearly, critical sliding
angles can be altered by establishing positive or negative curvature of ink patterns to
achieve directional mobility of water drops on superhydrophobic paper surfaces.
164
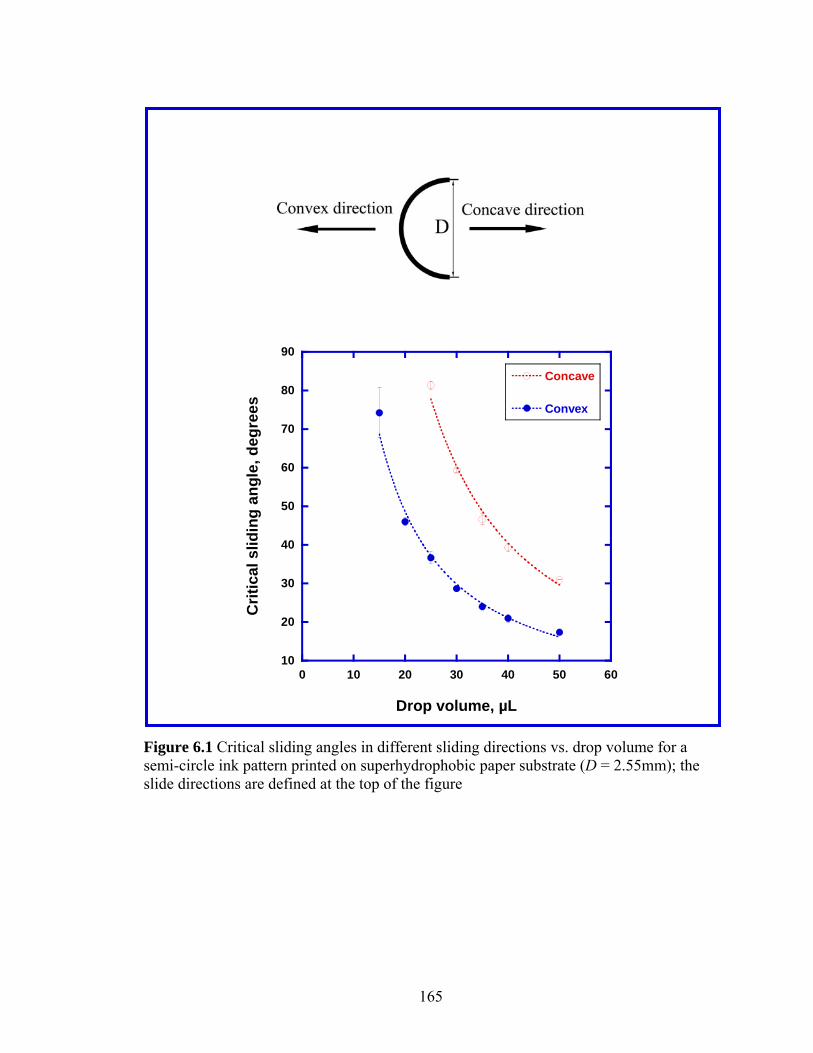
10
20
30
40
50
60
70
80
90
0 10 20 30 40 50 60
Concave
Convex
Crit
ical
slid
ing
angl
e, d
egre
es
Drop volume, µL
Figure 6.1 Critical sliding angles in different sliding directions vs. drop volume for a semi-circle ink pattern printed on superhydrophobic paper substrate (D = 2.55mm); the slide directions are defined at the top of the figure
165
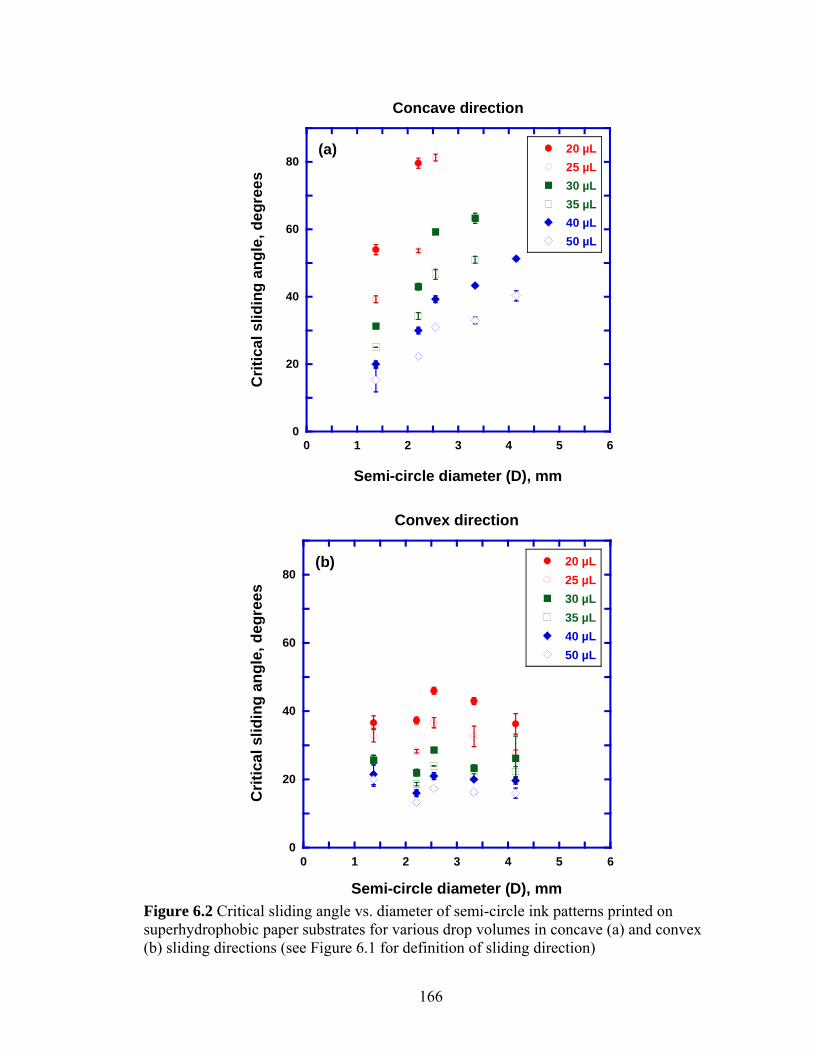
0
20
40
60
80
0 1 2 3 4 5 6
Concave direction
20 µL25 µL30 µL35 µL40 µL50 µL
Crit
ical
slid
ing
angl
e, d
egre
es
Semi-circle diameter (D), mm
(a)
0
20
40
60
80
0 1 2 3 4 5
Convex direction
6
20 µL25 µL30 µL35 µL40 µL50 µL
Crit
ical
slid
ing
angl
e, d
egre
es
Semi-circle diameter (D), mm
(b)
Figure 6.2 Critical sliding angle vs. diameter of semi-circle ink patterns printed on superhydrophobic paper substrates for various drop volumes in concave (a) and convex (b) sliding directions (see Figure 6.1 for definition of sliding direction)
166
6.3.1.2. Different types of directional sliding
Directional sliding of water drops on superhydrophobic surfaces may offer novel
approaches for the design of 2D microfluidic devices. For example, anisotropy can be
exploited to create 2D flow paths, valves/diodes, and junctions for drops on these
surfaces. In the following, several examples of patterns that apply the concept described
in the previous section to achieve specific droplet manipulation are discussed in detail.
Figure 6.3a shows the simplest anisotropic design, a straight line. When a drop is placed
on this line pattern, the width of the drop (Wdrop) in the ‘parallel’ sliding direction is
always smaller than in the ‘perpendicular’ sliding direction. This is because of the
elongation of the drop along the line as a result of the higher surface energy of the ink
line. The receding CAs for both sliding directions are similar to that of the receding CA
on the ink. While the advancing CA in the ‘perpendicular’ direction is similar to that of
the advancing CA on SH paper, the advancing CA in the ‘parallel’ direction is similar to
that of the advancing CA on ink. Such behavior is expected, because as the drop slides
along the line (parallel direction), the part of the drop that resides on the line always
remains in contact with the ink film. Thus ‘perpendicular’ direction sliding always has a
larger width (Wdrop) and advancing CA (θA) relative to the ‘parallel’ direction. Combining
this qualitative analysis with the Furmidge equation (Equation 6.1), it is evident that drop
sliding parallel to the line is easier than sliding perpendicular to the line. Figure 6.4a
clearly shows the anisotropy of drop sliding in directions parallel and perpendicular to a
line. A water drop placed on a line moves easily along the line, but it needs a higher tilt
angle to detach from the line in the perpendicular direction. This two-directional sliding
167
functionality of the line pattern can be used to design 2D flow paths for 2D microfluidic
devices. For example, lines can be used to ensure directional mobility of drops from one
position to another by merely tilting the substrate.
While a simple straight line pattern exhibits two-directional sliding, a semi-circle can be
inserted between two lines to establish anisotropy for sliding in one-direction. Figure 6.3b
shows such a design which is composed of a semi-circle and two line elements. As
described in the previous section, a semi-circle exhibits preferential drop sliding toward
the convex side of the semi-circle; lines are included in the design to create a defined
flow path for drops moving toward and away from the semi-circle element. The intent in
this design is to create a droplet gate or diode, which allows transport of the drop along
the line only in one direction. Figure 6.4b presents critical sliding angles in the concave
and convex sliding directions for a variety of drop volumes. Comparison of these data
with the results for an isolated semi-circle in Figure 6.1 shows that the presence of lines
near the semi-circle does not affect the directionality of drop sliding on the semi-circle.
At the appropriate tilt angle, while a drop sliding along the line in the concave direction
will have its movement inhibited by the semi-circle pattern; a drop sliding in the convex
direction will pass the semi-circle unhindered. Of course, different drop volumes result in
different sliding angle values for both directions during passage through the semi-circle
gate. The ability to exhibit different tilt pass angles for different volume drops sliding in
different directions on this pattern allows the fabrication of 2D gates/diodes and valves
for 2D microfluidic devices.
168
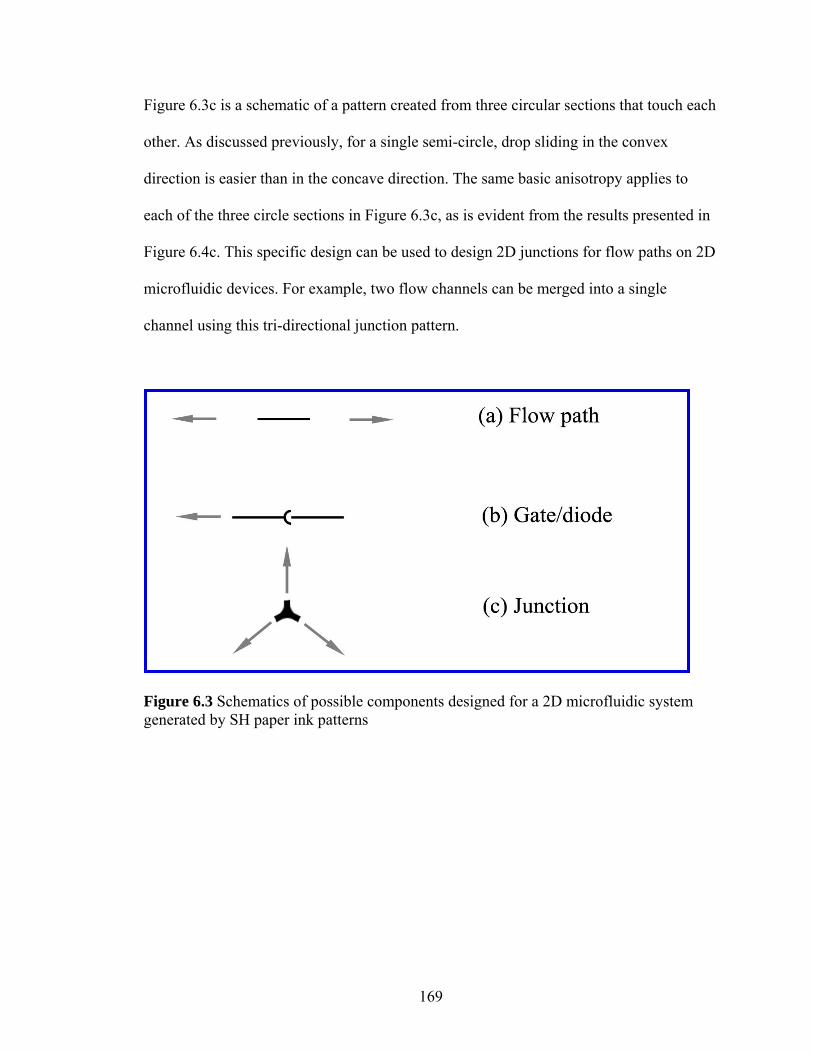
Figure 6.3c is a schematic of a pattern created from three circular sections that touch each
other. As discussed previously, for a single semi-circle, drop sliding in the convex
direction is easier than in the concave direction. The same basic anisotropy applies to
each of the three circle sections in Figure 6.3c, as is evident from the results presented in
Figure 6.4c. This specific design can be used to design 2D junctions for flow paths on 2D
microfluidic devices. For example, two flow channels can be merged into a single
channel using this tri-directional junction pattern.
Figure 6.3 Schematics of possible components designed for a 2D microfluidic system generated by SH paper ink patterns
169
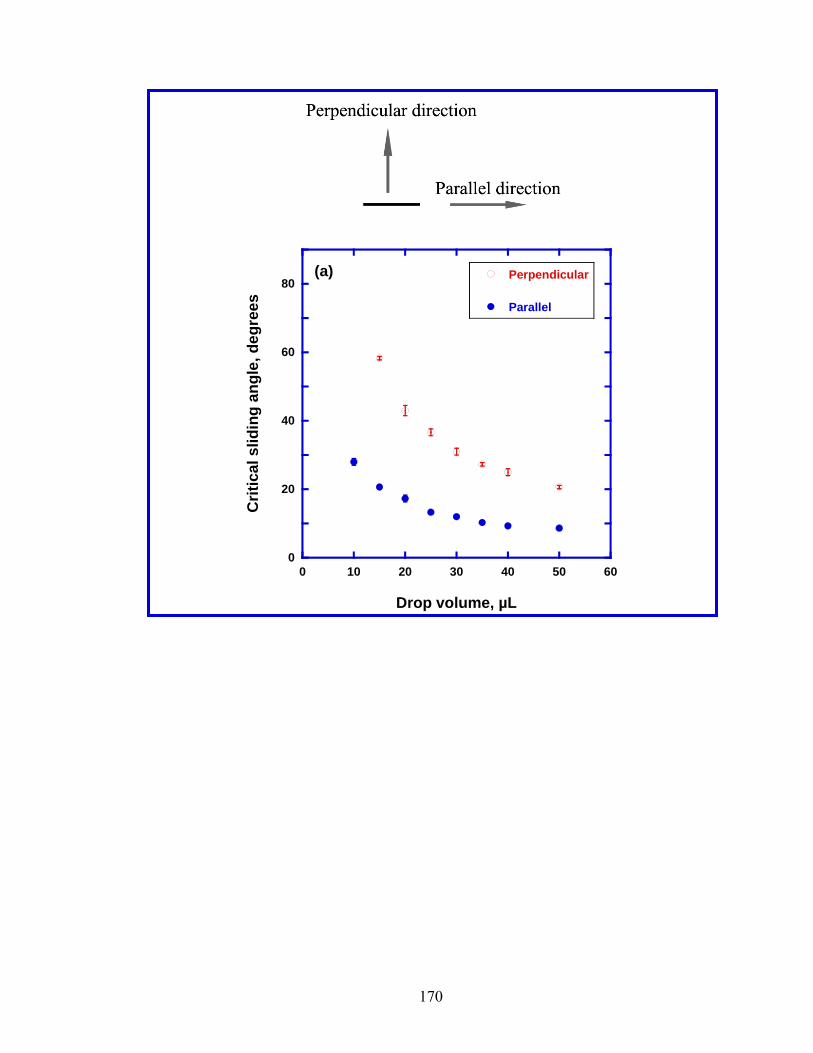
0
20
40
60
80
0 10 20 30 40 50 60
Perpendicular
Parallel
Crit
ical
slid
ing
angl
e, d
egre
es
Drop volume, µL
(a)
170
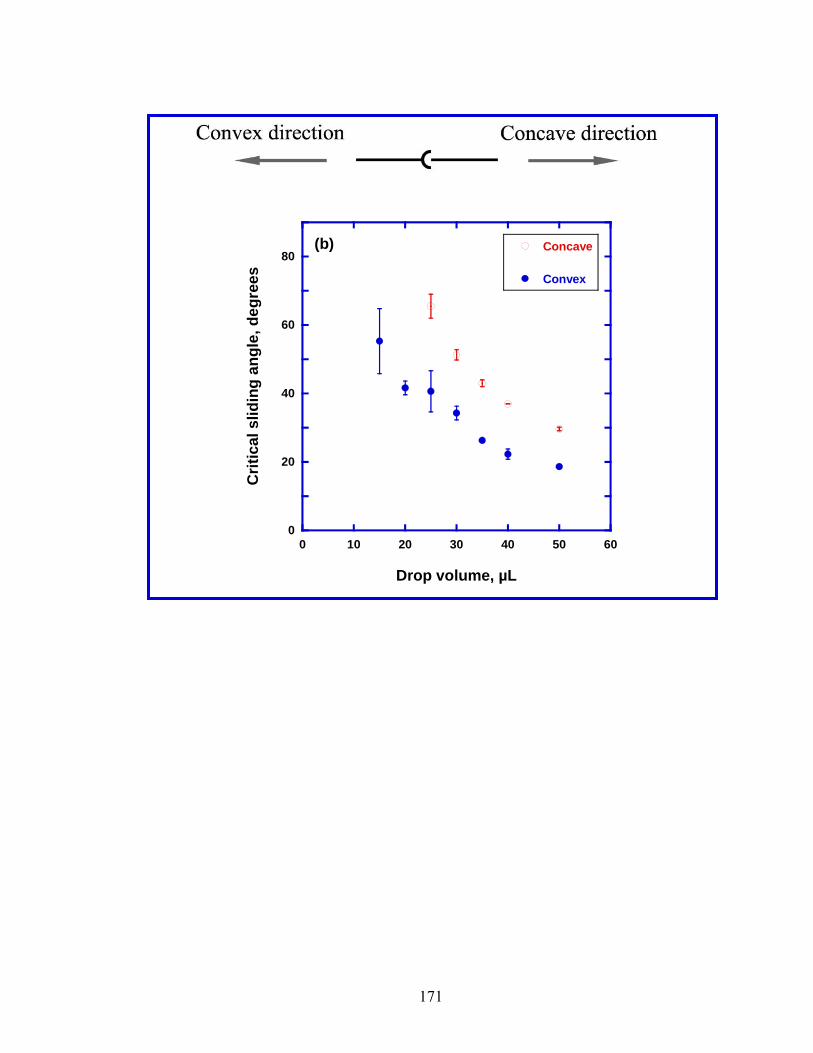
0
20
40
60
80
0 10 20 30 40 50 60
Concave
Convex
Crit
ical
slid
ing
angl
e, d
egre
es
Drop volume, µL
(b)
171
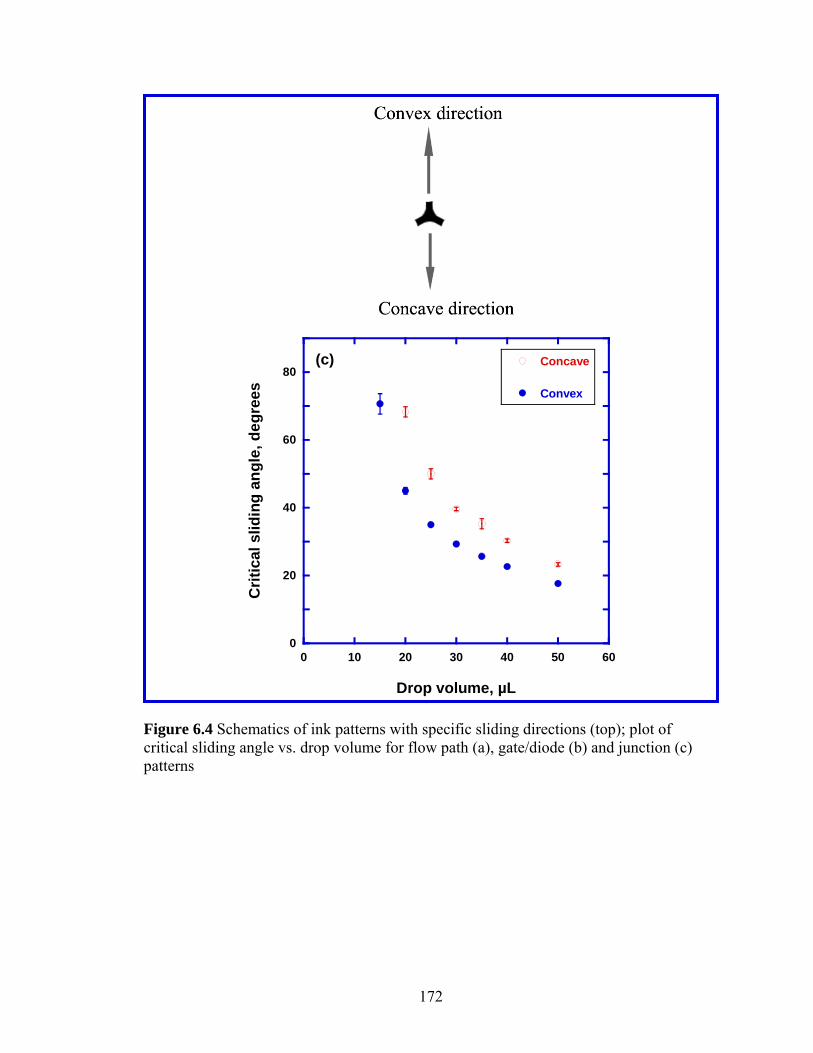
0
20
40
60
80
0 10 20 30 40 50 60
Concave
Convex
Crit
ical
slid
ing
angl
e, d
egre
es
Drop volume, µL
(c)
Figure 6.4 Schematics of ink patterns with specific sliding directions (top); plot of critical sliding angle vs. drop volume for flow path (a), gate/diode (b) and junction (c) patterns
172
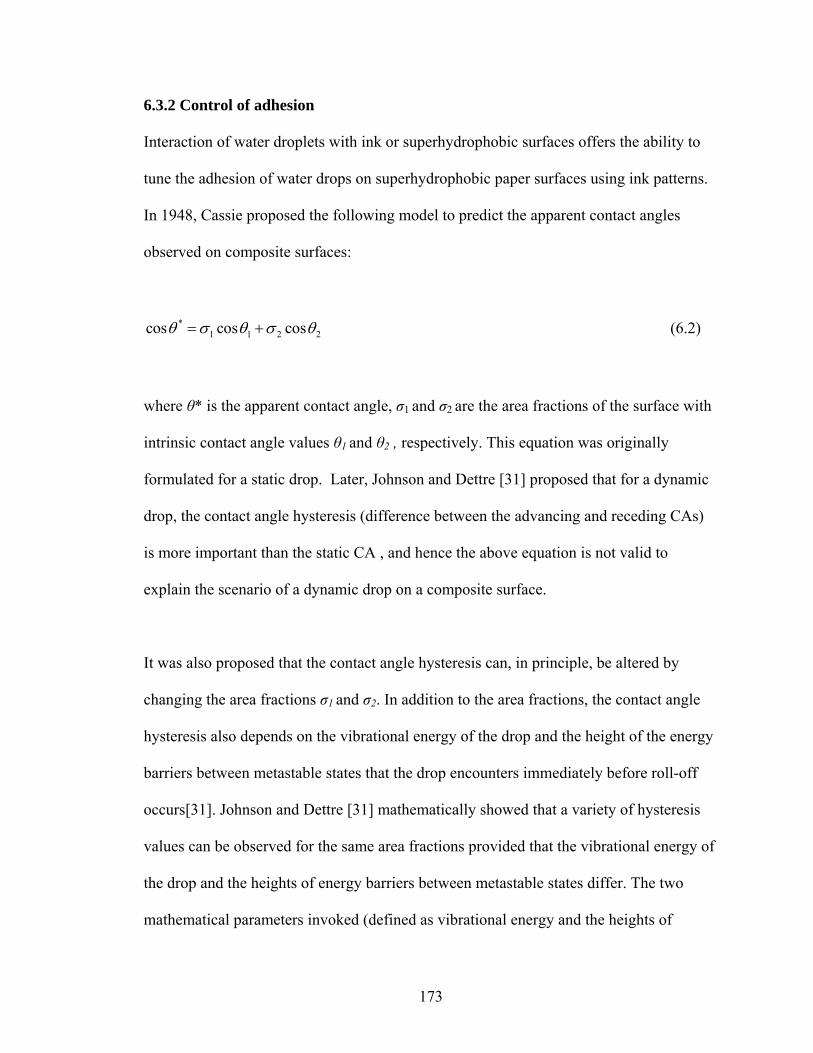
6.3.2 Control of adhesion
Interaction of water droplets with ink or superhydrophobic surfaces offers the ability to
tune the adhesion of water drops on superhydrophobic paper surfaces using ink patterns.
In 1948, Cassie proposed the following model to predict the apparent contact angles
observed on composite surfaces:
*1 1 2cos cos cos 2θ σ θ σ θ= +
(6.2)
where θ* is the apparent contact angle, σ1 and σ2 are the area fractions of the surface with
intrinsic contact angle values θ1 and θ2 , respectively. This equation was originally
formulated for a static drop. Later, Johnson and Dettre [31] proposed that for a dynamic
drop, the contact angle hysteresis (difference between the advancing and receding CAs)
is more important than the static CA , and hence the above equation is not valid to
explain the scenario of a dynamic drop on a composite surface.
It was also proposed that the contact angle hysteresis can, in principle, be altered by
changing the area fractions σ1 and σ2. In addition to the area fractions, the contact angle
hysteresis also depends on the vibrational energy of the drop and the height of the energy
barriers between metastable states that the drop encounters immediately before roll-off
occurs[31]. Johnson and Dettre [31] mathematically showed that a variety of hysteresis
values can be observed for the same area fractions provided that the vibrational energy of
the drop and the heights of energy barriers between metastable states differ. The two
mathematical parameters invoked (defined as vibrational energy and the heights of
173
energy barriers) were subsequently studied in more detail and related to the topography
of the three-phase contact line [9, 32, 33]. The work of Chen et al. demonstrated that the
topography of the contact line can be altered by changing the sizes/shapes of the different
surface elements on the composite surface [9]. Finally, altering the CA hysteresis or, in
other words, the advancing and receding CAs, alters the critical sliding angle of water
drops on the composite surfaces according to Equation (6.1). Therefore, previous studies
in this field suggest that the hysteresis, or the critical sliding angle, can be altered by
changing the area fraction and sizes/shapes of the different materials that make up the
composite surface.
The fabrication of superhydrophobic surfaces with tunable sliding angles for a wide range
of drop volumes is described below. Composite surfaces were prepared by printing ink
patterns consisting of square ink dots as described in the experimental section (Figure
6.5). The patterns in Figure 6.5 were designed in such a way that the area fraction and
feature size were varied independently. Table 6.1 shows the area fraction of ink, feature
size of ink spot and distance between the ink spots for the four patterns shown in Figure
6.5. From Table 6.1, Figure 6.5a and 6.5b have the same area fraction (~25%) of ink
printed on the superhydrophobic paper. However, the ink spot size in Figure 6.5b is
larger than that in Figure 6.5a. Similarly, Figures 6.5c and 6.5d have the same area
fraction (~8%) of ink but have different feature sizes (Table 6.1).
174
Figure 6.6 shows the sliding angle of water drops as a function of drop volume for the
substrates shown in Figures 6.5 a, b, c, and d, along with sliding angles for a continuous
ink film, for SH paper after passage through the printer but without printing (SH-control)
and for SH paper that was not fed through the printer (SH-virgin). From these results, it is
evident that composite surfaces with an ink fraction of ~25% (6a and 6b) display results
close to those for the ink film, while the composite surfaces with an ink fraction of ~8%
(6c and 6d) display properties more similar to the SH control substrate. These results
indicate that by changing the area fraction of the composite surface, critical sliding angle
values can be tuned between the values obtained for SH paper (control) and an ink film.
Further consideration of the curves in Figure 6.6 with the same area fraction but different
feature sizes demonstrates that the sliding angles can be altered by changing the feature
sizes. When feature size increases, the contact line becomes smoother, which minimizes
the tension of the drop on the contact line and thus lowers the energy barrier height for
drop sliding. Indeed, Figure 6.6 shows that patterns with larger features (6.6b and 6.6d)
consistently display higher sliding angles than do patterns with smaller features (6.6a and
6.6c) although the area fractions are the same.
The SH-control substrate shows higher critical sliding angle values than SH-virgin paper.
It is believed that the enhanced stickiness of the SH-control substrate is caused by minor
damage of the plasma-treated surfaces as a result of paper passage through the printer.
Heterogeneous damage incurred during passage through the printer is also the likely
cause of the relatively large error bars in Figure 6.6 for small drop volumes.
Nevertheless, the trends displayed in Figure 6.6 are consistent with differences between
175
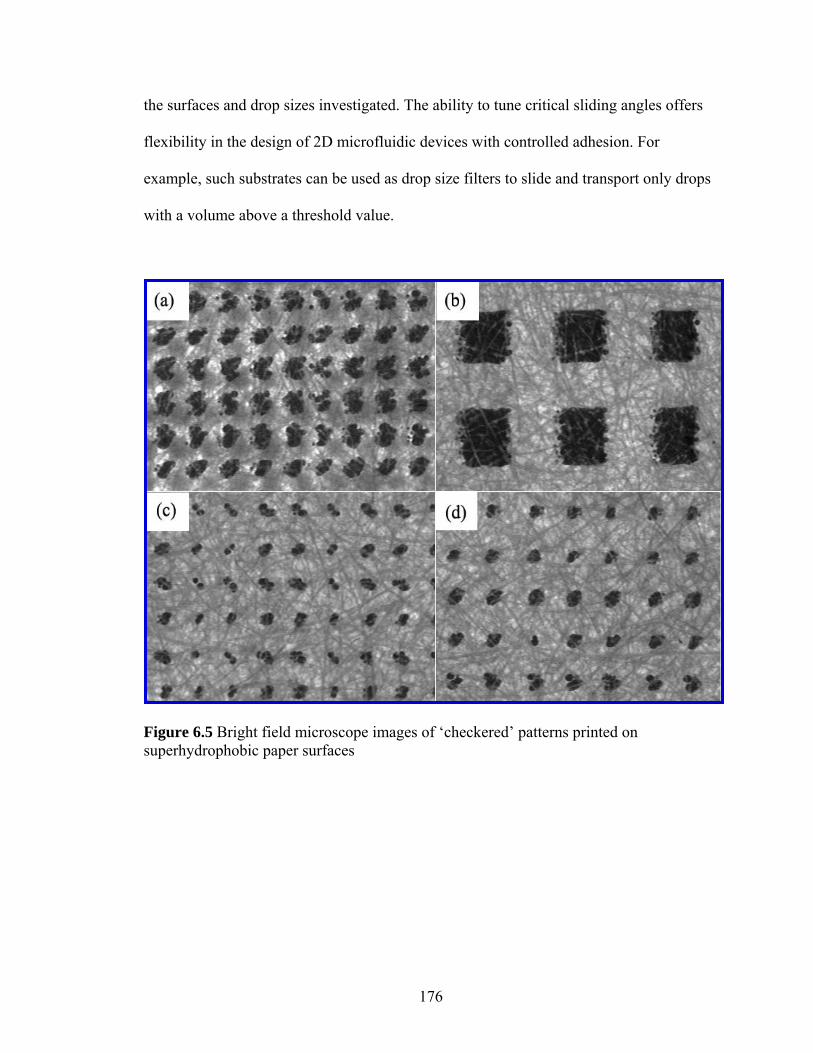
the surfaces and drop sizes investigated. The ability to tune critical sliding angles offers
flexibility in the design of 2D microfluidic devices with controlled adhesion. For
example, such substrates can be used as drop size filters to slide and transport only drops
with a volume above a threshold value.
Figure 6.5 Bright field microscope images of ‘checkered’ patterns printed on superhydrophobic paper surfaces
176
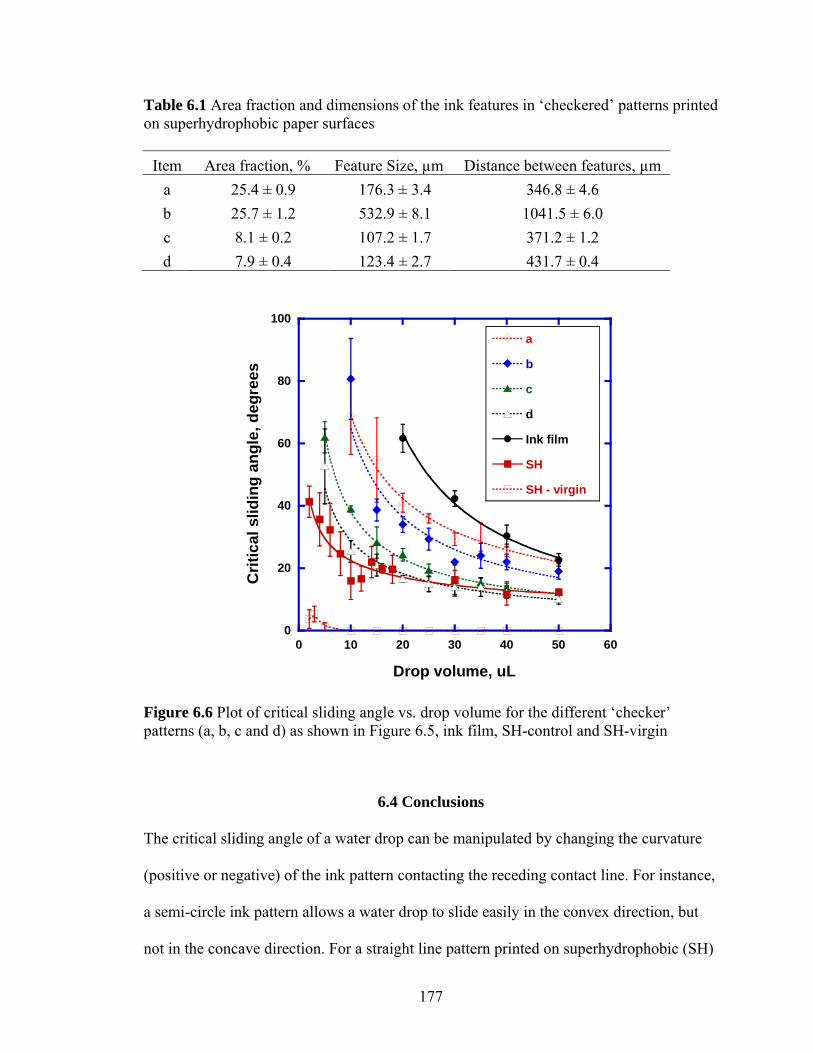
Table 6.1 Area fraction and dimensions of the ink features in ‘checkered’ patterns printed on superhydrophobic paper surfaces
Item Area fraction, % Feature Size, µm Distance between features, µm a 25.4 ± 0.9 176.3 ± 3.4 346.8 ± 4.6 b 25.7 ± 1.2 532.9 ± 8.1 1041.5 ± 6.0 c 8.1 ± 0.2 107.2 ± 1.7 371.2 ± 1.2 d 7.9 ± 0.4 123.4 ± 2.7 431.7 ± 0.4
0
20
40
60
80
100
0 10 20 30 40 50 60
a
b
c
d
Ink film
SH - control
SH - virgin
Crit
ical
slid
ing
angl
e, d
egre
es
Drop volume, uL
Figure 6.6 Plot of critical sliding angle vs. drop volume for the different ‘checker’ patterns (a, b, c and d) as shown in Figure 6.5, ink film, SH-control and SH-virgin
6.4 Conclusions
The critical sliding angle of a water drop can be manipulated by changing the curvature
(positive or negative) of the ink pattern contacting the receding contact line. For instance,
a semi-circle ink pattern allows a water drop to slide easily in the convex direction, but
not in the concave direction. For a straight line pattern printed on superhydrophobic (SH)
177
paper, the drop can move along the line more easily than in a direction perpendicular to
the line. These concepts were used in this paper to guide the design of fundamental
components for 2D microfluidic devices: flow paths, gate/diode, and junctions.
The tunability of critical sliding angle on SH paper obtained by establishing chemical
f the
hese studies have demonstrated directional mobility and tunability in the adhesion of
ty to
heterogeneity on the paper surfaces was also reported. Area fraction, ink spot sizes, and
the distance between ink spots were controlled in order to demonstrate tunability of
critical sliding angles on a composite paper surface. These structures allow control o
adhesion of drops on SH paper surfaces to permit the design of 2D drop filters for 2D
microfluidic devices.
T
water drops on superhydrophobic (SH) surfaces. Control was achieved by imposing
geometrical constraints on the contact lines by printing specific ink pattern. The abili
generate these functionalities on paper substrates using commercially available desktop
printing techniques offers considerable flexibility in designing paper-based 2D
microfluidic devices.
178
REFERENCES
1. Feng, L., S.H. Li, Y.S. Li, H.J. Li, L.J. Zhang, J. Zhai, Y.L. Song, B.Q. Liu, L. Jiang, and D.B. Zhu, Super-Hydrophobic Surfaces: From Natural to Artificial.
2. Biomimetic Nanofiber Patterns with Controlled Wettability. Soft Matter, 2008.
3. Kennedy, R.J., Directional Water-Shedding Properties of Feathers. Nature, 1970. 227(5259): p. 736-&.
4. Directional Adhesion of Superhydrophobic Butterfly Wings. Soft Matter, 2007. 3(2): p. 178-182.
5. Petal Effect: A Superhydrophobic State with High Adhesive Force. Langmuir, 2008. 24(8): p.
6. "Artificial Lotus Leaf" Prepared Using a 1945 Patent and a Commercial Textile. Langmuir, 2006. 22(14): p. 5998-6000.
7. Hierarchical Surface Structures by Combining Colloidal Self-Assembly and Au
8. ong, Superhydrophobicity on Two-Tier Rough Surfaces Fabricated by Controlled
9. Chen, W., A.Y. Fadeev, M.C. Hsieh, D. Oner, J. Youngblood, and T.J. McCarthy, Ultrahydrophobic and Ultralyophobic Surfaces: Some Comments and Examples.
Advanced Materials, 2002. 14(24): p. 1857-1860.
Wu, H., R. Zhang, Y. Sun, D.D. Lin, Z.Q. Sun, W. Pan, and P. Downs,
4(12): p. 2429-2433.
Zheng, Y.M., X.F. Gao, and L. Jiang,
Feng, L., Y. Zhang, J. Xi, Y. Zhu, N. Wang, F. Xia, and L. Jiang,
4114-4119.
Gao, L.C. and T.J. McCarthy,
Xiu, Y.H., L.B. Zhu, D.W. Hess, and C.P. Wong, Biomimetic Creation of
Sputter Deposition. Langmuir, 2006. 22(23): p. 9676-9681.
Zhu, L.B., Y.H. Xiu, J.W. Xu, P.A. Tamirisa, D.W. Hess, and C.P. W
Growth of Aligned Carbon Nanotube Arrays Coated with Fluorocarbon. Langmuir, 2005. 21(24): p. 11208-11212.
Langmuir, 1999. 15(10): p. 3395-3399.
179
10. Callies, M., Y. Chen, F. Marty, A. Pepin, and D. Quere, Microfabricated Textured Surfaces for Super-Hydrophobicity Investigations. Microelectronic engineering, 2005. 78(79): p. 100-105.
11. Lee, J.A. and T.J. McCarthy, Polymer Surface Modification: Topography Effects Leading to Extreme Wettability Behavior. Macromolecules, 2007. 40(11): p. 3965-3969.
12. Guo, Z.G. and W.M. Liu, Sticky Superhydrophobic Surface. Applied Physics Letters, 2007. 90(22): p. 223111-1 - 223111-3.
13. Hong, X., X.F. Gao, and L. Jiang, Application of Superhydrophobic Surface with High Adhesive Force in No Lost Transport of Superparamagnetic Microdroplet. Journal of the American Chemical Society, 2007. 129(6): p. 1478-1479.
14. Jin, M.H., X.J. Feng, L. Feng, T.L. Sun, J. Zhai, T.J. Li, and L. Jiang, Superhydrophobic Aligned Polystyrene Nanotube Films with High Adhesive Force. Advanced Materials, 2005. 17(16): p. 1977-1981.
15. Li, W., G.P. Fang, Y.F. Lij, and G.J. Qiao, Anisotropic Wetting Behavior Arising from Superhydrophobic Surfaces: Parallel Grooved Structure. Journal of Physical Chemistry B, 2008. 112(24): p. 7234-7243.
16. Yoshimitsu, Z., A. Nakajima, T. Watanabe, and K. Hashimoto, Effects of Surface Structure on the Hydrophobicity and Sliding Behavior of Water Droplets. Langmuir, 2002. 18(15): p. 5818-5822.
17. Liu, L.P., A.M. Jacobi, and D. Chvedov, A Surface Embossing Technique to Create Micro-Grooves on an Aluminum Fin Stock for Drainage Enhancement. Journal of Micromechanics and Microengineering, 2009. 19(3): p. 9.
18. Morita, M., T. Koga, H. Otsuka, and A. Takahara, Macroscopic-Wetting Anisotropy on the Line-Patterned Surface of Fluoroalkylsilane Monolayers. Langmuir, 2005. 21(3): p. 911-918.
19. Chung, J.Y., J.P. Youngblood, and C.M. Stafford, Anisotropic Wetting on Tunable Micro-Wrinkled Surfaces. Soft Matter, 2007. 3(9): p. 1163-1169.
180
20. Semprebon, C., G. Mistura, E. Orlandini, G. Bissacco, A. Segato, and J.M. Yeomans, Anisotropy of Water Droplets on Single Rectangular Posts. Langmuir, 2009. 25(10): p. 5619-5625.
21. Yong, X. and L.T. Zhang, Nanoscale Wetting on Groove-Patterned Surfaces. Langmuir, 2009. 25(9): p. 5045-5053.
22. Kusumaatmaja, H., R.J. Vrancken, C.W.M. Bastiaansen, and J.M. Yeomans, Anisotropic Drop Morphologies on Corrugated Surfaces. Langmuir, 2008. 24(14): p. 7299-7308.
23. Chen, Y., B. He, J.H. Lee, and N.A. Patankar, Anisotropy in the Wetting of Rough Surfaces. Journal of Colloid and Interface Science, 2005. 281(2): p. 458-464.
24. Zhang, F.X. and H.Y. Low, Anisotropic Wettability on Imprinted Hierarchical Structures. Langmuir, 2007. 23(14): p. 7793-7798.
25. Xu, Q.F., J.N. Wang, I.H. Smith, and K.D. Sanderson, Directing the Transportation of a Water Droplet on a Patterned Superhydrophobic Surface. Applied Physics Letters, 2008. 93(23): p. 3.
26. Youngblood, J.P. and T.J. McCarthy, Ultrahydrophobic Polymer Surfaces Prepared by Simultaneous Ablation of Polypropylene and Sputtering of Poly(Tetrafluoroethylene) Using Radio Frequency Plasma. Macromolecules, 1999. 32(20): p. 6800-6806.
27. Bikerman, J.J., Sliding of Drops from Surfaces of Different Roughnesses. Journal of Colloid Science, 1950. 5(4): p. 349-359.
28. Furmidge, G.C.L., Studies at Phase Interfaces I. The Sliding of Liquid Drops on Solid Surfaces and a Theory for Spray Retention. Journal of Colloid and Interface Science, 1962. 17: p. 309-324.
29. Kawasaki, K., Study of Wettability of Polymers by Sliding of Water Drop. Journal of Colloid Science, 1960. 15(5): p. 402-407.
30. Macdougall, G. and C. Ockrent, Surface Energy Relations in Liquid/Solid Systems I. The Adhesion of Liquids to Solids and a New Method of Determining the
181
182
Surface Tension of Liquids. Proceedings of the Royal Society of London Series a-Mathematical and Physical Sciences, 1942. 180(A981): p. 0151-0173.
31. Johnson Jr., R.E. and R.H. Dettre, Contact Angle Hysteresis .3. Study of an Idealized Heterogeneous Surface. Journal of Physical Chemistry, 1964. 68(7): p. 1744-1750.
32. Gao, L.C. and T.J. McCarthy, How Wenzel and Cassie Were Wrong. Langmuir, 2007. 23(7): p. 3762-3765.
33. Gao, L.C. and T.J. McCarthy, Reply To "Comment on How Wenzel and Cassie Were Wrong by Gao and Mccarthy". Langmuir, 2007. 23(26): p. 13243-13243.
CHAPTER 7
CONCLUSIONS AND RECOMMENDATIONS
7.1 Conclusions
Most of the artificial superhydrophobic surfaces that have been fabricated to date are not
formed on biodegradable, renewable, nor mechanically flexible substrates and the
substrate material is often expensive, which limits potential applications. In contrast,
cellulose is a biodegradable, renewable, flexible, inexpensive, biopolymer that is
abundantly present in nature. Although it satisfies the requirements listed above, cellulose
surfaces are not inherently superhydrophobic.
Chapter 2 reported fabrication techniques that were developed to obtain
superhydrophobicity on cellulose-based paper. The first processing step invoked domain
selective etching of the amorphous portions of the cellulose in an oxygen plasma to
‘uncover’ the crystalline cellulose microfibrils. The etched surface was then coated with a
thin fluorocarbon film deposited via plasma enhanced chemical vapor deposition using
pentafluoroethane as a precursor. Variation of plasma etch time yielded two types of
superhydrophobicity: “roll-off” (contact angle (CA): 166.7° ± 0.9° and CA hysteresis:
3.4° ± 0.1°) and “sticky” (CA: 153.4° ± 4.7° and CA hysteresis: 149.8±5.8°)
superhydrophobicity. While “sticky” superhydrophobic substrates combine a high static
water contact angle with strong droplet adhesion, “roll-off” superhydrophobic substrates
exhibit very low droplet adhesion, resulting in high droplet mobility, reminiscent of the
properties of lotus leaves. The key property required for roll-off superhydrophobicity
was nano-meter scale roughness, which was achieved by exposing the internal structure
183
of each fiber via selective etching, instead of depositing foreign material (e.g., polymers,
nanoparticles) as had been pursued in previous studies. The combination of this nano-
meter scale roughness with the inherent micro-meter scale roughness of cellulose fibers
on a paper surface resulted in robust superhydrophobic surfaces. This result was distinct
relative to roughened structures created by traditional polymer grafting, nanoparticle
deposition or other artificial means.
Chapter 3 described the methods that were established to enable tunability of the contact
angle hysteresis on superhydrophobic paper surfaces from 149.8±5.8° to 3.5±1.1°.
Continuous variations in contact angle hysteresis were achieved by controlling the nano-
structure of the fibers through the oxygen etching time. The change in wetting properties
was attributed to a transition of the liquid-surface interaction from a Wenzel state to a
Cassie state on the nano-scale, while maintaining a Cassie state on the micro-scale.
In Chapter 4, the effects of fiber types and paper making parameters on the fabrication of
superhydrophobic paper were studied. No significant difference in the formation of nano-
scale features via oxygen etching was observed for the different fiber types, which
underlined the generality of the superhydrophobicity treatment. The paper making
process controls the structure of the paper web and thus the micro-scale roughness. Paper
making parameters therefore strongly affects “sticky” superhydrophobicity, which is
dominated by the micro-scale roughness. However, because the etching process creates
similar nano-scale roughness on all fibers, all substrates tested in this thesis (from various
paper making techniques) became “roll-off” superhydrophobic. The study showed that a
184
30 minute oxygen etching process in combination with a 2 minute PFE deposition yields
the optimum roughness and film thickness (~100nm) for roll-off superhydrophobic paper
surfaces with good physical properties. The significance of water drop volume in contact
angle measurements was also discussed, which is particularly relevant for the
characterization and analysis of superhydrophobic behavior of heterogeneous, porous
substrates like paper. It was concluded that while measuring the CA values on
heterogeneous, porous substrates like paper, it is important to select drop sizes that 1) are
larger than the surface roughness length scales and 2) provide sufficient image resolution
for the goniometer to identify the three-phase contact line.
Chapter 5 described a method to pattern superhydrophobic surfaces with high surface
energy black ink by using commercially available desktop printing technology. The shape
and size of the ink islands control the adhesive forces between the surface and water
drops in two directions, parallel (‘drag-adhesion’) and perpendicular (‘extensional-
adhesion’) to the substrate. Experimental data on the adhesive forces showed good
agreement with classical models for ‘drag’ (Furmidge equation) and ‘extensional’
adhesion (modified Dupré equation). The tunability of the two adhesive forces was used
to design basic patterns that can be used to perform four basic unit operations for the
manipulation of liquid drops on the paper substrates: storage, transfer, mixing and
sampling. By combining these basic functionalities, it is possible to design simple two-
dimensional lab-on-paper (LOP) devices. In this 2D LOP prototype, liquid droplets
adhere to the porous substrate rather than absorbing into the paper; as a result, liquid
185
droplets remain accessible for further quantitative testing and analysis, after performing
simple qualitative on-chip testing.
Chapter 6 discussed in detail how directional mobility and controlled adhesion of water
drops can be obtained on superhydrophobic paper by creating more complex ink patterns.
By changing the curvature/shapes of the ink patterns, anisotropic geometrical constraints
can be imposed on the movement of the three-phase liquid/solid/vapor contact line.
Through careful pattern design, the critical sliding angle of water drops was manipulated
with respect to sliding direction. The adhesion of water drops on superhydrophobic paper
was controlled by designing chemical heterogeneity in the form of “checkered” ink
patterns. Printing ink patterns with varying area fractions and feature sizes resulted in
variable critical sliding angles of water drops. Directional mobility and tunable adhesion
of water drops on superhydrophobic paper surfaces can be applied to design novel
components for emerging two-dimensional LOP technology, such as 2D flow paths,
gates/diodes, junctions and drop size filters. Finally, the use of commercially available
desktop printers and word processing software to generate ink patterns enable end-user
design of LOP devices for user-specific applications, which adds significant flexibility to
this technology.
186
7.2 Recommendations
This thesis project identified interesting questions and directions that are recommended
for future research in this field.
Superhydrophobicity or water repellency on paper surfaces has been extensively
discussed in this thesis. Water is a strongly hydrogen bonded system with high cohesive
forces, resulting in a surface tension of ~73 mN/m. The high cohesive forces inhibit water
penetration into the nano-scale features that are coated with a low surface energy coating,
and thus give rise to superhydrophobicity of the modified substrate. Non-polar liquids
have surface tensions that are much lower than those for water. Because of the weaker
cohesive forces, these liquids can more easily penetrate into the nano- and micro-scale
structures that are coated with fluorocarbon layers. As a result, it is challenging to design
a surface chemistry and roughness topography that yield roll-off behavior for non-polar
liquids. Repellency to non-polar liquids, which has been dubbed superoleophobicity, is an
emerging field. Recently, it has been reported that the angle at which the liquid enters a
geometrical feature, referred to as ‘re-entrant angle’, determines to a great extent the
penetration ability of the liquid [1]. Therefore designing appropriate re-entrant angles on
the roughened nano-scale features should be a viable strategy to render a surface
superoleophobic [1]. Methods to impart controlled re-entrant angles on the nano-scale
features on cellulose surfaces should be devised and the resulting superoleophobic
behavior determined. Superoleophobic paper surfaces would have significant application
in the food packaging industry.
187
Chapters 5 and 6 described the operating principles and functionalities that have been
designed to create LOP microfluidic devices. Nevertheless, we have not presented a
bench-scale prototype of a functional LOP microfluidic device. Further research should
be performed to design and fabricate a prototype LOP device by combining the
fundamental building blocks described in this thesis work. Use of ink chemistries
containing indicators and analyte molecules should further enhance the functionality of
LOP devices, but this requires development of the appropriate printing technology, which
was beyond the scope of the current thesis.
188
189
REFERENCES
1. Tuteja, A., W. Choi, M.L. Ma, J.M. Mabry, S.A. Mazzella, G.C. Rutledge, G.H. McKinley, and R.E. Cohen, Designing Superoleophobic Surfaces. Science, 2007. 318(5856): p. 1618-1622.
VITA
Balamurali Balu was born in Kanchipuram, a suburb of Chennai in 1981. After schooling
in St. Joseph’s Higher Secondary School (Chengalpet) he attended Coimbatore Institute
of Technology, where he obtained his B.Tech degree in Chemical engineering in 2002.
After finishing his B.Tech degree he worked in Infosys Technologies (Bangalore) as a
Software Engineer. He came to the US in 2003 to pursue a M.S. degree in Environmental
Engineering at University of Wyoming. After finishing his M.S. degree, he joined the
School of ChBE at Georgia Tech in 2005 to pursue his doctoral research specializing in
surface modification of cellulose via plasma processing, under the supervision of Dr.
Dennis W. Hess and Dr. Victor Breedveld. Apart from research he enjoys writing music
and playing a variety of musical instruments.
190