Plasma and Laser Technology - JuSER
428
FORSCHUNGSZENTRUM JÜUCH GmbH lind workshop on Plasma and Laser Technology Cairo February 21-28, 1990 Edited by E. Hintz --
-
Upload
khangminh22 -
Category
Documents
-
view
0 -
download
0
Transcript of Plasma and Laser Technology - JuSER
FORSCHUNGSZENTRUM JÜUCH GmbH
lind workshop on
Plasma and
Laser Technology
Cairo February 21-28, 1990
Edited by E. Hintz
-----~-------

Bilateral Seminars of the International Bureau Volume2

Forschungszentrum Jülich GmbH Bilateral Seminars of the International Bureau
Second Workshop on
PLASMA AND LASER TECHNOLOGY
Cairo February 21-28, 1990
Editor: E. Hintz, Institut für Plasmaphysik
Lecture Notes Presented at the Seminar on Bilateral Cooperation between
Institut für Plasmaphysik, Forschungszentrum Jülich GmbH,
Laboratory of Laser Physics and Applications, Physics Department, Cairo University and
Plasma Physics Department, Atomic Energy Authority
Herausgeber und Vertrieb:
Druck:
Copyright:
Forschungszentrum Jülich GmbH ZENTRALBIBLIOTHEK Postfach 1913 . D-5170 Jülich Telefon (02461) 61-5368 . Telefax (02461) 61-6103
Wilhelm Dostall KG, Eschweiler
Forschungszentrum Jülich 1990
Bilateral Seminars of the International Bureau, Volume 2
ISSN 0938-7668
ISBN 3-89336-050-6
Preface
Bilateral seminars have proven to be a very useful instrument in
implementing bilateral cooperation. This general observation has also been
confirmed by the success of the first German-Egyptian uWorkshop on Pl asma
and Laser Technologi' at Cairo in February 1987. The lectures given at
that workshop were mafnly devoted to the presentation of the basic
principH~s of lasers and of their applications in science and technology.
From discussions between Egyptian and German sc1entists in the fOl10wing
years the conclusion was drawn that it would be appropriate to organize a
second workshop on plasma and laser technolo.gy with the main emphasis on
topics which are of special interest for current research in Egypt.
Accordingly the lectures were chosen with the aim to present princi ples J experimental methods J latest results and future perspectives of selected
topics in the fields of
plasma generation (in particular in regard to applications)J
plasma diagnostics.
The second workshop is also strongly influenced by the fact that this time
the Plasma Physics oepartment of the Atomic Energy Authority participated
in its planning J organization and support.
Afternoon sessions were mainly devoted to contributed papers by scientists
from Egyptian laboratories. These papers will be published in a second
volume.
Visits of laboratories and informal discussions of recent results and of
open questions were an important part of the workshop. Although the
results of these discussions cannot be documented J there was the general
conclusion that more weight should be given to them in future workshops.
JUlieh, August 10, 1990 E. Hi ntz

Directors of the worksnop:
Organizing Committee:
Lecturers:
• 3 .
Prof. Dr. E. Hintz Institute of Plasma Physics Forschungszentrum JUlich GMBH, FRG
Prof. Dr. M. El Nadi Laboratory of Laser Physics and Applications, Cairo University, Egypt
Dr. A.A. Gabr, Prof. M.A. Harith, Dr. Z.M. Hassan (AEA), Dr. L.Z. Ismail, Prof. T. El Khalafawy (AEA), Dr. S.M. Khalil (AEA) , Prof. M. El-Khishin, Prof. M. Masoud (AEA), Dr. S. Montasser, Prof. A. El Nadi, Prof. L. El Nadi, Dr. Y.M. El-Said (AEA)
P. Bogen, Institute of Plasmaphysics Association EURATOM-KFA Forschungszentrum JUlich GmbH, FRG
H.F. Döbele, Physics Department Essen University, FRG
A. El Nadi, Electronic Department Faculty of Engineering, Cairo University
L. El Nadi, Electronic Department Faculty of Engineering, Cairo University
G. Ecker, Institute of Theoretical Physics RUhr-University Bochum, FRG
E. Hintz, Institute of Plasma Physics Association EURATOM-KFA Forschungszentrum JUlich GMBH, FRG
H.J. Kunze, Institute of Experimental Physics Ruhr-University Bochum, FRG
J. Salge, Institute of High Voltage Engineering, Technical University Braunschweig, FRG
H. SchlUter, Institute of Experimental Physics, RUhr-University Bochum, FRG
J. Uhlenbusch, Institute of Laser and Plasma Physics, Heinrich-Heine-University DUsseldorf, FRG
J. Winter, Institute of Plasma Physics Association EURATOM-KFA Forschungszentrum JUlich, FRG
- 4 -
CONTENTS
X-ray spectroscopy. x-ray lasers and high intensity x-ray sources
!H.-J. Kunze)
1.
1.1
1.2
1.3 1.4
1.5 1.6
2.
2.1
2.2 2.3 2.3.1 2_3.2
2.3.3 2.3.4 2.3.5 2.4
3.
3.1 3.2
3.3
3.4
X-ray spectroscopy - line radiation
Introduction Charge state distribution Spectral line intensities Hydrogenlike ions Hel\umlike ions Line profiles References
X-ray lasers General considerations Non-plasma systems Plasma-based systems Specific problems Photoexcitation pumping Collisional pumping Recombination lasers Pulsed capillary discharges Multilayer x-ray mirrors
References
point-like high-intensity x-ray sources X-ray emission fram hot dense plasmas
Plasma sources Radiative collapse model The low-inductance vacuum spark
References
14
15 15 15 18
20 22 25 25
27 27
29 30 30
30
31 32 35 37
38
41 41 43
45 48
51
- 5 -
Continuous emission of plasma in the soft X-ray region (P _ Bogen)
LI
1.2 1.3
1.4
1.5
2_
2_1
2_2
2_3
3_
3_1
3_2
3_3
3_4
3_5
Introduction
Free-bound continuum Free-free and free-bound continuum
Examples Electron temperature measurement with absorption filters
Experimental set-up for soft X-rays
Foeussing of soft X-rays
Speetrometer for soft X-rays
X-Radiation detectors
Sliding sparks
Introduction
Sliding spark type 1
Sl iding spark type 2
Experimental arrangement Evaluation of the measurements
53
54 55
57
58
59
60
60
62 66
70
70
71
71 72 72
Appendix 1: Sliding spark over solid xenon as light souree for 85
production of plasma by photoionizat1on of gases
laser light seattering
(J_ Uhlenbusch)
1.
2_
2_1
2_2
2_3
Introduction
light scattering from a single electron
Radiation field of an accelerated eleetron
The radiated power
Radiation from a single electron exposed to the field of an
electromagnetic wave
89
90
90
90 92
93
3.
3.1 3.2
3.3
3.4
3.5
3.6 3.7
4. 4.1
4.1.1
4.1. 2
4.1.3
4.2
4.2.1
4.2.2 4.2.3
4.2.4
4.2.5 4.2.6
4.3 4.4
4.4.1
4.4.2 4.4.3
4.5
5.
6.
- 6 -
Light scattering fram an electron ensemble Introductory remarks Scatter cross section for an electron ensemble The dynamic form factor S ea1eu1ation of the dynamie form faetor Seattering from drifting e1eetrons and ions
Seatter profiles from magnetized plasmas
Scatter profiles from contaminated plasmas Relativistic effects
Varfous scatter experiments - a survey General aspects for planning a scatter experiment Seatter set-up and deteetion of seattered light
Optima1ization of the signal to noise ratio Calibration and interpretation of the scattered signals S1ngle-shot-experiments with a ruby laser
Introduction
Experimental set-up Absolute calibration of the detection system by means of pure rotationa1 Raman seattering of H2 and D2 Estimation of photon statistics and of the expected current
signals Evaluation of scattering signals and results
Addendum Experiments with repetitive1y pu1sed laser systems Far-infrared-scattering experiment at thermal density
fluctuations General considerations Detectian optics Signal to naise-ratio Collective scattering from suprathermal density fluctuatians
Conclusion and perspectives
Aeknow1edgements
96 96
97
98 103 104
107 109
111
111 112 114 115 116 116 116 119
121
122
124 125 130
130
133
135 137
142
143
- 7 -
7. Li terature
Laser-induced fl uorescence
(H.F. Döbele)
1. Princ; ples
2. Signal-ta-noise ratios
3. Pump radiation sources
4. Applications of LiF
5. Multiphoton excitation
Microwave diagnostics (H. SchlUter)
1.
2.
3.
4.
5.
6.
Introduct1on
Fundamental S of wave propagation in the absence of static
magnetic fields
Microwave interferometry
Resonator methods
Extension to the ca se Bo # 0
Survey of complementary methods
144
145
146
157
159
162
167
172
173
173
177
188
189
191
- B -
Hass spectroscopy (J. Winter)
1.
1.1 1.2
1.3
2.
2.1
2.2
2.3
3.
4. 4.1
4.2
The mass spectrorneter Ion formatlon
Mass separation
Ion detectlon
Residual gas analysis Sensitivity. effects in the ion source Application of residual gas analysis during conditioning of
tokamak wall s
Determination of the deposition rate during thin film formation
Measurements in "line of sight" geometry
Direct measurement of plasma ions The problem of the aperture
Energy selectfve plasma mass spectroscopy
The De cold cathodeglow discharge
(E. Hintz)
1. 1.1
2.
2.1
2.1.1
2.1.2 2.2
2.2.1
2.2.2
Introduction
General characterization of dc glow discharges
Collision processes and transport phenomena Cross-sections
Elastic colllsions
Inelastic col1isions Transport phenomena
Mobil ity of electrons and ions
Diffusion
194
195
195
198
198
199
199
202
203
204
205
205
209
213
214
215
218
218
219
221
222
222
223
• 9 .
2.2.3 The average energy of the electrons
2.2.4 The Townsend ionization coefficient
3. The dc-cold cathode glow discharge
3.1 The Townsend discharge 3.2 Similarity laws
3.3 General characterizatfon of the glow discharge
3.4 Theoretical models and estimates
3.4.1 A simplified model of the abnormal cathode fall
3.4.2 Numerical models of the cathode fall
3.5 The negative glow
Microwave dfscharges (H. Schluter)
1. Introduction
2. Breakdown
3. Steady-state discharges
4. Modelli~g of diffusion controlled discharges
5. Classification of arrangements for plasma generation
6. Surface wave discharges
High pressure glow disch.rges
(J. S.lge)
1.
1.1
Types of discharges .nd oper.tion conditions Oisch.rges between point .nd pl.ne electrodes
224
225
226 226 229 230 232 232 234
237
252
253
245
256
257
260
264
267
270
270
- 10 -
1.2 Dielectric-barrier discharges
1.3 Preionized discharges
2. Applications
2.1 Dzone generation 2.2 UV-radiation
2.3 Surface treatment
2.4 Electrostatic precipitation
2.5 Gas 1 aser
The pseudo spark-switch - a ßIldern plasma application
(G. Ecker)
1. Plasma technology and switch gear
2. Typical discharges of gaseaus electronics
3. Characteristica of the pseudo spark
4. Operation and data of the pseudo spark discharge
5. Advantages and bench marks
6. Analysis and fnterpretatfon of the PSS so far
7. Criticism and characterization of the predischarge
8. Criticism and characterfzatfon of the mafn dfscharge
274 277
278 278 282
284 284 286
292
293
294
296
302
302
309
316
318
- ------------------------
- 11 -
Laser-plasma-interaction (J. Uhlenbusch)
1.
2.
2.1
2.2
3.
4. 4.1
4.2 4.3
4.4
5.
5.1 5.2 5_2.1
5.2.2 5_2.3
5.3
5.4 5.4.1
5.4.2
5.4.3
6.
Introduction
Ignftion of an optical discharge Multiphoton ionization Cascade breakdown
Continous optical discharges (COO)
Pulsed optical discharges (POO) Q-switched CO2 laser system Spectroscopic set-up Asymmetry of Hß Electron temperature and 'density
Laser-induced surface plasma Introduct~ry remarks Experimental setup Q-switching with a mechanical chopper wheel Cutting and welding device Beam deflection technique Oeflectfon angle and electron densfty distributfon Experimental results Cutting Welding Electron density
References
322
323
323
324
324
327
329 329
329
331 334
334
334
336 336
336
338 339
341
341
343 343 .
347
- 12 -
Developments in plasma ,focus research (J_ 5alge)
1.
1.1
1.2
1.3
2.
2.1
2.2
2.3
2.4
3. 3.1
3.2
Introduction
Principle of operation
Ignition phase
Running down phase
Focus phase
Characteristic properties Operation conditions Plasma properties Particle beams and radiation Neutron emission
Possible applications
Neutron source
X-ray radiation
Ion sputtering of materials
(H.F. Döbele)
1. Phenomena
2. Applications of sputtering
3. Characteristic sputter1ng regimes
4. Detection techniques
349
350
351
352
353
355
356
356
357
357
358
359
359
361
367
368
368
370
383
- 13 -
Plasma assisted deposition of thin films (discussed at the example of 388 a-C:H) (J. Ninter)
1.
2.
2.1 2.2
2.3
3.
4. 4.1 4.2 4.3 4.4 4.5 4.6
Introduction
Deposition of hard amorphous carban films a-C:H
General review of the deposition processes
RF discharges
Large area deposition of a-C:H films in fusion deviees by rfassisted dc glow discharges
Observations during film deposition
Properties of a-C:H TransparencYJ refract1ve jndex
Film eomposition and thermal stability Physical structure Chemieal bonding Hypothetieal model of the a-C:H strueture Adhesion to the substrate
389
391 392 394 397
399
403
403 404 408 409 411 413
- 14 -
X-Ray Spectroscopy, X-Ray Lasers and
High Intensity X-Ray Sources
H.-]. Kunze
Institute of Experimental Physics
Ruhr-University Bochum, FRa

- 15 -
1_ X-Ray Spec:trosc:opy - Line Ra.dia.tion
LI Introduetlon
Atom1c species of hot plasmas - whether present either as undeslr
able Impuritles or added deHberately for dlagnostic purposes or constl
tuting the bulk plasma in other cases - have been ionJzed to high 10ni
zatlon stages. Since transition energies seale wJth Z 2 I where Z is the
charge of the ion, the emltted Une radiation shifts to the x-ray spectral
region.
Spectroscoplc investlgations of hot plasmas may be carried out for
different reasons:
- to study the atomlc structure of highly ionized atoms In the plasma;
- to study the influence of a specific well-known plasma state on the
structure of atoms and ions and on the emission of radiation;
- to study the influence of highly lonlzed atoms on the plasma Itself;
- to use radIation of the ions for diagnosties;
- to assess radiatIon losses.
In thls lecture we shall foeus the dlseussion essentlally on the dlag
nostle aspects. Spectrometers and deteetors for the x-ray region have
been discussed already by Bogen in the preeeding leeture [1.1]. General
prlnclples of x-ray speetroscoplc methods as well as the relevant atomlc
physlcs may be found In Refs_[1.2]-[1.S]. Hot plasmas In the laboratory
cover typlcally a range from about 100 eV to 10keV in electron tempera
ture, .nd the electran denslties are fram several tlmes 10 12 cm- 3 In toka
mak plasmas· to higher than 10 25 cm- 3 in Iaser-compressed plasmas.
1.2 Charge "tate distribution
In any plasma. the density nz of an atomic species in the lonizatlon
stage of charge Z Is glven by the equation of contlnulty
+ ( 1.1)
-> where r z 18 the flux density and Qz ls a sOUrce term representing changes
- 16 -
of the density by lonlzation and recomhination. In 15teady-state plasmas
(for example, In tokamak plasmas) diffusion and convectlon determine ->
the f1ux density r i in compression experiments, on the other hand, the z ->
rapid compresslon It.elf glves rz .
The source terms Qz conslsting of ionizatlon and recomblnation couple
the contlnulty equatlons of all lonlzatlon stages Z, and Eq. (1.1) may be
written:
Sz 15 the effective rate coefficlent for io~zat1on and CXz: that for. recom
blnatlon. When transport Is negllgible (\7. rz = 0), the set of rate equatlons
can be solved readily for a plasma whose plasma conclltlons are known
provlded that alt rate coefficients are also known. In general, however,
thls Is not the case because electron processes causlng transitions between
exclted levels have to be taken into aCCQunt as weIl as excltation from
and recombinatlon into those levels. Radiation trapping may introduce
further complicatIons.
The coJ/lsional-radlatjye model (eR model ), first developed for hy
drogen and hydrogenlike Ions by Bates, KIngston and McWhlrter [1.6), re
duces the infinite number of processes to the dominant ones and lumps
together all individual processes Into composlte rate coefflclents for
ionlzation and recomblnatlon, whJch are functions of density and tempera
ture. They are calle<J collisional-radiatlve coefficlents SCR and «eR, res
pectlvely ( see Ref. [1.7) ).
At low electron densitles ( known as the corans} regjme ), radiative
transitions are dominant, population ~ensitjes of excited levels remain
low, and rate coefficlents for ionization Sz and recomhination «z become
Independent of the electron denslty: they are determlned solely by the
properties of the specific Ion and the electron velocJty distrIbution func
tlon. Useful formulae may be found, for example, In Refs. [1.2] - [1.5],
[1.7] - [1.11]. Ionlzatlon occurs only from the ground state (to some
extent perhaps also from a metastable level), dlelectronlc recomblnatlon
dominates at hIghe:r temperatures and radiatlve recombinatlon at lower
- 17 -
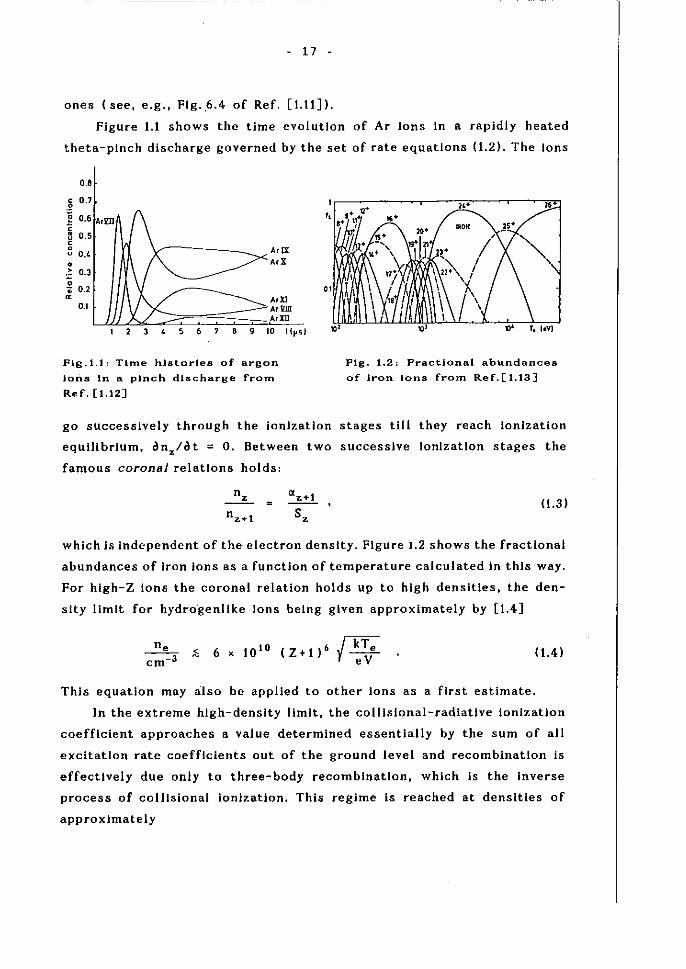
ones (see, e.g., Flg.6.4 of Ref. [1.1\]),
Figure 1.1 shows the time evolution of Ar ions in a rapidly heated
theta-plnch dis charge governed by the set of rate equatlons (1.2). The Ions
0.'
.~ 0.7
~ 0.6 AriD -0 3 0.5 < o u 0.1.
• ~ 0.3 o -.; 0.2 ~
A.tI. MX
A,XI
0.1 lJ!l~4-~::::~--;=!=~~~'~'~I!I11~ .,IQ 2 3 , 5 6 7 8 9 10 11"51
FIg.1.t: Time hJstorles of argon
Ions In a plnch dis charge from
Ref. [1.12]
Pig. 1.2; Fractlonal abundances
of Iran Ions from Ref.[1.13]
go sllccessively through the ionlzatlon stages tUt they reach ionlzation
equilibrium, onz/o t = O. Between two successlve lonlzatlon stages the
famous coronal relations holds:
C(z+l
Sz 0.3 )
which is independent of the electron density. Figure 1.2 shows the fractlonal
abundances of iron ions as a function of temperature calculated In thls way.
For high-Z Ions the coronal relation holds up to high densiUes, the den
sity limit for hydro'genlike Ions belng glven approximately by [1.4]
6 x 10'0 (Z+I)6 / kTe eV
This equation mayaiso be applied to other ions as a first estimate.
0.4)
In the extreme hlgh-density limit, the collislonal-radiatlve ionlzation
coefflcient approaches a value determlned essentially by the sum of all
excitatlon rate coefficients out of the ground level and recombination Is
effectlvely due only to three-body recomblnatlon, whlch Is the inverse
process of colHsional ionlzation. This regime 15 reached at denslties of
approximately
- 18 -
I x 1017
C Z + I) 6 I ~~e . C I.S )
In steady state, the fractlonal abundances of the Ions are given hy the
Saha equatlon [1.14], l.e. they are also density dependent. Soth limits In
dicate that laser-produced plasmas usually ocCUr between and Ions of
tokamak plasmas are definitely In the coronal regime.
1.3 S pectral lIne Inten.IUes
The emission coefflclent E of a spectral Une between levels p and q
Is glven by
(1. 6)
where ACp" q) is the transition probabillty, hVpq Is the energy of the
emltted photons, and n.Cp) Is the population denslty of the upper level
( see Ref. [1.14 J. page 73), Quite a number of proeesses ean influenee the
density nz (p); for the upper levels of many strang transitions of the Ions
In hot plasmas, however. an extended coronaJ approximation 15 an adequate
slmpllfleatlon. Population oeeurs by eleetron eollisional exeltatlon from
the ground state (g) and from a metastable level Cm) as weil as by reeom
blnatlon; depopulation Is by spontaneous radlative deeay to lower levels.
The equatlon for n.(p) thus ean be written:
=
(1. 7)
where ACp") = :E ACp"rl, and X. and "z are rate eoeffielents for excl-r<p
tat ion and recombin"atlon, respectively. Cascacling contributlons can be
Jnclucled in these rate cocfflclents. Consideration of the time constants
assoclated wlth the various rates Justlfles a quasi-steady state approxi
mation, i. e. dnz{p) / dt = O.
The emission eoefflelent ean now be wrltten:
hVpq
4n AC p ~ q) ACp" )
- 19 -
Rate coefflcJents I whlch are a fUllction of the temperature, may be taken
from the lIterature, e.g. [1.2] - [1.4]. [1.8], [1.10].
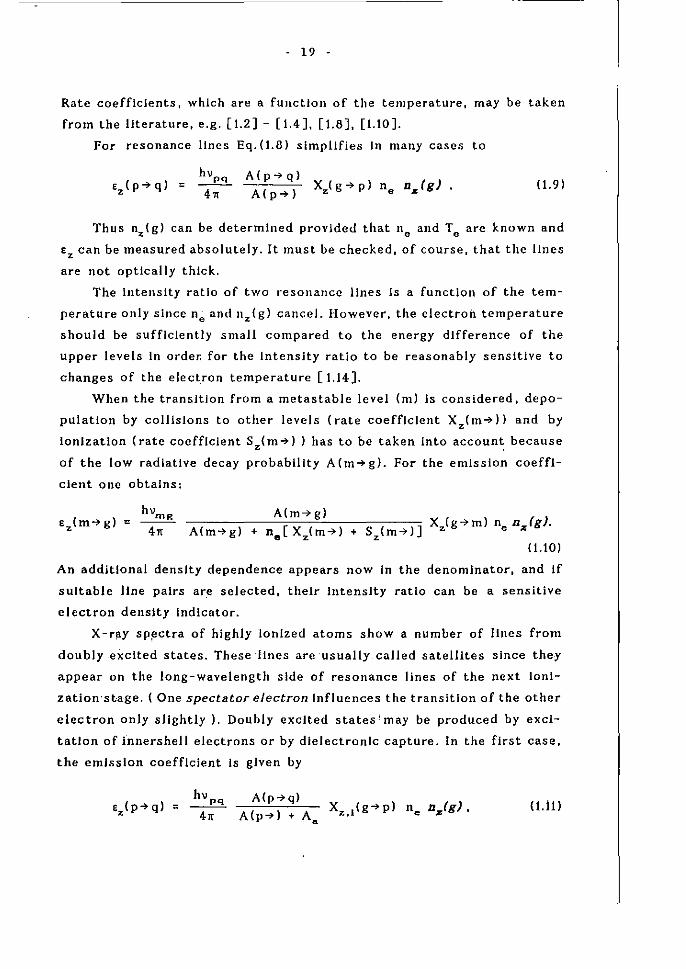
Far resonance Hncs Eq.(1.B) simpllfies In many eases to
A(p->q)
A(p-> ) (1. 9)
Thus nz(g) can be determlned provided that ne and Te are known and
Ez can be measured absolutely. It must be checked, of course, that the IInes
are not optlcally thlck.
Thc Intensity ratio of tWQ resonancc Unes 15 a function of the tem
perature only since ne and Il:.l;{g) cance!. However, the electron temperature
should be sufflclently small compared to the energy dlfference of the
upper levels In order. far the Intenslty ratio to be reasonably sensitive to
changes of the electron temperature [1.14].
When the transItIon from a metastable level (m) Is consldered, depo
pulation by collislons to other levels (rate coefficlent Xz(m-,») and by
lonlzatlon (rate coefflclent S (m-» ) has to be taken Into account because z .
of the low radlatlve decay probabIlIty A(m->gl. For the emissIon coeffl-
clent one abtalns:
A(m->g) -A:-:-( m-.. -g---:-) -+-n---'-c[~x:-;-( "'m'--.. ---:-) -+----:S:-;(-m-.. -:)""] X z ( g .. m) ne n % ( gJ.
e z z (1.10)
An additional denslty dependence appears now In the denomInator, and If
sultabJe Hne pairs ar.e selected. the1r lntenslty ratio can be a sensitive
electron denslty Indlcator.
X-ray sp~ctra of highly lonlzed atoms show a number of !ines from
doublyexclted states. These 'IInes areusually called satellltes slnce they
appear on the long-wavelength slde of resonance Iines of the next lonl
zation'stage. ( One spectator eJectron Influences the transition of the other
electron only sIJghtly ). Doubly exclted states' may be produced by excl
tation of lnnershell electrons or by dielectronlc capture. In the first case,
the emIssion coefflcient Is glven by
= h\J pq A(p"q) ( 1.11)
4"
- 20 -
and in the latter by
= hV pq
4" A(p~) + A.
A(p~q) (1.12)
XZ •1
is the rate coefficient for collislonal excitatlon of an innershell
electron, C(z+l,d 15 the rate coefflcient .for dlelectronic capture, and Ae the probabIlIty of radlationless autolonlzatlon.
One comrnent should be added here. In tokamak plasmas. where low
temperature neutral hydrogen atoms are present in the plasma perlphery
and energetic hydrogen atoms are injected for plasma healing, charge
exchange influenees the population denslties of higher levels and even
modifies the lonizatlon equilibrium. Estimates indicate that charge ex
change becomes a competitive recombination process when the neutral
hydrogen density Is
O-s nH ~ 1 ne . (1.13)
Because of the large cross seetIons. however, it 18 very likely that charge
exchange also plays a slgniflcant role in many cases not yet investlgated.
We now apply Eq. (1.8) to seleeted simple atomie systems to Illus
trate spectroscopic possibilitJes.
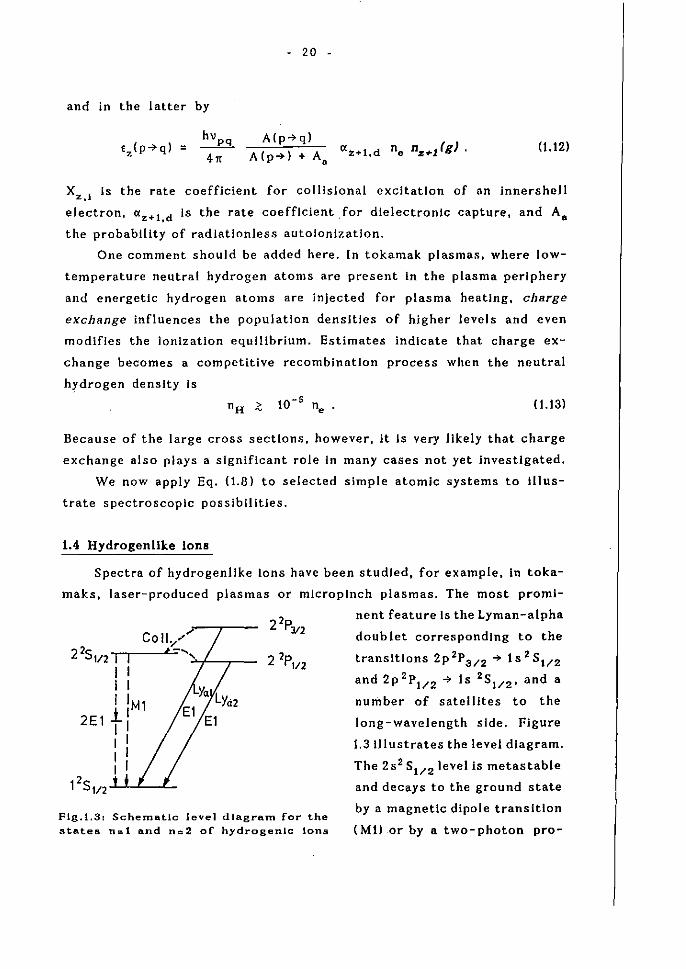
1.4 Hydrogenllke Ions
Speetra of hydrogenllke Ions have been studled. for example. In toka
maks, laser-produced plasmas or mlcroplnch plasmas. The most promi
nent feature Is the Lyman-alpha
ColI,./' 2 2S 1/2 I • --":""'--r--
I I I I IM1
2E1 +: I I I I I I
Fig.1.3: Schernatlc level dlagra.m for the stfttes h= 1 and n=2 of hydrogenie ions
doublet eorrespondlng to the
transitions 2p 2P3/2 -7 1 s 2 5 1/ 2
and 2p 2pl/2 ~ ts 2S1/2' and a
number of satellites to the
long-wavelength slde. Figure
1.3111ustrates the level diagram.
The 2s2 Sl/2 level is metastable
and deeays to the ground state
by a magnetie dipole transition
(Mt) or by a two-photon pro-
- 21 -
.eess (2 EI). For small Z the two-photon deeay Is more Important than the
magnelie dipole transition, but the transition probability of the latter
deeay Inereases rapidly along the Isoeleetronle sequenee (A ~ ZIO) [1.15).
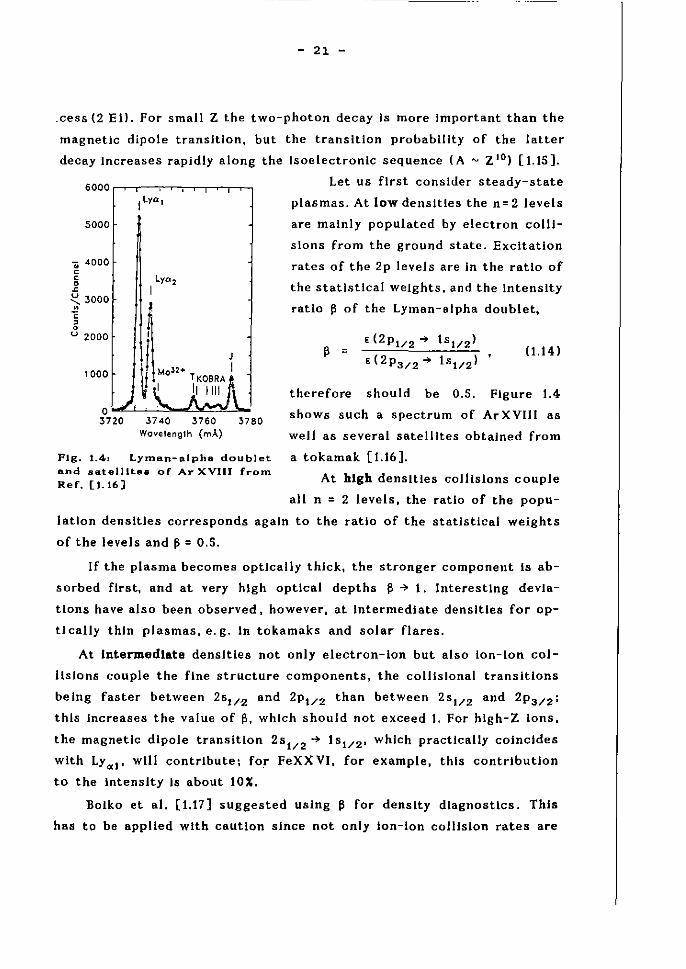
6000 ro-,-,-" ~,-,-r~",-, I Lyol
5000
Gi 4000 c c o .c ~ 3000 " " , o u 2000
1000
0../ 3720 3740 3760 ~780
Wovelenglh (mA)
Let us first eonslder steady-state
plasmas. At low densltles the n= 2 levels
are malnly populated by electron coill
sians from the ground state. Excitatlon
rates of the 2p levels are In the ratio of
the statlstleal welghts, and the Intenslty
ratio ß of the Lyman-alpha doublet,
ß = ,(2P'/2 -> 1s , /2)
,( 2p3/2 -> Is1/2' 0.14)
therefore should be 0.5. Flgure 1.4
shows such a spectrum of Ar XVIII as
weil as several satell1tes obtaJned from
Flg. 1.4: LYl'11an-alpha doublet a tokamak [1.16]. and sBt.ellltes of Ar XVIII from Ref. [1.'6] At high densltles collislons couple
all n = 2 levels, the ratio of the popu
lation densltles corresponds again to the ratio of the statlstical weights
of the levels and ß = 0.5.
If the plasma becomes optlcally thlck, the stronger eomponent Is ab
sorbed first, and at very high optical depths ß -> 1. Interestlng devla
tlons have also been ohserved. however, at Intermediate denslties for op
t1cally thln plasmas, e. g. In tokamaks and solar flares.
At Intermediate densltles not only electron-Ion but also Ion-Ion eol
llslons couple the fine structure components, the collislonal transitions
belng faster between 2sl/2 and 2pt/2 than between 2s'/ 2 and 2P3/2;
thls Inereases the value of ß, whleh should not exeeed I. For hlgh-Z Ions,
the magnetle dipole transition 2s1/2 -> IS'/2' whleh praetleally eolneldes
wlth Ly «', will eontrlbute; for FeXX VI, for example, thls eontrlbutlon
to the Intenslty Is about 10:\:.
Bolko et al. [1.17] suggested uslng ß for denslty dlagnostles. Thls
has to be applied wlth eautlon slnee not only Ion-Ion eollision rates are
- 22 -
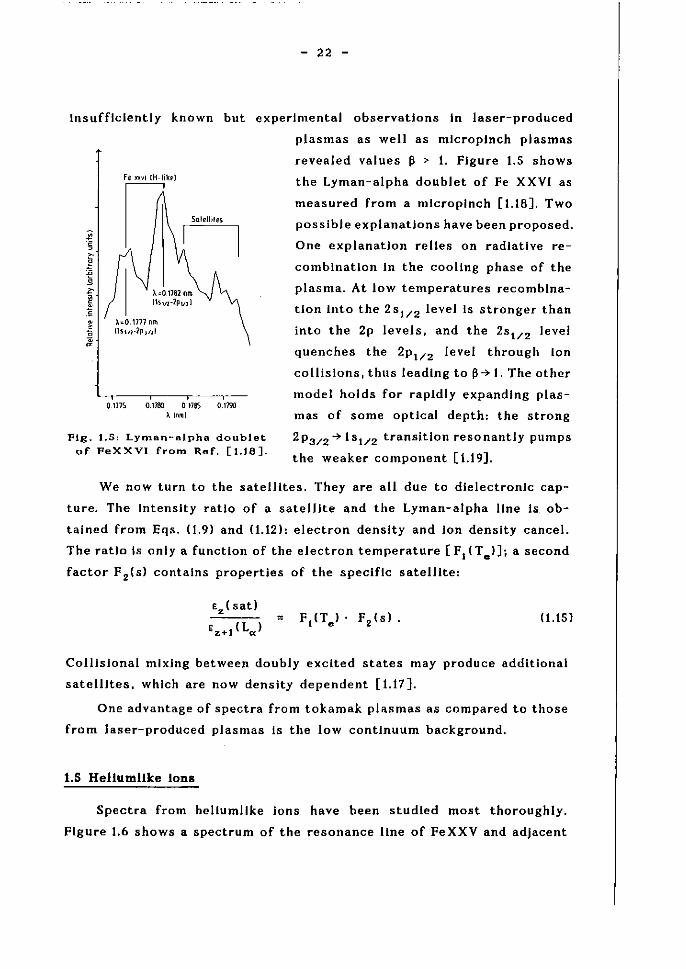
Insufflclently known but experimental observations In laser-produced
plasmas as weH as mlcroplnch plasmas
revealed values ß > I. Flgure I.S shows Fe n'/l [H-lik~J
I ~ ,1,,,,0.1177 nm [h'n-2P}/11
0.1175 0_1180 0178S 0.r19O ,I, Inm)
Fig. 1.5: Lyman-Blpha doublet of FeXXVI from Ref. [1.18].
the Lyman-alpha doublet of Fe XXVI as
measured from a mlcroplnch [1.18]. Two
possible explanatlons have been proposed.
One explanation relles on radlative re
comblnatlon in the coollng phase of the
plasma. At low temperatures recomblna
Uon into the 251/ 2 level 15 stronger than
into the 2p levels, and the 2s'/2 level
quenches the 2P'/2 level through Ion
collislons, thus leadlng to ß-? I. The ather
model holds for rapldly expandlng plas
mas of same optlcal depth: the strang
2P3/2~ 18 1/ 2 transition resonantly pumps
the weaker component [1.19].
We now turn to the satellItes. They are all due to dlelectronlc cap
ture. The Intenslty ratio of a sateillte and the Lyman-alpha IIne Is. ab
tained from Eqs. (1.9) and (1.12): electron denslty and Ion density cancel.
The ratJo 18 only a funetion of the eJectron temperature [FI(Te )]; a second
factor F 2 (s) contalns properties of the speclflc satel11te:
= (I.IS)
Collisional mlxing hetween doubly excited states may produce additional
satellites. whlch are now denslty dependent [1.17].
One advantage of spectra from tokamak plasmas as compared to those
from laser-produced plasmas is the low continuum background.
1.5 Hellumllke Ions
Spectra from hellumllke Ions have been studled most thoroughly.
Flgure 1.6 shows a spectrum of the resonance Ilne of FeXXV and adjacent
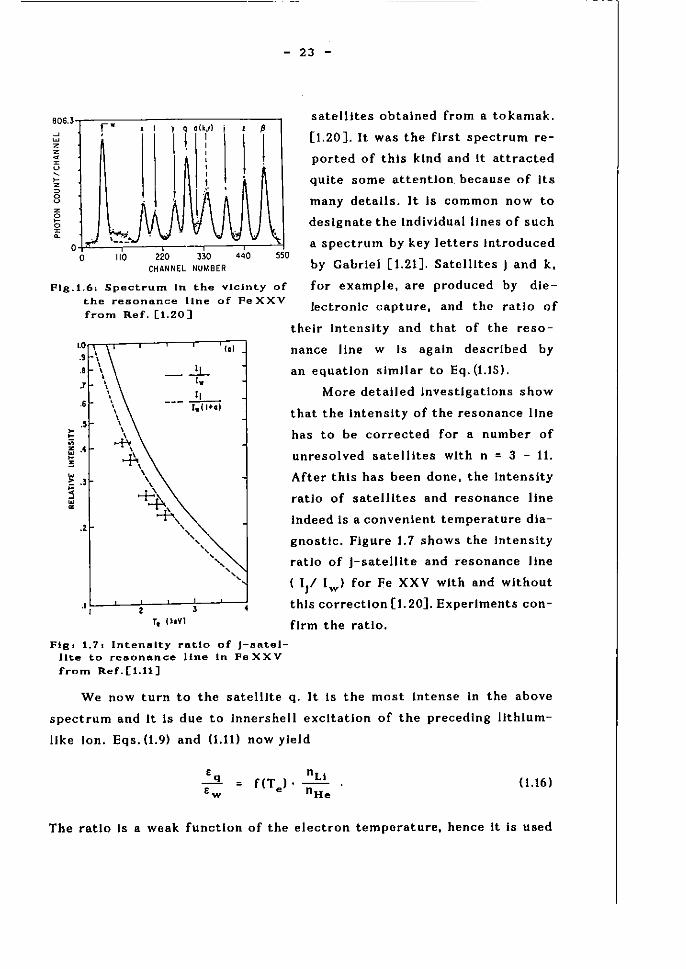
- 23 -
'0'.3,,---,=-----____ ---,-----.., fW alk,') i ß , I , q , \ 1
l I I , , , , !
CHANNEL NUMBER
Plg.1.6: Spectrum In the viclnty of the resonance lIne of Pe XXV
from Rer. [1.20]
. B
. 1
.,
.,
w :: .3
S w =
.Z
",
_21... ' . 'I
---~
3 T, IhVl
FIg: 1.7: Intenslty ra.t.lo of J-88.telIIte to resonance Une In FeXXV from Ref.[1.11]
satellites obtalned from a tokamak.
[1.20). It was the first spectrum re
ported of thls kind and It attracted
quite some attention, because of It8
many detaIls. It Is camman now to
deslgnate the Individual IInes of such
a spectrum by key letters Introduced
by Gabrlel [1.21]. SatellItes) and k,
for example, are produced by dle
lectron1c capture. and the ratio of
thelr Intenslty and that of the reso
nance IIne w Is agaln descrlbed by
an equatlon slmllar to Eq. (1.15) .
More detalled Investlgatlons show
that the Intenslty of the resonance IIne
has to be corrected for a number of
unresolved sateilltes wlth n = 3 - 11.
After thls has been done, the Intenslty
ratJo of sateJlites and resonance line
lndeed 18 a convenient temperature dla
gnostlc. Flgure 1.7 shows the lntensity
ratio of J-satellite and resonance IIne
( I,t Iw
) for Fe XXV wlth and wlthout
thls correctlon [I. 20). Experiments con
firm the ratio.
We now turn to the sateillte q. It 18 the most Intense in the ahove
spectrum and It Is due to lnnershell excltatlon of the precedlng IIthlum
IIke Ion. Eqs. (1.9) and (1.11) now yleld
(1.16 )
The ra.tio ls a weak functlon of the electron temperature. hence It 15 used
- 24 -
to measure the relative densltles of the ion In Its lithlum- and hellumllke
ionlzatlon stage. Thls ratio reveals whether the ions are' in ionlzation
equilibrlum or In a translent stage.
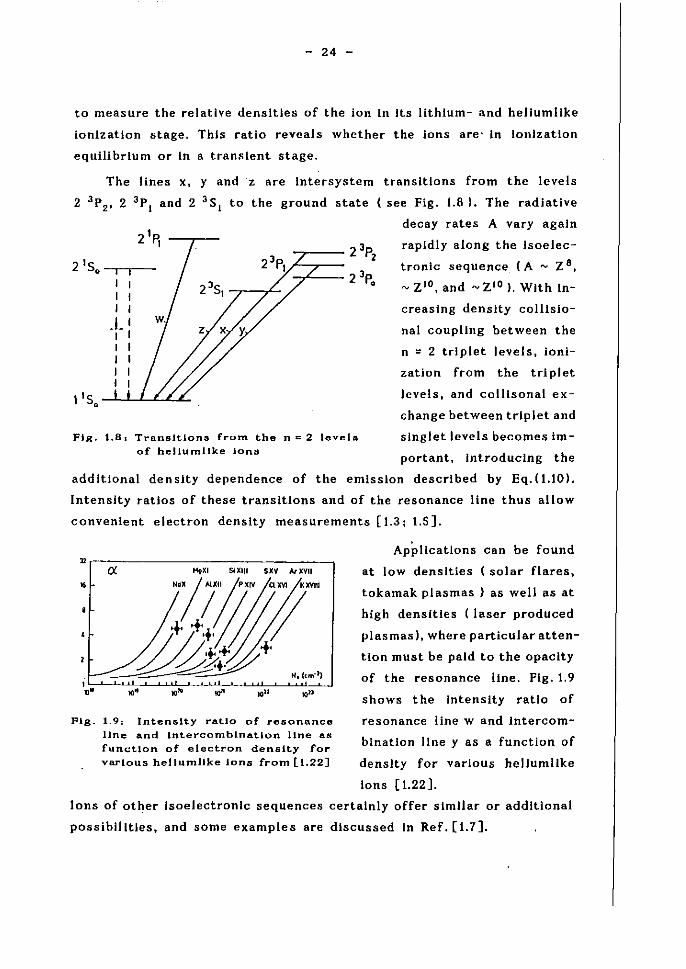
The Iines x, y and 'z are Intersystem transitions frorn the levels
2 3P2' 2 3p, and 2 3S, to the ground state (see Fig. 1.8 I. The radiative
2 ' R decay rates A vary agaln ,
2 '5. -r-- 2JPz
rapldly along the isoelec
tran1c sequence. (A ..... Z 8,
~ z,o. and ~ Z'O ). Wlth In
creastng density collisio
nal coupllng bet ween the
n = 2 triplet levels. lonl
zation from the trlplet
levels, and collisonal ex
change between trip let and
slnglet levels becomes im-
, -r'--2 J p. I I I
..LI , I , I I I I I I I
1'5 •
Flg. 1.8: Tra.nsItIons from the n;:; 2 levels
of hellumlIke Ions portant. Introduelng the
emission descrlbed by Eq.(I.IOl. add Itlonal de n sity dependence of the
Intenslty ratlos of these transitions and of the resonance line thus allow
convenlent electron denslty measurements [1.3; 1.5].
Fig. 1.9: [ntenslty ratio of resonance
Une and Intercomblnatlon Une as funcUon of electron denslty for varlous heJlumllke Ions from [1.22]
Applleatlons ean be found
at low densities (solar flares,
tokamak plasmas) as weil as at
high densitles (laser produeed
plasmas), where particular atten
tion must be pald to the opaelty
of the resonanee lIne. Flg.1.9
shows t he Intenslty ratio of
resonance line wand Jntercorn
bination line y as a fUßetion of
denslty for varlous hellumllke
Ions [1.22].
Ions of other isoeJectronlc sequences certalnly offer simllar or additional
possibilities. and some examples are dlseussed In Ref. [1.7].
- 25 -
All precedlng conslderatlons were under the assumption that the
plasma Is optleally thln to its own emitted line radiatlon. This may not
hold for hlgh-denslty plasmas, and radlatlve transport has to be taken Into
aeeount In those eases [1.14].
1.6 Llne ProfUe.
As dlseussed at the first workshop ( [1.14], page 771, the shapes of
spectral IInes are determined by the motion of the emittlng ion and by the
plasma environment. Hence respectlve plasma parameters may be derived
from the profiles.
Lines from low-density tokamak plasmas are solely broadened by the
Doppler effect, and ion temperatures are thus obtalned from the line
wldths. At the high densities of laser-produeed plasmas, the dominant
broadening mechanlsm 15 pressure broadenlng by the plasma electrons and
ions. The profile may further be Influenced by radiatlve transfer effects
due to large optleal depths. Sultably chosen IInes allow the derivation of
the plasma denslty. The standard referenee Is the monograph by Grlem
[1.23 ].
Reference.
[1.1] P. Bogen, thls workshop.
[1.2] Astrophyslcal and Laboratory Spectroscopy, Proc. 33rd Seottlsh
Unlversltles Summer School In Physlcs, eds. R. Brown and J. Lang,
Edlnburgh Unlverslty Press 1988.
[1.3] C. Oe Mlchells, M. Mattloll, Nuclear Fusion 21, 677 (1981l.
[1.4] H. R. Grlem, Plasma Spectroscopy, McGraw-Hlll, New York 1964.
[1.5] ApplJed Atomlc Colllslon Physlcs, Vol. 2, eds. C. F. Barnett and M.
F. A. Harrlson, Academlc Press, New York 1984.
[1.6] D. R. Bates, A. E. Kingston and R. W. P. McWhlrter, Proc. Roy.
Soe. London Sero A 267, 297 (\962).
- 26 -
[1.7] R. W. P. McWhlrter and H. P. Summers, In Ref. [1.5).
[1.8] R. K. janev, L. P. Presnyakov, V. P. Shevelko, PhysJcs of HJghly
Charged Ions, Springer, Berlln 1985.
[1.9] R. Mewe, In Ref. [1.2].
[1.10] M. Arnaud and R. Rothenflug, Astron. Astrophys. Supp\. Sero 60,
425 (l985J.
[1.11] \. H. Hutchlnson, PrJneJples of Plasma DJagnostJcs, Cambrldge Unl
versity Press, Cambrldge 1987.
[1.12] H. C. Meng, P. Greve, H.-j. Kunze, and T. Schmldt, Phys. Rev. A
31, 3276 (1985).
[1.13] C. Breton, C. de Mlchells and M. Matt101I, j. Quant. Spectrosc.
Radiat. Transfer 19, 367 11978l.
[1.14] Workshop on Laser and Plasma Teehno/ogy, Calro, February 16-
26, 1987.
[1.15] R. H. Garstang, In Highlights of Astronomy, ed. De jager, lAU
(1970 p.55S.
[1.16] E. S. Marmar, j. E. Rlce, E. Källne, j. Källne, R. E. LaVllla, Phys.
Rev. A 33, 774 (l986l.
[1.17] V. A. BOlko, S. A. Plkuz, and A. Ya. Faenov, j. Phys. B: Atom. Molec.
Phys. 12, 1889 (l979J.
[1.18] A. Schulz, R. Burhenn, F. B. RosmeJ and H.-j. Kunze, j. Phys. D:
App\. Phys. 22, 659 (l989l.
[1.19] F. B. RosmeJ, A. Schulz, K. N. Koshelev and H.-j. Kunze, j. Quant.
Spectrosc. Radlat. Transf., to be publlshed.
[1.20] M. Bitter, K. W. HIli, N. R. Sauthoff, P. C. Efthlmlon, E. Meservey,
W. Roney, S. von Goeler, R. Horton, M. Goldman, and W. Stodlek,
Phys. Rev. Lett. '3, 129 (l979l.
[1.21] A. H. Gabrlel, Mon. Not. Roy. Astron. Soc. 160, 99 (l972l.
[1.22] V. A. Bolko, S. A. Plkuz, A. Ya. Faenov, j. Phys. B: Atom. Molec.
Phys. 12, 1889 (1979J. [1.23] H. R. Grlem, Spectral Une BroadenJng by Plasmas, Academlc Press,
New York 1974.
- 27 -
2. X - Ra.y La.sers
2.1 General conslderatioDs
Research on short-wavelength lasers has been pursued vlgorously
In many lahoratorles since these lasers would have a tremendous Impact
on many flelds of selenee and teehnology. High-resolution holography of
IIvlng structures or of large moleeules is one posslbility. to name hut one
excitlng example. The unambiguous demonstration of short-wavelength
ampllfleatlon in laser-produeed plasmas In 1985 [2.1; 2.2] gay. a strong
boost to the many actlvlties in these Held, and a number of research
groups have also reported the observatIon of laslng since.
Two problems are crltlcal for the real1zatlon of short-wavelength
lasers:
how to achieve population inversIon, and
the lack of hlgh-refleetlvlty mlrrors for a resonator.
Although substantlal progress has been made In the development of
multllayer miTraTS for the soft x-region, present lasers rely on amp/lf1ed
spontaneous emission CASE). Inversion Is produced within a plasma co
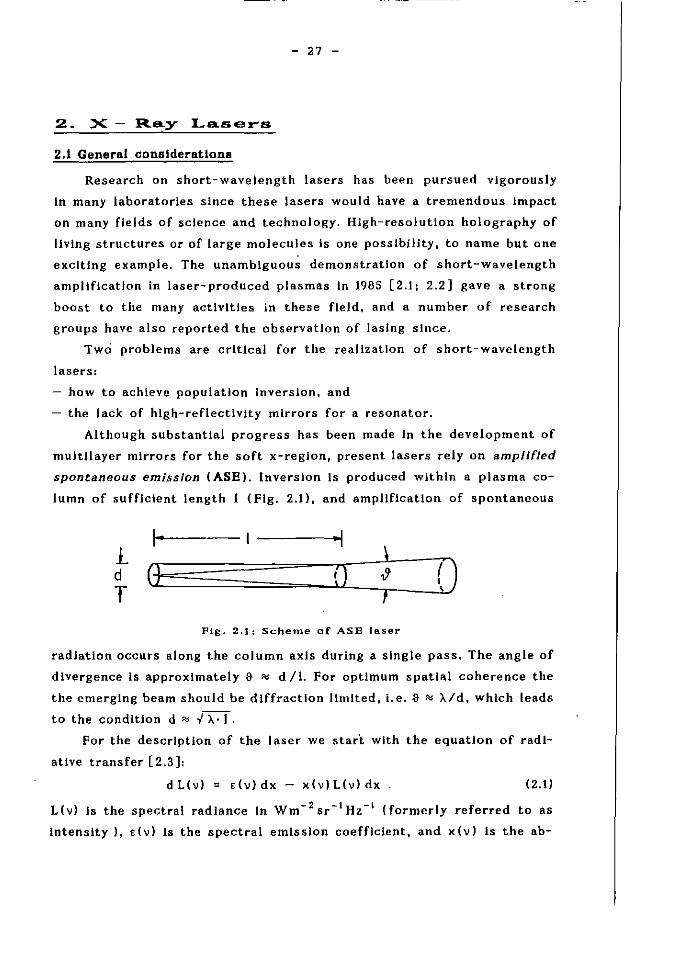
lumn of sufflelent length I (Flg. 2.1l. and amplifieatlon of spontaneous
I" ~
~ (~)~~~~()cj}~r() Pig, 2,1: Scheme of ASE laser
radiation occurs along the coJumn axls during a single pass. The angle of
dlvergence 15 approximately S ~ d /1. For optimum spatlal coherence the
the emerglng beam should be dlffraetlon IImlted. i.e. 1) '" )Jd. whleh leads
to the eondltlon d '" lx:J. For the descriptlon of the laser we star't with the equation of radi
atlve transfer [2.3]:
d L(v) = dv) dx - x(v)L(v) dx . (2.0
L (v) Is the speetral radlanee In Wm - 2 Sr -1 Hz -, (formerly referred to as
lntenslty). «v) Is the speetral emission eoefflelent. and xlv) Is the ab-
- 28 -
sorption coefflclent per unlt length. (Nowadays the word intenslty Is
restrlcted to the power per solid angle radlated by the whole source,
I.e. the spectral radiant Intenslty Is glven by I(v) = f L(v) dA).
When stlmulated emission dominates absorption, we substitute
xlv) = - odv), (2.2)
a(v) now belng the small signal gain coefflclent. Eq. (2.\) may be Inte
grated far a homogeneous plasma of length 1 as long as there Is no
saturation, because In thls case dv)/a(v) Is Independent of the frequency.
The spectral radiance at the plasma surface becomes
L(v) = dv) a(v)
[ e oe (\I) 1 _ 1] (2.3)
If we deflne a spectral radlance wlthout ampliflcation by Lo(v) = dv) ·1,
we may wrlte
L(v) = e cdvH _
a(v)1 (2.4)
where E(v) Is the spontaneous emission ampllflcatlon factor. a(v)1 Is the
galn-length product.
p
A(p-) q
9
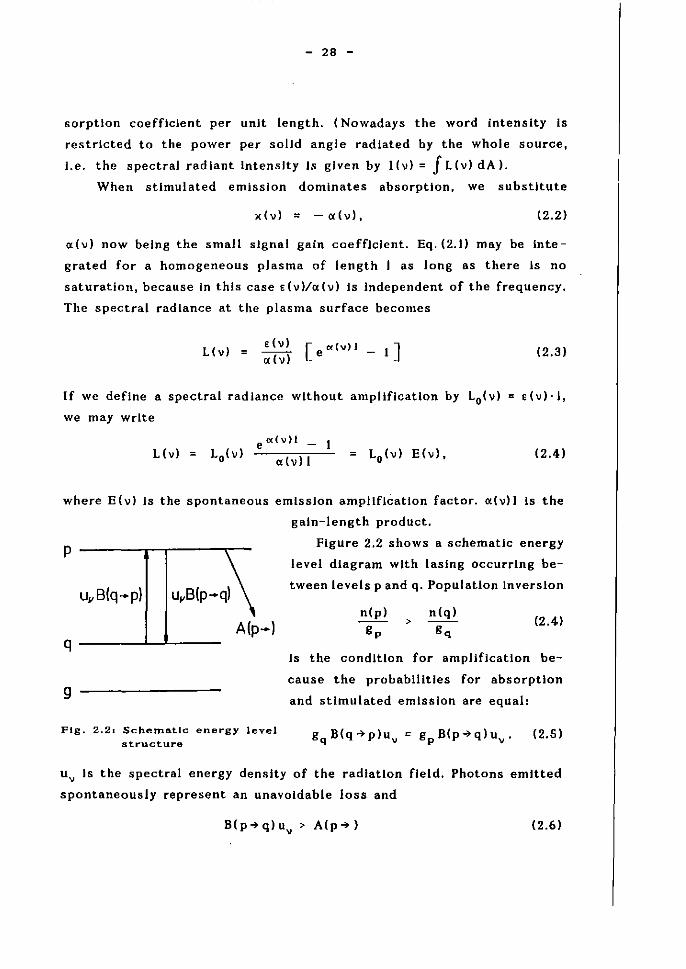
FIg. 2.21 SchematJe energy level structure
Figure 2.2 shows a schematlc energy
level diagram wlth laslng occurrlng be
tween levels p and q. Population Inversion
> (2.4)
Is the condltlon for ampliflcatlon be
cause the probabilities for absorption
and stlmulated emission are equal:
(2.5)
U v Is the spectral energy denslty of the radiation fleld. Photons emitted
spontaneously represent an unavoldable lass and
- 29 -
18 the second essential condition far lasinCj A(p ~) Is the surn of the radi
ative transition probabilities to a11 tower levels. Since
A{p~q)
B{p ~ q) = 81th 3 -- V
c 3 (2. 7)
radiatlve Jasses increase rapldly with frequency, and hence the power to
pump a laser must he expected to Increase accordingly. To be more pre
else, the galn coefflclent ,dv) depends on the shape of the IIne profile
S{v), and In the case of Doppler broadenlng, profile and thus ",{v) scale
accordlng to ~ IIv{kTl1/2 at the line center. Thls results In a pump power
scaling of P '" v .... The req ulred powers become enormous for X -ray lasers,
and at present only three types of pulsed laboratory sources can, in
princlple, deliver such power denslties: lasers, partlcle beams, and
pulsed-power driven discharges (see, for example, [2.4]-[2.6]). Several
schernes have been proposed, a few have already been successful.
2.2 Non-plasma systems
The classleal system is the K" -laser proposed in 1967 by Duguay and
Rentzepls [2.7]. High power Ineoherent X-ray radiation Is used to produee
K-shell vacancies by innershell photolonlzation. whlch lmmediately results
in population inversIon. The pump source must be restrlcted to a selective
narrow spectral band Jn order for K-shelJ ianizatJon to dominate the re
maval of outer electrans. Laser-produced plasmas have been studled as
possible sourees.
The laser is seIf-termlnatlng, and the rapid K-vacancy decay rate
of the upper-Iaser state leads to eorrespondlngly short laser pulses. The
competing fast Auger decay, however, poses a serious problem to this
laser scherne. whleh has not yet been frultful experimentally. Thls state
ment also holds for several other Ingenlous schemes [2.9]. so me of whleh
requlre physical canditions beyond those available wlth present state-af
the- art teehnology.
The scherne of the free-electron laser {FEll Is eompletely different
snd possibiIJties ta scale these devices ta the soft x-ray region are belng
studled. Major advantages would be tunabIlity. high average power, and
excellent beam quality.
2.3 Plasma- baaed systems
2.3.1 Speclflc problems
- 30 -
These approaches to an x-rar laser Involve multtcharged ions in
dense hlgh-temperature plasmas. In add itlon to the atomic level popu
lations belng far from equilibrlum, the plasmas themselves can be In
strongly dynamic states. Two problems are germane to most systems [2.10].
The first one Is the opa city limitation. It Is essential that the lower
laser level Is negUglbly populated, and thls Is achleved by rapid radl.tlve
decay, usually to the ground state. However, If the photons emitted in this
resonance transJtion cannot escape the plasma volume hut are re-absorbed,
the lower laser level Is re-populated. lt Is sufflclent to requlre that the
plasma be optically thin wlth respect to this transition in the transverse
direction only. This favors 10ng and thln plasma columns.
On the other hand, such plasmas will be hlghly Inhomogeneous In the
transverse dlrection. the gradients In density glvlng rlse to corresponding
gradlents of the plasma refractive index. Thls results in refractlon of any
laser beam propagatlng along the column and limits the useful length
of the laser plasma.
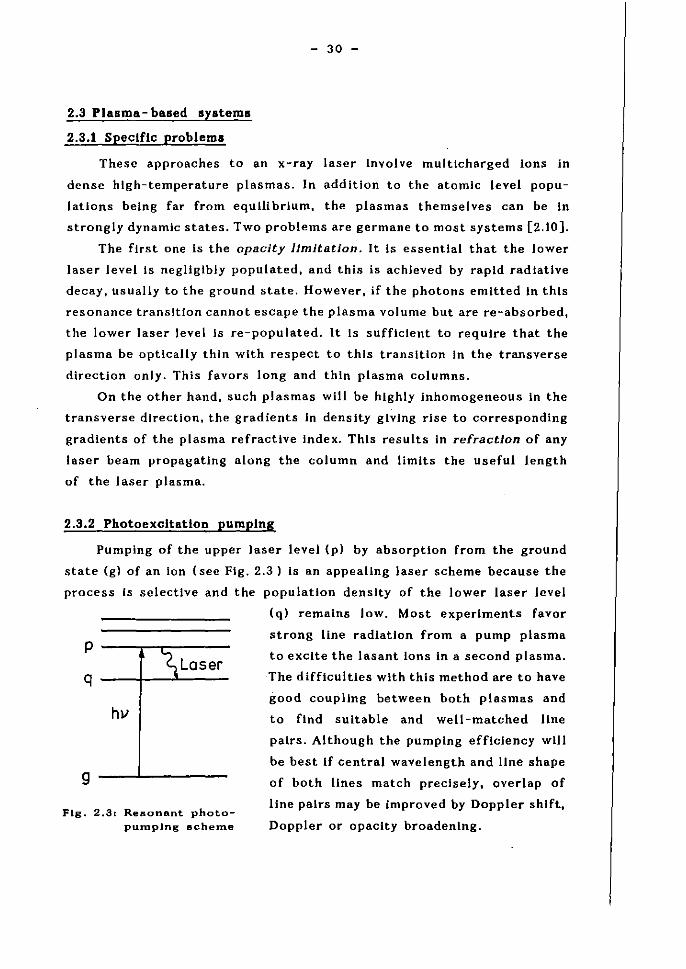
2.3.2 PhotoexcltatIon pumplng
Pumplng of the upper laser level (p) by absorption from the ground
state (g) of an Ion (see Fig. 2.3) ls an appealing laser sehe me because the
process is selectlve and the population density of the lower laser level
(q) remains low. Most experiments favor
p Laser
q
hv
9
Flg. 2.31 Resonant photopumplng scheme
strang line radiation from a pump plasma
to excite the lasant ions in a second plasma.
The dlfficultles wlth thls method are to have
good coupllng between both plasmas and
to find sult.ble and well-matched Une
pairs. Although the pumplng efflclency will
be best If central wavelength and IIne shape
of both Unes match preclsely, overlap of
line pairs may be Improved by Doppler shlft,
Doppler or opacity broadenlng.
- 31 -
One typlcal IIne pair that appears to be very promi.ing Is the ca.e
of the 2 'P ... I'S re.onance line of Na X at 1.100 nm whlch pumps the
\'S'" 4 'p IIne of Ne IX. Galn Is expected on the 4 ... 3 and 4'" 2 IInes of
of this ion. ather suitable line paIrs have been considered. see, for
example, [2.10] to [2.12]. Pul.ed-power-drlven plnch discharges as weil
as laser-produced plasmas have been employed, but up to now the photo
pumping scheme has not been successful-jn the xuv or x-ray regIon.
2.3.3 ColHalonal pumpluB
The alternative approach to photon pumping ls excltatlon of the
lasant Ions by Inelastic collislons of the plasma electrons. In contrast to
photoexcltation. this process is non-selectlve and the tower laser level
will be also populated. Ta make things worse, coillsional rates to lower
levels are usually even faster than those to the higher ones. This laser
scheme. therefore, reHes on strang caU Islonal pumplng of a forbldden
transitIon {rom the ground state to generate a relatlvely large level popu
lation In the upper laser level, whleh has a long IIfetlme, and on a lower
laser level, whlch rapldly decays to the grau nd state. It Is primarlly thls
fast decay preventing a buildup of population, whlch a!lows population
Inversion. In this approximatlon, the system Is in a quasisteady state,
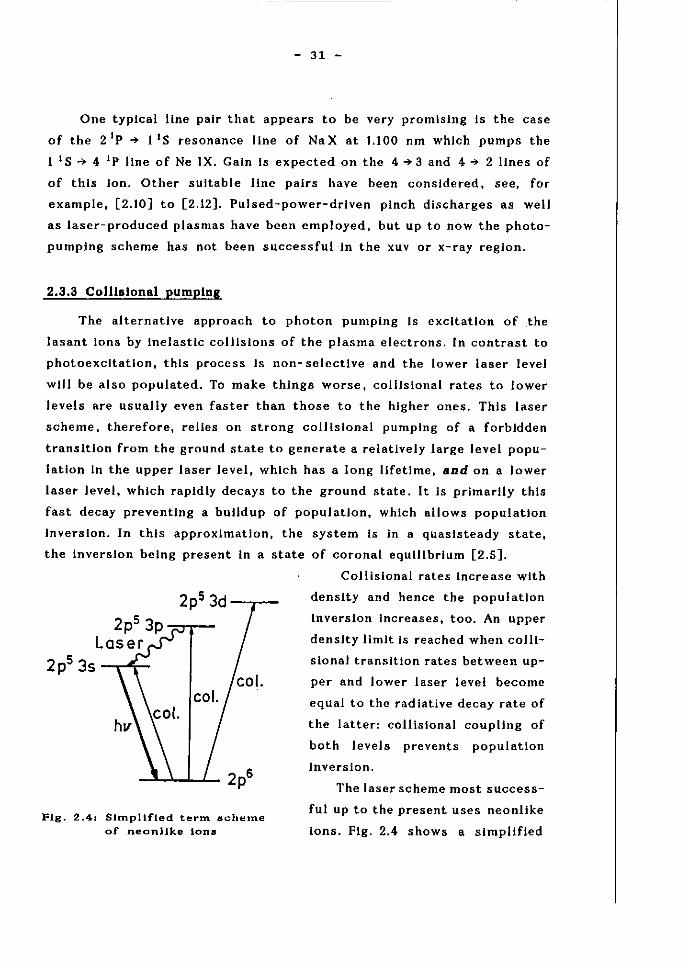
the Inversion belng present In astate of coronal equlllbrium [2.5].
2pS 3p~~ Laser
2ps 3s --.-...,p;;.....
Fig. 2.4, SllJ'lpllfled term sehe me
of neonlJke ions
Collisional rates increase wlth
denslty and hence the popul ation
inversion increases, too. An upper
denslty limit Is reached when eolil
slonal transition rates between up
per and lower laser level become
equal to the rad iative decay rate of
the latter: collislonal coupling of
both levels prevents population
Inversion.
The laser scheme most success
Cul up to the present uses neonlike
Ions. Fig. 2.4 shows a slmplifled
- 32 -
term scheme of these Ions. 2p electrons are collislonally exclted to 3s.
3p and 3d levels, the 2p ~ 3p monopole excltatlon rate belng comparable
to the 2p ~ 3s and 2p ... 3d dipole rates. Since the 3p level Is qulte meta
stable agaln.t dlrect dipole decay to the ground state and the 3s level
depopulates rapldly to the grau nd state, lasing between both levels Is
possible. As a matter of fact, many sublevels exlst in thc upper and lower
laser configuration, and a number of laslng transitions should be obser
vable; so rar, laslng has been seen on slx transitions [2.13].
The first experiment, whlch demonstrated slgnlflcant 3p-> 3s ampll
fieatlon, was carrled out at thc Lawrence Livermore National Laboratory
[2.1]: the la.ing plasma was produced by Ilne focusing a powerful laser
(energy 1 kl, pulse length 450 ps, wavelength ,,= 532 nm) onto a 75-nm-thiek
layer of Se, vapor depo.lted on one slde of a 150-nm-thlck formvar sub
strate. The 3p"> 3. la.lng transitions of Se XXV were at 20.63 and 20.96
nm. Since then, laslng has been dctcctcd In many other neonlike systems
from Cu XX to Mo XXXIII ( e.g. [2.13], [2.14]l. The laser Ilnes cover the
spectral region fra m 28.467 nm in Cu XX to 10.64 nm In Mo XXXIII, and
thc experimental approach was stmllar in all cases: powerful lasers were
used for the plasma production, the targets belng planar thln foils, rlb
bons, or solids.
Thc experiments were supported by large theoretical efforts primarl
Iy In the followlng areas: laser heating and target hydrodynamlcs, Ion 1-
zatlon and Inversion kineties, atomle data, and speetral synthesls [2.15].
One point should be mentloned speelfieally: the ineorporatlon of dielee
tronie recomblnatlon 38 additjonal population mechanlsm improved the
agreement with the experImental observations.
In order to reach shorter wavelengths, the analogous scheme using
4 d "> 4 p transitions In nlckel-Hke Ions Is belng explolted. AmpHfleatlon
of spontaneaus emission has been reported at 6.583 nm and 7.100 nm In
Eu XXXVI [2.16] and at 5.026 nm and 5.609 nm In Yb XLIII [2.17].
2.3.4. Recomblnatlon lasers
Recomhin.atlon as possihle pumplng me~hanjsm was first proposed
by Gudzenko and Shelepln [2.18]. The sehe me 10 qulte straightforward:
- 33 -
Inltlally, a plasma Is heated rapldly to high temperatures where the Ions
are In high stages of lonlzatlon, and by rapid eooling, the plasma beeomes
strongly nonequllJbrium, where recomblnation processes dornlnate. At
sufflelently high eleetron densitIes, eoilisional (three-body) reeombinatlon
Is effeetlve, whleh Is preferentlal Into hlgh-lylng levels close to the eon
tlnuum:
Xz{g) + e + e ? Xz_,{p) + e (2.8)
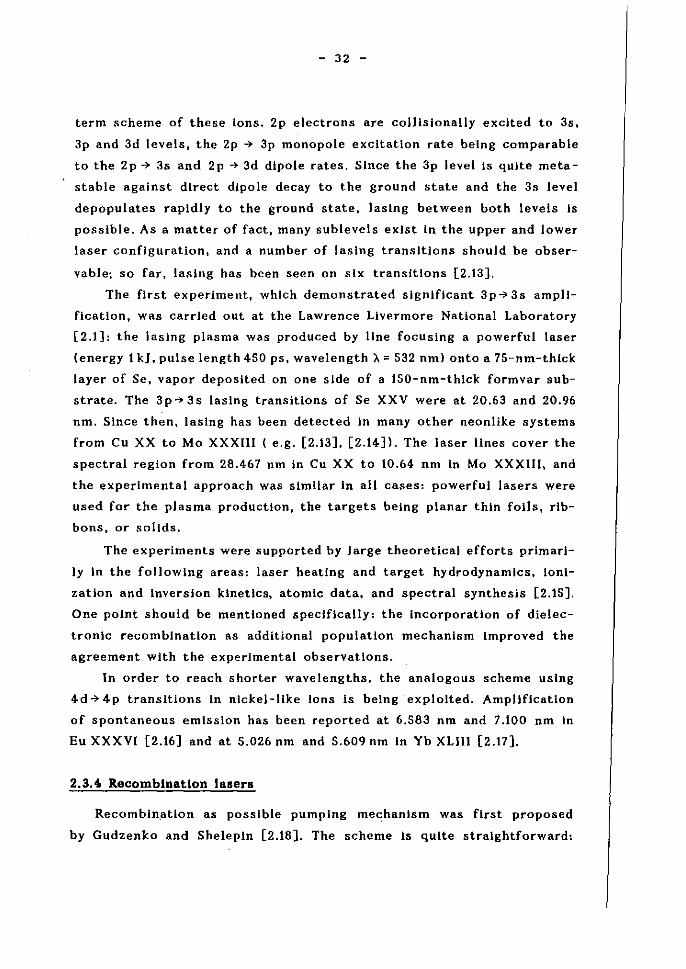
Subsequent radiative and colllsional decay also popuJates lower levels
although eollisional rates deerease; they seale as Re { n+l ? n) ~ n', whereas
Laser
q
A(q-)
9 Pig.2.S: Schematlc of purnplng by coJllslonal
recornblnatlon
radlatlve decay rates rapJdly become faster,
Aln?) ~ n- 9 / 2 . n Is the prlnelpal quantum number
of hydrogenie levels. In thls way, population In
version may be established between an upper le-
vel still coupled eollislonally to hlgher levels and
a lower level with a fast radiative decay.
Flg. 2.5 iIIustrates the eoneept of thls laser
scheme. It may be quantlfled wlth the help of
the collision limit n'. n' refers to the prlnelpal
quantum number of that level for which radiatlve
decay 18 about as likely as collisional excitatlon
Into hlgher exelted levels [2.19]. On the basis of
a slmplifled hydrogenlc model this eollision limit
Is glven by
n' '" 126 ZI2/17 n -2/17 (kT /E )1/17 e eH' (2.9)
where Z Is the lonlzatlon stage, ne Is the eleetron denslty In em-3 , and
kT elEH Is the eleetron temperature In unlts of the Rydberg energy EH'
As a rule of thumb, population Inversion may occur between an upper
level above the eollision limit and a lower level below n'.
The collJslonal recombination rate Re Into all levels ab ave the collI
slon limit seales as [2.19]
R ~ e (2.10)
The strang denslty seallng (effeetively with the thlrd power) aecentuates
- 34 -
the necessity of high-density plasmas far x-ray lasers just as the tem
perature seating reveaJs the effectlveness of eDoling. Different coollng
mechanlsms have to be considered: eDoling by adlabatlc expansion, by
strang emission of line radiation (radiation eooling), and by heat eon
duell on.
Starting from cornpletely ionized carban plasmas. recombination
lasers In C VI were the first to show slgnlfleant galn [2.2]. Population
inversion and gain was establlshed for the Balmer-alpha (Hoc) transition 8t
18.22 nm between the levels of prlnclpal quantum number 3 and 2. The
n = 2 level depopulates fast to the ground state by the Lyman-alpha tran
sition. The laslng plasma wasproduced by focuslng a powerful CO2 laser
on a solid target and conflnlng the plasma flow to a narrow cylinder by
a very strang axial magnetlc Held of 9 Tesla. The wal.I-conflned carban
plasma produced wlthin a cylinder··type target is very similar to that
approach [2.20).
The UBe of very thln carban fibers (2 to 10 11m in diameter', wh ich are
vaporized by powerful neodymlum-glass 18fers or thelr second harmonic,
has been suceessfully advaneed by other groups [2.21], [2.22]. Computa
tlonal modeling accompanled the experiments, [2.23] - [2.26). After eoatlng
carbon flbers 7 ~m In diameter wlth 0.5 ~m LI F, galn was also observed on
the H ex-lIne of FIX at 8.lnm [2.27).
~ n s p d f 9
5 p,,,, 4
3
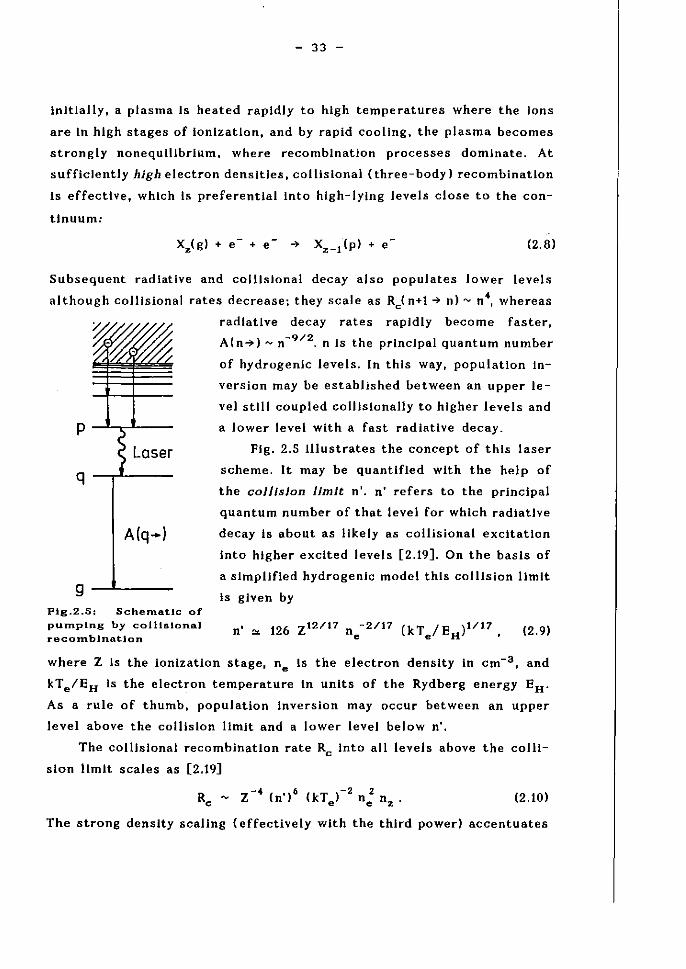
2-Plg. 2.6: Partial energy level dlagrarn
far IIthlurnlike Ions and observed 1881ng transitions
Recomblnation lasers have
also heen reallzed now wlth ions
of the lithium sequence. Fig. 2.6
shows the energy level diagram;
observed Jasing transitions are
Indlcated. An Important charac
terlstlc of these Ions Is the ex
ceptlonally fast decay 3d .. 3 p,
which renders the 3 d levels most
sultable as the lower level of
laslng transitions. Another merlt
of Ilthlumlike Ions Is a lower lonl
zatlon potential than hydrogenllke
- 35 -
Ions when comparing laslng transitions In l1thlumlike ions with Ba.lmer
alpha transItions of about the same wavelength.
Agaln, all laslng plasmas were produeed by foeuslng powerful lasers
onto solid slabs, folls or flbers. Gain was measured In AIXI, SIXII,
SXIV, and CL XV, [2.27] to [2.32].
Finally, a variant -of the recomblnation laser should be mentioned,
where the reeombining ions are produeed by photoionization [2.33]. Power
ful x-ray SQurces are needed for thls scheme, and besides laser produced
plasmas puJsed-power-driven implodlng plasmas are belng considered for
this applleation [2.34]. Although the ionization proeess Is non-resonant,
narrow-band radiation in the regIon of maximum pholoionization 15 re
quired in order ta keep excessive healing of the electrons ta aminimum.
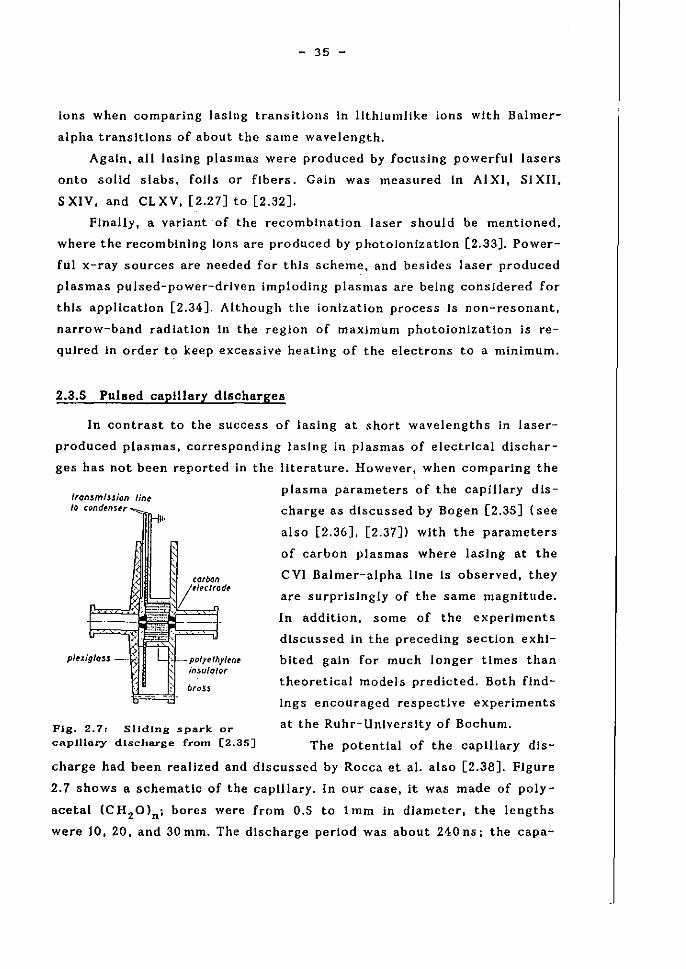
2.3.5 Pulsed caplllary discharges
In contrast ta the success of lasing at short wavelengths in laser
produced plasmas, corresponrling laslng in plasmas of electr1cal dIschar
ges has not been reported in the literature. However, when comparing the
Iranzml$$ion lin~ 10 "n,don,,,,. __
H'
Fig. 2.7, SlJdlng spark or capllla.ry discharge from [2.35]
plasma parameters of the capillary dis-
charge as dlscussed by Bogen [2.35] (see
also [2.36], [2.37]> wlth the parameters
of earbon plasmas where lasing at the
C VI Bai mer-alpha IIne ls observed, they
are surprJsJngly of the same magnitude.
In addition, some of the experiments
dlscussed in the preceding section exhl
bited galn for much longer times than
theoretieal models predicted. Both find
Ings encouraged respectlve experiments
at the Ruhr-University of Boehum.
The potential of the eapillary dis-
charge had been realized and discussed by Roeca et al. also [2.38]. Flgure
2.7 shows a sehematle of the caplliary. In our case, it was made of poly
acetal (C H 2 0)n i bores were from O.S to 1 rnm in diameter, the lengths
were 10, 20, and 30 mm. The discharge period was about 240 os; the eapa-
c ::>
.d L
" C
'" C .. C ~
100
L. H.
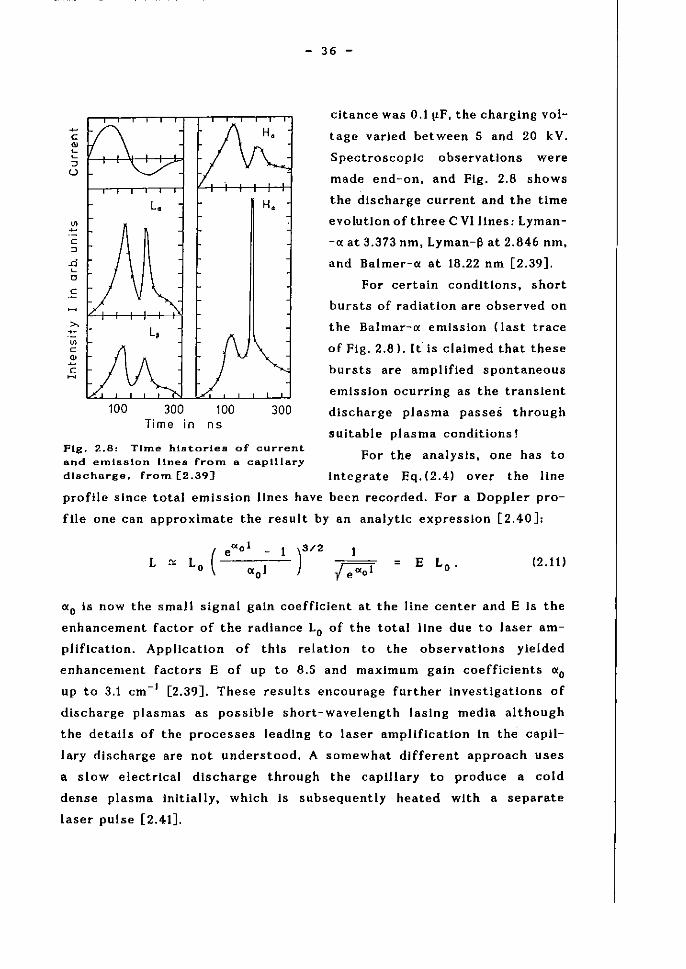
300 100 300 Time in ns
Flg. 2.8: Time hiataries of current and emission Ilnes from a capillary
discharge. from [2.39J
- 36 -
cltance was O.II'F, the charglng vol
tage varled bet ween 5 and 20 k V.
Spectroscoplc observations were
made end-on. and Fig. 2.8 shows
the discharge current and the time
evolution of three C Vllines: Lyman
-<X at 3.373 nm, Lyman-ß at 2.846 nm,
and Balmer-<X at 18.22 nm [2.39).
For certain conditlons, shorl
bursts of radiation are ohserved on
the Balmar-a emissIon (last trace
of Flg. 2.8l. [t is claimed that these
bursts are amplified spontaneous
emission ocurrlng as the translent
dis charge plasma passes through
suitable plasma conditions!
For the analysis, one has to
Integrate Eq. (2.4) over the line
profile since total emission Ilnes have been recorded. For a Doppler pro
file one ean approximate the result by an analyUc expression [2.40]:
L ~ L ( - 0 = (2.1Il
CX o Is now the smaH signal gain coefflcient at the line center and E Is the
enhancement factor of the radtance Lo of the total IIne due to laser am
pllflcatlon. Appllcation of this relation to the observations yielded
enhancement factors E of up to 8.S and maxImum gain coefficients (xo
up to 3.1 cm- I [2.39]. These results encourage further investigations of
discharge plasmas as possible short-wavelength laslng media although
the detalls of the processes leading to laser ampliflcatlon in the capll
lary discharge are not understood. A somewhat different approach uses
a slow electrical discharge through the caplliary to produce a cold
dense plasma initlally, which is subsequently heated wlth aseparate
laser pulse [2.41).
- 37 -
2.4 Multllayer x-ray mIrrars
Multilayered reflectors are CQmmon in the visible and uv spectral
region. Durlng the past deeade, the development of thln film teehnology
accompanied by theoretlcal lnvestlgatlons has made the productlon of
such structures possible also for the xuv and x-ray region [2.42], [2.43].
A multilayered synthetlc mierostructure Is usually made up of two
materials A and B arranged alternatively in tayers of thickness dA and
d B • The structure Is thus pe rio die wlth the perlad d = dA + d B . In the
case of non-absorblng materials like In the visible. the thlckness Is
chosen for optimum reflectlon such that
(2.12)
Reflectlons from all boundarles are In phase and the amplitudes add. For
a sufflclently large number of layers the refleetivlty approaehes one. At
short wavelengths, however, a11 substances exhIbIt absorption and the
layer structure has to be ~rranged wlth the. restrietion that the mate
rial, whleh absorbs more, is plaeed at the nodes of the standlng wave
pattern to keep absorption at aminimum. For other than normal Inel
denee, the Bragg eondltlon must be fulfilled for maximum refleetlvlty:
(2.13)
where l) Is the glanclng angle.
The tayers mllst he. extremely thln, and only advances in sputtering, eva
poration and laser deposition techniques lead to successful productlon.
Flnally, the substrates must be very smooth, they must be superpolished:
a mlcroroughness of the order of 0.1 to 0.2 nrn ls desirable. Typical 'com
binations are, for example. Mo/SI. W /C, Re/C. Anormal Ineldenee re
flectance of over 50% at 15 nrn has already been achieved far a Mo/Si
mu'itllayer [2.44]. Details of these and other aspeets of x-ray optles
may be found In the monograph by Mlehette [2.45].
Ta conclude [ would Hke to refer to a monograph by R. C. Elton,
whleh will cover all aspeets of x-ray lasers and whieh w'JIl be avallable
thls year [2.46].
- 38 -
References
[2.1] D. L. Matthews, P. L. Hagelstein, M. D. Rosen, M. ]. Eckart, N. M.
Cegllo, A. U. Hazl, H. Medeckl, B. J. MacGowan, J. E. Trebes, B. L.
Whltten, E. M. Campbell, C. W. Hateher, A. M. Hawryluk, R. L.
Kauffman, L. D. Pleasance, G. Rambach, J. H. Scofleld, G. Stone,
and T. A. Weaver, Phys. Rev. Lett. 54, 110 (1985),
[2.2] S. Suckewer, C. H. Sklnner, H. MIlchberg, C. Keane, and D.
Voorhees, Phys. Rev. Lett. 55, 1753 (1985).
[2.3] Workshop on Laser and Plasma Techno/ogy Calro, February 16-
26, 1987, p. 65.
[2.4] R. C. Elton, Opt. Eng. 21, 307 (1982).
[2.5] G. J. Pert, XUV and X-Ray Lasers, In Lasers - Physics, Systems,
and Techniques, eds. W. ]. Flrth and R. G. Harrlson (23. Scottlsh
Unlversltles Summer School In Physlcs, Edlnburgh 1983) p. 327.
[2.6] J. Davles, R. Clark, J. P. Apruzese, and ·P. C. Kepple, IEEE Trans.
Plasma SeI. 16, 482 (1988).
[2.7] M.·A. Duguay and M. P. Rentzepls, Appl. Phys. Lett. 10, 350 (1967).
[2.8] R. C. Elton; Appl. Optlcs 14, 2243 (1975),
[2.9] R. W. Waynant and R. C. Elton, Proc. IEEE 64, 1059 (1976).
[2.10] I. I. Sobelman and A.' V. Vlnogradov, In Advances in Atomlc and
Molecular Physics, Vol. 20, Academlc Press 1985.
[2.11] R. H. Dlxon and R. C. Elton, J. Opt. Soc. Am. B I, 232 (1984),
[2.12] P. L. Hagelstein, Plasma Phys. 25, 1345 (1983).
[2.13] T. N. Lee, E. A. Mclean, and R. C. Elton, Phys. Rev. Lett. 59, ll85
(19871.
[2.14] C. J. Keane, N. M. Cegllo, M. ]. MacGowan, D. L. Matthews, D. G.
Nilson, J. E. Trebes,' and 'D. A. Whelan, J. Phys. B: At. Mol. Opt.
Phys. 22, 3343 (1989 I.
[2.15] R. A. London, M. D. Rosen, M. S. Maxon, D. C. Eder, and P. L.
Hagelstein, J. Phys., B: At. Mol. OploPhys. 22, 3363 (19891.
[2.16] B. ]. MacGowan, S. Maxon, P. L. Hagelstein, C. ]. Keane, R. A.
London" D. L. Matthews, M. D. Rosen', ]. H. Scofleld, and D. A.
Whelan, Phys. Rev. Lett. 59, 2157 (1987).
- 39 -
[2.17] B. J. MaeGowan, S. Maxon, C. J. Keane, R. A. London, D. L. Matthews,
and D. A. Whelan, J. Opt. Soe. Am. B 5, 1858 (l988l.
[2.18] L. I. Gudzenko and L. A. Shelepln, Sov. Phys.- Dokl. 10, 147 (1965).
[2.19] H. R. Gdem, Plasma Spectroscopy, MeGraw-HIlI, New York 1964.
[2.20] E. Mlura, H. Daldo, Y. Kltagawa, K. Sawal, Y. Kato, K. Nlshlhara,
S. Nakal, and C. Yamanaka Appl. Phys. Lett. 55 .. 223 0989l.
[2.21] D. Jaeoby, G. J. Pert, S. A. Ramsden, D. L. Shorroek, and G. J.
Tallents, Optles Comm. 37, 193 (981).
[2.22] C. Chenals-Popovles, R. Corbett, C. J. Hooker, M. H. Key, G. P. Klehn,
C. L. S. Lewls, G. J. Pert, C. Regan, S. J. Rose, S. Sadaat, R. Smlth,
[2.23] G. J. Pert, J. Phys. B: Atom. Mol. Phys. 9, 3301 09761.
[2.24] G. J. Pert, J. Phys. B: Atom. Mol. Phys. 12, 2067 (979).
[2.25] S. Suekewer and H. Fishman, J. Appl. Phys. 51, 1922 0980l.
[2.26] R. Epsteln, Phys. Fluids I, 214 (989).
[2.27] O. WIlli, D. Basset, S. Coe, J. Edwards, M. Grande, P. Jaegl",;, G.
Jamelot, M. Key, G. Klehn, A. Klisnlek: C.Lewls, D. O'NeIlI, G. Pert,
S. Ramsden, C. Regan, S. Rose, R. Smlth, In Atomic Processes in
Plasmas, eds. A. Hauer and A. L. Merts, AlP Conf. Proe. 196, New
York 1988.
[2.28] P. Jaegl,;, A. Carlllon,A. Klisnlek, G. Jamelot, H. Guennou, and S.
Sureau, Europhys. Lett. I, 555 0986l.
[2.29] D. Klm, C. H. Sklnner, A. Wouters, E. valeo, D. Voorhees, and S.
Suekewer, J. Opt. Soe. Am 6, 115 ([989l.
[2.30] T. Hara, K. Konzo, N. Kusakabe, H. Yashlro, and. Y. Aoyagl, Jap.
J. Appl. Phys.28,L 1010 0989l.
[2.31] J. C. Moreno,H. R. Grlem, S. Goldsmlth, and J. Knauer, Phys. Rev. A
39, 6033 (l989l.
[2.32] A. CarIllon, M. J. Edwards, M. Grande, M. J. de C. Henshaw, P. Jaegle,
G. Jamelot, M. H. Key, G. P. Klehn, ·A.Klisnlck, C. -L. ·S. Lewls, D.
O'NeIlI, G. J. Pert, S. A. Ramsden C. M. E. Regan, .S .. J. Rose, R.
Smith, and O. Willi, J. Phys. B: At. Mol. Opt. Phys. 23, 147 (1990l.
[2.33] D. G. Goodwln and E. E. FIlI, J. Appl. Phys: 64,1005 (1988l.
[2.34] T. W. Hussey, M. K. Matzen, E. J. MeGulre, and H. E. Dalhed, J. Appl.
Phys. 66, 4112 (l989l.
- 40 -
[2.35] P. Bogen, thls workshop.
[2.36] P. Bogen, H. Conrads, and D. RusbUldt, Z. Physik 166, 240 (1965),
[2.37] P. Bogen, H. Conrads, G. Gattl, and W. Kohlhaas, J. Opt. Soc. Am.
58, 203 (1966),
[2.38] J. J. Rocca, D. C. Beethe, and M. C. Marconl, Opt. Lett. 13, 565
(1968 ).
[2.39] C. Steden and H.-J. Kunze, to be published.
[2.40] G. J. Llnford, E. E. Peresslnl, W. R. Sooy, and M. L. Spaeth, Appl.
Opt. 13, 379 (1974),
[2.41] A. Zigler, M. Kishenevsky, M. Glvon, E. Yarkonl, and B. Arad, Phys.
Rev. A 35, 4446 (1987l.
[2.42] J. H. Underwood and T. W. Barbee Jr., Appl. Opt. 20, 3027 (1981).
[2.43] A. V. Vlnogradov and S. I. Sagltov, Sov. J. Quant. Electron. 13, 1439
(1983),
[2.44] J. A. Trail, R. L. Byer, ,md T. W. Barbee', Jr., Appl. Phys. Lett. 50,
269 (1988).
[2.45] A. G.Mlchette, Optlcal Systems Far SoFt X-Rays, Plenum Press,
New York 1966.
[2.46] R. C. Elton, X-ray Lasers, Academlc Press, New York 1990.
- 41 -
'3. Pol:nt-l1ke hlgh-povver x-ra.y sourees
3.1 X-ray emission from hot denn plasmas
Hot dense plasmas are powerful flash radiation sources In the x-ray
regIon. Several exciting applications can be listed:
- x-ray llthography.
- x-ray mlcroscopy.
- irradiation of materials.
- extended x-ray absorption fine strueture speetroseopy (EXAFSl.
- photoexcltatlon and ionlzatlon of x-ray laser media.
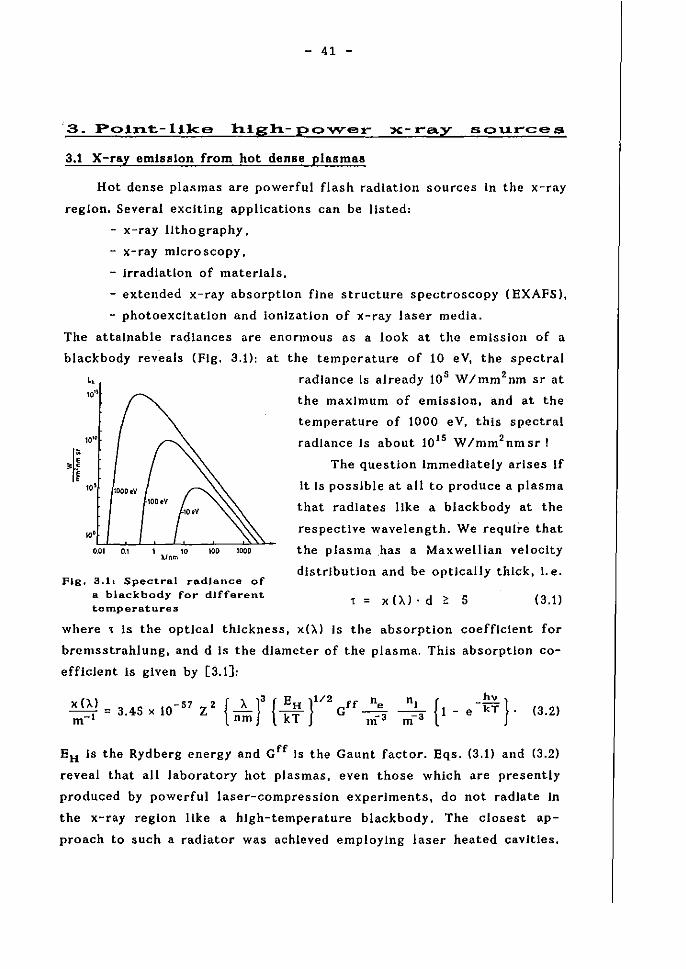
The attalnable radlances are enormous as a look at the emIssion of a
blaekbody reveals (Fig. 3.0: at the temperature of 10 eV, the speetral
L~ radlance Is already 105 W /mm 2 nm sr at
:OOOeV IOOeV
,,' O~,O!'~O~.,-L~~L,~O--~~~~~
Unm
Fig. 3.11 Spectral radlance of a blackbody far different temperatures
the maximum of emission, and at the
temperature of 1000 eV, this spectral
radlance 15 about 10 15 W/rnm 2 nmsr!
The question immediately arises If
it is possible at all to produce a plasma
that radiates like a blackbody at the
respectlve wavelength. We requlre that
the plasma ,has a Maxwellian velocity
distribution and be optieally thick, l. e.
1 = x(X)· d ~ 5 (3.1 )
where 1 is the optical thlckness, x(X) is the absorption eoefflcient for
bremsstrahlung, and d is the diameter of the plasma. This absorption co
effieient Is given by [3.1]:
x(X) = 3.45 x 10- 57 Z' {2.}3 {EH }'/2 Gff 2 rn-I nm kT m-3
hv } {1 - e -kT . (3.2)
EH Is the Rydberg energy and G ff is the Gaunt factor. Eqs. (3.0 and (3.2)
reveal that all laboratory hot plasmas, even those which are presently
produced by powerful laser-compression experiments, do not radlate In
the x-ray region Hke a high-temperature blackbody. The elosest ap
proach to such a radiator was achleved employlng laser heated cavitles.
- 42 -
High-power laser radiation Is foeused Into small eavltles of hlgh-Z ma-. ,
te rial (diameter 250 -1000 ~m), a hot plasma Is ereated at the Inner wall,
and the speetral distribution of the radiation emanatlng from small holes
of the eavlty Indeed resembles falrly well that of a blaekbody, see, for
• "e ;; ;1 ~
ION
:/i---~'k"d' I , H"no.v , , , , , , , ,
I " , , , : \ .. , , ,
I
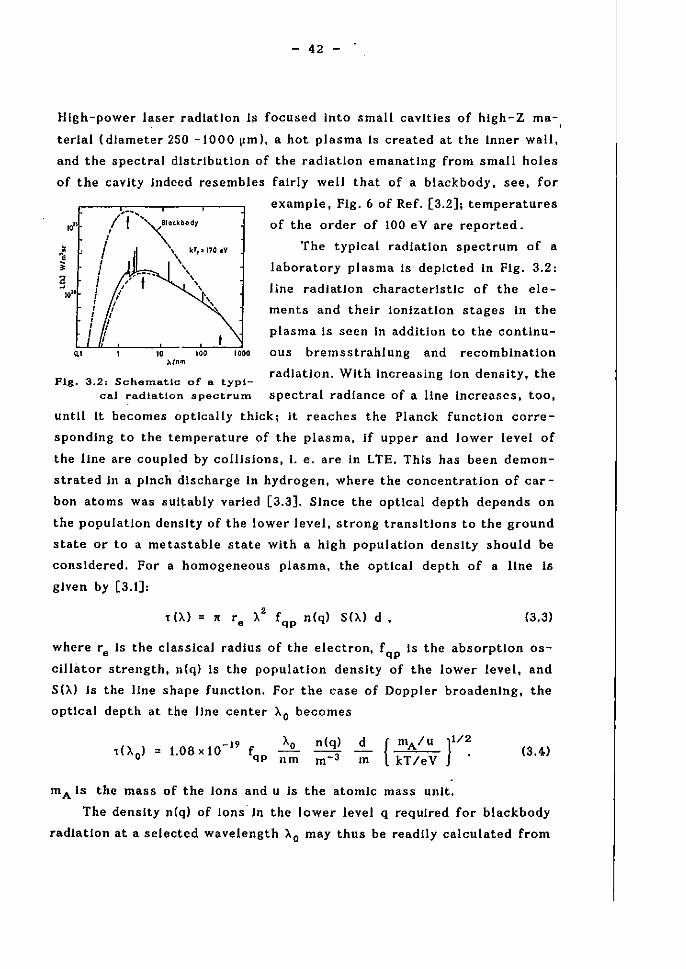
example, Flg. 6 of Ref. [3.2]; temperatures
of the order of 100 e V are reported.
The typical radiation speetrum of a
laboratory plasma Is depleted In Fig. 3.2:
line radiation eharaeterlstle of the ele
ments and their ionization stages in the
plasma 18 seen in addition to the continu-
.!;,-"--1L.~---::IO;----- -"C,!,,;-'----dl 000 0 U s b re m s strahl u n g an d re c 0 m b ina Uo n ),/nm
Fig. 3.2: SchElIl'latlo of ft typJ-radiation. With increasing Ion density, the
cal radiation spectrum spectral radiance of a Une increases. tao,
untll It beeome. optleally thiek; It reaehes the Planek funetlon eorre
spondlng to the temperature of the plasma, If upper and lower level of
the line are eoupled by eollislons, I. e. are In LTE. Thls has been demon
strated in a plnch discharge In hydrogen, where the concentration of ear
bon atoms was sUltably varled [3.3]. Sinee the optleal depth depends on
the population denslty of the lower level, strong transitions to the ground
state or to a metastable state wlth a high population denslty should be
eonsldered. For a homogeneous plasma, the optleal depth of a line Is
glven by [3.1]:
,().) = " r e ).2 fqp
n(q) S().) d, (3.3)
where re Is the classlca! radius of the electron, fqp Is the absorption os
eillator strength, n(q) Is the population denslty of the lower level, and
S().) Is the line shape funetlon. For the ease of Doppler broadenlng, the
optleal depth at the line center ).0 becomes
-19 ~ ,().o) = 1.08x10 fqp nm
n(q) m- 3
d m {
mA/u }1/2 kT/eV .
mA 18 the mass of the Ions and u is the atomic rnass unlt.
(3.4)
The denslty n(q) of Ions In the lower level q requlred for blaekbody
radiation at aselected wavelength ).0 may thus be readJly ealeulated from
- 43 -
Eqs. (3.t) and (3.4l.
A. lower limit of the total radlance L = L(X)· i'. X of an apticaHy thiek D
line Is obtalned by taklng i'. X equal to the Doppler wldth i'. X1/2 (f,ull
wldth at half maximum):
{ kT/eV 1/2
i'.Xl~2 = 7,7 x 10- 5 Xo mA/u} (3.5)
For kT = 1000 eV and mA = 20u, we obtaln a posslble radlanee of a line
at 0.25 nm (maximum af speetral emission) of L ., 1 x 10" W/mm2 sr.
Thls value Is huge. One eertalnly has to keep In mlnd that such plasmas
ean only be produeed far very shart times, and the total energy emltted
will be aeeordlngly law. The approach of produelng maximum emission at
aspeclfle wavelength by see ding a low-z plasma wlth sultable hlgh-z Ions
has the advantage that radiation lasses In other spectral regions remaln
eamparatively moderate, Iikewlse the total energy Input Into the plasma.
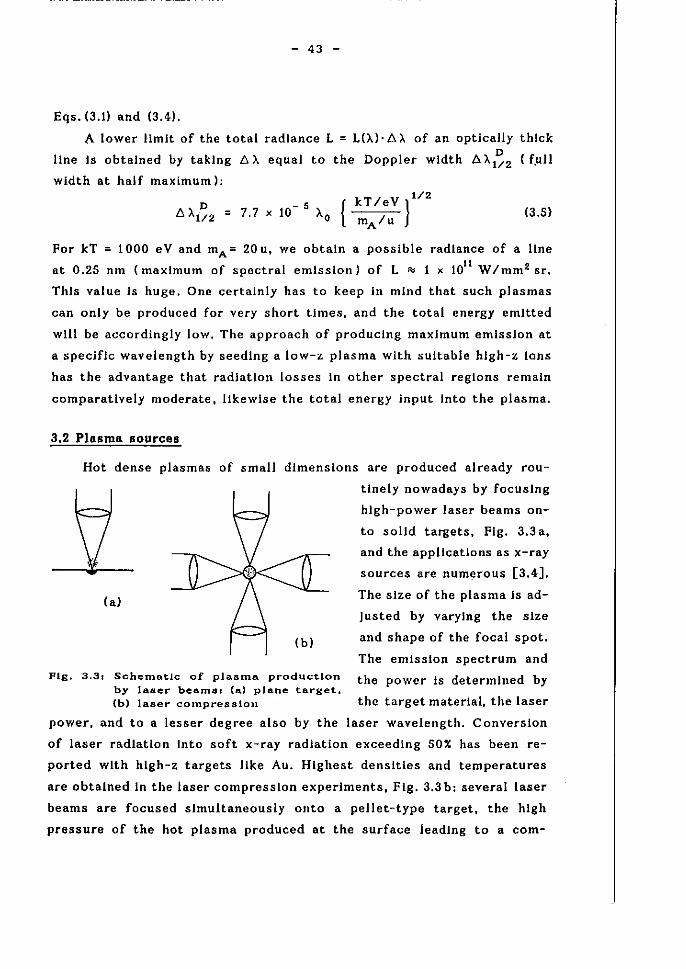
3,2 Plasma BoureeB
Hot dense plasmas of small dimensions are produced al ready rou
(a)
tlnely nowadays by focuslng
high-power laser beams an
to solid targets, Fig. 3.3 a,
and the applicatlons as x-ray
sources are numerous [3.4].
The slze of the plasma Is ad-
Justed by varylng the slze
(b) and shape of the focal spot.
The emIssion spectrum and
Fig. 3.31 SchemotJc of plasma producUon the power 18 determined by by laser beam81 (0) plane target.. (b) laser cornpresslon the target material, the laser
power, and to a lesser degree also by the laser wavelength. Conversion
of laser radiation Into 80ft x-ray radiation exceeding SOX has been re
ported wlth hlgh-z targets like Au. Highest densltles and temperatures
are obtalned In the laser compresslan experiments, Fig. 3.3 b: several laser
beams are facused slmultaneausly onto a pellet-type target, the high
press ure of the hot plasma produeed at the surface leadlng to a com-
- 44 -
pressIon of the materIal.
Discharge pfasmas are produced In varlous conflguratlons by modern
pulsed-power generators wlth power input up to the multl-terawatt re
gIon [3.5] and [3.6]. In comparlson to laser-produced plasmas, these dls
charge plasmas have usually targer dimensions, the discharge current Is
of longer duratlon, and hence total radiation yields up to 500 kJ could
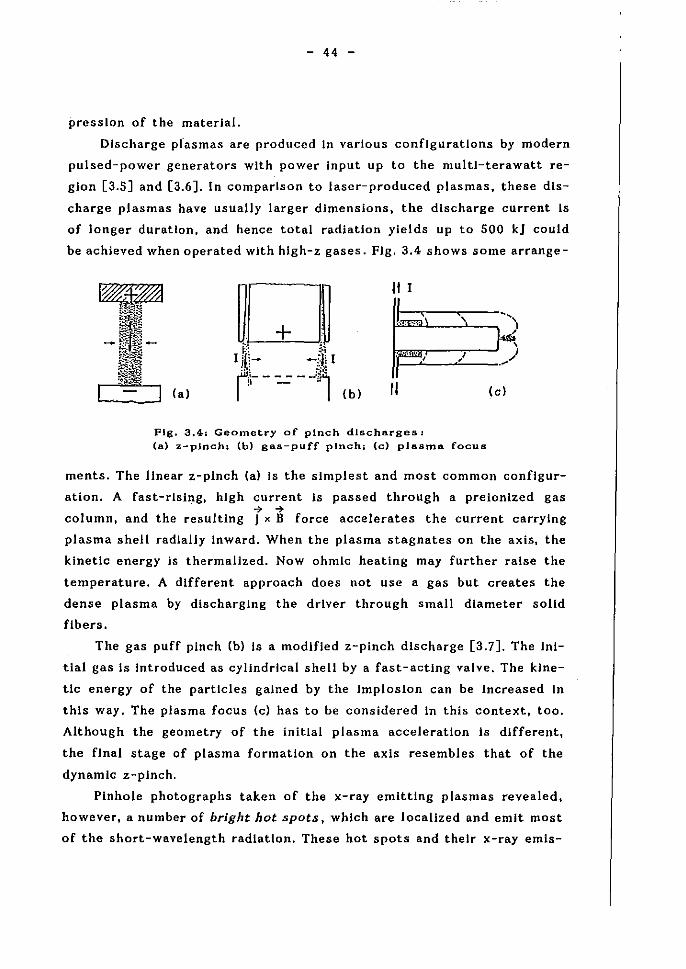
be achieved when operated with hlgh-z gases. Fig. 3.4 shows some arrange-
--j , ,
/ ) .~
(c)
CJ 1:-: ~·1
Il- -'I' I
r\\--:..= - -\'l,·i (b) 11 '--_---'J (a)
Fig. 3.4: Geometry of plnch discharges : (a) z-plnch; (h) gas-puff plnchi (c) plasma foeus
ments. The linear z-plnch (a) Is the slmplest and mOst common conflgur
ation. A fast-rlslng, high current Is passed through a prelonlzed gas .. .. column, and the resulting J x B force accelerates the current carrylng
plasma shell radlally Inward. When the plasma stagnates on the axis, the
kinetlc energy js thermal1zed. Now ahmle heating may furt her ralse the
temperature. A different approach does not use a gas hut creates the
dense plasma by discharglng the driver through small diameter solid
flbers.
The gas puff plnch (b) Is a modlfled z-pinch discharge [3.7]. The Ini
tial gas Is Introduced as cylindrlcal shell by a fast-actlng valve. The klne
tlc energy of the particles gained by the Implosion can be Increased In
this way. The plasma focus (c) has to be considered In this context, too.
Although the geometry of the initial plasma acceleratlon Is different,
the final stage of plasma formation on the axis resembles that of the
dynamlc z-plnch.
Plnhole photographs taken of the x-ray emlttlng plasmas revealed,
however I a number of bright hot spots I whlch are locallzed and emlt most
of the short-wavelength radiation. These hot spots and thelr x-ray emls-
- 45 -
slo" are rather sensitive to the current level and specificaJly to the atomlc
number of the plasma Ions. Because of their small dImension they repre
sent powerfu! polnt-Ilke x-ray sourees. For varlous applications thelr
major disadvantage slmply is the fact that there are a varying number of
hot spots In the plasma for each discharge, and thelr positions, although
close to the plasma axis In most eases, are erratlc.
The low-inductance vacuum spark discharge offers the unique possl
billty to produce only one hot spot during one discharge 1f operated
properly; two or even three may occur oceaslonally. Although spark dls
eh arges have been used for spectroscopic studles for decades, see, e. g.,
[3.8], the localized hot spot phenomenon appeared more reeently, when
the lnductance of a high voltage vacuum discharge was
drastically reduced and the peak current exceeded a
level of about 100kA [3.9]; speetra from very high
ionizatlon stages were recorded.
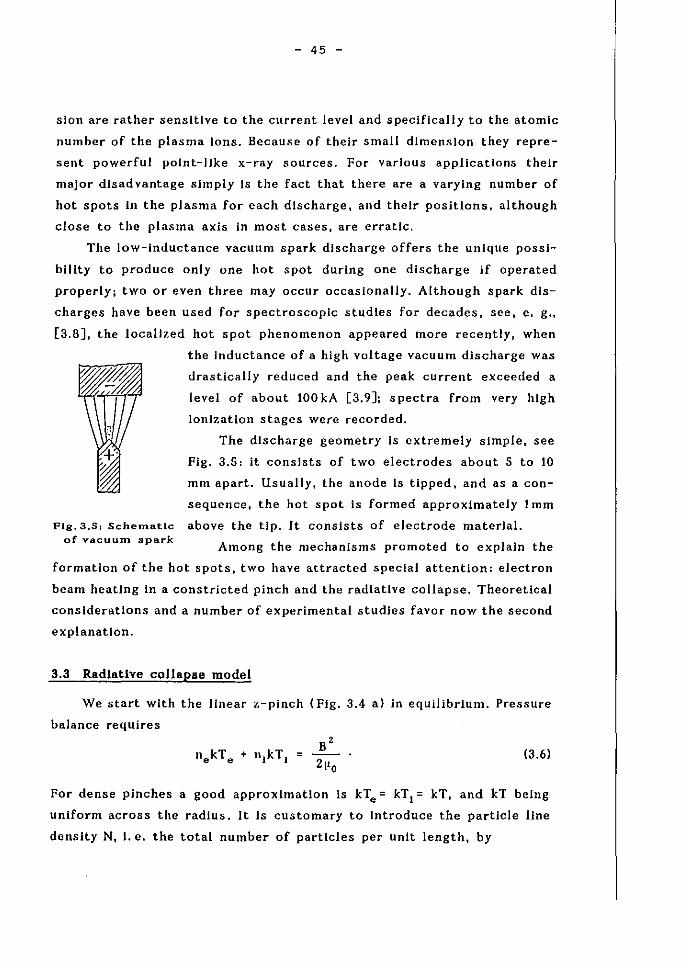
The dIs charge geometry is extremely simple, see
Fig. 3.5: it eonslsts of two eleetrodes about 5 to 10
mm apart. Usual1y, the anode ls tipped, and as a con
sequence, the hot spot is formed approximately 1 mm
Fig.3.51 Schematlc above the tip. It consists of electrode material. of vacuum spark
Among the mechanisms promoted to explaln the
formation of the hot spots, two have attracted special attention: electron
beam heatlng in a constricted pinch and the radiative col1apse. Theoretlcal
consideratlons and a number of experimental studles favar now the secand
explanation.
3.3 Radlatlve collapse model
We start wlth the linear z-pineh (Flg. 3.4 a) In equilibrium. Press ure
balance requires
(3.6)
For dense plnches a good approximation Is kTe = kT, = kT, and kT belng
uniform across the radius. It Is customary to Introduce the partlcle Hne
denslty N, l. e. the total number of partlcJes per unlt length, by
- 46 -
r o N = f (ne + n1) 2" r d r ,
o (3.7)
where r o Is the plasma radius. The magnetlc field may be expressed by
the total current I flowlng In the plasma column, and one obtalns the
famous Bennett relation for the linear plnch:
8" NkT = 12. ~o
(3.8)
Thls equillbrlum condltlon does not fix the plasma radius. A second con
dlUon for a radiation dominated plnch Is derlved from the energy con
servatlon. The first law of thermodynamlcs ylelds for the variation of the
total energy U of the plasma
dU dV dQ =-p--+--
dt dt dt dV
= - p -- - Pr + Po' dt
(3.91
2 V = "ro I Is the plasma volume, I Is the plasma length, Pr Is the total
power radlated, and Pols the rate of ohmic heating.
Pressure balance and a constant current 1 requlre NkT = const., and
Eqs. (3.8) and (3.9) may be comblned In thls case to
2 d ( " ro J)
= dt
For the plasma radius r o one obtalns
= 41l ;r ( Po
~o I I Pr
2 ~o I
4" (3.10)
(3.11l
Thls relation reveals, that the plasma column expands If the ohmlc heaUng
exceeds the radiation losses (Po> Pr)' and the plasma column shrlnks
If the radiation losses become larger than the energy Input (Pr> Po).
Thls phenomenon is called radlatlve cal/apse. The plasma Is In equillbrium
for Po = Pr' Thls conditlon Is reached for a eertaln current, whleh Is
known as Pease- Braglnskll eurrent IpB after the two authors who orlgl
Inally applied sueh eonslderatlons to a hydrogen plasma, [3.10] and [3.11].
We first conslder a plasma wlth fuHy strlpped Ions and pure ohmlc
heaUng. Radiation losses are through bremsstrahlung, and the reslstlvlty
- 47 -
3/2 of the plasma Is glven by the Spitzer reslstlvlty ~ = c;Z InA/(kT) .
c, Is a constant and A is the Coulomb logarlthm. The heatlng rate thus
I. -I 2
~ --2 I " ro
C, Z InA (kTl 3 / 2 =
The power emltted by bremsstrahlung Is given by
2 1/2 2 p. = c 2 Z ne n , (kT) "ro I
12
--2
" ro (3.12)
(3.13)
Using Bennett's equation (3.B) and the canditlon Z n l = ne t this equation may be wrllten as
I • --2'
" ro (3.14)
(Z + 1)2
The ratio of heatlng and radiation losses thus becomes
Po _ c, (8,,)2(Z+I)2 I - - - -- InA-p. - c2 ~o Z 12
(3.15)
The Pease-Braginskll current IpB may be readily obtalned uslng the well
known constants c, and c 2 from the lIterature. More detalIed consldera
Uons have to take Into account the denslty profile, see [3.13] for a dls
cusslon also of previous calculatlons; a parabollc denslty profile ylelds
= 4.33 x lOs {l;;A Z + I
2Z (3.16)
For a hydrogen plasma, a plnch thus Is In equlllbrium for IpB '" 1.5 MA.
It Is convenlent to Introduce the energy loss time,. due to radiation, 3 '. = '2 N kTIIP., and to comblne Eqs. (3.11) and (3.15), [3.14]. One obtalns
2
:0 ~:o = : '. (I ;2B - I)' (3.17)
Thls equatlon now shows that the plnch expands jf I < IpB ' however, that
It contracl. If I > IpB '
In some experiments thls model has to be reflned. As soon as the
electron drift velocity in the plasma exceeds the Ion sound speed, the
resistlvlty J) will Increase by current-drlven microinstabHitles, and the
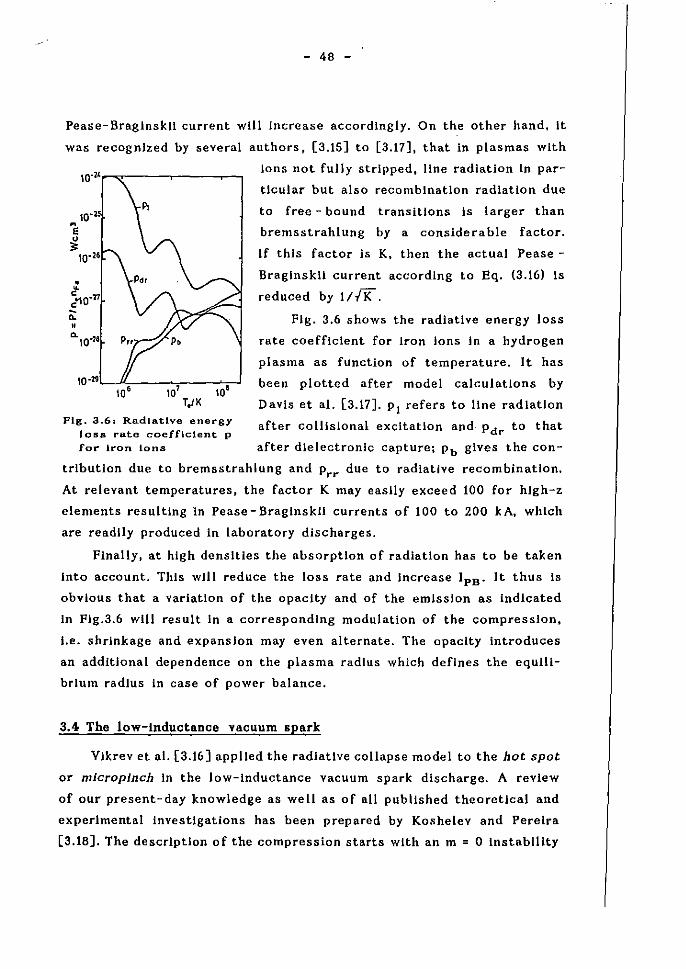
- 48 -
Pease-Braglnskll eurrent will Inerease aeeordlngly. On the other hand, It
was recognlzed by several authors, [3.15] to [3.17], that in plasmas with
10·" ......... __ --~--~__,
10·"L-.p,:---,--....,--' 107 10'
Tt/K
Pig. 3.6: Radlatlve energy IOB8 rate coefflclent. p
for iron Ions
Ions not fuHy stripped, Ilne radiation In par
tlcular but also recomblnatlon radiation due
to free - bound transitions 15 targer than
bremsstrahlung by a considerable faetar.
If this faetor is K, then the aetual Pease
Braginskil current aecordlng to Eq. (3.16) Is
reduced by 1/ lK'. Fig. 3.6 shows the radlatlve energy lass
rate coefficlent for iron Ions In a hydrogen
plasma as funetion of temperature. It has
been plotted after model ealeulations by
Davis et al. [3.17]. PI refers to lIne radiation
after eollislonal exeitation and Pdr to that
after dlelectronic capture; Pb glves the can-
tribution due to bremsstrahlung and Prr due to radlative recombination.
At relevant temperatures, the factor K may easHy exceed 100 for high-z
elements resulting In Pease-Braginskil eurrents of 100 to 200 kA, whleh
are readUy produeed in laboratory diseharges.
Finally, at high densities the absorption of radiation has to be taken
Into account. Thls wIll reduce the loss rate and increase IpB ' It thus 15
obvious that a variation of the opacity and of the emission as indlcated
in Flg.3.6 will result in a correspondlng modulation of the compresslon,
Le. shrlnkage and expansion may even alternate. The apaelty intro duces
an additional dependence on the plasma radius whieh deflnes the equili
brlum radIus in case of power balance.
3.4 The low-inductance vllcuum spark
Vikrev et al. [3.16] applied the radiallve eollapse model to the hot spot
or micropinch in the low-Inductanee vaeuum spark discharge. A review
of our present-day knowledge as weil as of all published theoretieal and
experlmental investlgations has been prepared by Koshelev and Pereira
[3.18]. The deseripllon of the compression starts with an m = 0 Instabillty
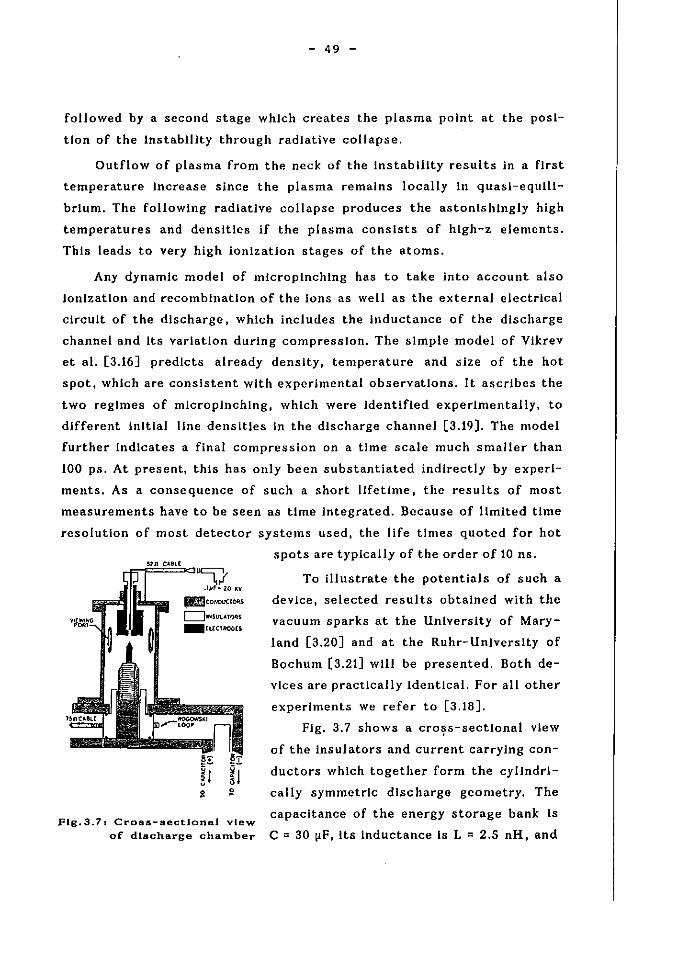
- 49 -
followed by a se co nd stage whleh ereates the plasma point at the posi
tion of the Instabillty through radlative eollapse.
Outflow of plasma from the neek of the Instability results in a first
temperature lncrease since the plasma remains locally In quasl-equHl
brlum. The followlng radlatlve eollapse produees the astonlshingly high
temperatures and densltles If the plasma consists of hlgh-z elements.
Thls leads to very high ionlzation stages of the atoms.
Any dynamlc model of microplnching has to take into account also
lonlzatlon and recombination of the Ions as weIl as the externaJ electrlcal
elreuit of the dlseharge, whleh inc1udes the induetanee of the dlseharge
channel and lts variatIon during compression. The sImple model of Vlkrev
et al. [3.16] predlets al ready denslty, temperature and slze of the hot
spot, which are consistent with experimental observatIons. It ascrlbes the
two regimes of mleroplnehlng, whleh were IdentifIed experlmentally, to
dIfferent Initial llne densitles In the dlseharge ehannel [3.19]. The model
further indieates a final compression on a time seale much smaller than
100 ps. At present, thls has only been substantiated indlreetly by experI
ments. As a consequence of such a short lifetime, the results of most
measurements have to be seen as time integrated. Because cf limited time
resolution of most detector systems used, the life times quoted for hot
Flg.3.7: Crosl5-sectJonal vlew of discharge charn.ber
spots are typlcally of the order of 10 ns.
To illustrate the potentials of such a
devlce, selected results obtained wlth the
vacuum sparks at the Unlverslty of Mary-
land [3.20] and at the Ruhr-Unlverslty of
Boehum [3.21] will be presented. Both de
vlees are praetlcally Identlcal. For all other
experiments we refer to [3.18].
Fig. 3.7 shows a cro~s-sectional vlew
of the insulators and current carrylng con
duetors whleh together form the cylIndrl
eally symmetrie diseharge geometry. The
capacitance of the energy storage bank Is
C = 30 ~F, Its Inductance is L = 2.5 nH, and
- 50 -
the maximum eharglng voltage Is 20 kV. The Induetanee of the total elreult
amounts to Ltot = 2S nH. When operated with Iron electrodes, the eh arg
Ing voltage Is usually 10 kV, and a maximum eurrent of 240 kA Is measured
at 1.5 ~s although mlcroplnching OCCUrs much earller. The energy stored
In the capaeltor bank amounts to 1.5 kJ In thls case.
The discharge Is Initlated by a trigger pulse to a third eleetrode co
axial wlthln the cathode; thls forms a cathode plasma from whlch electrons
are accelerated towards the anode, where they release a plasma jet. Both
plasmas move towards each other, and the current rises aB soon as they
meet. (Other experiments have also employed lasers to produce an initIal
plasma at the anode). The hot plasma points conslst malnly of anode
materIal.
Several dlagnostlc methods are used to study the dlscharges. A Ro
gowski loop monitors the derivative of the discharge current. and short
single and multiple dips Indlcate the time of pinching. These dips are
accompanled by intense bursts of x-rays, and time resolved spectroscoplc
measurements revealed that the dips are indeed correlated wlth the ap
pearance of plasma points.
The plasma slz" Is derlved from plnhole plctures In the x-ray region.
Metallic folls cut off the long-wavelength spectral emission. The slze of
plasma points of Iron Ions Is typlcally less than 8 ~m If the emission of
the helIumlike lonlzation stage Is observed, and It Is less than 6 ~m In
those cases where emission frorn hydrogenJike Ions can be detected. Plasma
poInts of alumlnum have a slze of about 40 \im on the average.
An estlmate of the electron temperature Is obtalned from the con
tinuum emission In the hard- x-ray region using the two-foll method. It
certainly ylelds reliable results only if the eJectrons have a MaxweIJlan
velocity distribution. The measurements [3.22] reveal two groups of plasma
points, whlch display a different sca!ing of the temperature with the atomlc
number of the anode material:
and T leV '" 0.32 Z3.t e (3.18)
Spectroscopic InvestlgatIons of the Une radiation In the x-ray region
as dlscussed in chapter 1 are used to derive electron äenslties and tem
peratures. Plane and curved crystal .spectrographs (Johann and Cauchois-
type) are
and cover
- 51 -
employed. The densltles also depend on the electrode material 20 -3 23-3
the range from about 10 cm to 10 cm .
Spectra of heliumlike Mo XLI were recorded photographlcally [3.21],
and even evldence of the Lyman-alpha doublet of hydrogenlike Mo XLII
was found when scanning the emJs~lon from discharge to discharge using
a Bragg-crystal spectrometer [3.20]. The present spectroscoplc arrange
ment utillzes a multlchannel-plate detector wlth a phosphor sereen. The
light emltted from thls screen Is imaged onto an optleal multlchannel
analyzer, whlch transfers the spectrum to a computer for convenient eva
luation and analysis. In thls way It was possible to study details even of
the Lyman-alpha emission of Fe XXVI from individual discharges [3.23].
References
[3.1] H. R. Grlem, Plasma Spectroscopy, McGraw-Hill, New York 1964.
[3.2] S. Sakabe, R. Sigel, G. D. Tsaklrls, I. B. Földes, and P. Herrmann,
Phys. Rev. 38, 5756 (1988).
[3.3] F. Böttcher, U. Ackermann, and H.-J. Kunze, Appl. Opt. 25,3307
(1986),
[3.4] F. O'Neill, In Laser-Plasma Interactions 4, Proc. 35 th Scottlsh
Unlversltles Summer School In Physlcs, ed. M. B. Hooper, Edin
burgh Unlversity Press, 1989.
[3.5] N. R. Perelra and J. Davls, J. Appl. Phys. 64, RI (988),
[3.6] Dense Z-Plnches, eds. N. R. Perelra, J. Davls, and N. Rostoker,
AlP Conf. Proc. 195, New York 1989.
[3.7] J. Shiloh, A. FIsher, and N. Rostoker, Phys. Rev. Lett. 40, 515
(1976).
[3.8] B. Edlen, Physlca 13, 545 (1947),
[3.9] L. Cohen, U. Feldman, M. Swartz, and J. H. Underwood, J. Opt.
Soc. Am. 56, 843 (1968),
[3.10] R. S. Pease, Proc. Phys. Soc. London B 70, 11 (957).
[3.12] S. I. Braglnskll, Sov. Phys. JETP 6, 494 (1958).
[3.13] A. E. Robson, Phys. Fluids B 1, 1834 (1989),
[3.14] J. W. Shearer, Phys. Fluids 19, 1426 (976).
[3.15] C. R. Negus and N. J. Peacock, J. Phys. D: Appl. Phys. 12, 91 (979),
- 52 -
[3.16] V. V. Vlkrev, V. V. Ivanov, and K. N. Koshelev, Sov. j. Plasma
Phys. 8, 688 (1982),
[3.17] j. Davls, V. L. jacobs, P. C. Kepple, and M. Blaha, j. Quant. Spec.
trosc. Radlat. Transfer 17, 139 (1977).
[3.18] K. N. Koshelev and N. R. Perelra, Rev. Appl. Phys., to be published.
[3.19] P. S. Antslferov, K. N. Koshelev, A. E. Kramlda, and A. M. Panln,
j. Phys. D: Appl. Phys. 22, 1073 (1989).
[3.20] j. j. Turechek and H.-j. Kunze, Z. Physik A 273, 111 (1975),
[3.21] R. Beler and H.-j. Kunze, Z. Physik A 285, 347 (978),
[3.22] R. Burhenn, B. S. Harn, S. Gossling, H.- j. Kunze, and D. Mlelczarski,
j. Phys. D: Appl. Phys. 17, 1665 (1984),
[3.23]. A. Schulz, R. Burhenn, F. B. Rosme;, and H.- j. Kunze, j. Phys. D:
Appl. Phys. 22, 659 (1989),
- 53 -
Continuous Emission of Plasma in the Soft X-Ray Region
P.Bogen
Institute of Plasma Physics
Association EURATOM·KFA
Forschungszentrum Jülich GmbH, Fed. Rep. of Germany
- 54 -
I. Continuous emission of plasma in the soft X-ray region
P. Bogen. Institut fUr Plasmaphysik, Forschungszentrum JUlich GmbH, Ass. EURATOM/KFA.
Postfach 19 13. 0-5170 JUlich / FRG
1. Introductfon
The limits of the soft X-ray region are not well deffned, but usually they are taken at 2 Ä < it < 100 Ä in the wavelength scale and 100 eV < hv<
5 keV in the energy scale. They are characterized by a strang absorption
in air and a bad reflectivity on all surfaces except at grazing incidence. This means that it is necessary to war!< in vacuum and that imaging is made difficult. Examples of plasma sources of soft X-radiation are:
High voltage vacuum spark, Sliding spark,
Theta-pinch, z-pinch, Tokamak,
Laser produced plasma, Stellar objects.
There are also non-plasma sourees, which are often used e.g. for
calibration purposes:
X-ray tube,
Synchrotron.
Continuous soft X-radiation are used for the d1agnost1c of laboratory and
stellar plasmas /1,21, for microscopy of biological objects /3/ and for
appl ications in sol id state physics /4/. We are ma1nly interested in the
first mentioned application. The electron occupat1on of the d1screte
levels of the atoms in a plasma often show strong deviations from that in
thermal equilibrium, whereas the occupation of the continuous levels is
well approximated by that in thermal equilibrium, i .e. by a Maxwellian
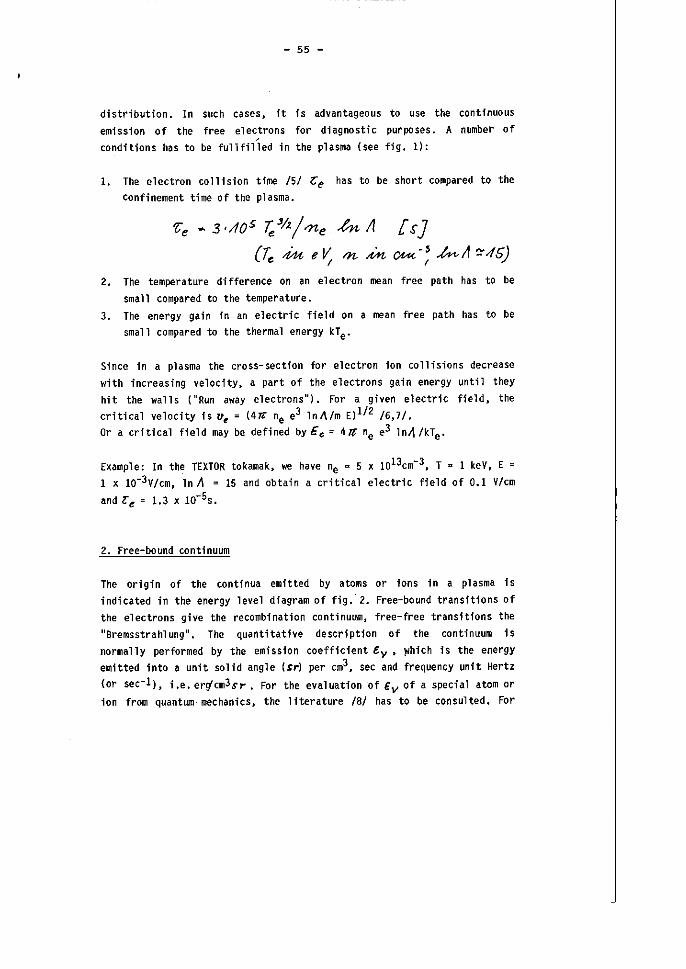
- 55 -
distribution. In such cases, ft 1s advantageous to use the cont1nuous
emission of the free electrons for dfagnostic purposes. A number of
conditions has to be fullfilled in the plasma (see fig. 1):
1. The electron co111sion time 151 Ce has to be short compared to the
confinement time of the plasma.
'Ce - 3· ,10s T/'7./ "rle -?n 11 !.r] (T. .i-u c Ij 1'11- ..in OU< -: .h<-11 ':46)
2. The temperature difference on an electron mean free path has to be
small compared to the temperature.
3. The energy gain 1n an electric field on a n:ean free path has to be
small compared to the thermal energy kTe .
Since in a plasma the cross-section for electron ion collisions decrease
with increasing velocfty, apart of the electrons gain energy until they
hit the walls ("Run away electrons"). For a given electric ffeld, the
critical velocity 1s v e '" (47(:' ne e3 lnl\lm E)1/2 16,7/. Or a critical field may be defined by Ee ;:: 4" ne e3 lnl\ IHe .
Example: In the TOTOR tokamak, we have ne ;:: 5 x 1013cm-3, T :;:: 1 keV, E ;::
1 x 1O-3V/cm, ln 1\ '" 15 and obtain a critical electric ffeld of 0.1 V/cm
and le = 1.3 x 10⁻⁵s.
2. Free-bound continuum
The origin of the continua eJllitted by atoms or ions in a plasma is
indicated in the energy level dfagram of fig." 2. Free-bound transitions of
the electrons give the recomb1nation continuum. free-free transitions the
"Bremsstrahlung". The quantitative descriptfon of the continuum 1s
normally performed by the emission coefficient E. y • )'Jhich is the energy
emitted into a unit solid angle (~r) per cm3, sec and frequency unit Hertz
(or sec1). i.e. ergcm3sr. For the evaluation 'of Ev of a special atom or
ion from quantwn' mechanics, the lfterature 181 has to be consulted. For
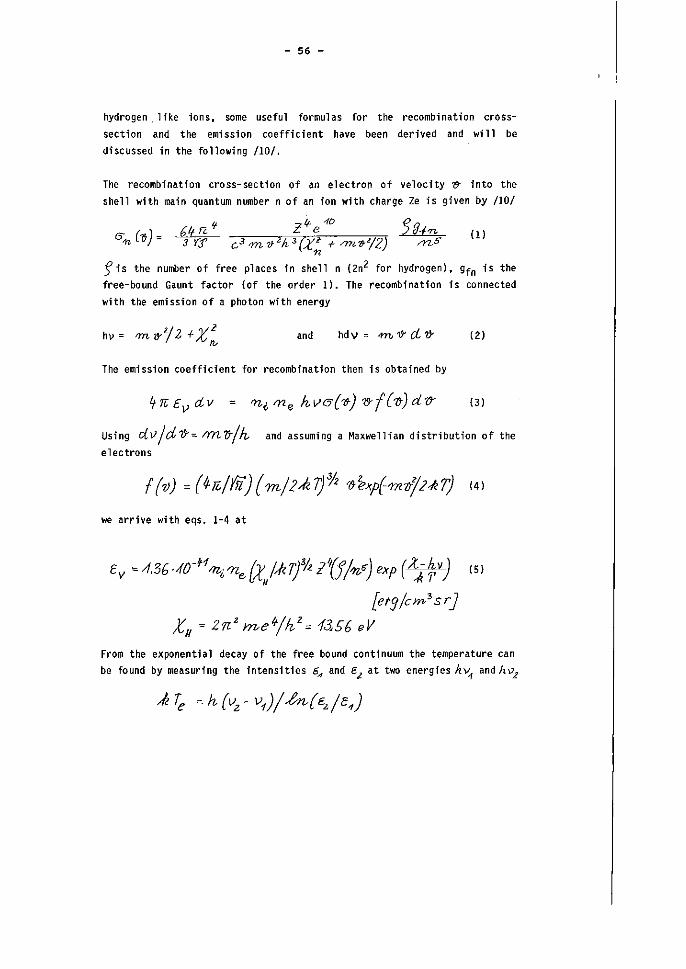
- 56 -
hydrogen lfke ions. same useful formulas for the recombination cross
sect;on and the emission coefficient have been derived and will be
discussed in the fo11o\ll1n9 /10/.
The recombination cross-section of an electron of velocity '& into the shell wfth main quantum number n of an ion with charge Ze is given by 110/
(1)
.) is the number of free places 1n shell n (2n2 for hydrogen). gfn is the
free-bound Gaunt factor (of the order 1). The recombination is connected
with the emission of a photon with energy
and (2)
The emission coefficient for recomb;nation then is obtained by
~rc EV dv n" /Yl. hvt3(lJ) zr ((rt)drY (3)
Using clv/d?J-=. /Y'n7t/k and assuming a Maxwellian distribution of the
electrons
we arrive with eqs. 1-4 at
Ev = -1.36 .40-f1 /tb, 'Yle tt/Ji r)o/z Zff/-nf) exp (:ti~V) (5)
[etg/cm'sr) X" = Zn' me'ik 2 = 135{' eV
From the exponential decay of the free bound cont1nuum the temperature can
be found by measuring the intensities °4 and E-z at two energfes hY1 and hvz
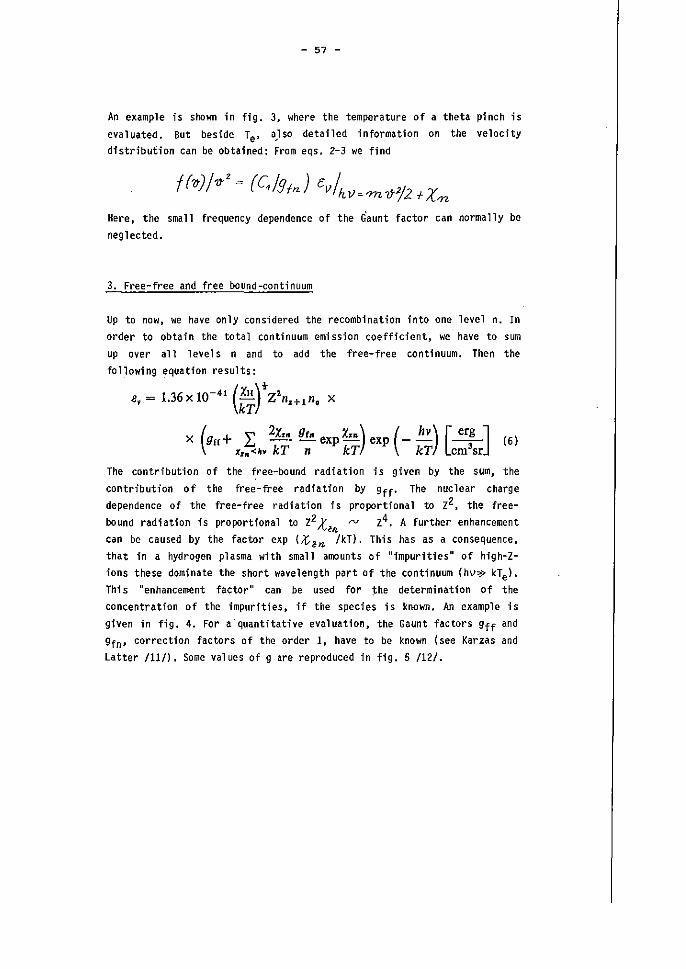
- 57 -
An example i s shown in fi g. 3. where the temperature of a theta pi neh i 5
evaluated. But beside Te' a)so detailed information on the velocity
distribution can be obtained: From eqs. 2-3 we find
Here, the small frequency dependence of the G'aunt factor can normally be
neglected.
3. Free-free and free bound-continuum
Up to now, we have on1y considered the recombination into one level n. In
order to abtain the total continuum emi ssion coefficient, we have to surn
up over all levels n and to add the free-free continuum. Then the
fol1owing ~quation results:
e, = 1.36 X 10⁻⁴
' (:;fz'n,+,n, X
x (grr+ L 2X,. g,. exp x .. ) exp (- !!!..) .,.<h. kT n kT kT [erg]
cm3sr (6 )
The contribution of the ~ree-bound radiation is given by the surn, the
contribution of the free-free radiation by 9ff' The nuclear charge
dependence of the free-free radiation is proportional to Z2, the free
bound radiation is proportional to Z2 -y rv Z4. A further enhancement
'"'" can be caused by the factor exp Ltln /kT). This has as a consequence,
that in a hydrogen plasma with small amounts of "impurities" of high-Z
ions these dominate the short wavelength part of the continuum (hv?,> kTe ).
Thi s "enhancement factor" can be used for the determination of the
concentration of the impurfties, if the species is known. An example is
given in fig. 4. For a quantitative evaluatio[l. the Gaunt factors 9ff and
gfn' correction factors of the order I, have to be known (see Karzas and
Latter 111/). Some values of gare reproduced in fig. 5/12/.
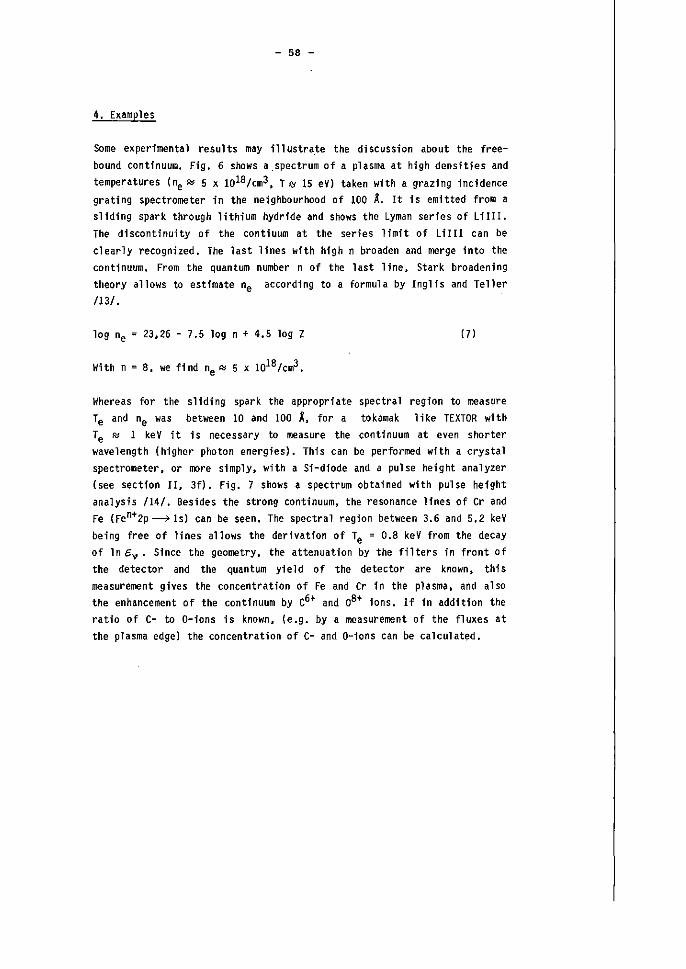
- 58 -
4. Examples
Some experimental results may ill ustra.te the df scussion about the free
bound contlnuum. Fig. 6 shows a.spectrum of a plasma at high densities and
temperatures (ne R::: 5 x 10¹⁸ jcm3• T f,'j 15 eV) taken with a grazing incidence
grating spectrometer in the neighbourhood of 100 A. It Is emftted from a
slidfng spark through lithium hydride and shows the Lyman series of Li IlI.
The dlscontinuity of the contiuum at the series limit of LiIII can be
clearly recognized. The last lines with high n broaden and merge into the
continuum. From the quantum number n of the last line. Stark broadening
theory allows to est1mate ne according to a formula by Ing11s and Teller
/13/.
log ne ::: 23.26 - 7.5 log n + 4.5 log Z (7)
Whereas for the slfding spark the appropriate spectral region to rneasure
Te and ne was between IO and 100 t for a tokamak 1 i ke TEX TOR wl th
Te ~ 1 keV it Is necessary to measure the continuum at even shorter
wavelength (higher photon energies). This can be perforrrled wfth a crystal
spectrometer. or IOOre simply. with a SI-diode and a pulse height analyzer
(see section 11, 3f). Fig. 7 shows a spectrum obtained with pulse helght
analysis /14/. Besides the strong continuum, the resonance llnes of Cr and
Fe (Fen+2p ~ ls) can be seen. The spectral region between 3.6 and 5.2 keV
being free of lines allows the derivation of Te ::: 0.8 keV from the decay
of ln c v ' Since the geometry. the attenuation by the filters in front of
the detector and the quantum yleld of the detector are known. this
measurement gives the concentration of Fe and Cr in the plasma. and also
the enhancement of the continuum by C6+ and 08+ ions. lf in addition the
ratio of C- to O-ions is known, (e.g. by a measurement of the fluxes at
the plasma edge) the concentration of C- and 0-lons can be calculated.
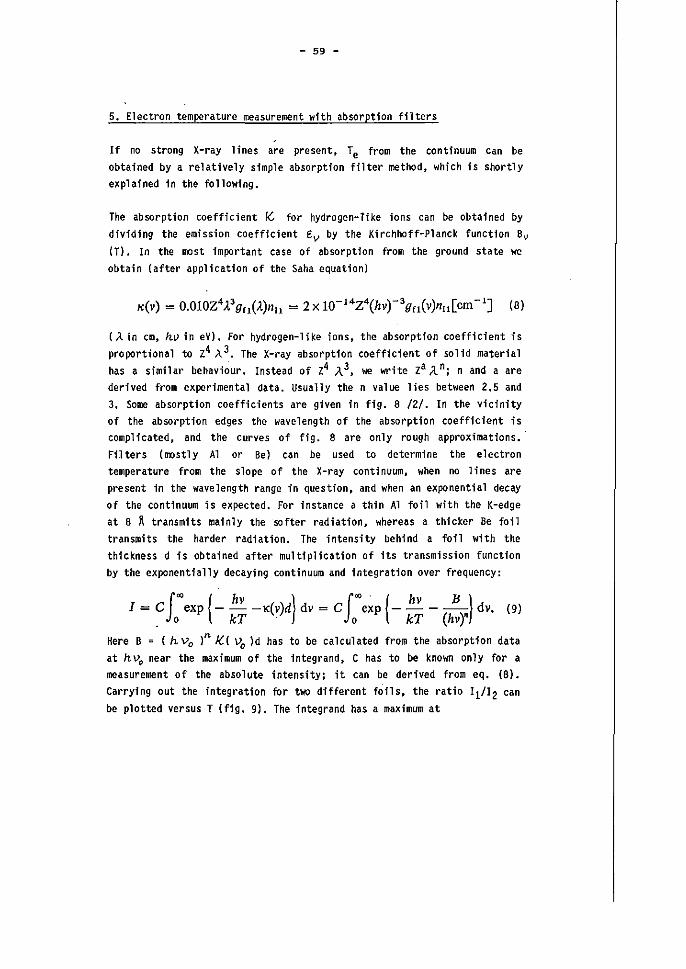
- 59 -
5. Electron temperature measurement wfth absorption filters
If no strang X-ray lines are present, Te from the continuum can be
obtained by a relatively simple absorption filter method, which is shortly explained 1n the following.
The absorption coefficient /C for hydrogen-Tike ions can be obtafned by
divfdfng the emission coefficient €v by the Kfrchhoff-Planck functfon Bv (r). In the most important case of absorption from the ground state we
obtain (after application of the Saha equation)
(;t in cm. hv in eV). For hydrogen-like ions, the absorption coefficient is
proportional to z4 A 3 . The X-ray absorption coefficient of solid material
has a similar behaviour. Instead of z4 i\.3. we write Za it n; n and aare
derived from experimental data. Usually the n value lies between 2.5 and
3. Some absorption coefficients are given in fig. 8 /2/. In the vicinity
of the absorption edges the wavelength of the absorption coefficient is
complicated. and the curves of fig. 8 are only rough approximations.'
Fi.1 ters (rr.ostly Al or Be) can be used to determine the electron
temperature from the slope of the X-ray continuum, when no lines are
present in the wavelength range in question, and when an exponential decay
of the continuum is expected. For instance a thin Al foil with the K-edge
at 8 Ä transmits mainly the softer radiation. whereas a thicker Be foil
transmits the harder radiation. The intensity behind a foil with the
thickness d is obtained after multipl ication of its transmission function
by the exponentially decaying continuum and integration over frequency:
1= cf."'exp (- !!!.- -K(V)d) dv = cf."'e~p (_!!!.- - ~) dv. . 0 kT· 0 kT (hv)"
(9)
Here B '" (h Va )/1. ,!C( Vo )d has to be calculated from the absorption data
at hvc> ne ar the maximum of the integrand, C has to be known only for a measurement of the absolute intensity; it can be derived trom eq. (8).
Carryfng out the integration for two different foils, the ratio 11/12 can
be plotted versus T (fig. 9), The integrand has a maximum at
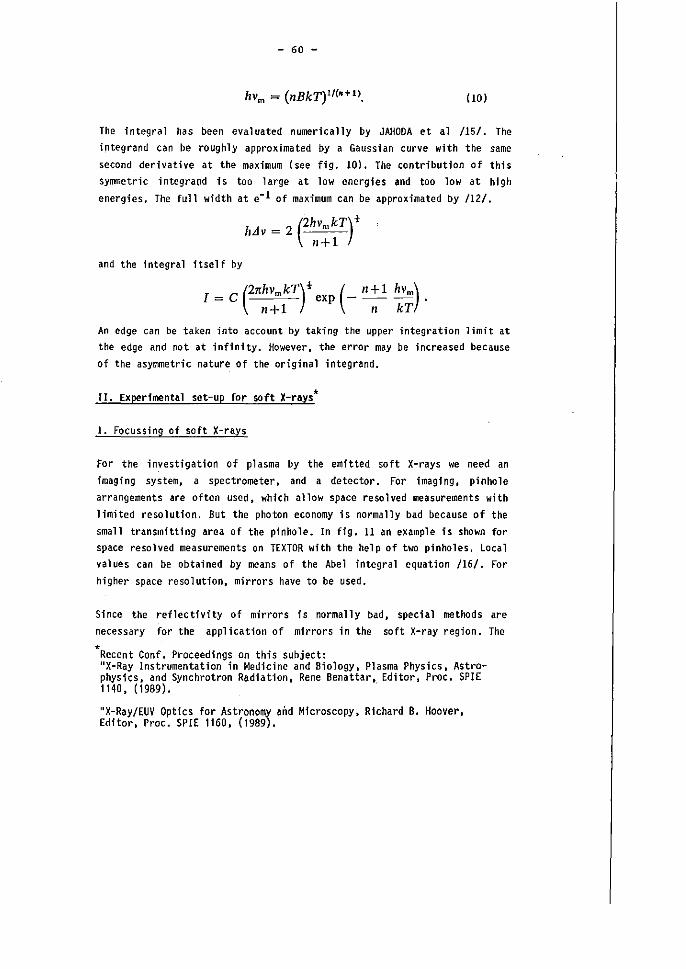
- 60 -
(JO)
The integral has been evaluated numerically by JAHOOA et al /15/. The
integrand can be roughly approximated by a Gaussian curve wHh the same
second derivative at the maximum (see fig. 10), The contribut1on of this
syrrmetric integrand 15 tao large at low energ1es and too lew at high
energies. The full width at e- 1 cf maximum can be approximated by 112/.
hAv = 2 (2hVrn kT)+ "+1
and the integral itself by
I = C (27rhVrn kT)t exp (_ "+1 hVrn) •
"+1 n kT
An edge can be taken into account by taking the upper integration limit at the edge and not at inf1nity. However, the errer may be increased because
of the asymmetrie nature of the original integrand.
II. Experimental set-up for soft X-rays*
1. Focussing cf soft X-rays
for the investigation of plasma by the emftted soft X-rays we need an
imaging system, a spectrometer, and a detector. For imagfng, pinhole
arrangements are often used, whfch allow space resolved measurements with
limited resolution. But the photon economy 1s normally bad because of the
small transmftting area of the p1nhole. In fig. 11 an example fs shown for
space resolved measurements on TEXTOR wfth the help of two pinholes. Local
values can be obtained by means of the Abel integral equation /16/. For
higher space resolution, mirrors have to be used.
Since the reflectfvi'ty of mirrors 1s normally bad, special methods are
necessary for the application of mfrrors in the soft X-ray region. The
* Recent Conf. Proceedings on this subject: "X-Ray Instrumentation in Medicine and Biology, Plasma Physics, Astrophysics, and Synchrotron Radiation, Rene Benattar, Editor, Proc. SPIE 1140, (1989). .
"X-Ray/EUV Optics for Astronomy and Microscopy, Rfchard B. Hoover, Editor, Proc. SPIE 1160, (1989).
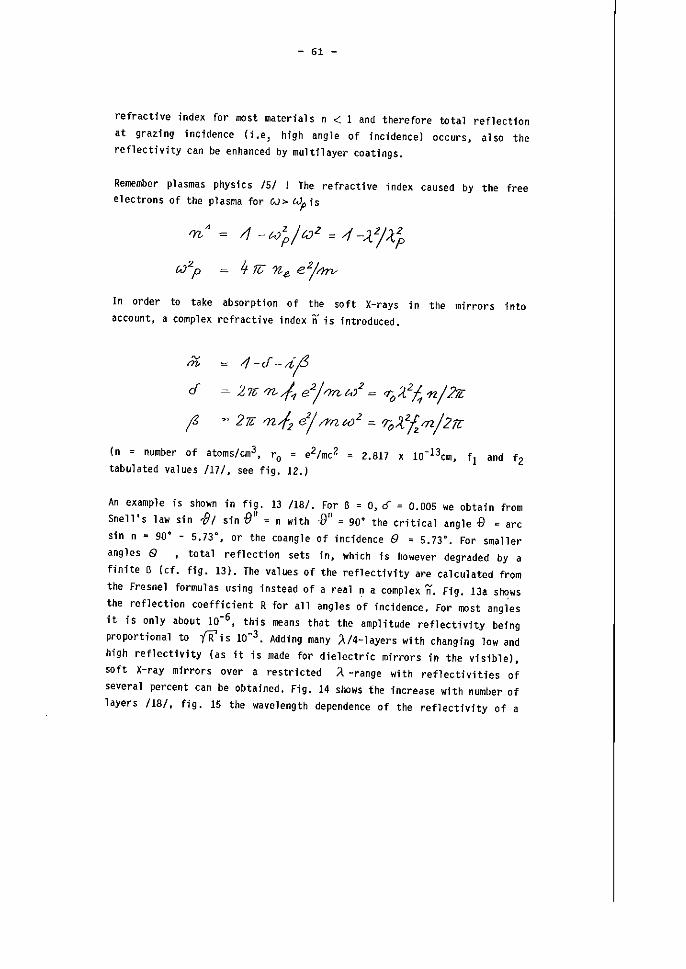
- 61 -
refractive index for IOClst material sn< 1 and therefore total reflectfon
at grazing incidence (i.e; high angle of incidencel occurs, also the
reflectivity can be enhanced by multilayer eoatings.
Remember plasmas physfes 151 ! The refraetive index eaused by the free eleetrons of the plasma for 0> tJp is
(,}2 P
In order to take absorption of the soft X-rays in the mirrors into aecount, a eomplex refraetive index n is fntrodueed.
,;;; ~ 1-cf --if cf 2n; /J& J, e1/1n tJ = "0;(21, n/271:
f 271 qzfz ej ;1n?02 ~ "O:tTzmj21l
(n = number of atoms/cm3 , ro = e2/mc 2 '" 2.817 x 10⁻¹³em, f1
and f2 tabulated values 117/, see fig. 12.)
An example is shown in fig. 13 118/. For ß = 0,6' = 0.005 we obtain from
Snel1's law sin ~I sin tJlt = n with .eil = 90° the eritieal angle.g = are
sin n == 900 - 5.73°, or the coangle of incidence 9 == 5.73°. For smaller
angles @ ,total refleetion sets in, which is however degraded by a
finite ß (cf. fig. 13). The values of the reflectivity are ealculated from
the Fresnel formulas using instead of a real ~ a eomplex n. Fig. 13a s~ws
the reflection eoefficient R for all angles of incidenee. For most angles
it is only about 10-6, this means that the amplitude refleetivity being
proportional to -{jfis 10-3 . Addfng many Al4-1ayers with changing lowand
high reflectfvity (as it is made for dielectrie mirrors in the visible).
soft X-ray mirrors over a restricted A. -range with reflectivities of
several pereent can be obtafned. Fig. 14 shows the increase with number of
layers 118/. fig. 15 the wavelength dependenee of the refleetivity of a
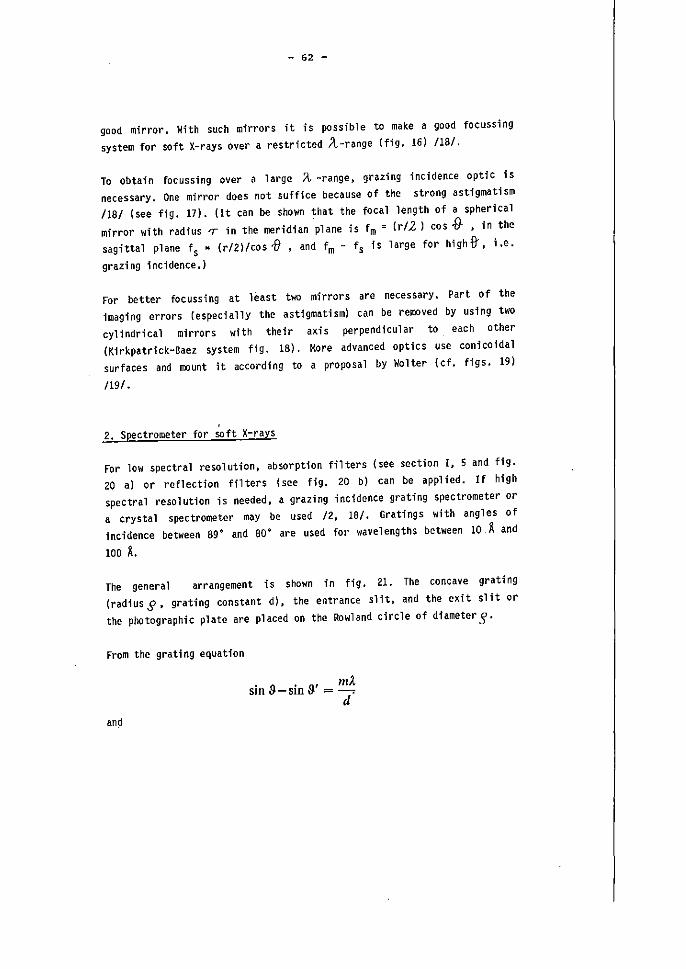
- 62 -
good mirror. With such mirrors it is possible to make a good focussing
system for soft X-rays over a restricted Il-range (fig. 16) 118/.
Ta obtain focussing over a large It -range, grazing incidence optic 1s
necessary. One mirror does not suffice because of the strong astigmatism
1181 (see fig. 1]). (It can be shown that the focal length of a spherical
mirror with radius rr in the meridian ·Plane is f m '" (rI2) cos,g. , in the
,agittal plane I, = (r/2)/co, f1 • and Im - I, i, large lor highB'. i.e.
grazing incidence.)
For better focussing at least two mirrors are necessary. Part of the
imaging errors (especially the ast1gmatism) can be removed by using two
cylindrical mirrors with their axis perpendicular to each other
(Kirkpatrick-Baez system fig. 18). More advanced optics use conicofdal
surfaces and rr.ount it according to a proposal by WoHer (cf. figs. 19)
/19/.
2. Spectrometer for soft X-rays
For low spectral resolution, absorption filters (see section I, 5 and fig.
20 a) or reflection filters (see fig. 20 b) can be applied. lf high
spectral resolution is needed, a grazing incidence grating spectrometer or
a crystal spectrometer may be used 12, 18/. Gratings with ang1es of
incidence between 89° and 80° are used for wavelengths between 10 Ä and
100 t
The general arrangement is shown in fig. 21. The co nc ave grating
(radiusg, grating constant d), the entrance slit, and the exit slft or
the photographic plate are placed on the Rowland circle of diameter s·
From the grating equation
. n • n' mJ. SIß l7-sm 17 =-.
d
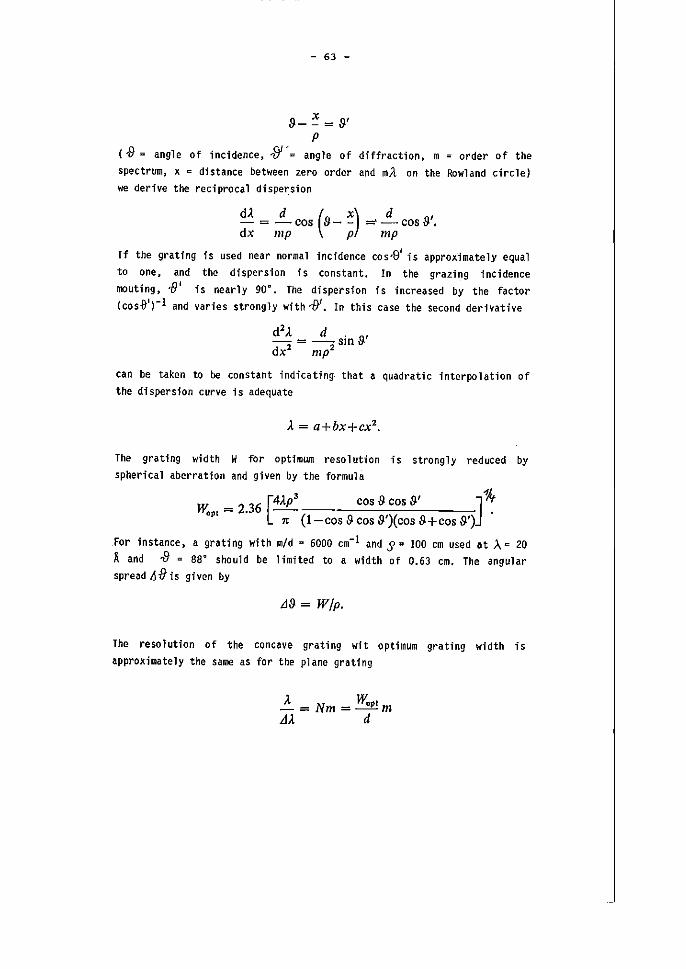
- 63 -
9-: = 11' p
( ,f}:::: angle of incidence • .{j ~:::: angle of diffraction, m -= order of the
spectrum, x = distance between zero order and mit on the Rowland circle)
we derive the reciprocal dispe~sfon
dA = ~ COS (11_ :) dx IIlp P
d 11' ='-cos . IIlp
If the grating is used near normal incidence co 5-9' is approx-imately equal
to one, and the dispersion is constant. In the grazing incidence
rrouting, 1}' is nearly 90 D
• The dispersion is increased by the factor
(cos.[}')-l and varies strongly with 1)1. In this ca se the second deriVative
can be taken to be constant indicating. that a quadratic interpolation of
the dispersion curve is adequate
A = a+bx+cx2•
The grating width W for optimum resolution is strongly reduced by spherical aberration and given by the formula
w, .. = 2.36 [4AP3 cos 11 co. 9' J~ " (i-co. 9 cos 9')(cos lI+co. 9')
.For instance, a grating with m/d '" 6000 cm- 1 and .J:: 100 cm used at A:: 20
Ä and -8;:: 88 0 should be limited to a width of 0.63 cm. The angular
spread iltfis given by
Ll9 = W/p.
The resolution of the concave grating wit optimum grating width is
approximately the same as for the plane grating
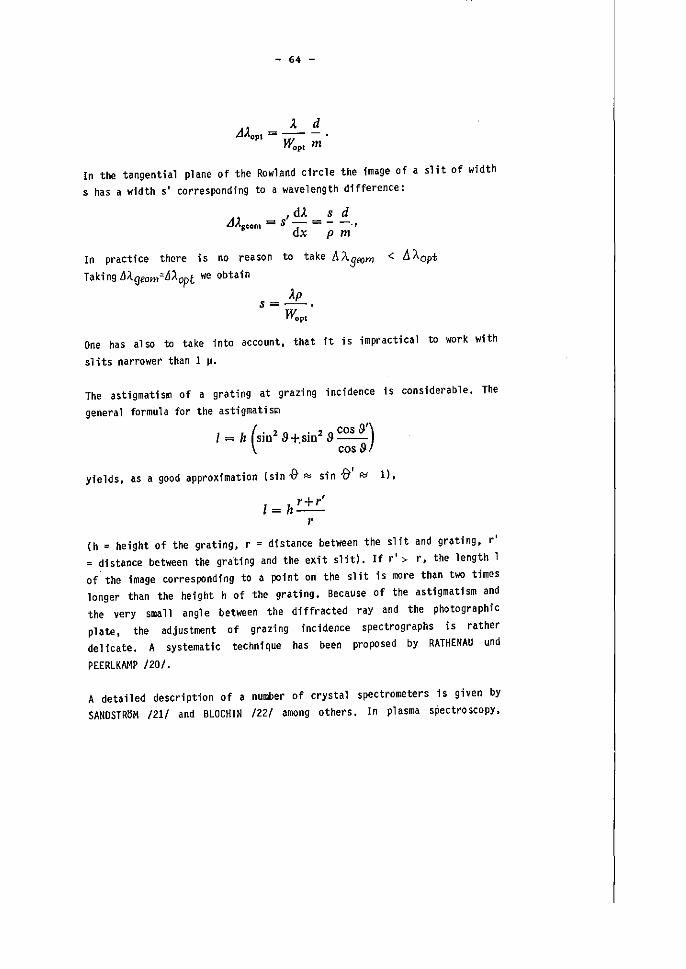
- 64 -
). d ,d)..,. = -- -
WOP1 m
In the tangential plane of the Rowland circle the image of a slit of width
s has a width 5' corresponding to a wavelength difference:
, d)' s d AAscom = s - = - -
dx pm
In practice there is no reason to take 8Agoom < LlAopt
Taking ß;(9eom~AAopt we obtain
Äp s= --.
Wopt
One has also to take into account, that it is impractical to work. with
slits narrower than 1 ~.
The astigmatism of a grating at grazing incidence 1s considerable. The
genera' formula for the ast; gmati sm
I = /J (Sin2 .9+.sin2 .9 cos .9') cos .9
yields. as a good approximation (sin.f} ~ sin -9' ~ 1).
I=h r +r ' r
(h = height of the grating, r = distance between the 51ft and grating, r' = distance between the grating and the exit slit). If r' > r, the length 1
of the image corresponding to a point on the 51it is more than two times
longer than the height h of the grating. Because of the astigmatism and
the very small angle between the diffracted ray and the photographie
plate, the adjustment of grazing incidence spectrographs is rather
delicate. A systematic technique has been proposed by RATHENAU und
PEERLKAMP /20/.
A detailed description of a number of crystal spectrometers is given by
SANDSTRöM /21/ and BLDCHIN /22/ among others. In pl asm. speetro seopy.
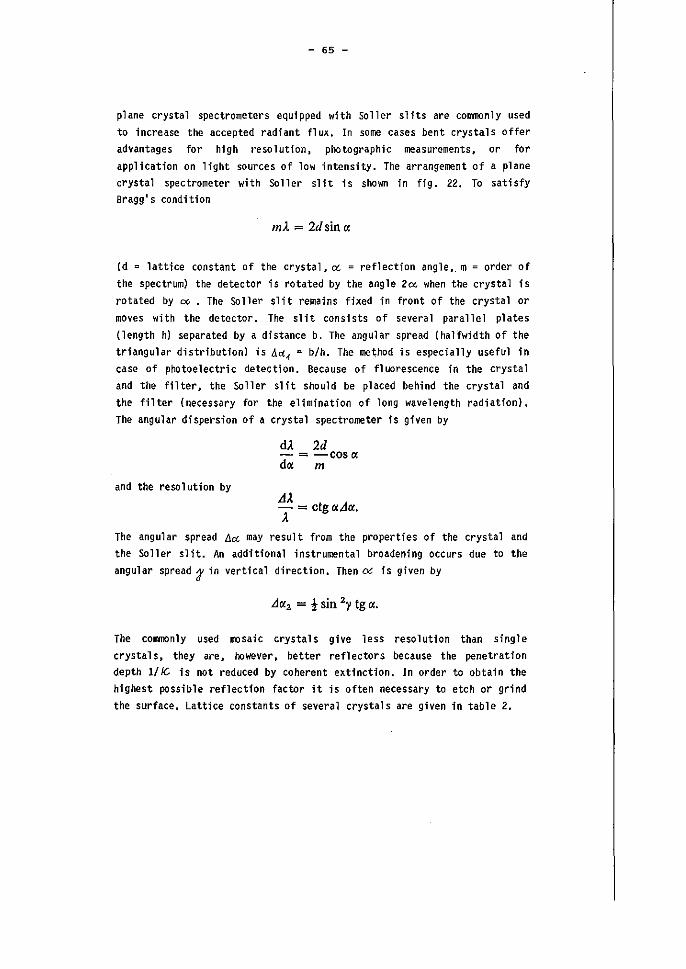
- 65 -
plane crystal spectrometers equipped with Soller slits are commonly used
to increase the accepted radiant flux. In some cases bent crystals offer
advantages for high resolution, photographic measurements, or for
application on light sources of low intensity. The arrangement of a plane
crystal spectrometer with $oller slit is shown 1n fig. 22. To satisfy
Bragg's condition
m.< = 2d sin rt
(d '" lattice constant of the crystal, Ci. ::: reflection angle •. m ::: order of
the spectrum) the detector is rotated by the angle 2~ when the crysta1 is
rotated by C(.. • The $oller slit remains fixed in front of the crystal or
moves with the detector. The slit consists of several parallel plates
(length h) separated by a distance b. The angular spread (halfwidth of the
triangular distribution) is Ad" =- b/h. The me1;hod is especially useful in
case of photoelectric detection. Because of fluorescence in the crystal
and the filter. the Soller sl it should be placed behind the crystal and
the filter (necessary for the elimination of 10ng wavelength radiation).
The angular dispersion of a crystal spectrometer fs given by
and the resolution by
d'< 2d - = -coscc drt m
.1'< - = ctg rtArt • .<
The angular spread lla. may result from the properties of the crystal and
the $Oller sl it. An additional instrumental broadening occurs due to the
angular spread'3' in vertical direction. Then cx 1s given by
Art2 = t sin 21 tg rt.
The commonly used mosaic crystals give less resolution than single
crysta 1 s. they are, however, better refl ectors because the penetration
depth 1I1C is not reduced by coherent ext1nction. In order to obtain the
highest possible reflectfon factor it is often necessary to etch or grind
the surface. Lattice constants of several crystals are given in table 2.
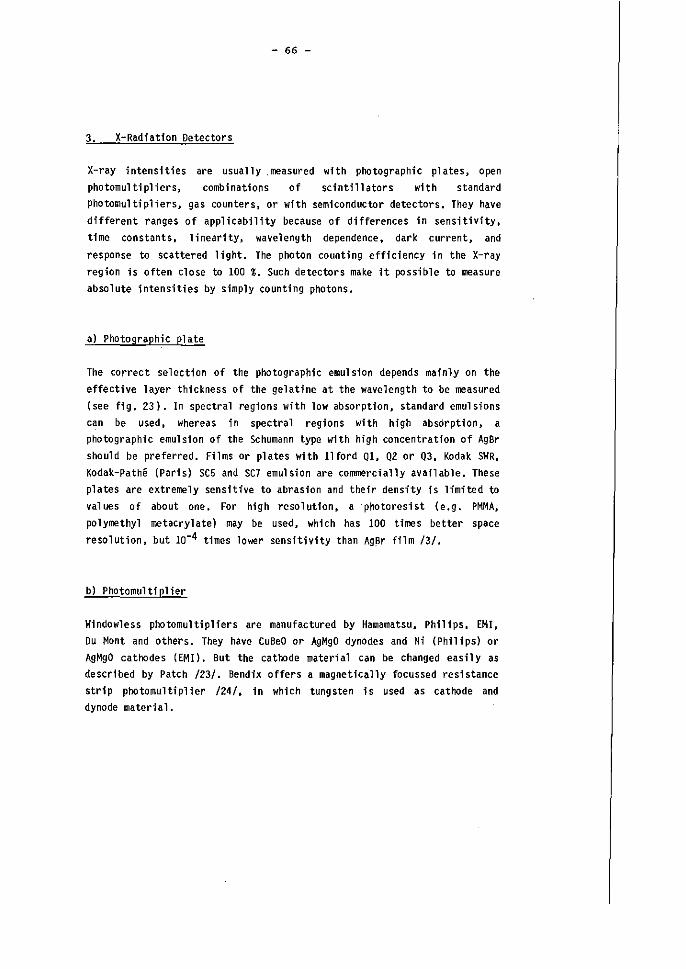
- 66 -
3. X-Radiation Detectors
X-ray intens1ties are usual1y.measured wfth photographie plates. open
photomul ti pl iers, combinatfons of scinti' 1 ators w1 th standard
photomultipliers, gas counters. or wfth semiconductor detectors. They have different ranges of appl icabil ity because of differences in sensitivity,
time constants, linearity. wavelength dependence. dark current. and response to scattered light. The photon counting efficiency 1n the X-ray
region is often close to 100 t. Such detectors make it possible to measure
absolute intensities by simply counting photons.
a) Photographie plate
The correct select10n of the photographie emul sioß depends mainly on the
effective layer thickness of the gelatine at the wavelength to be measured
(see fig. 23). In spectral regions with low absorption, standard emulsions
can be used, whereas ; n spectra 1 regions with hi gh absdrpti on, a
photographic emulsion of the Schumann type with high concentration of AgBr
should be preferred. Films or plates with 11 ford Q1, Q2 or Q3, Kodak. SWR,
Kodak.-Pathe (Paris) SC5 and SC7 emulsion are commercially avaflable. These
plates are extremely sensftfve to abrasion and thefr density is limfted to
values of about one. For high resolution, a -photoresist (e.g. PMMA,
polymethyl metacrylate) may be used, which has 100 tiroos better space
resolution, but 10-4 times lower sensitivity than Ag~r film /3/.
b) Photomultiplier
Windowless photomultipliers are manufactured by Hamamatsu, Philips. EMI,
Du Mont and others. They have CuBeO or AgMgO dynodes and Ni (Phil {ps) or
AgMgO cathodes (EMI). But the cathode material can be changed easily as
described by Patch /23/. Bendix offers a magnetfcally focussed resistance
str1 p photo multi pl ier /24/. in whi eh tung sten i s used as cathode and
dynode material.
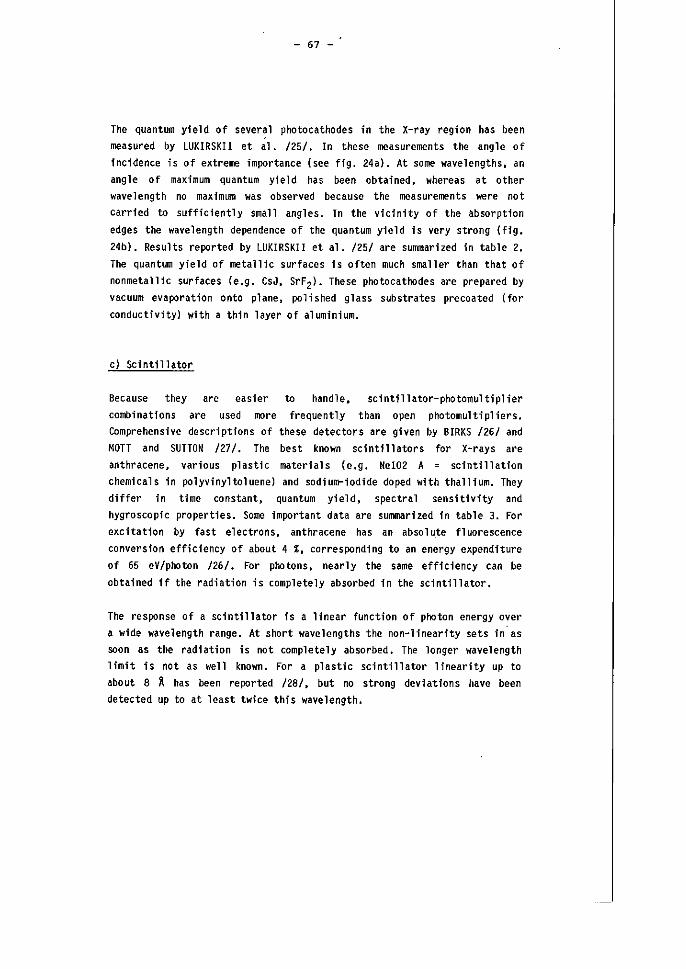
- 67 -
The quantum yield of sever~l photocathodes in the X-ray region has been
measured by LUKIRSKIl et al. /25/. In these measurements the angle of
fncfdence is of extreme importance (see fig. 24a). At some wavelengths, an
angle of maximum quantum yfeld has been obtained~ whereas at other
wavelength no maximum was observed because the measurements were not
carried to sufficiently sma'1 angles. In the vicinity of the absorption
edges the wavelength dependence of the quantum yield is very strong (fig.
24b). Results reported by LUKIRSKII et a1. /25/ are summarized 1n table 2.
The quantum yield of metallic surfaces is often much srnaller than that of
nonmetallic surfaces (e.g. CsJ, SrF2). These photocathodes are prepared by
vacuum evaporation onto plane, polished glass substrates precoated (for
conductivity) with a thin layer of aluminium.
c) Scintillator
Because they are easier to handle. scintillator-photomultiplier
combinations are used more frequently than open photomultipliers.
Comprehensive descriptions of these detectors are gfven by BIRKS /26/ and
MOTT and SUTTON /21/. The best known sc1ntillators for X-rays are
anthracene, various plast;c materials (e.g. Nel02 A = scintillation
chemicals in polyvinyltoluene) and sodium-iodide doped with thallium. They
differ in time constant, quantum yield, spectral sensitfvity and
hygroscopic properties. Some important data are summarfzed in tab1e 3. For
excitation by fast electrons, anthracene has an absolute fluorescence
conversion effic1ency of about 4 t, corresponding to an energy expenditure
of 65 eV/photon /26/. For photons, nearly the same eff1ciency can be
obtained if the radiation is completely absorbed 1n the scintillator.
The response of a scintillator is a linear function of photon energy over
a w1de wavelength range. At short wavelengths the non-linearity sets in as
soon as the radiation is not completely absorbed. The langer wavelength
limit 1s not as well known. For a plastic scintil1ator linearity up to
about 8 ~ has been reported /28/. but no strong deviations have been
detected up to at least twice this wavelength.
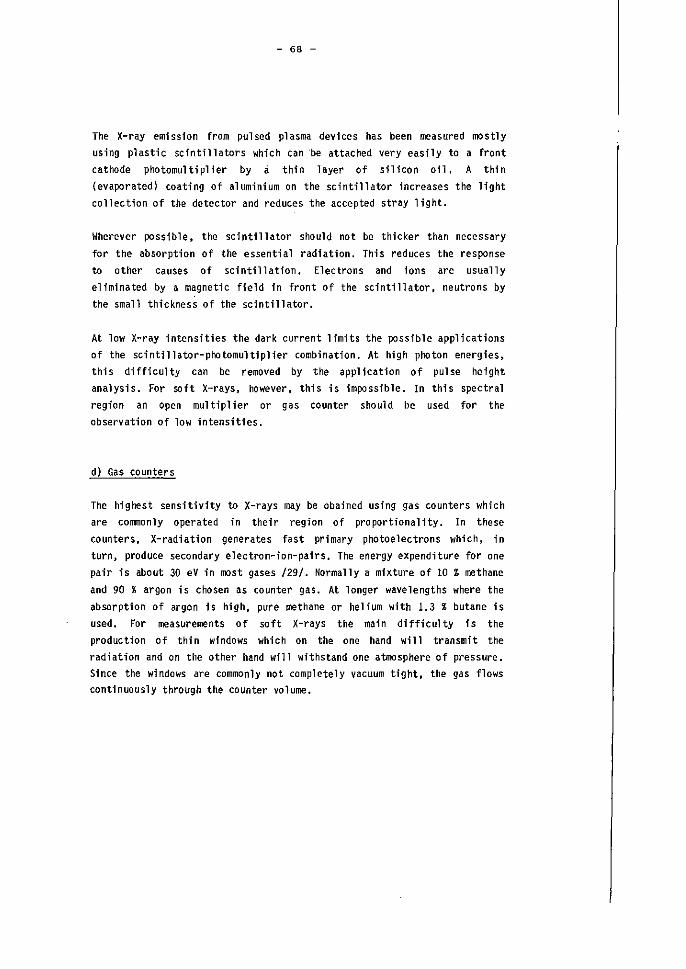
- 68 -
The X-ray emission from pulsed plasma devices has been measured mostly
using plastic sc1ntillators which can 'be attached very easily to a front
cathode photomultiplier by a thin layer of silicon 011. A thfn
(evaporatedl coating of aluminium on the scintillator increases the light
collect;on of the detector and reduces the accepted stray light.
Wherever possible, the scintfllator should not be thicker than necessary
for the absorption of the essential radiation. This reduces the response
to other Causes of scintl1lation. Electrons and fons are usually
eliminated by a magnetic field in front of the scintillator. neutrons by
the small thickness of the scintillator.
At low X-ray intensitfes the dark current limits the possible applications
of the scintillator-photomultiplier combination. At high photon energies,
this difficulty can be removed by the applfcation of pulse height
analysis. For soft X-rays, however, this is impossible. In this spectral
region an open multiplier or gas counter should be used for the
observation of low fntensit1es.
d) Gas counters
The higl1est sensitivity to X-rays may be obained using gas counters which
are commonly operated in their region of proportionality. In these
counters. X-radiation generates fast primary photoelectrons which, in
turn, produce secondary electron-ion-pafrs. The energy expenditure for one
pair is about 30 eV in post gases /29/. Normally a mfxture of 10 % methane
and 90 % argon is chosen as counter gas. At longer wavelengths where the
absorption of argon 1s high, pure methane or helium with 1.3 % butane 1s
used. For measurements of soft X-rays the main difficulty 1s the
production of thin wfndows which on the one hand will transmit the
radiation and on the other hand will wfthstand one atmosphere of pressure.
Since the windows are commonly not completely vacuum tight. the gas flows
continuously through the counter volume.
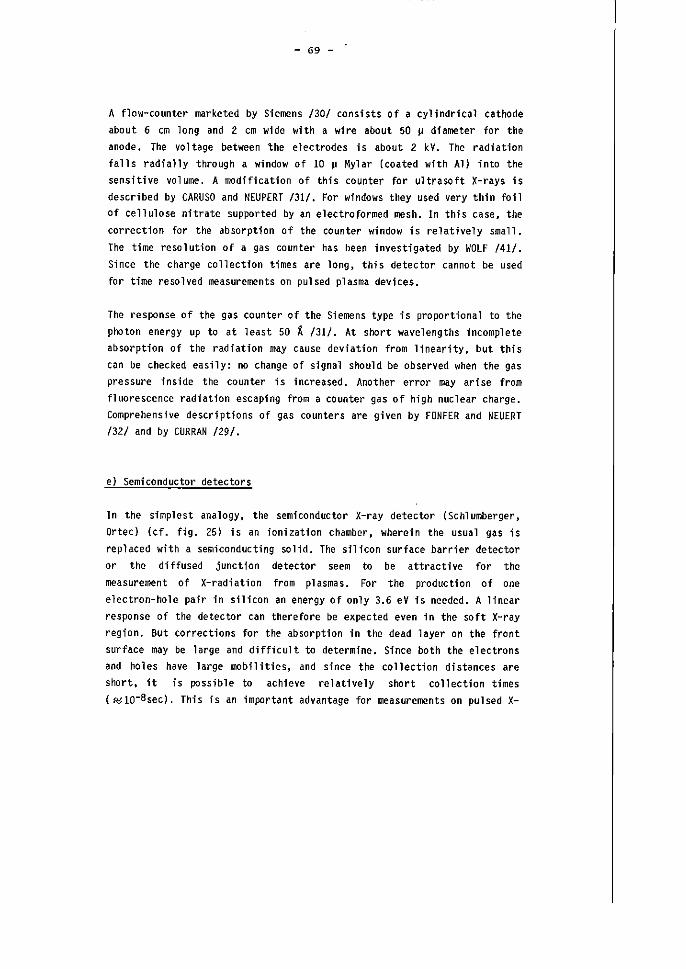
- 69 -
A flow-counter marketed by Siemens /30/ consfsts of a cylindrical cathode
about 6 cm long and 2 cm wide with a wire about 50 j.l diameter for the
anode. The voltage between the e1ectrodes is about 2 kV. The radiation
falls radially through a window of 10 j.l Mylar (coated wfth Al) into the
sensitive vo1ume. A modification of this counter for ultrasoft X-rays 1s
described by CARUSO and NEUPERT /31/. For windows they used very thin foi1
of cellulose nitrate supported by an electroformed mesh. In this case, the
correction for the absorption of the counter window is relatively small.
The time resolution of a gas counter has been investigated by WOLF /41/.
S;nce the charge collection times are long, this detector cannot be used
for time resolved measurements on pul sed plasma dev1ces.
The response of the gas counter of the Siemens type ;s proportional to the
photon energy up to at least 50 .a /31/. At short wavelengths incomplete
absorption of the radiation may cause deviation from linearity. but this
can be checked easily; no change of signal should be observed when the gas
pressure inside the counter is increased. Another error may arise from
fluorescence radiation escaping from a counter gas of high nuclear charge.
Comprehensfve descriptions of gas counters are given by FONFER and NEUERT /32/ and by CURRAN /29/.
e) Semiconductor detectors
In the simplest analogy, the semiconductor X-ray detector (Schlumberger,
Ortec) (cf. fi9. 25) is an ionization chamber, wherein the usual gas ;s
replaced with a semiconduct1ng solid. The silicon surface barrier detector
or the diffused junction detector seem to be attractive for the
measurement of X-radiation from plasmas. For the production of one
electron-hole pair in silicon an energy of only 3.6 eV is needed. A linear
response of the detector can therefore be expected even in the soft X-ray
region. But corrections for the absorption in the dead layer on the front
surface may be large and difficult to determine. Since both the electrons
and holes have large mob11ities, and since the collection distances are
short. it is possible to achieve relatively short collection times
(~1O-8sec). This is an important advantage for measurements on pulsed X-
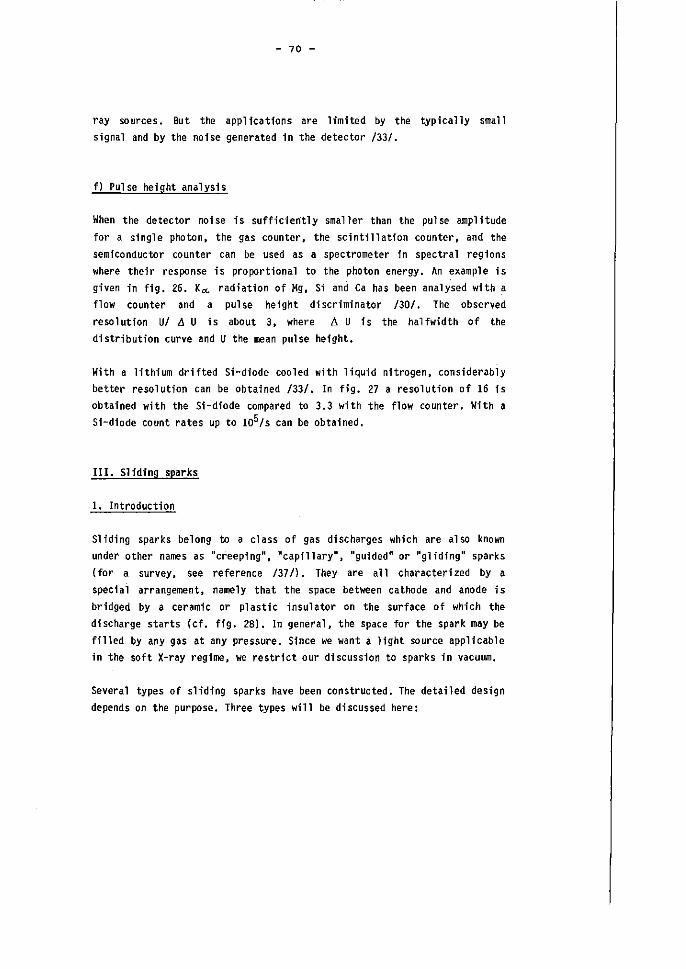
- 70 -
ray sources. But the applfcat10ns are limited by the typically small
signal and by the noise generated in the detector /33/.
f) Pulse height analysis
When the detector noise is sufficiently smaller than the pulse amplitude
for a single photon, the gas counter~ the sc1ntillation counter, and the
sem1conductor counter can be used as a spectrometer in spectral regions
where their response is proportional to the photon energy. An example is
given in fig. 26. Kc{. radiation of Mg, Si and Ca has been analysed with a
flow counter and a pul se height di scriminator /30/. The observed
resolution U/ /!J U is about 3, where /J. U 1s the halfwidth of the
distribution curve and U the mean pulse height.
With a 1 ithi um drifted Si -diode coo led wi th 1 i quid nitrogen. considerab 1 y
better resolution can be obtained /33/. In fig. 27 aresolution of 16 1s
obtained with the Si-diode compared to 3.3 with the flow counter. With a
Si-diode count rates up to 105/s can be obtained.
111. Slfding sparks
1. lntroduction
Sliding sparks belong to a class of gas discharges which are also known
under other names as "creeping", "capfllary". "guided" or "glidfng" sparks
(for a survey, see reference /37J). They are all characterized by a
special arrangement~ namely that the space between cathode and anode is
bridged by a ceram1c or plastic insulator on the surface of which the
discharge starts (cf. fig. 28). In general, the space for the spark may be
fil1ed by any gas at any pressure. Since we want a light source applicable
in the soft X-ray regime, we restr1ct our discuss10n to sparks in vacuum.
Several types of sliding sparks have been constructed. The detailed design
depends on the purpose. Three types will be discussed here:
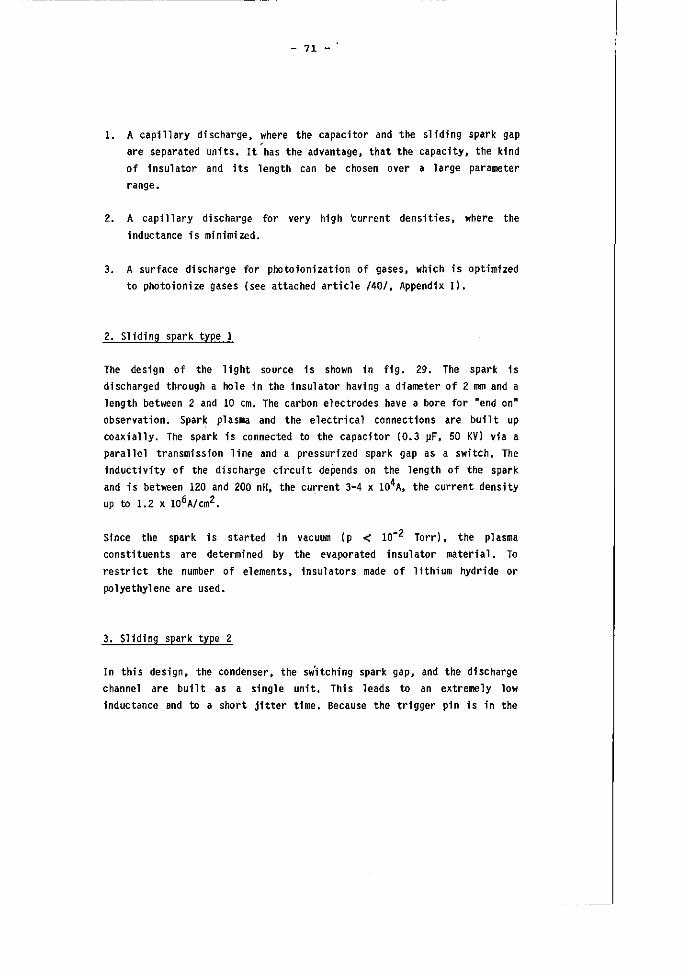
- 71 -
1. A capillary discharge, where the capacitor and the sliding spark gap
are separated units. It has the advantage, that the capacfty, the kind
of 1nsulator and its length can be chosen over a large parameter
range.
2. A cap111ary discharge for very high 'current densities, where the
inductance is minimized.
3. A surface discharge for photoionization of gases, whfch is optimized
to photoionize gases (see attached article /40/. Appendix I).
2. Sliding spark type 1
The design of the light source 1s shown 1n fi9. 29. The spark 15 dfscharged through a hole in the 1nsulator havfng a diameter of 2 mm and a length betW1:!en 2 and 10 cm. The carbon electrodes have a bore for "end on"
observation, Spark plasma and the electrical connections are built up
coaxially. The spark. is connected to the capacitor (0.3 f./F, 50 KY) via a
parallel transmission line and a pressurized spark gap as a switch. The
inductivity of the discharge circuit depends on the length of the spark
and is between 120 and 200 nH, the current 3-4 x 10⁴A, the current density
up to 1.2 x 1Q6A1cm2,
5fnce the spark is started in vacuum (p < 10-2 Torr), the plasma
const1tuents are determined by the evaporated insulator material. To
restrict the number of elements, insulators made of lithium hydride or
polyethylene are used.
3. 51 iding spark type 2
In this design, the condenser, the sw';tching spark. gap. and the discharge
channel are bu1lt as a single unit. This leads to an extremely low
inductance and to a short jitter time. Because the trigger p1n 1s in the
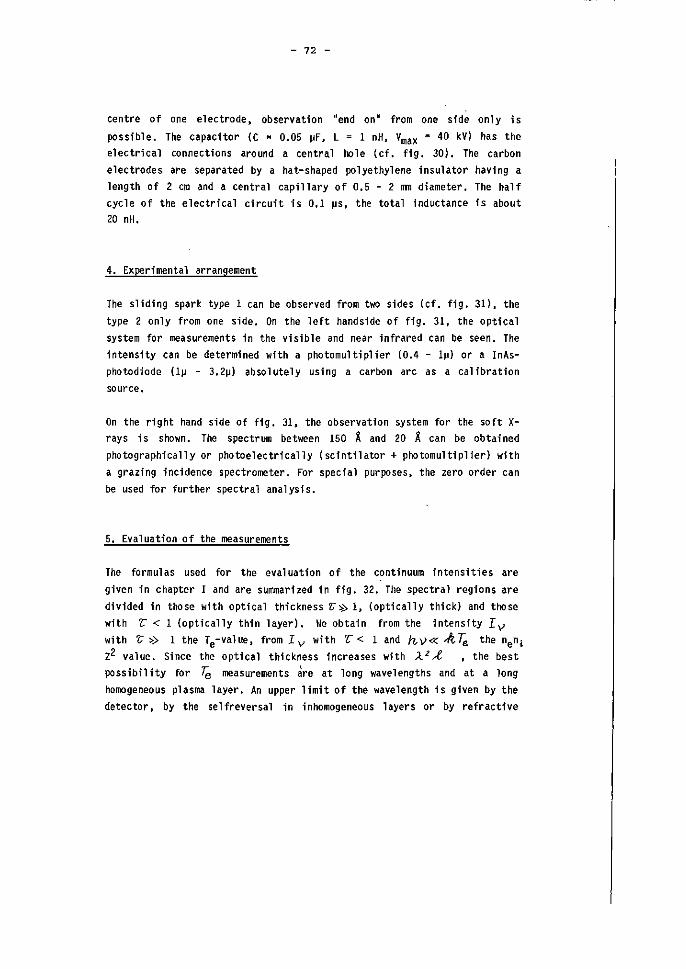
- 72 -
centre of one electrode, observation "end on" from one side only is
possibl •. Th. capacftor (e = 0.05 ~F, L = 1 "H, Vmax = 40 kV) has th.
electrical connections around a central hole (cf. fig. 30). The carbon
electrodes are separated by a hat-shaped polyethylene insulator having a
length of 2 cm and a central capillary of 0.5 - 2 nm diameter. The half
cycle of the electrical circuit is 0.1 IJS, the total inductance is about
20 "H.
4. Experimental arrangement
The sliding spark type 1 can be observed from two sides (cf. fig. 31). the
type 2 only from one side. On the left handside of fig. 31, the optical
system for measurements in the visible and near infrared can be seen. The
intensity can be determined with a photomultiplier (0.4 - 11J) or a InAs
photodiode (l1J - 3.21J) absolutely using a carbon are as a calibration
source.
On the right hand side of fig. 31, the observation system for the soft xrays is shown. The spectrum between 150 ~ and 20 K can be obtained
photographically or photoelectrically (scintilator + photomultipl ier) with
a grazing incidence spectrameter. For special purposes, the zero order can
be used for further spectral analysis.
5. Evaluation of the measurements
The formulas used for the evaluation of the continuum intensities are
given in chapter I and are summarized in fig. 32. The spectral regions are
divided in those with optical thickness Z-~ 1. (optically thick) and those
with 'C< 1 (optically thin layer). We obtain from the intensity Iv with 'C» 1 the Te-val ue. fram I y with r< 1 and h v« 4 Te the nen-i
Z2 val ue. Sfnce the opti ca 1 thf ckness i ncreases with ;t 2 A!, ,the best
possibility for Te measurements are at lang wavelengths and at a lang
homogeneaus plasma layer. An upper limit of the wavelength 1s given by the
detector, by the selfreversal in inhomogeneous layers or by refractfve
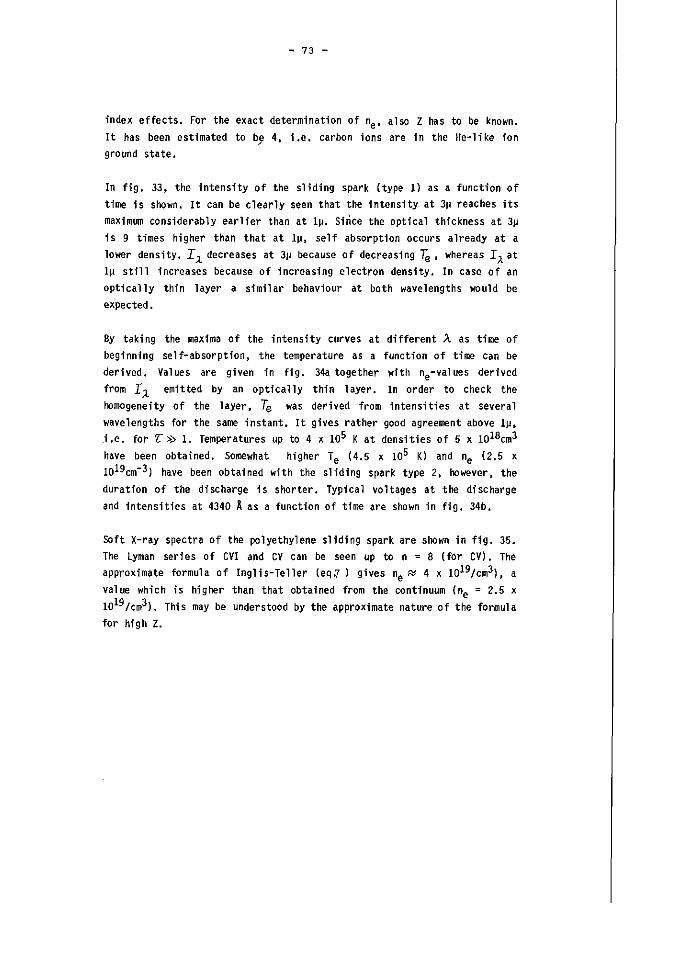
- 73 -
index effects. For the exact determination of neo also Z has to be known.
It has been estimated to b~ 4. i .e. carbon ions are in the He-like fon
ground state.
In f;g. 33, the intensity of the sliding spark (type 1) as a function of
time is shown. It can be clearly seen that the intens1ty at 3~ reaches its
maximum considerably earlier than at 1~. Since the optical thfckness at 3~
is 9 times higher than that at l~J self absorption occurs al ready at a
lower density. I;;t decreases at 3~ because of decreasing Te. whereas 1;1. at
I~ still increases because of increasing electron density. In case of an
optically thin layer a similar behaviour at both wavelengths would be
expected.
By taking the maxima of the intensity curves at different A, as time of
beginnfng self-absorption, the temperature as a function of time can be
derived. Values are given in fig. 34a together with ne-values derived
from I A emitted by an optically thin layer. In order to check the
homogeneity of the layer, Te was derived from intensities at several
wavelengths for the same instant. It gives rat her good agreement above l~.
i .e. for r; » 1. Temperatures up to 4 x 10⁵ K at densities of 5 x 1018cm3
have been obtained. Somewhat higher Te (4.5 x 10⁵ K) and ne (2.5 x
1019cm-3) have been obtalned with the slidlng spark type 2. however, the
duration of the discharge 1s shorter. Typical voltages at the discharge
and lntensities at 4340 A as a function of time are shown in fig. 34b.
SOft X-ray spectra of the polyethylene s11ding spark are shown in fig. 35.
The Lyman series of CVI and CV can be seen up to n :: 8 (for CV). The
approximate formula of Inglis-Teller (eq.7) gives ne ~ 4 x 10¹⁹/cm3). a
value which is higher than that obtalned from the continuum (ne = 2.5 x
lOI9tcm3). This may be understood by the approximate nature of the formula
for high Z.
- 7.4 -
Literature
/1/ S.v. Goeler et al. in:"Diagnostica for Fusion Reactor Conditons", lot. Scheol of Plasma Physics, Villa Monastero-Varenna (1982) Vol.l
/2/ P. Bogen, in: IIPlasrna Diagnostics ll J ed. W. Lochte-Holtgreven,
North-Holland Publ. Camp., Amsterdam 1968
/3/ G. Schmahl and D. Rudolph, eds. IIX-Ray MicroBcopyll, Springer Series in Optical ScienGes, 1984, Vol.43
/4/ B. Lengeier, Physikalische Blätter, Bd.4-6- (1990) 50
/5/ L. Spitzer: "Physics of Fully Ionized Gases ll J
Interscience PUb!., New York 1956
/6/ H. Dreicer, PrOQ. 2nd Int. Conf. Atomic Energy, Geneva 31, 57 (1958)
/7/ I.D. Landau aod E.M. Lifshitz, "Course of Theor,etical Physics ll,
Val.10, Pergamon Press 1981
/8/ A. Unsöld, "Physik der Sternatrnosphären", Springer, Berlin 195~
/9/ W. Finkelnburg and Th. Peters, in: Handbuch der Physik, Bd.XXVII Springer Verlag, Berlin, 1951)
/10/ J. Schlilter, Thesis T.H. Aachen1966; Berichte der Kernforschungaanlage JUlich Nr.ij13 (1966)
/11/ W.J. Karzas and R. Latter, Astrophys. J. Suppl.VI, NO.55, 167 (1961)
/12/ H. R. Griern, "Plasma Spectroscopyrl, McGraw-Hill Book Comp., New York 196~
/13/ D.R. Inglis and E. Teller, Astrophys.J. 90 (1939) ij39
/1~/ J. Schlilter, Persönliche Mitteilung- (1989)
/15/ F.C. Jahoda et al., Rev.Rev. 119 (1960) 8ij3
/16/ H.J. Kunze, "Emission Spectroscopy", Wor_kshop on Plasma and Laser Technology, Cairo, Febr. 1987, p.61
/11/ D.T. Attwood, and B.L". Herike 'rlLow Energy X-Ray Diagnostics - 1981, AlP Conf. Proc_. No.15, Americam Institute of Physics, New York 1981
/18/ A.G. Michette :"Optical Systems for Soft X-Rays", Plenum Press, New York 1986
/19/ H. Wolter, Ann. Phys. f, (1952) 9ij
/20/ G. Rathenau und P.K. Peerlkamp, Physica" 2 (1935) 125
- 75 -
/21/ A.E. Sandström and W. SChaa!'s,"Experimental Methods of X-Ray Spectroscopy", Handbuch der Physik" 30 (Springer Verlag, Berlin, 1957)
/22/ M.A. Blochin, "Methoden der Röntgenspektralanalyse", Verlag otto Sagner, MUnchen 196~,
/23/ R.W. Patch, Rev. Sei. Instr. 32, (1961) 983
/2~/ G. Goodrieh and W.C. Wiley, Rev. Sei. Instr~32 (1961) 8~6 L. Heroux and H.E. Hinteregger, Rev. Sei. Instr.' 31 (1960) 280
/25/ A.P. LUkirskii, T.M. Zimika and Yu.F. Shepelev, Bull. Acad. Sei. USSR, Phys. Ser.· 28 (196.) 77. .
/26/ J.B. Birks, IISeintillation Counters", Pergamon Press, Oxford 1960 J.B. Birks, "The Theciry and Practice of Seintillation Counting ll
,
Pergamon Press, Oxford 196~
/27/
/28/
/29/
/30/
/31/
/32/
/33/
/3./
/35/
/36/
/37/
/38/
/39/
/.0/
W.E. Mott and R. B. Sutton, IISc intillation and Cerenkov Counters", Handbuch der Physik- XLV, 86, Springer Verlag, Berlin 1958
A.J. Meyeroot, P.G. Fisher, and D.T. Roethig, Rev. Scient. Instr. 35,(196.) 669
S.G. Curran, IIThe 'Proportional. Counter as aDetector, an"d Spectrometer", Handbuch der Physik' XLV, _17li~ Springer Verlag, Berlin 1958
H. Ne!'!' J Siemens Zeitschrift· 33, ('1959) -655
A.J. Caruso and W.M. Neupert, Appl. opt. ~, (1965) 2~7
E. Fünfer und H. Neuert, IIZlihlrohre und Szintillationszählerll, Verlag Braun, Karlsruhe 1959
ORTEC, Oak Ridge Enterprise 'Corporation' (USA)
H. Conrads, Thesis TH Aachen, ,Bericht'e 'der Kernforschungsanlage JUlieh, Nr.360 (1966)
H.L. Price, .. X-Ray Microseopy Using Grazing Incidence Ref'lection Optics ll , AlP Conf. Proc. No.75, American Inst. of Physic6, New York
1981 B.L. Henke, Adv. X-Ray Anal. ~ (1960) 2 ••
R.E. Beverly III,"Light Emission for,m High-Current Stirf'ace"';Spark Diseharges", in: Progress in Optics XVI, ed. E. Wolf (1978), North Holland
P. Bogen, H. Conrads und D. Rusbüldt, Z. Physik' ~86 (1965) 2~0
P. Bogen, H. Gonrads, O. Gatti and W. Kohlhaas, J. Opt. Soc. Am-.58 (1968) 203
Y.T. Lie, P. Bogen, E. Hintz, in: 10th Intern. Conf. Phen. in Ionized Gases (Donald Parsons & Co Ltd., Oxfor,d 1971) 39LJ
G. Wolf, Z.Angelof. Phys. 15 (1963) .35
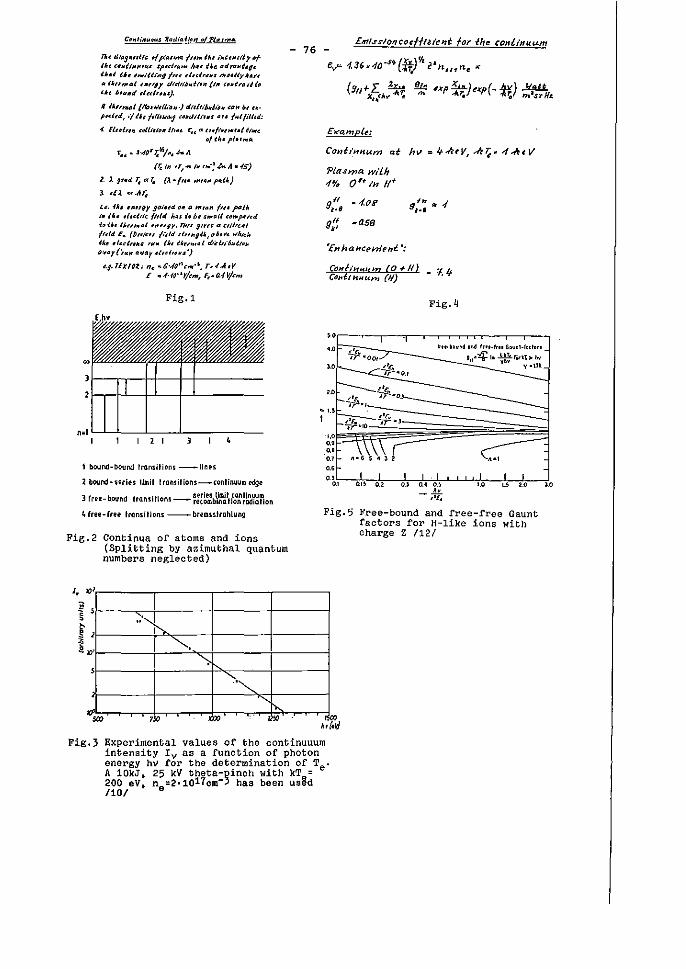
11 .. dl~91fISu~ ~ pltulrrQ. /,.'" lIu ,"'~tlftfty "I 'he (tllI{f/l,,,,,S .tP""I<'" !.,U {lu. '"I,.. .. 't~l1~ l.J.d ~l~ i!h<IlUnq ftu d"lr"u "',,~Uy""" .. O'''"."l '"°11 d(d'I"~tt ... {'li , •• /,.",,1 {t1
tl.t '''"l1d ~'U"""). 11 ""'nral '1f1"",1tf"~"') dlt",.""t/~~",,, /" u/1«1«[, .'/11, 1.{('HfJ.! c",oIllr,"s "" 1"'lmul: 4 Etui"" uUIII,,"Ü"'4 r. ... u.!,.,>*ul t,..~
01 Ih. 1"""'111.
r ... J-AOSJ;*/ •• hil.
(~/n '1','" fit r .. -:.t..A Il.fS)
1. .1. S,.d r. «r" (:ta!, .. nt/4,. p41J,)
1 .Cl «< ... ..;
,,, . ."" ""'"y 9,,",,<1 D" .. """,,, I'" palI. ,,, "" ,lul,re (Itld Iru loht:mMI (""/'41'4 lotl. 11,,0,. .. 1 ... ",,,. ritts 1'1'{' a CtIJr~41 {,,(d F~ (Drlfttr {i,U tlu"glJ,,"""'4 >"'leh U,tfJ .lut,.", ", .. tlt, "tl ... "l d,~,,,·6 .. ü~,,
0""1'('''''' ",../11' t'.d,~".s')
t./-Tlxrot, "c .. 6·'{O"~ ... ·s. rß~...E,1' E ".{·{~··y/~m, F~.o."V/~m
Fig.1
,., LLJL---.JL_..L_-:-----:-__ , 2 ,
1 bourod-boulld transitions -_!lnes
2 bourd-uries 110111 Iransllions_conlil\lJullledge
3 free-bound transitions -- ~[~e:b\~J',,~~~~~non 4 tree-tree transitions -_ bUOIulralllung
Fig.2 Continua of atoms and ions (Splitting by azimut haI quantum numbers neglected)
I •• , , .:.'t, ,
I "'-. '> ,
""." '" f>.-
$(I) "" .
'" ,.,
- 76 Em',u,/oncoeHulent tor ihe conÜnuum
E.".,. 1. 36 .. 10··H• {.ff.)"1 ~'J1,u"lne K
(911+x~Jo"~ ~ ~xp !tt)exp(-~) '"~!tH7. "
ConCiHHum Clt hv = 1f-kt'V, ...k~ .. 4-1ttV
'Pla..rn?4 wt'lh 4% O'i- 1H NI-
0/:, -1.o~
0;: .. ase
,. .. "c~ It" ~Qo, , ..
,. ". 7ft.,
Fig,LJ
"' .. ~,u.d.od ''',·Ir .. 60"0'·1,,1.,. 1".-tfIn~fWl~~,,",
- _____ yom
... ,.~
, .•. ~~~~ I ,'E. 7T~IO
.;~ ••
'0.7 .. ~r{"~ Jr~l
... .,L--.\"/,--~,,i:.'</;-'--'-"-';i,___t;_;!o-__i 0.1 QH 0.2 0.) 0.4 o.~ '.0 l5 2.0 lO
_k ,·e. Fig,5 Free-bound and free-free Gaunt
factars for H-like ions with charge Z 1121
'''' II,M}
Fig.3 Experimental values of the continuuum intensity Iv as a funetion of photon energy hv for the determination of Te' A 10kJ. 25 kV theta-pineh with kTe = 200 eV. n =2·1017om-' has been uaed 110/ e
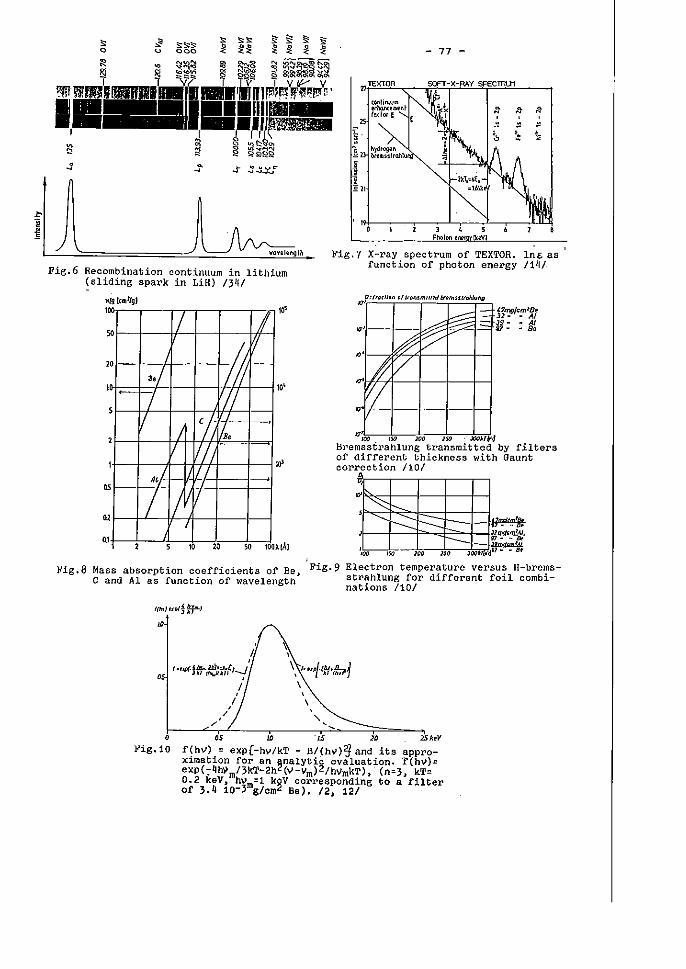
- 77 -
.,
Fig.6 Recombination continuum in lithium (sliding spark in LiH) 1341
Fig.7 X-ray spectrum of TEXTOR. In€. as function of photon energy 114l
Fig.8
, 11 J
I
50
/1 ~ 20
3·1 //1 , , 5 7 'ft
1/ ~ I/.. 2 1
0'
, 'IL I
"L ' 1 ~
05
02 / 1/ I
o J , 2 5 , 20 50 100). ~J
o 1 11 I1 ' tor on 0 fQ'l5m
'" .mu ""
& ~ I~ '" d: P ",'
P /' .. ~ "" 'w "" m """
'7mglcmlB~ ll- _ AI J9- _ Al 97--Be
Bremsstrahlung transmltted by filters of different thickness with Gaunt correction 1101
'" , ,'-':::: t---'--r---: t---: ,
, "'" ,~ "" "" JOOMI>'>l~
Fig.9 Electron temperature versus H-brems-Mass absorption coefficients of Be, t h1 f d'fferent fo'1 comb'-C and Al as function of wavelength s ra ung or ~ ~ ~
nations 1101
o
o Pig.10
1 , " ,. "({(f:.·i~jlJ
\
os J1J "Mi 2D 25keV
.f(hV) = exp[-hvlkT - B/(hV)2j and its approximation far an ~nalytic evaluation. :f(h")= exp(:-4h'im/3kT-2h (v-Ym)2/hVmkT), (n=3 1 kT= 0.2 keV, hVm=l keV corresponding ta a filter at 3.4 10-3 g/om2 Be). 12, 121
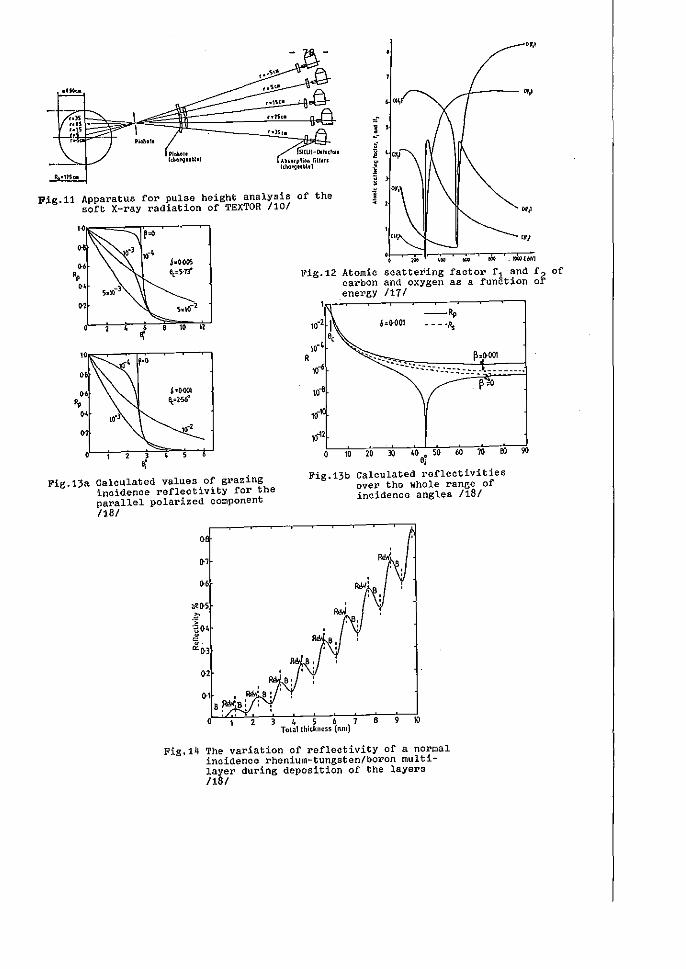
PI""OII Ith0"il.abill Ab.o.pli'" fillill
1' .... ogKbl.'
OJ,I
0,'
Pig.ll Apparatu5 for pulse height analysis of the soft X-ray radiation of TEXTOR /10/ .. ,
Fig.13a
10 12
,., , ~
Caleulated values of grazing ineidenee refleetivity for the parallel polarized component I1BI
o
01
06
02
o ,
Fig.12 Atomic carbon energy
'" ••
scattering factor f 1 and and oxygen as a funetion 1171
-Rp - - _.p,
1~' o}-~w,-~,~o--~~C--t.>W~.5~O--7.W.-~~.--eooc-.dw
" Fig.13b Calculated reflectivities over the whole range of ineidenee angles /18/
4 5 6 7 Tolal Ihitkness (nm)
, 9 10
Fig.14 The variation of reflectivity of anormal incidence rhenium-tungsten/boran multilayer during deposition of the layers 11BI
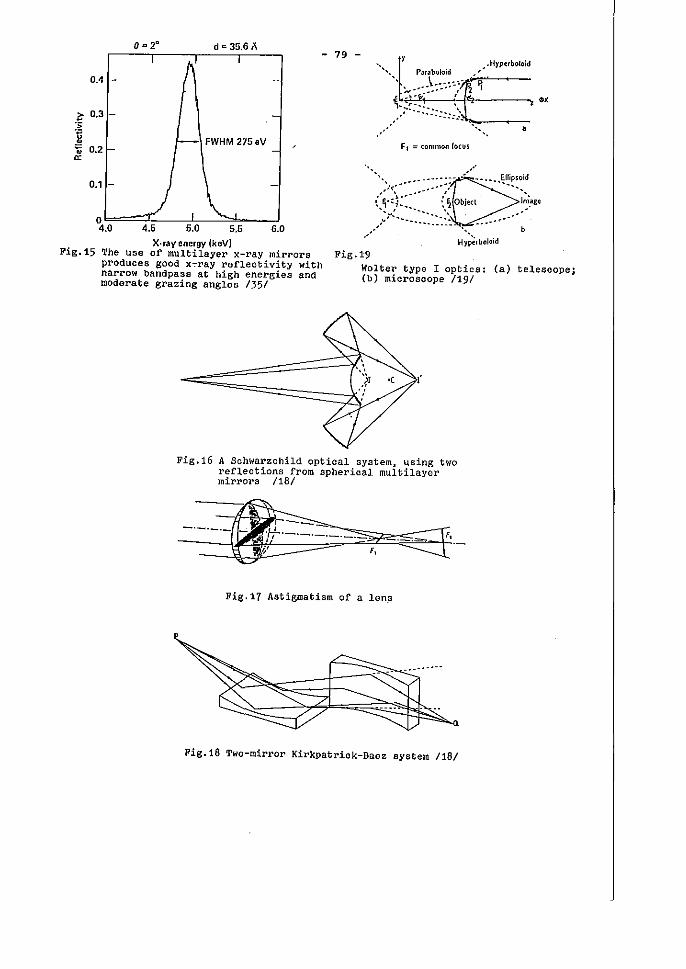
d '" 35.6 1\ - 79 -
,. "'.. . .... > .. :::,:: ,> .. -. .,......~--:-
", a .... '.
I , .•. Hyperboloid
""" Parabuloid .'. • \. ..•.. ,."",1'\;;-. ~-, :-.~':-- ." : Ji. I .,
0.4 -
C;- 0.3 - .-'S 'ji
'--- FWHM 275aV • .. 0.2 r -0:
F I = (Ol1ll1lon foeus
0.1 -
~ -
0 ..1\ .,'
4.0 4.5 5.0 5.5 6.0 '. b
HY~~lboloid X·ray energy IkeV) Fig.19 Pig.15 The use of multilayer x-ray mirrors
produces good x~ray reflectivity with narrow band pass at high energies and moderate grazing angles /35/
Wolter type I optics: (a) telescope; (b) microscope /19/
.(
Fig.16 A Schwarzchild optical system. using two reflections from spherical multilayer mirrors /18/
-_. __ ._~._~,-I/ F,
---'<0 ....
Fig.17 Astigmatism of a len~
Fig.18 Two-mirror Kirkpatrick-Baez system /18/
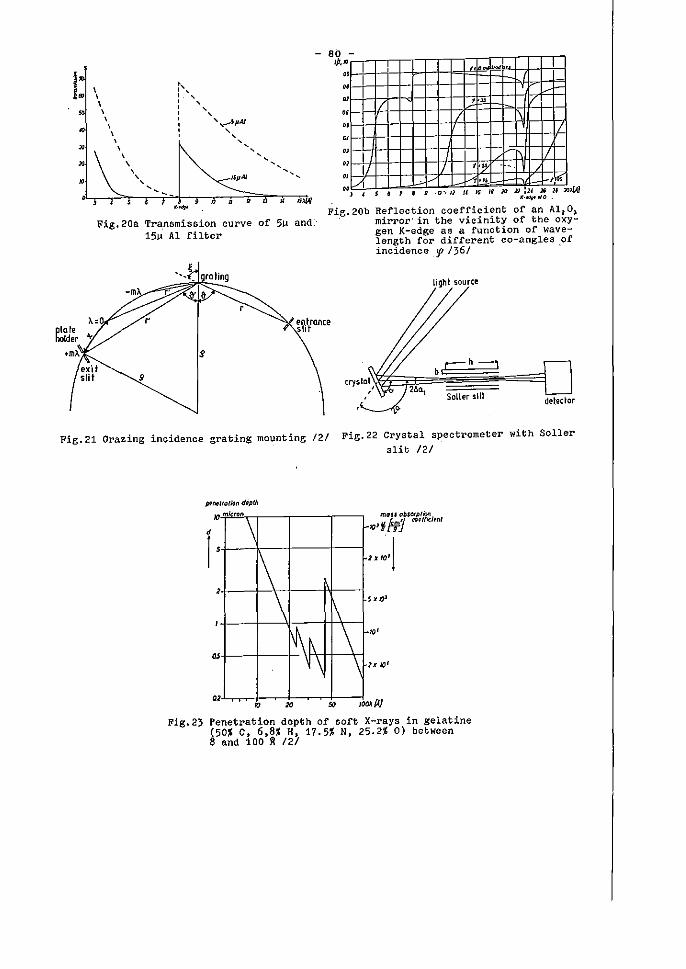
•
~ote Ider .mA
~
, , , , , , ,
Fig.20a
exit slit 9
" '- • , u
80 'P •
-• I .. "
I
" .. .. " ..
I .. :: ~/ , , ....
Fi.g.20b Transmission curve of 5u and:-15).1 Al filter
, ;~t{Qnce
9
-1 ,--
11 ' .
1\ 1/ IT , - 'I \
Vt"$ , S 6 lag -0' /1 " ~ " }(J »,21 16 21 JOJ.W
.or.~010 .
Reflection coefficient of an A1 2 0, mirror' in the vicinity of the oxygen K-edge as a function of wavelength ror different co-angles of incidence ':/' /36/ .
light SOUfce
r: h ="' b
Seiler slit
Fig.21 Orazing incidence grating mounting /2/ Fig.22 Crystal spectrometer with Soller alit 12/
rn/ron
f \
,
2 \ \
N\~ ~ \ "
o 2 20
1\ \
\
~ m"5J "bSOf"pliotJ IO'!I"J co~"ic/fn'
w,,1 ,
, 0'
2 , .' Fig.23 Penetration depth of soft X-rays in gelatine
(50% C, 6,8% H, 17.5% N, 25.2% 0) between 8 .nd 100 ~ /2/
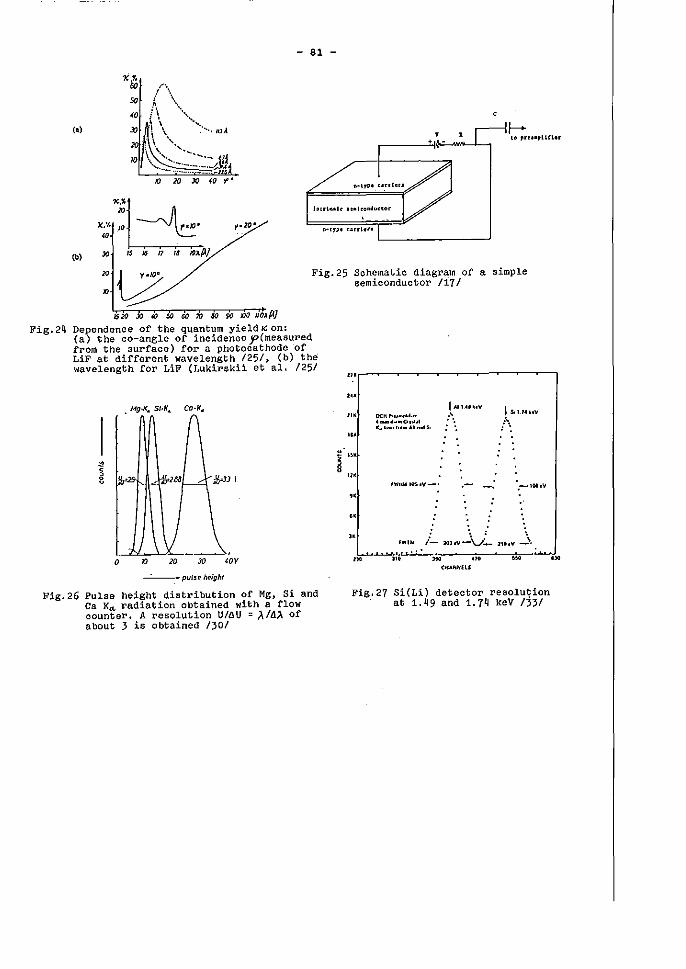
- 81 -
(.) f--10 p •• llIpIHler
(b)
:~ Fig.25 Sohematic diagram of a simple
semiconductor /11/
Fig,24
1520 J() t,() 51) 60 70 6Q SlO /JO IIoAPl
Dependence of the quantum yield IG on: (a) the co-angle of incidenceJP(measured fram the surface) ror a photooathode of LiF at different wavelength /25/, (b) the wavelength ror LiF (Lukirskil et a1. /25/
o
Fig.26 Pulse height distribution of Mg, Si end Ca K~ radiation obtained with a flow counter. Aresolution U/ÖU = A/!J.),. of about 3 i3 obtained 1301
~
'" '" '" ... .. , ,,.
" .. ,.
DCKP, .. ~ ... ' .... d~ .. O.~.1
1"'14'~'V " ",
I Sd.IU.V
IC", ..... " ... AI.ndSo /\
""""I05.V_· ,- ',_101.11
, ' : ',: \ l- 2OJ,V-V_ 21D,V _',
.k"wu~t,,~.w'w'~'~'-.,.~-"--~.ro'--"--~"'-_C~ •• C~HS
,.
FiS.,27 Si(Li) detector resolution at 1.~9 and 1.1~ keV /33/
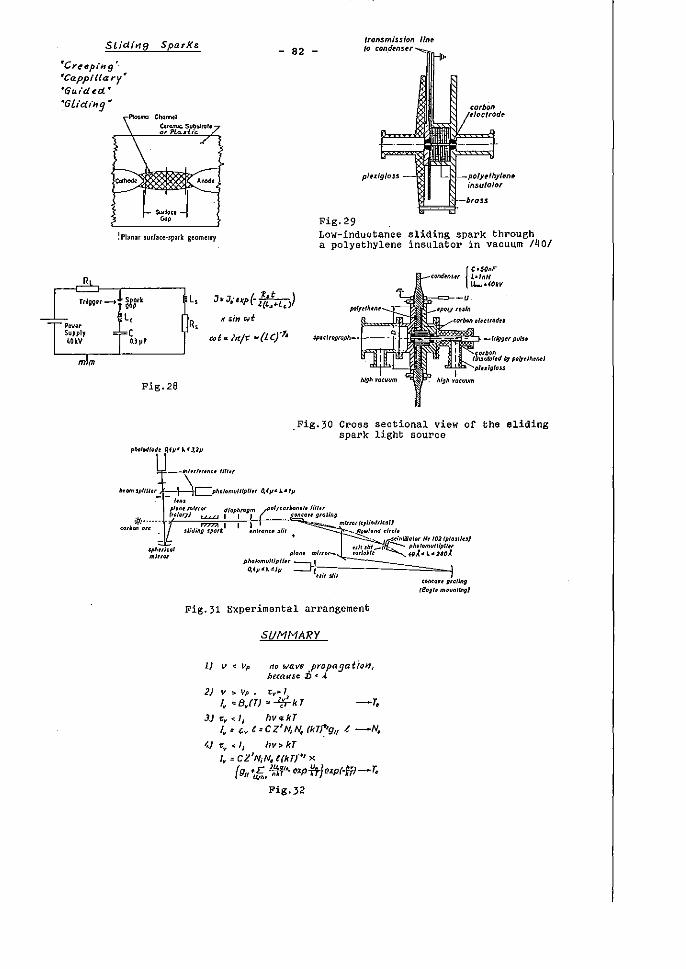
Stiel/Hg Spa'/(s - 82 -
IInt
" 'CrellpiHg' 'CapplllaI'Y~ 'Guided ..
'6lidlH9 '"
Fig.29
plufg/OJ$
! PIaniIr sUlface·spark geomelly Low-indu~tance sliding spark through a polyethylene insulator in vacuum /40/
L,
R,
Fig.28
J1rJ';'}(P(-l~tt~Le)) x sin ",I:
.Fig.30 Cross sectional view of the eliding spark light SOUrce
plono tnl"".. dfophrtlgm (,.Iory) tLLLl 1 1 , *....... 1'777.'11 I
.o,b"" on ~liding ~po/A ""/on •• ~1iI
~.ri •• 1 ml""..
Fig.31 Experimental arrangement
I.J l) < vp
SUMMARY
no walle .propa9al:ion, becau5c D < ..t
2) v ,. Vp. l" .... 1
Iv '" 8 .. (7) ... *k T --T,
3J 1: .. <1, hV<l-kT I .. " (;v t "C Z' N; ~ (kTr:gl( .t -N,
1,.)1:" .. <1; hv>kT
I." CZINiN,((kTl" X
{gI{ f,f". J~W· E'XPftJ exp(.e;J - ~
Fig.32
<OMo .. grollng IEogl. m.~nl/tlgJ
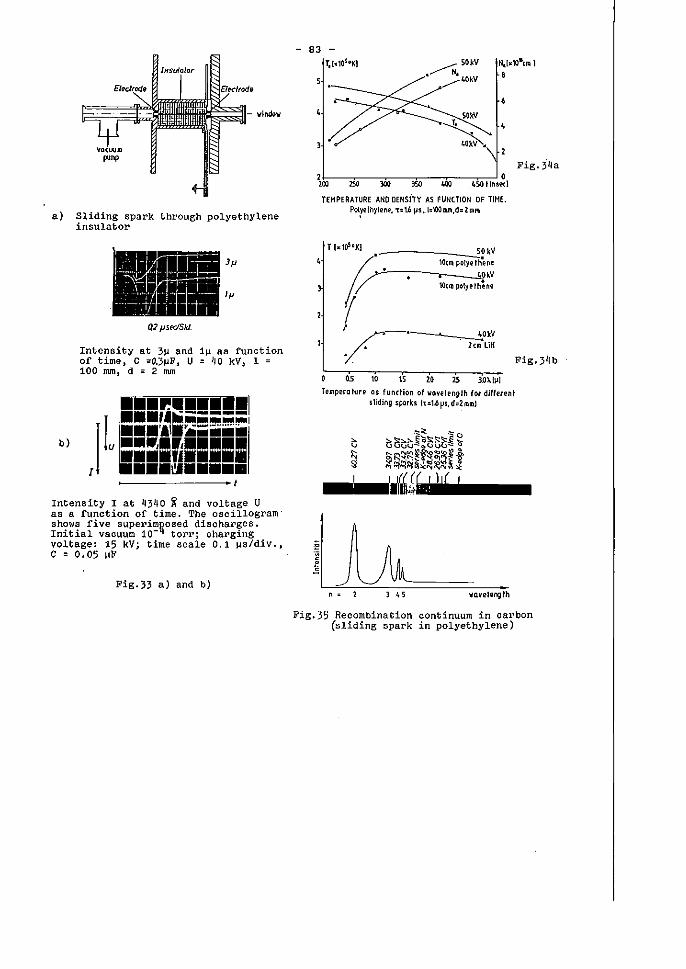
'oI'indo'ol'
a) Sliding spark through polyethylene insulator
b)
)p
Ip
Q] JjsPdShl.
Intenaity at 3~ and 1~ aa funetion of time, C =O.3~F, U = ~O kV, 1 = 100 mm, d = 2 mm
Intensity I at ~340 i and voltage U as a funetion of time. The oseillogram' shows five superimHosed diseharges. Initial vaeuum 10- torrj eharging vOltage: 15 kVj time seale 0.1 ~s/div'J C • 0.05 "F
Fig.33 a) and b)
.--- SOkV .~ NI
.......-40kV
6
TfMPERATURE ANO DENSiTY AS FUNCTlON OF TIME. PolyelhyleM. T=t6 jJs~ 1;'IOOIMI.d= 21111'1
05 \0 \5 " 25 3.0).[111
Temperalure os funclion of 'oI'ovelenglh for dillerenl sliding sparks [t=1.6ps,d=2IllmJ
II~ =:---:-:--:: n = 3 45 'oI'avelRrw;tth
Fig.3~b
Fig.35 Reeombination eontinuum in earbon (sliding spark in polyethylene)
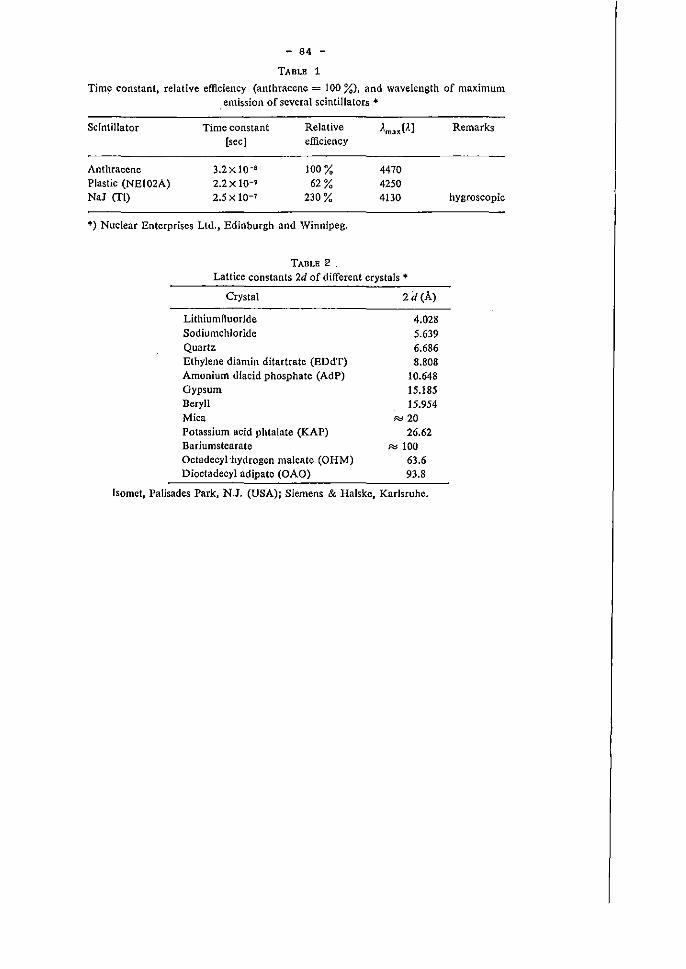
- 84 -
TADLE 1
Tim~ constant, relative efficiency (anthracene = 100 %), and wavelength of maximum emission of several scintillators ...
Scintillator Time constant Relative ).m3xJ).,] [sec] efficiency
Anthracene 3.2 x 10⁻⁸ 100% 4470 Plastic (NEl02A) 2.2 x 10⁻⁹ 62 % 4250 Na] (TI) 2.5 X 10⁻¹ 230% 4130
*) Nuclear Enterprises Ltd., Edinburgh and Winnipeg.
TADLE 2 .
LaUice constants 2d of different crystals * Crystal
Lithiumfluoride Sodiumchlorldc Quartz Ethylene diamin ditartrate (EDdT) Amonium diaeid phosphate (AdP) Gypsum Beryll Mica Potassium acid phtalate (KAP) Bariumstearate Octadecyl'hydrogen maleate (OHM) Dioctadecyl adipate (OAO)
4.028 5.639 6.686 8.808
10.648 15.185 15.954
'" 20 26.62
R::1 100 63.6 93.8
Tsomct, PaJisades Park, N.J. (USA); Siemens & Halske, Karlsruhe.
Remarks
hygroscopic
Appendix I - 85 -
Sliding Spark over Solid Xenon as Light Source for Produetion of Plasma by Photoionization of Gases
Y.T. Lie, P. Bogen and E. Hintz Institut fUr Plasmaphysik der Kernforschungsanlage JUlich GmbH
Assoziation EURATOM-KFA
1. Introduction
For the production of spatiallY ho~ogeneous, lOH denalty plasmas of laree volume (e.e. diameter ~o cm, length 100 em) Whieh are needed e.g. tor shock wave experiments, the phot010n!zation of eases 1s a very promisine method. It is especially useful at 10w partic1e densities
14 -3 no(no< 10 em }, when the breakdown of gas discharees becomes diffi-eult. Lieht soure es to be used for this purpose should have the fol10-wing properties: hirh temperature J hifh density, larfe emittine area, and sUfficiently 10n[ emission time. Althoueh optical windows oannot be applied J the irradiated r,as must be weIl iso 1a ted from the lieht source durine the experimental ti~e. Hith intensity slidine sparks des-cribed earlier /1/ produce a relatively low degree of ionization beeause of their amall ernitting area and short duration. Therefore a new type of slidine spark was developed usiny, solid xenon aa insulator.
2. Design of the light source Fif. 1 shows the desir.n of the lieht source which 15 eontained In a cross-shaped eass tube. The two electrodes have a width of 2 cm and a separation of 1 em. The cooled, solid xenon coated surface is mounted between them. The rap between the xenon dielectric and the electrodes is smaller than 1 ~~ to ensure the onset of a Blidine spark in vaeuum. On the other hand an uridesirably large heat flow from the e1ectrodes to the xenon is prevented. For the present liquid air was uaed for freezinc: the xenon .. At 77 0r. solid xenon has 8- vapour pl'cssure of ab out 10-3 Torr. Por the breakdown to take place along the surtaee of the insulator it was necessary to pump down to apressure lower than ~110-4 Torr.
The electrieal circuit i5 shown in Fi~. 2. Two condenser banks were used: a relatively slow bank (23/uF, 16 kV) for evaporatinp and ionizinC the xenon and a fast bank (30,uP, 17 kV) for heatiny. it. The second bank is fired 10/us after the first when the current haB reached lts maximum. With this delay the hiphest intensities have been achieved.
- 86 -
3. Spectroscopic measurements
The absolute intensity of the radiation in the visible and quartz
UV was mcasured by cornparison with a carhon are. For the determi
nation·of the intensity down to 650 R an arragement consistint. of a focussing: mirror and a Seya Uamioka monochromator was used. The
calibration was made firstly by eomparison with the weIl known con
tinuum of a hieh ternperaturc theta-pinch in helium and secondly with the continuum of a synchrotron. Doth ca librations showed food arreer.1ent.
For the experiments thc capacitance C of the main bank was varied
between 7/UF and 30/UFo Fie. 3 shows electrical eurrent and intensity at A :: 800 R as a function of time. \'Iith C :: 7/UP strang'. lieht emission oeeurs in the firs"t half-cycle for 3/US. r1ith the capacitance inereased
to 30/uF the intensity increases by a factor of 10, and strone emission is observed for 5/US (FiC. 3).
The intensity as runction of wavelenrth is shown in FiC. bremsstrahlung of a hirh teMperature plasma a dependence
i5 expectf7.d. This means th~t g/;d,nr. f;rom 30090 R to 750 R
lj. For pure
I~~ I/X2
I).., should
increase by a. factor of 16 •. A factor of .1.00 has actua.lly been observed. Thi.s can b,e e~'plaine,d partly by ,recombinat.ion continua and line radiation,
partly, at leas,t for thc h.if.h capac,itance c.~se, by, .reabBorption at lonfer
;wavelenct'hs. At 150~ R in. the~ 30,uF ca~e" i~. blackbody temperatu.re of about 5 eV wa's measured. Since the Oe+ZnS. coating or the focuss"ine-mir:ror withstoOd oniy a limited"nWnber ot' shots because or'the' Btr~ng 'irradiation, a: det:a~led meas~.re~ent or' the line spe'ctrup! was n.ot possible.
,At 800,R an il"'\tensity of 1,.1,012 Watt/cm3 5,1',' lasting abou~ 5/US was
observed., Assuming that I k ~ 1/A2 between lj50 Rand 950 R we obtain
per unit ~urfa'ce area and per unit solid angle a radiation energy of , . . "
31 Ws' in this wave'le'ngth ba~nd.; 'With an aetual emitting area 'of abo'ut
1.6 'cm2 ~.t·he 'en~r'~Y: ~mi'tte'd ov'~'r. '~'n is at)~~t! 750' Ws •. "
4. Micrawave measu~e~nts
The. light; 'sour,ce desc.~.ibed ,ab ave ('!"t~h; ,3.0 ruF, ba~k) w,~'~ ~U5,e~ t~ Pt"I.otoi~n.ize xenon at a· ,pre!3su.re ~Qf ~,'10- Torr •. B.e"tween light spurce .an.d te~.t. gas, ;a wir'e-,mesh .of ~o.s:; ,transmisa,ion wa.B piace~l. Ati~er. 'the, f.lrst
hait-.cycle I, ne ~: '2,' 1012 C'l"11- 3, :was qbserved w.i\h: 'an ,8. ~: micr.owave:, i.nterterometer' (Fig.;5)., Wi~h an .ionization cross":secti,on pf 6.·10-~1i cm2
and'" an ·e~fect·iv~.' ~aveie~~'th' :~a~d tram ~50 t~ '950.' (. thi:'s r:eQUir~8 ~'
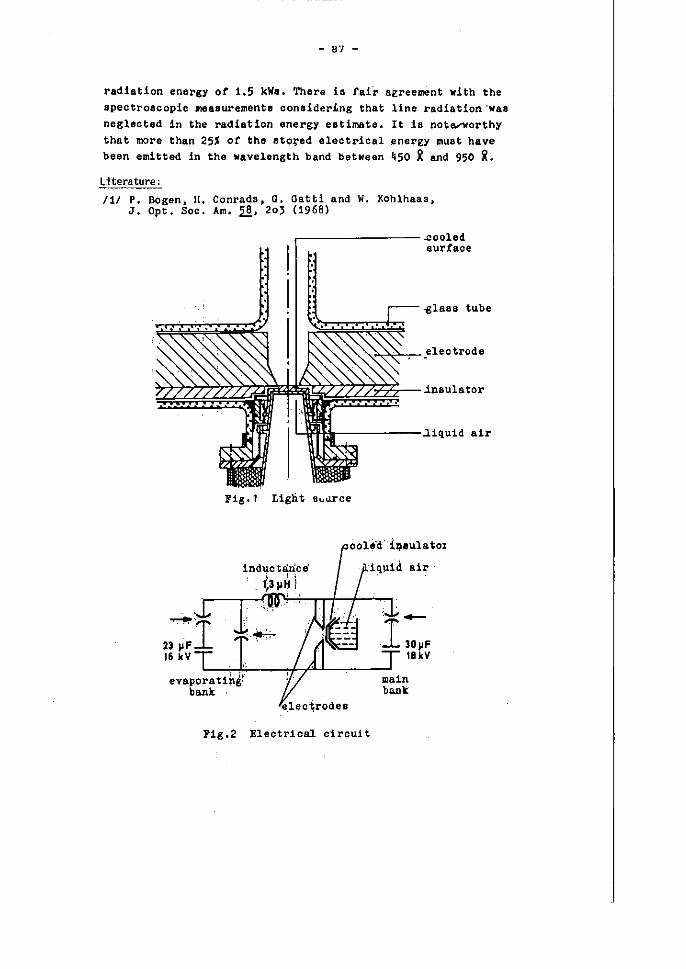
- 87 -
radiation energy of 1.5 kWII. There 18 farZ" aereement with the apectroacop1c me8euremente conB!derLng that 1ine radiation 'WAB neglected in the radiation energy eat1mate. It 1a not6'Worthy that more than 25% or the atored e1ectrical ~nerEY muat have bean em1tted in the wAvelength band between 450 i and 950 R. Literature:
/1/ P. Bogen. 11. Conrads, O. Gatt! and W. KOh1haas, J. Opt. Soc. Am. ~. 203 (1968)
r----------.cooled 8urfaoe
..glass' tube
,'"",2'-.,-- electrode
:'Ir-------.liquid air
Flg.1 Lisnt B~~ce
Fig.2 Eleotr1cal clrcu1t
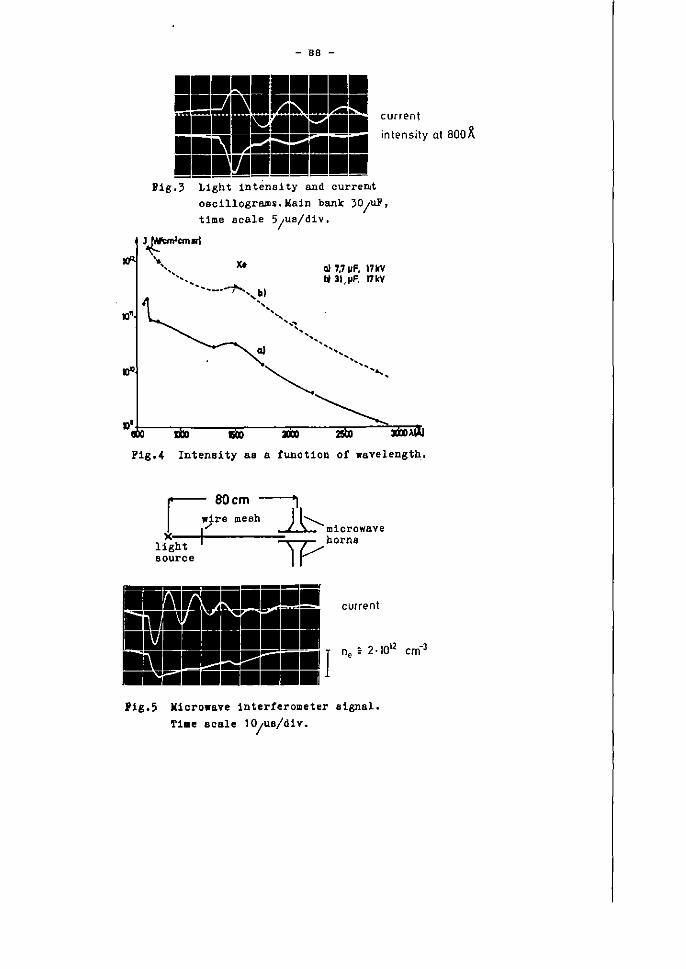
- 88 -
n • Pli ~ II!: II! =
~ ... current
inlensity al 800)\
g i1g.3 Light 1ntene1ty and curre~t
oBcl11ogram$.Main bank 30/uF, time Bcale 5/ua/diV.
aJ
aj 7,7 "F, 17 kV 1131,"F, I7kV
P1g.4 Inteneity 88 a funct10n of wavelength.
~ SOcm ----,
wire meah ~ X ( .1l:: mierowave
light ~/"horn. Bource Ir
11 fj .i>'II ... it ,J liiiII .,;
11 11 !!!::l
P1g.5 Miero.ave interferometer signal. Ti •• Beal. 10/UB/d1v.
- 89 -
Laser Light Scattering
M. Born, H. Kempkens, 1. Uhlenbusch
Institute of Laser and Plasma Physics Heinrich-Heine-University Düsseldorf, FRG
1.Introduction
- 90 -
LASER LIGHT SCATTERING
by M.Born, H. Kempkens, J. Uhlenbusch
Institute of Laser- and Plasma-Physics Heinrich-Heine-University Düsseldorf
Following the theory of dassieal electro.dynamics an aeeeierated eharged particle emUs eleetromagnetie wav€S. In ease of seatteriog the acceleration of the charge is due to the field of the ineoming electromagnetie wave. In laboratory plasma physics only seattering from electrons contr.ibutes.
Various light seattering meehanisms are distinguished depending on the state of the electron and photon:
a.) Thomson or incoherent seattering describes the interaction of low energy photons (hv « m., . c2 ) with free electrons as available in a plasma. If the electron temperature reaches say a few keV relativistic effects are of importance.
b.) In a plasma the eh~ctrons are not completly free but weakly bound by the Coulomb forces. This weak coupling causea coherent or eollective scattering events.
c.) Bound electrons in the strong fields of atQms and molecules give rise to elastic scattering (Rayleigh scattering) and inelastic scattering (Ramao scattering).
d.) As a special situation the incoming photon and the electron are in resonance. This so called laser induced fluorescence (LIF) is studied elsewhere (see leeture· Doebele) of this conference. This lecture deals with topics a.) and b.), for calibration purposes case c.) is of ioterest, too.
Diagnostics of the frequency behaviour of the scattered incoherent or coherent light delivers Ioeal information about plasma temperatures and densities, magnetie fieIds, plasma drift velocities and impurity cOntent. In connection with a proper laser light source light seattering is a strong tool for plasma diagnosis.
2. Light scaUering from a single electron
A moving charge cloude dq of speed v produces a current density ](f', t l) and a spa<:e charge
density eel(r, t ' ) a.t P' which again generate electric and magnetic fields at P (see Fig. 1). From these fields the Poynting veetor ean be derived, which eomprises the power loss of the moving charge. To ca.1eulate scattered power the forced motion of a charged particle in the field of a wave must be investigated. Throughout the following I v I je« 1 is assumed.
2.1. Radiation Held of an accelerated electron
Assumed a spatially distributed charge dq = eel(r, t')cPr at P' moving with velocity v(r, t l), see
Fig. I.
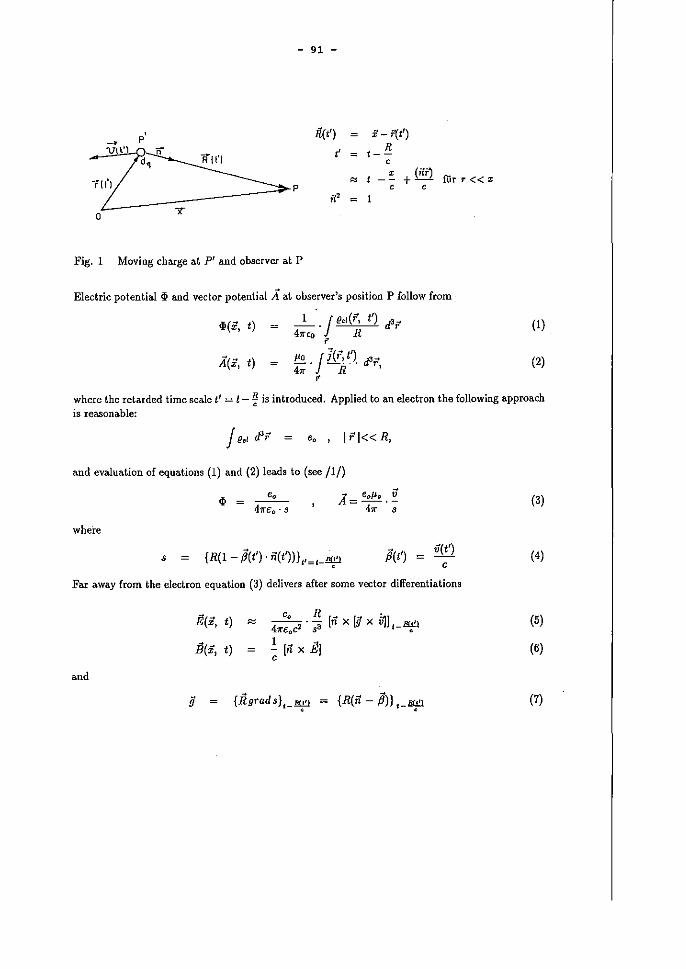
-------- ----------------------
- 91 -
R{ t')
I'
x - f{1') R
1- -c l
--'i l " p' -
~ , d~, n RII')
r(t) ~p ----x {nT} + - fur r «z c c
il' o x
Fig. 1 Moving charge at pi and observer at P
Eledric potential ~ and vector potential A at observer's position P follow from
iJ;{z, t) _1_, J e,,{r, t') <l'r 411"(0 r R
A(i, t) po -J J(r, t') cf'r 41[" R 1 ,
(I)
(2)
where the retarded time seale t' := t - ~ is introduced. Applied to an electron the following approach is reasonable:
Je" <1';:
and evaluation of equations (1) aud (2) leads to (see /1/)
(3)
where
8 ß(t') = v(t') c
(4)
Fa.:r away [rom the electron equation (3) delivers after some vector differentiations
E(z, t) '0 R [" [9 ~I (5) '" ~·anx xVt_l!C.J!l 41!'€o S e
E(i, 1 " (6) t) - [il X EI c
.nd
!j {Rgrads}t_l!!P {R(il - ß)) .-"'P (7)
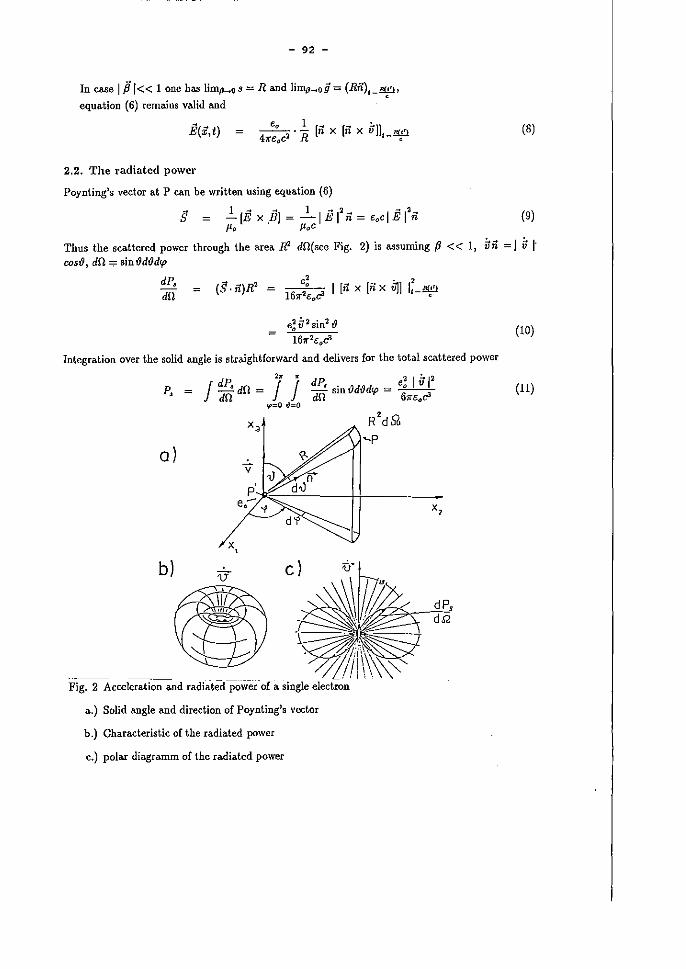
- 92 -
In case I ß I< < 1 one h~ limß ..... o s = Rand limp ..... o § = (Rn),_.s!!l,
equation (6) remains valid and e
2(i,t) e, 1 [. [. "11 --·-nxnxv l!!!2 411"eoc2 R i- e
(8)
2.2. The radiated power
Poynting's vector at P can be written using equation (6)
8 1.... .... 1 .. 2 .... 2 - [E x BI = -] E] n = .,c] E] n Po PoC
(9)
Thus the scattered power through tbe area. Jt2 dfl(see Fig. 2) is assuming ß « 1, i1;i =1 i; I' cos!9, dn =:= sin I1d.,Jdcp
dP, dU
(8. il)R'
e~ i;2 sin2 !? 1611'"2eod
Integration over the solid angle ia straightforward and delivers for the total scattered power
2~ w •
P J dd:': dA = J J dP, . "d"d _ e: ] ii I' 3 = H H an sm u v cp - 6'il"e.,c3
rp=o .1=0
ol
x,
cl
Fig. 2 Acceleration and radiatedpower-of a single """,,,'Ull
a.) Solid angle and direction of Poynting's vector
b.) Characteristic of the radiated power
c.) polar diagramm of the radiated power
x,
(10)
(11)
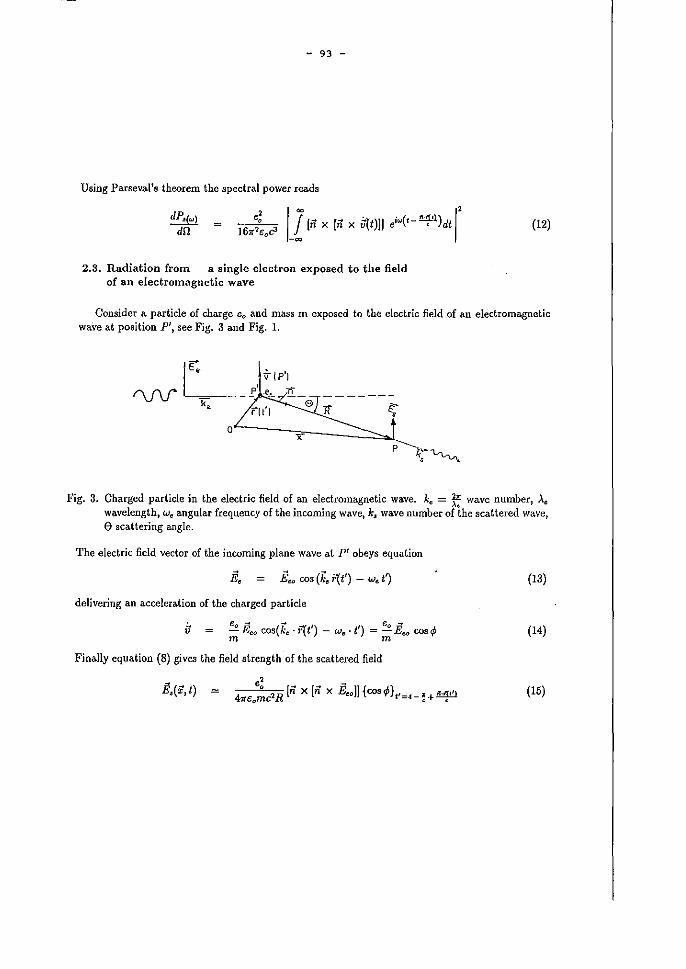
- 93 -
Using Parseval's theorem the spectral power reads
dP,(w) dn
2.3. Radiation from a single electron exposed to the field of an electromagnetic wave
(12)
Consider a. particle of charge eo and mMS m exposed to the electric field of an electromagnetic wave at position pi, see Fig. 3 and Fig. 1.
p
Fig. 3. Charged particle in the electric field of an electromagnetic wave. k" = ~ wave number, A" wavelength, W e angular frequency of the incoming wave, k, wave number of the scattered wave, o scattering angle.
The electric field vector of the incoming plane wave at pi obeys equation
E, Ew cos (k, '(I') - w, t~ (13)
delivering an acceleration of the charged particle
e, " (" Cf ') I eo .... -Eeocos ke·r\t -we·t) =-Eeocoscp m m
(14)
FinaHy equation (8) gives the field strength of the scattered field
E,(i, I) (15)
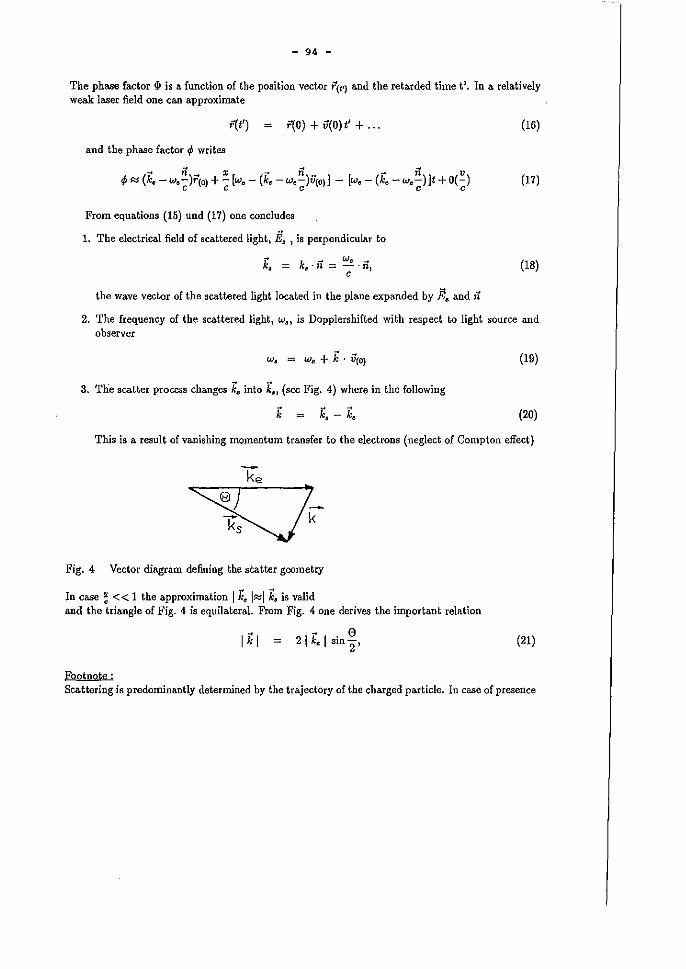
- 94 -
The phase factor ~ is a function of the position vector r(,,> and the retarded time P. In a relatively weak laser field one can approximate
f(t') f(0) + v(O) t' + ... (16)
and tbe pbase factor tP writes
.... ii x .... n ..oii v 4>'" (k,-w,-)r(O) + -lw, - (k, -w,-)V(O)] - [w,- (k, -w,-)]t+O(-) (17)
c c c c c
From equations (15) und (17) ODe concludes
1. Tbe electrica.l field of scattered light, E, , is perpendicular to
k k..o W e .... , = , . n = -;;. n,
tbe wave vector of the scattered light located in the plane expanded by Ee and it
(18)
2. Tbe frequency of the scattered light, w" is Dopplershifted with respect to light souece and abserver
(19)
3. The scatter process cbanges ke iota ;;" (see Fig. 4) wheee in the following
(20)
Trus is a result of vanisbing momenturn transfer to the electrons (neglect of Compton effect)
Fig. 4 Vector diageam defining tbe Btatter geometry
In case ;; «1 tbe approxima.tion I ~e I~I k, is valid and the triangle of Fig. 4 is equilateral. From Fig. 4 one derives tbe important relation
Footnote :
" 0 21 k,l siu 2 , (21)
Scattering is predominantly determined by the trajectory of tbe charged particle. In case of presence
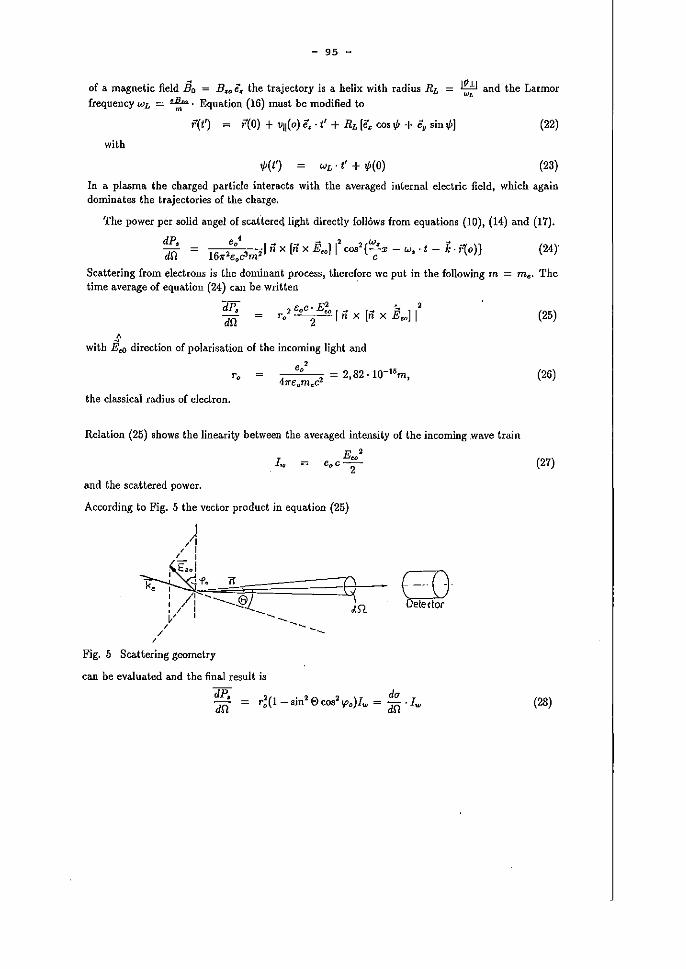
- 95 -
of a magnetic field Bo B~o e~ tbe trajectory is a helix witb radius RL = Jf:!:.l and the Larmor ., frequency WL = ~. Equation (16) must be modified to
f(t1 = .(0) + vlI(o) c,· t' + RL [C. co,.p + e, ,in.pl (22)
witb
WL . t' + >/«0) (23)
In a plasma tbe charged particle interacts with the averaged internal electric field, which again dominates tbe trajectories of the cbarge.
Tbe power per solid angel of scat'tereq light direct1y follows from equations (10), (14) and (17).
dP, dil
eo4 .......... 2 2 W 8 ....
6' r!' ,lnx(nxE,,11 cos(-x-w,.t-k·i'(o)) 1tr€om c
(24)
Scattering from electrons js tbe dominant process, tberefore we put in the following m = me. The time average of equation (24) can be WI"itten "
, dP, dil
, e.e· E-:" I" (" E~ I I' r. --2- n x n x eo
with Ee(J direction of polarisation of the incoming light and
Co 2
-15
4 _~ = 2,82· 10 m,
tr€ome(..-
the classical radius of electron.
Relation (25) shows tbe linearity between tbe averaged intensity of tbe incoming .wave triWn
and tbe scattered power.
Eeo2
e.c-2
-
According to Fig. 5 tbe vector product in equation (25)
Fig. 5 Scattering geometry
can be evaluated and tbe final result is
ED Oe!edor
dP, dil
'( ., ') du r o 1- sm E> cos !po Iw = dO ·Iw
(25)
(26)
(27)
(28)
where
du
dn
- 96 -
(29)
ia tbe differential cross-section for light scattering. After integration aver C{Jo and 0 tbe total crosssedion cau be written
u
3. Light scattering from an electron ensemble 3.1. Introductory remarks
(30)
Tbe scatter theory is now extended to N electrons in tbe scatter volume, whose individual position vector i8 labeled by fj(tj). Aga.in tbe case ~ « 1 i8 considered and thc dimension of the scatter volume be much smaller than tbe distance between scatter volume and detector. Following equations (9) and (10) tbe resulting scattered power from N electrons can be written
dP, dn
A further straightforward rearrangement delivers
dP, dn
Two limiting cases are of importance:
a) Thomson OI incoherent scattering.
(31)
(32)
Tbe second term in equation (32) is assumed to vanish. The electrons are randomly distributed and contribute with random phaßes but nearly equal field atrength a.mplitudes to the frequency cbannel W~ - We. = ,k.V(O). Tbus tbe seatter apectrum resembles the themal motion of electrons parallel to k and the spectral widtb of the seatter profile deflects the electron mean velocity or their temperature. The frequency integrated seatter ~ignal is proportional to N, the number of electrons in tbe seatter volume giv1ng the possibility to derive neo The proportionality of scattered power to N (not N 2) 1s typical of seatter processes from density fluctuations.
b) Coherent seattering. The second term in equation (32) takes account of correlated Evalues reaching the detector surface. These electric fielda are eorrelated if neighboured plasma electrons oscillate in the same way. This is the case for electrons in a. Debye sphere which are exposed to a plasma fluetuation with wave vector k = 211' I..\.. If the wa.ve length of tbe fluctuation ,\ fa.lls below tbe Debye lengtb An the fluctuation is strongly damped and eorrelation is not effective. Thus tbe so caJled seatter parameter (see equation (21))
~ 1 1
a = 21f).D = k).D = 21 ke.13in~'\D (33)
separates the regime of incoherent and eoherent scattering. For a < < 1 the actual Thomson or incoherent seattering is observed, for a ;::: 1 the seatter process reflects coherent phenornena and eoherent scattering signals are present.
- 97 -
3.2. Scatter cross section for an electron ensemble The dynamic form ractor S
Aecording to equations (15), (17), (16), (19) and (26) N electrons generate a total eledrie field at the detector
(34)
Equations (9) and (10) deliver tbe scattered power. After averaging over the time constant of tbe detection system, which must be long compared with the correlation time of plasma fluctuations, it follows with equation (27) and (29)
Therefore the cross seetion rea.ds
duSoou dfl
du !im ~ j Le-;(";(<?) dt TI'I N I' dU T ..... oo T .
-T12 )=1 "='_~
(35)
(36)
The remaining problem is to evaluate tbe "phase surn". There is a relation between the instantaneous position of the electrons and their densitYJ
N
n(r, t') LW' - i'j(t')) ;=1
where the 6·function ean be representep by (see/2f)
Witb
n,(t')
equation (37) ean be written
_1_ jeik(i'-i"j(I'»cfk (2~)3 .'
N L e-iki'j(I')
;=1
(37)
(38)
(39)
(40)
The phase surn introduced in equation (35) represents the time dependent amplitudes of density fluetuations with wave vector k. The superposition of tbe eomplete wave field ta.king aceount of all possible k vectors delivers via equation (40) the loeal electron density.
- 98 -
Using equation (36) the scatter cross section reads
dO". 1 Tj" 1 I' dn J~ T n,(t11'=1_.B dt -T/2 e
(41)
The spectral behaviour of tbe scatter cross section follows from a Fourier- Laplace transform of the ßuctuation amplitudes
j nk(t) e- iwt • e--rldt o
(42)
I is an infinitesimal real coßsta.nt, its reciprocal characterizes the length of the laser pulse, that means the time of observation. With a generalized Parseval's theorem one obtains
T/2 2')'
Tl j j 1 n,(t') I' ,,~,_~dt = 21 1 n,(t') I' "~'-f dt -T/2 0
;; ] 1 n,(w) I' dw (43) -00
Thus the equation (41) delivers
d(fs~u(k· ) dn ,W
(44)
where following the notation of equation (19)
w (45)
ia introduced.
Using the so called dynamic form factar
S(k,w) (46)
the spectral scattering power an be written
dP,(w) = I dO". N. S(k w) = PL. dO" n . S(k w)· L dn wdn ' dn. e , ,
(47)
Hefe PL ia the power of the incoming laser beam (~Itu' A,), A, the cross seetion of the laser beam at the position of the scatter volume of length L~, ne = A~L. means the averaged electron density wlthin the seatter volume.
3.3. Calculation of the dynamic form factor
As shown in the preeeding chapter the evaluation of the dynamie form factor as well as the spectral scatter power requires the knowledge of the speetral ampHitudes of density fiuetuations, which can be derived from the plasma kinetic equations.
In the formulation of plasma kinetic thoory the state of the plasma can be described in terms of one--particle distribution functions fe(f'e, Ve, t) and j;(ri' Vi, t) for the total number of electrons, N,
- 99 -
and ions N/z, resp. Neglecting binary collisions the lIuhstantial derivative of le, /;, resp. vanishcs, that means
In the following the index q = (e, i) is skipped, further eO{! = -eo, eo; = z . eo.
The acceleration term iiq can be expressed by the loeal internal electric field
eoq· E v, m,
which again is given by Poisson's equation
div E ~(zn, - n,) = ~[zJM;'v - Jf,d'i1l co co
rot E o
(48)
(49)
(50)
(51)
The set of equations (48)-(51) are nonlinear and soLved by a linearization procedure. The detailed solution is studied elsewhere (see 13/). Here only final results are given
• [ 1 - G,(l") [' w, S(k,w) = [1- G.(l") _ G,('k') I' . Fkr) + z
1 G,(l") I' (w,) 11- G,(l") - G,('k') I' . F, k (52)
where Fe, F; are the zero order velocity distribution functions for the component of the velocity VII along k normalized to unHy and
G,(w) = w'.!. Joo ßF, dUIi PO k ßVII (w + kUli - i-y)
-00
(53)
the so called "screening integrals "with the plasma frequencies
(54)
Next the calculations of S(k,w) for Maxwellian distribution functions Fq are considered, admitting different electron and ion temperatures. With the abbreviations
and
( )'1' WE = 2kBTe
k m,
w x=
WE
w y=
w/
(55)
(56)
- 100 -
and the seatter parameter (see equation (33))
one gets
Gi(y) -Z· ~a' [I - f(y) - iv;rye-"]
where
• fex) = 2xe-:z;1 J /1 dt
o
this function may be approximated by the series
limf(x) .~o
(57)
(58)
(59)
(60)
(61)
(62)
Following Salpeter (see /4f) a useful approximation enables one to weite S(k,w) as a surn of two quite similar terms, each of which i8 a function of either x or y atone. This Salpeter approach i8 , , valid for 'fJ = ~ = (~), (~)1 «1 showing the large disparity in scale of the variables x and y
for a given value of frequency w. Setting I y 1= ~ the values are very large when investigating the regime x ~ 1. Usiag
lim Gi(y) = ~;r'-a' (I - (I + _1_) - iv;rye-~) .... 0 y ..... oo Ti 2y 'l
(63)
one finds near x ~ 1
II-G,-Gd' '" II-G,I'=[I+a'-a'f(x)]' + 1I"a4
x 'le-'2:z;2 (64)
By a similar argument, when y:;;:j 1, x must be much less than unity and
(65)
Thus
11 - G, - Gi]' '" 11 + a' - Gd' = (I + a')' [I - IG~(~, [' (I + a')' ([I + ß' - ß' f(y)]' + ~ß'y'e-'~} (66)
with
ß' (67)
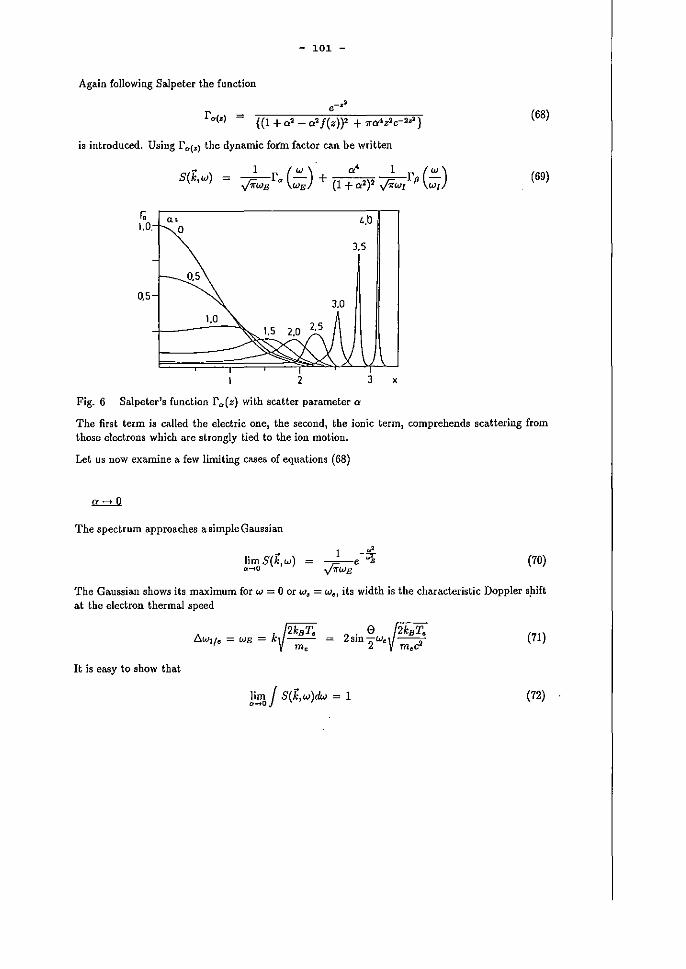
- 101 -
Again following Salpeter the function
e-Z~
r.(.) = {(I + a' - a' j(z))' + ,,«'z'e "'}
is introduced. Using r er(:I) the dynamic fOl'ffi factor can be written
r, 1.0.
0.5
n,
S(k,w) =
o
0.5
1.0
_l_r (~) + a' _1 r (-"'-) ";;WB a WB (1 + 0:2)2 ";;WI P Wl
3.5
3.0
2 3 x
Fig. 6 Salpeter's function ra(z) with scatter parameter 0:
(68)
(69)
The first term is called the eleclric one, the second, tbe ionic term, comprehends scattedng from those electrons which are strongly tied to the ion motion.
Let us now examine a few limiting cases of equations (68)
The spectrum approaches asimpleGaussian
limS(k,w) .~O
1 -~ --e' .,fiWE
(70)
The Gaussian shows its maximum for W = 0 or W~ = We , its width IS the characteristic Doppler spift at the electron thermal speed
lkBT. . 0 J2kBT. D.w,,/e = WB = k -- = 2sm-we --me 2 mec2
(71)
It is easy to show that
Iim J S(k,w)dJN = 1 .~O
(72)
- 102 -
Therefore there js a etriet proportionality between the eleetron density and tbe total frequeney integrated scattering power as ean be seen from relation (47). The ease 0 -t 0 means incoherent sca.ttedng from N free electrons: These electrons have nearly straight trajectories and are not influenced by the electde fields in the plasma.
<>""I
Now contributions from both terms in equation (69) oceur. Tbe first (electronie) term is present in a. frequeney range 0 $1 W 1 S I WB I, while the second (ionic) term is dominant in the amaH frequency regime 0 ~ I W I S I w/ I. The scatter light reßects the fact that tbe trajeetoiies of eleetrons and ions a.re atrongly influenced by the interna.! eleetric fields within a Debye sphere.
<!22..l
Now the ionie part of tbe scatter spectrum i8 the dominant oue and i8 eentered near w = O. Tbe relatively weak electronic term peaks near the frequeney (see equation (57»
'l 2 k2
2 ( 3) WMB ;:::: wpe + 3kB Te- = wpe 1 + 2 m o <> (73)
Equation (73) 1s identical with the dispersion relation for longitudiual plasma waves in the limit kAD -). 0 or a -). 00. Near w = wpe the electronie scatter term can be approximated by a Lorentzian profile, who5e width i5 governed by 50 called Landau damping. When eollisional damping becornes significant (for the large 0 case) the line widtb will be determined by tbe reeiprocal of the mean collision time. With growing a these electronic satellites vanish with l/a2 as seen later. The ionic speetrum near 0 $1 W 1 ~ I WI I ,however, saturates and ß approaehes Jz. ~, which remains near uoity in the frame of Salpeter's theory. Therefore the ion feature do~ not peak and resembles the a ~ 1 case of tbe eleclronic spectrum. Most of the scatter signal now sterns from this ionic spectrum.
This can be seen quantitatively by evaluating the total frequency integrated cross section from equation (69). An exact calculation delivers
Joo.... ........ 1 Z04
8(k,w)dw = 8o(k) + 8,(k) = 1+ a' + (1 + a')(1+ <>'(1+ zL)) - ~ (74)
The electronic feature thus vanishes with 1/02 for 0 » 1 wbile the ionic term approximates ~+' 1 .I~.
as stated before. ' The tbree cases Q' < < 1, Q' ~ 1, and 0 > > 1 are gathered in Fig.7
so !
l ........ R.
1 }6>-t
. " T. '!ov
Fig.7 Scatter spectrum for Q' < < 1, a ~ 1 and 0 > > 1 after /5/ Footnotej Salpeter's approach is not applicable for # » 1 (as realized in glow discharges). A numerical
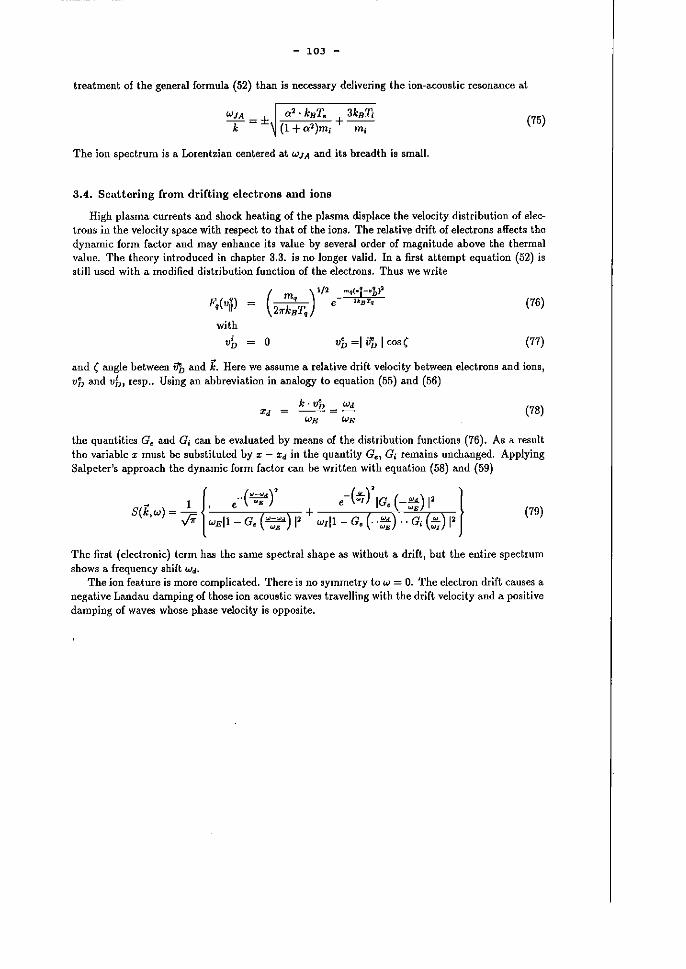
- 103 -
treatment of the general formula (52) than is necessary delivering the ion-aooustic resonance at
(75)
Tbe ion spectrum is a Lorentzian centered at WJA and its breadth ia small.
3.4. Scattering from drifting electrons snd ions
High plasma currents and shock heating of the plasma displace the velocity distribution of electrons in tbe velocity space with respect to that of the ions. The relative drift of electrons affects tbe dynamic form factor and may enbance its value by several order of magnitude above the thermal value. Tbe theory introduced in chapter 3.3. ia no longer valid. In a first attempt equation (52) is still used witb a modified distribution function of tbe electrons. Thus we write
F,(u~) --'- e aBTq (
m ) 1/2 ... q(·i-·~)~
21rkB Tq (76)
witb
vb = 0 vh =1 VD 1 cosC (77)
and C angle between Vb and k. Hefe we assume a relative drift ve10city betwel'm electrona and ions, vb and vb, resp .. Using an abbreviation in analogy to equation (55) and (56)
k· vh Wd Xd = --=-
WB WE (78)
tbe quantities Gc and Gi can be evaluated by means of the distribution functions (76). As a result tbe variable x must be substituted by x - Xd in tbe quantity GCl Gi remains unchanged. Applying Salpeter's approach the dynamic form factor can be writtcn with equation (58) and (59)
(79)
The first (electronic) term has the same spectral shape as without a drift, but tbe entire spectrum shows a frequency 8hift Wd.
The ion feature i8 more complicated. There ia DO aymmetry to W = O. The electron drift causes a negative Landau damping of th08e ion acouatic waves travelling with the drift velocity and a positive darnping of waves whose phase velocity is oPP08ite.
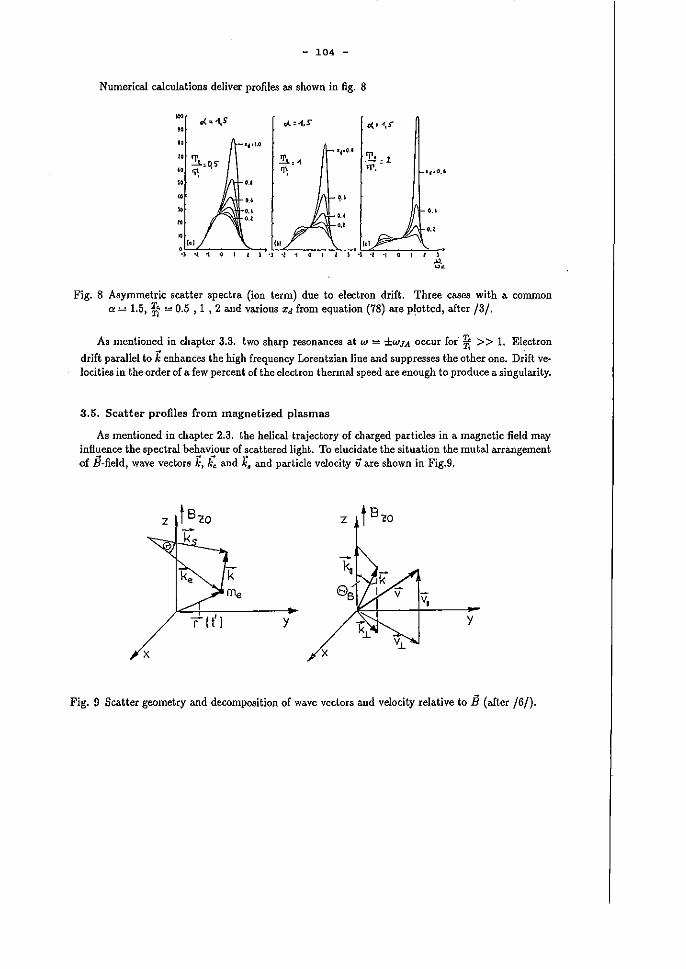
- 104 -
Numerical calculations deliver profiles as shown in fig. 8
" Q{ ""1,S .. ,J. :4,S" c<.' -1,.5"'
.. '4,1,0 .. .!i.. -1 '4'0-'
fj1':1 ~:q) .. ,~ 0; >1'. '4,0.1 .. . .. .. •• ~.I
• •. , •.. ... .. . .. .. , . ..
• ,., '" ,,' • ,-' ., .. ., ., , • , , ., .,
Fig. 8 Asymmetrie seatter spectra (ion term) due to electron drift. Three cases with a eommon a = 1.5, ~ := 0.5 , 1 , 2 and various Xd from equation (78) Me p~otted, after /3/.
As mentioned in chapter 3.3. two sharp resonances at W := ±WJA occur for" ~ » 1. Electron
drift parallel to k enhances the high frequency Lorentzian line and suppresses the other one. Drift velocities in the order of a few percent of the electron thermal speed are enough to produce a singularity.
3.5. Scatter profiles from magnetized plasmas
As mentioned in chapter 2.3. the helical trajectory of charged particles in a magnetic field may influence the spectral behaviour of scattered light. Ta elucidate the situation the mutal arrangement of B-field, wave vectors k, k: and k. and particle vclocity va.re shown in Fig.9.
z
Tlt') y y
x x
Fig. 9 Scatter geometry and decomposition of wave vectors and velocity relative to jj (after /6/).
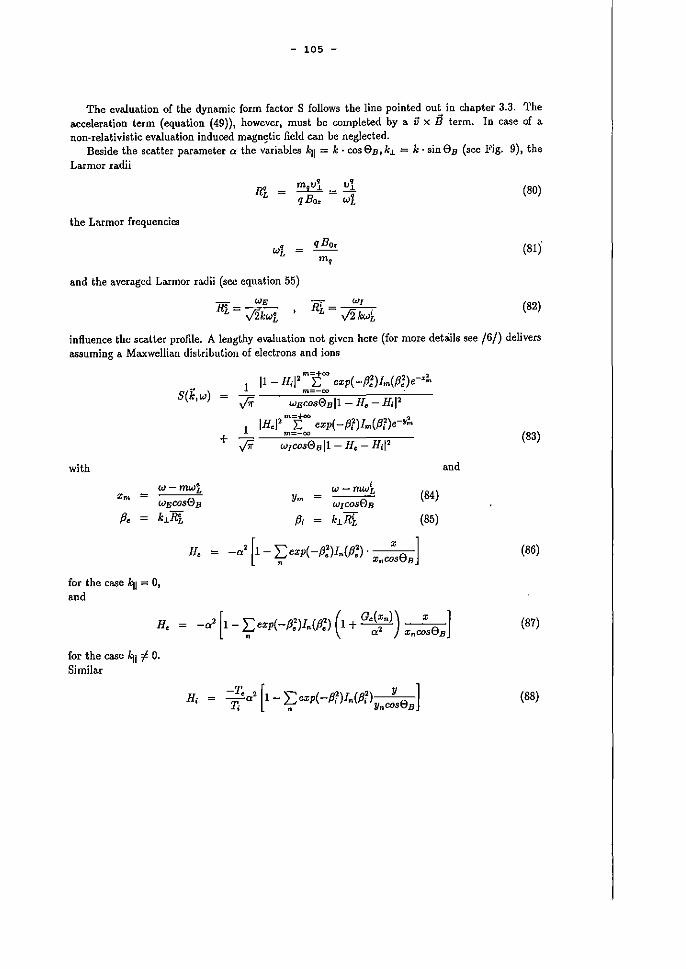
- 105 -
The evaluation of the dynamic form factor S follows tbe line pointed out in chapter 3.3. The acceleration term (equation (49», however, muat be completed by a v x jj term. In ca.se of a non-relativistic evaluation induced magnc;tic field ca.n be neglected.
Beside the scatter pa.rameter a the variables kJl = k· cos0B,k.L = k· sineB (see Fig. 9), the Larmor ra-dii
the Larmor frequencies
wl =
and the averaged Larmor radii (see equation 55)
- WB R!--
L - ./2kwl
qBo~
m,
(80)
(81)
(82)
infiuence the scatter profile. A lengthy evaluation not given here (for more details see /6/) delivers assuming a Maxwellian distribution of e1ectrons and ions
S(k,w)
with
w-mwi.. = Xm wEcos0B
ß. k.llL
for tbe case kU = 0, and
H.
{or the oase "11 # 0, Simila.r
H;
v:;r wEcos0Bll- He - Hd 2
+
m=+oo ::I
1 IH.I' L: exp( -ß?)Im(ß!)e-Ym
m ro (83)
.nd
w-mw~ (84) Ym
W/COS0B
ß; k.lRi (85)
(86)
(87)
-T. [ y 1 -T." a' 1 - L exp( -ßilI.(ßil EJ I n Yncos B
(88)
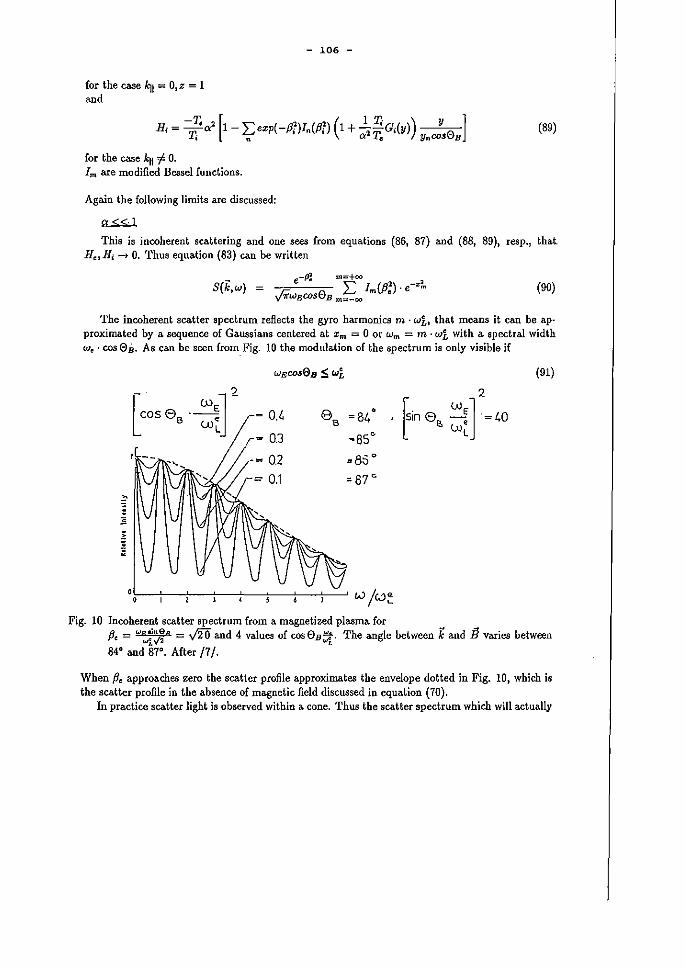
for the case kJl = O,z = 1 and
- 106 -
H; = -T,T,,,, [1- 'Eezp(-ß;)J"(P!l (1+ '!-'T,T,'G;(y)) y 0] I n a e YnC()S B
ror the case kJl "# O. Im are modified Bessel fUßctioßs.
Again the following limits are discuased:
~
(89)
This ia incoherent scattering and one sees from equations (86, 87) and (88, 89), resp., that. He, Hj -J. O. Thus equation (83) can be written
S(k,w) = (90)
The incoherent scatter spectrum reflects the gyro harmonics m . wl, that means it ca.n be apo proximated by a sequence of Gaussians centered at Xm = ° or Wm = m . wl with a. spectra.l width We ' cos SB. As ean be seen from_ Fig. 10 the modulation of the spectrum ia only visible if
[COS e . W E] 2 _ 0.4
B w' L
Fig. 10 Incoherent seatter apectrum from a magnetized plasma. for
2
rin e W,] = 1.0 B W.
L
(91)
Pe = ",,~j~~B = ..;2"0 and 4 values of cos SB7.. The angle between k and jj varies between , , 84' and 87'. After 17/.
When Pe approaches zero the satter profile approximates the envelope dotted in Fig. 10, which ia the seatter profile in the absence of magnetic field discussed in equation (70).
In practice seatter light ia observed witbin a cone. Thus the seatter spectrum which will actually
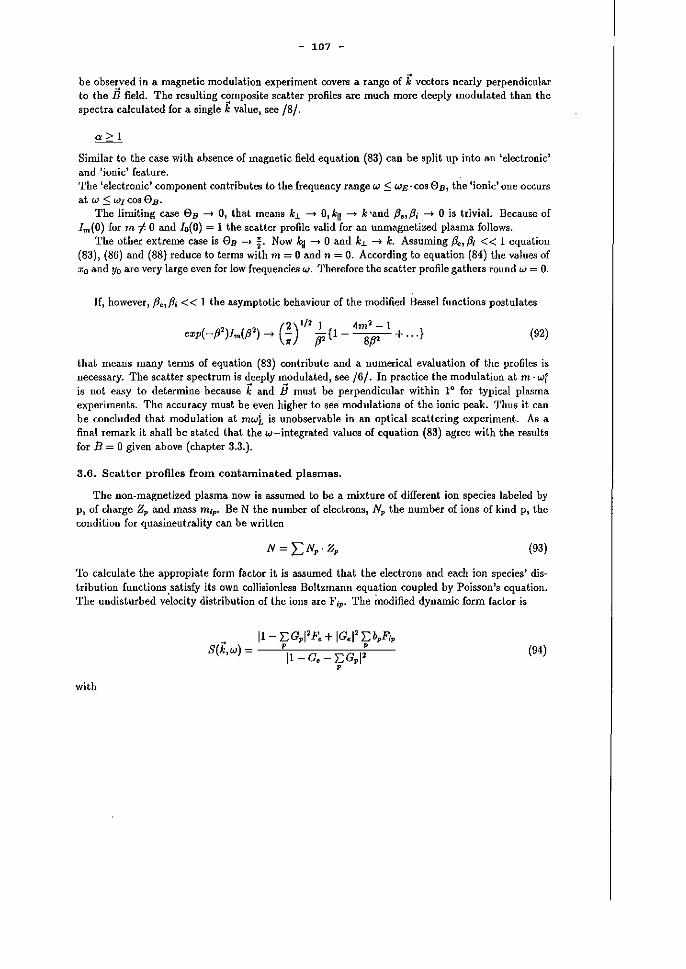
- 107 -
be observed in a magnetic modulation experiment covers a range of k vectors nearly perpendicular to the B field. The resulting composite scatter profiles are much more deeply modulated than the spectra caleulated for a single k value, see /8/.
a~l
Similar to the ease with absence of magnetic field equation (83) ean be split up into an 'electronic' and 'ionie' feature. The 'electronic' component contribute'l to the frequency range w .:::; WE· cos eB , the 'jonie' one oecurs at w ':::;WICOSeB •
The limiting caße eB ---* 0, tbat means kl. -t 0, "11 -t k 'and Pe, Pi --+ 0 1S trivial. Beeause of Im(O) for m t- 0 and 10 (0) = 1 the scatter profile valid for an unmagnetized plasma folIows.
The ather extreme ease is eB -) ~. Now kjl -t 0 and kl. -) k. Assuming Pel Pi « 1 equation (83), (86) and (88) reduce to terms with m = 0 and TI = o. According to equation (84) the values af :1:0 and VO are very large even for low frequencies w. Therefore the seatter profile gathers round w = O.
If, however, PeIPi« 1 the asymptotic behaviour of the modified Bessel functions postulates
(2)1/ '1 1 4m '1 -1
exp( -ß')Jm(ß') -->;;: ß' {I -~ + ... } (92)
that means many terms af equation (83) eontribute and a numerical evaluation of the profiles is neeessary. The seatter spectrum is deeply modulated, see /6/. In pradiee tbe modulation at m . wf is not easy to determine because k and jj must be perpendieular within 1° for typical pla.o:;ma experiments. The accuracy must be even higher to see modulations of the iOßie peak. Thus it can be concluded that modulation at mwi i8 unobservable in an optlcal scattering experiment. As a final remark it shall be stated that the w-integrated values of equation (83) agree with the results for B = 0 given above (chapter 3.3.).
3.6. Seatter profiles from contaminated plasmas.
The non-magnetized plasma now is assumed to be a mixture of different ion species labeled by p, of charge Z" and mass mip. Be N the number of electrons, Np the number of ions of kißd p, the condition for quasineutrality ean be weilten
(93)
To calculate the appropiate form factor it js as8umed that the electrons and each ion species' distribution functions satisfy its own eollisionless Boltzmann equation eoupled by Poisson's equation. The undisturbed v~locity distribution of the ions are Fip. The modified dynamic form factor is
(94)
with
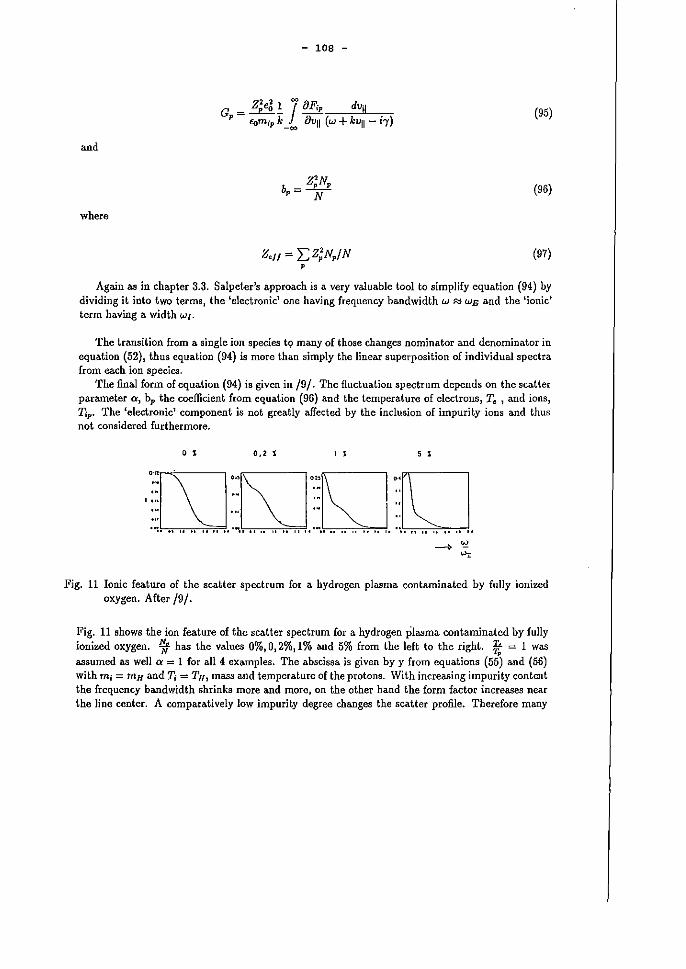
- 108 -
(95)
and
(96)
where
(97)
Again M in chapter 3.3. Salpeter's approach is a very va.luable tool to simplify equation (94) by dividing it iota two terms, the 'electronid one having frequency bandwidth w :=;:: WB and the lionic' term having CI. width W/.
The transition from a. single ion species tQ many of those changes nominator and denominator in equation (52)J thU8 equation (94) is more than simply tbe linear superposition of individual spectra. from each ion species.
The final form of equation (94) is given in /9/. The fluctuation spectrum depends on the seatler parameter 0', bp the coefficient from equation (96) and the temperature cf electrons, Te I and ions, Tip. The 'electronic' component js not greatly affected by the indusion of impurity ions and thU8 not considered furthermore.
o , 0,2 ,; I , , ,
,O:~w' ::lSJ~':~ ::D ,.. ... ,.. "
'''l •• , " .... " , .......... " 10 " " ......... " ....... ~ ..... " .... ..
Fig. 11 lonic feature of the scatter spectrum for a. hydrogen plasma contaminated by fuUy ioniz.ed oxygen. After /9/.
Fig. 11 shows the ion feature of the scatter spectrum for a hydrogen plasma contaminated by fuHy ionized oxygen. !ff has the values 0%,0,2%,1% and 5% from the left to the right. ~ = 1 was a.ssumed as we1l Q' = 1 for all 4 examples. The abscissa is given by y from equations (55) and (56) with mj = mH and Ti = T«, mass and temperature of the protons. With increasing impurity content the frequency bandwidth shrinks more and more, on the other hand the form factor increases near the liDe center. A comparatively low impurity degree changes the scatter profile. Therefore many
- 109 -
attempts were star ted to measure the level of contamination by light scattering, see chaptcr 4.4 .. More accurate calculations take account oI the magnetic field. Then equation (94) must be modified.
3.7. Relativistic effects
With increasing temperature oi electrons and ions thc assumption ß = ~ < < 1 made in the preceding chapters is no longer valid. Beyond 108 IC(ß = 0,2) the condition ß < < 1 is violated, and the equations given in chapter 2.3. must experience some rclativistic corrections.
A single charge at P' moving with ß ~ 0 in the field of an electromagnetic wave produces a field strength at the detector position P
(98)
where the uuit vcctor
ko
ko (99)
was introduced, l/l is specified byequation 14 and re means classical electron radius. The trajectory of the electron now follows from the relativistic equation of motion
d "" dt,(mü) ~ q(E + iJ x B) (100)
As mentioned in chapter 2.3., the influence of the E and llfield of the wave on particle motion is marginal. Than the retardation follows from
, (x iif(O))) / "" t ~ t - ;:- + -c- (1 - n . ß)
and thc phase futor ,p can be written
~ k" "() (Wo Wo" "()) (1 - eß) 'f' = e' r 0 + -x - wet - -n . r 0 ........ C C (1- nß)
From formulas (98) and (102) one concludes:
a) The electrical field vector E of the scattered light is no longer coplanar with EfO and Ti
b) The frequency of incoming and scattered laser light are different
W. (1- eß)
Wo---"-(1 - ilß)
(101)
(102)
(103)
- 110 -
c) Equations (18) and (20) are still valid, but 1 k, 111 k. 1
d) The intensity of scattered light follows by applying equations
(9) and (98) in combin.tion with equ.tion (26) .nd (27). Terms of order (11· Ee(J)2 are neglected. Using equations (25), (27) and (29), the cross sedion with relativistic correction
(for!po = ~) can be weitten
~ dP, = (dG) = r: (W')' (1- ß') I w dfl dfl ,e1 W" (1 - ii . ß)2
(104)
Equation (104) is anly valid for large scatter volumes. For small volumes there is a difference between
course of time at the scatter volume and at tbe detector where
6.t'=~ (1 - riß)
(105)
If the detector sees the scatter energy .6. W, tbe appropriate power is .o..o.~ = (1- riß) ~';': , that means
the cross section given in equation (104) mllst be multiplied by the factar (1- iiß).
Here ooly results for the incoherent case are reported. One mllst evaluate the formula
(106)
Fe(V) sta.nds for the relativiatic velocity distribution of eledrons. The numerical evaluation of equation (106) valid for the wavelength of a. ruhy-Iaser p. = 6934A) and for a 90° scatter experiment is
shown in Fig. 12
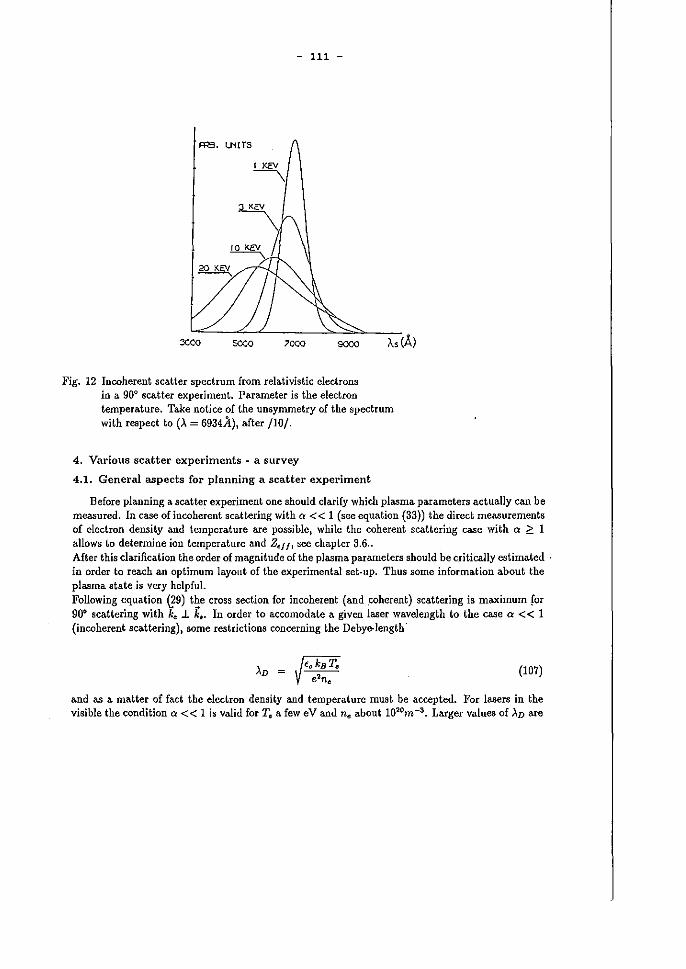
- 111 -
~. LNITS
Fig. 12 Incoherent scatter spectrum from relativistic electrons in a. 90° scatter experiment. Parameter is the electron temperature. Ta.ke Dotiee of the unsymmetry of the spectrum wi(h reapec( (0 (i. = 6934A), aner /1O/.
4. Various Beatter experiments - a survey
4.1. General aspects for planning a scatter experiment
Befate pla.nning a scatter experiment one should c1ariry which plasma. parameters actually can be measured. In case ofincoherent scattering with Cl < < 1 (see equation (33)) the direct mea.surements of electron density and temperature are possible, while the coherent sca.ttering ca.se with a ;::: 1 a.1lows to determine ion temperature and Z~/j, see chapter 3.6 .. After this clarification the order of magnitude of tbe plasma parameters should be critically estimated ' in order to reach an optimum layout of tbe experimental set-up, Tbus some information about tbe plasma state is very helpful. Following equation ~9) t~e cross section for incoherent (and ,coherent) scattering is maximum for 900 scattering with ke J. k,. In order to accomodate a given laser wavelength to the case a « 1 (incoherent scattering), some restdctions ooncerning the Debye-lengtb'
(107)
and as a matter of fact tbe electron density and temperature must be accepted. For lasers in tbe visible tbe condition a« 1 is valid for T~ a few eV and ne about l020m-3. Larger values of)"n are
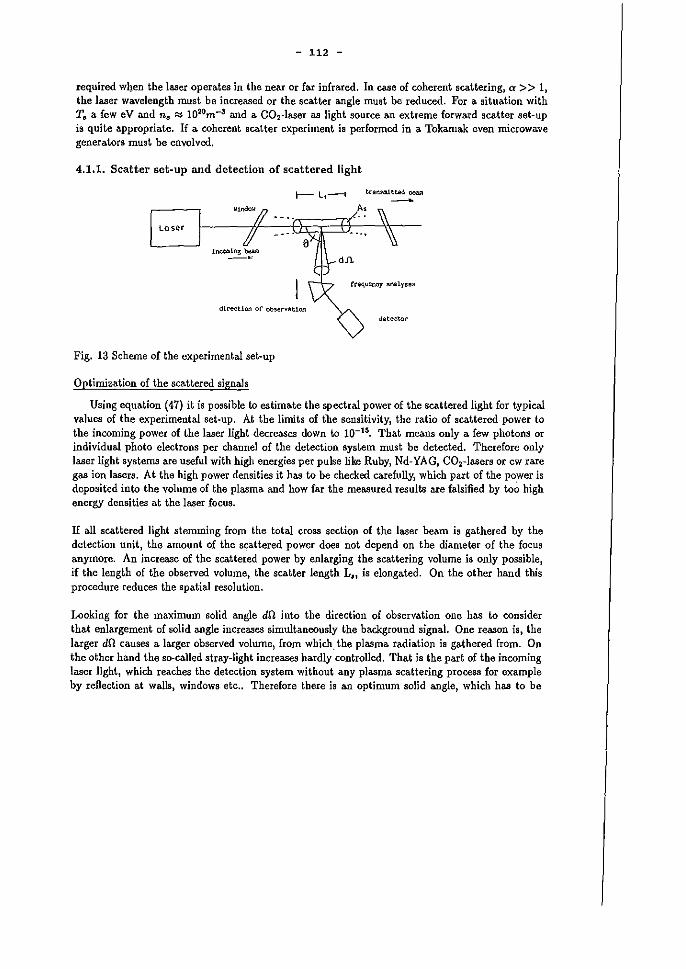
- 112 -
required when tbe laser opera.tes in the neM or far infrared. In caße of coherent scattering, a» I, the laser wavelength must be increased or the scatter angle must be reduced. For a situation witb Te. a few eV and ne. ~ l02om-3 and a. CO2-laser aa light source an extreme forward scatter set-up ia quite appropriate. If a coherent scatter experiment is performed in a Tok3IIlak even mierowave generators must be envolved.
4.1.1. Scatter set-up and detection of scattered light
I-- L,-I tran~tt.ed oeam
dLreetlon of observation dete>!tor
Fig. 13 Scheme of the experimental set-up
Optimization of the sca.ttered signals
Using equation (47) it is poasible to estimate the spectral power of the scattered light for typical values of the experimental set-up. At the limits of tbe sensitivity, the ratio of scattered power to the ineoming power of the laser light deereases down to 10-15. That meana only a few photons or individual photo electroDs per channel of the detection system must be detected. Therefore only laser light systems are useCul with higb energies per pulse like Ruby, Nd-YAG, CO2-lasers or cw rare gas ion lasers. At tbe high power densities it bas to be checked earefully, which part of the power is deposited into the volume of the plasma and how far the measured results are falsified by to~ high energy densities at the laser foeus.
If all scattered light stemming from the total cross section of the la.ser bea.m is gathered by the detection unit, the amount of the seattered power does not depend on the diameter of the foeus anymore. An inerease of the sca.ttered power by enlarging the scattering volume ia only possible, if the length of tbe observed volume, the seatter length LI! is elongated. On the other hand this procedure reduces the spatial resolution.
Looking for tbe maximum solid angle dO ioto the direction of observa.tion one has to conaider that enlargement of solid angle inereases simultaneously the background signal. One reason is, the larger dO causes ala.rger observed volume, from which, the pla.sroa radiation is gathered from. On the other hand the so-ca.lled stray~ligbt inereases hardly eontrolled. That is the part of tbe incoming laser Hght, which reaches the detection system without any plasma scattering process for example by reßection at walls, windows ete.. TherefoIe theIe is an optimum solid angle, which has to be
- 113 -
found out for every scatter experiment by analysis of the geometry of the chosen opti~.
Possibilities of the frequency analysis of scattered signals
The eaBiest way to analyse the spectrum of the scattered signals is to use a one channel system, whose spectral curve of transmission is g.anged by tilting an interference filter or by scanning a monochromator, for example. The advantage of this simple set·up is balanced by the important dis· advantage, that the scattered spectrum has to be puzzled together from values measured at different times. That means oue needs a lot of time for the measurement and a high reprodudbility of the plasma under investigation.
By using a multichannel system it is possible to reeord tlie complete spectrum of the scattered light by one single pulse of the laser system. The distribution of scattered spectrum over the indivi· dual ehannels can be realized by comhining reflection and interferenee filters, by feeding the spectrum into several bundl~ of glassfibers at the exit slit of a monochromator or by using homo/heterodyning techniques in combination with e1edronic frequency filters. These filters analyse spectrally the seattered spectrum, which is mixed down into the low frequency regime.
Especially for discharges of single shot type like Tokamaks these multi-channel systems are very useful. Parallel channeIs measuring at different spatial areas give a further improvement, where each spatial channel works as a spectral multi-channel analyser. This can be done by several parallel opties of observation or by using a two dimensional array of diodes at the exit slit of a monochromator. One axis of the array records the frequency resolved scattered light, which hM to be assigned to the different spatial points along the other axis. It js an aggravating disadvantage of such a multi·channel system, that all channeIs have to be calibrated relatively to eaeh other, to compare and to weigh the measured data. It haa to he taken iuto account carefully that the sensitivity of the detection systems may be different for continuous or pulsed signals or for the superposition of both types.
Detection of the scattered light
Because of the low signal level of the scattered light the main requirements for the detection system are: high quantum efficiency, large gaiß, low drift and noise. Additionallya good temporal resolution ia needed for measuring the short signals scattered from pulsed systems.
The choiee of a suitable detector depends on the individual set-up of the scattedng experiment, too, especially on the chosen waveleugth of the used laser light. Possible types of detectors are shortly discussed in the following: In the visible photomultipliers are mainly used with a medium quantum efficiency (up to 20 %), but with a high current gain (up to 107
). By a proper electronic circuiting the photomultipliers have a good time resolution, but depending on their construction they are sensitive to jamming by electrlcal and magnetical fields. By improving the quantum effidency and the gain of photo diodes it is possible to use such an array of these diodes for multi-channel system arrangements. As a detector for the near infrared the Si·avala.nche diode has an extreme high quantum efficiency (up to 100 %) with a relatively poor gain (up to 102 ). The needed gain of the signals has to be done by separate electronics with an additional sensitivity for noise and jamming by externat fields. To detect the radiation of CO',;t-Ja.sers at the IR region H&, Cdll Te-detectors are used with a high sensitivity and a good time resolution, hut these detectors need a cooling by liquid air.
- 114 -
In case of experiments with infrared lasersources Schottky-Barrier diodes are very appropriate to detect the scattered spectrum, which is mixed down to a frequency range of GHz.
The problem here are noise and the sensitivity, which depends critical1y on the energy coupling of the FIR waves to the antenna-system (Whisker).
4.1.2. Optimalization of the signal to noise ratio
Accomplishing scattering experiments, soueres of thc background noise are mainly the straylight, the seH radiation of the measured plasma and noise, produced by the statistics of the photons, by detectors, by electronics and by electronical disturbances.
The stray light is located at the central frequency of the used laser light, because it is produced by that part of the laser light, which ean directly rea<:h the detection system without a seatter process. Therefore the influence of the stray Jight can be blocked, if the frequency range around tbe eentre of the scattered profile is not used for data evaluation. Blocking ean be performed for example by a narrowband blocking filter. This is only usefull at temperatures, where scattered profiles are definitively broader than the transmission profile of the blocking filter. Additionally using this type of bloeking the calibration of the scattering set-up is not possible by the proeess of Rayleigh scattering, because this type of scattered light is located at the same eentered channel. Beside this the stray light should be reduced by a suitable transmission of the laser beam. The fust direct reduction of the stray light js possible by a suitablc system of apertures neM the optics of the incoming beam. These apertures should block the pai"asitic laser light reaching regions inside the plasma vessel, which are next to the seatter volume. The arrangement of entrance and exit windows is important, too, and they should be nearly free of scattering centers. Additionally following the direction of the transmitted laser beam a suitable light dump suppresses that part of the laser light coming back to scattering area (see Fig. 14).
The largest amount of thc stray light comes from the part of the vessel wall situated opposite to the direction of observation, henee at this position any reduction of reflexes is most efficient. This can be done by roughing the wall surface, by aligning a stack of razor blades or by mounting blackened pyramides viewing onto the edges and tips. Latter proved to be most efficient when optimizing simultaneously the imaging optics.
With respect to the disturbing radiation of the plasma itself conta.ining continuum and line emission the wa.velength of the light source has to be chosen, if possible, in a waveLength range, which does not show up strong line radiation of the plasma within the area of the scatteeed spectrum. In this ease the possible laser induced ßuorescence would falsify the seatter profiles. Because the scattered light is linearly polarized in contrast to the plasma radia.tion, a polarizee at the direetion of observation reduces the noisy part of plasma radiation down to the half.
The signal to noise ratio eaused by the plasma radiation, the statistics of the photons, the deteetor, the electronics and the electrica.l disturbances can be improved additionally by special measuring techniques. Gating of the detectors and the measueed signals optimizes the ratio of measured values
- 115 -
to background data. Tbat means tbe measured signal should be integrated ooly over a time interval as long as the scattering pulse lasts. Using continuously working experiments Lock-In and BOXCAR techniques can be used. Supplementary statistical methodes are applied to analyse the signals.
4.1.3. Calibration and interpretatiol} ar the scattered signals
To evaillate the absolute value of the electron density from the measured seatter profiles (using equation (47)) in principle all data of the scatter experiment have t~ be known exactly, like the transmission of the optics, the seatter length and the solid a.ngle of the diredion of observation. These data can be calculated only with a high inaccuracy. The problem mllst be solved by calibrating the experimental set-up by a scattering process, which shows identical dependence of parameters as the Thomson scattering process. That means the scattered power has to be proportional to the density of the scattering particles and to the incoming laser power. Using the identical scatter set-up for the calibration process the value of the transmission, the seatter length and the solid angle are identical. In the ratio of the Thomson scattered signal to the signal of calibration the dependence of the parameters upon the scattering geometry cancels. If the density of the scattering particles can be evaluated precisely during the calibrating procedure for example by press ure and temperature measurements, and if the cross seetions of the scattering process are known sufficiently, absolute values of the electron density follow.
Different scattering proceases can be used for calibration. So in the visible the calibration is mostly done by Rayleigh seattering from cold gases. The cross sections are precisely known, the density can be measured well knowing the pressure and the temperature. Not to leave the dynamic range of the detection system the signals of the R.ayleigh scattering should be of the same order as the Thomson scattered signals. This is obviously problematic for a high stray light level. Additionally Mie scattering from light dUSit particles will occur at high pressure (a few 104. Pa), which has to be used to get a sufficient high signal from Rayleigh scattering. Another problem is the dependence of the cross seetions of the Rayleigh scattedng on the wavelength ("" f;). In the infrared these cross sectioßs become too smaIl, and cannot be balanced by increasing the press ure of the cold gas. That 's why liquids and crystals are used as media for calibration in this wavelength range.
Using Raman scattedng for calibration the problem of the stray light does not oceur, the scattered signals are located far away from the frequency range of the incoming laser light. For this procedure however only special Raman active gases are usefull whose cross section can be calculated with a sufficient accuracy. Because of the smaIl values of the cross sedion the measurements have to be done normally at cornparable high pressure. The utual value of the stray light can be extrapolated from the measurements of the Rayleigh scattering by decreasing the pressure of the cold gas to the limit of zero. By means of these stray light signals the Thomson scattering signals must be corrected.
Then the electron density follows from the frequency integrated profiles of the Thomson scattering. Further plasma parameters, usually temperatures, should be derived from the shape of the spectral profile of the scattered signals. Here the measured values are compared with a calculated profile. For this method it has to be taken into account, that the resulting profile comes from folded integration of the sensitivity profiles of the single frequency channels with the concerning theoretical
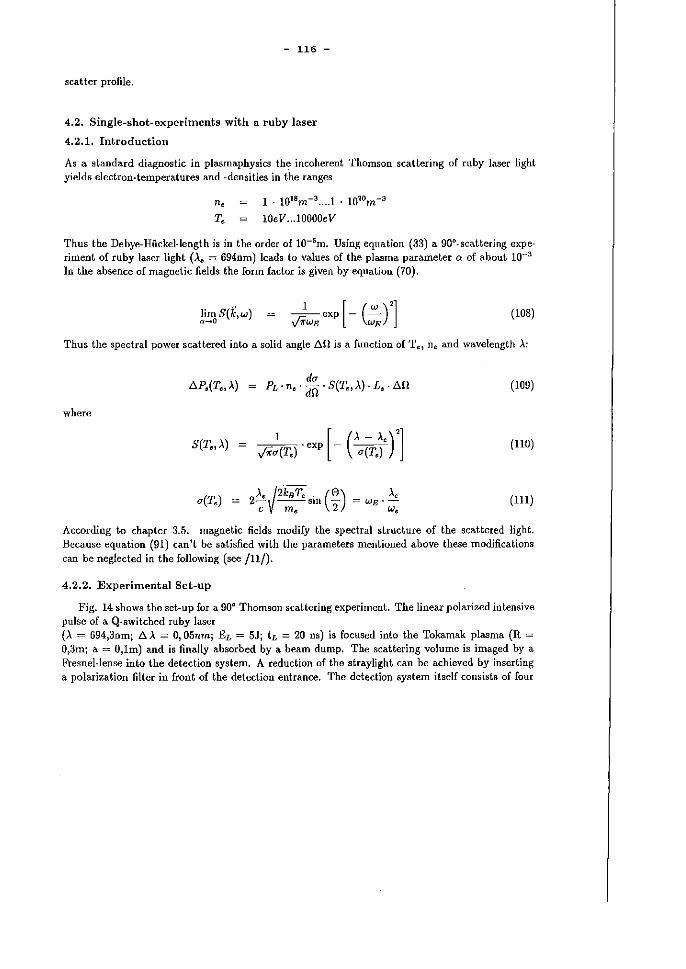
- 116 -
scatter profile.
4.2. Single-shot-experiments with a ruby laser
4.2.1. Introduction
As a standard diagnostic in plasmaphysics th~ incoherent Thomson scattering of ruhy laser light yields electron-temperatures aud -densities in tbe ranges
ne 1 . 1018m-3 .... 1 . I02om-3
T, 10eV ... 10000eV
Thus the Debye-Hückel-length is in the order of 1O-5m. Using equation (33) a 90o-scattering experiment of ruhy laser light (A., = 694nm) leads to values of the plasma parameter a of about 10-3
In the absence of magnetic fields the form fadar is given by equation (70).
limS(k,w) ._0 _1 exp [_ (-"-) '] ViWE WE
(108)
Thus the spectral power scattered into a solid angle.6.0 i8 a fundion of Te, Oe aud wavelength A:
where
d~ Io.P,(T" A) = PL· n, . dl1 . S(T" A) . L, . 10.11
S(T" A) = ,;;r:(T,)· exp [- C.(T,~')']
~(T,) = 2~lkBT, sin (~) c me 2
A, = WE'w,
(109)
(110)
(lll)
According to chapter 3.5. magnetic fields modify the spectral structure of the scattered light. Because equation (91) can't be satisfied with the parameters mentioned above these modificatioos can be neglected in the following (see IH/).
4.2.2. Experimental Set-up
Fig. 14 shows the set-up for a 90° Thoffison scattedng experiment. The linear polarizcd intensive pulse of a Q-switched ruby laser (A = 694,3nmj .6..>" = 0,05nmj EL = 5Jj tL = 20 ns) 1s focused into the Tokamak plasma (R =
0,3mj a. = O,lm) and is finruly absorbed by a beam dump. The scattering volume 1s imaged by a Fresnel-Ieose ioto the detection system. A reduction of the straylight can be achieved by ioserting a polarization filter in front of the detection entrance. The detectioo system itself consists of four
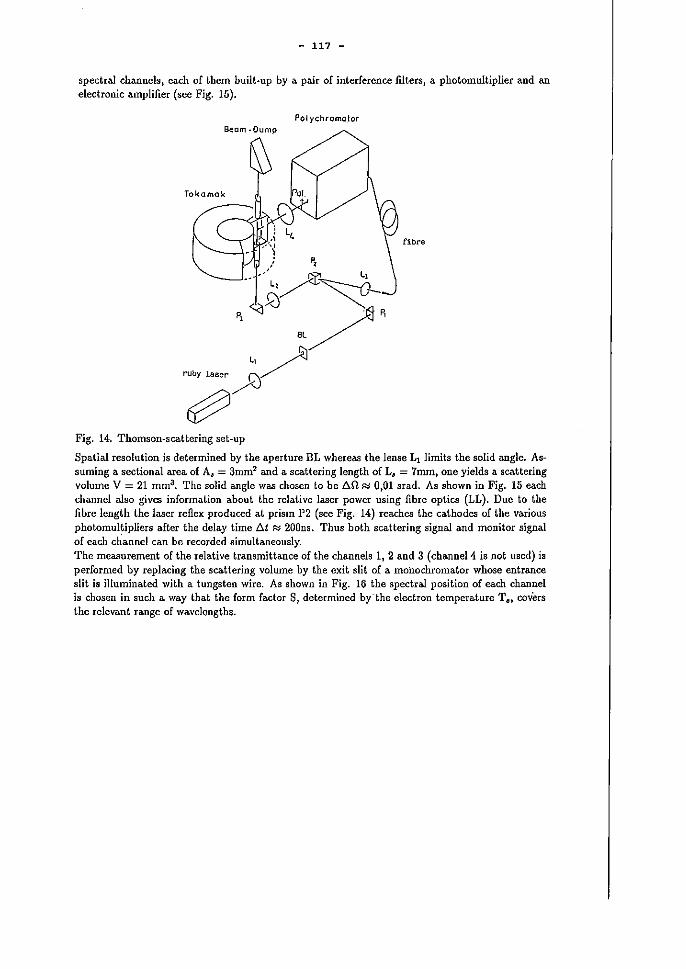
- 117 -
spectral channels, each of tbem built·up by a pair of interference filters, a photomultiplier aud an electronic amplifier (see Fig. 15).
Pol ychromo.tor Becm .Oump
fibre
Fig. 14. Thomson·scattering set·up
Spatial resolution is determined by the aperture BL whereas the lense Ll limits the solid angle. As· suming a. sectional area of A, = 3mm2 and a sca.ttering length of L, = 7mm, one yields a sca.ttering volume V = 21 mm3• The solid angle was chosen to be 6.0 ~ 0,01 srad. As shown in Fig. 15 each channel also gives information about the relative laser power using fibre optics (LL). Due to the fibre length the laser reflex produced at prism P2 (see Fig. 14) reaches the cathodes of the various photomul~ipliers after thc delay time b.t ~ 2000s. Thus both scattering signal and monitor signal of each channel can be recorded simultaneously. The measurement of the relative tranSmlttance of thc channels 1, 2 and 3 (channcl4 is not used) ia performed by replacing the sca.ttering volume by the exit slit of a monochromator whose entrance slit i8 illuminated with a tungsten wire. As shown in Fig. 16 the spectral position of each channel is chosen in such a way that the form factor S, determined by-the electron temperature Te, covers the relevant range of wavelengths.
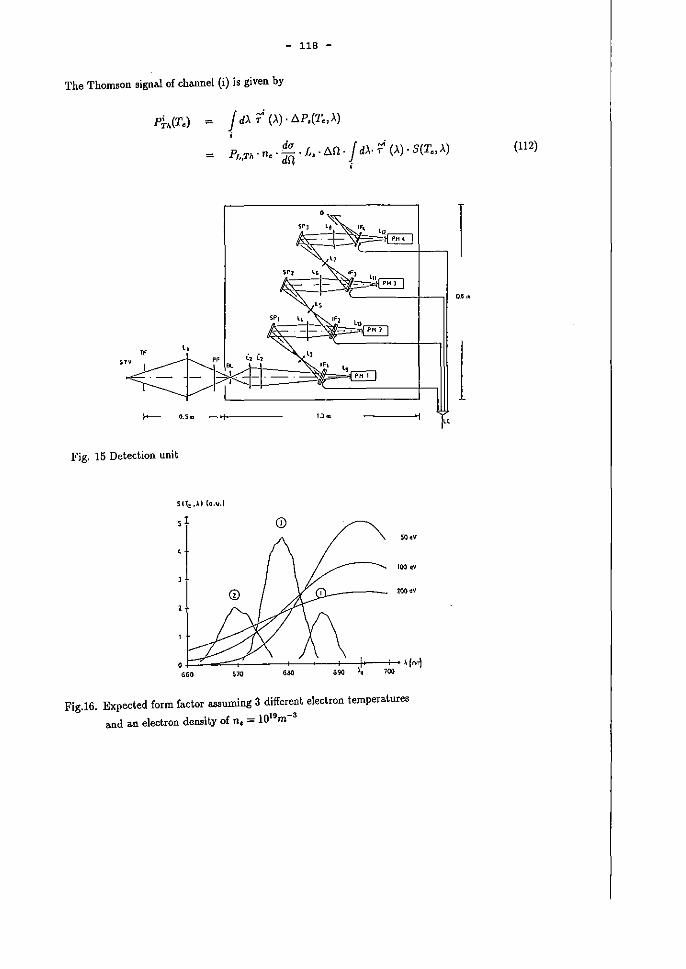
- 118 -
The Thomson signal of channel (i) is given by
P~h(T.) = J d>' 1 (>') . Ll.P,(T" >')
du J'; h,Th . n.· dil . L, . D.!l· d>" T (>.). S(T" >')
i =
"
I--- 0.5/D ->to.---- u ...
Fig. 15 Detection unit
SIr.: .AI {a ..... 1
SO~V
ICO~
lOO~V
o,+"::::::---=".::;"::--~-,-< .. ",,,:-,:,,-,,~o-+,,--,,,....,o 'iool
Fig.16. Expected form factor assuming 3 different electron temperatures
a.nd a.n electron density of ne = 1019m-3
(112)
0_6 ..
I
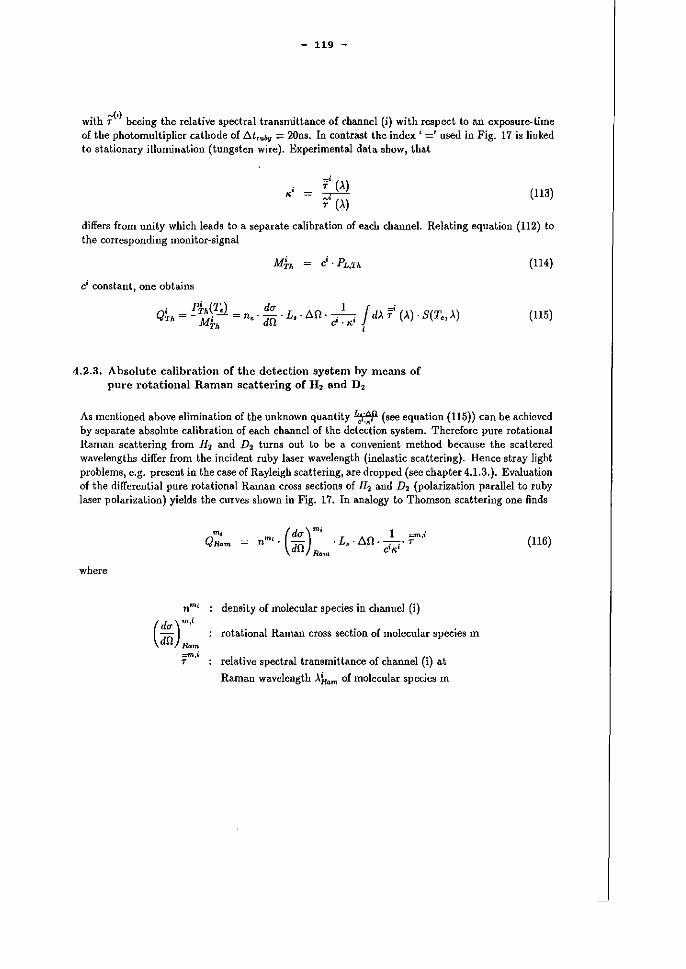
- 119 -
with ;1') beejng the relative spectral transmittance of channel (i) with respect to an exposure-time of the photomultiplier cathode of .6.tru~ ;:: 20ns. In contrast the index' =' used in Fig. 17 is linked to stationary illumination (tungsten wire). Experimental data show, that
; t (>') < = ;" (>') (113)
differs from unity which leads to aseparate calibration of each channel. Relating equation (112) to the corresponding monitor-signal
Ci constant, one obtains
Qh = P~(T,) = n, - ddllu - L, -6.1l- _._1_. J d>' 1'; (>') . S(T" >') h C"K,' i
4.2.3. Absolute calibration of the detection system by means of pure rotational Raman scattering of H 2 and D 2
(114)
(115)
As mentioned above elimination of the unknown quantity ~i·.!P (see equation (115» can be achieved by separate absolute calibration of each channel of the detectioD system. Therefore pure rotational Raman scattering from H2 and D2 turns out to be a convenient method because the scattered wavelengths differ from the incident ruby laser wavelength (inelastic scattering). Hence stray light problems, e.g. present in the case of Rayleigh scattering, are dropped (see chapter 4.1.3.). Evaluation of the differential pure rotational Raman cross sections of H2 and D 2 (polarization parallel to ruby la.'ler polarization) yields the curves shown in Fig. 17. In analogy to Thomson scattering one finds
where
(dU)m,; dO Rom
::rn,i T
m' (dU)m; L All 1 =,; n '. - . ~'U --.-.-T dll Ram cl,..'
density of molecular species in charmel (i)
rotational Raman cross section of molecular species m
relative spectral transmittance of channel (i) at
Raman wavelength Akm of molecular species m
(116)
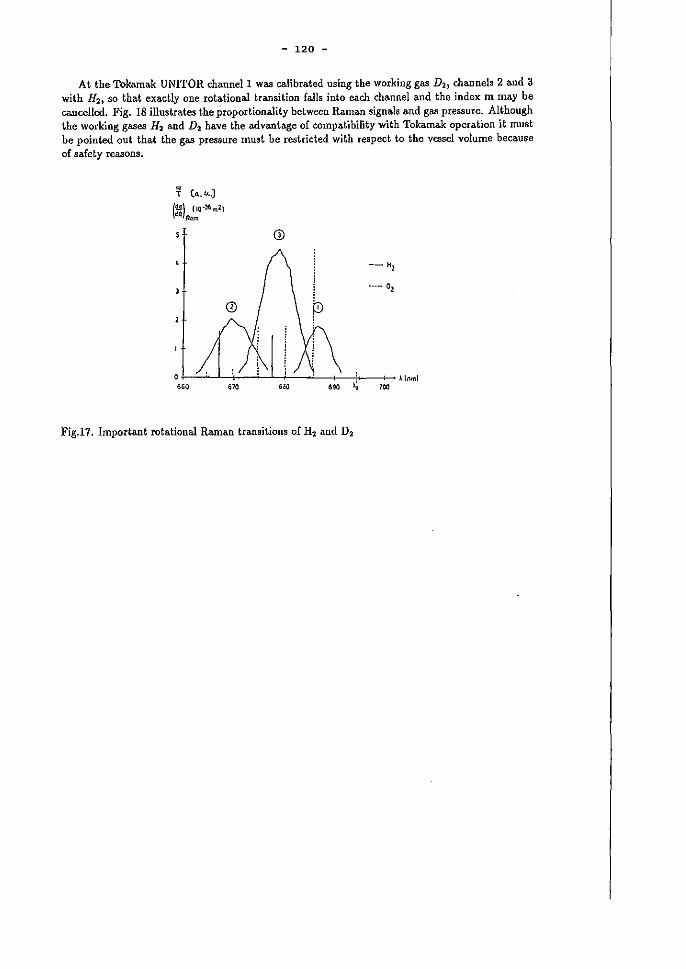
- 120 -
At the Tokamak UNITOR manneil WM calibrated using the working gas D 21 channels 2 and 3 with H21 so that exactly one rota.tional transition falls into each mannel and the index m ma.y be cancelled. Fig. 18 illustrates the proportionality between Raman signals and gas pressure. Although the working gases H 2 and D 2 have the advantage of compatibility with Tokamak operation it must be pointed out that the gas pressure must be restricted with respect to the v€8sel volume beca.use of safety reasons.
~ (CI,A.)
(") (IO-36m21 "Rom
,.,,-'-"---'--,",,---'---"-,-',,--'---'----'->90-'---.. j.' --,->,,- ~lnml
Fig.17. Important rotational Raman transitions of H2 and D2
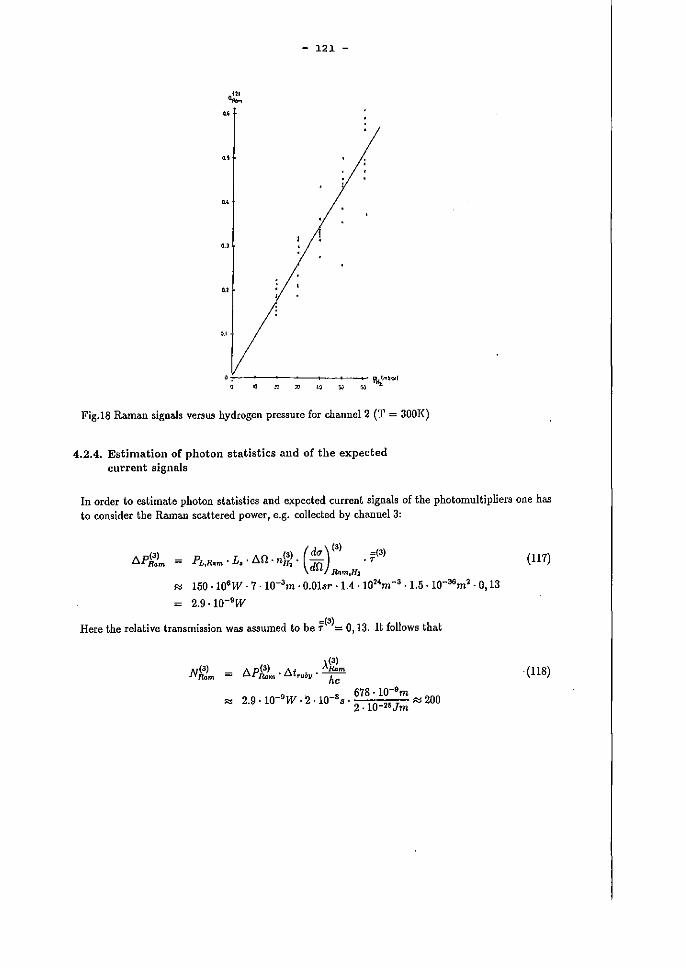
- 121 -
•
Fig.18 Raman signa.ls versus hydrogen pressure for channe12 (T = 300K)
4.2.4. Estimation of photon statistics and of the expected current signals
In order to estimate photon statistics and expected current signals of the photomultipliers one has to consider tbe Raman sca.ttered power, e.g. collected by cbannel 3:
(3) (3) (dU) (3) .(3) 6.PRam PL,flqm ' L, ' Llfl . nH~' dU . T
&m,H~
(117)
l=:;j 150 .1Q6W· 7· 1O-3m · 0.01sr .1.4 ·10'l4m -3 ·1.5 .1Q-36m 'l· 0, 13
2.9 ·lO-'W
Here the rela.tive transmission was assumed to be 7'(3)= 0, 13. It follows that
,(3)
N (3) Ap(3) A /\.&m Ram u R4m' utrubll . ~ (118)
-9 ' -8 678· lQ-9m "" 2.9·10 W· 2 ·10 S· 2 .10-"Jm "" 200
- 122 -
photons reach tbe photomultiplier cathode which leads to the rela.tive error
The corresponding photomultiplier current ja
N~3) . fl(3) . e . V;p(3) flQm "' m ~ O.lmA
fit rIJbll
with the multiplier effideney ,,(3) ~ 12 % and multiplier amplification V~~ ~ 5 . 105.
In case of Thomson scattering one yields comparable values.
4.2.5. Evaluation of scattering signals and results
(119)
(120)
Using equations (115) and (116) one retates the Thomson signal of channel (i) to the corresponding Rarnan signal so that
n,. (~) . ji(T.) n' (!k)' ,
ao R<>m
i T' (.\) j (T,): = / d.\ i . S(T".\)
i T (.\Rom)
(121)
where Ji(Tc} are welI-known functioDs (see Figs. 19 and 20). Determination of the electrontemperature Te follows from
QhlQk.m Q~hIQ!"m
aud the electron density is given by
(122)
(123)
Thus one yields 2 independent values for Tc and 6 independent values for ne, respectively. Fig. 21 shows the measured time- and space-resolved profiles of electron-temperature and -density in the tokamak UNITOR. Each measured value represents an average over 5 discharges of same dischargeparameters, i.e. plasma current, pulse length etc .. The relation error ia estimated to be
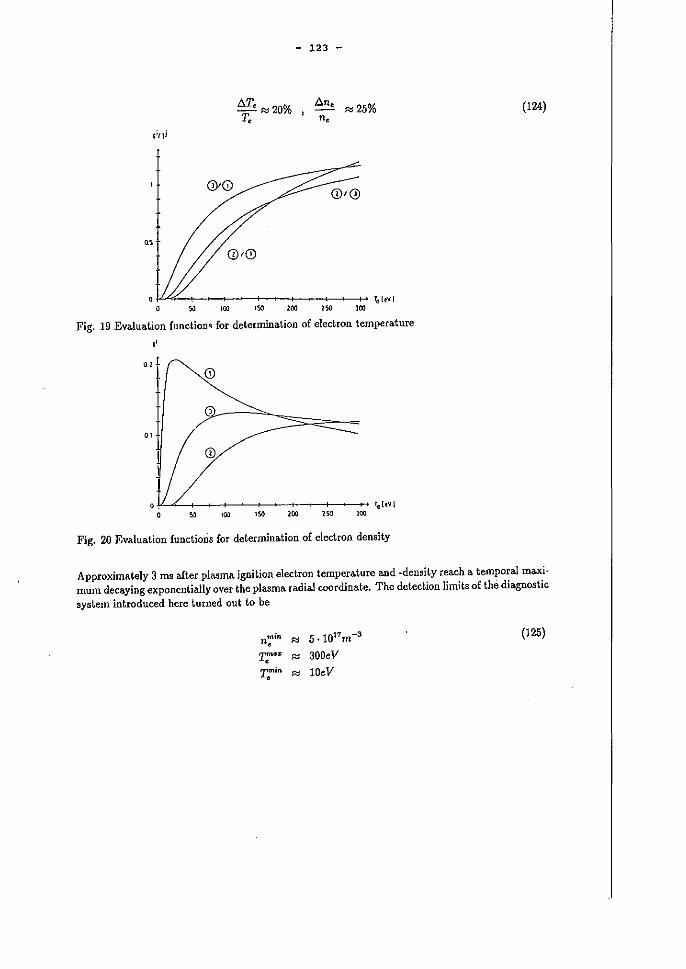
- 123 -
t;.T. "" 20% T.
'00
n.
,so
",,25%
T.:! Ir'" I JOO
Fig. 19 Evaluation function~ for determination of electron temperature
"
"
Fig. 20 Evaluation functions for determination of electron density
(124)
Approximately 3 ms after plasma ignition electron temperature and -density reach a temporal maximum decaying exponentially over the plasma radial coordinate. The detection limlts of the diagnostic
system introduced here turned out to be
nmin • "" 5 .1017m-3 (125)
~ .. • "" 300eV
Tmin
• "" 10eV
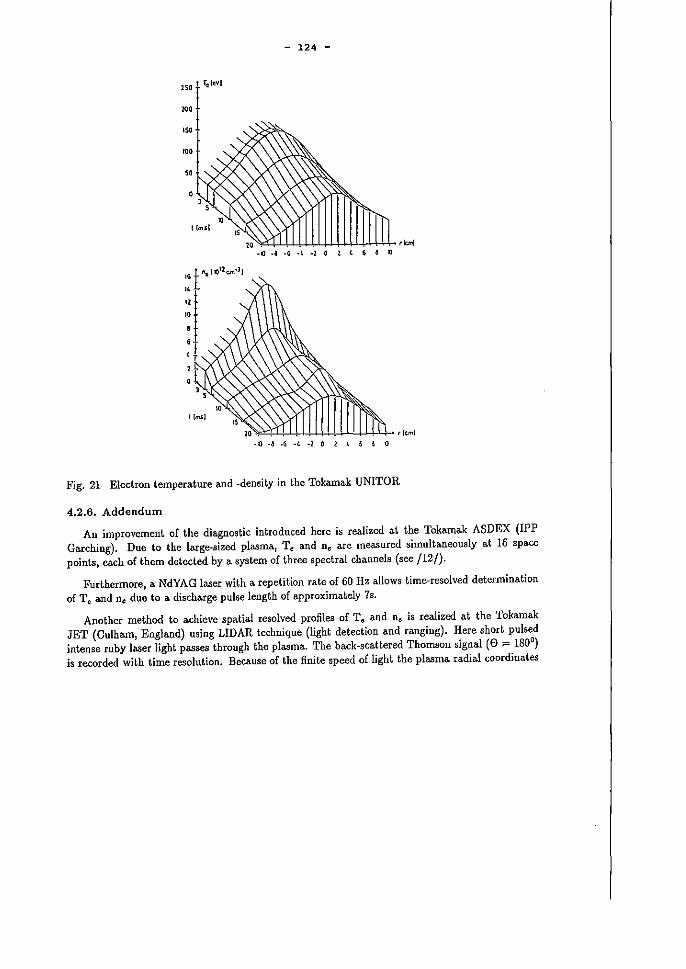
- 124 -
-:0 -a .G _L -1 0 2' a 11
Fig. 21 Electron temperature and -density in the Tokamak UNITOR
4.2.6. Addendum
An improvement of the diagnostic introduced here ia realized at the Tokamak ASDEX (IPP Garehing). Due to the large-aized plasma, Te and ne are measured simultaneously at 16 space points, ea.ch of them detected by a system of three spectral channels (see /12/).
Furthermore, a NdYAG laser with a repetition rate of 60 Hz allows time-resolved determination of Te and ß e due to a discharge pulse length of approximately 7s.
Another method to achieve spatial resolved profiles of Te and ne is realized at the Tokamak JET (Culha.rn, England) using LlDAR technique (light detection and ranging). Here short pulsed intense ruby laser light passes tbrough the plasma. The back-scattered Thomson signal (0 = 180°) is recorded with time resolution. Because of the finite speed of light tbe plasma radial coordinates

- 125 -
are related to a time coordinate of the recorded Thomson-signal.
4.3. Experiments with repetitively pulsed laser systems
With the development of high power Nd YAG lasers with a. repetition rate from 5 Hz up to 100 Hz these systems are used in plasma diagnostics for Thomson scattering, too. There are very different modifications of those experiments, like the use of the spiking mode with extremly fast groups of pulses or of the direct laser light at 1.06 pm with a Si avalanche diode as a detection unit. For the experiment /13/ described here, the frequency doubled laser light (Ae = 532.0nm) is used as the source of the scattered light. In this frequency range the conventional detection techniques with photomultipliers can be used with the advantage of the.significantly higher quantum efficiency compared to the ruby laser syst~ms. The plasma. under investigation is a stationary hollow cathode are in the low pressure regime. The discharge burning in different working gases like Ar, He, H2 and N2 js stabilized by a longitudinal magnetical field.
For a set of typical discharge parameters (1.3Pa, O.074T, 60A) the electron densities have values from 1018 to 1020 m-3 at an electron temperature betwccn 0.5 to 7eV. Fig. 22 shows the expeümental set-up:
CAI-IAC-SYS!I!r;l
ce.",."
"'. ~12 .... J F'
~! ~'~' /:~ '-"f""77l "'''I'·L···,····· ..... ~,._"-_S."'-'..J .". '-"::' .,; i I 11 :. ttJIoIP', ~~ , . I-IM'P 1
rt .. :;~-, i I Fig. 22 Experimental set-up of a scattering experiment with a
Nd YAG laser
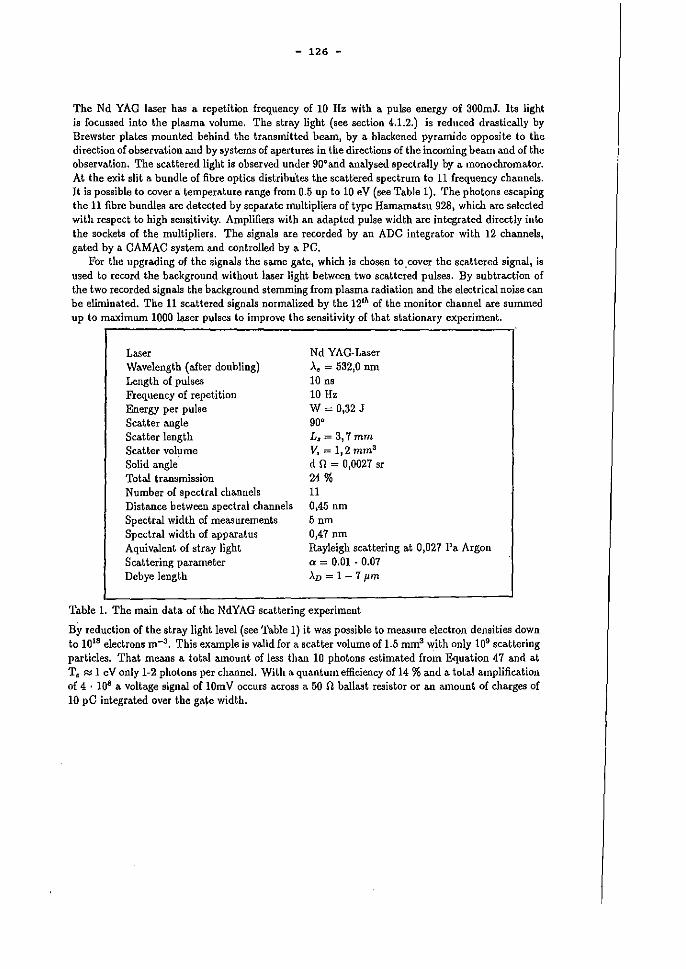
- 126 -
Tbe Nd YAG laser bas arepetition frequency of 10 Hz with a pulse energy of 300mJ. Hs light is focussed into the plasma volume. The stray light (see section 4.1.2.) is reduced drastically by Brewster plates mounted behind the transmitted beam, by a blackened pyramide opposite to the direction of observation and by systems of apertures in the directions of the incoming beam and of thc observation. The scattered ligbt is observed under 900 and analysed spectrally by a monochromator. At tbe exit sm a bundle of fibre optics distribu'tes the scattered spectrum to 11 frequency channels. 1t i8 p08sible to cover a' temperature range from 0.5 up to 10 eV (see Table 1). The photons escaping the 11 fibre bundles are detected by separate multipliers of type Hamamatsu 928, which are selected with respect to high sensitivity. Amplifiers witb an adapted pulse width are integrated directly inta the sockets of tbe multipliers. The signals are recorded by an ADe integrator with 12 channels, gated by a CAMAC system and controlled by a PC.
For tbe upgrading of the signals the scune gate, which js chosen to .cover the scattered signal, Is used to record the background without laser light betwcen two scattered pulses. By subtraction of the two recorded signals the background stemming from plasma. radiation and tbe electrical noise can be eliminated. The 11 scattered signals normalized by the 12'h of the monitor channel are summed up to maximum 1000 laser pulses to irnprove tbe sensitivity of that statlonary experiment.
Laser W.velength (after doubling) Lengtb of pulses Frequency of repetition Energy per pulse Scatter angle Scatter length Scatter vol~me Solid angle Total transmission Number of spectral channels Distance betwcen spectral channels Spectral width of measurements Spectral width of apparatus Aquivalent of stray light Sca.ttering parameter Debye length
Nd VAG-Laser >..~ = 532,0 nm 10 ns 10 Hz W = 0,32 J 90' L8 = 3,7 mm
V. = 1,2 mm3
d n = 0,0027 sr 24% 11 0,45 nm 5nm 0,47 nm Rayleigh scattering 80t 0,027 Pa Argon a = 0.01 . 0.07 ),D = 1-7 pm
Table 1. The main data of the NdYAG scattering experiment
By reduction of tbe stray light level (see Table 1) it was possible to measure electron densities down to 1018 electrons m-3 • This example is valid for a seatter volume of 1.5 mm3 with only 109 scattering particles. That means a total amount of less than 10 photons estimated from Equation 47 and at Te ~ 1 eV only 1-2 photons per channel. With a quantum efficiency of 14 % and a total amplification of 4 . 108 a voltage signal of 10m V occurs across a 50 n ballast resistor or an amount of charges of 10 pC integrated over the ga~e widtb.
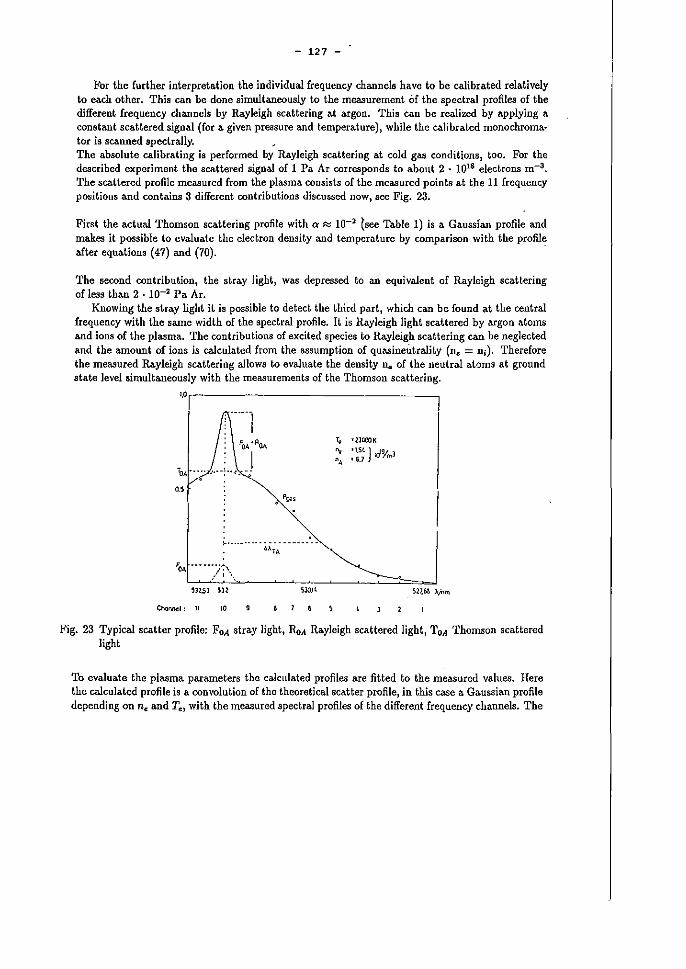
- 127 -
For the further interpreta.tion the individual frequency channele have to be calibrated relatively to each other. This can be done simultaneously to the mea.surement of the spectral profiles of tbe different frequency channels by Rayleigh scattering at argon. This can be realized by applying a coDstant scattered signal (for a given pres8ure and temperature), wbile tbe calibrated monochroma· tor ia sca.nned spectrally. The absolute calibrating is performed by Rayleigh sca.ttering at cold gaa conditi.ons, too. For tbe described experiment tbe scattered signal of 1 Pa Ar corresponds to about 2 • 1018 electrons m-3 •
The scattered profile measured from tbe plasma consista of the measured points at the 11 frequency positions and contains 3 different contributioos discussed now, see Fig. 23.
First tbe actual Thomson scattering profile with a R: 10-2 tsee Table 1) is a Gaussian profile and makes it possible to evaluate the electron density and temperature by comparison with the profile after equ.tion, (47) and (70). .
The second contribution, the stray light) was depressed to an equiva.1ent of Rayleigh scattering of less tha.n 2 . 10-2 Pa Ar.
Knowing the stray light it ia possible to detect the third part, which can be fouod at the centra.l frequency with the same width of the spectral profile. It i8 Rayleigh light sca.ttered by argon atoms and ions of the plasma. The contributions of excited species to Rayleigh scattering can be neglected and the amount of ions js calculated from the assumption of quasineutrality (ne = Di)' Therefore the measured Rayleigb scattering aJlows to evaluate the density n .. of the neutral atoms at ground state level simultaneously with tbe measurements of the Thomson scattering.
'·'1
T~ TllOOOK
~ : ~~ } Ido/rn3
• p~s
1-.- -_._-_ •• - - - _._ ••• --~;l.iA
FOA ••••• :)i'\_ 532..Sl ~n
~I: 11 10
Fig. 23 Typical sca.tter profile: FOA stray light, RoA Rayleigh scattered light, T OA ThomsoD scattered light
To evaluate the plasma parameters the calculated profiles are fitted to tbe measured values. Rere the ca.lculated profile i8 a convolution of tbe tbeoretical scatter profile, in th1s case a Gaussian profile depending on ne and Te, with tbe measured spectral profiles of the different frequency channels. The
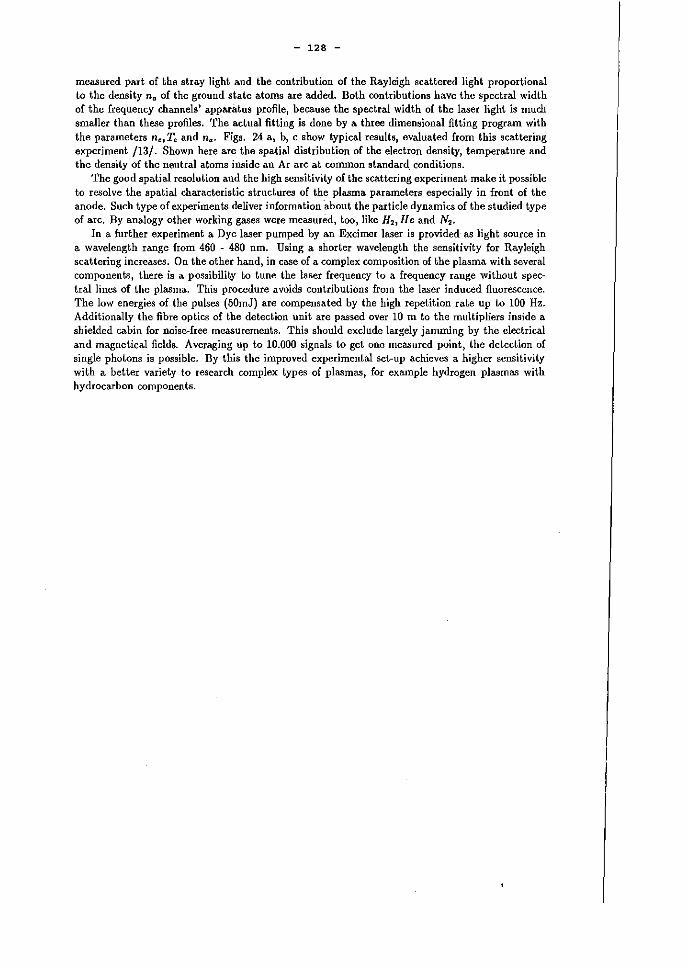
- 128 -
measured part of the stray light and tbe contribution of the Rayleigb scattered light proportional to the density »0 of the ground state atoms Me added. Botb contributions have the spectral width of the frequency channels' apparatus profile, because the spectral width of the laser light is much smaJler than these profiles. The actual fitting is done by a three dimensional fitting program with tbe parameters ne,Te and no • Figs. 24 a, b, c show typical results, evaluated from this scattering experiment /13/. Shown here Me tbe spatial distribution of the e1ectron density, temperature and tbe density of the neutral atoms inside an Ar are at common standard. conditions.
The good spatial resolution and the high sensitivity of tbe scattering experiment make it possible to resolve the spatiaJ eharacteristic slructures of the plasma parameters especially in front of the anode. Such type of experiments deliver information about tbe particle dynamics of the studied type of are. By analogy other working gases were measured, too,like H2 ,He and N 2 •
In a further experiment a Dye laser pumped by an Excimer laser is provided as light source in a wavelength range Irom 460 - 480 um. Using a shorter wavelength the sensitivity for Rayleigh scattering increases. On the other hand, in case of a complex composition of the plasma with several components, there is a possibility to tune the laser frequency to a frequency range without spectrallines of the plasma. This procedure avoids contributions from the laser induced ftuorescence. The low energies of the pulses (50mJ) are compensated by the high repetition rate up to 100 Hz. AdditionalLy the fibre optics of tbe delection unit are passed over 10 m to the multipliers inside a shielded cabin for noise-Iree measurements. This should exclude largely jamming by the electrical and magnetical fields. Averaging up to 10.000 signals to get one measured point, the detection of single photons is possible. By this the improved experimental set-up achieves a higher sensitivity with a better variety to research complex types of plasmas, for example hydrogen plasmas with hydrocarbon components.
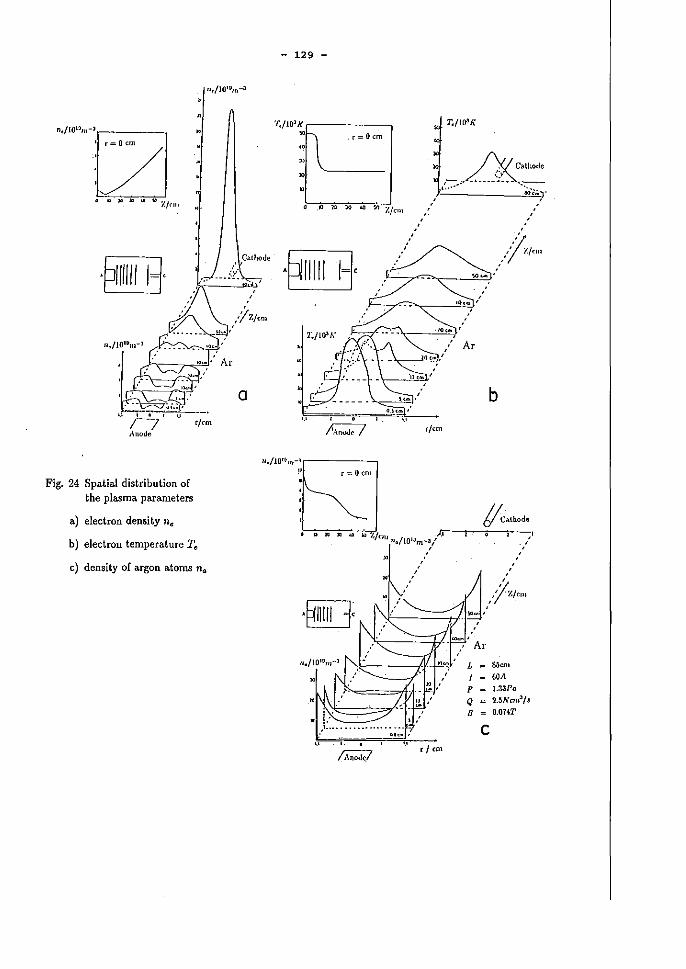
Fig. 24 Spatial distribution of the plasma. parameters
a) electron density ne
b) electron temperature Te
c) density of argon atoms na
COlt/lOde
- 129 -
•
,;--'--.t= l-\noJe 7
"
, ,
~"
,
·/0 .... I
Ar 10,m I
.1], .. '
2J..'''' , -~ .. ---
f!em
,:0/""
b
1I./JO'~m-l'r-----
" r=Ocnl
Ycalhode 1<1 '1./<:111 I ,/"'-" ~.-;:..-~-
". IOJ9m~3./ ,I .' .,' . '
, ,
:!: " ' -'
, ,
; ~. =:::,::0.=/,'
"~L"""""~:': '.- rlem
, , ,'!Z!CUl
"- ,
L "ro, J 60A
P 1.3JPo
Q 2.5NcnN~
B O.OHT
C
- 130 -
4.4. Far-infrared-scattering experiment at thermal density fluctuations
4.4.1. General considerations
Collective Thomsoq scattering at thermal density fluctuations offers the possibility to mea.sme time- and space -resolved profiles of the ion "temperature of a Tokamak plasma. In this case the scatter parameter Cl satisfies the condition
1.s: a S;; 10 (126)
In case of larger values of a non-thermal density ßuctuations should be observed not fmther considered here (see Chapter 4.5.). Using the UNITOR-plasma parameters
Te ~ 200eV (127) ne ~ 5. l019m -3
the Debye-Hückel-Iength becomes
(128)
Hence in a 90o-scattering experiment the wave1ength of the scattering laser is given byequations (33) and (107)
).e = Cl' 41r).n· sin (~) = Cl ·133pm (129)
With respect to inequality (126) one needs a laser transition in the far infrared wavelength range. Furtherffiore restrietions of the laser frequency follow from the heterodyne detection system and from electron cyclotron radiation emitted by the plasma. At UNITOR an optically pumped DzOlaser is used as a strong source of far infrared radition. Ws Raman-transition at ).e = 385pm is optically pumped by a CO2-TEA-Iaser.system at ).COl = 9, 26pm(9R22) consisting of a monomode TEA-oscillator and five amplifiers. Pulse energy and pulse duration decisively inßuence the signal to noise ratio (see chapt. 4.4.3).
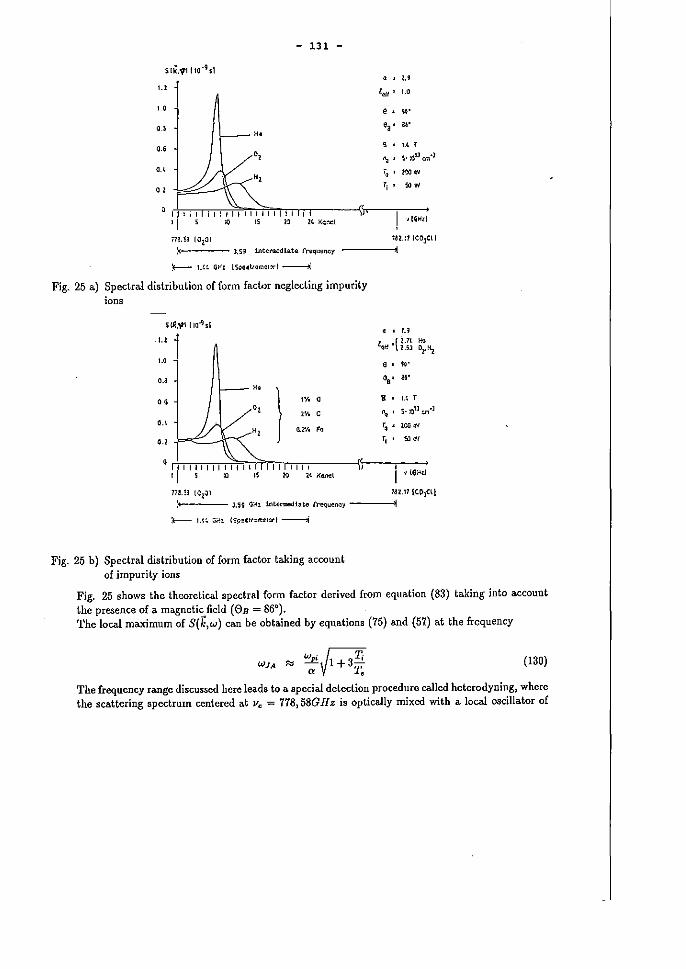
- 131 -
LI i "
• , .. Z~1f ' 0.0
, ~.
0' " ' ... , 1.4 T , ' S. ;Oll ",,"}
0.' 0,
0.< '. '''''' T, ,,~
S· I ,(of;';l! I " I 11 i i 1IIIII t 1III 11 113 ;0 15 iO lLK<:;....:1
182.:1 ICJJCl I m.:3 10,01 :: ;1 J,Si Intermediate l'requerwy ------<
Fig. 25 a) Spectral distribution of form facttJ[ neglecting irnpurity ions
SUi,VlIIQ-'lii
,., i 0.0
0.' ,.
} 00 ,% 0
" 1'10 C 0.<
", 1l2'1. F,
0.'
1 1
1111111111 [I L 1IIIII1111 I 'j :0 15 20 "'1<=1
• , .. ZQH .[ t~~ '" Dr~ , .. ',' U'
B I.~ T
,- ;_:011 ",,']
T, ZCG~
T, "'"
77.~.:J ICZJl
.' 782.17 {CPjC1l
l.Si ~:.O!! int.e=ediate t'reQ,uenay ---~!I
Fig. 25 b) Spectral distribution offarm factor taking account of impurity iODS
Fig. 25 shows the theoretical spectral form factar derived from equation (83) taking into account
the presence of a. magnetic field (eB = 86°). The loeal maximum of S(k,w) can be obtained by equations (75) and (57) at the frequency
Wp,~ WJA '" --;;y 1+ 37'; (130)
The frequency range discussed here leads to a special detection procedure called heterodyning] where the scattering spectrum centered at v" = 7781 58GHz is optica11y mixed with a local oscillator of
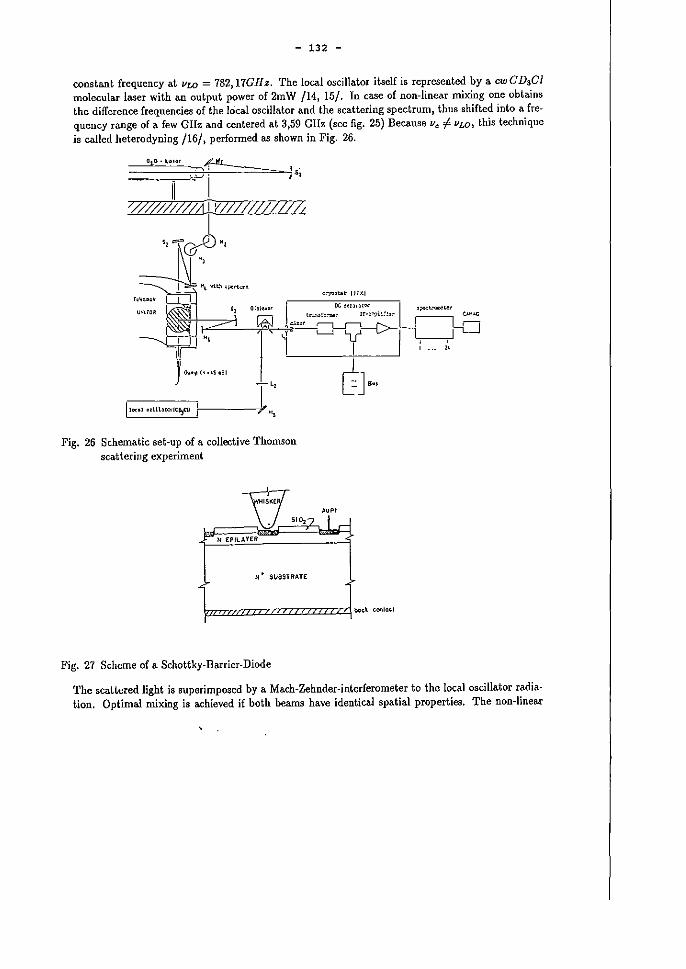
- 132 -
constant frequency at Vw = 782, 17GH z. Tbe IDeal oscillator itself 1a represented by a cw eD3GI molecular laser with an output power of 2mW /14, 15/. In case of non-linear mixing one obtains the difference frequencies of tbe IDeal oscillator and the scattering spectrum, tbus shifted into a frequeney range of a few GHz and centered at 3,59 GHz (see fig. 25) Because Ve !- VLQ, this technique ja called heterodyning /16/, performed as shown in Fig. 26.
Fig. 26 Schematic set-up of a collective Thomson scattering experiment
N EPILAYER
N· suaSTRATE .
Fig. 27 Scheme of a Schottky-Barrler-Diode
The scattered light is superimposed by a Ma.ch-Zehnder-interferometer to tbe IDeal oscillator radiation. Optimal mixing j8 achieved if both beams have identical spatial properties. Tbe non-linear
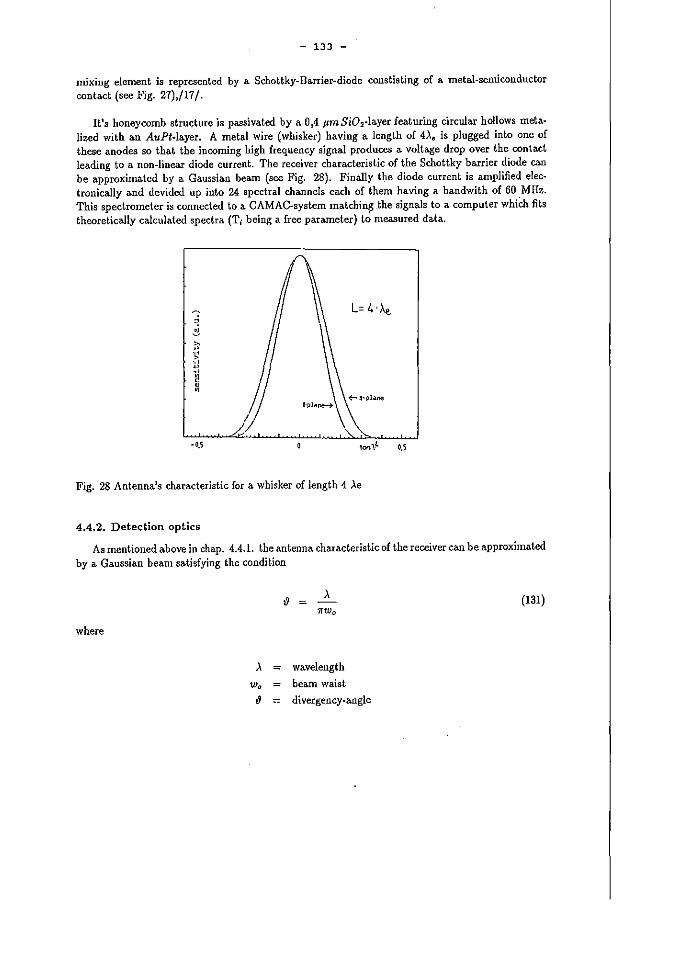
- 133 -
mixing element is represented by a. Schottky-Barrier-diode constisting of a metal-semiconductor contact (see Fig. 27),/17 f.
Ws honeycomb structure js passivated by a 0,4 J.lmSi02-1ayer featuring circular hollows metalized with an AuPt-Iayer. A metal wire (whisker) having a. length of 4).e is plugged into one of these anodes so that the incoming high frequency signal produces a voltage drop over the contact leading to a non-linear diode current. The receiver characteristic of the Schottky barrier diode ca.n be approximated by a Gaussian beam (see Fig. 28). Finally the diode current i8 amplified electronically and devided up into 24 spectral channels ea.ch of them having a bandwith of 60 MHz. This spectrometer is connected to a CAMAC-system matchin~ _the signals to a computer whiCh fits theoretically calculated spectra (Ti being a free parameter) to measured data.
L=4·x.. ~ ~ ~ ~ ~ > ~ ~ ~
~ • •
I
-o.s
Fig. 28 Antenna's characteristic for a whisker of length 4 ).e
4.4.2. Detection optics
As mentioned above in chap. 4.4.1. the antenna characteristlc of the receiver ca.n be approximated by a. Gaussian beam satisfying the condition
~ A (131 )
~w,
where
.; wavelength
w, beam waist
d divergency-angle
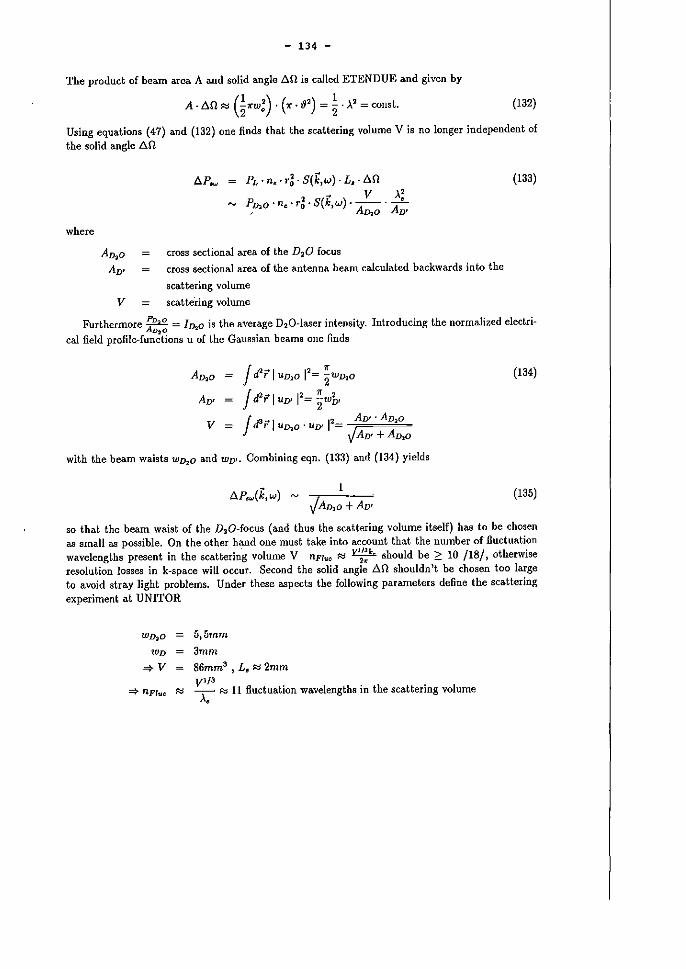
- 134 -
The produd of bearn area A a.nd solid angle .6.0 1e caJled ETENDUE and given by
A·.c:.n '" G~W:)' (~.~,) = ~ .,,' = const. (132)
Using equations (47) and (132) one finds that the sca.ttering volume V i8 00 longer independent of
the solid angle 6.0
where
PL ·ne .r~. S(k,w) ·L6 • An , (_) V ,,~ P/hO -ne ,ro ·8 k,w . --.
, A/ho An'
AD~O cross sectional area of the DzO foeus
AD' cross sectional area of the antenna beam calculated backwards ioto the
scattedng volume
V scattering volume
(133)
Furthermore APD20 = Ilh.o i8 the average D20-1aser inteosity. Introducing the normalized electri
D,O ca! field profile-functions U of the Gaussian beams one finde
Av,o
v
J efr I UD10 12= ~Wl>30
J cf? I UD' 12= iWb l
AD" AD20
,fAD' +Av,o
with the beam waists Wlh.O and WD" Combining eqn. (133) and (134) yields
1
,fAv,o + Av'
(134)
(135)
so that the beam waist of the DzO-focus (and thus the scattering volume itself) hM to be chosen as small as possible. On the other hand one must take into account that the numher of ßuctuation wavelengths present in the scatterin'g volume V nFlue F:j Vi;; .... should be 2: 10 /18/, otherwise resolution losses in k-space will occur. Second the solid angle .6.11 shouldn't be chosen too large to avoid stray light problems. Under these aspects the following parameters define the scattering
experiment at UNITOR
WD~O 5,5mm
WD 3mm ::::} V 86mm3
, L8 F:j 2mm V 1/ 3
::::} RFlue F:j T Rl 11 ßuctuation wavelengths in the scattering volume •
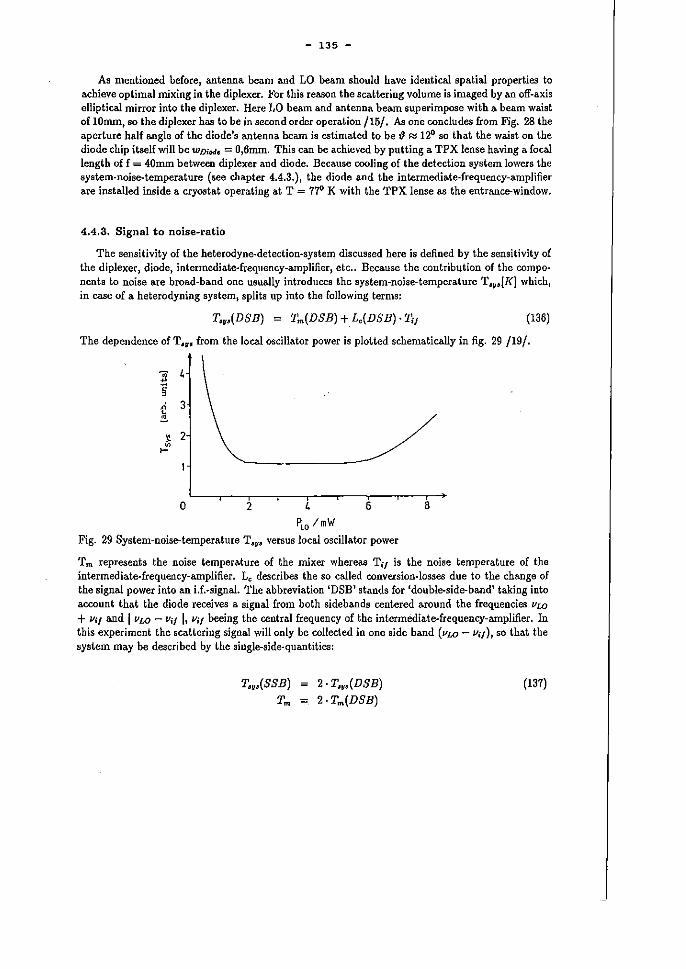
- 135 -
As menlioned beforeJ antenna bea.m and LO beam should bave identica.l spatial properties to achieve optimal mixing in the diplexer. For this reason the sca.ttering volume is imaged by an off-axis elliptica.l mirror into tbe diplexer. Here LO beam and antenna bea.m superimpose with a beam waist of IOmmJ so the diplexer ha.s to be in second order operation /15/. As one concludes from Fig. 28 the aperture haU a.ngle of the diode's antenoa bea.m is eslimated to be {} ~ 12° so that tbe wa.ist on the diode chip itselfwill be WDiode = O,6mm. This ca.n be achieved by putting a. TPX lense having a foeal lengtb of f = 40mm between diplexer and diode. Because ooo]ing of the detection system lowers tbe system·noise-temperature (see chapter 4.4.3.), tbe diode and the intermediate-frequency-amplifier are instalIed inside a cryostat operating at T = 71> K witb tbe TPX lense a.s the entrance-window.
4.4.3. Signal to Doise-ratio
Tbe sensitivity of tbe heterodyne-detection-system discussed here IS defined by the sensitivity of the diplexer, diode, intermediate-frequency-amplifier, etc .. Because the contribution of the components to noise are broad-band one usually introduces the system-noise-temperature T'II'[[(] wbicb, in case of a heterodyning system, splits up ioto the following terms:
T.,.(DSB) = Tm(DSB) + L,(DSB)· T;j (136)
The dependence of T'II~ from the loeal oscillator power is plot ted schematically in fig. 29 /19/.
!i 2 ,..
o 2 4 6 8
PLO ImIN
Fig. 29 System-noise-temperature T.s1l6 versus Ioeal oscillator power
Tm represents the noise temperature of the mixer wbereas Ti! is the noise temperature of the intermediate-frequency-amplifier. Lc describes the so ca.lled conversion-Iosses due to the change of the signal power ioto an i.f.-aignal. The a.bbreviation 'DSB' stands for 'double-side-band' taking into a.ccount that the diode receives a signal from both sidebands centered Mound the frequencies vLO
+ Vi! and 1 VLO - ViI I, Vi! beeing the central frequency of the intermediate-frequency-a.mplifier. In tbis experiment the scattering signal will only be collected in one side band (VLO - Vif), so that tbe system may be described by the single-side-quantities:
T ... (SSB)
Tm
2· T.,.(DSB) 2 . Tm(DSB)
(137)
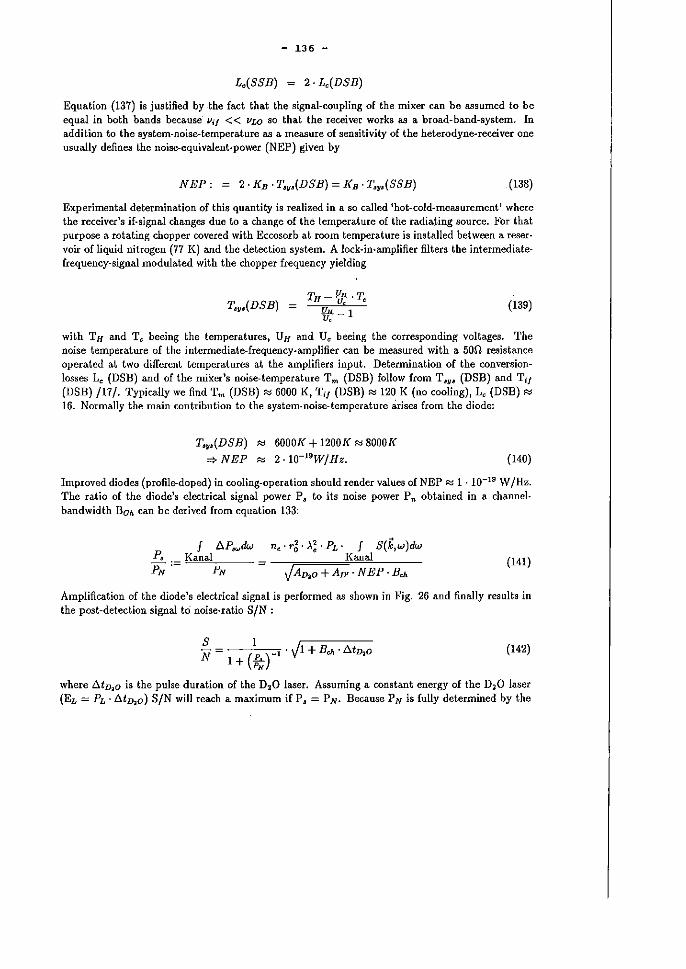
- 136 -
L,(SSB) = 2· L,(DSB)
Equation (137) ia justified by -the fact that tbe signal-coupling of the mixer can be assumed to be equal in both bands because vif « "LO so that the receiver works a.s a broad-hand-system. In addition to the aystem-noise-temperature a.s a rneasure of sensitivity of the heterodyne-receiver one usually defines the noise-equivalent-power (NEP) given by
NEP: = 2· KB · T".(DSB) = KB • T.,.(SSB) (138)
Experimental determination of thi8 quantity ia realized in a so called 'hot-cold-measurement' where the receiver's ir-signal changes due to a change of the temperature of the radiating source. For that purpose a rotating chopper covered with Eccosorb at room temperature ja installed hetween areser· voir of liquid nitrogen (77 K) and the detection system. A lock-in-amplifier filters tbe intermediatefrequency-signal modulated witb tbe chopper frequeney yielding
TH- f!x·T T~!J~(DSB) = u U
c e 11::- 1
(139)
with TH and Te beeing the temperatures, UH and Ue beeing the eorresponding voltages. The noise temperature of the intermediate-frequency-amplifier ean be measured witb a 500 resistance operated at two different temperatures at the amplifiers input. Determination of tbe conversionlosses Le (DSB) and of the mixer's noise-temperature Tm (DSB) follow from T~y~ (DSB) and Ti! (DSB) /17/. TypicaJly we find Tm (DSB) '" 6000 K, T;J (DSB) '" 120 K (no cooling), L, (DSB) '" 16. Normally the main contribution to tbe system-noise-temperature arises from the diode:
T".(DSB) '" 6000[( + 1200[( '" 8000[(
'* NEP '" 2 .1Q-19W/Hz. (140)
Improved diodes (profile-doped) in eooling-operation should render values of NEP ~ 1 . 10-19 W 1Hz. The ratio of the diode's electrical signal power P 3 to its noise power Pn obtained in a channel· bandwidtb BOh can be dedved from equation 133:
ne · ra' >.~. PL • I S(k,w)dw Kanal
JAv,o +AD' ·NEP ·B", (141)
Amplification of the diode's eledrlcal signal is performed as shown in Fig. 26 and finaHy results in the post-detection signal tri noise-ratio S/N :
S 1 "~~~-- = -1 • ";1 + B", . ßtv,o (142) N 1+(*;)
where ßtIho is the pulse duration of tbe D2 0 laser. AS8urrring a constant energy of the DzO laser (EL = PL · tlt IhO) S/N will reacb a maximum if P~ = PN- Because P N i8 fuHy determined by the
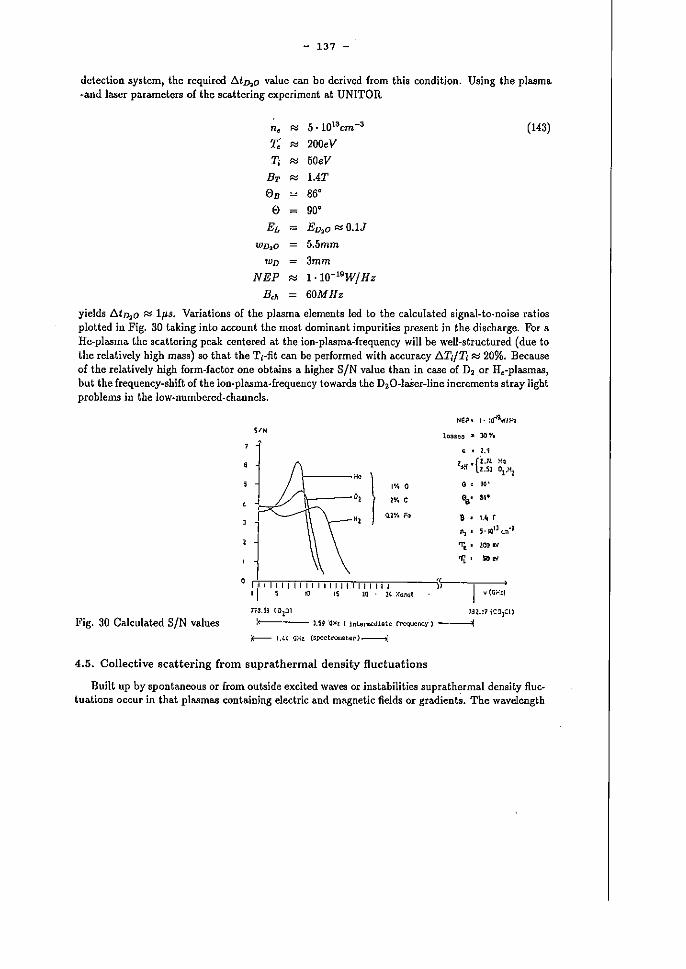
- 137 -
detection system, the required l!:..t~o value can be derived from this condition. Using tbe plasma. -and laser parameters of tbe scattering experiment at UNITOR
n, '" 5 ·1O"cm-3 (143)
T. '" 200eV
'" 50eV
EL ED20 ~ O.IJ
WD20 5.5mm WD 3mm
NEP '" 1·1O-19W/Hz B", 60MHz
yields fit~o ~ Ips. Variations of the plasma elements led to the calculated signal-to-noise ratios plotted iu Fig. 30 taking iuto account the most dominant impurities present in the discharge. For 80
He-plasma the scattering peak centered at the ion-plasma-frequency will be well-structured (due to the relatively high mass) so that the Ti-fit can bc perforrncd with accuracy fiT;jTj ~ 20%. Because of the relatively high form-factor ouc obtalns a higher S/N va.1ue thao in case of D2 or He-plasmas, but the frequency-shift of the ion·plasma-frequeney towards thc DzO-laSer-line increments stray light problems in tbe low-numbcred-channels.
Fig. 30 Calculated S/N values
''"
1'10 0
1'1. C
0.11'. N
"
NE" • , • • a-;9,NI!o't
los.ses' '" JOY.
• U
~ .(i.1L i'!~
.. 2.53 °1-'1: , . W' ... ... , 1.~ r
~. 5'10,1 (,,':'1'1
'1', • 2CO rI
",. SOw
" v ((j;';:1 1 I ~ 10 IS 2Q . !4 xc:,,,,,
1dl.:7IC:Jj~1)
1.H 'li!: [ interme<llate frequency) ------I
4.5. Collective scattering from suprathermal density fluctuations
BuHt up by spontaneous or from outside excited waves or instabilities suprathermal density fluetuationa oeeur in tb80t plasmas containing electric and magnetic fields or gradient~. The wavelength
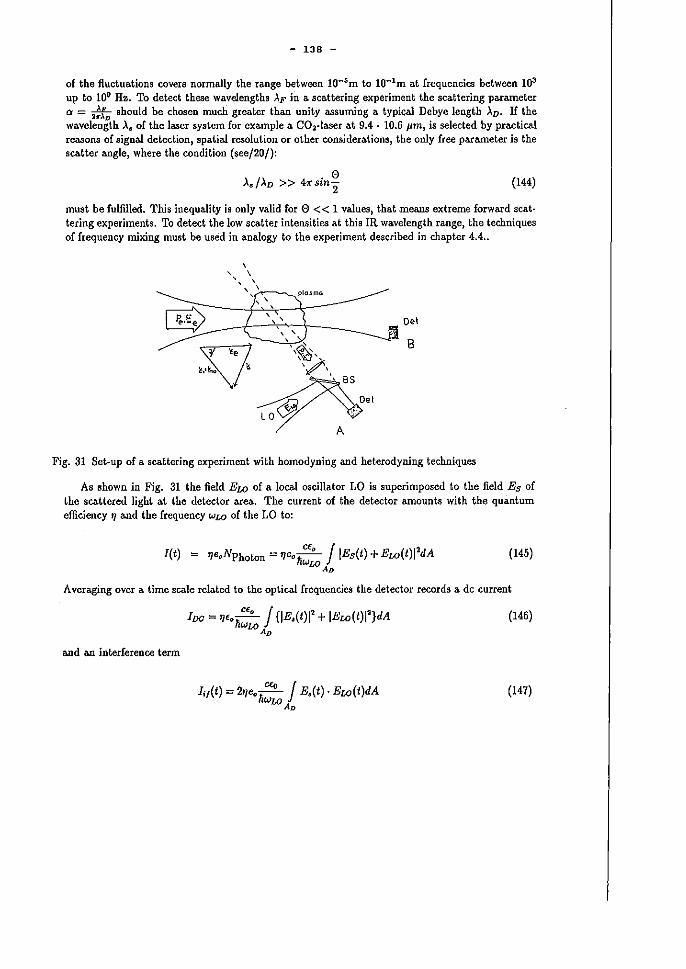
- 138 -
of tbe fluctuations covers normally tbe range between 1O-5m to lO-lm at frequencies between loa up to lOg Hz. Ta detect these wavelengths '\F in a. scattering experiment tbe scattering pa.rameter er = ~ should be chosen mucli greater tha.n unity assuming a typicaJ Debye length AD' If the wavelength Ae of the laser system for example a. CO:l·!aser at 9.4 - 10.6 pm, is selected by practical reasons of signal detection, spatial resolution cr other considerations, tbe ooly ffee parameter ja the scatter angle, where tbe condition (seej20/):
(144)
mllst be fulfilled. This inequality js ooly valid far e « 1 values, that means extreme forward seattering experiments. Ta detect tbe low seatter intensities at this IR wavelength range, the techniques of frequency mixing mllst be used in analogy to the experiment described in chapter 4.4 ..
, , \
" ' , <'~-'---Plasrna ~, \ ~
fi Oe'
B
Fig. 31 Set.up of a scattering experiment with homodyning and heterodyning techniques
As shown in Fig. 31 the field Ew of a local oseillator LO is superimposed to the field Es of the scattered light at the deteetor a.rea. The eurrent of the detector amounts with the quantum efficieney f] a.nd the frequeney Ww of the LO to:
let) = ~e,Nphoton = ~e'h::" / IEs(t) + Ew(t)l'dA AD
(145)
Averaging over a time scale related to the optica.l frequeneies the detector records a de eurrent
100 = ~,.;:. / (lE,(t)l' + IEw(t)I'}dA WAD
(146)
and an interference term
hJCt) = 2~e.:: / E,(t). Ew(t)dA WAD
(147)
- 139 -
In case of heterodyning expedments (we =I ww) a8 described in chapter 4.4. the scattered spectrum de1ivered by equation (147) is centered around WLO - We • For homodyning experiments, (we = ww), the local oscillator'is part of the incoming laser light and the scattered profile mixed down can be measured directly. The beam guidance is reaJized by separate paths of the light (Fig. 31: case A and Fig. 26). If the seatter a~gel decreases further on, the- detector touches the edge of the intensity distribution of the transmitted laser light because of the divergence of the laser beam. In this case of extreme forward seatteriog (0< 1°) the transmitting beam can be used directly as the ioeal oseillator, too, and is mixed witb the scattered light on the detector by thi8 way (Fig. 31: case B).
Squaring and further averaging over time of equation (147) shows
4? = 2 (~:a)2 ßP~' Pw (148)
Thus the signal at the detector cao be increased by rais1ng the LO-power. However, th1s is limited by the noise of the LO itself. If in equation (146) the contribution of the LO dominates, the intensity of the shot noise, assumed the width of the channel to be Bdo , see /21/, can be written
Therefore the signal to noise ratio derived from equation (148) and (149) reads
I>P, SNR = ~. > 1
nwWBch
This delivers the minimum detectable power of the scattered light (SNR = 1)
I:::J.PSmin
(149)
(150)
(151)
Because the coodition of effective mixing js k, = kw , the method of detection described here js hardly sensitive to stray light and background radiation. The reason is that the detector measures only radiation coming from the direction of the LO. A second advantage is the mixing down of the scattered spectrum from the IR to the video regime, where it js pos~lible to analyse the frequency very precisely.
The object under investigation of tbe following experiment /22/ is the stationary magnetized alC of hollow cathQde type, described in cbapter 4.3 .. The experimental set·up is shown in ~ig.32. As light source a self-made CO 2-laser 1s used with a grating resonator. Tbe c.w., mono mode and actively frequency stabilized laser is working 80t tbe 10P20 line of 10.6 JJm with 4 to 8 Watt. With the optical system LI, L2 the beam Walst is imaged by an f to f transformation 1nto the plasma of Imm cross section. This waist inside tbe plasma is imaged again f to f into the plane.of an Hg-Cd-Te detector, which is cooled by liquid air to provide high quantum efficiency (70%) and high amplification (105). The beam splitters BS1, BS2 limit the power of tbat laser beam reaching the
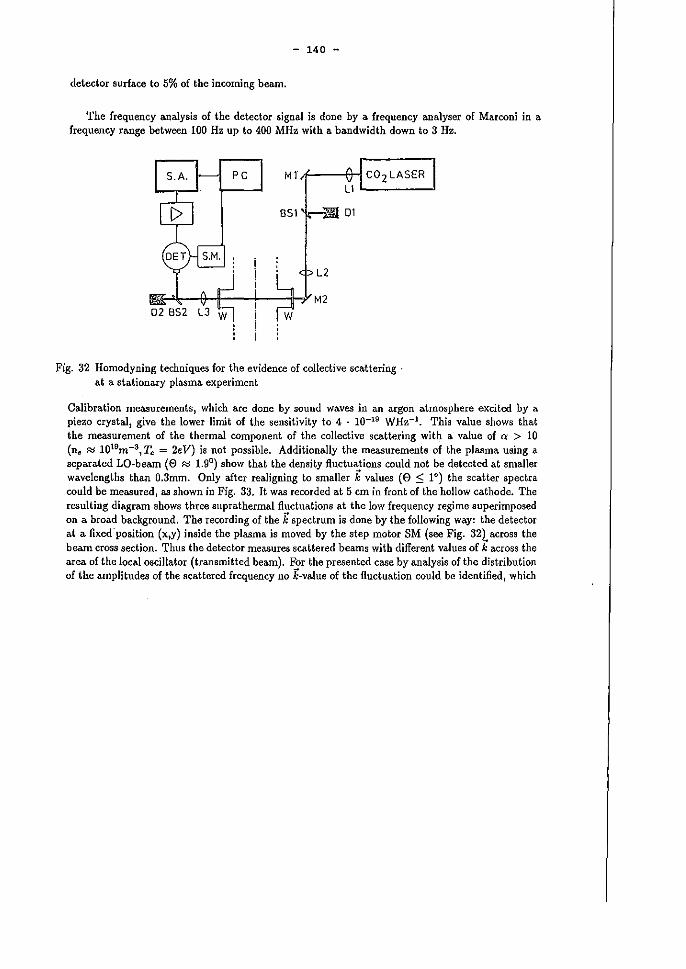
- 140 -
detector surlace to 5% of the incoming beam.
The frequency analysis of the detector signal is done by a frequency analyser of Marconi in a frequency range between 100 Hz up to 400 MHz with a bandwidth down to 3 Hz.
LI '-----'
D1
Fig. 32 Homodyning techniques for the evidence of collective sca.ttering . at a stationary plasma experiment
Calibration rneasurements, which are done by sound waves in an argon atrnosphere excited by a piezo cryatal, give the lower limit of the sensitivlty to 4 . 10-19 WHz-1• This value shows that the measurement of the thermal oomponent of the collective sca.tter.ing wit~ a value of a > 10 (nt' ~ 1019m-3, Te = 2eV) is not possible. Additionally tbe measurements of tbe plasma using a separated LO-beam (8 ~ 1.9°) sbow tbat tbe density fluctuations could not be detected at smaller wavelengths than 0.3mm. Only after realigning to smaller k values (8 ::::; 1°) the scatter spectra could be measured, a.s shown in Fig. 33. It was recorded at 5 cm in front of the hollow catbode. The resulting diagram shows three suprathermal fluctuations at the low frequency regime superimposed on a broad background. The recording of the k spectrum is done by the following way: the detector at a fixed"position (x,y) inside the plasma 1a moved by the step motor SM (see Fig. 32) acr05S the beam cross section. Tbus the detector measures scattered beams with different values of k across the area of the loeal oscillator (transmitted beam). For the presented case by analysis of the distribution of the amplitudes of the scattered frequency no k-va.lue of the fluctuation could be identified, wbich
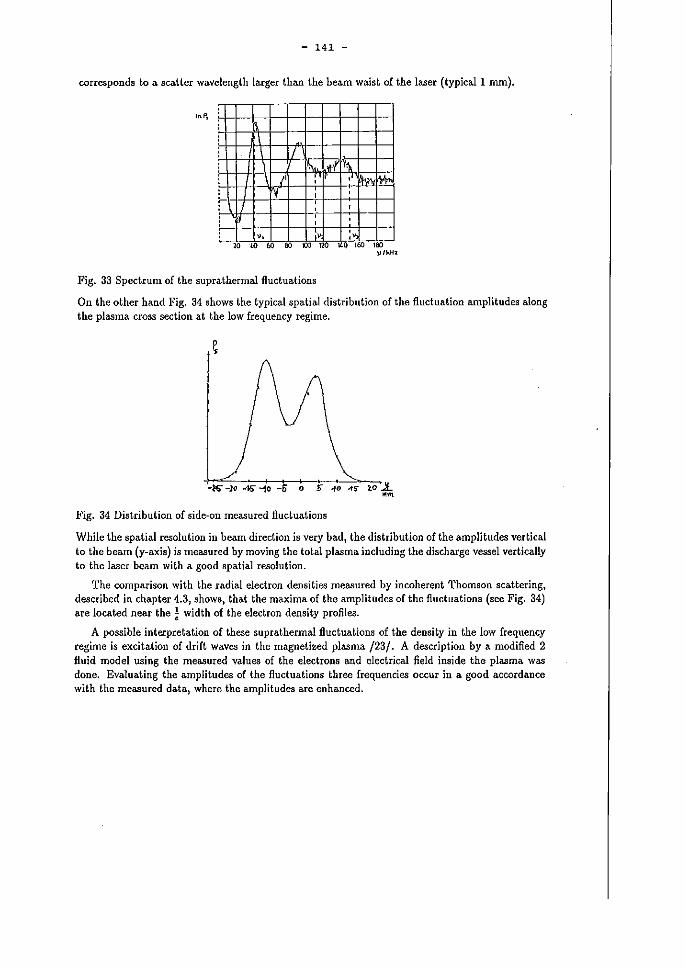
- 141 -
corresponda to a seatter wavelength targer than the beam waist of the laser (typicall mm).
Inp, :
: i/
: \ 1"-. I.~! 1''11 /' , ,
y , , >- ,
11 , , , ,
: " :' ;, 10 UJ 1)0 80 '00 120 lLQ "0 '"0
Fig. 33 Spectrum of the suprathermal fluctuations
On the other hand Fig. 34 shows the typical spatial distribution of the fluctuation amplitudes along the plasma cross section at the low frequency regime.
Fig. 34 Distribution of side-on measured fluctuations
While the spatial resolution in beam direction is very bad, the distribution of the arnplitudes vedical to the beam (y-axis) is measured by moving the total plasma including the discharge vessel vertieally to the laser beam with a good spatial resolution.
The cornparison with the radial electron deosities measured by incoherent Thomson scattering, described in chapter 4.3, shows, that the maxima of the amplitudes of the fluctuations (see Fig. 34) are located near the ~ width of the electron density profiles.
A possible interpretation of these suprathermal fluctuations of the density in the low frequency regime is excitation of drift waves in the magnetized plasma /23/. A description by a modified 2 fluid model using tbe measured values of the electrons and electrical field inside the plasma was done. Evaluating the amplitudes of the fluctuations three frequencies occur in a good accordance with the measured data, where the amplitudes are enhanced.
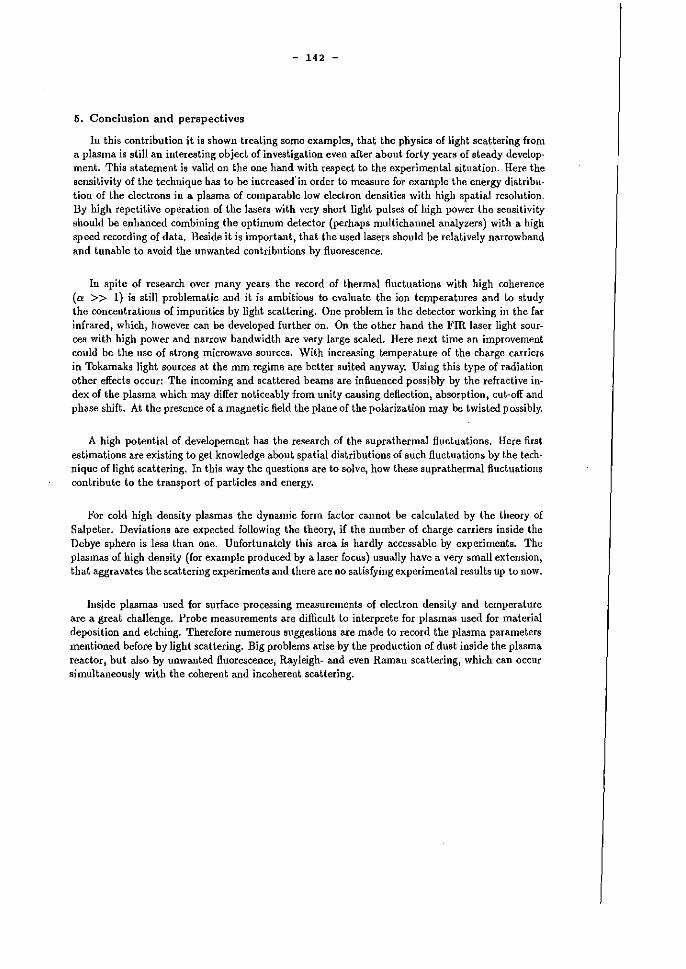
- 142 -
5. Conclusion and perspectives
In this contribution it is shown treating some examplffi, that the physics of light scattering from a plasma is still an interesting object of investigation even after about forty years of steady deve1opment. This statement is valid on the one hand with respect to the experimental situation. Here the sensitivity of the technique has to be increased' in order to measure for example the energy distribution of the electrons in a plasma of comparable low electron densities with high spatial resolution. By high repetitive operation of the lasers with very short light pulses of high power the sensitivity should be enhanced combining the optimum detector (perhaps multichannel analyzers) with a high speed recording of data. Beside 1t is important, that the used lasers should be relatively narrowband and tunable to avoid the unwanted contributions by fluorescence.
In spite of research over many years the record of thermal ßuctuations with high coherence (er » 1) is still problematic and it is ambitious to evaluate the ion temperatures and to s.tudy the concentrations of impurities by light scattering. One problem is the detector working in the far infrared, which, however can be developed further on. On the other hand the FIR laser light sources with high power and narrow bandwidth are very large scaled. Here next time an improvement could be the use of strong microwave sources. With increasing temperature of the charge carriers in Tokamaks light sourres at the mm regime are better suited anyway. Using this type of radiation other effects occur: The incoming and scattered beams are influenced possibly by the refractive index of the plasma which may differ noticeably from unity causing deflection, absorption, cut-off and phase sh1ft. At the presence of a magnetic field the plane of the polarization may be twisted possibly.
A high potential of developement has the research of the suprathermal fluctuations. Here first estimations are existing to get knowledge about spatial distributions of such fluctuations by the technique of light scattering. In this way t1e questions are to solve, how these suprathermal fluctuations contribute to the transport of particles and energy.
For cold high density plasmas the dynarnic form factor cannot be calculated by the theory of Salpeter. Deviations Me expected following the theory, if the number of charge carriers inside tbe Debye sphere is less than one. Unfortunately this area is hardly accessable by experiments. The plasmas of high density (for example produced by a laser focus) usually have a very small extension, that aggravates the scattering expedments and there are no satisfying experjmental results up to now.
Inside plasmas used for surface processing measurements of electron density and temperature are a great challenge. Probe measurements are difficult to interprete for plasmas used for ma.terial deposition and etching. Therefore numerous suggestions are made to record t1e plasma parameters mentioned before by light scattering. Big problems arise by the production of dust inside the plasma reactor, hut also by unwanted fluorescence, Rayleigh- and even Raman scattering, which can oceur simultaneously witb the coherent and incoherent scattering.
- 143 -
6. Acknowledgements
The authors thank Mes. van Bronswijk and Mr Schulz for typing the manuscript, De. Schäfer for numerous drawings, Me Dicken and Me Blockhaus for leaving Fig. 25 a.), b), 33 and 34.
- 1.44 -
7. Literature
/1/ J.D. Jackson, Classical Electrodynamics, Wiley, London (1975)
/2/ E. Madelung, Die Math. Hilfsmittel des Physikers, 7. Auflage, Springer Verlag (1964)
/3/ O.E. Evans und J. Katzenstein, Rep. Prog. Phys. 32, 207 - 271, (1969)
/4/ E.E. Salpeter, Phys. Rev., 120, 1528 (1960)
/5/ H.J. Kunze, The laser as a tool of Plasma Diagnostics etc., W. Lochte-Holtgreven, North Holland Publishing Company, Amsterdam (1968)
/6/ J. Sheffield, Plasma Scattering of Electromagnetic Radiation, Acad. Press (1975)
/7/ G. Lehner und F. Pohl, Z. Phys. 232,405 (1970)
/8/ P.G. Carol.n and D.E. Evans, Plasma Physi<s U, 947 (1971)
/9/ D.E. Evans, Plasma Physics 12, 573 (1970)
/10/ P. Nielsen in Diagnostics for Fusion Reactor Conditions, Vol I, Commision of the European Communitiea (1982)
/11/ M. Born, Thesis, University of Düsseldorf (1988)
/12/ H. Röhr, K.H. Steuer, IPP Report Garehing III/121 (June 1987)
/13/ P. Jauernik, H. Kempkens, J. Uhlenbusch, Plasma Physics and Contr. Fusion~, 1615, (1987)
/14/ R. Mann, Dissertation, University of Düsseldorf (1983)
/15/ G. Haupt, Thesis, University of Düsseldorf (1988)
/16/ R. Behn et .• 1., Phys. Rev. Lett. 62, No. 24 (1989)
/17/ H. Nett, Dissertation, University of Bonn (1989)
/18/ E. Holzhauer, J.H. Massig, Plasma Physics W, 867 (1978)
/19/ H. Küllmanu, Dissertation, University of Düsseldorf (1989)
/20/ R.E. Slusher .nd C.M. Surko, Phys. Fluids II (3), 472 (1980)
/21/ W.B. Davenport, W.L. Roth, An Introduction to the Theory of Randoin Signals and Noise, Me. Graw Hill, New York (1958)
/22/ A. Brockhaus, H. Kempkens, R. Mann, D.C. Schram and J. Uhlenbuseh, SFB·Bericht 86·01-149 (1986)
/23/ A. Brockhaus, Dissertation, University Düsseldorf, beeing prepared
- 145 -
Laser-Induced Fluorescence
H.F. Döbele
Physics Department
Essen University, FRG
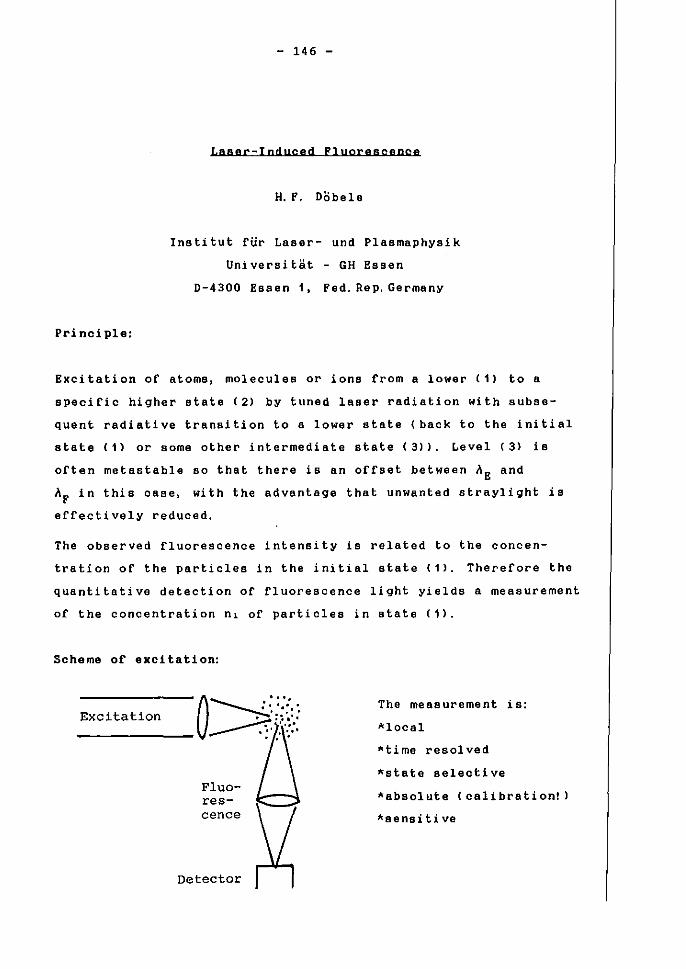
Pri nci pIe:
- 146 -
I.AAflr-Indllced PIUOrftRQeDce
H. F. Döbe1e
Institut für Laser- und Plasmaphysik
Universität - GH Essen
0-4300 EBsen 1, Fed. Rep. Germany
Excitation of atoms, moleeules or ions from a lower (1) to a
specific higher state (2) by tuned laser radiation with subse
quent radiative transition to a lower state (back to the initial
state (1) or some other intermediate state (3». Level (3) ia
orten metastable so that thera ia an offset betwaen AE and
"F in this eBse , with the advantage that unwanted straylight ia
effectively reduced.
The observed fluorescence intensity ia related to the concen
trat10n of the partiales in the initial state (1). Therefore the
Quantitative detection of fluorescence light yields a measurement
of the concentration n1 of partic1es in state (1).
Scheme of excitation:
Excitation . .." ~~ :.":::.
~~,:;,,::
----- .:.,'; ..
Fluorescence
Detector
Tho measurement i8:
*10ca1
#Iltime resolved
*state selective
*absolute (calibration!)
*sensitive
- 147 -
Furthermoro, stete selective valocity distributions can be ob
tained ir certain conditione concerning the linewidth (see below>
are fulfilled [1J.
The sensitivity can be compared e. g. with ThomBon Bcattering:
Tho total ThomBon Bcattering cross Beatlon 1a given by (1]
0T = (8u/3) ro 2 = 0.665'10- 24 cm2 ,
where ro Is the classical electron radius. Far abound electron,
the corresponding quantity 18 [2J
Ir we irradiate the atom with very narrON bandwidth radiation
Aw < t with central wavelength ~ = ~O, we heve:
We abtain in the classical approximation «( 2] I pg. 274) where the
damping mechanism 1a the energy lOBS of the radiating oBcillator
with
using ro = e 2 tme c 2 the result oB = 6nc 2 /wo 2 , or, introducing the
wavelength no:
aB (3/21l)·'\02.
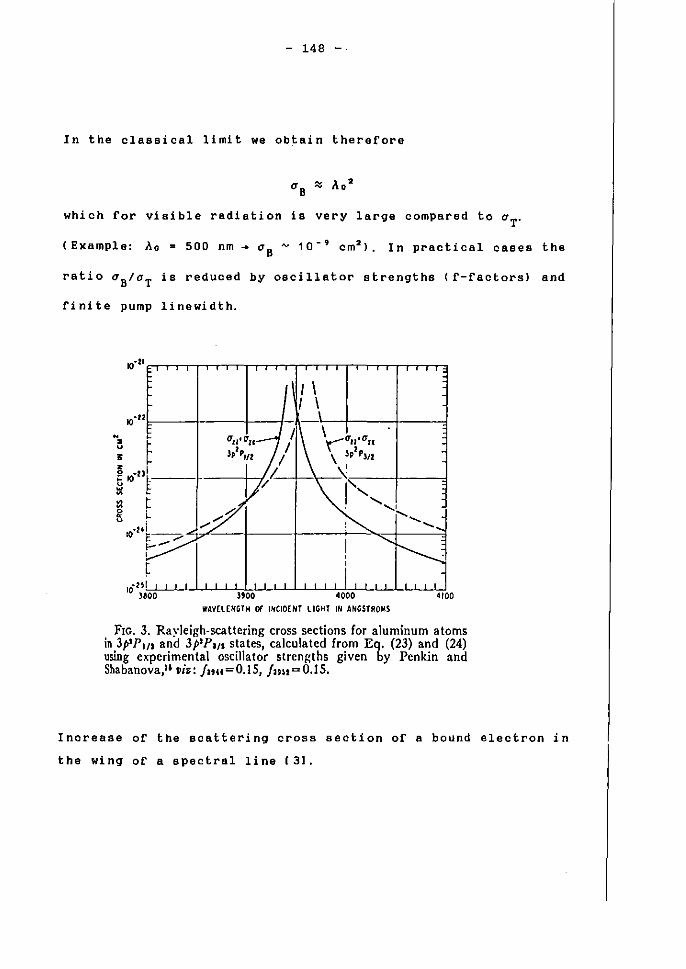
- 148 -
In the classical limit we obtain therefore
which ror visible radiation la very larg8 compared to O'T'
(Example: Ao = 500 nrn ... O'B "" 10- 9 cm 2). In practical cases the
ratio aBloT Is reduced by o8cillator strengths (f-factors) end
finite pump linewidth.
" • u
10-' I
, •
~ 't t L
• i
~ t
",-'
,I . -, 10 l800
I \ I \
0'"'1' er,. ~\ . r-Uu ' 0'11 ,pi Pm / ,
l \f' 17/ I' ...... // ' ............... 1
~::7 ~ ....... ,. ! ........... - ...... I ~ ,
, i . , , , I I
'900 4000 4roo WAY(l[HG1H Of IkCIO[NT LIGHT IN ANGSTRO .... S
FIG. 3. Rayleigh-scattering cross sections for aluminum atoms in 3p'P1/1 and 3P'P", states, calculatcd from Eq. (23) and (24) using experimental osciJlator strcngths given by Penkin and Sbabanova,u vi.: j" .. = 0.15, j .. " = O. 15.
IncreaBe of the Bcattering cross sectlon of abound electron in
the wing of a spectral I1ne (3],
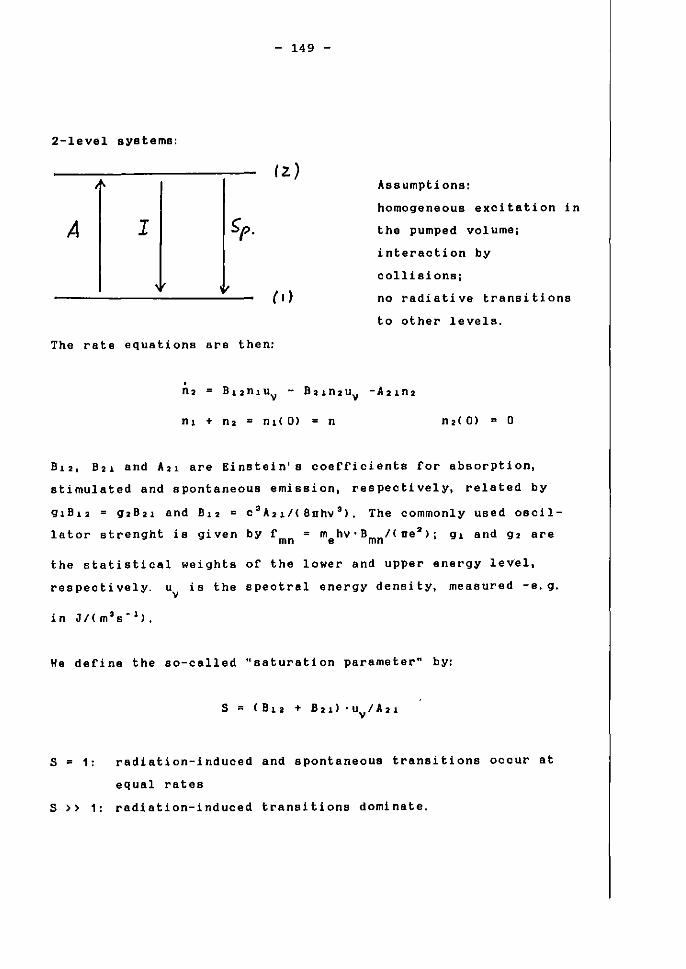
2-level systems:
A I
•
- 149 -
(z) Assumptions:
homogeneous excitation in
the pumped volumei
interaction by
00111810nsi
no radiative transitions
to other levels.
The rate equations are then:
. "2 B12ßIUV - B21ß2UV -AZln2
"1 + 02 = nd 0) = n
B121 B21 end A21 are Binetsin' s coefficients ror absorption,
stimulated and spontaneaus emission, respectively, related by
91812 = 9'2821 end B12 D c 3 A21/( 8nhv 3), The commonly used 08011-
lator strenght i8 given by f = m hV'B J(ue 2). 9'1 end 92 are mß e mn I
the statistical weights of the lower and upper energy level,
respectively. Uv
18 the spectral energy density, measured -e. g.
in J/( m3s~1),
We derine the so-called "saturation parametern by:
S = 1:
s = (812 + B21) 'UV
/A21
radiation-induced and spontaneous transitions occur at
equal rates
S » 1: radiation-induced transitions dominate.
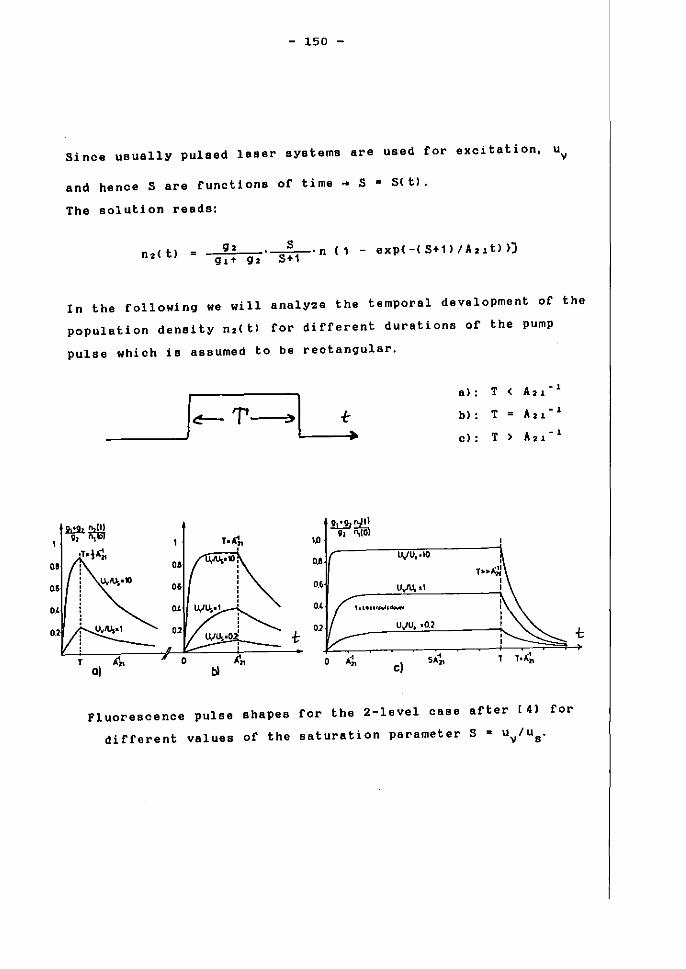
- 150 -
Since uBually pulsed laser systems are used rar excitation. Uv
end hanee S are functions of time ~ S = 5<t),
The solution reade:
n21 tl g2 S g,+ g2·~·n [1 - expl-IS+ll/A21 tl »)
In the following we will analyze the temporal development of the
population density n2(t) far different durations of the pump
pulse whieh ia 8sBumed to be reet angular.
____ I~ 'P--:>IL. __ -I:~, al:
bl: T
cl:
"'n 01 bI
t
I~
OJI,------'U/~~-.I~O---------i
0.' U.,JU. .1
0.4 1.l<l'''wI.~
02 U.,IU, .0.2
o A~ cl
A -, 21
Fluorsscence pulse shapes Cor the 2-1evel ease after [4) ror
different valu8s of the saturation parameter S = uv/u s '
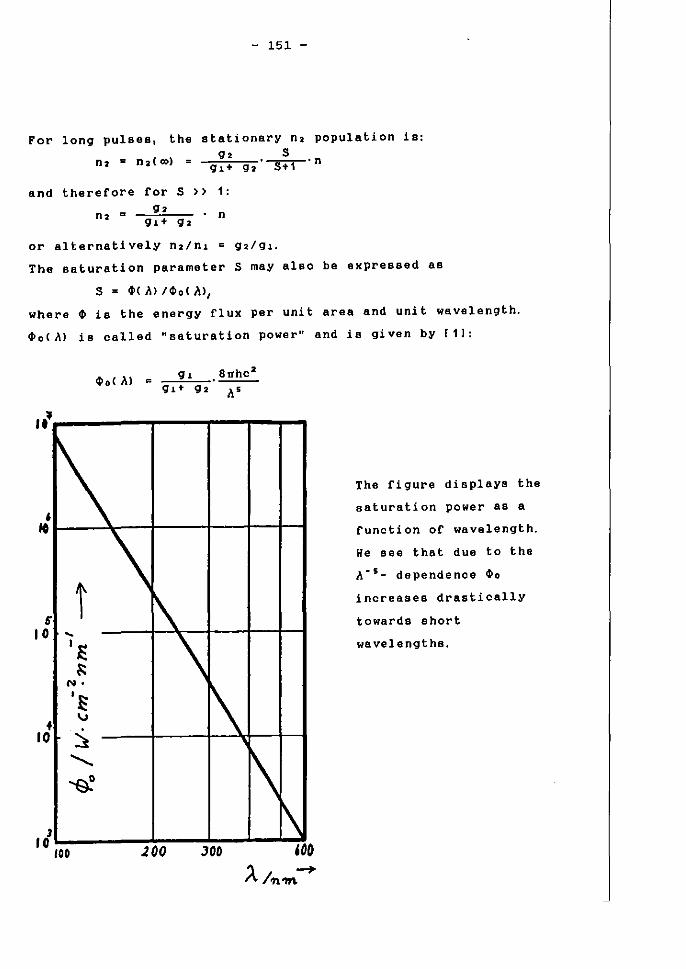
- 151 -
For 10ng pulses, the stationary 02 population ia: g, S
91+ g2'~'n
end therefore far S » 1:
91+ 92 • n
or alternatively 02/01 c g;l!91.
The saturation parameter S mayaIso be expressed as
S = 0I>(,\) 1000.('\),
where ~ is the energy flux per unit ares end unit wavelength.
~o( Al ie called "saturation power" end ie given by (1]:
1 ' •
10
r 10
• 10
J 10
i\ 1\ ...
\ I~ ~
N'
'~ 1\ V
~ .........
~
100 200 JOO
1\ !\
The figure displays the
saturation power aB a
funetion of wavelength.
He see that due to the
~-s_ dependence ~o
increases drastically
towards short
WB ve 1 e ngt hs.
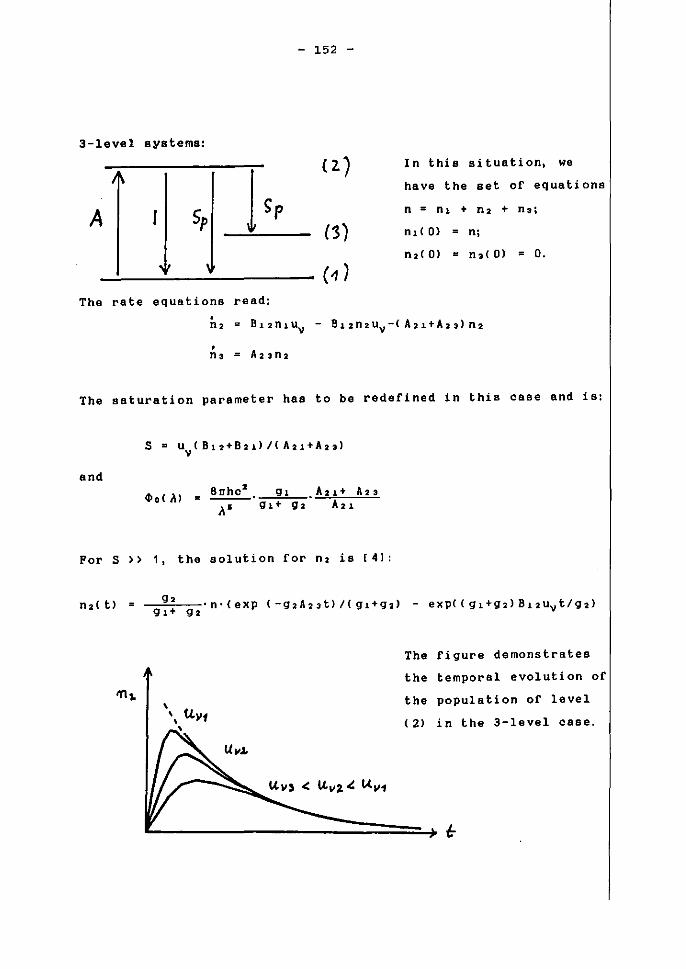
3-level systems:
11\ 1 Sp A r 5p
, , Tho rate 8quations read:
- 152 -
(2.)
(3)
In this situation, we
heve the set of equations
n, ( 0) n;
n,(O) • n3(0) = O.
. "2 B~2nlUv - B12nzuv-CA21+A,3)nZ
The saturation parameter has to be redefined in this eBse end ia:
S 11::1 Uv ( B 1 2 + B 2 1) I ( A 2 1 + A 2 3 )
end
cI>. ( ,\)
Por S » 1 , the solution ror 02 i8 [4J:
n, ( t)
The figure demonstrates
the temporal evolution of
'11" the population of level
tLVf ( 2) in the 3-level eBse.

- 153 - "
The levels (1) end (2) are populated according to 02/nl c 92/91
einee we are considering the ease S » 1.
A1though for all times t the transition (1) ~ (2) is saturated,
the total number of partie1es in these levels dies out due to the
continuous 1088 ioto level (3),
The fluorescence radiation (2) .. (1) 18 given by the emission
coefficient :
~F1( t) i =2. 3
Since 0, 18 proportional to ", the initial population nd 0) of
level (1) can be determined by measuring the fluorescence
intensity.
In the 3-1evel ease ws find rar the tima-integrated fluorsscence
(S » 1 ~nd suffieient1y 10ng pump pulse):
I " hv 23 I" • ~Fl( t)dt = 4"i!"A'3". n2( t)dt
hv 2 3 = 4"i!·n I
einee the integral has the velus [A23' 92 ]-1 .In this ease. gl + 92
knowledge of A23 18 not even nec8sssry.
In the above cases, 0011i810ns have not bean included. In eBse of
atoms inbedded in a p.lasma, the most important col1is10n errects
are produced by electrons.
The rate equations that include electronic collision processes in
• 3-1evel model are of the form 151 (ne is the e1eetron density
and Xij ia the rate coerricient ror collisional transitions i~j):
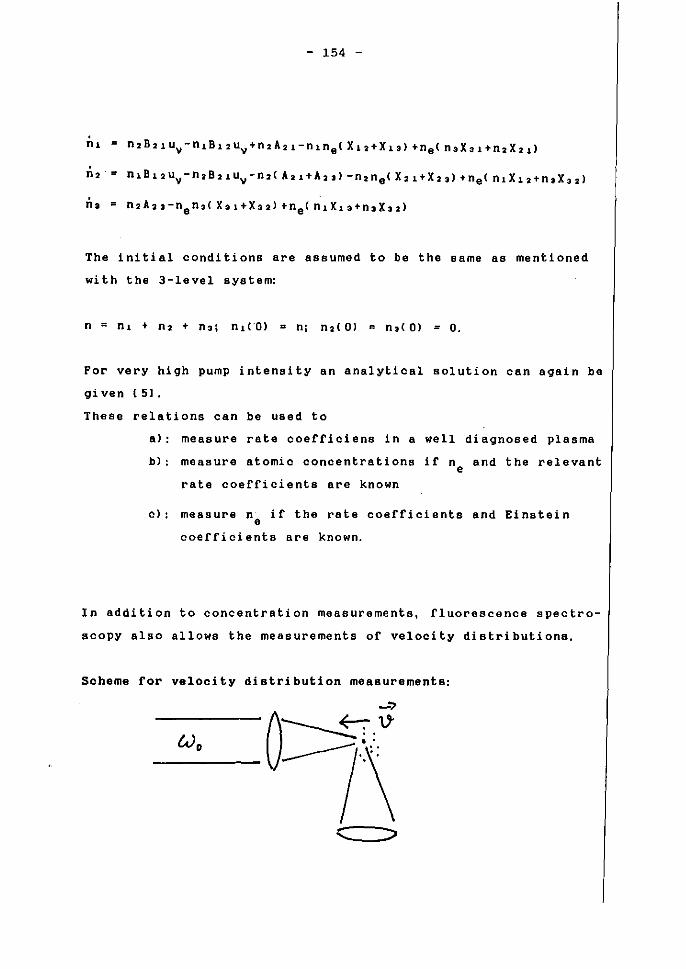
- 154 -
02 = nlB12UV-na821UV-n2( A21+A 23 ) -nan e ( X21 +X23) +n e ( nlX12+03X 32 )
The initial conditions are assumed to be the same BS mentioned
with the 3-1evel system:
Por very high pump intensity an analytical solution can again be
given (51.
These relations can be used to
a): measure rate coefficiens in a weIl diagnosed plasma
b): measure atomic concentrations ir "e and the relevant
rate coefficients are known
c): measure "e ir the rate coefficients end Einstein
coefficients are known.
In addition to concentration measurements, fluorescence spectro-
scopy also allows the measurements of velocity distributions.
Scheme ror velocity distribution measurements:
-?
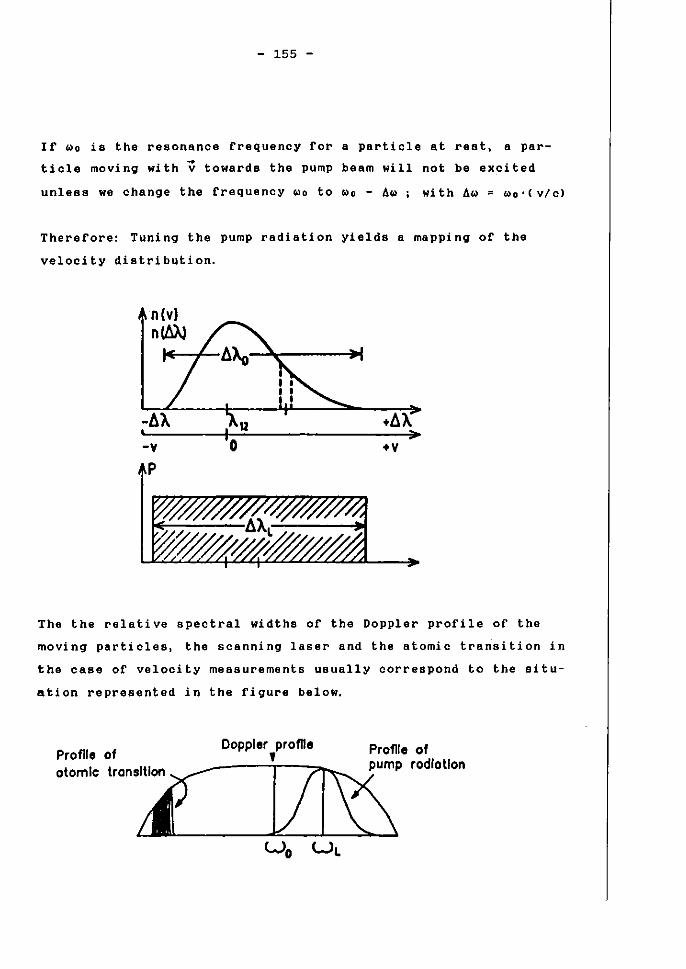
- 155 -
Ir ~o ia the resonance frequency ror a particle at reet , a par
ticle moving with V towards the pump beam will not be excited
unlesB we change the frequency ~o to ~o - Aw i with A~ = ~o'(v/c)
Therefore: Tuning the pump radiation yields a mapping of the
velocity distribution.
n (V) nltlA)
-y
p +y
The the relative spectral widths of the Doppler profile of the
moving particles, the scanning laser end the etornic transition in
the ease of velocity meseurements u8ually correspond to the situ
ation represented in the figure below.
fli f Doppler prome Profile of
Pro e 0 ,
,"mk ""'Z VlY\ "",,,,, Wo WL

- 156 -
Let us describe the Doppler profile by D(w - wo) with
1 D(w-wo) d", • 10
In the ease S « 1, we heve:
R
For simplicity, the pump laser profile ia 8SBumed to be
Lorentzi an:
5 w
The saturation parameter S ia connected with S through the linew
width by 5 = AwL-'ol 5w dw Therefore, we heve:
R o D( w-wo) 01 5 dw 91+ 92 ~
R = oD(w-wo)0(1I/2)o, 05 91+ 92 L L
IC, however, S aSBumea an arbitrary value, we heve similarly:
and
R =
R • 5 w + 5 w
The evaluation of the integral yie1ds 'L o( 11/2) o( 1+5L) -1/2
- 157 -
Therefore: for S « 1: R la proportional to SL' where8e for
S » R seales as YSLo
This leads to an effective broadeninq of the Bcanning pump laser
profile - the so-called effect of "power broadening".
This broadening efeect can be seen more directly by looking at
the ratio 02/n = R~ per unit frequency interval:
R .,
This Lorent2ian profile has the halfwidth ,. = (1 +SL) 1/2 "L'
The broadening raetar (1 +SL) 1/2 was determined ha re for the
special ease of a Lorentzian pump laser spectral profile. Actual
profiles may be (and usually are) different. The basic broadening
mechanism remains qualitatively unchanged, however.
Signal-ta-noice ratios:
The signal-ta-noise ratio ( SNRl ie determined by
• the number of deteeted fluorescence photons
• the number of background photons
• the number of strayli ght photons
• the detector properti es, mainly the quantum efficiency
The numerical value is gi yen by
Here, Zs depende on the specific experimental circumstances and
ZB may be estimated for given plasma date (see, e. g. (6]).
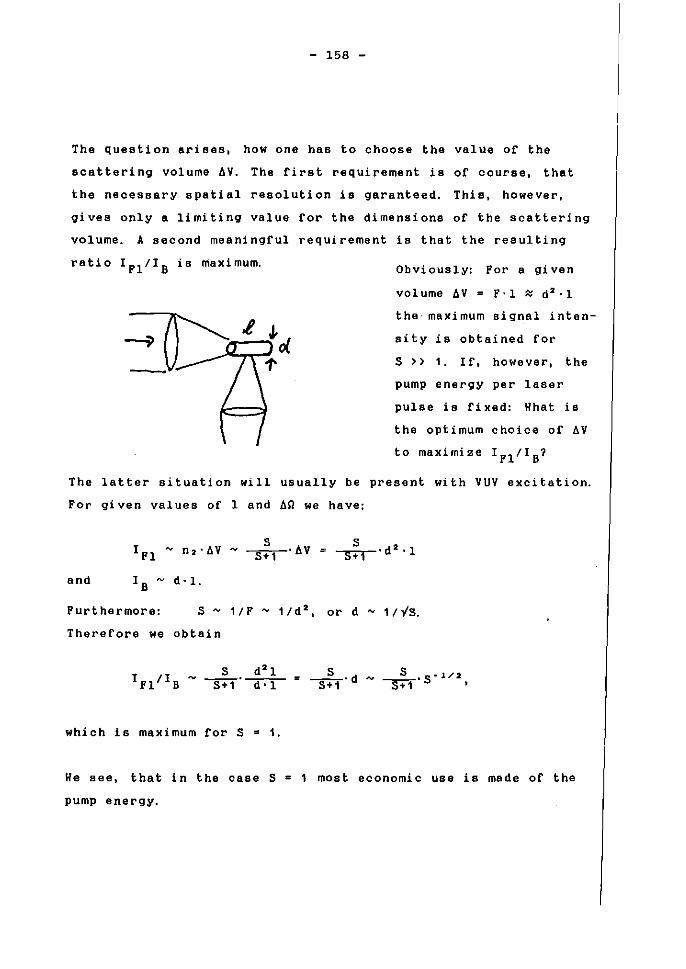
- 158 -
The queetion arieGs, how ans haB to choose the value of the
scattering volume AV. The first requirement 1a of course, that
the necesssry spatiel resolution Is garanteed. This, however,
gives only a limiting value far the dimensions of the scattering
volume. A second meaningful requirement 18 that the resulting
ratio IF1/IB
18 maximum. Obviously: Far a given
volume AV = F'l ~ d2 '1
the· maximum signal inten
sity 19 obtained far
S » 1. IC, however, the
pump energy per laser
pulse le fixed: Hhat la
the optimum ehoiee of 6V
to maximize 1P1
/10
?
The latter situation will uBually be present with VUV excitation.
Far given values of 1 end AQ we heve:
and 1 0 - d·l.
Purthermore: 5
Therefore we abtain
1 / P - 1 / d 2 , 0 r d - 1 / 1"5.
5 --s+i"' d
__ 5_. g • 1 / 2 S+1 I
whieh 18 maximum for S = 1.
He see, that in the ease S = 1 most economic usa i8 made of the
pump energy.
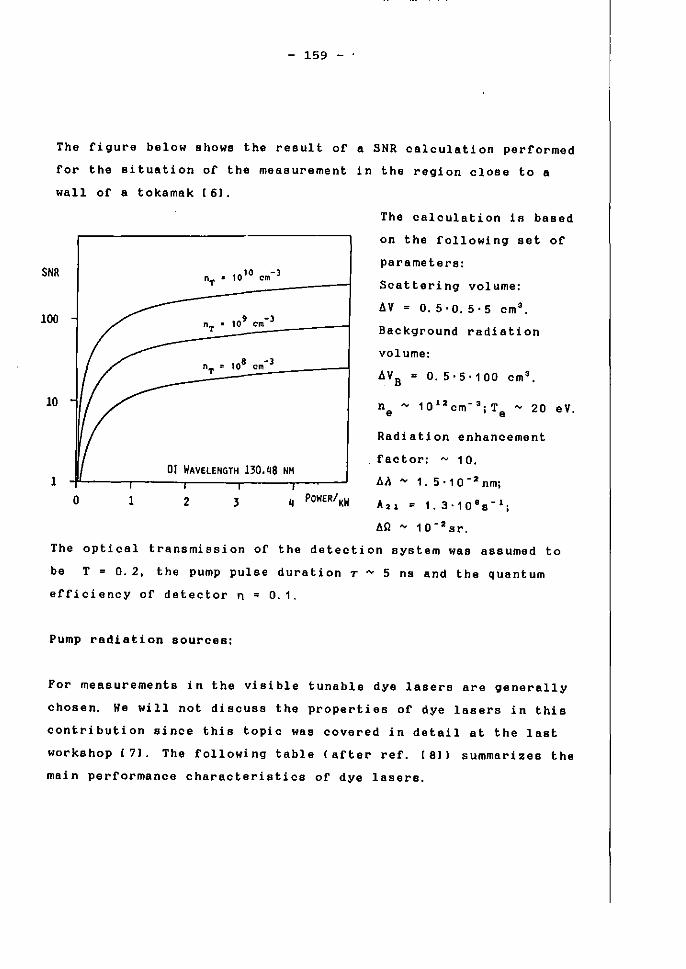
- 159 - .
Tho figura below shows the result of a SNR calculation performed
far the situation of the messurement in the region eIoee to a
wall of a tokamak [61.
SNR
100
10
1
o 1
10 -) nT • 10 cm
• -J "T • 10 cm
O[ WAVELENGTH 130.QS NH
2 3
The calculation 18 bssed
on the following set of
parameters:
Scattering volume:
/lV = 0.5'0.5'5 cm'.
Background radiation
val urne:
/lVD = 0.5'5'100 cm'.
n ..., 10 12 cm- 3 'T ..., 20 eV e • e .
Radiation enhancement
factor: 10.
~A "'" 1. 5· 1 0 - 2 nm;
A21 = 1.3'10 8 8- 1 ;
llQ ..., 10- 2 sr.
The optical transmission of the detection system was aSBumed to
be T = 0.2 , the pump pulse duration T ..., 5 ns and the quantum
efficiency of detector n = 0.1.
Pump radiation 80urces:
Par measurements in the visible tunable dye lasers are generally
chosen. He will not diseuse the properties of dye lasers in this
contribution eince this topic was covered in detail at the last
workshop [71. The fOllowing table (after ref. (81) summarizes the
main performance characteristics of dye lasers.
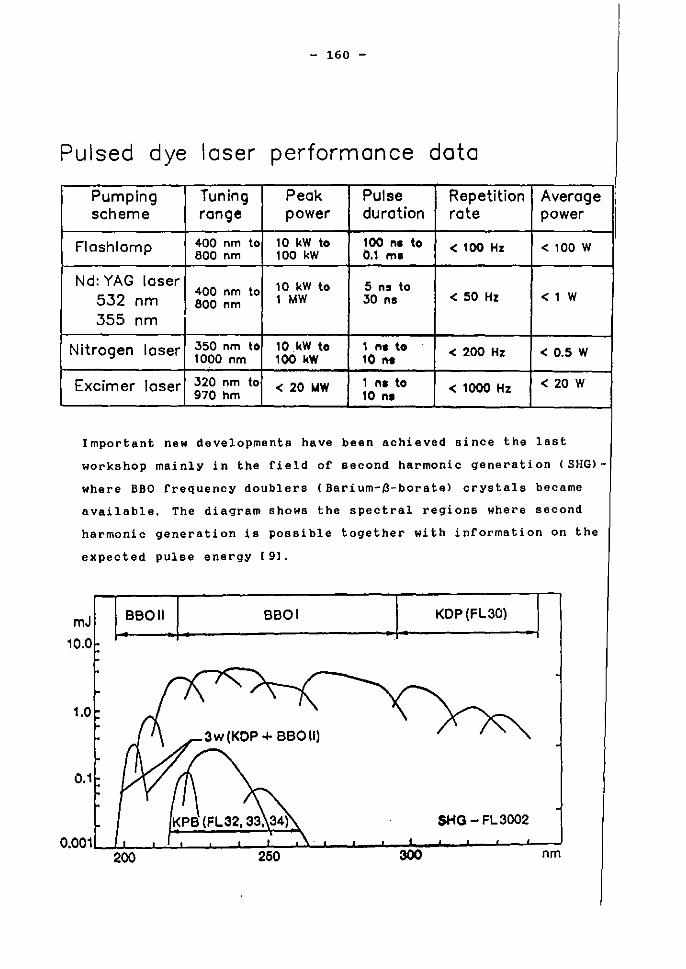
- 160 -
Pulsed dye laser performance data
Pumping Tuning Peak Pulse Repetition Average scheme range power duration rate power
Floshlomp 400 nm \0 10 kW \0 100 nl 10 < 100 Hz < 100 W 800 nm 100 kW 0.1 ml
Nd: YAG loser 10 kW 10 5 n. 10 400 nm \0 532 nm 800 nm 1 MW 30 n. < 50 Hz < 1 W
355 nm
Nitrogen loser 350 nm 10 10kW 10 1 nl 10 < 200 Hz < 0.5 W 1000 nm 100 kW 10 ""
Excimer laser 320 nm 10 < 20 "'W 1 nl 10 < 1000 Hz < 20 W 970 hm 10 nl
Important new developments have been achieved since the last
workshop mainly in the rield of second harmonie generation (SHG)
where BBO frequency doublers (Barium-ß-borate) crystals became
available. The diagram shows the spectral regione where second
harmonie generation is possible together with information on the
expected pulse energy 19l.
mJ
10.0
1.0
0.1
6eOll 6601 KOP(FL30l
SHG-FL3002
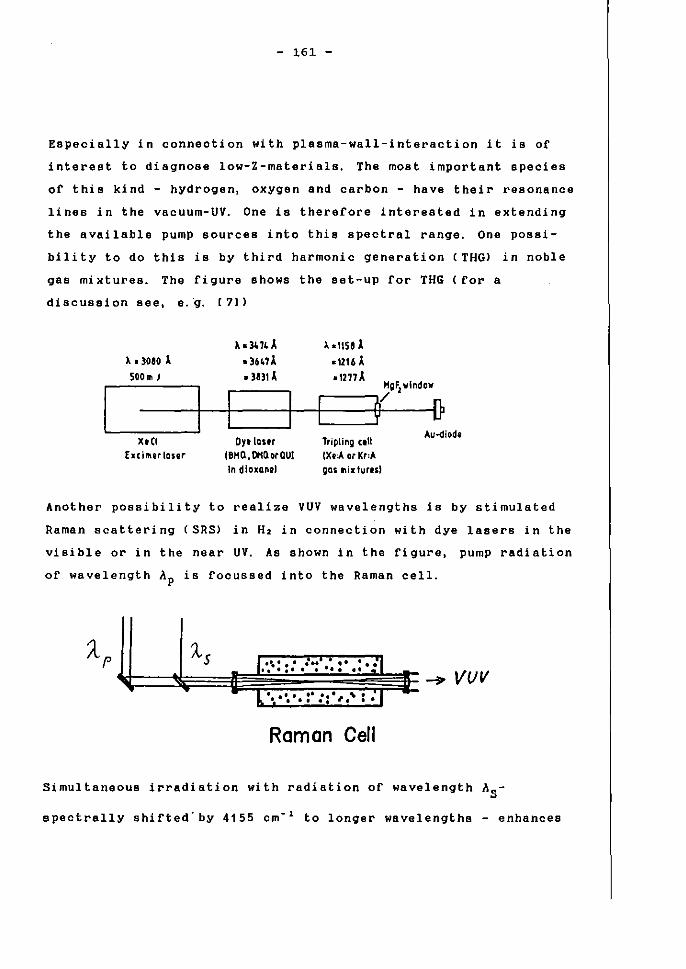
- 161 -
Especially in connection with plasma-wall-interaction 1t 1a of
interest to diagnose low-Z-materials. The most important species
of this kind - hydrogen, oxygen and carbon - have their resonance
lines in the vacuum-UV. One 18 therefore interested in extending
the 8vailable pump Bources into this spectral range. One possi
bility to do this le by third harmonie generation (THG) in noble
g8S mixtures. The figura shows the set-up ror THG (ror a
discussion see, e. "g. (71)
~ 03010 1
500 lfI J
X.CI [xcilllerlas'f
~.341d
.l6411
.llll1
O)'llaur IBHQ.DltQorQUl In dioxan"
~ .11511 .12161
.12111
Tripling ClII (X,:A or Kr:A gas lIix turesl
Auoodiod.
Another possibility to realize VUV wavelengths la by stimulated
Raman scattering (SRS) in H2 in connection with dye lasers in the
visible or in the near UV. A8 shown in the figure, pump radiation
of wavelength Ap i8 focussed into the Raman cello
Af A.S ........... ' ••
~~::::~i======1~~.~.~.~.~.~.~.~ .. ~.~.~.~.~~t: ....... :' ::',.':. _ VVv
Roman Ce"
Simultaneous irradiation with radiation of wavelength AS -
spectrally shifted'by 4155 cm- 1 to longer wavelengths - enhances
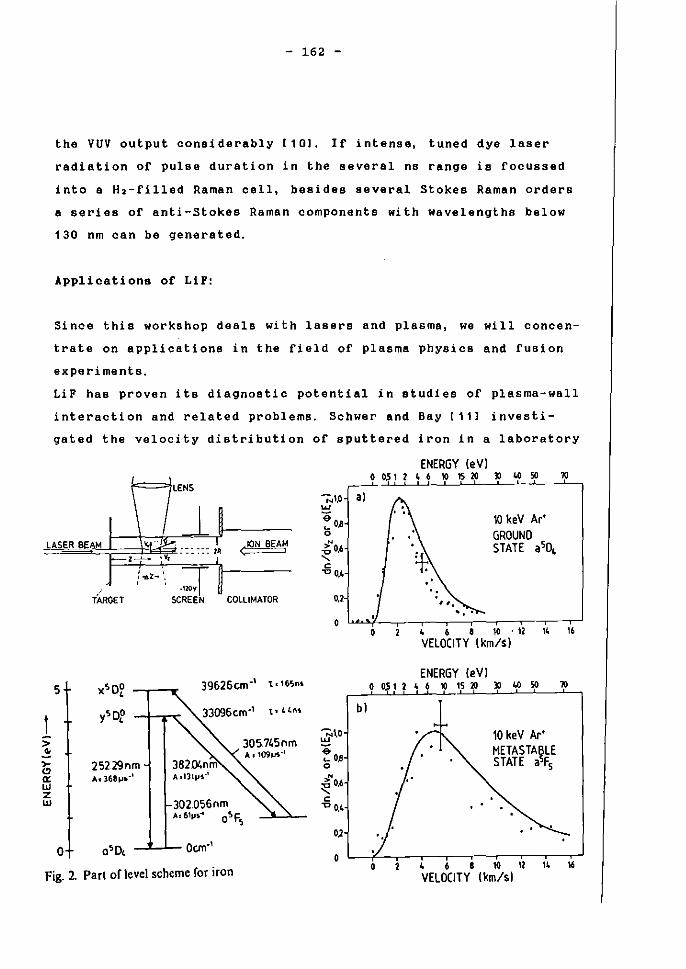
- 162 -
the VUV output consi derably [101, I fintense, tuned dye laser
radiation of pulse duration in the Baveral ns range 18 focussed
into a H2-filled Raman cel1, besides s8veral Stokes Raman orders
a sari es of anti-Stokes Raman components with wavelengths below
130 nrn can be generated.
App1ications of LiP:
Since this workshop deals with lasers and plasma, we will concen
trete on epplications in the rield of plasma physics end fusion
experiments.
LiF hae proven its diagnostic potential in studies of plasma-wall
interaction end related problems. Schwer and Bey (11] investi
gated the velocity distribution of sputtered iron in a laboratory
ENERGY (eVI
«I ==lLENS
I \
00.51246101520 ))4050 70
al
LA.SER BEAM I )~ .. J..-; =:: ::: 2A: d2:~ I--z----;---- I
10 keV Ar' GROUNO STATE aSO,
1 > ~
b a: w z w
5
o
J /~l- .:r] i~GET SCREEN COLLIMATOR
39&26c.m"' to165M
33096cm-1 t" 44M
305.745nm A..I09~··
25229nm Ac 168~i.·'
302.056nm A..61",,," a!lF
s
F' 2 Part or level seherne ror iron Ig. ,
0,2
o
~\O .. ~ Oß o
>' 0,6 ~ C '00,4
0)
o
bl
"
", " '
o 4 6 8 W "12 14 16 VELOCITY (km/sI
ENERGY (eVI 005124610 1S20 13 40 so
10 keV Ar' METASTABLE STATE aSFs
10
o 2 4 6 e ro 12 14 ~
VELOCITY (km/sI
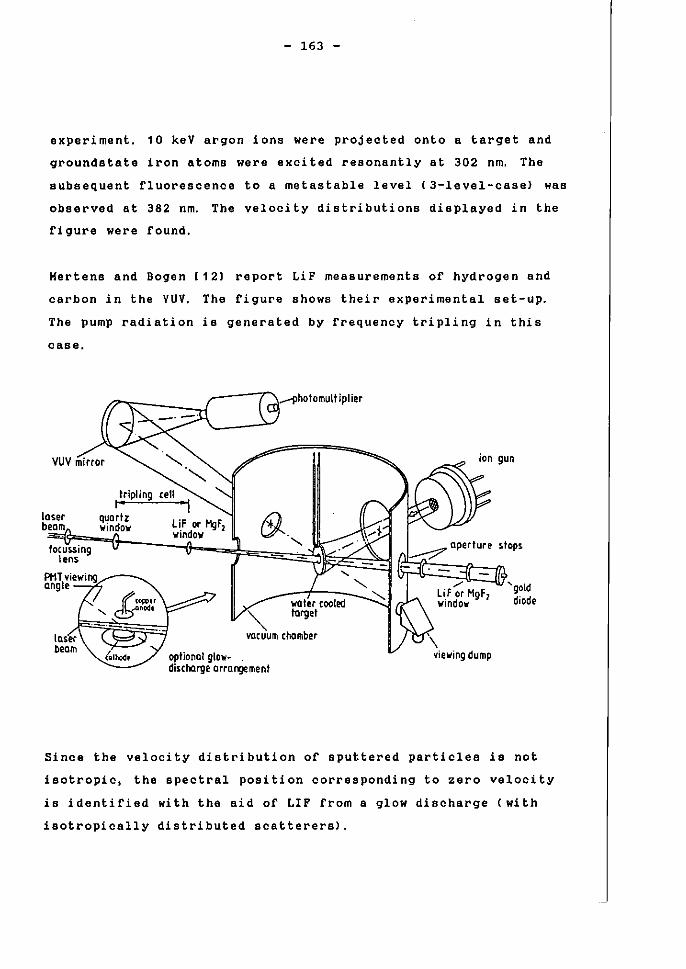
- 163 -
experiment. 10 keV argon ions were projected onto a target and
groundstata iron atoms were excited resonantly at 302 nm. The
subsequent fluorescence to a metastable level (3-1evel-case) was
observed at 382 nm. The velocity distributions disp1ayed in the
figure were found.
Kertens and Bogen (121 report LiF messurements of hydrogen end
carbon in the VUV. The figura shows their experimental set-up.
The pump radiation is genera ted by frequency tripling in this
ease.
I/~:-___ I---;".-jlhotomult iplier
VUV mirrar
laser beam
focur.sing lens
tripling (eil I' , I
quartz window L iF or I1gF,
window
'" vacuum chamber
optional glow· discharge arrargement
ion gun
/' li.F or HgF1 wlndo ...
yiewing dump
stops.
'gold diode
Since the velocity distribution of sputtered particles is not
isotropie, the spectral position corrssponding to zero velocity
is identified with the aid of LIF from a glow discharge (with
isotropically distributed scatterersl.
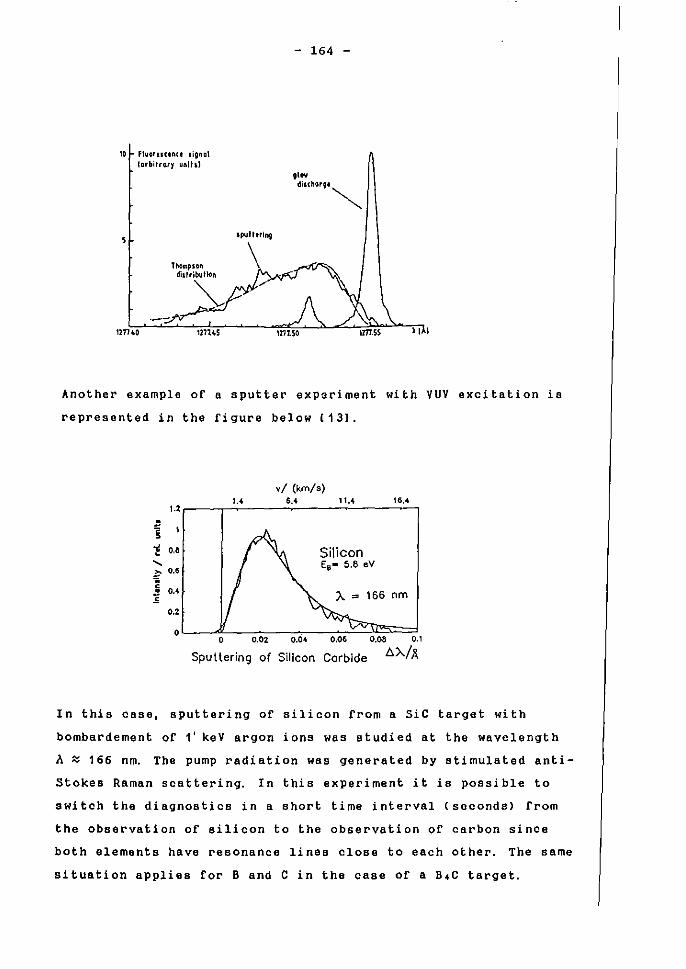
10 fluoructnCe lignol IQrbilro.r~ unihl
Tholllpion dillribuUon
~
- 164 -
,lw diuho.rge
~
Another example of a sputter expsriment with VUV excitation 1a
represented in the figure be10w [131.
vi (km/s) 1. • 5.' 11.4 16.4-... .
'E , 'f ••• Silicon "- Es- 5.8 eV 1:- ••• .. c ••• • nm ;;
•. 2
• 0.04 • 0.02 0,06 0.08 •• 1
Spultering of Silicon Carbide ß'A/ft.
In this ease, sputtering of silicon from a Sie target with
bombardement of l' keV argon ions was atudied at the wavelength
A ~ 166 nrn. The pump radiation was generated by atimulated anti
Stokes Raman scattering. In this experiment it i5 possible to
switch the diagnosticB in a ahort time interval (seconds) from
the observation of silicon to the observation of carbon since
bath elements have resonance lines close to aach other. The same
situation applies for Band C in the case of a B.C target.
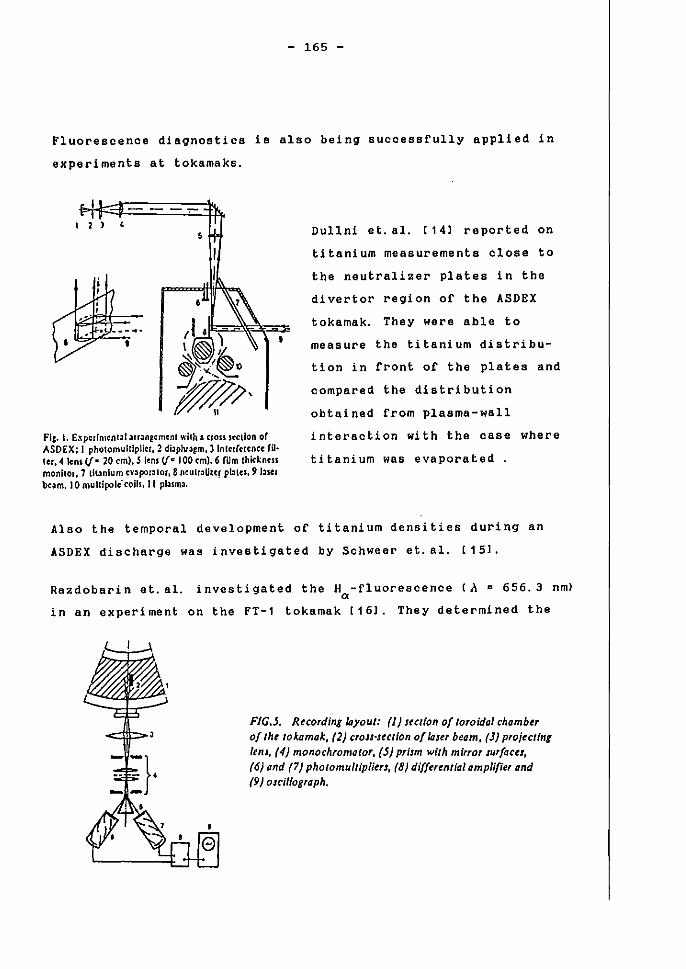
- 165 -
Fluorescence diagnostics 1a also being successfully applied in
experiments at tokamaks.
1 , ,
•
Fi,. I. E:o:pcrlmcnl313rr:lnBcm~nl wich. a cross srellon or ASOEX; J pholomuI1Iplier.:2 di3phu{!m, 3Inh:r(crcncc ril· ler, 4lcni V'" 20 cm),.5 lens <Ir: 100 cml. 6 rum Ihid:nen monilol.7 liunlum cV3poC3101, 8 neulr:lUZC! pblu. 9 bier beam. 10 mullipolc' (olls. 11 pl.uma.
Dullni et. a1. [14J reported on
titanium measurements close to
the neutralizer plates in the
divertor region of the ASDEX
tokamak. They ware able to
measure the titanium distribu-
tion in front of the plate. and
compared the distribution
obtained from plasma-wall
interaction with the oase where
titanium was evaporated .
Also the temporal development of titanium densities during an
ASDEX discharge was investigated by Schweer et.81. (15].
Razdobarin et. al. investigated the H -fluorescence (A = 656.3 nm) '" in an experi ment on the FT-1 tokamak (16]. They determined the
FIG.J. Recording layout: (I) swion of toroidol ehamb" of th, tokamak, (2) cro"'"etlon of laser beom, (]) pro;eetlng (tm, (4) monochromator, (5) prism with mirror sur/acts, (6) and (7) photomultipliers, (8) differential omplifier ond (9) oscil/ogroph.
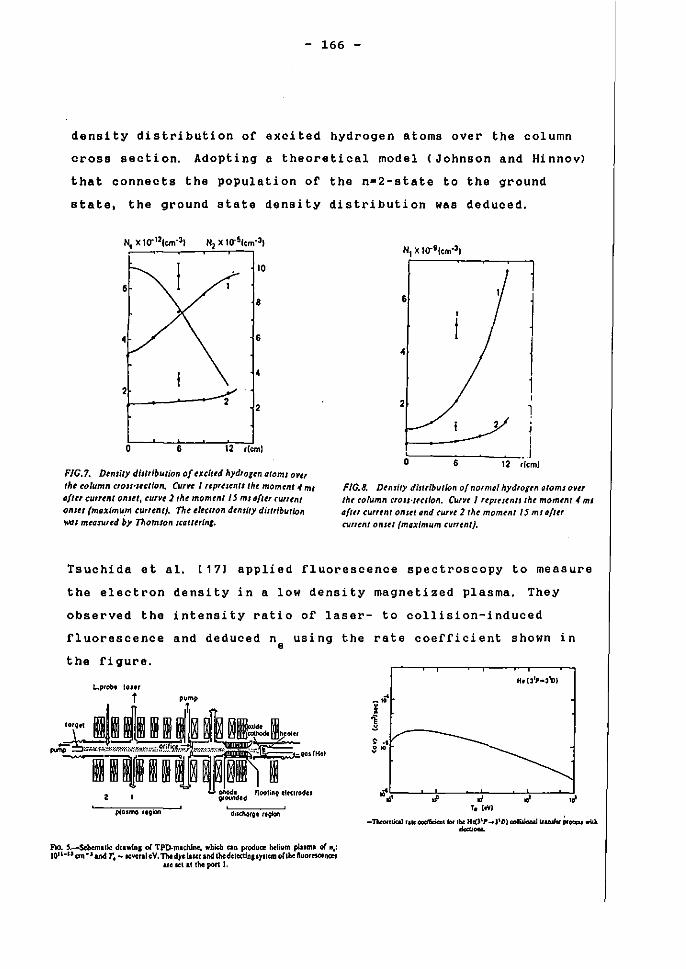
- 166 -
density distribution of excited hydrogen atoms over the column
cross Beot10n. Adopting a theoretical model (Johnson and Hinnov)
that connects the population of the n=2-state to the ground
etate, the ground stats density distribution was deduced.
10
6
8
• 6
• 21--_-------22
2
o 6 12 rlernl
FIC.? Dtnllty dl,11i6111;on 01 txcittd hydrogen atoms 0"'" Iht to/uMn ,rO'I-I,cliofl. Cu1l't J tipr/sintl Ihe moment -I ml ti/lU CUtTlnt Qnlt', curvi] Ihe moment J5 mStJ/ul ('III1Mt OflStl (maxfmu.m tuuent). Tht t/eetl01l d,nlily distribution WlJI mtasured by Thomson scoUt/lnl.
6
•
2
2 J
! , . J 0 6 12 rltml
FIC.8. Dtfllity dimfbutJon o{ normtlI hydrotin atoms O'itl Ihe tolumll (rOINtclion. ewv, J uprut1lU Ihe moment .( ml
"lltf (""ttll onu' (md tU1'lt 2 IM moment 15 ml a/ltr CUllt1l1 onsu (mtlximum ("/I,nt).
Tsuchida et a1. (17l applied fluorescence spectroscopy to measure
the electron density in a low density magnetized plasma. They
observed the intensity ratio of laser- to collision-induced
fluorescence and deduced n using the rate coefficient shown in e
the figure.
L.prob. lonr
~~'IH"
~iKllorQ e teQk!tl
f'lo. 1--Scbemulc dflMn, oe TP[).mlchlne, .hkll can produot helium pluml 0( 11,: JOII-IJ PII-' and r. _ lC"nlcV. Thedycluer llMi thedclo.tl.ll,lll1cm ol'lbc lIuoresoOenotl
Ife ICI II IM pon I.
.. , :"
T. ItVl
-TbeonIiW IIlCood!iciaItlor tllc HI()'I' .... )'DI~ u&allct it-..1rii1l. """-
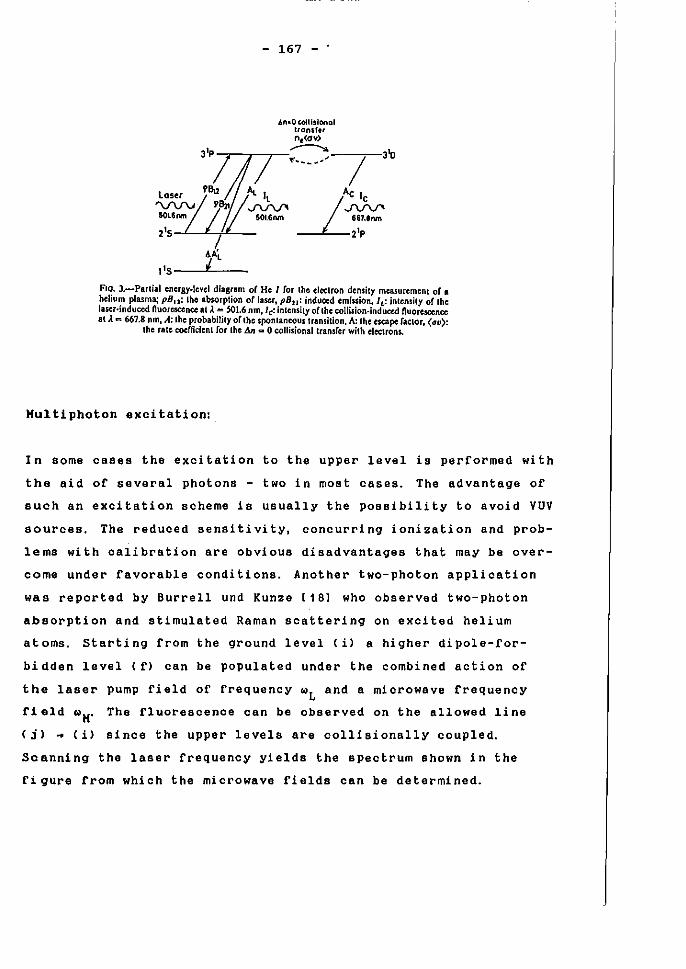
- 167 - .
IIn-OcolllslOtlal IronSf,r n,(av)
3' • ....,.-"T"-.-.~--/-,-3'O
lQs~r VBu ~ Il AC le '\fV\J Oß21 ..rv\/' 1..rv\/'
SOL6nrn SOl.6nm 667.lnm
215 21p
V: , L "5---'-'----
FI~. J.-Parlial energy·level dia~lm of He 1 (or thc clcclron dcnsil)' mcasurcmcnt of • hehu':'l plasma; pB I1 : thc absorpllon of laser, pBll: induocd emission. I,.: intensil)' of thc lascr·mduocd ftuorcscenct 81 A = 501.6 ßm,le: inlcnsh)' ollhc collision-induccd tluorcsoencc 81 A ... 667.8 nm, A: thc probabililY orlhc sponlancous transition, A: thc escape (aclor, (170):
thc rale cocfficlcnl for thc An ... 0 collisional Iransfer wilh clcclrons.
Hultiphoton exaitation:
In some cases the excitation to the upper level is performed with
the aid of several photons - two in most cases. The advantage of
Buch an exaitation scheme is usually the possibility to avoid VUV
sourees. The reduced sensitivity, concurrinq ionization and prob
lems with ca1ibration are obvioU8 disadvantaqes that may be over
come under favorable conditions. Another two-photon application
was reported by Burrell und Kunze 1181 who observed two-photon
absorption and stimulated Raman scatterinq on excited helium
atoms. Starting from the ground level (i) a higher dipole-for
bidden level (f) aan be populated under the combined action of
the laser pump field of frequency wL
and a microwave frequency
fi eld The fluorescence can be observed on the allowed 1ine
( j) ~ sinae the upper levels are aollisionally aoupled.
Scanning the laser frequenay yields the speatrum shown in the
figura from which the microwave fields can be determined.
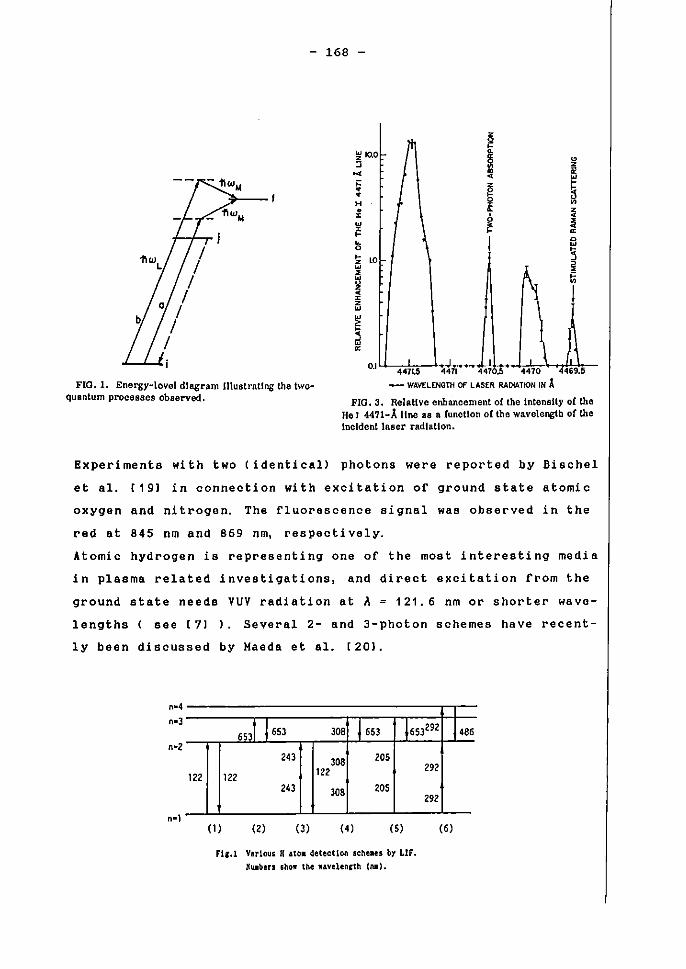
- 168 -
z
~ 10.0 ~ ...
r " ~ ~ ~ ~
m ~ • w ;: • • H
~ § ~ ~
• " W
~ ~ 0 ~ LO z w • w u z • " z
~ z
~ • ~ ~
j 0 w
5
~ i ~ j
w
~ " w ~
0.1 , \
4471.5 4471 "1470.5 4470 -4469.5 I
Fra. 1. Energy~level dlagram Ulustratlng the two~ quantum proceSS8S observed.
- WAVELENGTH OF LASER RADIATION IN .l FIG.3. Relative enhancement or the Intensity of the
He I 4471-Allno 88 a luncUon of the wavelengtb of the lneldent laser radiation.
Experiments with two (identical) photons were reported by Bischel
et a1. (19) in connection wi th exoi tation of ground state atomic
oxygen and nitrogen. The fluorescence signal was observed in the
red at 845 nm and 869 nm, respectively.
Atornie hydrogen i8 representing one of the most interesting media
in plasma related investigations, and direct excitation from the
ground state needs VUV radiation at 1\ = 121.6 nm or shorter wave-
lengths see [7J ). Several 2- and 3-photon schemes have recent-
ly been di scussed by Haeda et al. (201.
n-4
n-3
n-2
122 122
(1 )
6531 )653
243
243
(2)
30B )653
30B 205 122
30B 205
(3) (4)
1653292
292
292
(5)
FII.l Varlous H "to. detecUon sehe.es by UF. NUlben sholl' the 1I&velencth (tIII).
)4B6
(6)
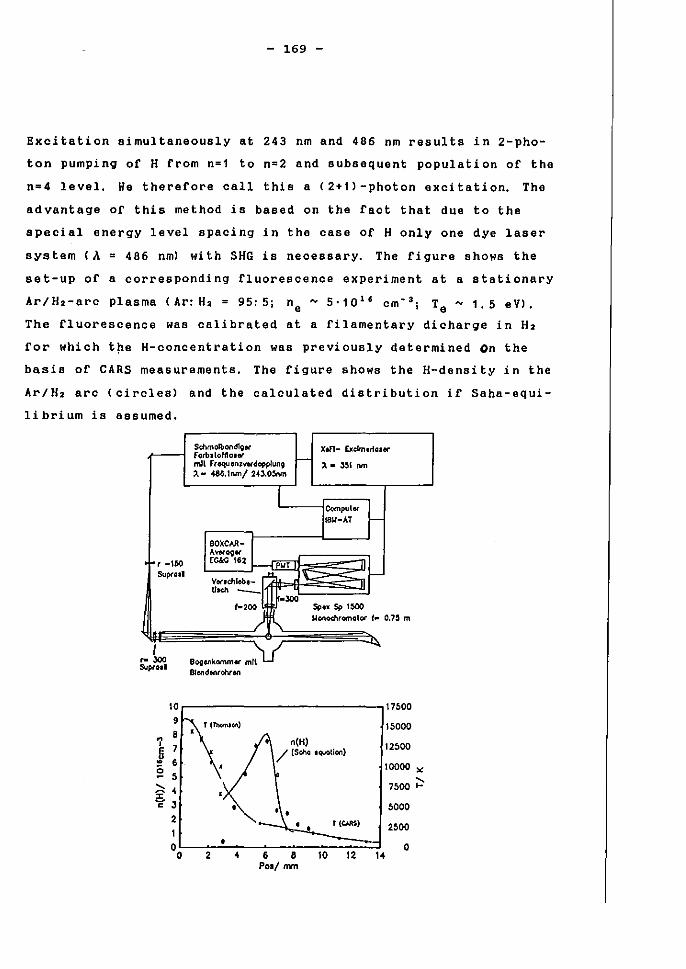
- 169 -
Excitation simultaneously at 243 nrn end 486 nm results in 2-pho
ton pumpinq of H from n=l to n=2 and subsequent population of the
n=4 level. He therefore call this a C 2+1) -photon excitation. The
advantaqe of this method is based on the fact that due to the
special energy level spacing in the ease of H only one dye laser
system CA = 486 nm) with SHG is necessary. The fiqure shows the
set-up of a corresponding fluorescence experiment at a stationary
Ar/H2-arc plasma (Ar: H2 = 95: Si Oe ,., 5'10 16 cm~3i Te A" 1.5 eV).
The fluorescence waa calibrated at a filamentary dicharge in H2
ror which t~e H-concentration was previously determined On the
basis of CARS measurements. The figure shows the H-density in the
Ar/H2 are (cireles) and the calculated distribution ir Saha-equi-
librium is BSBumed.
, -150 SuptClsl
I ~ lOO SUpro"
" , ti • ;;
..... g c
10
7
6
5
• J
2 1 0
0
Scllmolbond1~er forb.loMa.er f---mll frequlnzvetdopp!un\l ,. .. 4M.lnm/ 243.05nm
I
BOXCAA-"veroger EG&Cl 162 pur
Vendllobe- ~ u,'" - ,.-
1-'00 J-lOO
B09tnkGlTlm« mIt Bfondonrolvon
nCH)
Xofl- [xelm,rlCllOr
"-35IM1
Compul6f tall-AT I-
f---
Spu 59 1500 tAOIIochrCltnCllot t- O.7~ m
...
17500
15000
/ (ScI\Q 'QIJO(ion) 12500
10000 :.:
7500 ;::-
5000 , (WtS) 2500
• 0 2 • 6 8 10 12 ..
Post nvn
- 170 -
Referenoes:
[11 P. Boqen and E. Hint2: "Plasma Edqe Diaqnostics Usinq
Optical Methods" in: "Ph.sics oe Plasma-Hall Interactions
in Controlled Fusion", D. E. Post and R. Behrisch. ade.
Plenum Publishinq Corp., 1986.
[21 A. Unsöld: "Physik der sternatmosphären", 2nd ed.
Springer Verlag Berlin, 1968; pg. 177
[ 31 C. M. Penne.: J. opt. Soo. Amer 59 (1969) 34
(4] A. Elbern: IIExperimentelle Untersuchungen zum Nachweis von
metallischen Verunreinigungen in Plasmen mittels der
Fluoreszenzspektroskopie"
Thesi B 1977, Ruhr Uni versi tät Bochum, Fed. Rep. Germany.
(51 H. C. Heng: ItUntersuchung der Diffusion von laser-erzeugten
Verunreinigungsatomen in einem Plasma mittels
Resonanzfluoreszenz"
Thesis 1977, Ruhr Universität Bochuffi, Fed. Rep. Germany.
[61 H. F. Döbele, H. Röwekamp .nd B. RUckle:
J. Nul. Mater. 128 & 129 (1984) 986
[7] P. Bogen: "Dye lasers, frequency conversion and laser
induced fluorescence" in:
Workshop on Plasma and Laser Technology,
Cairo, Feb. 16-26, 1987; E. Hint2, ed.
International Bureau KFA JUlich 1987.
- 171 -
[81 F. K. Kneubüh1 and H.II. Sigrist: "Laser", Teubner 1988
[91 Lambda Physik Göttingen: Technica1 information
[101 V. Schul2-von der Gathen et a1.: IEEE J. Quant. E1ectron.,
to appear in april 1990
[ 111
[ 1 21
[ 1 31
[ 1 41
[ 151
[ 1 61
[ 1 71
[ 1 81
[ 1 91
( 201
B. Schweer and H. L. Bay: App1. Phys. A29 (1982) 53
Ph. Hertens and P. Bogen: App1. Phys. A43 (1987) 197
H. Röwekamp, A. Goehli ch and H. F. Döbelo, to be pub li shed
E. Dullni et al.: Phys. Lett. 88A (19821 40
Schweer et a1.: J. Nuc1. Hater. 111 & 112 (19821 71
G. T. Razdobarin et a1.: Nuclear Fusion 19 (1979) 1439
K. Tsuchida et a1.: Plasma Phys. 25 (19831 991
C. F. Burrell and H. -J. Kunze: Phys. Rev. Lett. 29 (19721 1445
11. K. Bischel et al.: App1. Opt. 21 (19821 1419
H. Haeda et a1.: Proc. 4th Intern Symp. on Laser-aided
Plasma Diagnostics, Fukuoka (JAPAN) Nov. 20-23, 1989.
(211 V. Schul2-von der Gathen et a1.: To be published
- 172 -
Microwave Diagnostics
H. Schlüler
Institute ofExperimental Physics Ruhr-University Bochum, FRG
- 173 -
Mlcro'Wave DJ.agnostics
1. Introductlon
Mlcrowave dlagnoatlcs are part of a large tleld employlng electromagnetlc waves tor
non-obstruslve dlagnoat1cs. These waves are transmitted trom the outside Into the
plasma wlth an Intenslty vlrtualLy not alCecting the plasma propertlss. The
speclalJzatlon to vaccum wavelengths In the mm and em fange 18 duo to pragmatlc
rassons; In thls range Borns methods are weIl appllcable to plasmas of practlcsl In
trast. The underlylng laws are valid tor a much 18rger range of electromslnetlc
waV9S; a good example 19 the mlcrowave Interterometry, obvlouSly related to Intor
terometry In the optleat range, though usuelly addresslng different parameter
ranges.
There are also some slmllarltles between mlcrowave dlagnostles and laser dlagnos
tlcs and spectroseoPYj however. In the ease or mlerowave dlagnostlc~ atomle pro
ces ses are usuelly or no pertleular Importanee.
2. Fundamentals of Wave Propagation In the Absence or StaUe Magnetle Flelds
Onry electrons (mass m. charge -e) are taken Into aeeount. Wlth the usual no
tations the equatlon of motion ylelds
d' x m·-- "" - e·E
dt'
where E S exp(l.w.t). Thls will lead to
x • --·E m·w2
- 174 -
and the current denslty 18 (N = stectron denMty)
j
Thera 18 a phase shltt hetwssß J and E. A conductlvlty a can be detlned
In vlew or the structure of the Maxwelllan equatlons (where J + Eo·E show up),
ane Is Induced to deflne 8 dlelectrlc constant :
"h CI" Eo + i~W
Thus wlth the expression of 0':
, 1 - ...!..:..! h oll!
The plasma frequency 18 derlnad 89
-) _~[ N·.' ] Wp - -molo
wlth N In m·3. Consequently the refrsctJve Index reads
1 _ Wpl ] ;;;0
Wlth glven frequency wend Incraaelng danstt)' N .., Wp2 the reCractlve Index
turns out to be tlnally pureI)' Imaglnary from a crltlcal danaUy Ncrlt upwards:
No r l' m· eo w'·--.' = L2.10U (..L)2 m_a
GHz
E,g. for a frequenc)" cf t = 10 GHz (wh Ich 15 about 3 cm wavelength) the crltlcal
danstty Is
Nerl' =s 1.2.1018 m- 3 1.2.1011 cm- 3
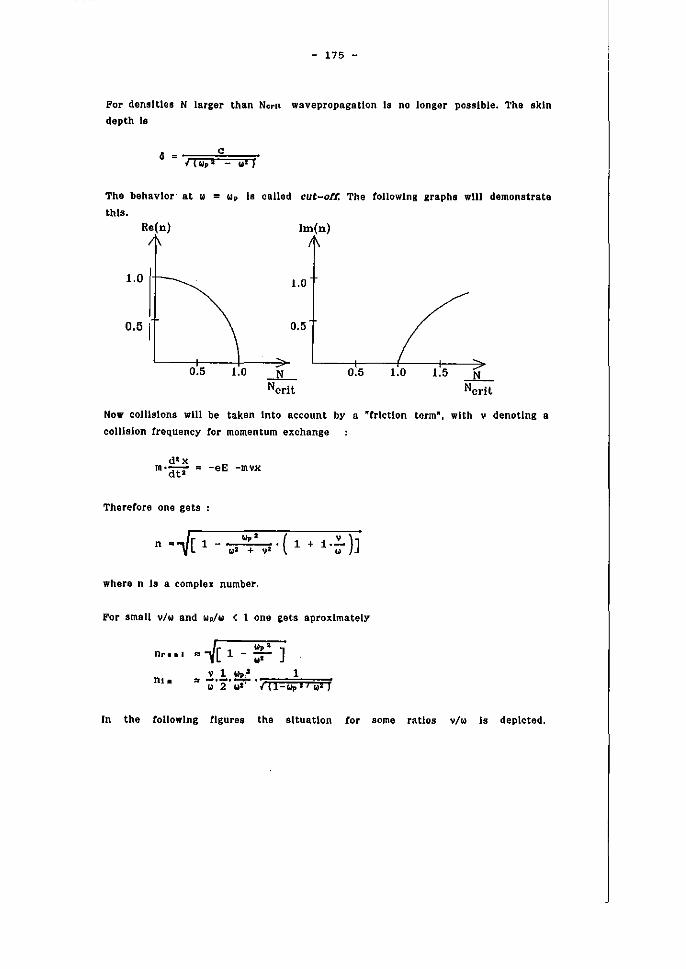
- 175 -
For densltles N larger than Nerlt wavepropagatlon ls 00 longer posslble. The skIn
depth ls
c .((Wpi-Wi)
The behavlor at w = Wp 18 called cut-ou. The tollowlng graphs wlll demonstrate
thls. Re(n) Im(n)
1.0 1.0
0.5 0.5
0.5 1.0 _N_ 0.5 1.0 1.5 _N_ Ncrit Ncrit
Now 001l1810n8 wlll be taken loto account by a "frletton term·, wlth " denotlng B
colllsion trequency tor momentum exchange
-eE -mvx
Therefore one gets
.... ' • ( y ) 1 + i.-;:- ] Co)2 + ,,2 w
wher8 n 18 a complex number.
For srnBll vlw Bnd wp/w < 1 one gets aproxlmatelY
ßr •• I " ..J[ 1 - :: ' ]
V!Wp,i 1 :I -:'2' 7 '., tI-Wp iI w2 )
0,.
In the tollowlng tJgures the sItuation tor some ratlos vlw 15 deplcted.
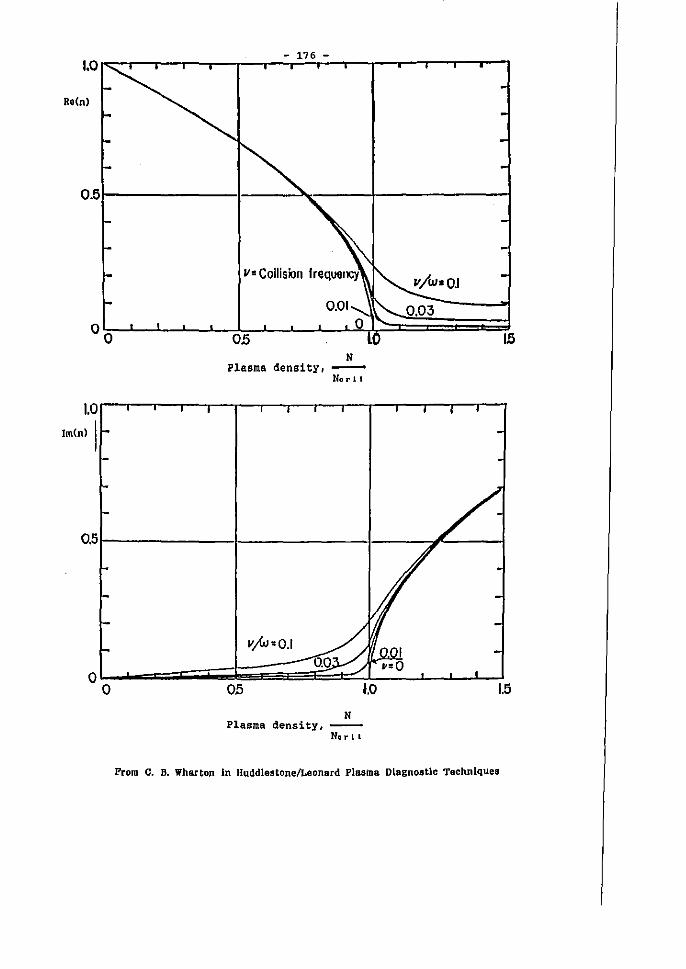
Re(n)
O.5t-------I---~;:__-_t-----_t
05 o 15 N
Plasma density, Ne r 11
1.0 r--.--r---...-,,-,.--.---r--r-,--.--r--r-,,--.,---'
Im(n) I
O.51--------~-------I---~'---_l
v;W = 0.1
N Plasma density, -
Nor I I
From C. B. Wharton in HuddlestonelLeonard Plasma Dlagnostlc Technlques
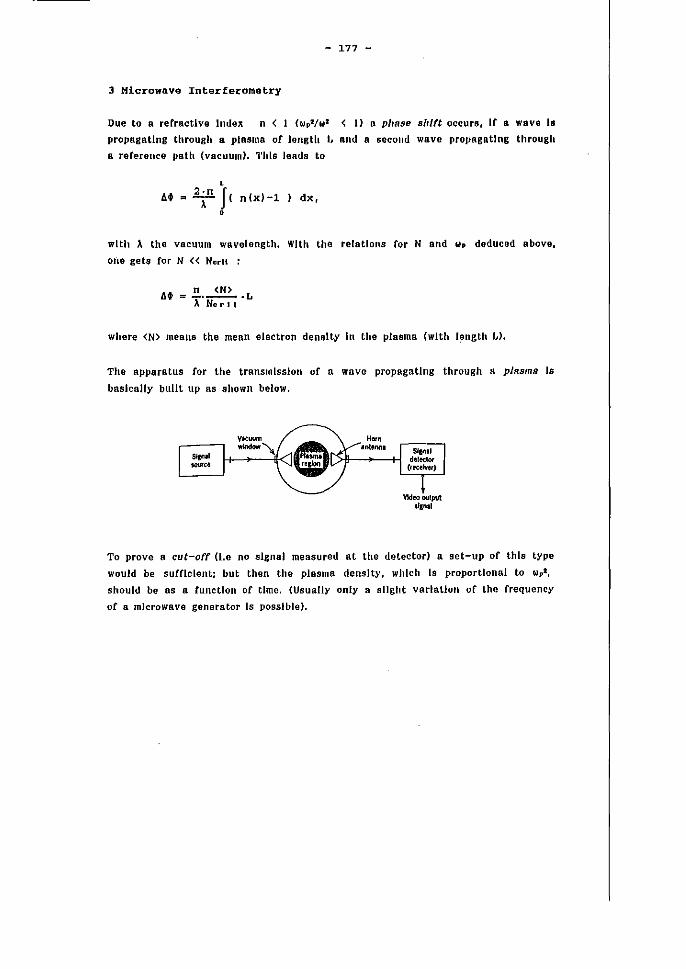
- 177 -
J Hicrowave Interferometry
Due to a refractlve Index n < 1 (c,,J p2/w l < 1) Q phase s/llft occurs, It a WQve 18
prapagatlng through a plasma ot 1ength L arid a eecolld wave propagatlng through
a reCerence path (vacuum). 1'hls leads to
, M = \n J( n(x)-l ) dx •
•
wlth A tha vacuum wavelength. Wlth the relations tor N and Wp deduced above,
ane gets Cor N «Ncrll :
dt = !!.~.L A Ncr I I
where <N> meane tha me an electron denslty In the plasma (wlth length L).
The apparatus for the transmission of a wave propagatlng through a plasma Is
baslcally buHt up RS shown below.
Vldeooutpul: s!snll
To prove R cut-off (l.e no sIgnal measured at the detector) a set-up of thls type
would be suCflclent; but then the plBsma denslty. whlch Is proportional to wpt,
should be as a Cunctlon of time. (UsuallY only a sllght variation of tha Crequency
ot a mlcrOW9ve generator ls posslble).
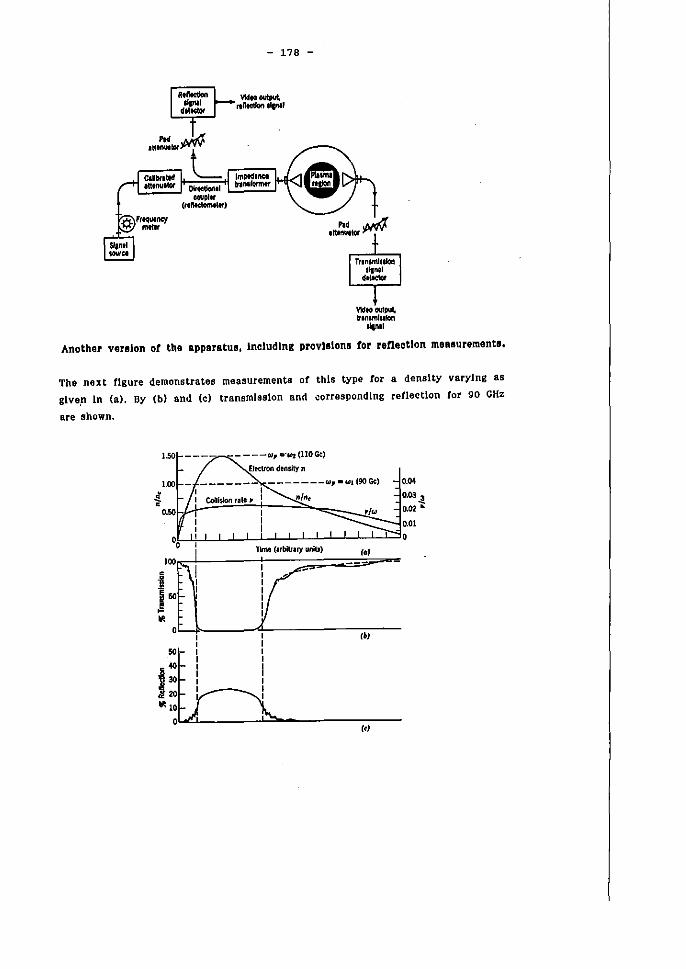
Slant'
"""
- 178 -
". .. ..,.., rtRtctlon -'&MI
,·:::. .. #fi!oL ~ __ C&lbnltd ImPtdlllC1 1lttnVI!ot ow.etIcnl' trlnllotrntf
eovpl., (nfltctomlttf)
"' ......... trlnlml .. 1On
'.'", Another venlan of tha apparatuR, Includlng provIsions tor reßectlon meallurementa,
The nex t figure demonstrates measurements of thls type tor a denalty varylng as
glve,n In (a). By (b) and (c) transmission Bnd ~orr9spondlng retlectlon tor 90 GHz
are shown.
,.50 _ ---w, "'''-'l(llOGe)
E1&ctton density n
------- _______ w, _1011 (90 Ge) ~ .. n/ne .... .1.
'I" 0.02 .. , , 0.01
00 , 0 I , Time (ubltrllY unllJ) (.,
!TI 7-- ---:=.--
I I '" , , " I I , I j: I I ,
I , , , I I
"" 0 ("
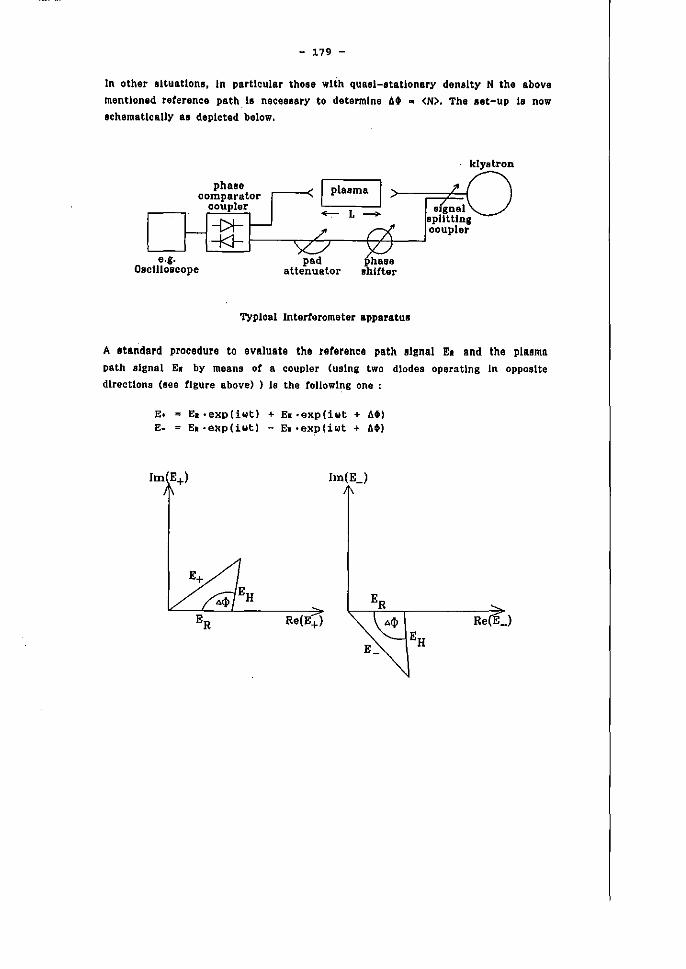
- 179 -
In other situations, In partlcular those wlth qUBs!-atatlonBry danslt)" N the above mentloned reterence path _18 nece8sary
IlIchematlc:ally as deplcted below.
phase comparator
coupler
to determlne 6. l1li <N>. Tha set-up 18 now
plasma
e.g. Osctlloscope
pad attenuator
phase ahifter
Typleal Interferometer apparatus
A I!ItRndard procedure to avaluBte the reterence path signal E. and the plasma. path signal E. by maans ot a coupler (uslng two dlodes operating In oppos1te
dlrectlons (see flgure above) ) 18 the tollowlng one :
EI E. ·exp(iwt) + E. ·exp(iwt + .6..) E- E. ·exp(iwt) - E. ·exp(iwt + At)
E

- 180 -
Therefora one gets
lEt pi '" Eil + Eil + 2·E. ·ER 'cos(641) JE.jl "" Eil + Eil - 2·EI·ER 'cos(641)
In general Eil » Eil 18 true. Expandlng the square root of the expresslon8
above Into apower lIerles leads to
IE'.-I " E. ± E, ·cos(bf)
Thu8 for the voltages :
Ut.~ = U(E.) ± U(ER·cos(b.41»
If one takes the output signal U" = Ut - U. one gets a voltage proportlonal to
<:os(.641). Thus U" = Uo·cos(b.." where Uo 18 lts amplltude. (Th18 19 true tor the
llnear regIon of the of the dIode characterlstlcs.)
Usually the phase shlCter 18 adJusted to a phase of 6(10 = n/2 In absence of the
plasma, so that U... = O. When the plasma 18 lnserted one gets :
u. Uo ·cos (.!!. + 6.) 2
Uo·sin(6.)
Therefore the mean denslty Is gIven by:
<N> A.Ncrll........ A·Norlt . (u. n.L LI'I' = n.L ·arCSl,n Uo
UA~ ______ ~~~ __________________________ UO
~----------~----------~6~
L-----------------------~--~--------Uo
- 181 -
The measurlng procedure could be (e.g:) :
- Adjust U" => 0 In absence of the plasma.
- Usa the phase shltter to scan a voltage curve In order to eval
uate Uo.
In case of accurate performance Bpproximately 1/100 of NcrH Is measurable.
To lIlustrate thls, take tor example a frequency ot 10 GHz, ). = 3 cm and a plasma
length L = 6 cm. This wIll lead to a crltIcal danalty Ncrn = I.2·10 L2 cm-3• Ir N =
1.2.1011 cm-3 , whleh Is NcrH/I0, and A~ = 0.1·20, thls would me an <N> In the
range of some 1010 cm-3 up to 1012 cm-3•
Uslng an 8 mrn mlcrowave everythlng wlll be 14 tImes higher, uslng a 4 mm mlcro
wave everythlng wlll be agaln 4 tlmes higher. Note, that
L 1 A~ «"I'fa « L,).
A dUrerent procedure to evaluate MI uses an additional unlt whlch provldes a
phase shirt oe 0/2, Theretore one gets eos(AtlI) and sln(AtII), 80 that Uo 18 not
neoded.
In ease of large L phase shltts larger than 20 may hava to ba taken Into account.
In partIcular tor time depandent densltles thls multiple phase shltts can weIl be
observed.
The naxt flgure shows a detalled arrangement lneludlng provisions tor ratlectlon
measurements.
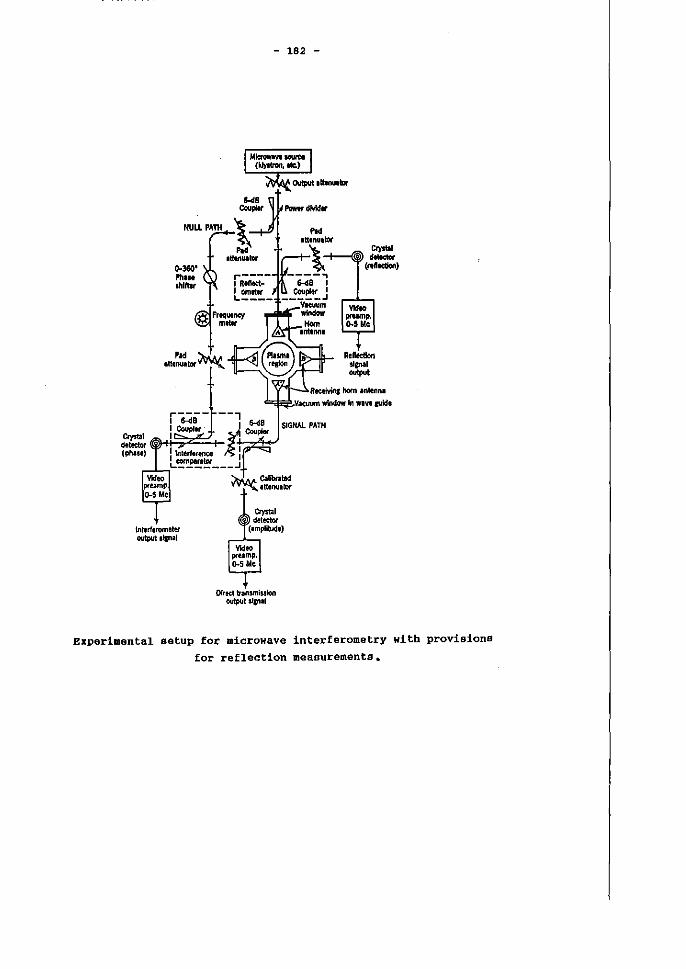
Inlerferometer output ,!pal
- 182 -
NULL PATlf
OIrKl transmission output "&nIl
SlGlW. PATli
Experimental setup for microwave interferometry with provisions
for reflection meaourements.
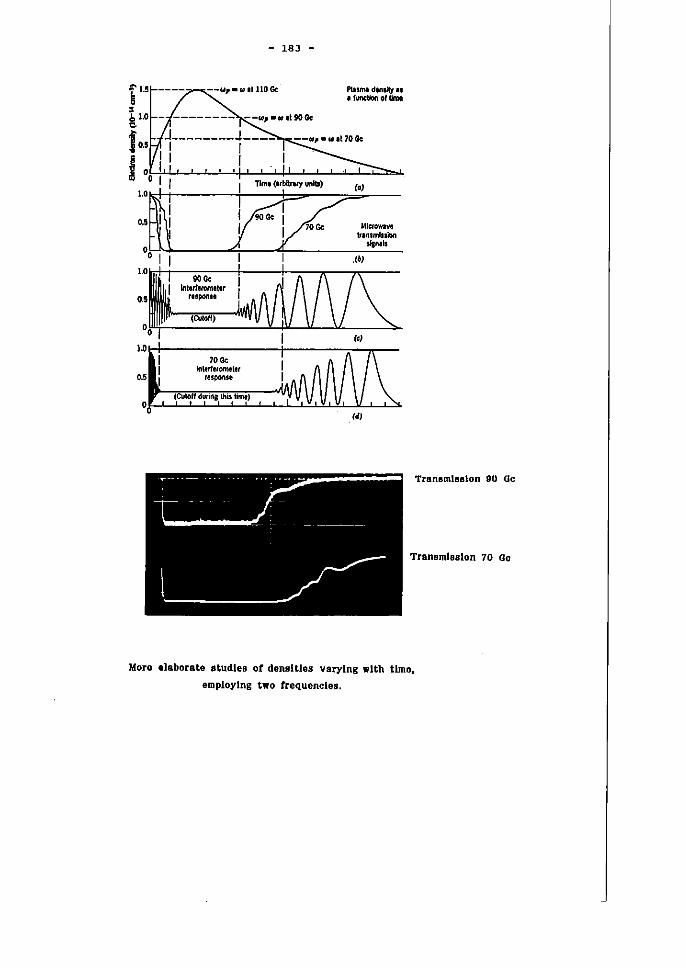
- 183 -
b I·'II--·-·--.r""",~-o,. w .1110 Ge
~ Ibl--i---·-----"1-,-0' •• ,190"
Plutnl d.nli!y .. • fundlon 01 timt
f J
ti~-·_-·_-·_---~---·-"'~~'·,·O"'O"
1.0
0.'
0.5
00
'0 .. Inlm"omelet
response
(CUtoff dwinllhis time)
C')
.. ".". lr.nsmlnlOn
111""1
Transmission 90 Oe
Transmission 70 Ge
More elaborate atudJes 01 densltles varylng wlth time,
employlng two trequencles.
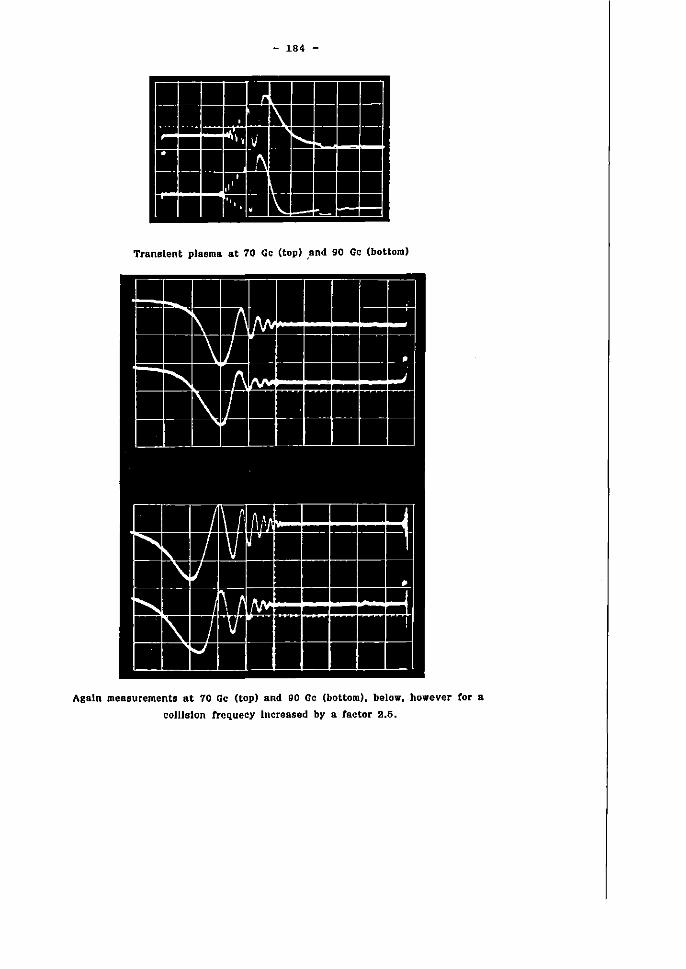
- 184 -
f.i • I~ - , ioIl\ • V ... !!!!!.
g , ,,' " .-: ::.=i
" , 11 11 ·
Translent plasma at 70 Ge (top) ,and 90 Ge (bottom)
I fj ~ • ~ • ~ & ~ ....
• r'J
r~ llJj1 I ·, ~ ~ rJ ß ~
lI1 ~ • ~ 11. fi l'I 11
&:.I •• I l!J !
i::t
Agaln measurements at 70 Ge (top) and 90 Ge CboUom), below, however tor a
eoJIIslon frequeey Inereased by a factor 2.6.
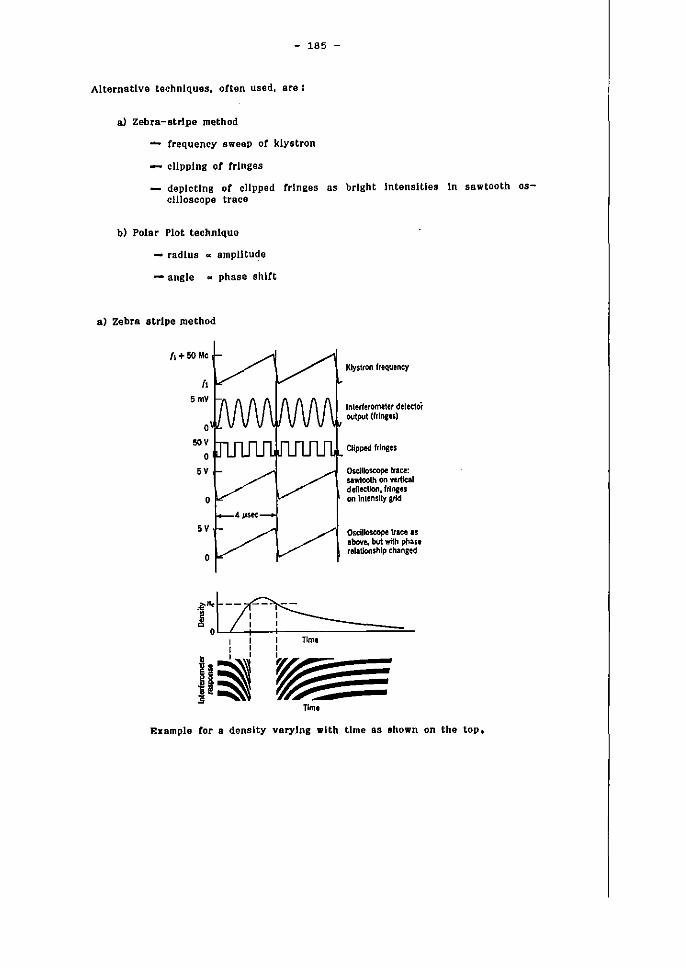
- 185 -
Alternative technlques, often used, are:
a) Zebra-strlpe method
frequency sweep of klystron
cllpplng of frlnges
deplctlng of cllpped (ringes as brlght Intensltles In sawtooth oscllloscope trace
b) Polar Plot technlque
- radius CI{ ampUtu~e
- angle .. phase shirt
a) Zebra atrJpe method
o 50V
o 'V
'V o
Klystron frequeney
Interferometer detector OU'Iput «(ringes)
Clipped frlnses
Osdlloscope trace: Ulwtoolh on vertlcal deflecUon, frlnges on Inlenslly grld
Oscilloscope lIaee .5 aboYe. bvt wtlh phase relationship changed
Example tor 8 denslty varylng .lth time aB ahown on the tOPt
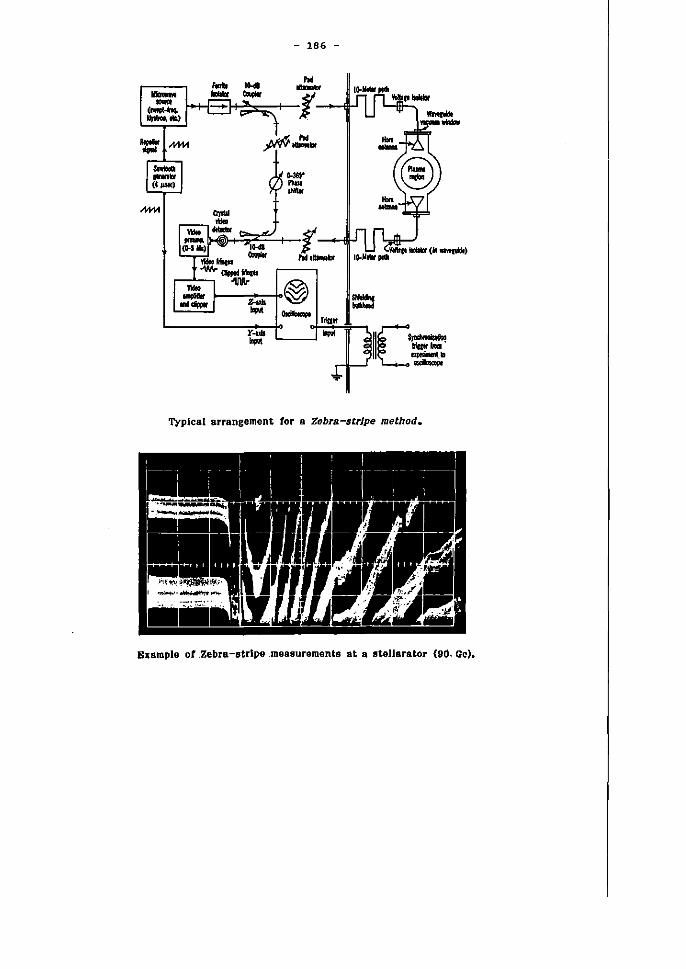
-""- -.... (lIfI'I.-fnII. _oto.l
- 186 -
..... -.." ..... --lo@ c.::=::..J ... __ ,,,,,.
Y-uls ... '--_...J .... lIeg
Typtesl arrangement lor a Zebra-strlpe method.
Eumple 01 .Zebra-strlpe .measurements at a stelJarator (90, Ge).
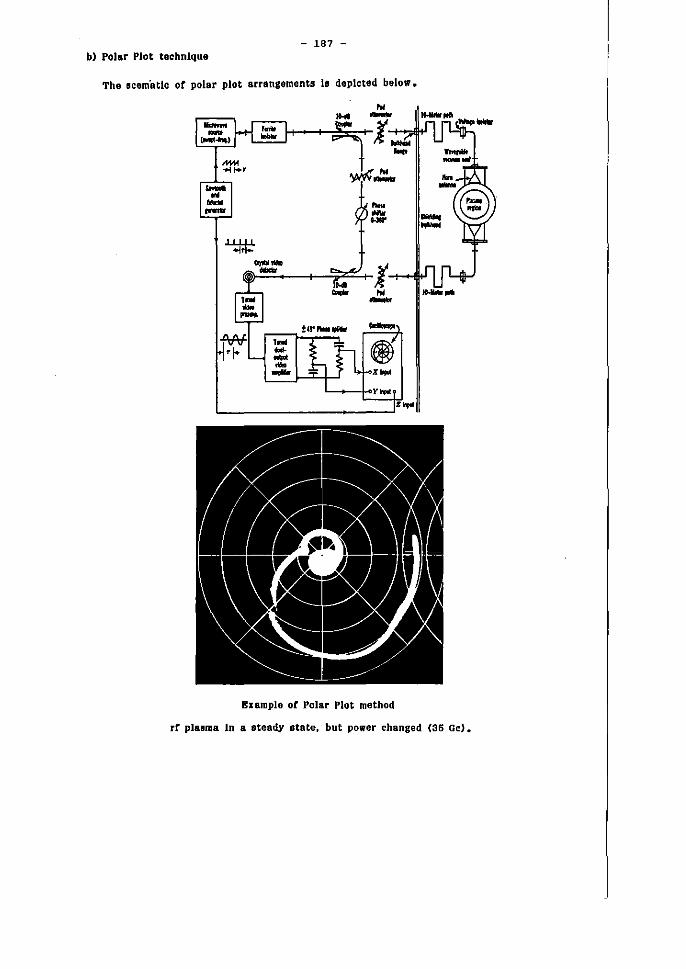
- 187 -b) Polar Plot technlque
The IIcematlc ot polar plot arrangements 18 deplcted balaw.
--~ _ ... ~-::...----+-.::;;:z::::."-t- )j~ ,.. Je -- '" .......... --
Example ot Polar Plot method
rt plasma In a steady state. but power changed (36 Ge).
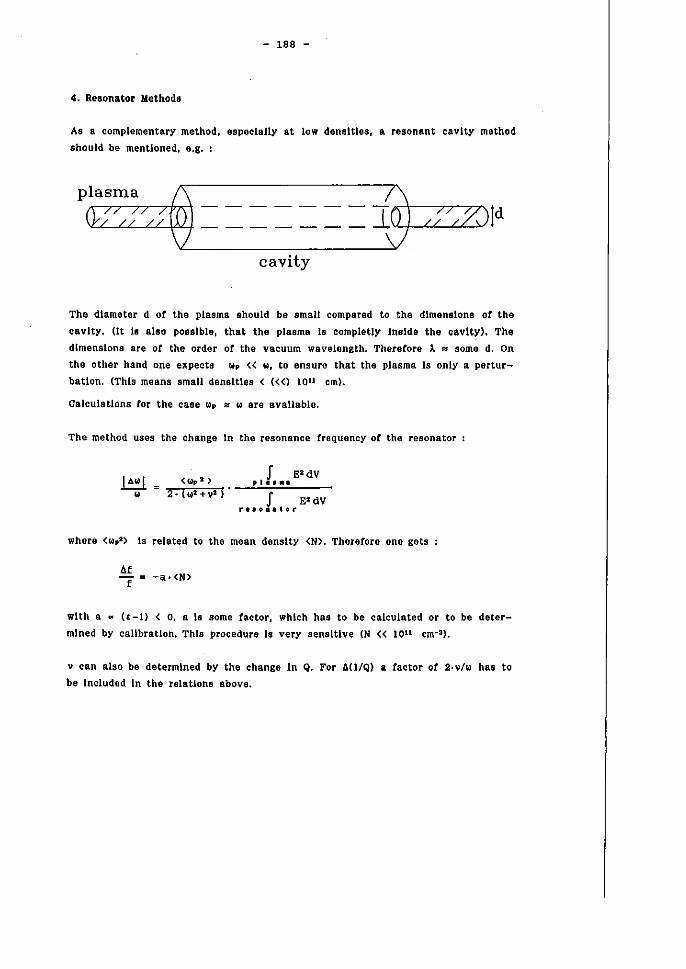
- 188 -
4. Resonator Methods
As a complementary method, 8spocially at low densltles, a reaonant eavlty method
should be mentloned, s.g. :
cavity
The diameter d or the plasma should be small compared to the dimensions or the
cavlty. (It Is also posslble, that the plasma is completly inside the cavlty). The
dimensions are or the order of the vaeuum waveiongth. Thererore ,. =:: some d. On
the other hand one expects Wp « w, to ensure that the plasma is only a pertur
bation. (Thls means sm all densltles < «() 1011 cm).
Calculatlons ror the case wp :: ware avallable.
The method uses the change In the resonance frsquaney of the resonator
J E'dV pi ••••
J E'dV 1' •• 0.1101'
where <W p2> Is related to the mean denslty <N>. Therefore one gets
6f f
-a· <N>
wlth a ... (t-1) < O. a Is some factor, whleh has to be calculated or to be deter
mlned by callbratlon. Thls procedure Is ver)' sensitive (N « lall cm-3).
v can also be determlned by the change in Q. For 6U/Q) a factor of 2· v/w has to
be Included In the relations above.
- 189 -
The equatlon above, expresslng the ratio At/f, can be modltled In a WB)' that It
can be ueed tor the eaee 80 .. 0 ae weil.
The range of applleo.blUty can be eetImated BS follows :
The measurable N.11l 18 approzlmatel), glven by
N.I Il = No r I t -0-
where Q Is of the order 104•
The extension ot the resonator method to pllJsmlJ-wlJvegulde-systems 18 posslble.
6. Eztenslon to the eal. ot 50 .. 0
a) Wave propagation
In case of a staUc magnetlc neid 80 'I< 0 the dlelectrle eonstant becomes a
tensor. The problem 1s anisotropie. One gat9 different pOSSlbllltles; especlally
the dlrectlon of the wave propagation (~.> In relation to !!o Is Imp'ortant.
Instead of the simple equaUon
N' 1 -
one obtalns
In the ease of k 11 Ro. In thl8 equatlon w. = (e/m).Bo 19 the electron cyelotron frequency.
Generally It 18 Important to Inelude the efteets ot the wave on the Ions In
the plasma. Therefore another term haB to be Ineluded. Thls haB to be a term
In whleh wp haB to be eJ:changed wlth Wpl (which Includes the Ion mau), and
w. has to be roplaced by -WI.
- 190 -
There are two clrcular polarlzed wavell propalatln& In the dlrectlon ot 10 (elreulatlng eloekwille and the other way round), But tor hllh frequenele.
w»w. the equatlon
Wpl NI AI 1 - -
W'
remalns a goad approximation.
1t k. 11 ~o Is not tultllled, the situatlon gets even more compllcated. In case of (the practlcQl1y Important) case oe k. .L ~o one gets :
1l11.L!!o
- ~xtraordlnary elllptlcally polarlzed wave.
- P.or w » w. the above mentloned results Are atlll valid.
11) ~ 11 !!.
- Ordlnary WBve wlth N2 = 1 - Wp2/W2 whlch Is not attected by 80 tor
Bny w I
Thls means there are always two "electromagnetlc· Ylaves p08slble, whlch
behave dltferently accordlng to the dlrectlon of thelr propagation.
The Ineluslon of thermal etrects brlngs only sllght changes. Ono gets two
additional types of waves (In rough approximation for f f. 0) :
electron plasma wave
wll =: ~'k2 + sinl (f),wI 2 m,
ion-acoustic wave
where " Is the angle between k and !!o.
The exaet treatment of thermal ettects (klnetlc theory) would lead to harmo
nies or the cyelotron trequeneles w.. WI a9 weil.
Additional dlagnostlc methods are not dlseussed here.
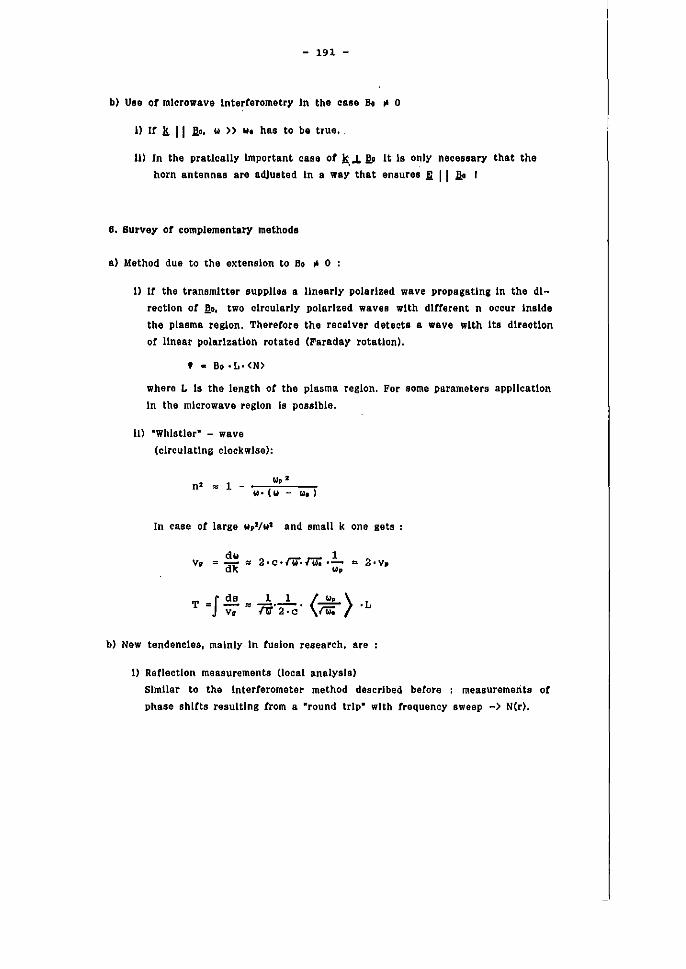
- 191 -
b) Use of mlerowave Interferometry In the esse Bo ,. 0
l) If k 11 Ro. w » w. has to ba true.
11) In the pratleally Important ease of k . .L I!,o It Is only necessary that the
horn antennas are adjuated In a way that enaures ! 11 Ao r
6. Survey of eomplementary methods
a) Method due to the extension to Bo ,. 0 :
l) Ir the transmitter suppUes a Unearly polarlzed wave propagatlng In the dl
raetlon of Ro. two elreularly pOlarlzed waves wlth different n oecur Inside
the plasma region. Therefore the receiver detects a wave wlth Its dlrectIon
of Unear polarlzatlon rotated (Faraday rotation).
'.Bo·L·(N)
where L Is tha length of tha plasma region. For some parameters appUeatlon
In the mlcrowava region la posslble.
11) ·Whlstler" - wave (clrculatlng eloekwlso):
In case of large wp2jw' and small k one gets :
dw 2.c.rw.rw; .L ::r. 2.vp v. =- := dk w.
T =I ~ = 1 1
<~ > ·L v. Ii"~'
b) New tendendes. malnly In fusion research. are
l) Reflectlon measurements (local analysis)
Slmllar to the Interferometer method descrlbed betore : measuremerits ot phase shltts resultlng trom a "round trip· wlth trequency sweep -) N(r).
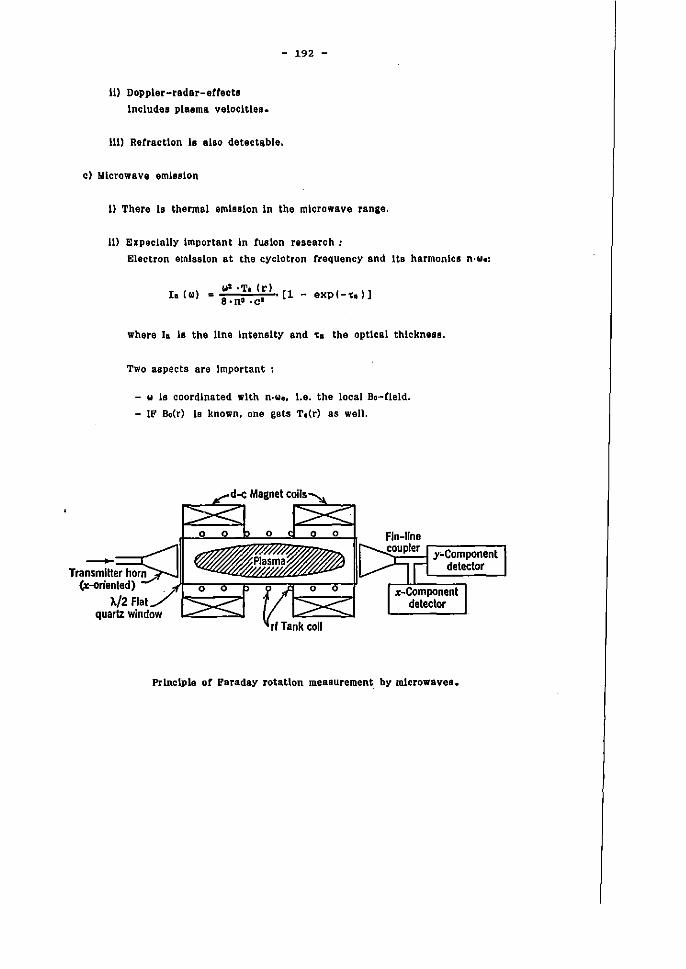
11) Doppler-radar-ettects
Includes plasma veloeitles.
- 192 -
Ull Retractlon 18 11so detectllble.
c) Mlcrowlve emission
1) There Is thermal emission In the mlcrowave range.
Il) Expeclally Important In tuslon research:
Elactron emission at the cyclotron trequency and Its harmonlcs n·w.:
II. (w) = WZ
·T. (r) • [1 _ exp(-'b)] 8 ·n' ·c l
where 11. Is the Une Intenslty and ''1:1. the optlcal thlckneu.
Two aspects are Important :
- w Is coordlnated wlth n·w., l.e. the loeal Bo-neld. - IF Bo(r) 19 known, one gets T,(r) as weil.
--"'''''':'''-1 y"Componenl del.etor
rflank coll
Prlnclple ot Faraday rotatlon measurement. by mItrowaves.
- 193 -
RatarenC8a
PIB8m'adlagnostics wlth mlcrowBvEls. M.A. "eald and e.B. Wharto,n.
John WUey. New York (1965)
V.E. Golant. MlcrowBve dlagnostlc technlque8,
SOy. Phyo. - Techn. Phy •. 6. 1191 (1961)
S.J. Buchsbaum. L. Mower anB S.O. Brown
InteractIon between cold plasmas and gulded electroffiagnetlc WBVOS,
Phys. FluIds 3. 806 (J 960)
- 194 -
Mass Spectroscopy
J. Winter
Institute of Plasma Physics Association EURATOM-KF A
Forschung,zentrum Jülich GmbH, FRG
- 195 -
Hass Spectroscopy
J. Wint(;!.r
Institut für Plasmaphysik, Forschungszentrum JUlich GmbH, Ass. EURATOM-KFA, P.O. Box 1913, 5170 JUlieh, FRG
1. The Hass Spectrometer
Mass spectroscopy in plasma processes 1s frequently used for the partial
pressure analysis to monitor the working gas cr for the measurement of gaseous reaction products formed in the plasma or by the interaction between the plasma and materials. Advanced systems also allow the measurement of non gaseous
erosion product, e.g. sputtered particles, or of ions formed in the plasma 1tself.
Hass spectrometers essentially incorporate three functional elements which
serve the
ion formation,
mass separation and ion detection.
For the real izati on of these requi rements a number of different techni ques can be used. The most commonly used instrument is the quadrupole mass spectrometer. which is discussed ·1n the following. It requ;res a vacuum better than 10-4 mbar for its reliable operation.
1.1 Ion formation
COlMlOnly used ion sources rely of the electron impact ionization of neutral atoms or molecules. Electrons are thermally emitted fram a cathode, accellerated in an electric field and traverse at an constant energy through the ion;zation volume of the ion source. Here, they ionize the neutral atoms or molecules according to the following scheme:
+ -A + 2e
AB + e- ~ AB+ + 2e
A++B+2e
A + B+ + 2e-
- 196 -
(atoms)
(molecules)
The tra~fer of kinetic energy from the electron onto the atom ;5 very small because of the large mass difference between the particles. Thus the ion has essentially the same kinetic energy as the neutral particle. The ionization of the neutrals starts at a certain electron energy (appearance potential) which
for atoms is equfvalent to the ionization energy. At high impact energy of the electrons, multiply charged ions may be formed.
The number N of ions which are created by an electron a10n9 a path of
length Land per second 1s given by
N=nxLxs.
n is the particle density in the ion1zation volume, L the path length of the electrons in the ionization volume and s the propability for ionization of an atom per unit 1 ength. s i s typ i ca 11 y of the order (1 - 30) x 1017 cm2sec. It
is important to note that the ionization rate is proportional to the particle density in the ionization volume. The quantitative evaluation of mass spectroscopi c 5 i gna 1 s requi res ei ther that the ions are in thermal equil i bri um with the surrounding vessel or that the velocity distribution of the ions is known.
Figure 1 shows the ionization yields of different gases as a function of the electron energy for apressure of 1 mbar at room temperature.
The collision of an electron with moleeules may lead to dissociative ionization in addition to the normal ionization, according to the scheme shown above. This fragmentation occurs the easier the larger a molecule is and the more atoms it contains. As a consequence of these processes the mass spectrum of large molecules becomes very complex and the identification of the parent
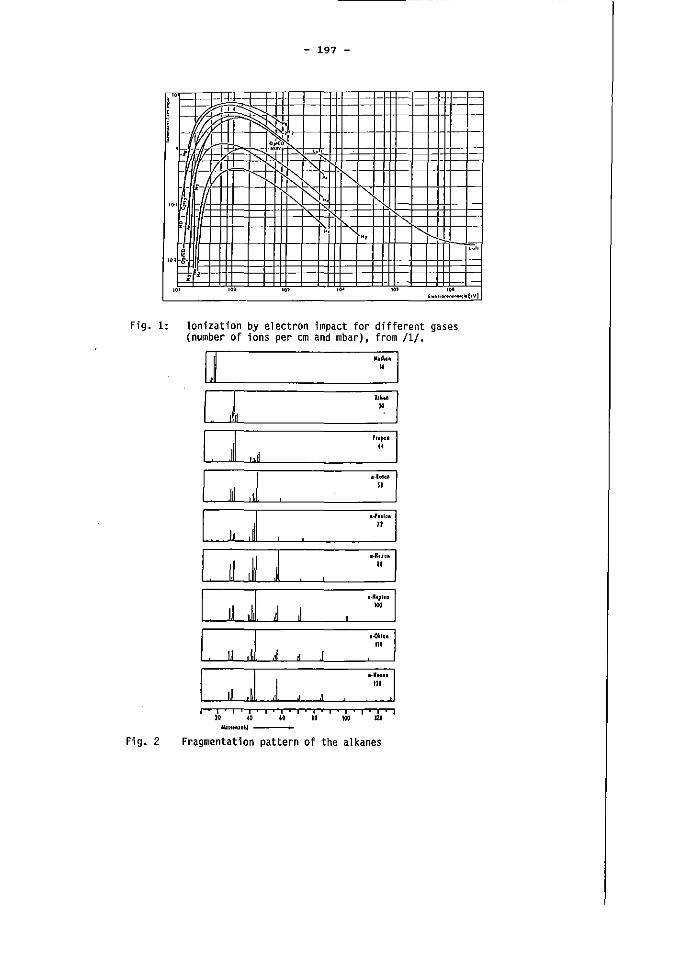
- 197 -
! - .,-1- - .. r-, r-~' " .::-.-
i ~ . - oJ;,o ,,, - I-r I'i-[
" ~R~ "" -
'" , .,
"' ". 10"' ,~_ ~'"
" ;
," ," '" ," ". '" h", .............. ~I·vl
Fig. 1: Ion;zation by electron impact for different gases (number of ions per cm and mbar), from /1/.
lL "~'I
I II~ "~~ I I, Il lid ":~'I
I 11I ",I "'~"I I 11 I ~I ";;"'1
I 1,1 I~I ,l ";;"1
I 1I I~I ,11 '"~"I I. u "I ,I "''''1 ,
n,
I 1I ,tl ,J ··· .. ·1 '" , , I' i • I I' I • , , • , ' I ' I
" .. " " '" .. ",."","1>1 ___
Fig. 2 Fragmentation pattern of the alkanes
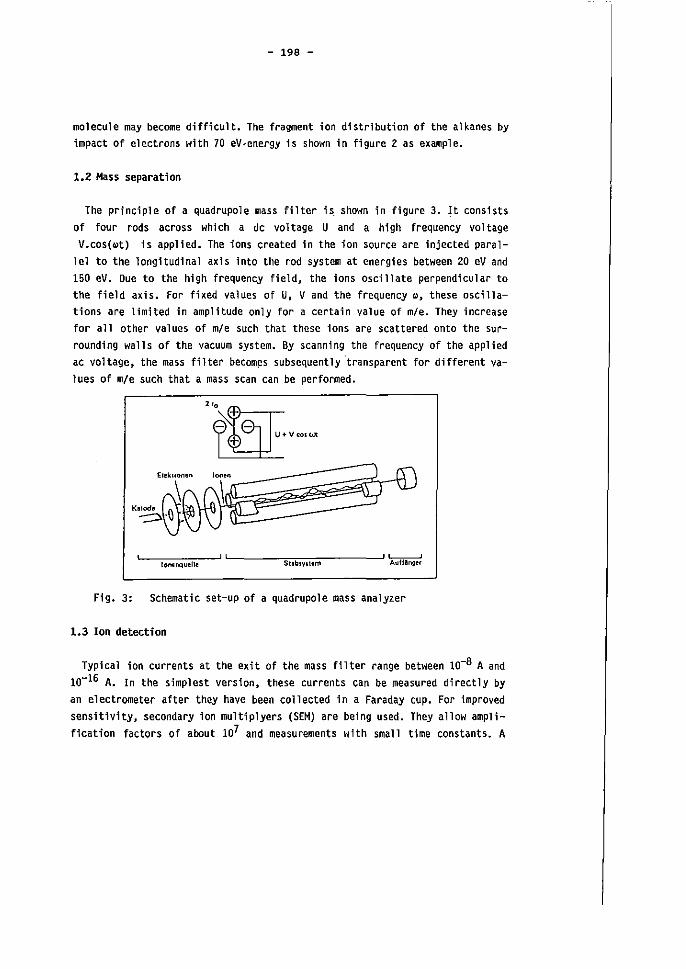
- 198 -
moleeule may become difficult. The fragment ion distribution of the alkanes by impact of electrons with 70 eV~energy 1s shown in figure 2 as example.
1.2 Hass separation
The principle of a quadrupole mass filter ;5 shown in figure 3. It cons1sts
of four rads across which a dc voltage U and a high frequency valtage V.cos(~t) 15 applied. The ions created in the ion source are injected paral
lel to the longitudinal axis into the rod system at energies between 20 eV and 150 eVa Due to the high frequency field, the ions oscillate perpendicular to the field axis. For fixed values of U, V and the frequency ~, these 05c;11ations are limited in amplitude only for a certain value of rn/e. They increase for all other values of m/e such that these ions are scattered onto the surrounding walls of the vacuum system. By scanning the frequency of the applied ac voltage, the mass f-ilter becom!'!s subsequently transparent for different values of m/e such that a mass scan can be performed.
~~'O=M=~=,=.,,~.--~'L'-------'S~"~b~.y~ ... =m~-------"'~
Fig. 3: Schematic set-up of a quadrupole mass analyzer
1.3 Ion detection
Typical ion currents at the exit of the mass filter range between 10-8 A and 10-16 A. In the simplest version, these currents can be measured directly by an electrorneter after they have been collected in a Faraday cup. For improved sensit1vity, secondary ion multiplyers (SEM) are being' used. They allow amplif1cation factors of about 107 and measurements wfth small time constants. A
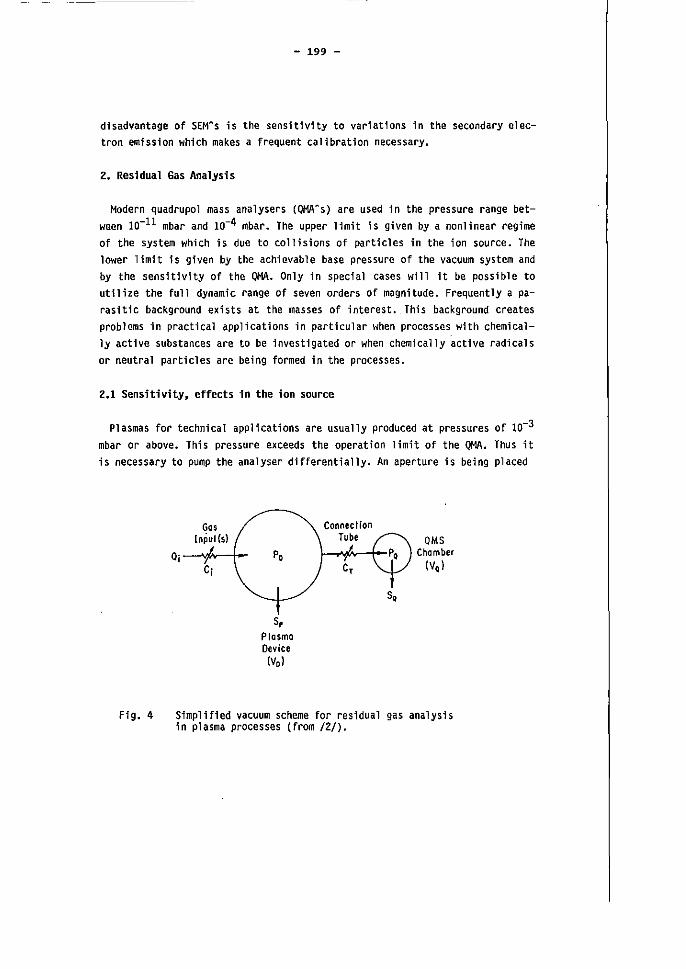
- 199 -
d1sadvantage of SEM~s is the sensit1v1ty to variations in the secondary electron emission which makes a frequent calibration necessary.
z. Residual Gas Analysis
Modern quadrupol mass analysers (QMAA S ) are used in the pres5ure range between 10-11 mbar and 10-4 mbar. The upper limit is given by a nonlinear regime of the system which is due to collisions of particles in the ion source. The lower limit is 9;ven by the achievable base pressure of the vacuum system and by the sensit1vity of the QMA. Only in special cases will it be possible to
utilize the tu11 dynamic range cf seven orders of magnitude. Frequently a parasit1c back.ground exists at the masses of interest. This background creates problems in practical applications in particular when processes with chemically active substances are to be investigated or when chemically active radicals or neutral particles are being formed in the processes.
2.1 Sensitivity~ effects in the ion source
Plasmas for technical applications are usually produced at pressures of 10-3
mbar or above. This pressure exceeds the operation limit of the QMA. Thus it is necessary to pump the analyser differentially. An aperture 1s being placed
F1g. 4
Gas lnpul(s) OM5
°i P, Chamber
Ci IV,)
5,
5, Plasma Device IV,)
Simplified vacuum scheme for residual gas analysis 1n pla,ma proce"e, Ifrom /2/).
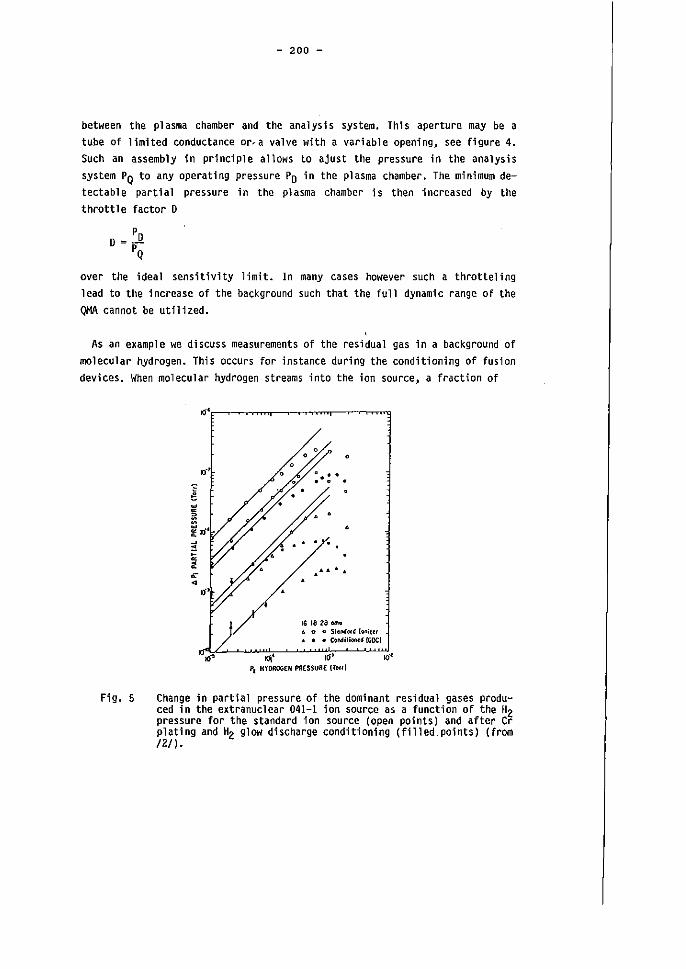
- 200 -
between the plasma chamber and the analysis system. This aperture may be a
tube of limited conductance or ... a valve with a variable opening, see figure 4.
Such an assembly in principle allows to ajust the pressure in the analysis
system PQ to any operating pressure Po in the plasma chamber. The minimum detectab 1 e part; alpressure in the pl a5ma chamber i 5 then i ncreased by the
throttle factor 0
over the ideal sensit;vity limit. In many cases however such a throtteling lead to the increase of the background such that the fu11 dynamic range oF the QMA cannat be utilized.
As an example we discuss measurements of the residual gas in a background of molecular hydrogen. This occurs for instance during the conditioning of fusion devices. When molecular hydrogen streams into the ion source, a fraction of
Fig. 5
o o
o o 0
:. : ..
..........
16 18 28 0" • .. 0 0 Slo"",,OI6!oftiur .. • • ColldUlonc~ {Goel
~' II1J
Pt HYDROGEN P!lESSuRE ITord Ki'
Change in partial pressure of the dominant residual gases produced in the extranuclear 041-1 ion source as a function of the HZ pressure for the standard ion source (open points) and after Cr plating and HZ glow discharge conditioning (filled points) (from 121).
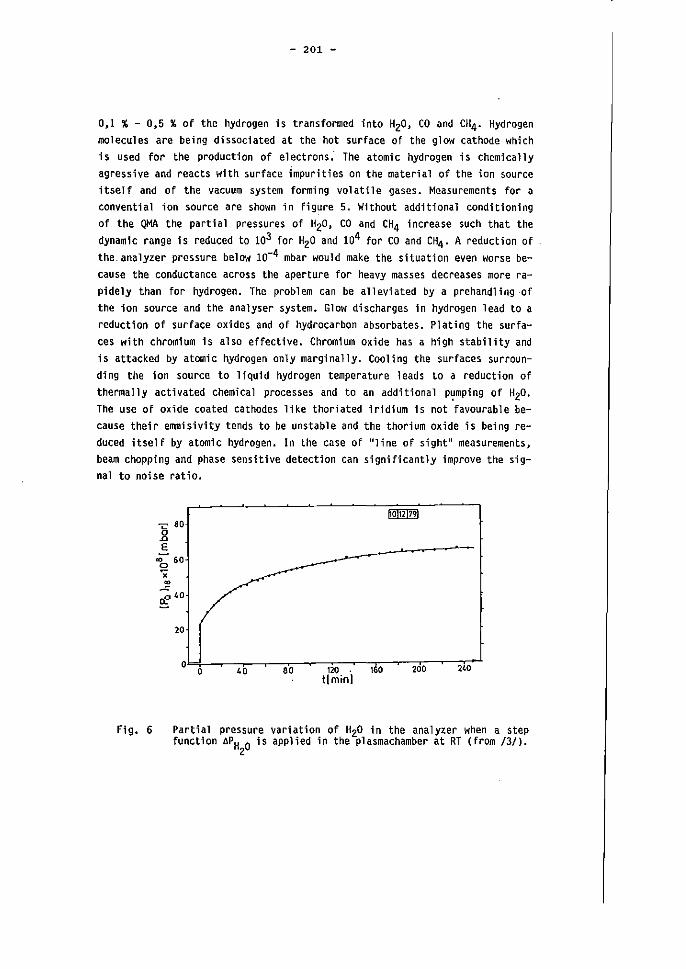
- 201 -
0,1 % - 0,5 % of the hydrogen is transformed into HZO, CO and CH4• Hydrogen molecules are being dissociated at the hot surface of the glow cathode which is used for the production of e1ectrons: The atomic hydrogen is chemically agressive and reacts with surface impurities on the material of the ion source itself and of the vacuum system forming volatile gases. Measurements for a convential ion source are shown in fig~re 5. W1thout additional conditioning of the QMA the partial pressures of HZO, CO and CH4 increase such that the dynamic range is reduced to 103 for HZO and 104 for CO and CH4. A reduction of the.analyzer pressure below 10-4 mbar wou1d make the situation even worse because the conductance across the aperture for heavy masses decreases more rapidely than for hydrogen. The problem can be alleviated by aprehandling of the ion source and the ana1yser system. Glow discharges in hydrogen lead to a reduction of surface oxides and of hydrocarbon absorbates. Plating the surfaces with chromium is also effective. Chromium oxide has a high stability and i s attacked by atomi c hydrogen only margi na 11 y. Cool i ng the surfaces surrounding the ion source to liquid hydrogen temperature leads to a reduction of thermally activated chemica1 processes and to an additional p~mping of HZO. The use of oxide coated cathodes like thoriated iridium is not favourable because their emmisivity tends to be unstable and the thorium oxide is being reduced itself by atomic hydrogen. In the case of "line of sight" measurements, beam chopping and phase sensitive detection can significant1y improve the signal to noise ratio.
Flg. 6
nol121791 ""i:' 80 0 .c E
.;;-- 60 ~ x ~
~40
'0
0 0 40 80 120 '60 '00 240
t1minl
Partial pressure variation of HZO in the analyzer when a step funetion APH 0 is applied in the plasmachamber at RT (from /3/).
2
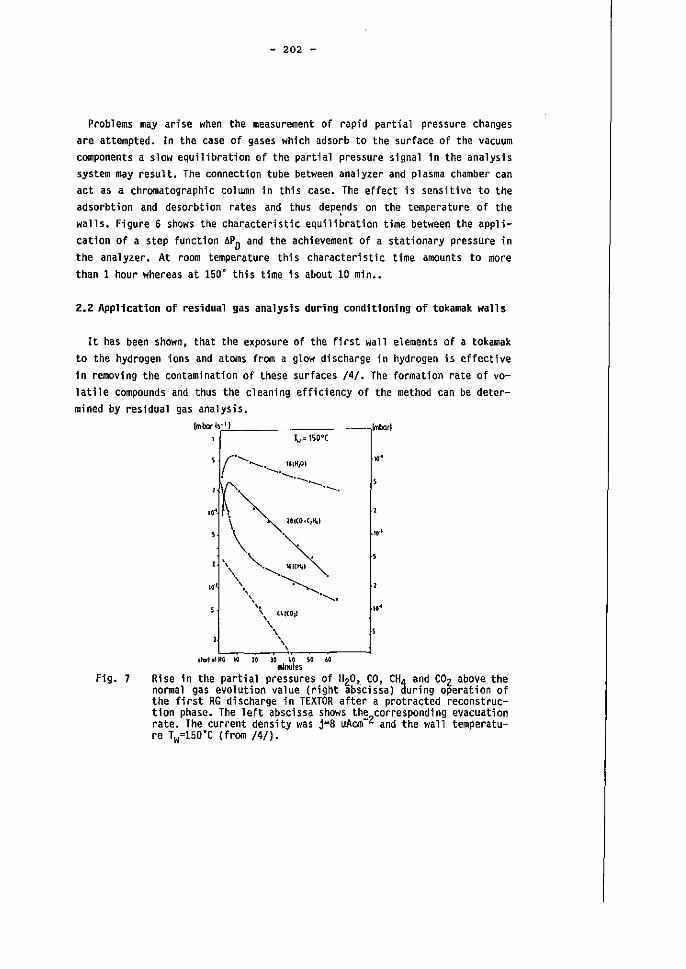
- 202 -
Problems may arise when the measurement of rapid partial pressure changes are attempted. In the case of gases which adsorb to the surface of the vacuum components a slow equilibration of the partial pressure signal in the analysis system may result. The connect1on tube between analyzer and plasma chamber can act as a chromatographic column in this case. The effect is sensitive to the adsorbtion and desorbtion rates and thus depe,nds on the temperature of the walls. Figure 6 shows the Characteristic equilibration time between the application of a step function APD and the achievement of a stationary pressure in the analyzer. At room temperature this characteristic time amounts to more than 1 hour whereas at 150· this time is about 10 min ••
2.2 Application of residual gas analysis during conditioning of tokamak walls
It has been shown, that the exposure of the first wall elements of a tokamak to the hydrogen ions and atoms from a glow discharge in hydrogen is effective in removing the contamination of these surfaces /4/. The formation rate of volatile compounds and thus the cleaning efficiency of the method can be determined by residual gas analysis.
Fig. 7
~ ___ • 181K,oJ ( ''-.
, 'v'.~---'---'---'---''--' "J ,\ ' ,,,,,,<, ..
\ "-,--....A \0"' \'" ~
\ ..............
" UI(O/I
'\\ ,
~,,~--~\--~------~ ,krio/lI(i 10 10 )0 ~o ~o ao
/lllnutes
.' 10.1
.. '
Rise in the partial pressures of H20,. CO, CH4 and COz above the normal gas evolution value (right abscissa) during operation of the first RG discharge in TEXTOR after a protracted reconstruction phase. The left abscissa shows the
2corresponding evacuation
rate. The current density was j=8 uAcm- and the wall temperature Tw·150·C (from /4/),
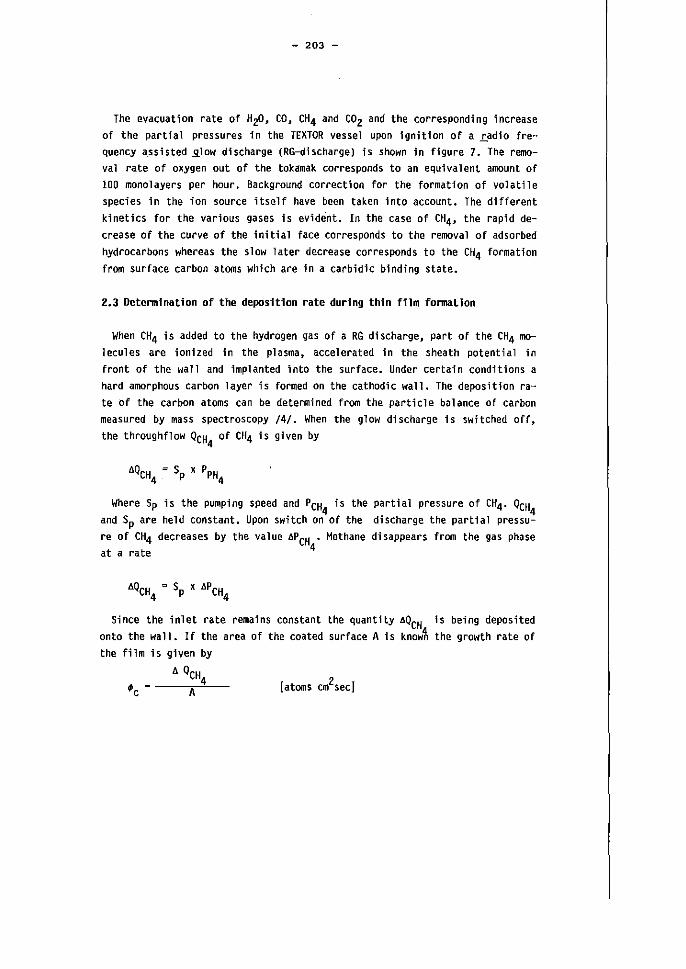
- 203 -
The evacuation rate of HzO, CO, CH4 and COz and the corresponding increase of the partial pressures in the TEXTOR vessel upon ignition of a Ladio frequency a,ssisted ..9..lOW discharge (RG-discharge) ;s shown in f1gure 7. The removal rate of oxygen out of the tokamak corresponds to an equivalent amount of 100 monolayers per hour. Background correction for the formation of volatile species in the ion source itself have been taken into account. The different kinetics for the various gases is evident. In the case of CH4, the rapid decrease of the curve of the initial face corresponds to the removal of adsorbed hydrocarbons whereas the slow later decrease corresponds to the CH4 formation from surface carbon atoms which are in a carbidic b1nding state.
2.3 Determination of the deposition rate during thin film formation
When CH4 is added to the hydrogen gas of a RG discharge, part of the CH4 100-lecules are ionized in the plasma, accelerated in the sheath potential in front of the wall and implanted into the surface. Under certain conditions a hard amorphous carbon layer ;s formed on the cathodic wall. The deposition rate of the carbon atoms can be determined from the particle balance of carbon measured by mass spectroscopy /4/. When the glow di scharge i s switched off, the throughflow QCH
4 of CH4 is given by
Where Sp is the pumping speed and PCH4 ;s the partial pressure of CH4• QCH4
and Sp are held constant. Upon switch on of the discharge the partial pressure of CH4 decreases by the value APCH • Methane disappears from the gas phase
4 at a rate
Since the inlet rate remains constant the quantity .dQCH is being depos;ted onto the wall. If the area of the coated surface A is know~ the growth rate of the film 1s given by
• QeH ~ c ~ --·A.-"-4--
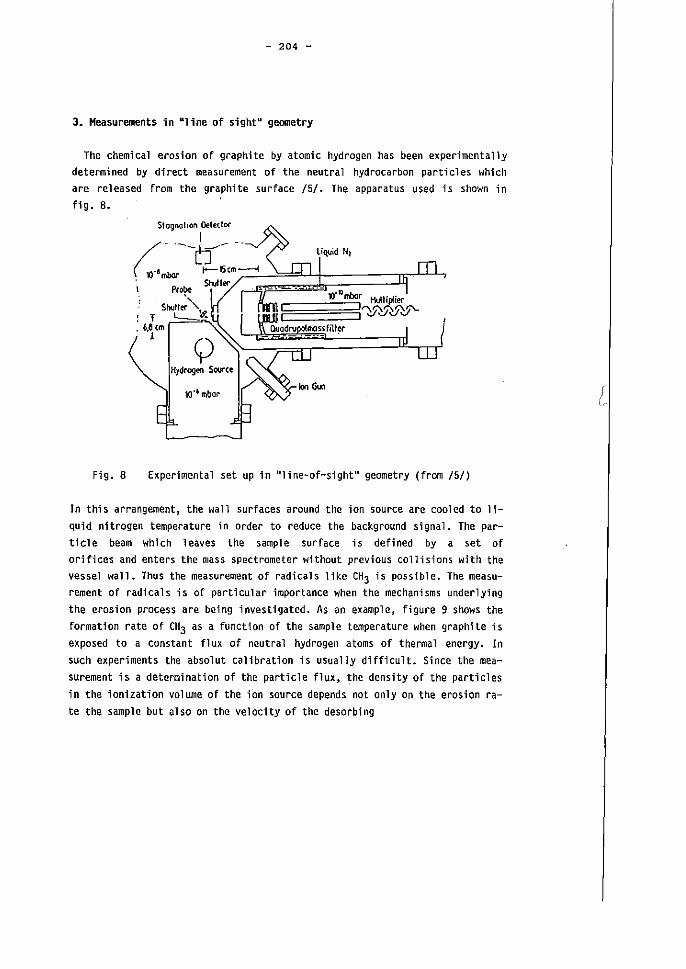
- 204 -
3. Heasurements in uline of sight U geometry
The chemical erosion of graphite by atom;c hydrogen has been experimentally determined by direct measurement of the neutral hydrocarbon particles wh;ch are released from the graphite surface /5/. The apparatus used is shown in f1g. B.
Fig. B Experimental set up in uline-of-sight U geometry (from /5/)
In this arrangement, the wall surfaces around the ion source are cooled to liquid nitrogen temperature in order to reduce the background signal. The parti cl e beam whi ch I eaves the sampIe surface i s defi ned by a set of orifices and enters the mass spectrometer without previous collisions with the vessel wall. Thus the measurement of radicals like CH3 is possible. The measurement of radicals is of particular importance when the mechanisms underlying the erosion process are being investigated. As an example, figure 9 shows the formation rate of CH3 as a function of the sampIe temperature when graphite is exposed to a Constant f1 UX of neutral hydrogen atoms of thermal energy. In such experiments the absolut calibration is usually difficult. Since the measurement is adetermination of the particle flux, the density of the particles in the ionization volume of the ion source depends not only on the erosion rate the sampIe but also on the velocity of the desorbing
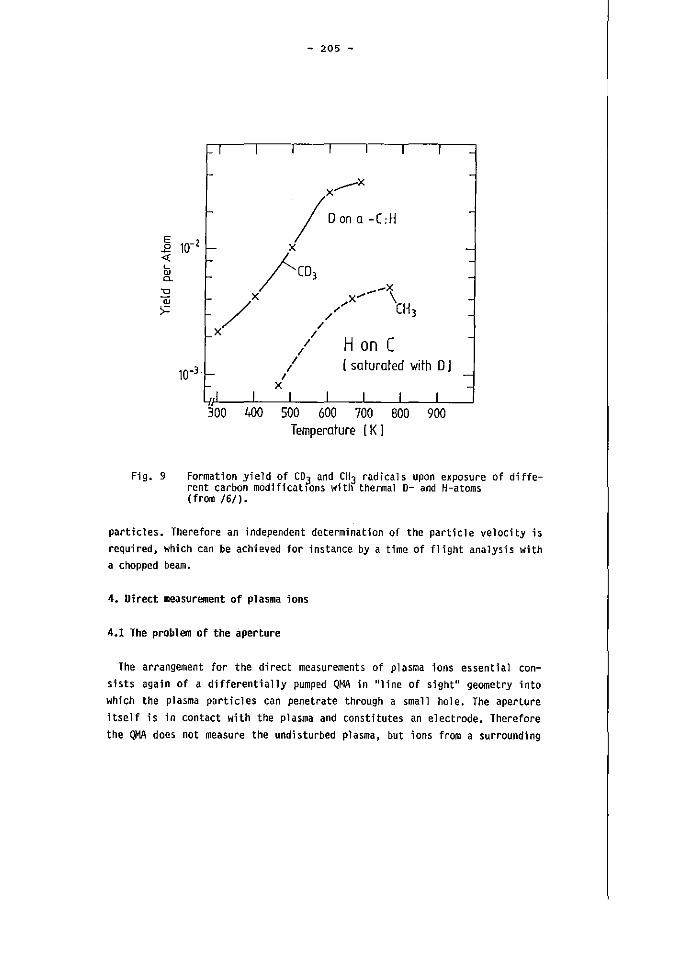
E 2 « L QJ
"'-"0 <U >=
Fig. 9
- 205 -
I I I I I I I _
I- .___x X
/0 on 0 -C:H
f-- x -10-2
I- /C03 -__ x
x'" \ l- x
/ ,/ CH 3 / /
I- X / H on C -/
/ I [ saturated with 0 J 10-3 I
f-- I -"I I xI I I I I
-
300 400 500 600 700 800 900 Temperature [K J
Formation yield of CDJ and CH3 radical s upan exposure of di ffere nt carbon modificatlons witn thermal D- and H-atoms (from /6/).
particles. Therefore an independent determination of the particle velocity is
required, which can be achieved tor instance by a time of flight analysis with
a chopped beam.
4. Direct measurement of plasma ions
4.1 The problem of the aperture
The arrangement for the direct measurements of plasma ions essential con
s1sts aga;n of a differentially pumped QMA in IIline of sight ll geometry inta
which the plasma particles can penetrate through a small hole. The aperture
itself ;$ in contact with the plasma and canstitutes an electrode. Therefore
the QMA does not measure the undisturbed plasma, but ions from a surrounding
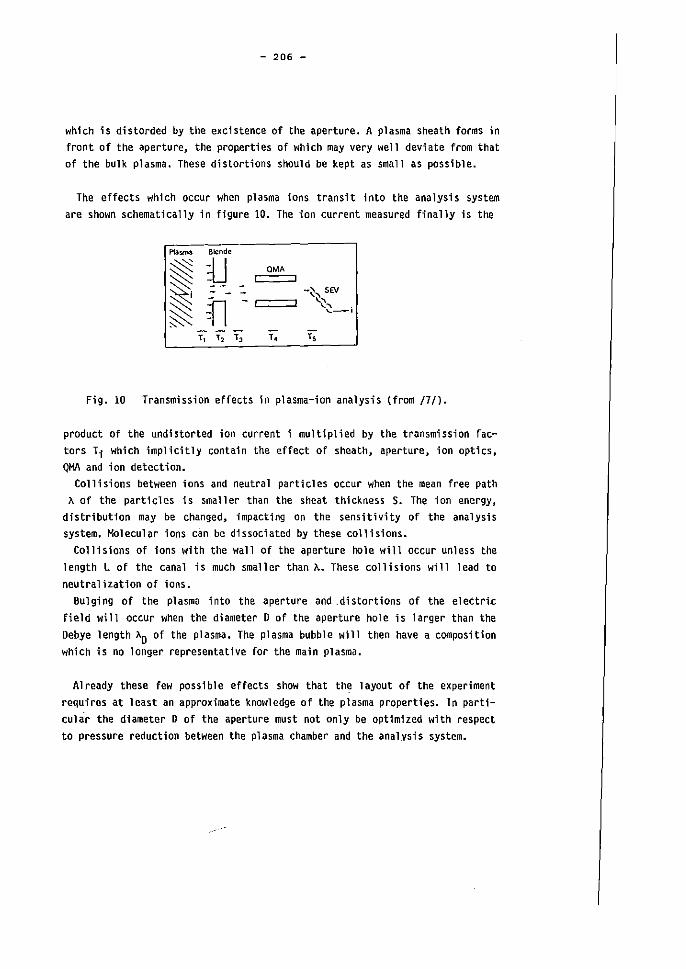
- 206 -
which is distorded by the excistence of the aperture. A plasma sheath farms in front of the aperture, the properties cf which may very well deviate from that of the bulk plasma. These distortions should be kept as small as possible.
The effects which occur when plasma ions transit into the analysis system are shown schematical1y in figure 10. The ion current measured finally is the
"'"'" Blende
::s::: iJ OMA
~ ~ - - - -~, SE'I
n - , " " ~ --; T, T, T, T, T,
Fig. 10 Transmission effects in plasma-ion analysis (from /7/).
product of the undistorted ion current i multiplied by the transmission fattors Ti which implicitly conta1n the effect of sheath, aperture, ion optics, QMA and ion detection.
Col1isions between ions and neutral particles occur when the mean free path 1\ of the particles is smaller than the sheat thickness S. The ion energy,
distribution may be changed, 1mpact1ng on the sensitivity of the analysis system. Molecular ions can be d1ssociated by these collisions.
Collisions of ions with the wall of the aperture hole will occur unless the length L of the canal is much smaller than Ä. These collisions will lead to neutralization of ions.
Bulging of the plasma into the aperture and .distortions of the electri.c field will occur when the diameter D of the aperture hole is larger than the Debye length Äo of the plasma. The plasma bubble will then have a composition which is no langer representative for the main plasma.
Already these few possible effects show that the layout of the experiment requires at least an approximate knowledge of the plasma properties. In particular the diameter D of the aperture must not only be opt1mized with respect to pressure reduction between the plasma chamber and the analYsis system.
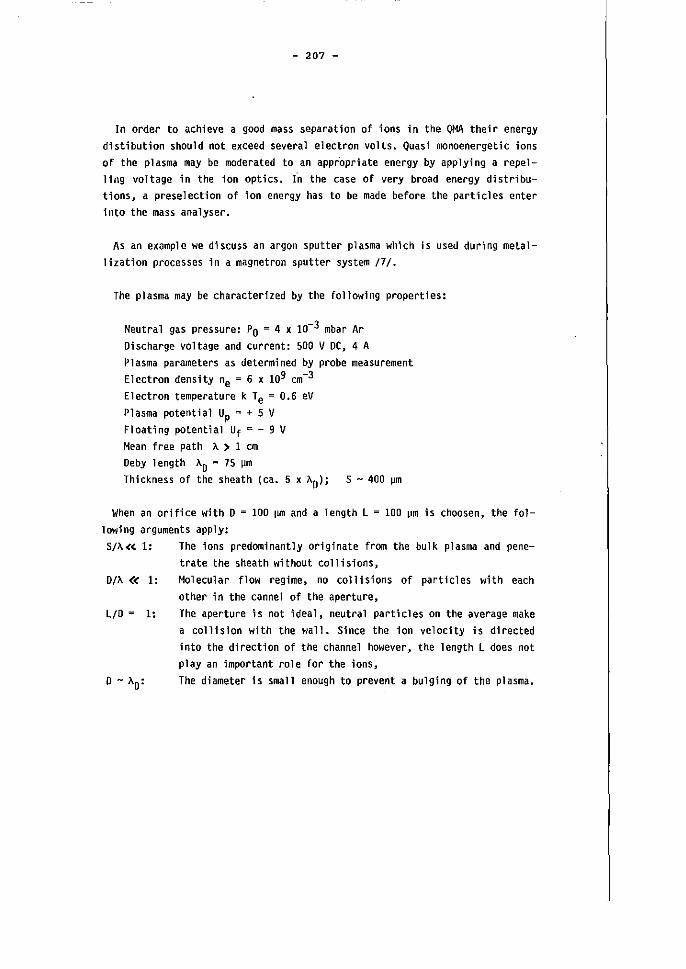
- 207 -
In order to achieve a good mass separation of ions in the OMA their energy distibution shou1d not exceed several electron volts. Quasi monoenergetic ions of the plasma may be mOderated to an appropriate energy by applying a repelling volta ge in the 10n optics. fn the ca se of very broad energy distributions~ a preselection of ion energy has to be made before the partic1es enter into the mass ana1yser.
As an example we discuss an argon sputter plasma which is used during metallization processes in a magnetron sputter system /7/.
The plasma may be characterized by the following properties:
Neutral gas pressure: Po = 4 x 10⁻³ mbar Ar Discharge vo1tage and current: 500 V oe, 4 A Plasma parameters as detenmined by probe measurement Electron density ne = 6 x 109 cm-3
Electron temperature k Te = 0.6 eV Plasma potential Up = + 5 V Floating potential Uf ~ - 9 V Mean free path Ä > 1 cm Oeby length AO = 75 ~m Thickness of the sheath (ca. 5 x ÄO); S - 400 ~m
When an orifice with 0 = 100 ~m and a length L = 100 ~m is choosen, the following arguments apply: S/Ä« 1: The ions predominantly originate from the bulk plasma and pene
trate the sheath without co11is10ns, Oll>.« 1:
LID ~ 1:
Molecular flow regime, no colli5ions of particles with each other in the cannel of the aperture, The aperture i5 not ideal, neutral partic1es on the average make a collision with the wall. Since the ion velocity 15 directed into the direction of the channel however, the length L does not p1ay an important role for the ions, The diameter 155mall enough to prevent a bulging of the plasma.
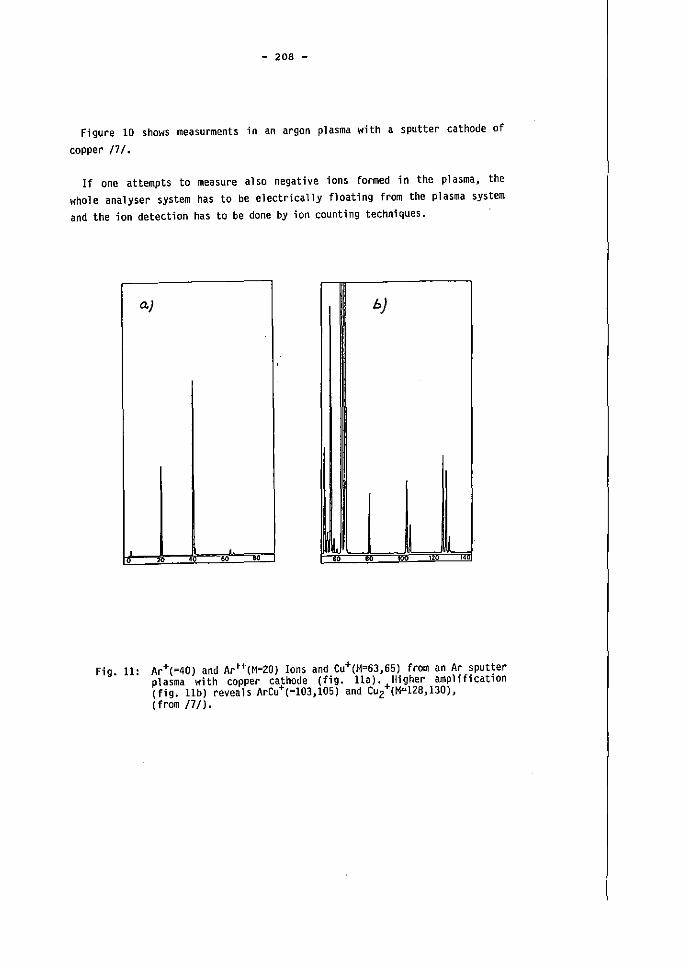
- 208 -
Figure 10 shows measurments in an argon plasma with a sputter cathode of
copper /7/.
If one attempts to measure also negative ions formed in the plasma, the
whole analyser system has to be electrically floating from the plasma system
and the ion detection has to be done by ion counting techniques.
0.) b)
I, , 120 14
Fig. 11: Ar+(=40) and Ar++(M=20) Ions and Cu+(M=63,65) from an Ar sputter plasma with copper cathode (fig. Ha). Higher amplification (f1g. Ilb) reveals ArCu+(=103,105) and CU2+(M=128,130), (from /7/).
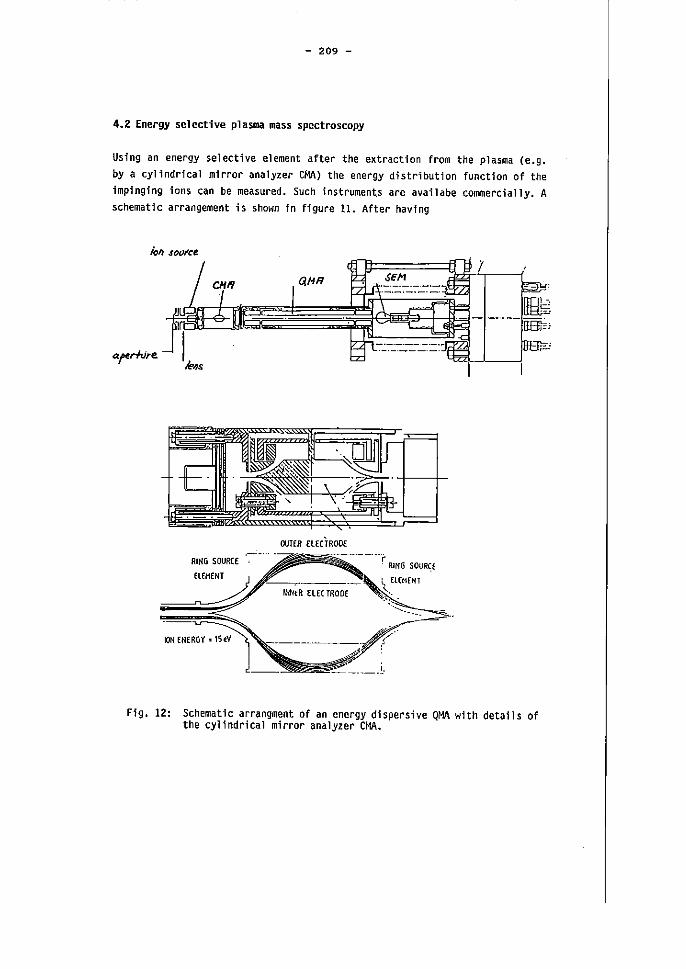
- 209 -
4.2 Energy selective plasma mass spectroscopy
Using an energy selective element after the extraction from the plasma Ce.g. bya cy11ndrical mirror analyzer CMÄ) the energy distribution function of the impinging ions can be measured. Such instrument.s are availabe commercially. A schematic arrangement is shown in figure 11. After having
OUTER HEcTROOE
RING SOURCE
INNtR ElEC TROOE
---------/ ------.!.
Fig. 12: Schematic arrangment of an energy dispersive QMA with details of the cylindrical mirror analyzer CMA.
- 210 -
passed the aperture, which is immersed into the plasma, the ions are focused by a 1 ens i nto the entrance 5.1 it of the CMA. The energy se 1 ction i s made by apply1ng a voltage between the inner and outer electrode of the CHA. A typical energy resolution is about 1 eV. Thereafter the ions are focussed into the QMA and impinge after mass analysis onto the secondary electron multiplyer. The instrument also incorporates an ion source in front of the CHA and can thus be used for conventional residual gas analysis and for the measurement of neutral
particles escaping the plasma.
Figure. 12 shows the energy distribution of H2+ and H3+ impinging onto the cathode of a oe glow discharge in pure hydrogen. The voltage applied between anode and cathode in this experiment was 570 V. The neutral gas pressure in the discharge was 1.6 x 10⁻³ mbar. Under these conditions the sheath is essentially collisionless. The maxima of the ion energy distribution function are
at 565 eV.
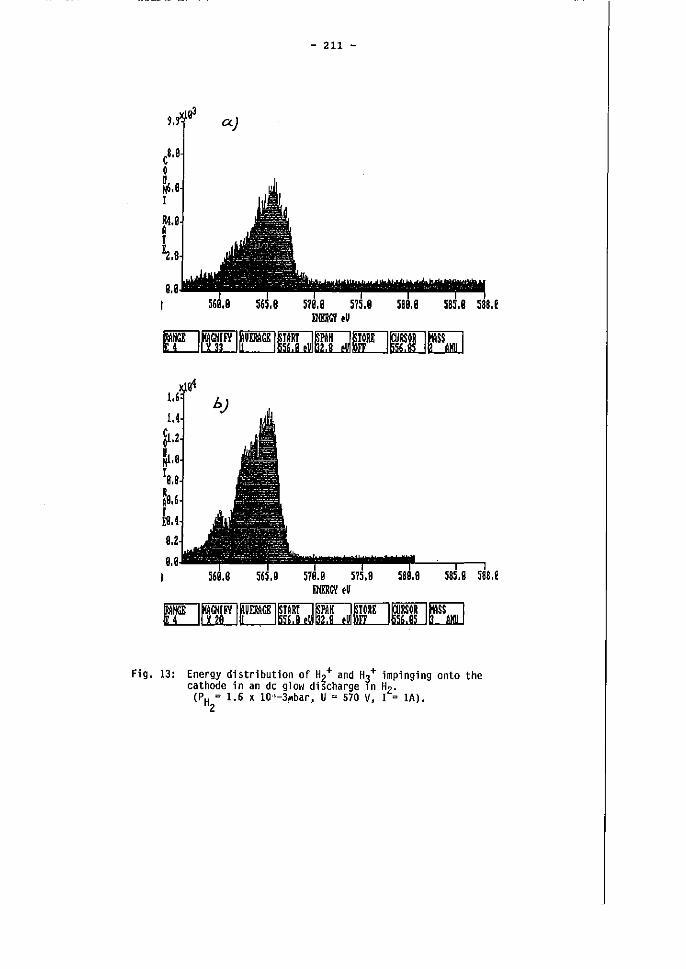
- 211 -
OOIWI .u
~~~IF/ I~U!AAGE 1~~m!Jff[]~
1liDIC'I .U
~~~'F/ I~U!AAGE 1~~m!Jff[]E;]
Fig. 13: Energy distribution of HZ+ and H3+ irnpinging onto the cathode in an dc glow discharge ln Hz.
(PH = 1.6 , 10·'-3.bar, U = 570 V, I 0 IA). 2
- 212 - .
References
/11 Partialdruckmessung in der Vakuumtechnik, Balzers AG, Liechtenstein
/2/ M,J. Vasile and H.F. Dylla, "Mass Spectrometry of Plasmas" in Plasma
Diagnostics, Val. 1, O. Aucello, D.L. Flamm (eds.), Academic Press, San
Diego, Landon, 1989
/31 F. Waelbroeck, J. Winter, I. Ali-Khan, P. Wienhold, B. Brandt and K.J. Dietz, Report JUL-169Z, December 19880, Research Cent re Jülich, FRG
/4/ J. Winter, J. Nucl. Mater., 1Jll (1989), 265
/51 E. Vietzke, K. Flaskamp and V. Philipps, J. Nucl. Mater. 111+112 (1982),
763
/6/ E. Vietzke and V. Philipps, Nucl. Instr. Methods in Phys. Res. 823
(1987), 449
/1/ K. Höfler, "Plasmadiagnostik bei plasmauntnstützten Dünnschichttechni
ken", Ba 1 zers AG, Li echtenstei n
Generalliterature
D. Prince "Dynamic Mass Spectrometry", Vol 2, Heyden and Sons Ltd.,
London, 1971
- 213 -
The DC Cold Cathode Glow Discharge
E. Hintz
Institute of Plasma Physics Association EURATOM-KFA
Forschungszentrum Jülich GmbH, FRG
- 214 -
The DC COld Cathode Glow Discharge
1. Introduction
The reason for se 1 ecti ng the low pressure glow di scharge as one 0 f the
topics for this workshop is the broad range of applications which it finds
in modern technology. Some of the applications have become part of our
every day life to such a degree, that we hardly take note of them, e.g.
the fluorescent lamps and Na-vapour lamps which are increasingly used for
lighting purposes. Other well known examples for the use of glow
discharges as a source of radiation are various types of gas lasers: He
Ne-lasers, He-Cd-lasers, metal vapour lasers, noble gas ion-lasers and
molecular lasers (C02, CO, HCN, etc.).
Surface engineering and thin film technology is another branch of
technology where the low pressure glow discharge is applied extensively;
the various processes which are used are known as plasma etching, plasma
deposition, surface cleaning, surface activation, sputtering. Although the
state of development of these plasma-based technological devices is well
advanced, the understanding of the basic physical processes and of the
discharge as a whole is in most cases rather low. The main reason is that
we are dealing with very complex systems as will become more evident later
on in this lecture.
In order to get a better insight into the physics of the glow discharge we
try to reduce the complexity and restrict our discussions to special types
of glow discharges. First of all we shall consider only dc discharges with
cold cathode and disregard discharges with hot cathode and ac-driven
discharges. Secondly we choose the simplest possible geometry, i.e. plane
electrodes with a diameter large compared to the electrode distance and
thirdly we shall discuss only discharges in atomic gases and vapours, i .e.
we exclude molecular gases from our discussion. In order to be specific
and at the same time cover important applications we shall in general
refer to discharges in He and Ar.
- 215 -
We hope that it will become clear, that the glow discharge not only plays
an important role in technol,ogy but also presents achallenge for basic
research. It is an important example of a strongly non-uniform, non
equilibrium plasma, consisting of several parts with strongly different
plasma parameters, which have to be matched; electron energy distributions
are typically non-Maxwellian, the system is highly non-linear and a
multitude of atomic processes plays a role.
From what we have said it should be clear, that in this lecture we can
achieve only an approximate description of the basic discharge phenomena
and that in general a theoreti cal descri ption of the di scharge wi 11 have
to rely on numerical modelling. The latter conclusion is also the reason
for the observation that there has been a stagnation in glow discharge
physics until about 10-15 years ago and that the development of modern
computers has given fresh impetus to furt her development of this
interesting field of physics. At the end of this chapter we have listed a
few monographs and survey articles, which may be helpful to acquire a more
thorough introduction into glow discharge physics.
1.1 General characterization of dc glow discharges
Gases in the normal state are non-conducting. In order to set up
"electrical discharges in gases" charge carriers have to be generated
either in the gas volume or at the gas-electrode (or wall) interfaces. In
the following we have to discuss therefore the processes responsible
for the generation of charge carriers,
for their destruction or loss,
and for their transport.
In particular, we have to consider these processes in the presence of an
electric field E. It has been useful to distinguish two types of
discharges: "non-selfsustained discharges (e.g. ionization chambers) which
rely for their existence on the supply of charge carriers by some external
means, e.g. electron sources, X-rays, or more generally on "foreign"
currents - and "selfsustained" di scharges for which external currents are
not needed. For both types the experimental arrangement is quite simple
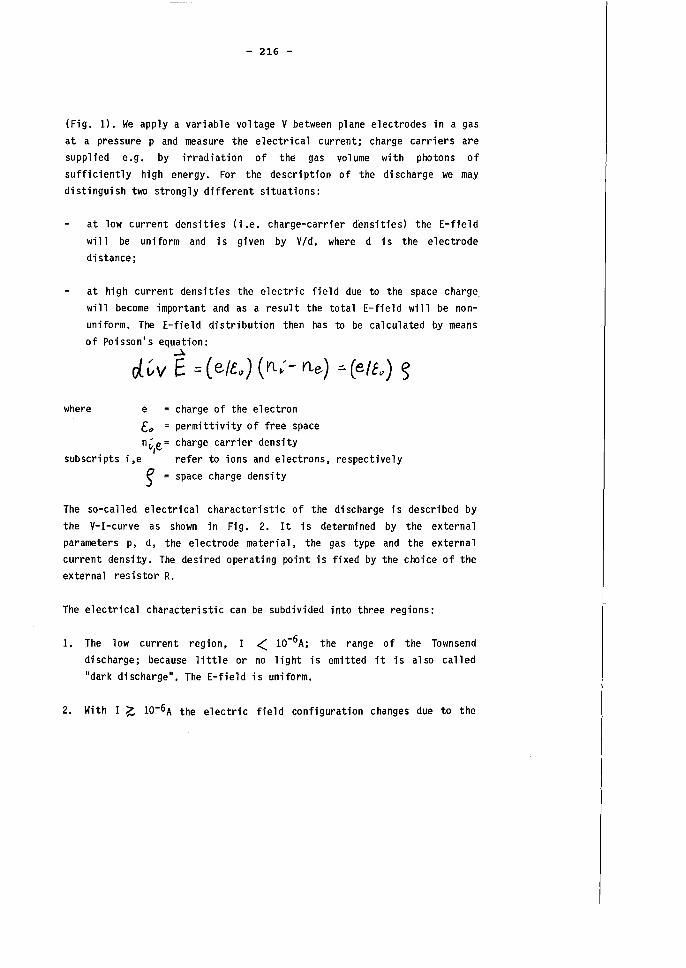
- 216 -
(Fig. 1). We apply a variable voltage V between plane electrodes in agas
at apressure p and measure the electrical current; charge carriers are
supplied e.g. by irradiation of the gas volume with photons of
sufficiently high energy. For the description of the discharge we may
distinguish two strongly different situations:
at low current densities (i .e. charge-carrier d"ensities) the E-field
will be uniform and is given by V/d, where d is the electrode
distance;
at high current densities the electric field due to the space charge
will become important and as a result the total E-field will be non
uniform. The E-field distribution then has to be calculated by means
of Poisson's equation:
where
....l.
rJ.. ~V E = ( e/(17 ) (Vl; - rte) =- (elt~) ~
e charge of the electron
E~ permittivity of free space
n~e = charge carrier density , subscripts i,e refer to ions and electrons, respectively
~ = space charge density
The so-called electrical characteristic of the discharge is described by
the V-I-curve as shown in Fig. 2. It is determined by the external
parameters p, d, the electrode material, the gas type and the extern al
current density. The desired operating point is fixed by the choice of the
external resistor R.
The electrical characteristic can be subdivided into three regions:
1. The low current region, I < 1O-6A; the range of the Townsend
discharge; because little or no light is emitted it is also called
"dark discharge". The E-field is uniform.
2. With I ~ 1O-6A the electric field configuration changes due to the
- 217 -
onset of space charge distortions. The potential drop Vc is confined
to a short region in f-ront of the cathode (cathode fall). For a
certain range of the current the voltage drop Vc is independent of the
current, this is the so called normal glow region.
With increasing current Vc rises; we ~nter the region of abnormal
glow. Large E-fields may occur and, connected with it, the formation
of electron beams.
3. Further increase of the current leads to the so-called glow-to-arc
transition. The cathode fall undergoes a transformation from a cold
cathode di scharge to a hot cathode di sc harge wi th thermo i oni c
emission.
In the course of this lecture we shall be concerned only with region 11 of
the characteri sti c. The structure of thi s 1 ecture requi res some knowl edge
on the type and the cross-section of collisons which are important for the
discharge. For this purpose we first give an outline of the characteristic
plasma parameter ranges which we may expect in typical glow discharges:
108/cm3 ~ ne ~1012/cm3
1O-4torr = p ~ 10 torr
i.e. ne/no ~ 10-6-10-3
0.1 eV~ Te ~10 eV
5 x 10¹²/cm3 ..::: n L. 3 x 10¹⁷ Icm3 - g-
A» ~ 1O-2-1O-1cm
Where ng denotes the density of neutral atoms, Te the electron temperature
and Ap the Debye length (A]>= 7.4 x 10² (Te/ne)1/2).
The position, which glow discharge plasmas take in a general ne - Te
diagram is shown in Fig. 3.
Some general concl usions can now be drawn. Because ne « ng electron
electron collisions in most cases are negligible and elastic collisions
between electrons or ions and neutral atoms are dominant.
Furthermore m « M, i.e. miM X 10-3-10-5 (where m is the mass of the
electron and M that of the ion or atom). As a consequence we obtain for
- 218 -
the energy 10ssil W due to e1astic co11isions
with We being the energy of the e1ectron. This means that the energy 10ss
per co11ision may be sma11 compared to the energy gained inbetween
co11isions. The e1ectrons are decoupled from the gas atoms, i .e. we may
expect Te» Tg. On the other hand for the ions Ll Wi ~ll/2)Wi; ho1ds, i .e.
the ion temperature will be c10se to the gas temperature.
Depending on the e1ectron temperature the e1ectrons will main1y 100se
energy due to ine1astic co11isions (excitation and ionisation) which,
therefore, will p1ay an important ro1e. Since the relaxation time for
estab1ishing a Maxwe11ian (t: ee) will be 10ng, one may expect strong
deviations from a Maxwe11ian energy distribution.
It is also to be expected, that in order to obtain we11 defined discharge
conditions, the requirements on the purity of the discharge gas will be
high, in particu1ar, with respect to mo1ecu1ar impurities because of their
10w excitation energies. If this is not taken into account, ine1astic
co11isions of the e1ectrons with these impurities may strong1y modify the
energy distribution.
To reach an understanding of the physics of glow discharges we have to
devote some time to the discussion of the cross-sections for e1astic and
ine1astic co11isions of e1ectrons and ions with the gas atoms.
2. Co11ision Processes and Transport Phenomena
2.1 Cross-sections
It has been shown in section 1 that e1astic and ine1astic co11isions of
e1ectrons and ions with the neutral atoms of the discharge gas will p1ay
an important part in the description of glow discharges. In the framework
of this 1ecture, however, it is not possib1e to describe in an adequate
way the princip1es and most important resu1ts of this interesting branch
of atomic physics. Instead, we sha11 try to co11ect and present existing
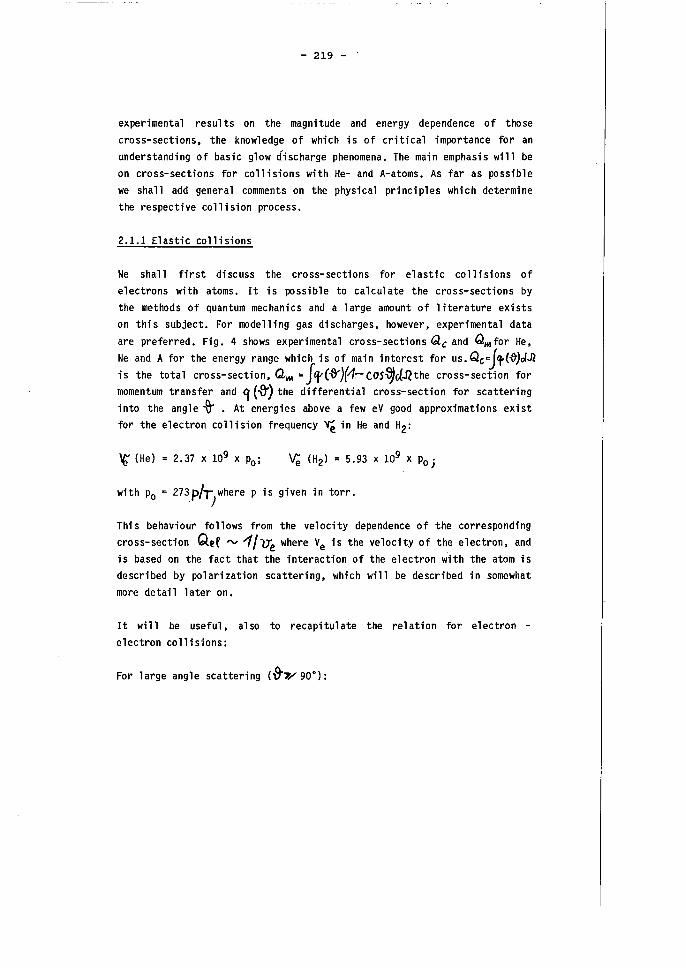
- 219 -
experimental results on the magnitude and energy dependence of those
cross-sections, the knowledge of which is of critical importance for an
understanding of basic glow discharge phenomena. The main emphasis will be
on cross-sections for collisions with He- and A-atoms. As far as possible
we shall add general comments on the physical principles which determine
the respective collision process.
2.1.1 Elastic collisions
He shall first discuss the cross-sections for elastic collisions of
electrons with atoms. It is possible to calculate the cross-sections by
the methods of quantum mechanics and a large amount of 1 iterature exists
on this subject. For modelling gas discharges, however, experimental data
are preferred. Fig. 4 shows experimental cross-sections Id., and QHlfor He,
Ne and A for the energy range which is of main interest for us.Q,=jt<-&)clJl is the total cross-section, 0,,,, = ftt(-&,)(1:--cos-3)c1J2the cross-section for
momentum transfer and q (-8') the differential cross-section for scattering
into the angle t . At energies above a few eV good approximations exist
for the electron collision frequency ve in He and H2:
~ (He) = 2.37 x 10⁹ x Po;
with Po = 273plT where p is given in torr. . )
Thi s behaviour follows from the velocity dependence of the corresponding
cross-section Q~f IV 1/lJ"e where Ve is the velocity of the electron, and
is based on the fact that the interaction of the electron with the atom is
described by polarization scattering, which will be described in somewhat
more detail later on.
It will be useful, also to recapitulate the relation for electron -
electron collisions:
For large angle scattering (&'7/90°):
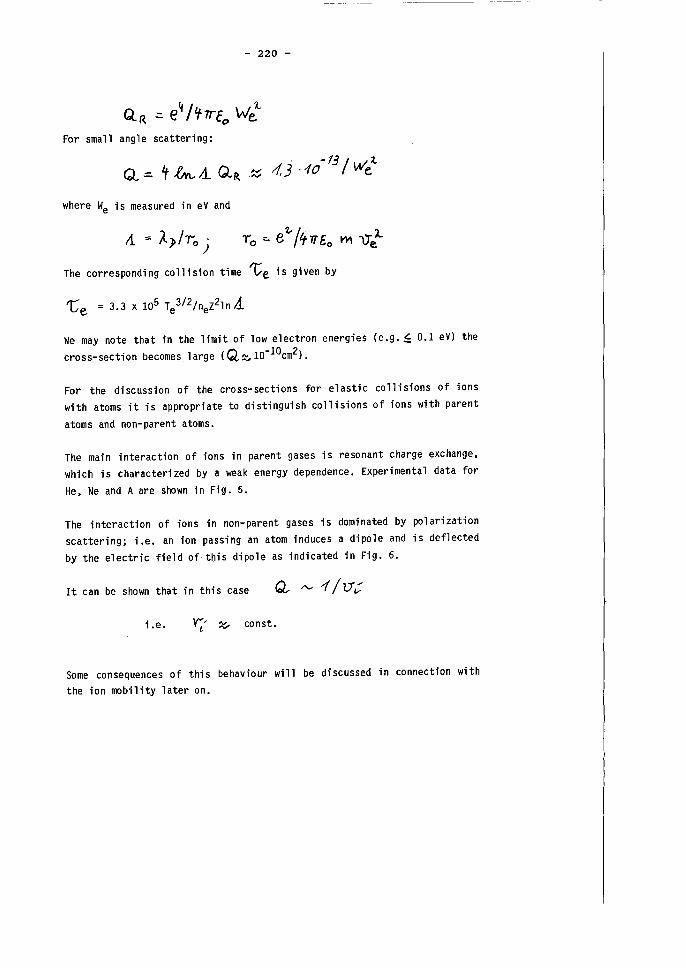
~-- ---------
- 220 -
For small angle scattering:
where We is measured in eV and
r1. .. ).)/1'. . o )
The corresponding collision time 1:;e is given by
We may note that in the limit of low electron energies (e.g. ~ 0.1 eV) the
cross-section becomes 1 arge (Q ~ 10-10cm2).
For the discussion of the cross-sections for elastic collisions of ions with atoms it is appropriate to distinguish collisions of ions with parent
atoms and non-parent atoms.
The main interaction of ions in parent gases is resonant charge exchange, which is characterized by a weak energy dependence. Experimental data for
He, Ne and Aare shown in Fig. 5.
The interaction of ions in non-parent gases is dominated by polarization scattering; i.e. an ion passing an atom induces a dipole and is deflected
by the electric field ofthis dipole as indicated in Fig. 6.
It can be shown that in this case
i.e. V;' ~ const.
Some consequences of this behaviour will be discussed in connection with
the ion mobility later on.
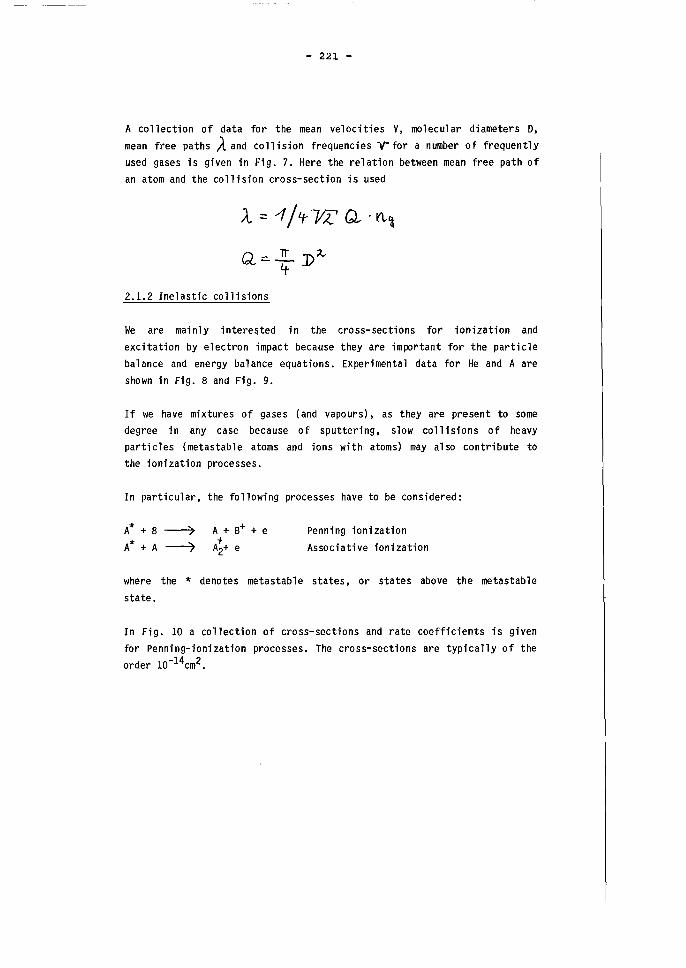
- 221 -
A collection of da ta for the mean velocities V, molecular diameters D,
mean free paths A and collision frequencies Y-for a number of frequently
used gases is given in Fig. 7. Here the relation between mean free path of
an atom and the collision cross-section is used
2.1.2 Inelastic collisions
We are mainly intere~ted in the cross-sections for ionization and
excitation by electron impact because they are important for the particle
balance and energy balance equations. Experime'ntal data for He and Aare
shown in Fig. 8 and Fig. 9.
If we have mixtures of gases (and vapours), as they are present to some
degree in any case because of sputtering, slow collisions of heavy
particles (metastable atoms and ions with atoms) may al so contribute to
the ionization processes.
In particular, the following processes have to be considered:
Penning ionization
Associative ionization
where the * denotes meta stab 1 e states, or states above the metastab 1 e
state.
In Fig. 10 a collection of cross-sections and rate coefficients is given
for Penning-ionization processes. The cross-sections are typically of the order 10-14cm2.
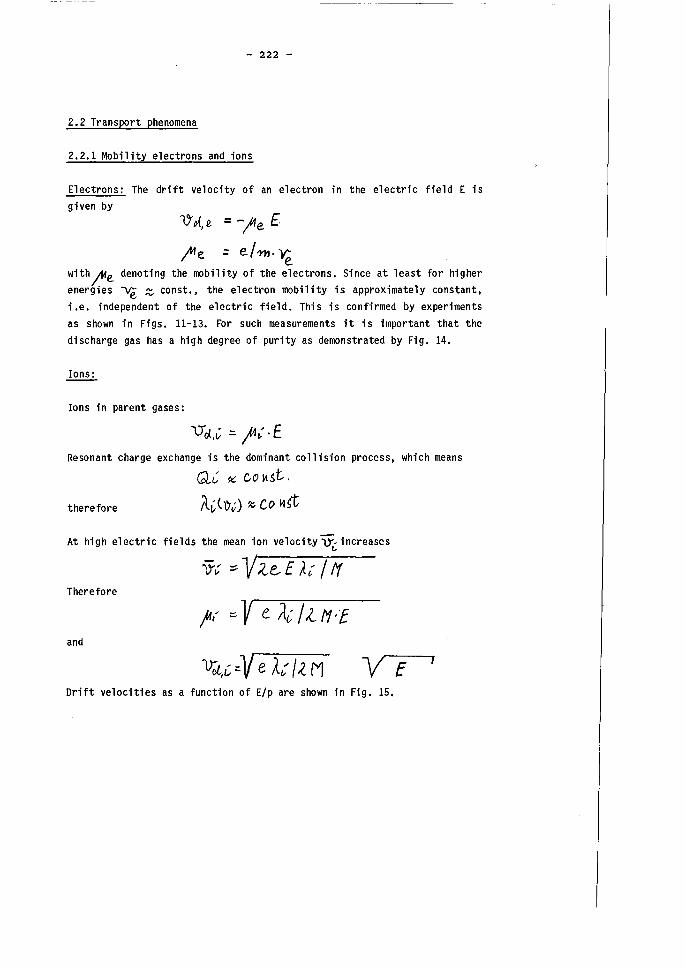
- 222 -
2.2 Transport phenomena
2.2.1 Mobility electrons and ions
Electrons: The drift velocity of an electron in the electric field E is given by
With;IHe denoting the mobility of the electrons. Since at least for higher energies -ve .:::. const., the electron mobility is approximately constant. i .e. independent of the electric field. This is confirmed by experiments as shown in Figs. 11-13. For such measurements it is important that the discharge gas has a high degree of purity as demonstrated by Fig. 14.
Ions in parent gases:
lTol,~ :; 1':. E Resonant charge exchange is the dominant collision
QC ~ ~o~st.
therefore I\.~(~~) ~ Co l1$t
process. which means
At high electric fields the mean ion velocity tr. increases r...
Therefore
and
'\r~ ::; V Ze. E ~[ / 11
)1t ::; V e A& / l f1 'E
~,t::=Ve Av" I~ M VE Drift velocities as a function of E/p are shown in Fig. 15.
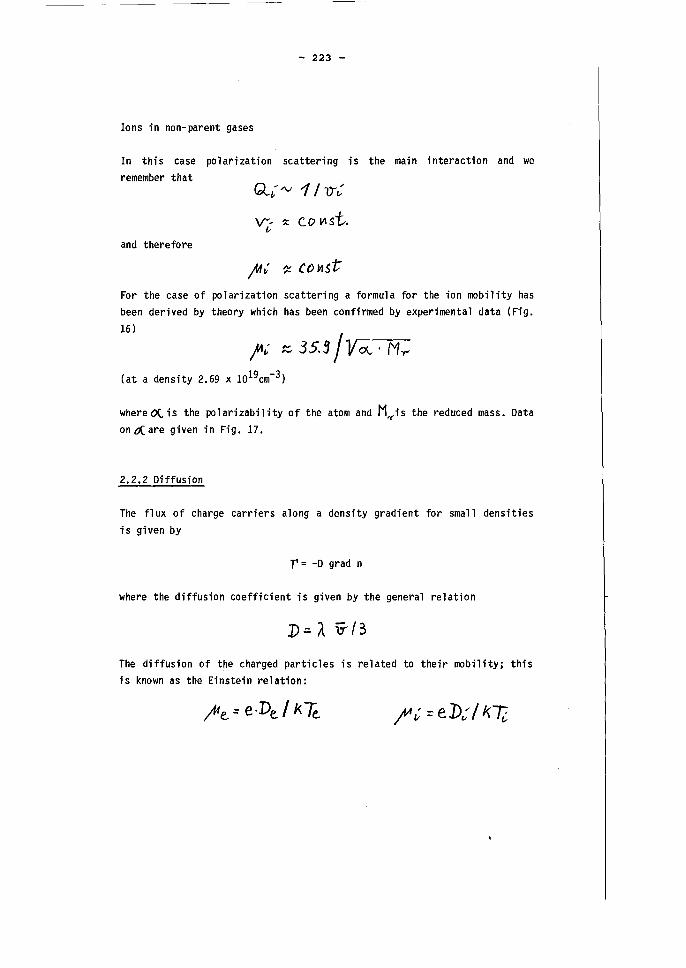
- 223 -
Ions in non-parent gases
In this ca se polarization scattering is the main interaction and we remember that
and therefore
Q.; /V 1 / r;-';
V':'~ ~ C.DVlst. /;
;«,; ~ cowst For the case of polarization scattering a formula for the ion mobility has been derived by theory which has been confirmed by experimental data (Fig.
where 0(. i s the po 1 ari zabi 1 i ty of the atom and M .... i s the reduced mass. Data on t;( are given in Fig. 17.
2.2.2 Diffusion
The fl ux of charge carriers along a density gradient for small densities is given by
r = -D grad n
where the diffusion coefficient is given by the general relation
The diffusion of the charged particles is related to their mobilityj this is known as the Einstein relation:
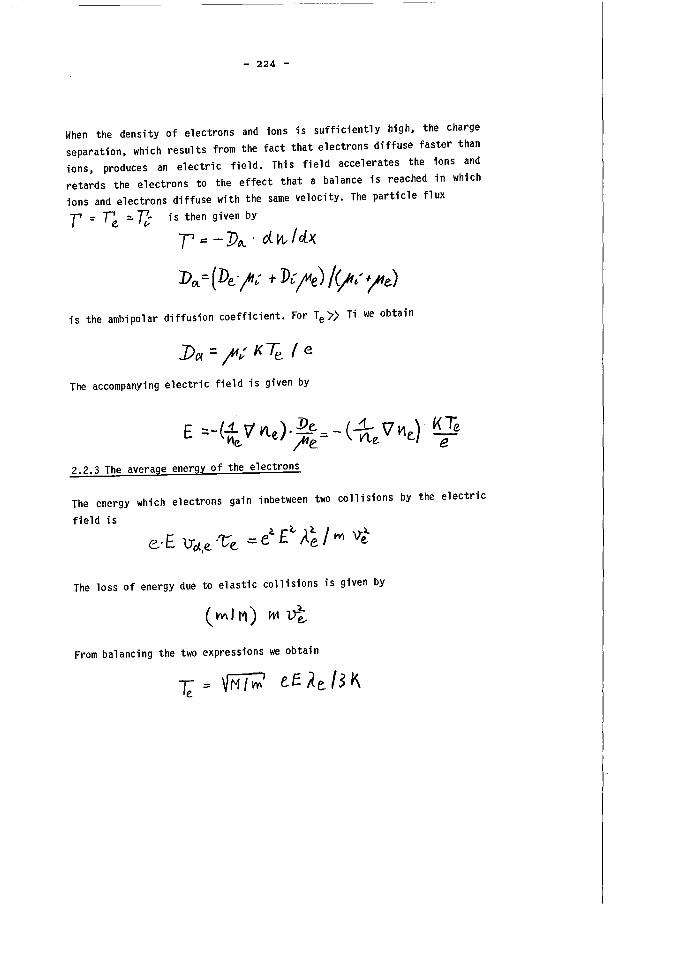
- 224 -
When the density of e1ectrons and ions is sufficient1y high, the charge
separation, which resu1ts from the fact that e1ectrons diffuse faster than
ions, produces an e1ectric fie1d. This fie1d acce1erates the ions and
retards the e1ectrons to the effect that a balance is reached in which
ions and e1ectrons diffuse with the same velocity. The partic1e f1ux
( = T'e ::. r:: i s then given by
r == - J)~ . d..11.-1 dx.
is the ambipo1ar diffusion coefficient. For Te » Ti we obtain
The accompanying e1ectric fie1d is given by
2.2.3 The average energy of the e1ectrons
The energy which e1ectrons gain inbetween two collisions by the e1ectric
fie1d is
The 10ss of energy due to e1astic co11isions is given by
From ba1ancing the two expressions we obtain
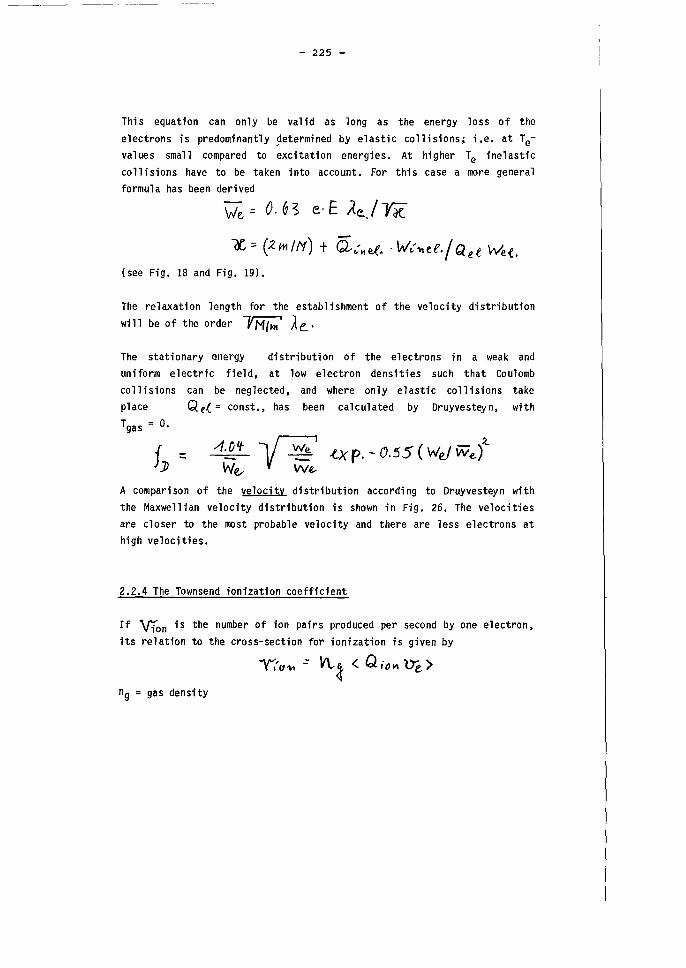
- 225 -
Thi s equation can only be val id as long as the energy loss of the
electrons is predominantly getermined by elastic collisions; i .e. at Te-
values small compared to excitation energies. At higher Te inelastic
co 11 i sions have to be taken i nto account. For thi s ca se a more general
formula has been derived
Vle- = O. &3 e,. E A.e.../Y5t
7l = (21411/'1) t Q-':I\~ •. "'':'tIee) Qee We{.
(see Fi g. 18 and Fi g. 19).
The relaxation length for the establishment of the velocity distribution
will be of the order l'M/m i Ae..
The stati onary energy distribution of the electrons in a weak and
uniform electric field, at low electron densities such that Coulomb
collisions can be neglected, and where only elastic collisions take
place Qf.( = const., has been calculated by Druyvesteyn, with
Tgas = O.
A comparison of the velocity distribution according to Druyvesteyn with
the Maxwellian velocity distribution is shown in Fig. 26. The velocities
are closer to the most probable velocity and there are less electrons at
high velocities.
2.2.4 The Townsend ionization coefficient
If \!ion is the number of ion pairs produced per second by one electron,
its relation to the cross-section for ionization is given by
Y;'I11-t .: h,~ ( 0"01-\ lYe.> ng = gas density
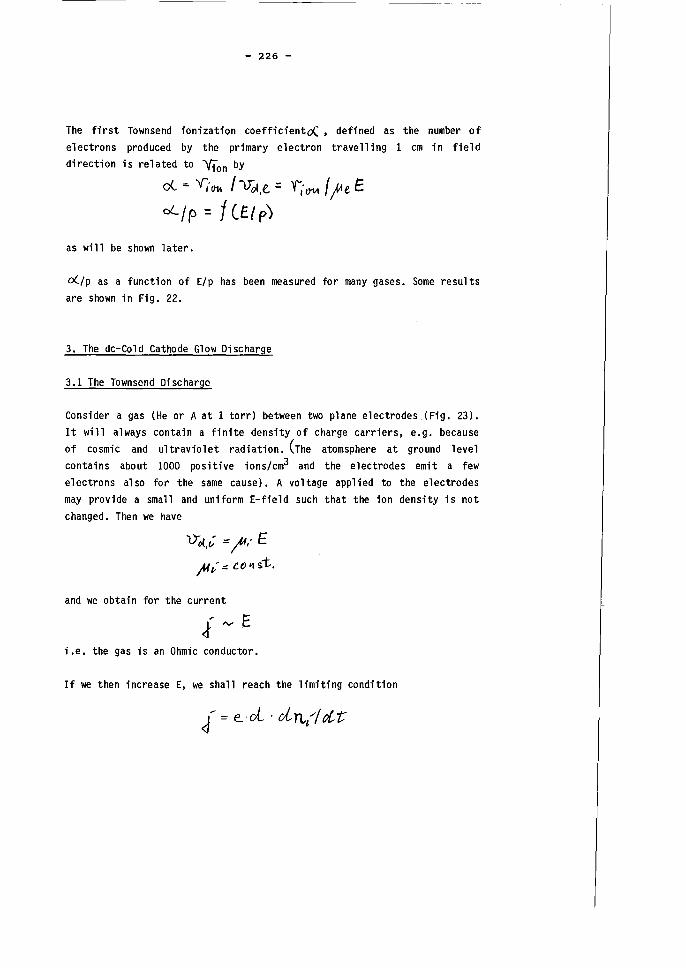
- 226 -
The first Townsend ionization coefficiento(, deflned as the number of electrons produced by the primary electron travelling 1 cm in field direction is related to Vion by
ci-- =- 'V,'rJ1r. /VoI,e. = Y",'()"A./fe.E öC/p = f (EI p)
as will be shown later.
o(/p as a function of E/p has been measured for many gases. So me results are shown in Fig. 22.
3. The dc-Cold Cathode Glow Discharge
3.1 The Townsend Discharge
Consider a gas (He or A at 1 torr) between two plane electrodes.(Fig. 23). It will always contain a finite density of charge carriers, e.g. because of cosmic and ultraviolet radiation. (The atomsphere at ground level contains about 1000 positive ions/cm3 and the electrodes emit a few electrons also for the same cause). A voltage applied to the electrodes may provide a small and uniform E-field such that the ion density is not changed. Then we have
trol,t-" ::: 1'" E }h- == C() 'I st.
and we obtain for the current
i .e. the gas is an Ohmic conductor.
If we then increase E, we shall reach the limiting condition
i:; e.·oL . dn/I d't
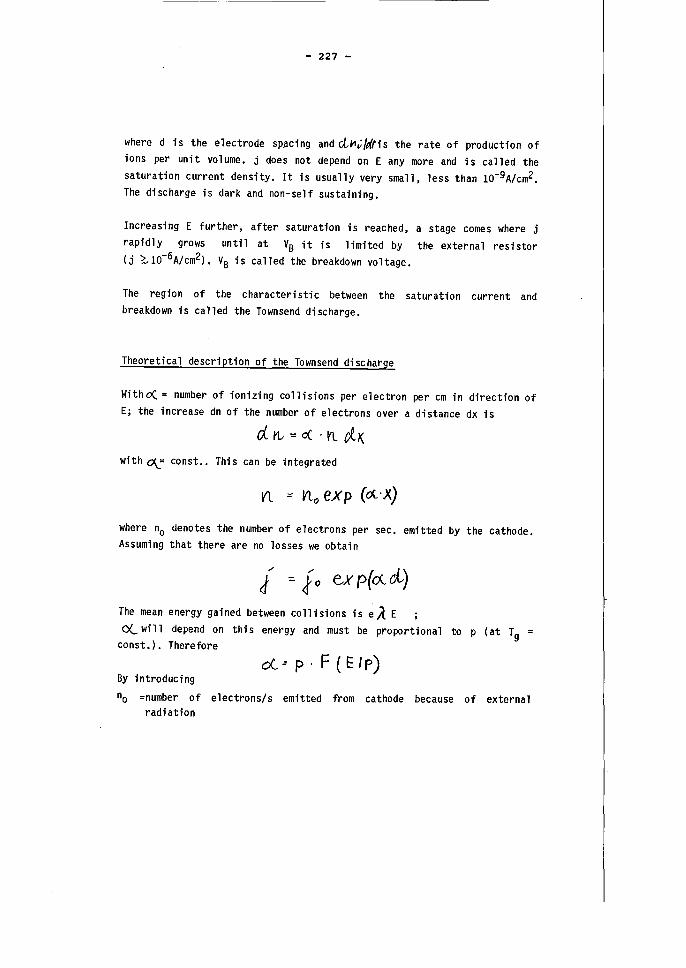
- 227 -
where d is the electrode sPlicing and ci~,;ft;(fis the rate of production of ions per unit volume. j does not depend on E any more and is ca11ed the saturation current density. It is usually very small, less than lO-9 A/cm2• The discharge is dark and non-self sustaining.
Increasing E further, after saturation is reached, rapidly grows until at VB it is limited by (j ~lO-6A/cm2l. VB is called the breakdown voltage.
a stage comes where j
the external resistor
The region of the characteristic between the saturation current and breakdown is called the Townsend discharge.
Theoretical description of the Townsend discharge
Witho( = number of ionizing collisions per electron per cm in direction of E; the increase dn of the number of electrons over a distance dx is
with ~= const •. This can be integrated
where no denotes the number of electrons per sec. emitted by the cathode. Assuming that there are no losses we obtain
J The mean energy gained between collisions is e A E
<X.. wi 11 depend on thi s energy and must be proportional to p (at T 9 const.l. Therefore
By introducing ci..~ p. F (Elf)
no =number of electrons/s emitted from cathode because of external radiation
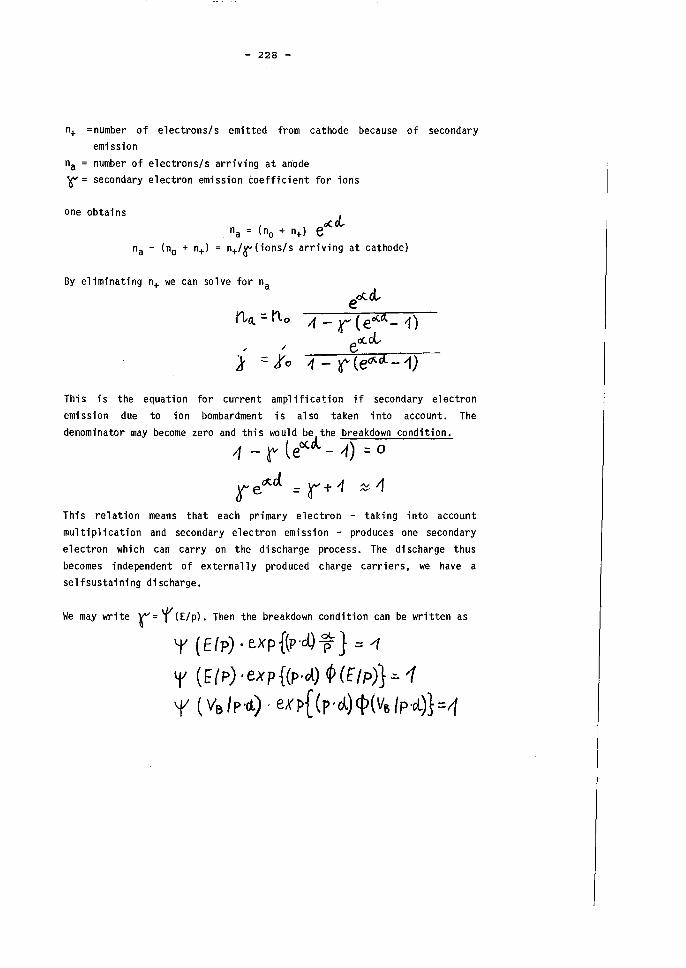
- 228 -
n+ = number of e lectronsl semitted from cathode because 0 f secondary
emi ssion
na = number of electrons/s arriving at anöde
~= secondary electron emission coefficient for ions
one obtains ",d.
na = (no + n+) e na - (no + n+) = n+/~(ions/s arriving at cathode)
By eliminating n+ we can solve for na
,
This is the equation for current amplification if secondary electron
emission due to ion bombardment is also taken into account. The
denominator may become zero and this would be the breakdown condition.
1 - t (eO("'- - ;f) = 0
re~c1 = r-t 1 ~-1 This relation means that each primary electron - taking into account
multi pl i cati on and secondary e 1 ectron emi ssi on - produces one secondary
e 1 ectron whi eh can carry on the discharge process. The di scharge thus
becomes independent of externally produced charge carriers, we have a
selfsustaining discharge.
We may write (= r (E/p). Then the breakdown condition can be written as
~ (Elp), exp{(p·d) ~} :; 1
r (t (p) . ex p Hp· cA) ~ (E I p)} =. 1 'V (Va /P'r1) . exp{ (p'ct) <P(Vs Ip·cl)} =1
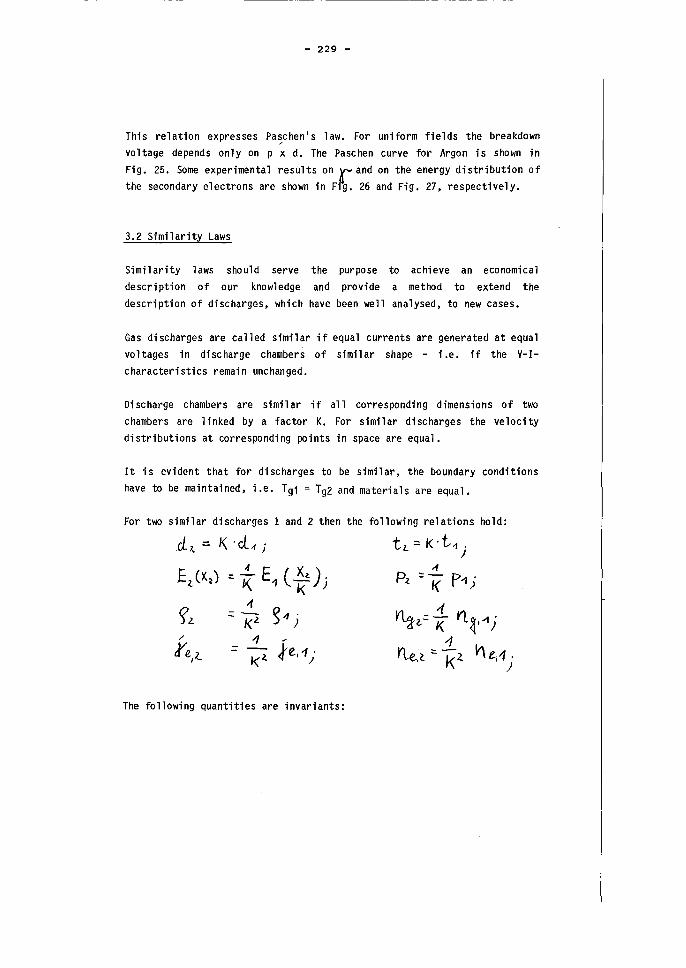
- 229 -
This relation expresses Pa~chen' s law. For uniform fields the breakdown voltage depends only on p x d. The Paschen curve for Argon is shown in
Fig. 25. Some experimental results on ~and on the energy distribution of the secondary electrons are shown in Flg. 26 and Fig. 27, respectively.
3.2 Similarity Laws
Similarity laws should serve the purpose to achieve an economical description of our knowledge and provide a method to extend the description of discharges, which have been well analysed, to new cases.
Gas discharges are called similar if equal currents are generated at equal voltages in discharge chambers of similar shape - i .e. if the V-Icharacteristics remain unchanged.
Di scharge chambers are simil ar if all corresponding dimensions of two chambers are 1 i nked by a factor K. For simil ar discharges the ve loci ty distributions at corresponding points in space are equal.
It is evident that for discharges to be similar, the boundary conditions
have to be maintained, i.e. Tg1 = Tg2 and materials are equal.
For two similar discharges 1 and 2 then the following relations hold:
cl" = 1\ 'cL, j tz. = K'L, ' )
-f P:l ::1( p~; Et (X 2 ) :: ~ E1 (~l.);
-1 ~4j
The following quantities are invariants:
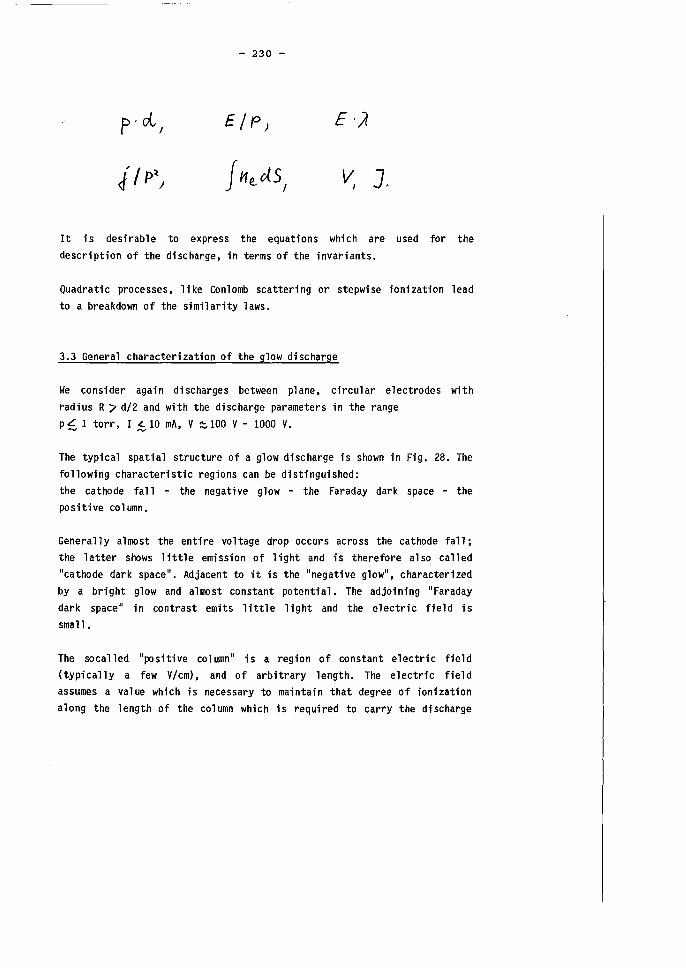
- 230 -
P' ol, E·).
V, ].
It is desirable to express the equations which are used for the
description of the discharge, in terms of the invariants.
Quadrati c processes ,li ke Conlomb scatteri ng or stepwi se ionization 1 ead
to a breakdown of the similarity laws.
3.3 General characterization of the glow discharge
We consider again discharges between plane, circular electrodes with
radius R / d/2 and with the discharge parameters in the range
p ~ 1 torr, I ~ 10 mA, V ::;.100 V - 1000 V.
The typical spatial structure of a glow discharge is shown in Fig. 28. The
following characteristic regions can be distinguished:
the cathode fall - the negative glow - the Faraday dark space - the
positive column.
Generally almost the entire voltage drop occurs across the cathode fall;
the latter shows little emission of light and is therefore also called
"cathode dark space". Adjacent to it is the "negative glow", characterized
by a bright glow and almost constant potential. The adjoining "Faraday
dark space" in contrast emits little light and the electric field is
small.
The socalled "positive col umn" is a region of constant electric field
(typicallY a few V/ern), and of arbitrary length. The electric field
assurnes a value which is necessary to maintain that degree of ionization
along the length of the column which is required to carry the discharge
- 231 -
current; i .e. an electron temperature is established which provides for ionization rates sufficient to compensate for charge carrier losses due to diffusion and recombination.
The positive column is the best studied part of the glow discharge and well understood. However, in principle it is not necessary for its existence. In the remainder of this lecture we shall not discuss it further. Dur main topics will be the description of the cathode-near region of the glow discharge, i.e. of the cathode fall and of the negative glow.
The primary electrons required to maintain the discharge are emitted by the cathode mainly due to bombardment by positive ions. They gain rapidly energy in the linearly decreasing electric field of the cathode fall. With typical current densities of 1 mA/m2 and electron velocities above 109cm/ s electron densities will be low (~107/cm3). On the other hand the electron energy is sufficient for ionization and multiplication. At the end of the cathode fall (E % 0; at x = d) nearly all of the current is carried by the electrons.
Ions entering the cathode fall from the edge of the negative glow or due to ionization of atoms in the cathode fall are accelerated towards the cathode. Their energy gain in general is limited by charge exchange collisions such that approximately the relation \rI~(X) ~e Ec. ~cx holds. Near the cathode the total current i s carri ed predominantl y by the ions. With E/p ~ 103V/cm torr one obtains in helium for the drift velocity
vd,He ~ 106cm/s and for ni ~ 10101cm3; i .e. there is a positive space charge in front of the cathode which determines the E-field distribution. Measurements have shown that E decreases linearly; i .e. ~ (X) % const. With dc denoting the thickness of the cathode fall, we have at the cathode
Ec = 2 Vc/dc•
From the V-I characteri sti c shown in Fi g. 24 we 1 earn that we have to distinguish two different modes of operation of the glow discharge.
- 232 -
a) The normal glow, where Vc remains constant with increasing current.
At low currents the discharge exists only in a small channel with
dimensions small compared to the· cathode radius. With increasing
current, at constant current density, it will spread out over the
cathode until it covers the available area. Within this range of
currents the properties of the cathode fall do not change.
b The abnormal glow, where Vc increases with increasing current and the
current density increases also) while dc decreases. A discharge
characteristic, obtained for argon is shown in Fig. 29 and compared
with the results of a simple model using different values for y-, the
yield of secondary electrons.
In this lecture we shall mainly be concerned with slightly abnormal glow
discharges. In this case a beam of fast electrons enters the negative
glowj excitation and ionization of the gas atoms is possible without
additional energy gain by an electric fieldj the extension of this region
i s determined by the range of the electrons before their mean energy i s
reduced to a value below the threshold for excitation and ionization (Fig.
30). The adjoining Faraday dark space is a transition region to the
positive columnj the electric field is small, and electron energy and
excitation of atoms is lowj it serves for matching the electron density in
the negative glow by diffusion to that of the positive column.
3.4 Theoretical models and estimates
3.4.1 A simplified model of the abnormal cathode fall
We consider a glow discharge in the abnormal region of the V-I
characteristic, e.g. at Vc ~ 1000 V and j ~ 1 ~A/cm2, and choose a cathode
with r;t. 0.3. For the energy of the electrons at a distance x from the
cathode we may then assume that it is approximately equal to Vle.. (x)
e V (x), where V (x) is the value of the electric potential at x.
Looking at the cross-sections for excitation and ionization by electron
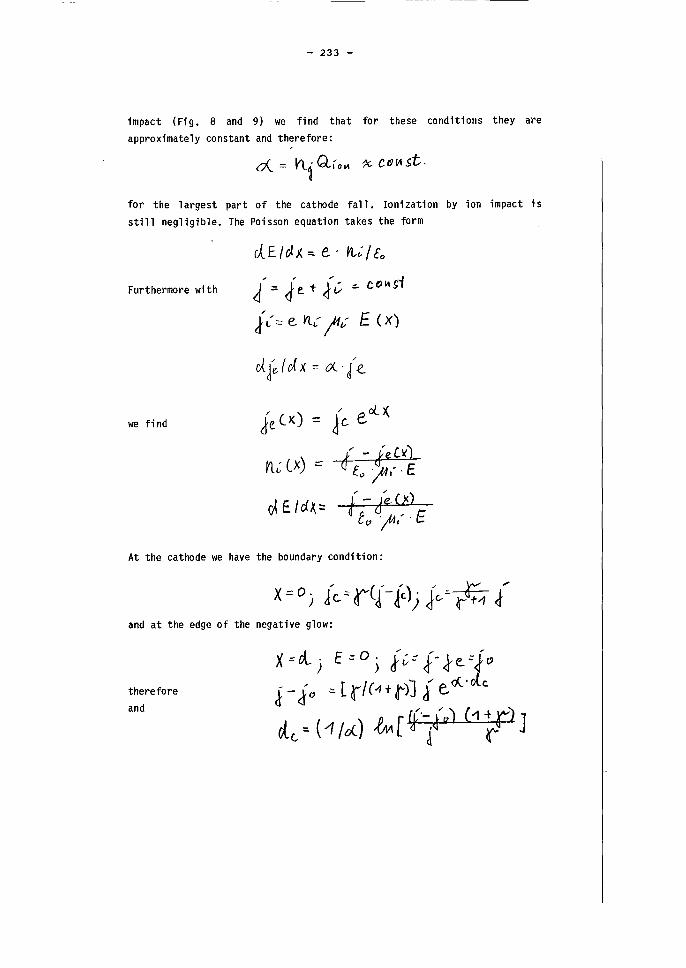
- 233 -
impact (Fig. 8 and 9) we find that for these conditions they are
approximately constant and therefore:
for the largest part of the cathode fall. Ionization by ion impact is still negligible. The Poisson equation takes the form
Furthermore with
we fi nd
rlE/c1x=.e· 'Il.;/[o
i::: Je.- t i~ ;:, C()k~i
i t:::: e Vl; jI~ E (X)
cA J~ ( of X ~ cX.. [e..
Vl.~ LX) :::
At the cathode we have the boundary condition:
and at the edge of the negative glow:
therefore
and
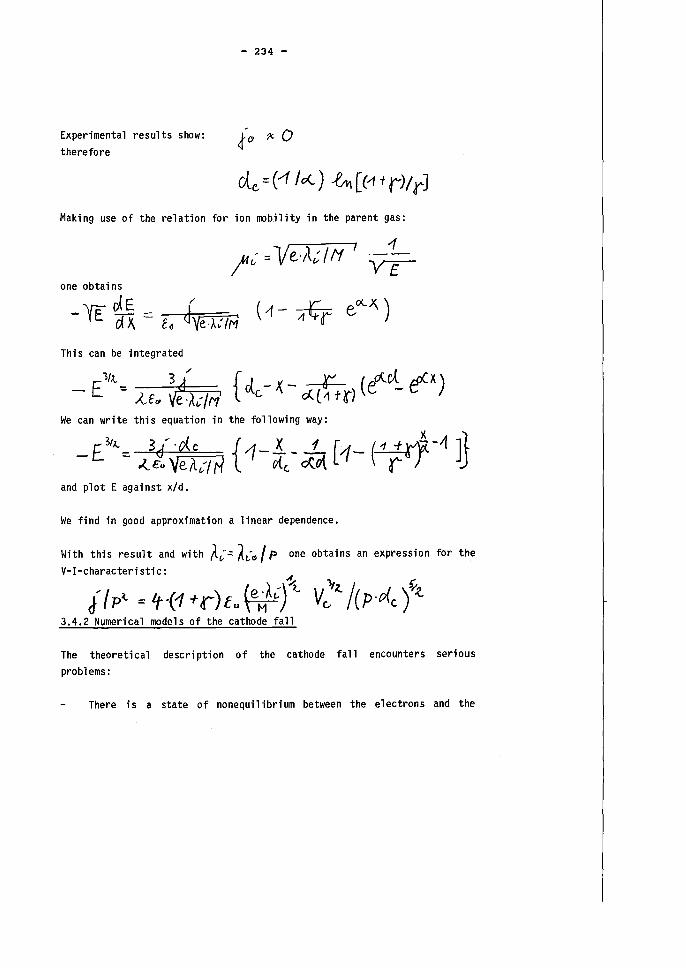
Experimental results show: therefore
- 234 -
Making use of the relation for ion mobility in the parent gas:
one obtains
This can be integrated
E1
/l... _ 3l {vt -X--+-- (~ct e-X) - - ~E" Ve )..,;/'1' c.. c(( -1 t ~-) e -
We can write this equation in the following way:
and plot E against x/d.
We find in good approximation a linear dependence.
With this result and with ~c:.: Al:" I p one obtains an expression for the V-I-characteristic:
llp~ ='t{1+r)tu~et-fcft V:/~/(p·rJ..c)>;~ 3.4.2 Numerical models of the cathode fall
The theoretical description of the cathode fall encounters serious problems:
There is astate of nonequilibrium between the electrons and the
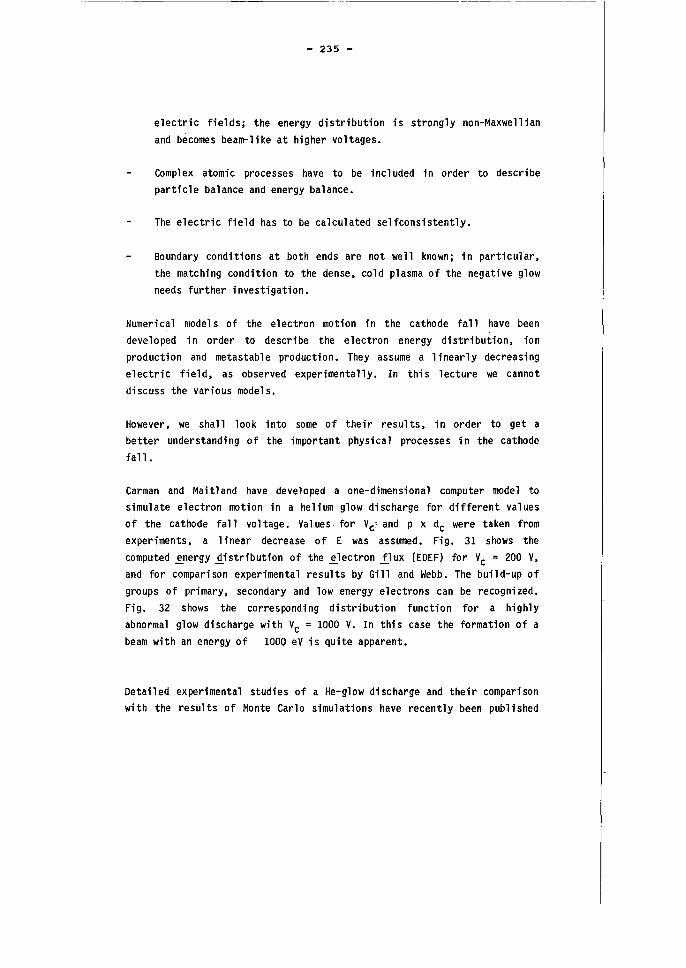
- 235 -
electric fields; the energy distribution is strongly non-Maxwellian
and becomes beam-like at higher voltages.
Complex atomic processes have to be included in order to describe
particle balance and energy balance.
The electric field has to be calculated selfconsistently.
Boundary conditions at both ends are not well known; in particular,
the matching condition to the dense, cold plasma of the negative glow
needs further investigation.
Numerical models of the electron motion in the cathode fall have been
developed in order to describe the electron energy distribution, ion
production and metastable production. They assume a 1 inearly decreasing
e 1 ectri c fi e 1 d, as observed experimenta lly. In thi s lecture we cannot
discuss the various models.
However, we shall look into some of their results, in order to get a
better understandi ng of the important physi ca 1 processes in the cathode
fall .
Carman and Maitland have developed a one-dimensional computer model to
simulate electron motion in a helium glow discharge for different values
of the cathode fall voltage. Yalues for Yc :' and p x dc were taken from
experiments, a linear decrease of E was assumed. Fig. 31 shows the
computed ~ergy iistribution of the ~lectron .!.lux (EDEF) for Yc = 200 Y,
and for comparison experimental results by Gill and Webb. The build-up of
groups of primary, secondary and low energy electrons can be recognized.
Fig. 32 shows the corresponding distribution function for a highly
abnormal glow d i sc harge wi th Y c = 1000 Y. In thi s case the formati on 0 f a
beam with an energy of 1000 eY is quite apparent.
Detailed experimental studies of a He-glow discharge and their comparison
with the results of Monte Carlo simulations have recently been published
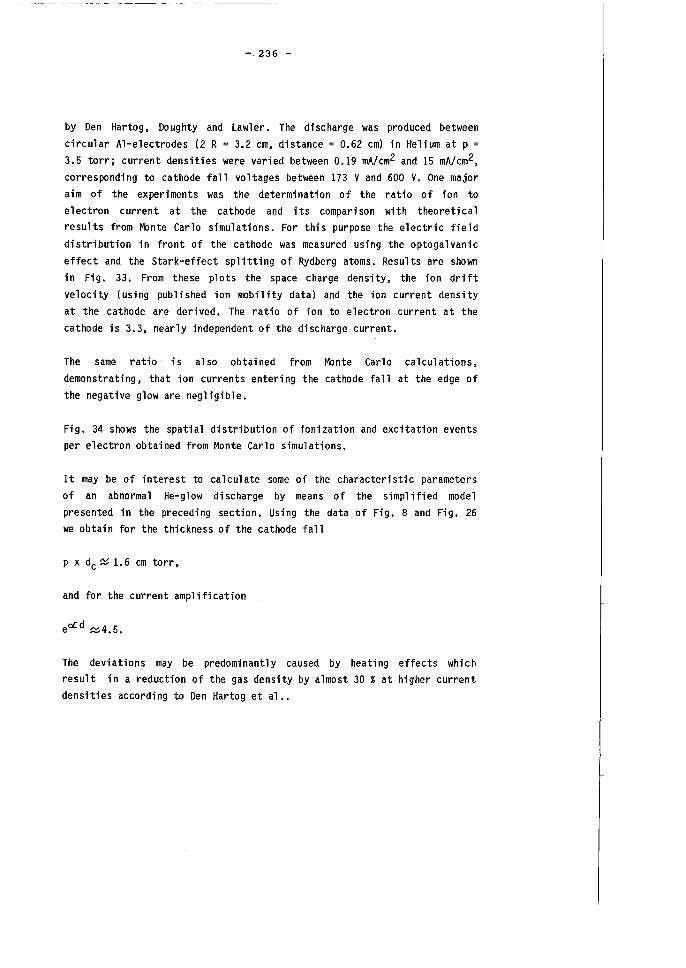
-. 236 -
by Den Hartog, 00 ughty and Lawl er. The d i sc harge was produced between circular Al-electrodes (2 R = 3.2 cm, distance = 0.62 cm) in Helium at p =
3.5 torr; current densities were varied between 0.19 mA/cm2 and 15 mA/cm2, corresponding to cathode fall voltages between 173 V and 600 V. One major aim of the experiments was the determination of the ratio of ion to electron current at the cathode and its comparison with theoretical results from Monte Carlo simulations. For this purpose the electric field distribution in front of the cathode was measured using the optogalvanic effect and the Stark-effect splitting of Rydberg atoms. Results are shown in Fig. 33. From these plots the space charge density, the ion drift velocity (using published ion mobility data) and the ion current density at the cathode are derived. The ratio of ion to electron current at the cathode is 3.3, nearly independent of the discharge current.
The same ratio is also obtained from Monte Carlo calculations, demonstrating, that ion currents entering the cathode fall at the edge of the negative glow are negligible.
Fig. 34 shows the spatial distribution of ionization and excitation events per electron obtained from Monte Carlo simulations.
It may be of interest to ca 1 cul ate some of the characteri sti c parameters of an abnormal He-glow discharge by means of the simplified model presented in the preceding section. Using the data of Fig. 8 and Fig. 26 we obtain for the thickness of the cathode fall
p x dc X 1.6 cm torr,
and for the current amplification
eoCd z4.5.
The deviations may be predominantly caused by heating effects which result in a reduction of the gas density by almost 30 % at higher current densities according to Den Hartog et al •.
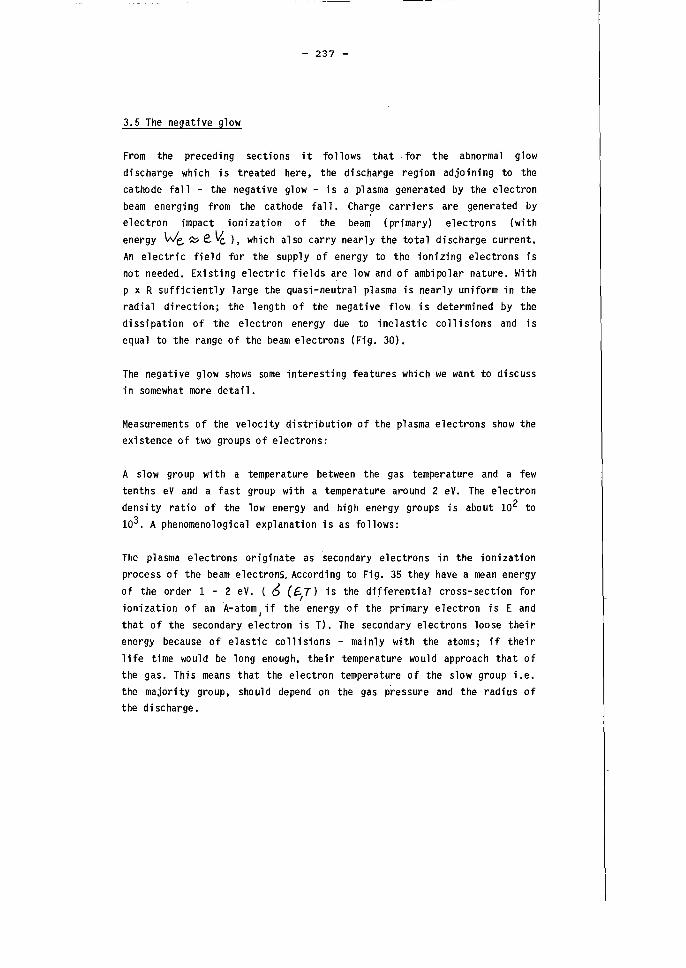
- 237 -
3.5 The negative glow
From the preceding sections it follows that ,for the abnormal glow
discharge which is treated here. the discharge region adjoining to the
cathode fall - the negative glow - is a plasma generated by the electron
beam energing from the cathode fall. Charge carriers are generated by
electron impact ionization of the beam (primary) electrons (with
energy We, ~ e ~ ). which also carry nearly the total discharge current.
An electric field for the supply of energy to the ionizing electrons is
not needed. Existing electric fields are low and of ambipolar nature. With
p x R sufficiently large the quasi-neutral plasma is nearly uniform in the
radial direction; the length of the negative flow is determined by the
dissipation of the electron energy due to inelastic collisions and is
equal to the range of the be am electrons (Fig. 30).
The negative glow shows some interesting features which we want to discuss
in somewhat more detail.
Measurements of the velocity distribution of the plasma electrons show the
existence of two groups of electrons:
A slow group with a temperature between the gas temperature and a few
tenths eV and a fast group with a temperature around 2 eV. The electron
densi ty ratio of the low energy and high energy groups i s about 102 to
103 . A phenomenological explanation is as follows:
The plasma electrons originate as secondary electrons in the ionization
process of the beam electronS. According to Fig. 35 they have a mean energy
of the order 1 - 2 eV. ( eS (E,Tl is the differential cross-section for
ionization of an A-atom I if the energy of the primary electron i s E and
that of the secondary electron is T). The secondary electrons loose their
energy because of elastic collisions - mainly with the atoms; if their
life time would be long enough. their temperature would approach that of
the gas. This means that the electron temperature of the slow group i.e.
the majority group. should depend on the gas pressure and the radius of
the d i sc harge .
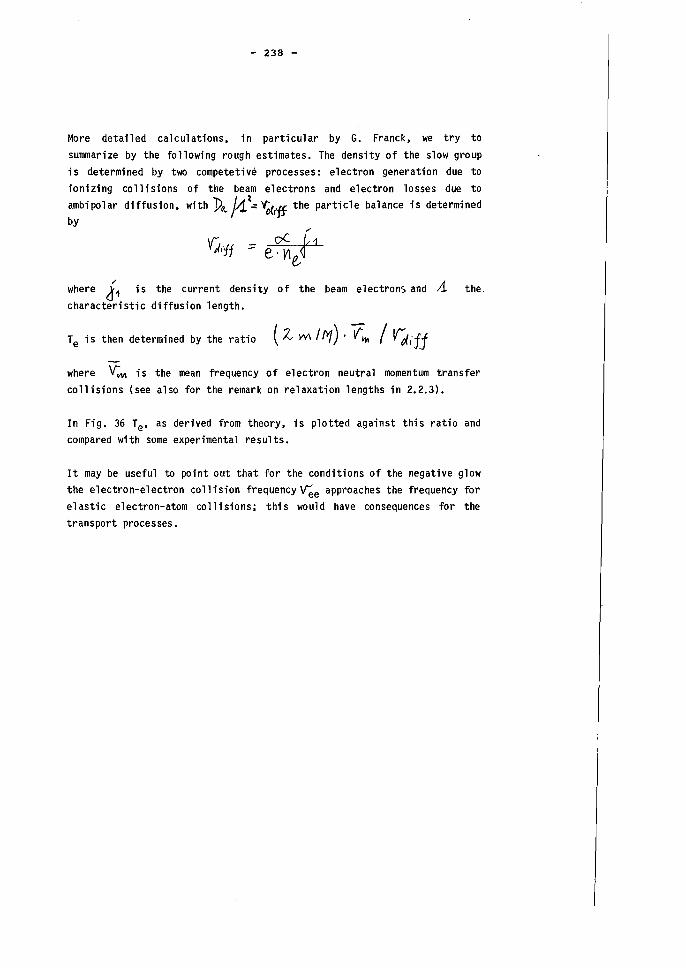
- 238 -
More deta1led calculations, in particular by G. Franck, we try to
summarize by the following rough estimates. The density of the slow group
i s determined by two competetive processes : electron generation due to
ionizing collisions of the beam electrons and electron losses due to
ambipolar diffusion, with J)tt /4t", ~'Jf the particle balance is determined
by
where J., i s the current density 0 f the be am e 1 ectronS and A the
characteristic diffusion length.
Te i s then determined by the ratio ( Z Vv'\ / fY/) . V'ItI I 'Id.'ff
where V->M is the mean frequency of electron neutral momentum transfer
collisions (see also for the remark on relaxation lengths in 2.2.3).
In Fig. 36 Te' as derived from theory, is plotted against this ratio and
compared with some experimental results.
It may be useful to point out that for the conditions of the negative glow
the electron-electron collision frequencY~e approaches the frequency for
elastic electron-atom collisions; this would have consequences for the
transport processes.
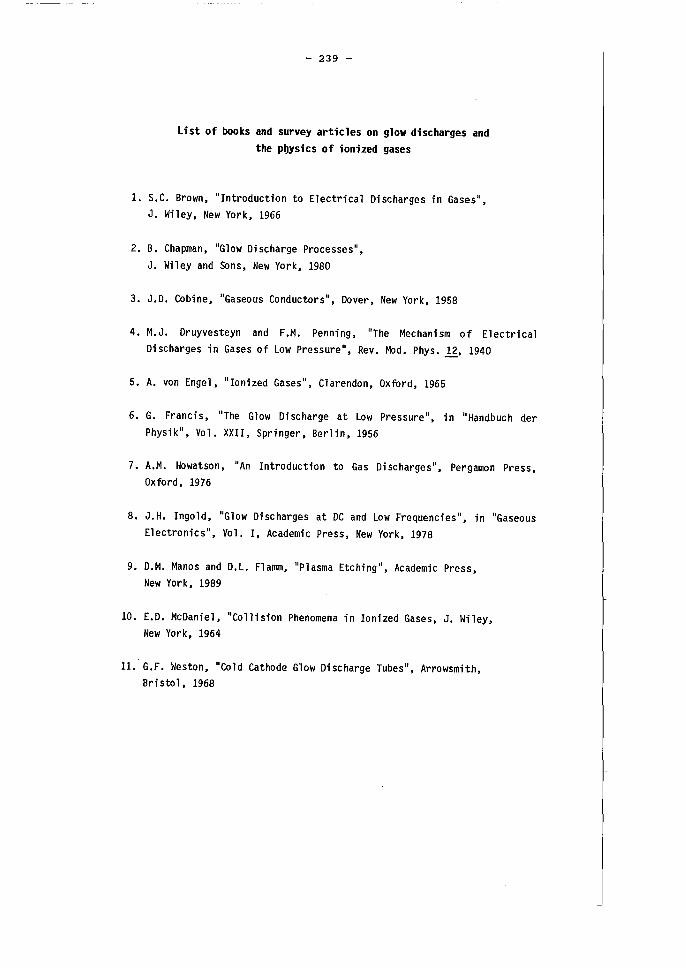
- 239 -
list of books and survey articles on glow discharges and
the p~sics of ionized gases
1. S.C. Brown, "Introduction to Electrical Discharges in Gases", J. Wiley, New York, 1966
2. B. Chapman, "Glow Discharge Processes",
J. Wiley and Sons, New York, 1980
3. J.D. Cobine, "Gaseous Conductors", Dover, New York, 1958
4. M.J. Druyvesteyn and F.M. Penning, "The Mechanism of Electrical Discharges in Gases of Low Pressure", Rev. Mod. Phys. 11, 1940
5. A. von Engel, "Ionized Gases", Clarendon, OXford, 1965
6. G. Francis, "The Glow Discharge at Low Pressure" , in "Handbuch der Physik", Vo 1. XXII, Spri nger, Berl in, 1956
7. A.M. Howatson, "An Introduction to Gas Discharges", Pergamon Press, Oxford, 1976
8. J.H. Ingold, "Glow Discharges at DC and Low Frequencies", in "Gaseous
Electronics", Vol. I, Academic Press, New York, 1978
9. D.M. Manos and D.L. Flamm, "Plasma Etching", Academic Press, New York, 1989
10. E.D. McDaniel, "Collision Phenomena in Ionized Gases, J. Wiley, New York, 1964
11.' G.F. Weston, "Cold Cathode Glow Discharge Tubes" , Arrowsmith, Bristol, 1968
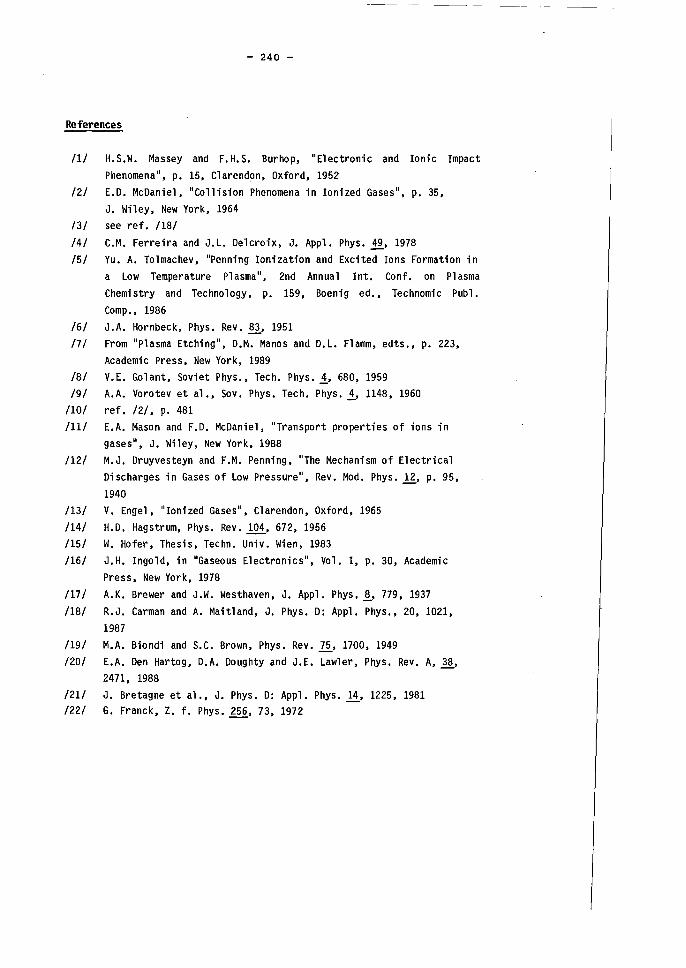
- 240 -
References
/1/ H.S.W. Massey and F.H.S. Burhop, "Electronic and Ionic Impact
Phenomena", p. 15, Clarendon, Oxford, 1952
/2/ E.D. McDaniel, "Collision Phenomena in Ionized Gases", p. 35,
J. Wiley, New York, 1964
/3/ see ref. /18/
/4/ C.M. Ferreira and J.L. Delcroix, J. Appl. Phys.~, 1978
/5/ Yu. A. TOlmachev, "Penning Ionization and Excited Ions Formation in
a Low Temperature Plasma", 2nd Annual Int. Conf. on Plasma
Chemistry and Technology, p. 159, Boenig ed., Technomic Publ.
Comp., 1986
/6/ J.A. Hornbeck, Phys. Rev. 83, 1951
/7/ From "Plasma Etching", D.M. Manos and D.L. Flamm, edts •• p. 223,
Academic Press, New York, 1989
/8/ V.E. Golant, Soviet Phys., Tech. Phys • .1, 680, 1959
/9/ A.A. Vorotev et al., Sov. Phys. Tech. Phys • .1, 1148, 1960
/10/ ref. /2/, p. 481
/11/ E.A. Mason and F.D. McDaniel, "Transport properties of ions in
gases", J. Wiley, New York, 1988
/12/ M.J. Druyvesteyn and F.M. Penning, "The Mechanism of Electrical
Discharges in Gases of Low Pressure", Rev. Mod. phys.ll, p. 95,
1940
/13/ V. Engel, "Ionized Gases", Clarendon, Oxford, 1965
/14/ H.D. Hagstrum. Phys. Rev. 104, 672, 1956
/15/ W. Hofer, Thesis, Techn. Univ. Wien, 1983
/16/ J.H. Ingold, in "Gaseous Electronics", Vol. I, p. 30, Academic
Press, New York, 1978
/17/ A.K. Brewer and J.W. Westhaven, J. Appl. Phys. !' 779, 1937
/18/ R.J. Carman and A. Maitland, J. Phys. D: Appl. Phys., 20, 1021,
1987
/19/ M.A. Biondi and S.C. Brown, Phys. Rev. ~, 1700, 1949
/20/ E.A. Den Hartog, D.A. Doughty and J.E. Lawler, Phys. Rev. A, ~,
2471, 1988
/21/ J. Bretagne et al., J. Phys. D: Appl. Phys.~, 1225, 1981
/22/ G. Franck, Z. f. phys.lli, 73, 1972
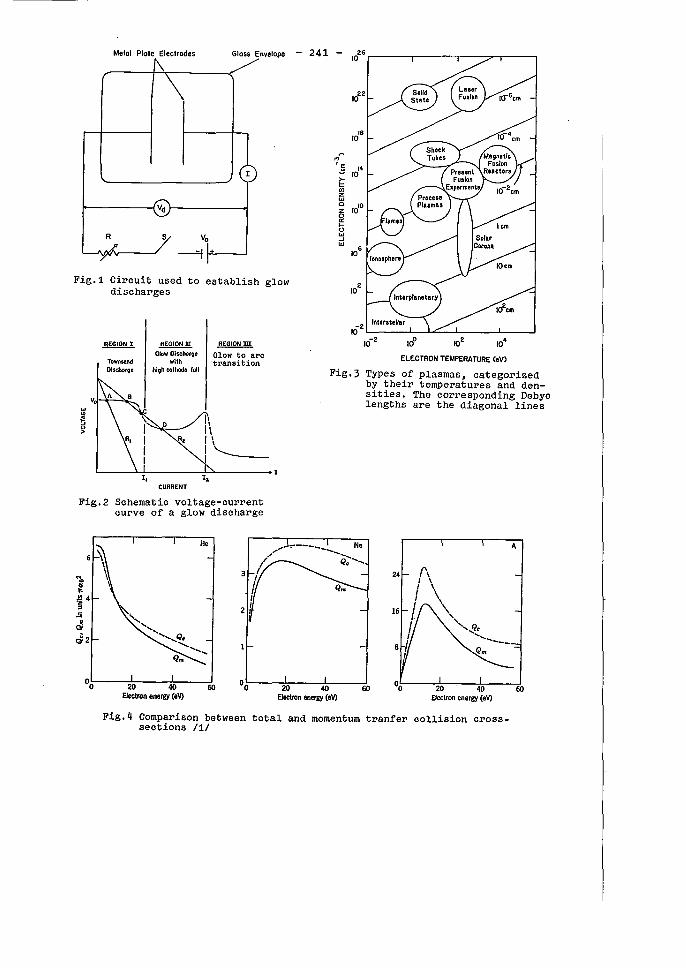
Fig.1
Melal Plale Eleclrades Glass Envelape
\
Vd
Va
---=j
Circuitused to establish glow discharges
Townsend Dischorglil
~ Glow Olscho'g,
wllh high CC1lhode fall
CURRENT
~ 010" to are "transition
I' 1\ I \ 1'------
Fig.2 SChematic vOltage-current curve of a glow discharge
- 241 - 26 10
1022
19 10
~ ,., 'e I' ~ 10 >-!:: UJ Z LU 0 z 0 0: I-<.) LU .J LU
106
102
Fig.3 ELECTRON TEMPERATURE (oV)
Types of plasmas, categorized by their temperatures and densities. The corresponding Debye lengths are the diagonal lines
A
%~----~----~----~oo Eloctran energy (eV)
Fig.4 Comparison between total and moment um tranfer collision crosssections /1/
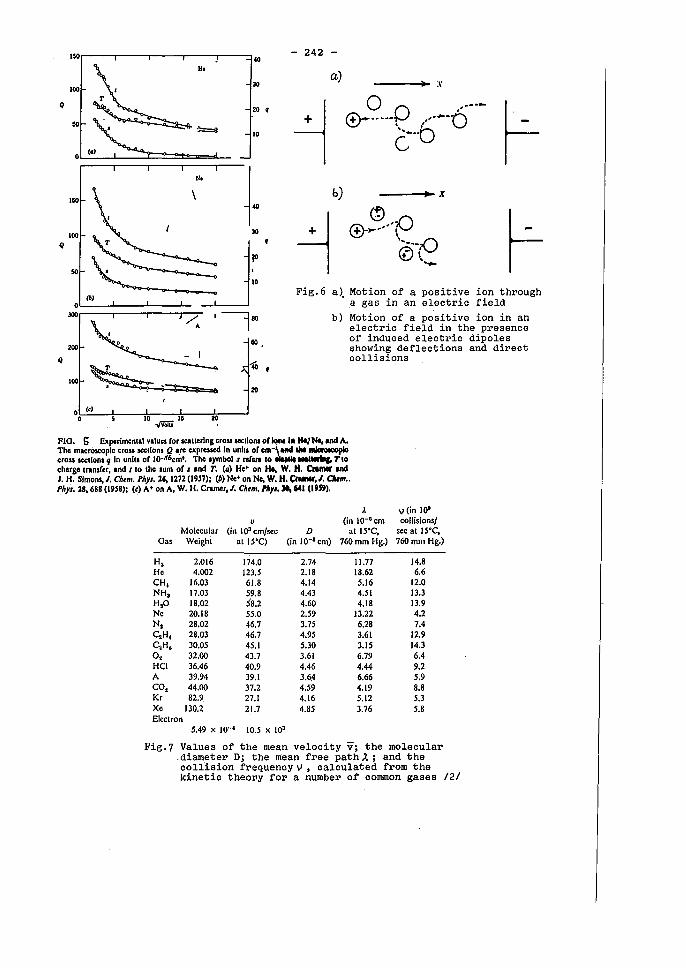
- 242
100 30
a) ----i~~ :~
-1 Q o 0 ,., .....
®-..... , ······0 ·····b c
20 9
10
o (0)
N.
150 \ ~. bJ
":(6\)~'~:: -J:' F1
J.'g+.6 -~ .. , a~ Motion of a positive ion through a gas in an electric field
.--: 0 -----=180 b) Motion of a positive ion in an
~ I electric field in the presence
o • 110 of induced electric dipoles • . showing deflections and direct
- I collisions
~.~ & :'
300
Q
200
100
o (,) 10 1$
.jVoiii 20
FIO. Ei Expcrimcnlal .alues ror "","erln, crOlllCCllons or Iona 111 Hal1'lc. and A. Thc macrOscopic cross ...,lIon. Q Ire cxprcsscd In unh. or cm-~It IM mIcroIoopIc cross ""Ilon. 'I in unlll or JO-~6cm·. Thc Iymbol I ror.n 10 NM ...... Tlo charg. nan.r.r, Ind I 10 Ihc .um or lind T. (al H.- on HI, W. H. Cnmor and J. H. Simo/1J,J. Ch.m. Phy'. 26, 1272 (19J7J; (b)N.·on N., W. H.~,J. Clr4m .. Phy'. 18,688 (1958); (c) A- on A, W. H. Cramcr, J. Ch.m. "'y"'" 641 (1959).
aas
H. He CH, NH3
H,O Ne N, C.H, C,H. 0, HCI A CO, Kr Xe
v Moleeular (in 103 ern/sec
Weighl .1 IS·C)
2.016 174.0 4.002 123.5
16.03 61.8 17.03 59.8 18.02 58.2 20.18 55.0 28.02 46.7 28.03 46.7 30.05 45.1 32.00 43.7 36.46 40.9 39.94 39.1 44.00 37.2 82.9 27.1
130.2 21.7
A (in IO-·em
D aIIS·C, (in 10-1 em) 760 mOll Hg.)
2.74 11.77 2.18 18.62 4.14 5.16 4.43 4.51 4.60 4.18 2.59 13.22 3.75 6.28 4.95 3.61 5.30 3.15 3.61 6.79 4.46 4.44 3.6.4 6.66 4.59 4.19 4.16 5.12 4.85 3.76
v (in 10' eollisions/
sec al IS·C, 760 mm Hg.)
14.8 6.6
12.0 13.3 13.9 4.2 7.4
12.9 14.3 6.4 9.2 5.9 8.8 5.3 5.8
Eleclron 5.49 x 10-' 10.5 X 10³
Fig.7 Values of the me an velocity v; the molecular .diameter D; the mean free path.:t ; and the collision frequency V • calculated from the kinetic theovy for a number of common gases /2/
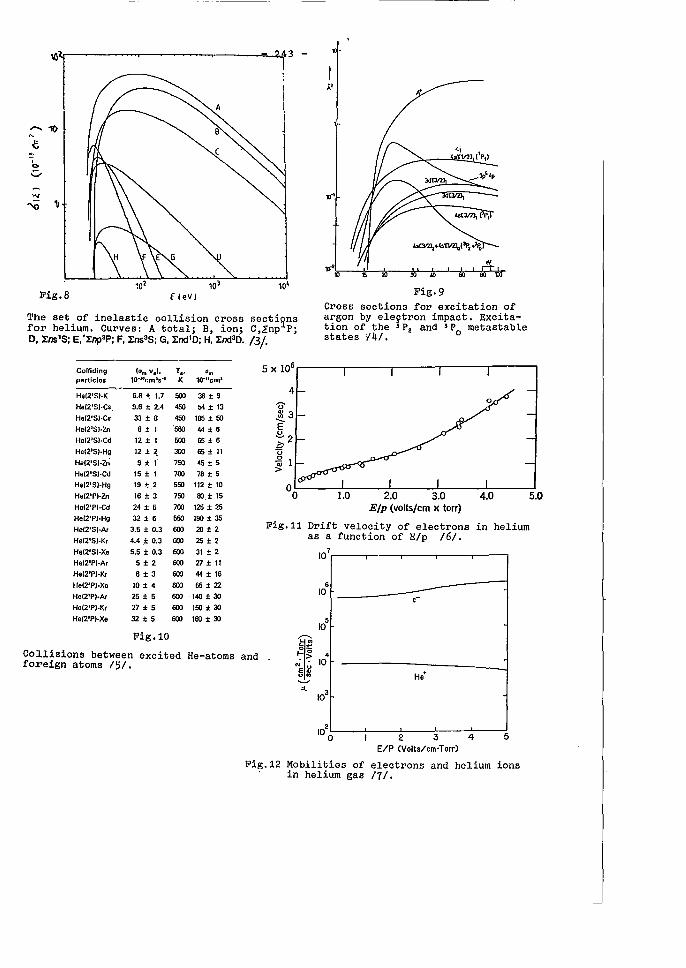
~l ~43
-11)
~ ~
C>
v
..... ...0 '\l
Fig.8 f(eV)
The set of inelastic collision cross secti~ns for helium. Curves: A total; B, ion; C,~np P; D. l:ns1S; E, '1:np3p; F.1:ns3S; G, 1:nd'O; H, 1:nd30 .. /3/.
-
,,'
1. .... ·\/21,('P1 )
Fig.9 Cross sections for excitation of argon by ele~tron impact. Excitation of the 'P2 and'P metastable states '/4/. 0
Colliding (Om v.l. T •• Dm 5xl06~----~-----.------~-----r-----.
partielos 10-lOcmJs'l K
HeI2'SI·K 6.8 ± 1.7 500
HeI2'SI·Cs 9.6 ± 2.4 450
HeI2'SI·Cs 33 ± 8 450
HeI2'SI·Zn 8 ± 1 '580
H.,2'SI·Cd 12 ± 1 500
HeI2'SI·Hg 12 ± ~ 300
HeI2'SI·zn 9 ± 1 750
HeI2'SI'Cd 15 ± 1 700
HeI2'SI·Hg 19 ± 2 550
HeI2'PI·Zn 16 ± 3 750
HoI2'PI·Cd 24 ± 5 700
10-U cm1
38 ± 9
004 ± 13
185 ± 50
44 ± 6
65 ± 6
65±11
45 ± 5
78 ± 5
112 ± 10
BO.± 15
125 ± 25
4
'Ü' 313 --E u ;2 'ü
~ 1 >
1.0 2.0 3.0 4.0 5.0 E/p (volts/cm X torr)
HeI2'PI·Hg 32 ± 6 550 190 ± 35
HeI2'SI·Ar 3.5 ± 0.3 600 20 ± 2 Fig.ll Drift velocity of electrons in helium HeI2'SI·Kr 4.4.± 0.3 600 25 ± 2
HeI2'SI·Xe 5.5 ± 0.3 600 31 ± 2
HeI2'PI·Ar 5±2 600 27±11
HeI2'P)·Kr 8 ± 3 600 44 ± 16
HeI2'PI·Xe 10 ± 4 600 55±22
HeI2'PI·Ar 25 ± 5 600 140 ± 30
HeI2'PI·Kr 27 ± 5 600 150 ± 30
HeI2'PI·Xe 32 ± 5 600 IBO ± 30
Fig.l0
Co~lisions between excited He-atoms and . foreign atoms 15/.
as a function of E/p 16/.
107
6 10
5 10
r o~
':-~ 4
N U 10 e .. u .. ......... He+ -"-
103
102
0 2 3 4 5 E/P (Volts/em'Torr)
Fig.12 Mobilities of electrons and helium ions in helium gas 17/.
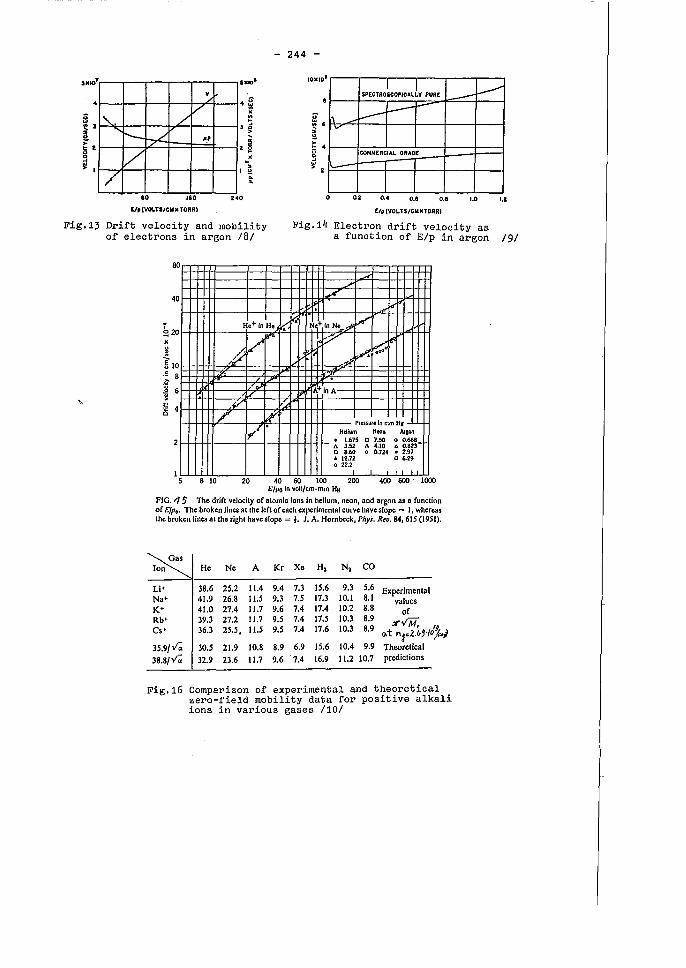
• 5_10
'/ ~ L
'r-- i-L
V /
80 160
E/,(VOI,.TS/CWXTOftR,
. ~.'
I
"0
244 -
10)(10 •
u ::: . ii !!. ,. ... u d > •
SPECTRO~COPICiAJy PURE -V I--I-
1\ --V
CONNERCIAL GRADE - I
0.. 0.' 0 .• 0.' 1.0 I.' E/p IVOL TS/CWKTORRI
Fig.13 Drift velocity and mObility of electrons in argon 181
Fig.14 Electron drift velocity as a function of E/p in argon 191
',.
0
40
I ~ 20 x
1 5
.A .;-
I ........
ßfo" He+ in He v.:. N~+ln N._~
y
V C· -;7 ~~ /. ,/. /f/ ,~
/ . '.,P A"ln A
,y ./ ~ PIemI" In r.-;m HI ,r' Helium Neo. "'Ion 1" . 1.675 [] 7.50 o 0.668
t. 3.52 A 4.10 lI. 0.823 0. 8.60. o 0.124 • 2.97 ... 12.72 Q 6.29 o 22.2
8 10 20 40 60 100 200 400 600 1000 EIPo in volt/cm-mm Hg
FJG. "i $ The drin 'velocily of 810mic ions in helium, ".con, and argon as a function of Elp,. The broken Iines atthe left of each experimental curve have _Iope = I, wherca_ the broken Iines atthe right haye _Iop. = I. J. A. Hornbeck, Phys. Rev_ 84, 615 (1951).
Gas Ion He Ne A Kr Xe H. N. CO
Li+ 38.6 25.2 11.4 9.4 7.3 15.6 9.3 5.6 Experimenlal Na+ 41.9 26.S 11.5 9.3 7.5 17.3 10.1 8.1 values K+ 41.0 27.4 11.7 9.6 7.4 17.4 10.2 8.8 of Rb+ 39.3 27.2 11.7 9.5 7.4 17.5 10.3 8.9
;;rv M, '1 es' 36.3 25.5. 11.5 9.5 7.4 17.6 10.3 8.9 u.t n~=Z,bj"O 7#,J 35.9Iv~ 30.5 21.9 10.8 8.9 6.9 15.6 10.4 9.9 Theorelical
38.8/v~ 32.9 23.6 11.7 9.6 7.4 16.9 11.2 10.7 prediclions
Fig.16 Comparison of experimental and theoretical zero-field mobility data for positive alkali ions in various gases /101
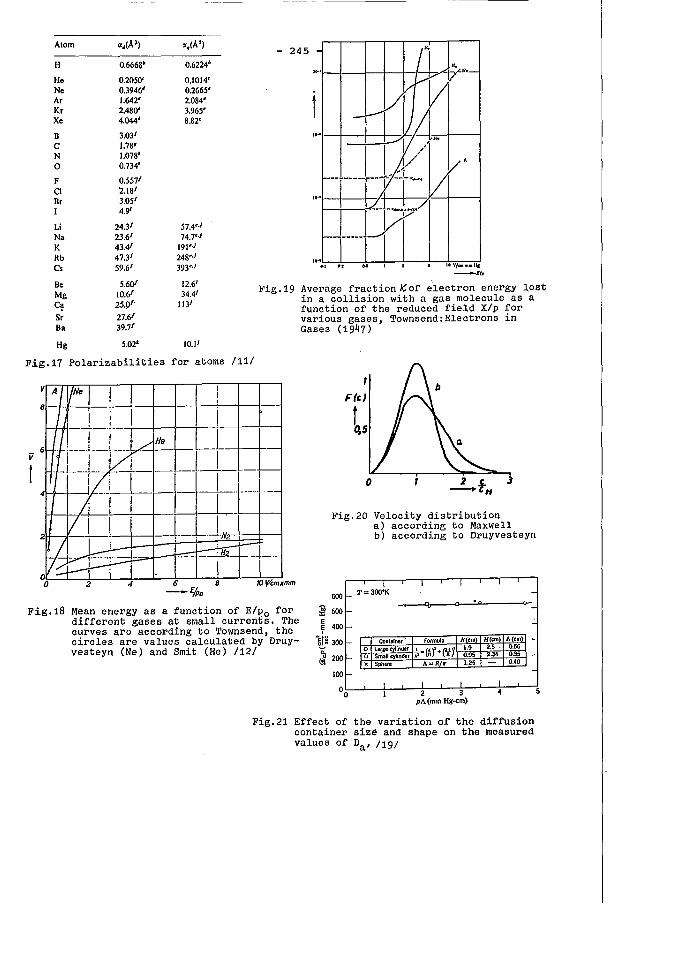
Atom
H
He Ne Ar Kr Xc
B C N 0
F CI Br I
Li Na K Rb es Be Mg C~ Sr Ba
Hg
a,(A3)
0.6668'
0.2050' 0.3946' 1.642' 2.480" 4.044'
3.0Jl 1.78' 1.078' 0.734'
0.557' 2.18' 3.05' 4.9'
24.3' 23.6' 43.4' 47.3' 59.6'
5.60' 10.6' 25.0"
27.6' 39.7'
5.02'
0.6224'
0.1014' 0.2665' 2.084' 3.965' 8.82'
57.4'J 74.7'J
191'J 248'J 393'·i
12.61 34.4 i
113i
W.li
- 245
I~'l--!---I--+--f-J
IO-~_t.,I---'~-+'---'~-+--!--:'!:-";:-:,.. __ m __ .-.:-' ...
--'Z/~
Fig.19 Average fraction~of electron energy lost in a collision with agas molecule as a function of the reduced field X/p for various gases, Townsend:Electrons in Gases (19~71
Fig.17 Polarizabilities for atoms 1111
Fig.18 Mean energy as a function of E/po for different gases at small currents, The curves are according to Townsend, the circles are values calculated by Druyvesteyn (Ne) and Smit (He) 1121
F(e)
~5
o J
Fig.20 Velocity distribution
600
~ 500
~ 400
"gi* 300 a: i3l 200
100
00
a) according to Maxwell b) according to Druyvesteyn
T= 300'K • 0
"
fOlmula R(c:m) H(em A cm)
A = R/r 1.25 0.40
2 3 pA (mm Hg-cm)
Fig,21 Effect of the variation of the diffusion container size and shape on the measured values of Da' /191
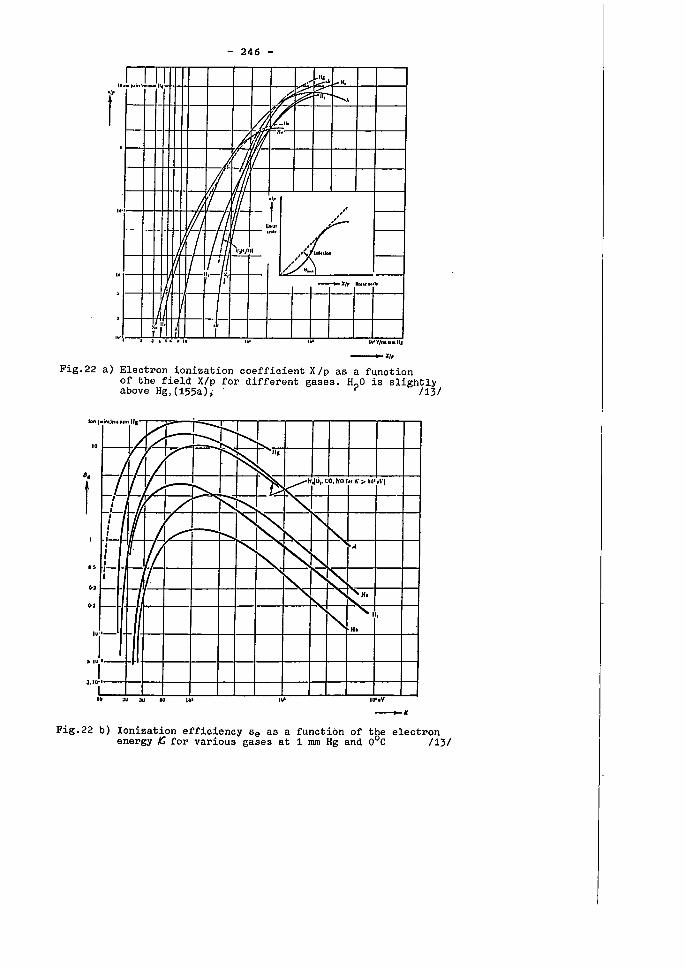
- 246 -
r .1 .. ...l.J...1 "-~'" H,
~ ~ -H, r-.. IA ~
) WfI N.
, )
,fh rt'
Li !t fl j r~ ./,
,., t .' t---111 'I E Ijn.n -
I r 'P.
~l·,H.OII ", la&!11u -IL '/ '
f-- I--/" Ba..
11,-:\, .-I --;... XI, "&I' K ....
I
Lt1 J tr A
',. I , ~ . ~,.; . '" I~ I~ III'V ••• H
Fig,22 a) Electron ionization coefficient X/p as a function of the field X/p for different gases, H?O is slightly above Hg, (155a); . /13/
'0
.... i,..'rllllmnU,
-I' /~ r-----~~ ~
10.
V -.....;:
~ 11, ", /1 ~
-I- I 11/- -~ ~H.l.OI.l'OI HO(oJr K:> !l) •• \'1
~ I " /' Kt"- "-H
~ v "-~ r-.. I"" ,
I
~/ ---I r...... l-I
" ~, d
I
'" I ,--Z ~ ~"-J
r- - ....... ....... ~N'
8,
t
•• .. , ...
r"- 'H, ·H,
U' I -
I ., .'-I ,., °i' ,. :tu ~u 60 ,0' , .. ,v ,0'
_I(
Fig.22 b) lonization efficiency se as a functibn of tee electron energy ~ for various gases at 1 mm Hg and ° C /13/
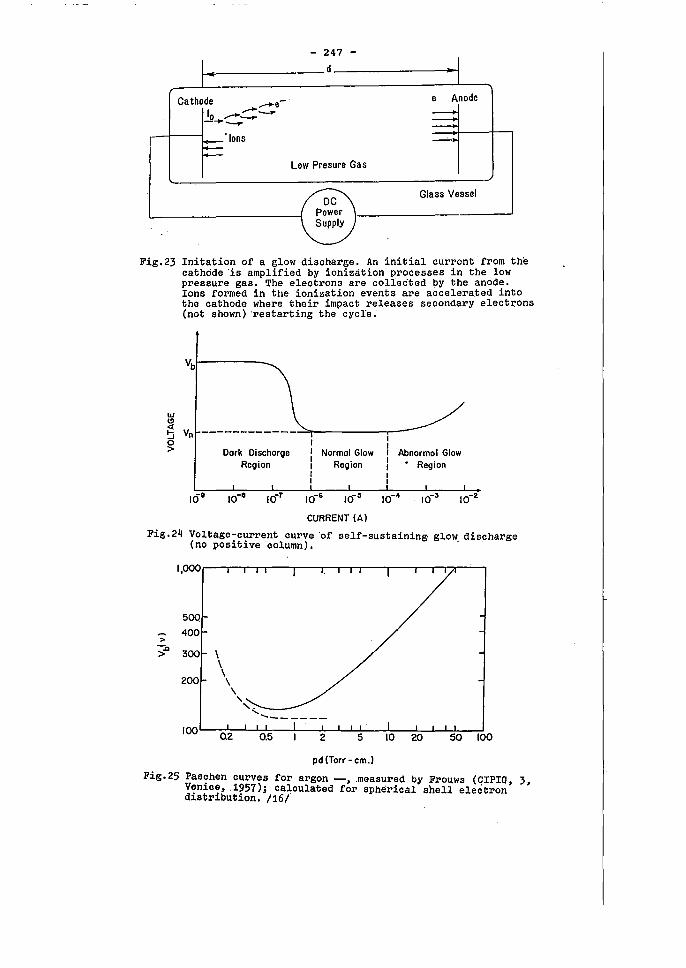
- 247 -~ ______________ d ______________ ~
e Anode
L6W Presure Gas
Glass Vessel
Fig.23 Initation of a glow discharge. An initial current from the cath6de 'is amplified by ionization processes in the low pressure gas. The electrons are collected by the anode. Ions formed in theionization events are accelera,ted into the cathode where their impact releases secondary elect~ons (not shown) 'restarting the cycl·e.
w C> cl: ~ Vn o > Dark Di scharge
Region Normal Glow
Region
CURRENT (Al
Abnormal Glow • Region
Fig.2~ Voltage7c~rrent curve 'of self-sustaining glo~ dis~harge (no pos1t1ve ·column).
1,000
500
-; 400 ~.o
300 \ > \ \
200 \ \ , , .
............. _-----100 Q2 0.5 2 5 10 20 50 100
pd (Torr - cm.l
Fig.25 Pas~hen curves for argon - •. measured by Frol.\ws (CIPIG 3. Ven1ce, .1957); calculated for spherical shell electron' distribution. /16/
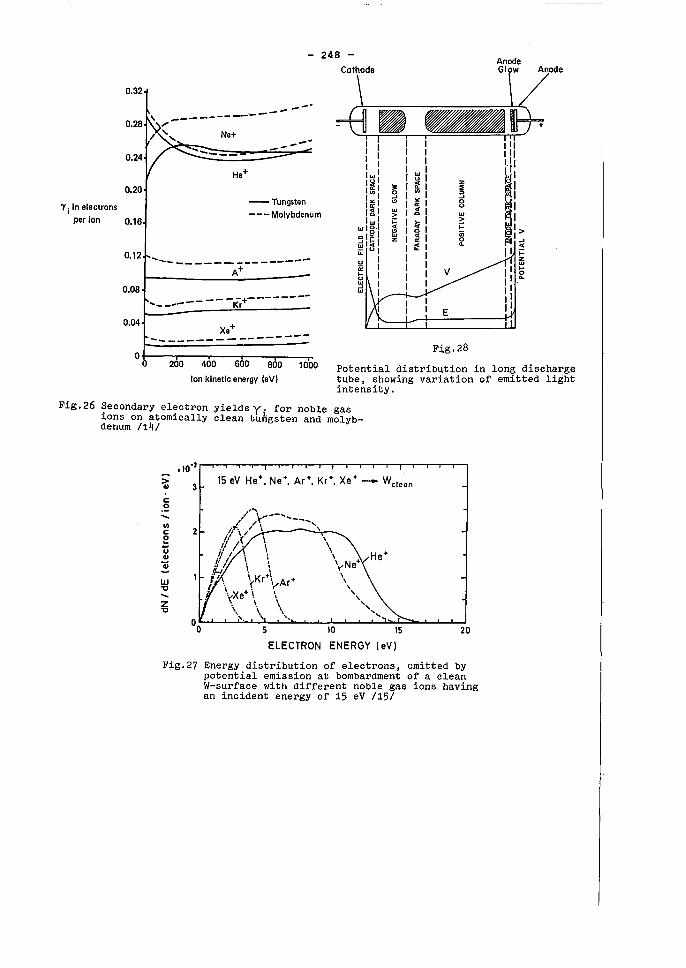
'Y i in electrons per ion
- 248 -
0.32
--' ---\ ----------0.28~
/ " Ne+ ::>- ---_.
0.24 V"""'~~-2:--=-===~..-: He+
0.20 --Tungsten
0.16 --- Molybdenum
0.12 ---------A+-------_ 0.08
'- _ .. --- ---K-;.+--------
0.04 Xe+
-----------------0~0--20rO--4~0~0--6~0~0--8'OrO--l-r000
Ion kinetlc energy (eV)
Calhode
~ j j 1 1 I I", l\;l 13;
I~ I~
",l~1 cl§!1 ~I~ I t;: 0 I
I 1 I I
:I: 5 .. '" >
~ z
1 ___ ....
E
F:i,g.28
Potential distribution in long discharge tube, showing variation of emitted light intensity.
Fig.26 Secondary electron yields Y i for noble gas ions on atomically clean tungsten and molybdenum 111J1
.10'2
> 3 CI)
c: 0
--111 c: ß u CI)
4i
w "0
--Z "0
5 10 15 20
ELECTRON ENERGY (eV)
Fig.27 Energy distribution of electrons, emitted by potential emission at bombardment of a clean W-surface with different noble gas ions having an incident energy of 15 eV 1151
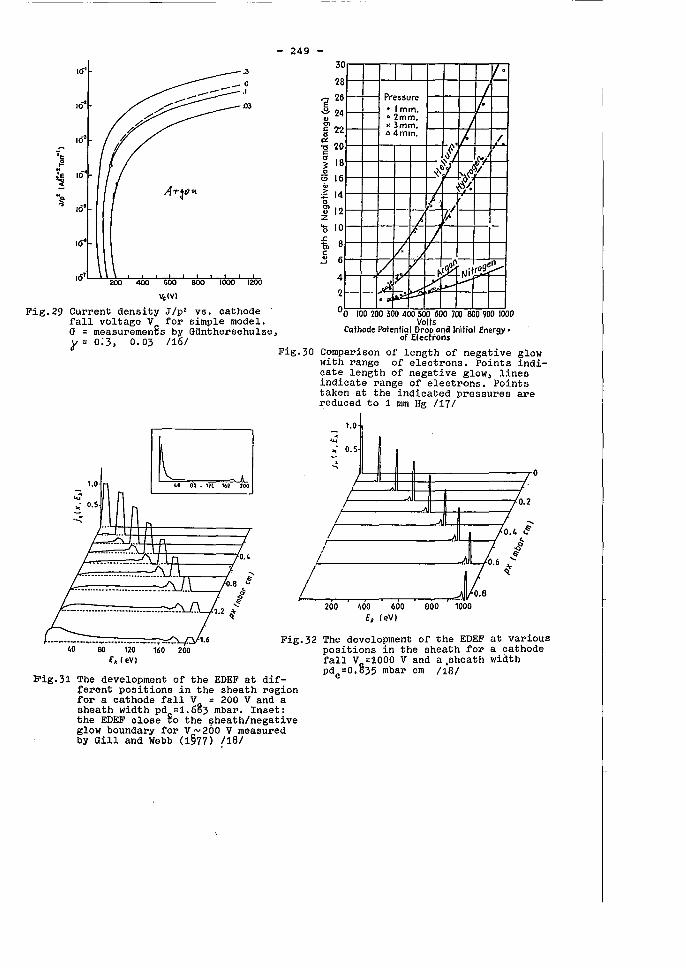
- 249 -
.~
~
~ ~
N~
Fig.29
16' .3
IÖI D3
103
IÖ'
A ... ~tlit IÖ'
10'"
Vc(V)
Current density J/p2 vs. cathode rall voltage V for simple model. G = measuremen€s by GUntherschulze, r = 0;3, 0.03 1161
Fig.30
1.0 L 40 00. 11(, '60 200
;;;. ... 0.5
.~
0.4
/ Fig.32
80 120 160 200 E. I eV)
Fig.31 The development of the EDEF at dirfe re nt positions in the sheath region ror a cathode rall V = 200 V and a sheath width pd =1.683 mbar. lnset: the EDEF close Bo the ~heath/negative glow boundary for V 'V 200 V measured by Gill and Webb (1§77) (181
0
8
3
2
E 2 ~2
6 f--
41--GI 0)
; 22 Cl "lS 20 c:
~ I 8 o G 16
~ 14
" 3' 12 z '0 10
~ 8 c:
c--
e--- Pressure
c-- ·Imm. ·2mm.
- " 3mm. A4mm.
" I
V-
V· /
lf /
~ If. I
'~I- r;-:t r-~ --:<f X' ~~Qr- c--/ X-~/,
! ~
I ~ 6
4
2
L V ~ eO
4;{ rrr _.Pi r . " .. ':::: :...- I 00 100 700 300 400 500 600 700 800 900 1000
Volts Cathode Potent~~'E?~~rr~~~ Initial Energy.
Comparison or length or negative glow with range or electrons. Points indicate length of negative glow, lines indicate range or electrons. Points taken at the indicated pressures are reduced to 1 mm Hg 1171
l.O
..; ~. 0.5 . ....
)~~-*~~.--------,O
f-----"L-II----f------tO.2
/ I
I
200 400 600 800 1000 Ek leVI
The development or the EDEF at various positions in the sheath ror a cathode fall V =1000 V and a,sheath width Pdc=0.§35 mb ar cm 1181
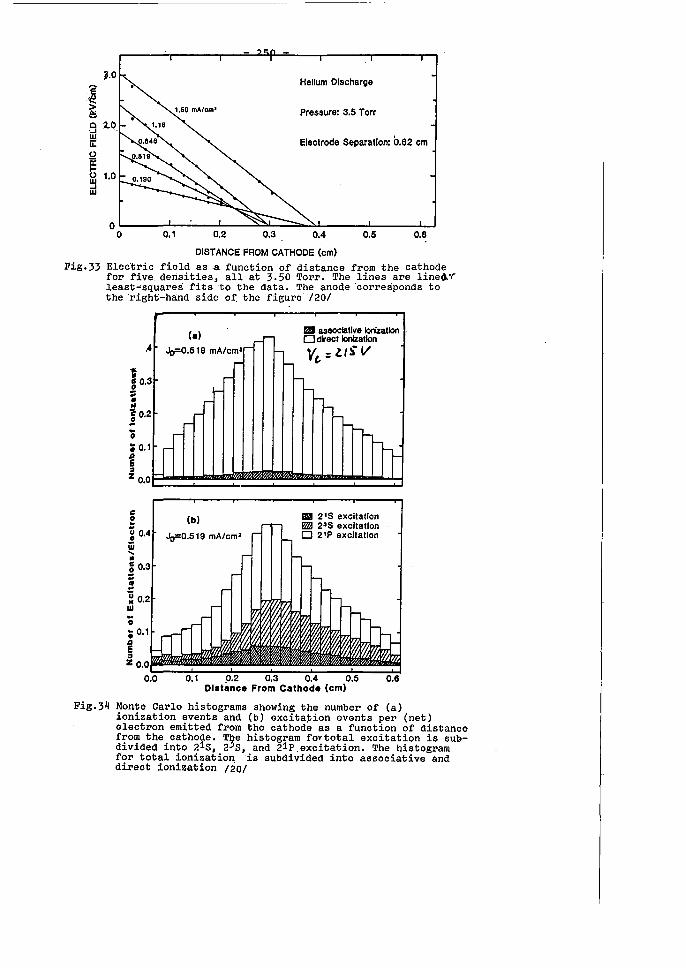
Fig.33
~,O Helium Olseharge
Pressure: 3.5 Torr
Eleetrode Separation: 0.62 cm
o~----~----~--~~~~~----~----~~ o 0.1 0.2 0.4 0.5 0.6
DISTANCE FROM CATHODE (ern)
Elee'trie l'ield asa funetion of distanee from the eathode for five,'derisities, all at 3.50 Torr. The lines are line~Y lea:st-squares fitsto the dat'a. The anbd,e 'ecirresponds to the 'right-hand side of the figure'/20/
,4 (e) "
.10=0.519 mAlern'
r: 2 (bI
j 0.4 .10=0.519 mAlern' iii ... • r: .2 .. • .. ii IC UI
0.0
1\\1 associatlve Ionizatlon o direct Ionizatlon
V" = 1./) V
m 2'8 excitallon l'llJ 2'8 exeltatlon o 2'P exeltatlon
Fig.34 Monte Carlo histograms showing the number of (a) ionization events and (b) excita~ion events per (net) electron emitted from the cathode as a function of distance from the cathode. The histogram fovtotal excitation is subdivided into 21S, 23S, and 21P,excitation. The histogram for total ionization 'is subdivided into associative and direct ionization /20/
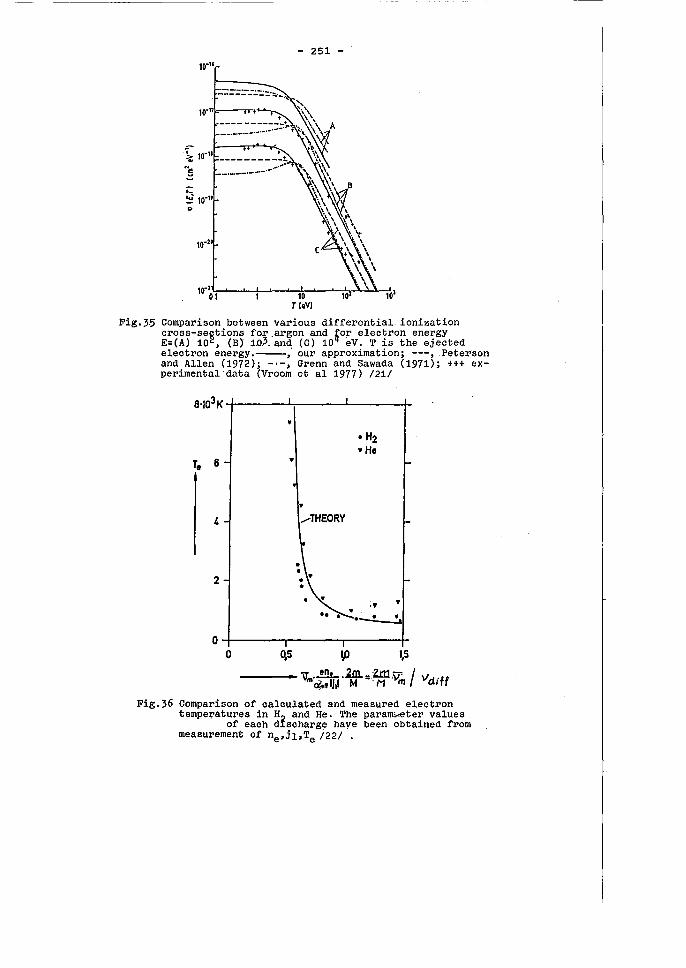
- 251 -
Fig.3-5 Comparison between various differential ionization cross-sections for_argon and ~or electron energy E=(A) 102, (B) 1D~ and (C) 10 eV. T is the ejected electron energy.---; our approximation; ---,Peterson and Allen (1972); -'-, Grenn and Sawada (1971); ttt experimental data (Vroom et al 1977) /21/
8'I03K -f----.I..,..-------1----4-
Te 6 •
,
2
• 9 •
0-+-----,,----,---+ o 0.5 !p 1,5
I "" • .!!!L. 2m _ :Zl:!:1_-' / ---- vm~lwli.l M -'-M -Vm VcJ,;ff
Fig.36 Comparison of calculated and measured electron temperatures in H, and He. The paraMketer values
of each dIscharge haye been obtained from measurement of ne,jl,Te /22/ .
- 252 -
Microwave Discharges
H. Schlüter
Institute of Experimental Physics
Ruhr-University Bochum, FRG
- 253 -
MJ.crow-ave DJ.scharges
1. Introductlon
Whereas so me early work on mlcrowave discharges stems from unwanted efCects In
the course of developlng radar technlques, nowadays there Is a wlde-spread use of
these dlscharges. Thls Is largely due to the avallabillty of good and not too
expensive mlcrowave power sources.
A detalled comparlson oC mlcrowave, rf and dc dlscharges, of course, would re
qulre careful differentiation, partlculary In vlew of an intended use of a dlscharge.
Nevertheless two main advantages may be attrlbuted to mlcrowave and rf dIschar
ges : The posslblllty of reduced contamination by largely avoldlng electrode effects
and the general ease 01 operation at the present state of technical developement.
By now mlcrowave discharges have entered almost a11 neids oC gas discharges and
thereCore partleipate In the growlng motivation for better understandlng of the
discharge phenomena.
Important cases of appUcatlon are
- Light sources
- Lasers
- Ion sources
- Plasma surface interactIon
- Plasma chemlstry
A characteristic of mlcrowave discharges Is the "locaUzatlon" of the electrons :
The electrons osclllate over dlstances sma11 compared to the dimensions of the
dis charge vessel.
- 254 -
However, there are Important slmllarltles to dc dlscharges. A very useful one Is
the concept of effective field strength Eeff, valid for frequencles w> VE, wlth \lE
an energy transfer frequency.
From an equatlon of motion for electrons (wlth \111 the colllsion frequency of
momentum transfer and Ep the applIed electrlc fleld strength)
dv m·~
dt
one obtalns
y = - ~ •. ~p·exp(iwt)
where the moblllty ~. Is deflned by
e ~. m· (iw + \I .. )
Thus the real power absorbed by electrons per unlt volume
p N. • e 2 • (E. f f ) 2
m· v ..
wlth the effectlve fleld strength glven by
2. Breakdown
Breakdown Is reached when the 10nlzatlon rate N.Vl balances the 10ss rate by free
diffusion. In thls ease the contlnulty equatlon reads
aN. ~ z 0 = N. ·V1 + div([)
wlth [= - D.·V.N. , and D. belng the diffusion eoeffieent.
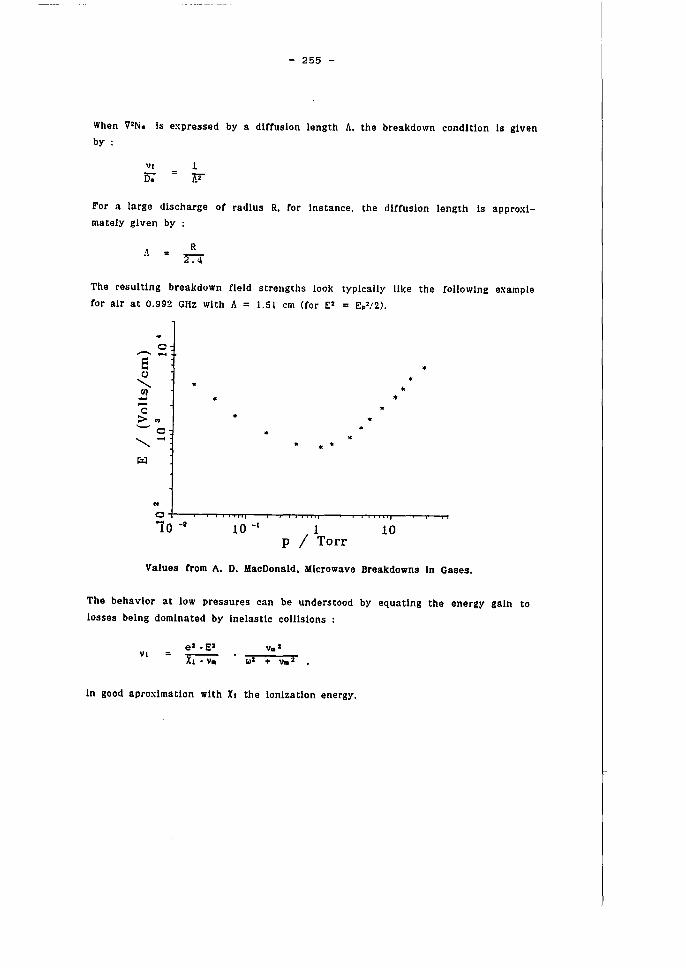
- 255 -
When IrzN. ls expressed by a diffusion length A. the breakdown condition Is given by :
VI 1 0; F
For a large discharge of radIus R. for Instance. the diffusion length ls appro:dmately glven by :
;\ R 2':"4
The resulting breakdown neId strengths look typlcally llke the followlng example
for aIr at 0.992 GHz wlth A = 1.51 cm (for E2 = Epz/2).
o
c > .. -0 ,-~
10 -2
..
10 -I
.. .. ..
1 P / Torr
.. ...
10
..
Values (rom A. D. MacDonald. Microwave Breakdowns In Gases.
The behavlor at low pressures can be understood by equatlng the energy galn to
losses belng domina ted by inelastlc colllsions
VI (0)2 + v. Z
In good apro:dmatlon wlth XI the lonlzatlon energy.
- 256 -
From the breakdown conditlon VI = D./A" one obtains approximately (wlth D. = ~.<u>/3, ~ me an free path, w" »v.') :
E " 1
VII
For high pressures the losses are dominated by elastic colllsions and the trans
ferred energy per colllsion is (VII" »w') :
2 . .!!!. <u> M
-) E
with the energy <u> in eV and M the mass of the atom.
In general the conditlon VI = D./A" has to be evaluated by caiculating VI and D.
from the distribution function which is obtained from the Boltzmann equation in a
self-consistent manner as commented on later.
3. SteadY-State Dlscharges
In the steady-state case the electron diffusion leads to the bulld-up of aspace
charge fleid Es, so that the diffusion flux of the electrons is now :
r. - D •• V· N. - 11.' N •• g.
g. ensures that the (lux of the ions Is as large and given by a corresponding
equation with sUbscripts i and a plus sign of the last term. From the two (lux
equatlons r. can now be written as
r. - 0.· V·N.
with the ambipolar diffusion coefflcent D. = (0111. + 00111)/(111 + 110). (N. = NI is
assumed.) Recombinatlon losses are usually negllgible.
Now the microwave fleld strength E (and the resulting distribution 1'unction) have
to be determined for glven w so that VI = D. /A" is fulfilled.
- 257 -
The space charge fleld Is glven by :
D. - D. V·N. V·N. - Us • __ N. 11. '-v.-
Thls treatment is correct when the me an free paths are quite small compared to
a11 relevant dimensions. It can be extended somewhat to low press ures by uslng
a modifled diffusion coefflcent D. instead öf D. and an effectlve diffusion length
A ••
The steady state fleld strengths are smaller than the br'eakdown values, since
D. < D •.
4. Modelllng of Diffusion Controlled Discharges
The basis of modelllng is the Boltzmann equatlon for the distribution funetlon
F(r, v) for the eleetrons :
~ contalns ~.fI (1n the effective neId strength approximation Cor sUfflcentiy high
w) and the space charge fieid ~8. C descrlbes the effect of eoll1sions (elastic
colllsions with neutrals, Inelastlc exeltation and lonlzatlon collisions),
For the ease of a high values of collisions frequencles the distribution funetlon
and collision terms are expanded in spherical harmonics. Under assumption of rapid
eonvergenee the symmetrlcal eontrlbutlon Fo domlnates, and the fo11owing relation
ls obtalned
~. V2 ·Fo - ~. V· (E8 .~) - __ e __ • ...!. [.:::. (E •• V) 'Fo 3· v. 3 'm • v. - ilv 3 • m. v2 ilv v. -
v 2 (e. E. 2 ) ilFo 1 il m -~. --m- + Uc ·v. 2 '"5V"] + Vi äV' [v3 ·M· v •. Fo ]
- (v. + VI)' Fo + Q o
- 258 -
where
VII Is the elastlc colllsion frequency, v. Is the Inelastlc one (actually a sum), VI Is the lonlzatlon frequency,' uc Is the averaged energy galn from the mlcrowave fleld per colllsion (In V):
uc 2 • m· (w· + VII')
e· Ep'
Q accounts for slow electrons appearlng by lonlzation and oexcltatlon. Here Fo Is
Involved not at the argument v, asfor other terms, but rather at shifted argu
ments, thus compllcatlng the numerical solution by "non-Iocal" terms.
This compllcated equation can be slmpllfied by the assumption of spaclally homo
geneous microwave fields as weil as transport properties and rate coefflclents and
the assumption, that the second and thlrd space charge terms, descrlblng the
energy loss of the electrons flowing agalnst the space charge neid and heatlng
due to this fleId, can be neglected for small mean free paths. Then Fo(r.v) can be
factorlzed :
Fo N.(J;:)·fo(v)
The resultlng equation is (for V' =- 1/ A')
- V" e·u. 1 Ho 1.l (e.uc.v • .lfo m ) -=-----:-:0. [fo+--._.--] +-.-[v' '""T
v + -M,v.,v'fo ]
3,vlI·A" m v.lv v".lv 3·m u
- (V. + VI)' fo + q • I 0 If • I • c I rOD. o "QOD-10081- ter.s
u. takes the effect of the space charge neid Into account, as 1t was defined
before.
The speclflc case consldered in °the equation above °ls the one ivith the high fre
quency fleld polnting In axial direction.
For u. = 0 breakdown neid strengths and for Ila F 0 steady state fleid strengths
are obtalned by numerlcal solutions of the Boltzmann equation together with the
condltion VI = D. / A"
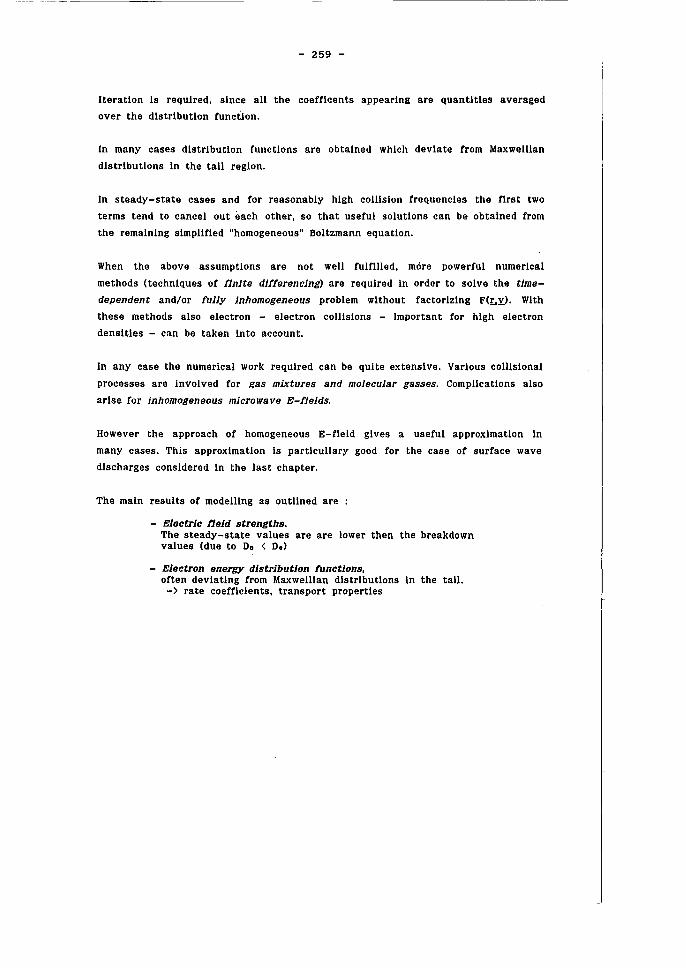
- 259 -
Iteration is required. since all the coefficents appearing are quantlties averaged
over the distribution functIon.
In many cases distribution functions are obtained which deviate from Maxwelllan
distributions in the taU region.
In steady-state cases and for reasonabiy high coillsion frequencies the first two
terms tend to cancel out each other. so that useful solutions can be obtained from
the remaining simpllfied "homogeneous" Boltzmann equation.
When the above assumptIons are not well fulfllled. more powerful numerical
methods (techniques of fInIte dlfferencIng) are required in order to solve the tIme
dependent and/or fully Inhomogeneous problem without factorizing F(l:.Y.). Wlth
these methods aiso eiectron - electron colllsions - important for high eiectron
densities - can be taken into account.
In any case the numericai work required can be qUite extensive. Various colllsional
processes are invoived for gas mixtures and molecular gasses. Compllcations aiso
arise for inhomogeneous microwave E-fields.
However the approach of homogeneous E-fleid gives a usefui approximation in
many cases. This approximation is particullary good for the case of surface wave
discharges considered in the iast chapter.
The main resuits of modelllng as outllned are
- Electric neld strengths. The steady-state vaiues are are lower then the breakdown vaiues (due to D. < Oe)
- Electron energy distribution l'unctions. orten deviating from Maxwelllan distributions in the tall. -) rate coefficients. transport properties
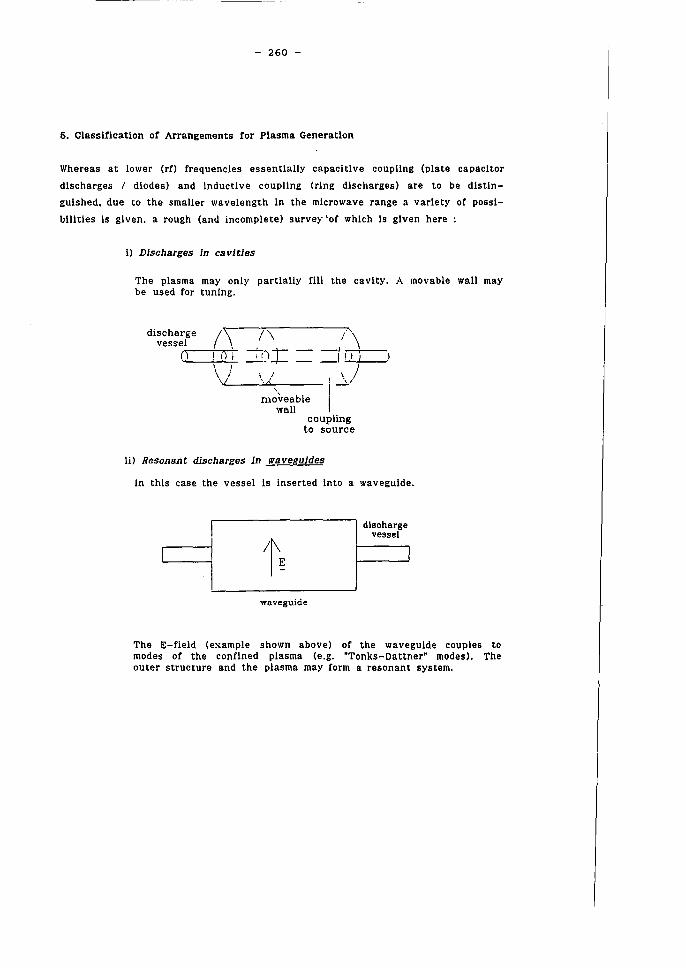
- 260 -
5. Classificatlon of Arrangements Cor Plasma Generation
Whereas at lower (rf) frequeneles essentlally eapaeitlve eoupllng (plate eapaeltor
dis eh arges / dlodes) and Induetlve eoupllng (ring dlseharges) are to be dlstln
guished. due to the smailer wavelength In the mlerowave range a varlety or possl
bilitles Is given. a rough (and ineomplete) survey 'of whleh Is glven here :
1) Discharges in cavities
The plasma may only partlally flll the eavlty. A movable wall may be used for tuning,
vessel dis charge (\\, /\ /'\
(.,-) ---i,"-,I""'} +-, " r) T ==! "",O-fl __ \ / / \\Ii \/ ,\
-L ___ ''-'' ":...,' ---- I' ~I \
moveable I wall
coupling to source
ii) Resonant discharges in waveguides
In thls ease the vessel 15 Inserted lnto a wavegulde,
waveguide
discharge vessel
The E-field (example shown above) of the wavegulde eouples to mo des of the eonflned plasma (e,g, "Tonks-Dattner" modes). The outer strueture and the plasma may form aresonant system.
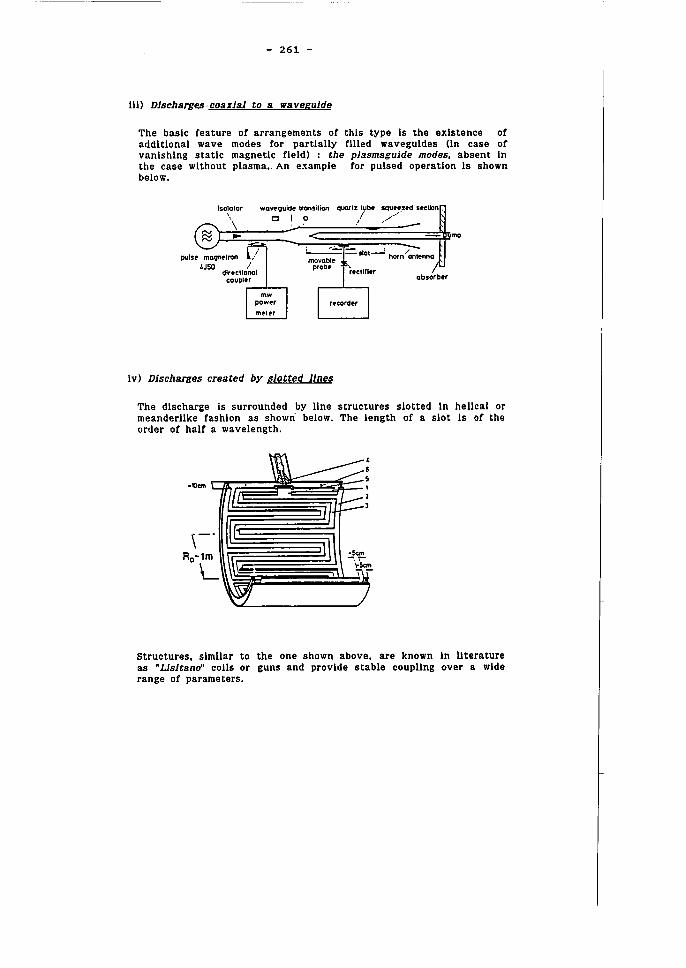
----- - -----------
- 261 -
lll) DJscharge.s· coazlal to a wavegulde
The basic feature of arrangements of thls type 15 the exlstence of additional wave modes for partlally mIed waveguldes (In case of vanlshlng statlc magnetlc fleld) : ehe plasmaguide modes. absent In the case wlthout plasma •. An example for pulsed operation 15 shown below.
isolator WQvt'guidr transilion quatlZ tube
\. C I 0 /
~):~~~~::~::~~~~~~~~~~~~~mp L--.::::: ='101---= horn/ antenna mOvQble
! direclional coupler
,..-...1-...,
prob ..
Iv) Discharges created by slotted lines
absorber
The discharge 15 surrounded by Une structures slotted In heUcalor meanderUke fashion as showri below. The length of a slot 15 of the order of half a wavelength.
Structures. slmllar to the one shown above. are known In lIterature as .. Lls1tano" colls or guns and provlde stable coupllng over a wlde range of parameters.
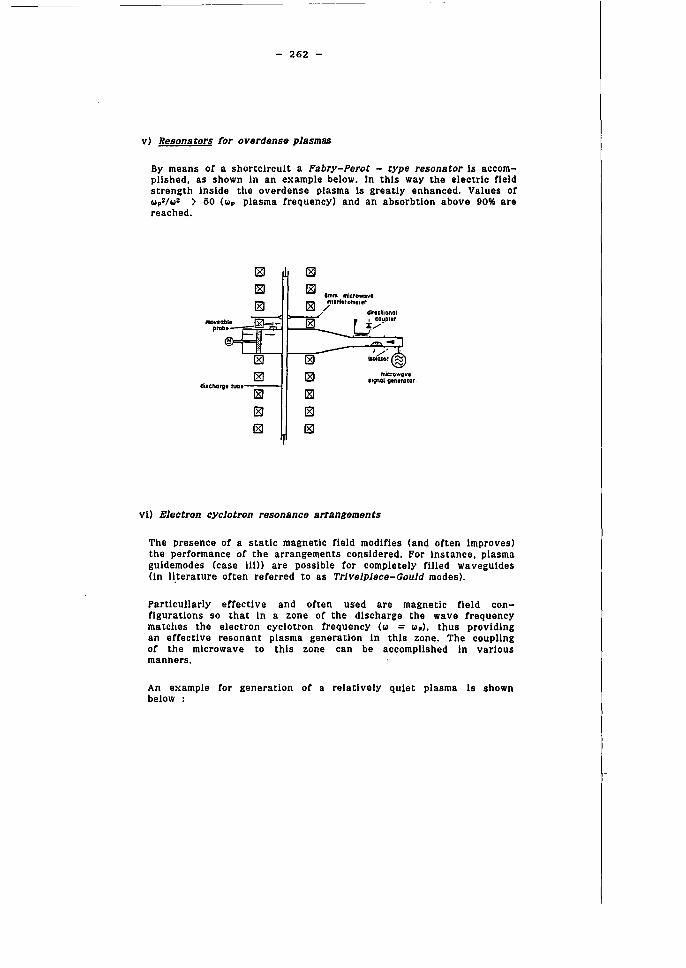
- 262 -
v) Resonators tor overdense plasmas
By means of a shortclrcult a Fabry-Perot - rype resonator ls accompllshed. as shown In an example below. In thls way the electrlc tleld strength Inside the overdense plasma ls greatly enhanced. Values ot Wp2/W2 > 50 (wp plasma frequency) and an absorbtlon above 90% are reached.
!EI !EI !EI !EI Imm microwav •
!EI 181 .,,,rt,,oml.,r
./ dr,clional
!81 U~!'I"" ....
!81 . '/' IIC11Qtor ~
!81 mlcrOWQVI II~OI V'ntralOr
diacharge lUD.
!81 181 181
vi) Electron cyclotron resonance arrangements
The presence of a statlc magnetic tleld modlfies (and often Improves) the performance of the arrangements consldered. For Instance. plasma guldemodes (case i11» are posslble tor completely fllied waveguldes (In 11.terature often referred to as Trlvelplece-Gould modes).
Partlcullarly effective and often used are magnetlc tleld configuratlons so that in a zone of the discharge the wave trequency matches the electron cyclotron frequency (w = w.). thus provldlng an eftectlve resonant plasma generation In thls zone. The coupllng of the mlcrowave to thls zone can be accompllshed In varlous manners.
An example tor generation ot a relatlvely qulet plasma ls shown below :
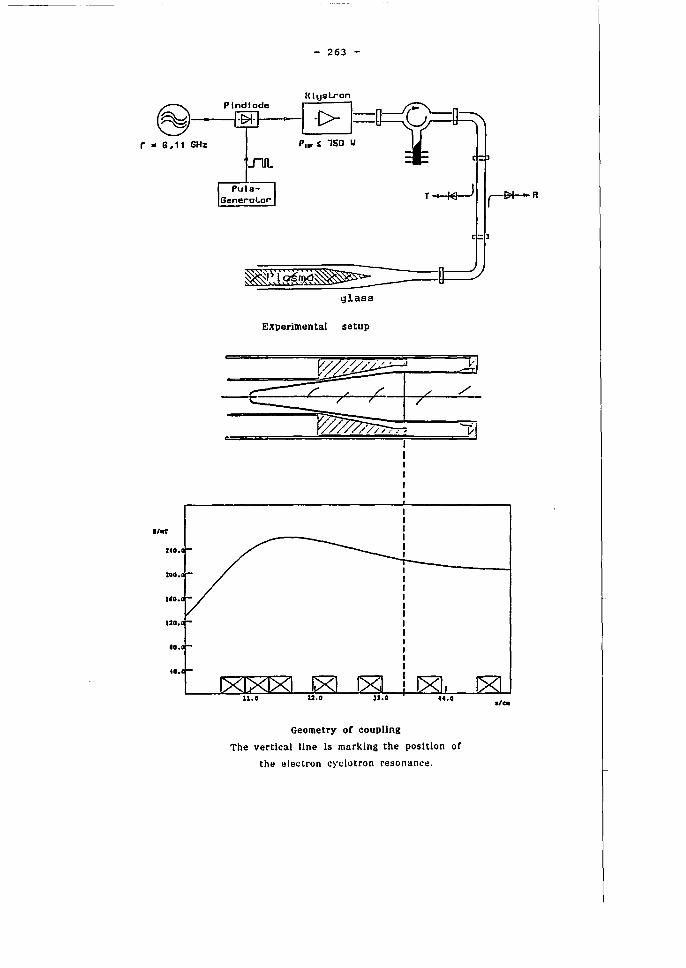
- 263 -
(§) __ P_II~;~l-de __ (I';:~I="y r • 6,11 GHz P'I':!: 150 U
JlfL
c
./~
T~ r~R
Experimental setup
f~ V ..-,.
/' " (' ./'
7 7
~ ~I
Geometry or coupllng
The vertlcal Hne Is marking the position or
the electron cyclotron resonancl!.
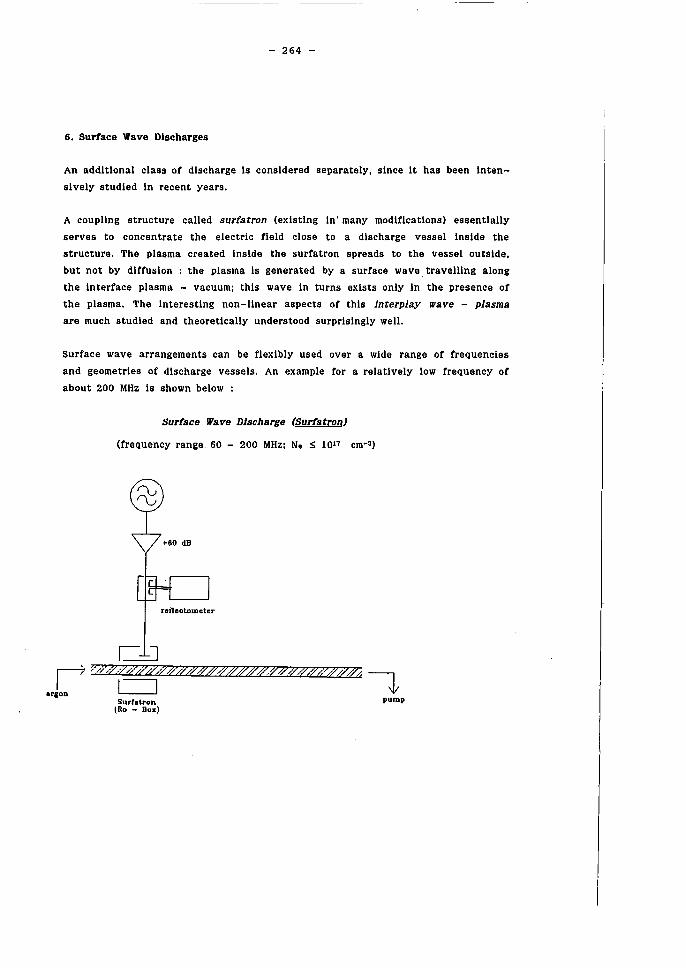
--------------
- 264 -
6. Surtace Wave Dlscharges
An addltlonal class ot discharge Is consldered separately, slnce It has been lnten
slvely studled In re cent years.
A coupllng structure called surfatron (exlstlng In' many mod1flcatlons) 'essentlally
serves to concentrate the electric fleld close to a discharge vessel Inside the
structure. The plasma created inside the surfatron spreads to the vessel outside,
but not by diffusion the plasma Is generated by a surface wave traveUlng along
the Interface plasma - vacuum ö this wave In turns exlsts only In the presence of
the plasma. The Interesting non-linear aspects of this interplay wave - plasma
are much studled and theoretlcally understood surprlslngly weil.
Surface wave arrangements can be flexlbly used over a wlde range of frequencies
and geometries of discharge vessels. An example for a relatlvely low frequency of
about 200 MHz is shown below :
Surface Wave Dlscharge (Surfatron)
(frequency range 60 - 200 MHz: N. ~ 1017 cm-3)
roiloclometer
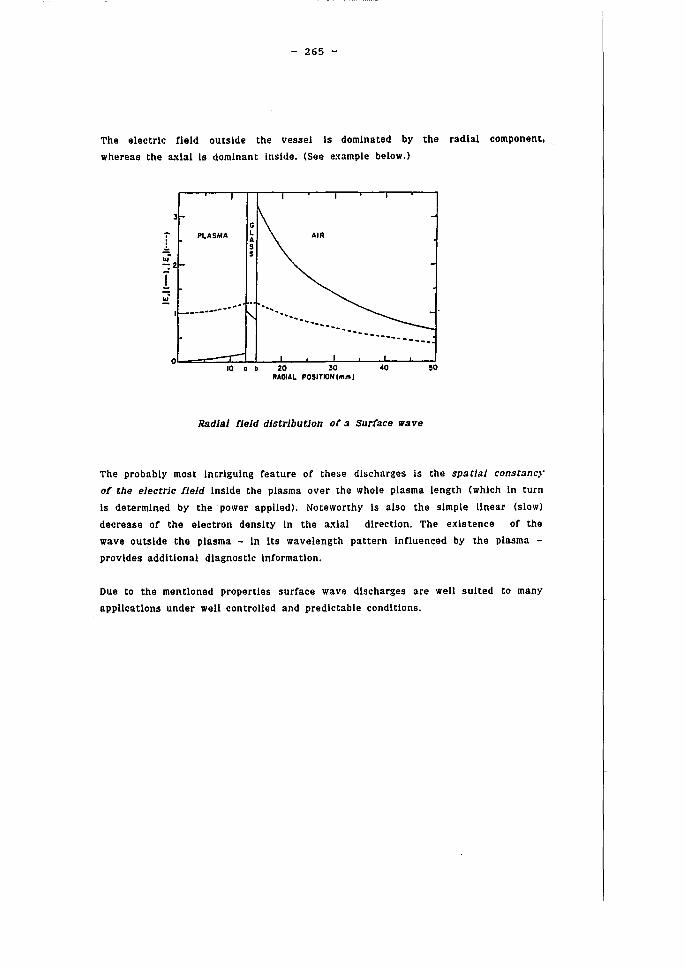
- 265 -
The electrlc neid outside the vessel Is domina ted by the radial component.
whereas the aldal Is dominant Inside. (See example below.)
PLASMA
w"
G L A S 5
AIR
-:2
I ~
I ------------ '" ...............
'" ---- .... ---- .. O~c=:===~,O~~.-bL---2LO--~--~30L---L---~~O--~--~,O
RAOIAL POSITIONlmm)
RadJal fjeld dlstrJbution of a Surface wave
The probablY most lntrlgulng feature of these discharges Is the spattal constanc.\·
of the electrtc fjeld inside the plasma over the whole plasma length (which In turn
15 determlned by the power applied). Noteworthy Is also the simple linear (slow)
decrease of the electron den51ty In the a;dal dlrection. The exlstence of the
wave out,5ide the plasma - In its wavelength pattern Infiuenced by the plasma -
provldes additional dlagnostlc Information.
Due to the mentloned propertles surface wave discharges are weil sulted to many
appllcations under weU controlled and predlctable condltlons.
- 266 -
Re1"ere:n.ces
A. D. MacDonald, Mlcrowave Breakdowns In Gases, John Wlley; New York (1966).
S. C. Brown, In Handbuch der Physik, Springer Verlag, 22, 531 (1956).
J. Marec, E. Bloyet, M. Chaker, P. Leprlce and R. Nghlem, In NATO ASI SERIES, Serles B : Physlcs, vol. 89b, Plenum Press (1981) p. 347 .
C. M. Ferrelra and M. Molsan, Physlca Scrip ta 38, 382 (1988).
B. Kampmann, Z. Naturforsch. 35a, 293 (1979).
G. LIsltano, Report Max-Planck-Institut für Plasmaphysik IPP III/145, May 1989.
G. Böhm, Z. Naturforsch. 35a, 293 (1979).
A. Shlvarova, NonlInear Surface Waves, In Spatlal Dispersion In Sollds and Plasmas, edlt. P. Haievi, North Holland Publ. Comp., Amsterdam (1990).
- 267 -
High Pressure Glow Discharges
J.Salge
Institute of High Voltage Engineering
Technical University Braunschweig, FRG
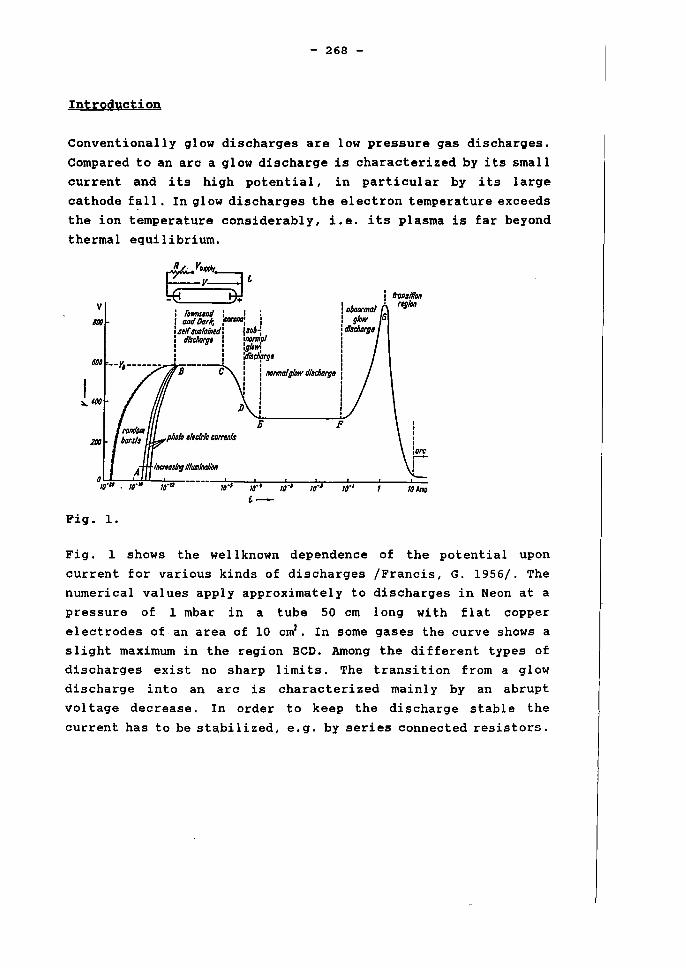
- 268 -
Introduetion
Conventionally glow diseharges are low pressure gas discharges.
Compared to an are a glow diseharge is characterized by its small
current and its high potential, in particular by its large
cathode fall. In glow diseharges the el ectron temperature exceeds
the ion temperature considerably, i.e. its plasma is far beyond
thermal equilibrium.
: IronsHion I D'-IJ('fTIIlI' ngiM
I IbwnSlnd: I : ' (NI
: and Darlf. f'I'W'O: : : glDw G IstH'StIllaillld: lSu6~ i ai.sc!DlJB i disdJorg'! lnormal I I I :glg~ : : I ',dbdifrg, :
, I
i normal glow disc!argl i I i : I i f E F
ID~
t-
Fig. 1.
Fig. 1 shows the wellknown dependence of the potential upon
current for various kinds of discharges /Francis, G. 1956/. The numerical values apply approximately to discharges in Neon at a
pressure of 1 mbar in a tube 50 cm long with flat copper
electrodes of an area of 10 cml. In some gases the curve shows a
slight maximum in the region BCD. Among the different types of
discharges exist no sharp limits. The transition from a glow
dis charge into an
vol tage decrease.
arc is characterized mainly by an abrupt
In order to keep the discharge stahle the
current has to be stahilized, e.g. by series connected resistors.
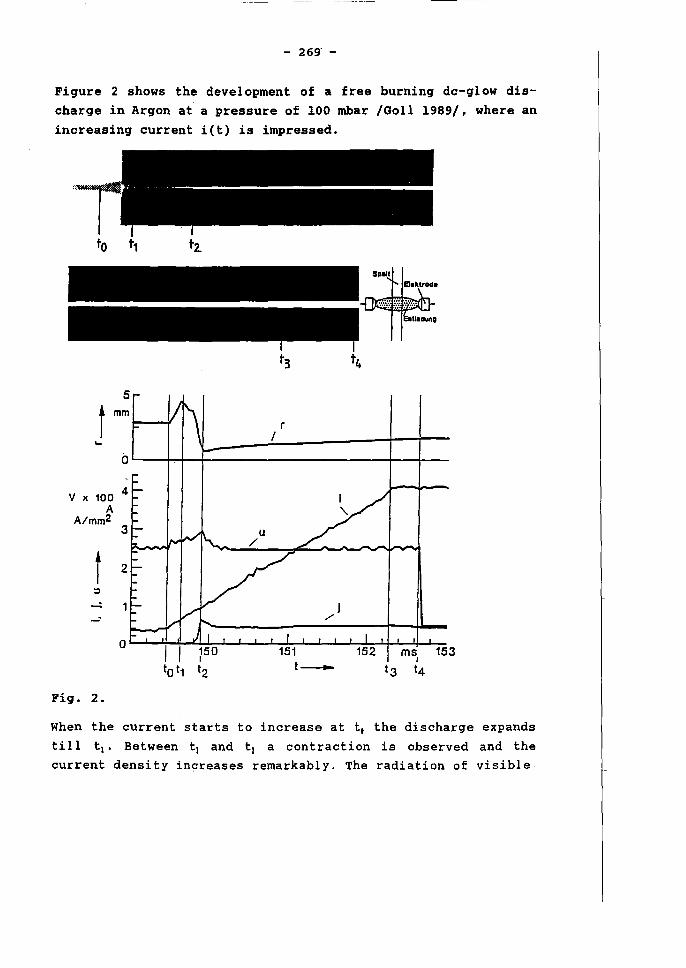
- 269" -
Figure 2 shows the development of a free burning dc-glow discharge in Argon at apressure of 100 mbar /Goll 1989/, where an increasing current i(t) is impressed.
to
t mm r
I ... Ö
V x 100 A
A/mm2
t 2
:J
--0
ms 153 t_ I
t3 t4
Fig. 2.
When the current starts to increase at t. the dis charge expands tUl t l • Between t l and t l a contraction is observed and the current density increases remarkably. The radiation of visible
- 270 -
light beeomes more intense. Although the eurrent inereases up
to 4 A the vol tage aeross the diseharge remains eonstant for
3 ms. At t. the transition to an are take plaee. This experiment underlines the great variety of the glow dis charge phenomenon.
Generally with inereasing pressure it is difficult to maintain
stable glow discharges. The voltage across the diseharge
increases and the originally stable discharge becomes transient.
At atmospheric pressure a discharge ean change rapidly from a
dark diseharge in an are.
In summary a high pressure glow discharge is mostly a transient
phenomenon. The discharge is eharacterized by a high voltage gradient in parts of the" discharge and by a plasma beyond thermal
equil ibri um.
1. Types of Discharges and Operation Conditions
At high pressures there are various operation condi tions to
realize high pressure glow discharges:
- discharges between point and plane electrodes
- dielectric-barrier discharges
- preionzied discharges
1.1 Discharges between Point and Plane Electrodes
stable glow discharges at high pressures can be generated in
strongly inhomogeneous electric fields. At electrodes with sma11
radius of curvature (points, edges or wires) the electric field
strength can exceed the breakdown field strength 10cally. Above
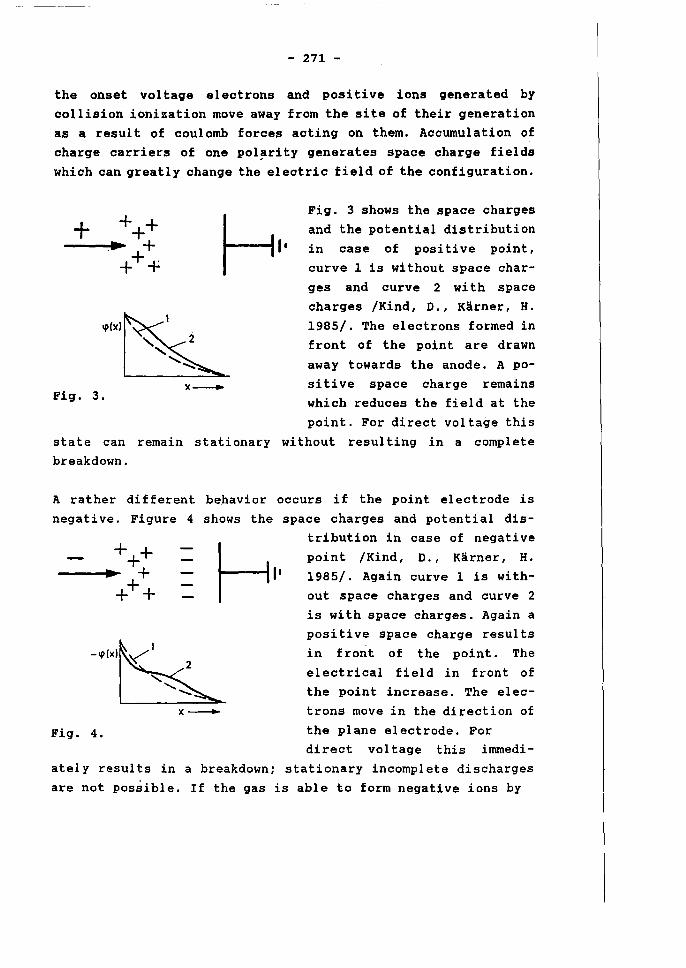
- 271 -
the onset voltage electrons and positive ions generated by collision ionization move away from the si te of their generation as a result of coulomb forces acting on them. Accumulation of charge carriers of one pol~rity generates space charge fields which can greatly change the electric field of the configuration.
x_ Fig. 3.
Fig. 3 shows the space charges and the potential distribution in case of positive point, curve 1 is without space char-ges and curve 2 wi th space charges /Kind, D., Kärner, H. 1985/. The electrons formed in front of the point are drawn away towards the anode. A positive space charge remains which reduces the field at the point. For direct voltage this
state can remain stationary wi thout resul ting in a complete breakdown.
A rather different behavior occurs if the point electrode is negative. Figure 4 shows the space charges and potential dis-
+++ --........... +
+++
Fig. 4.
x-
tribution in case of negative
point /Kind, D., Kärner, H. 1985/. Again curve 1 is without space charges and curve 2 is with space charges. Again a positive space charge results in front of the point. The electrical field in front of the point increase. The electrons move in the direction of the plane electrode. For direct voltage this immedi
ately results in a breakdown; stationary incomplete discharges are not possible. If the gas is able to form negative ions by
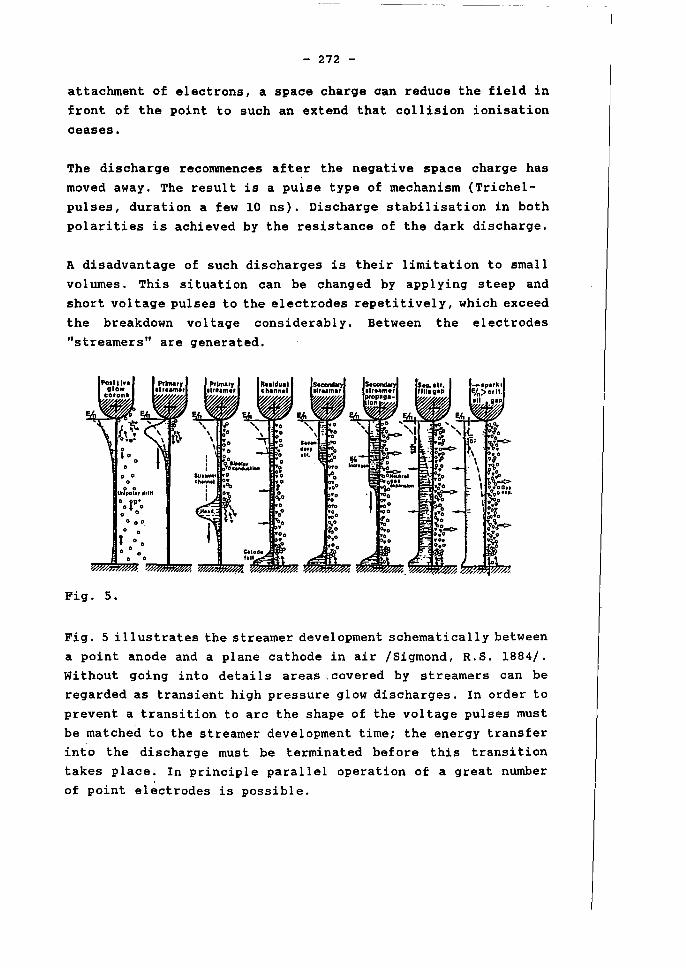
- 272 -
attachment of electrons, aspace charge can reduce the field in front of the point to such an extend that collision ionisation
ceases.
The discharge recommences after the negative space charge has
moved away. The result is a pulse type of mechanism (Trichelpulses, duration a few 10 ns). Discharge stabilisation in both
polarities is achieved by the resistance of the dark discharge.
A disadvantage of such discharges is their limitation to small volurnes. This situation can be changed by applying steep and short voltage pulses to the electrodes repetitively, which exceed
the breakdown voltage considerably. Between the electrodes
"streamers" are generated.
o 00
o o'
l 0 0
o 0 0
o 0
~~
Fig. 5.
Fig. 5 ill ustrates the streamer development schematically between
a point anode and a plane cathode in air /Sigmond, R.S. 1884/. Wi thout going into detail s areas, covered by streamers can be regarded as transient high pressure glow discharges. In order to prevent a transition to arc the shape of the voltage pulses must
be matched to the streamer development time; the energy transfer into the discharge must be terminated before this transition takes place. In principle parallel operation of a great number of point electrodes is possible.
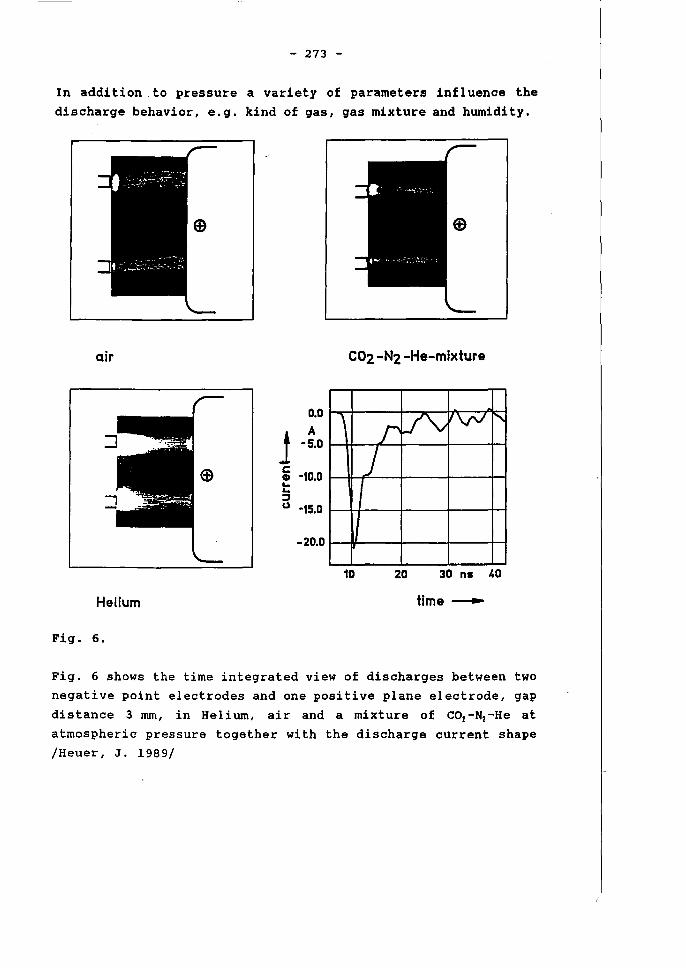
- 273 -
In addition .to pressure a variety of parameters influence the
discharge behavior, e.g. kind of gas, gas mixture and humidity.
air C02 -N2 -He-mixture
0.0
j A
-5.0
c -10.0 CD .. ..
'\ r Vv If'v'/ " J I
:::l u -15.0
-20.0 11
10 20 30 na 40
Helium time ~
Fig. 6.
Fig. 6 shows the time integrated view of discharges between two
negative point electrodes and one positive plane electrode, gap
distance 3 mm, in Helium, air and a mixture of COz-Nz-He at atmospheria pressure together with the discharge cUrrent shape /Heuer, J. 1989/
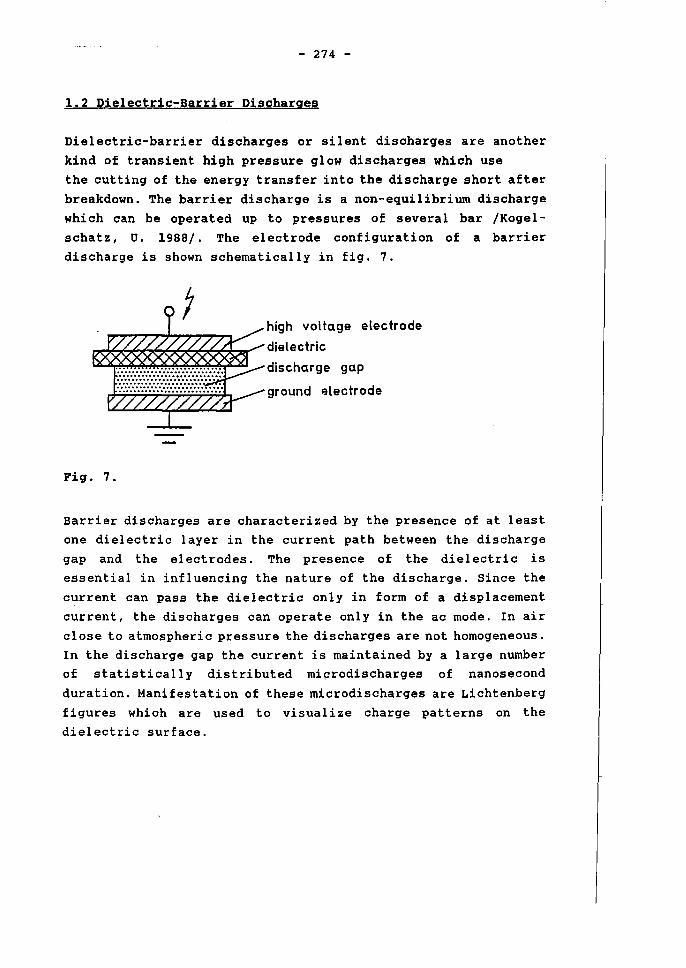
- 274 -
1.2 Dielectric-Barrier Discharqes
Dielectric-barrier discharges or silent discharges are another kind of transient high pressure glow discharges which use the cutting of the energy transfer into the discharge short after breakdown. The barrier discharge is a non-equilibrium discharge which can be operated up to pressures of several bar /Kogelschatz, U. 1988/. The electrode configuration of a barrier discharge is shown schematically in fig. 7.
high voltage electrode
1A:~~~~'?6c~;6~~"- dielectric discharge gap
ground electrode
Fig. 7.
Barrier discharges are characterized by the presence of at least one dielectric layer in the current path between the discharge gap and the electrodes. The presence of the dielectric is essential in influencing the nature of the discharge. Since the current can pass the dielectric only in form of a displacement current, the discharges can operate only in the ac mode. In air close to atmospheric pressure the discharges are not homogeneous. In the discharge gap the current is maintained by a large number of statistically distributed miprodischarges of nanosecond
duration. Manifestation of these microdischarges are Lichtenberg figures which are used to visualize charge patterns on the dielectric surface.
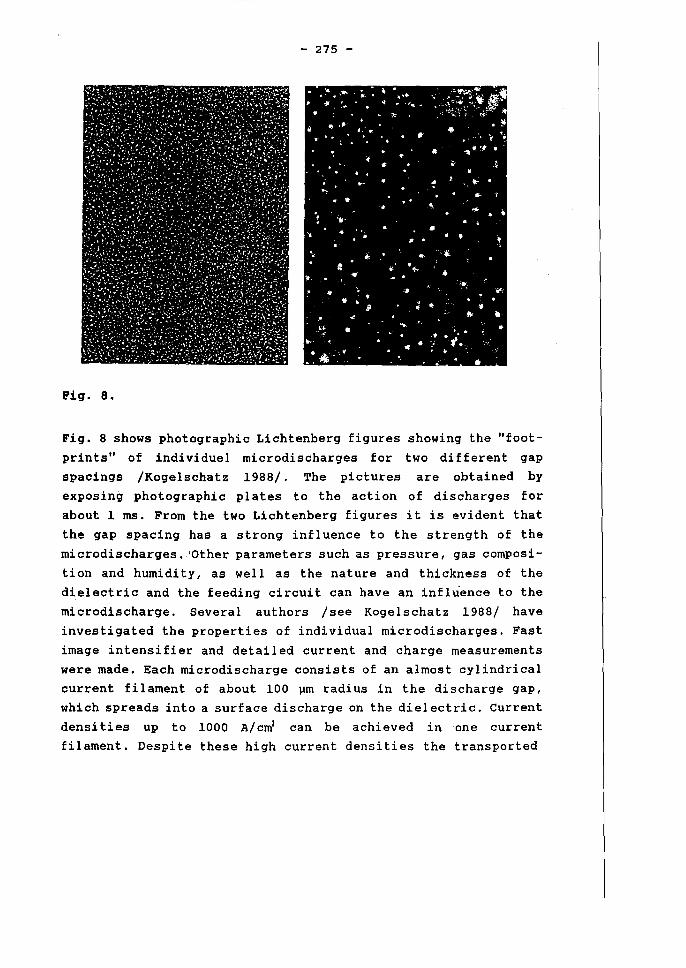
- 275 -
Pig. 8.
Fig. 8 shows photographic Lichtenberg figures showing the "foot
prints" of individuel microdischarges for two different gap
spacings /Kogelschatz 1988/. The pictures are obtained by
exposing photographic plates to the action of discharges for
about 1 ms. From the two Lichtenberg figures it is evident that
the gap spacing has a strong influence to the strength of the
microdischarges. 'other parameters such as pressure, gas composi
tion and humidity, as weIl as the nature and thickness of the dielectric and the feeding circuit can have an infl~ence to the
microdischarge. Several authors /see Kogelschatz 1988/ have investigated the properties of individual microdischarges. Fast
image intensifier and detailed current and charge measurements
were made. Each microdischarge consists of an almost cylindrical current filament of about 100 ~m radius in the discharge gap,
which spreads into a surface discharge on the diel ectric. Current
densi ti es up to 1000 A/ cml can be achi eved inone current
filament. Despite these high current densities the transported
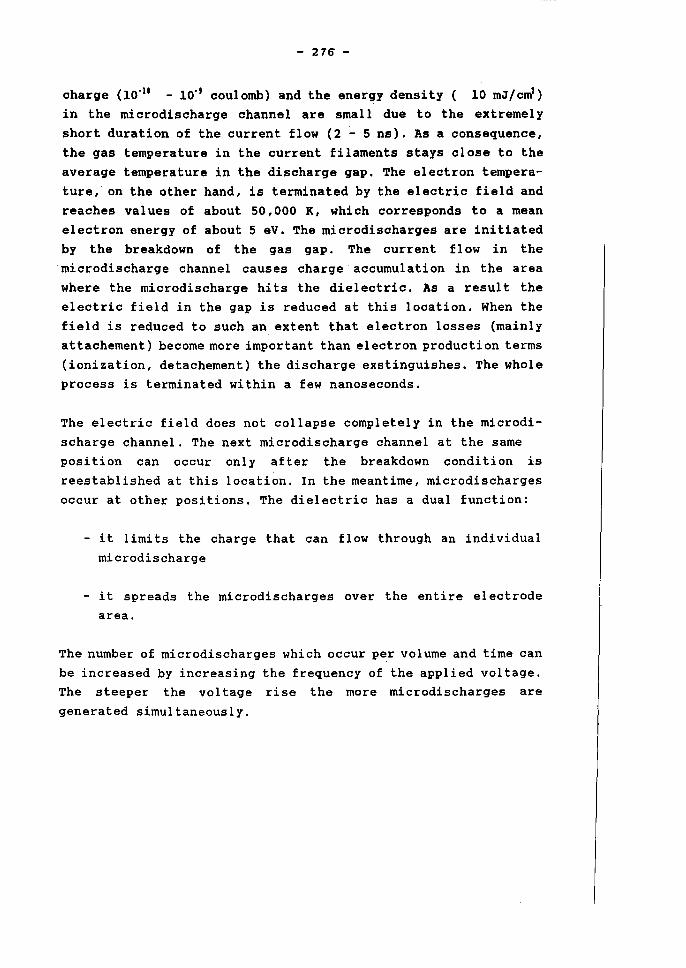
- 216' -
charge (10·\1 - 10·' coulomb) and the energy density ( 10 mJ / cm' ) in the microdischarge channel are small due to the extremely short duration of the current flow (2 - 5 ns). As a consequence, the gas temperature in the current filaments stays close to the average temperature in the discharge gap. The electron temperature, on the other hand, is terminated by the electric field and reaches values of about 50,000 K, which corresponds to a mean electron energy of about 5 eV. The microdischarges are initiated by the breakdown of the gas gap. The current f I ow in the microdischarge channel causes charge accumulation in the area where the microdischarge hits the dielectric. As a result the electric field in the gap is reduced at this location. When the field is reduced to such an extent that electron losses (mainly attachement) become more important than electron production terms (ionization, detachement) the discharge exstinguishes. The whole process is terminated within a few nanoseconds.
The electric field does not collapse completely in the microdischarge channel. The next microdischarge channel at the same position can occur only after the breakdown condition is reestablished at this location. In the meantime, microdischarges oeeur at other positions. The dielectric has a dual function:
- it limits the charge that ean flow through an individual mierodischarge
- it spreads the mierodiseharges over the entire eleetrode area.
The number of mierodischarges whieh oceur per vol urne and time ean be inereased by inereasing the frequeney of the applied voltage. The steeper the voltage rise the more mierodiseharges are
generated simultaneously.
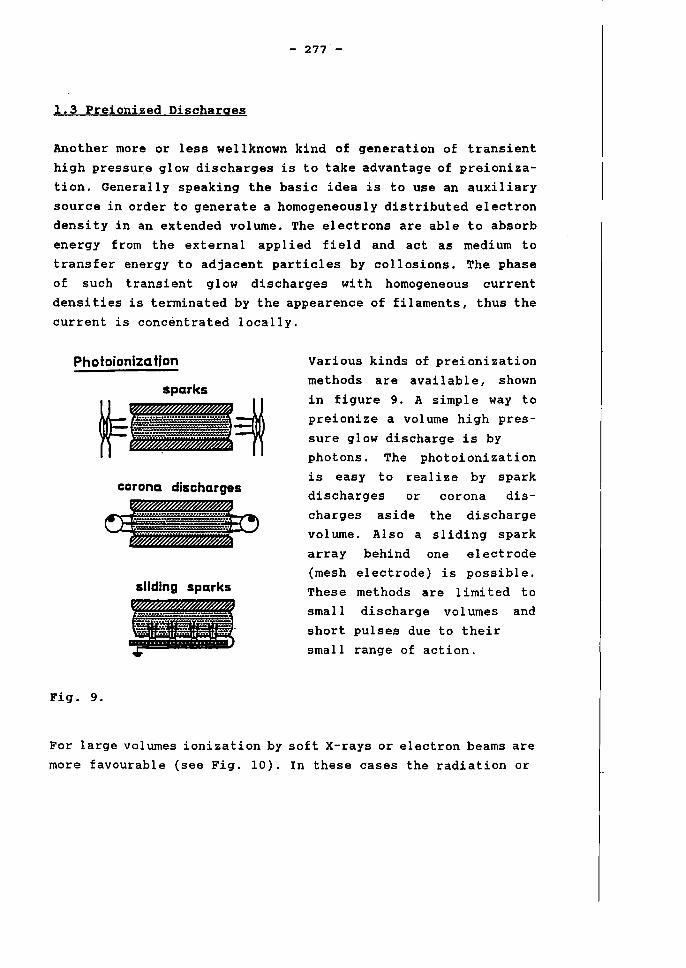
- 277 -
1.3 Preionized Discharqes
Another more or less wellknown kind of generation of transient
high pressure glow discharges is to take advantage of preionization. Generally speaking the basic idea is to use an auxiliary
source in order to generate a homogeneously distributed electron densityin an extended volume. The electrons are able to absorb energy from the external applied field and act as medium to transfer energy to adjacent particles by collosions. The phase
of such transient glow discharges with homogeneous current densities is terminated by the appearence of filaments, thus the
current is concentrated locally.
Photoionizat;on
sparks
corona discharges
sliding sparks
Fig. 9.
Various kinds of preionization methods are available, shown
in figure 9. A simple way to preionize a volume high pres
sure glow discharge is by photons. The photoionization is easy to realize by spark discharges or corana discharges aside the discharge
val urne. Al so a s liding spark array behind one electrode (mesh electrode) is possible.
These methods are I imi ted to small discharge volumes and short pulses due to their
small range of action.
For large volumes ionization by soft X-rays or electron beams are
more favourable (see Fig. 10). In these cases the radiation or
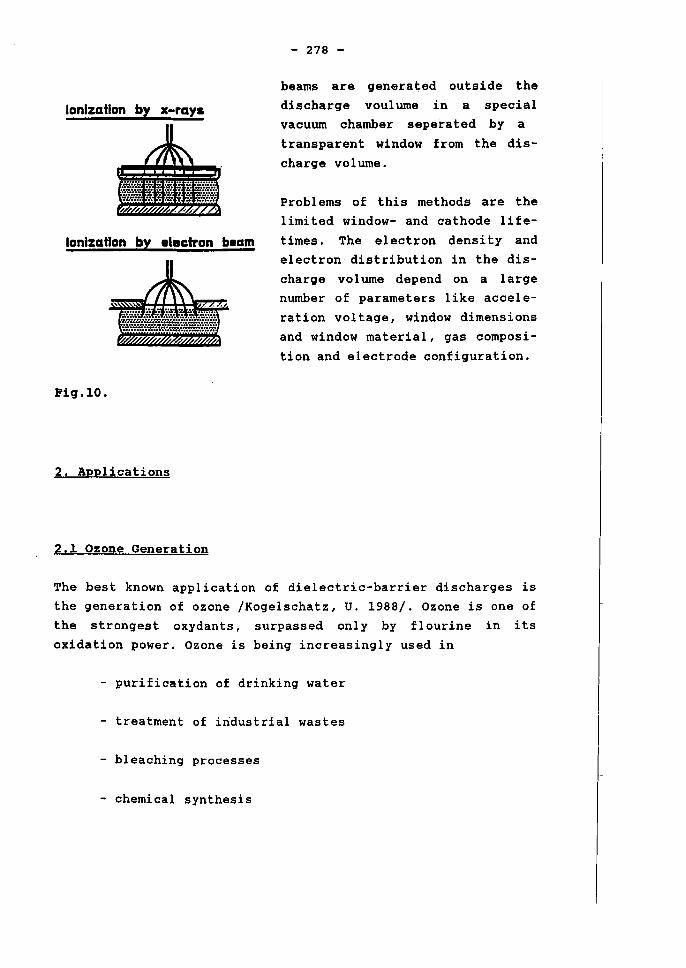
lanlzattan by x-ray.
lanlzattan alactran baam
Fig.10.
2. Applications
2.1 Ozone Generation
- 278 -
beams are genera ted outside the discharge voulurne in a special vacuurn chamber seperated by a transparent window from the discharge volume.
Probl ems of this methods are the limited window- and cathode lifetimes. The e1 ectron densi ty and electron distribution in the discharge vol urne depend on a I arge number of parameters like acceleration voltage, window dimensions and window material, gas composi
tion and electrode configuration.
The best known application of dielectric-barrier discharges is the generation of ozone /Kogelschatz, U. 1988/. Ozone is one of the strongest oxydants, surpassed on1y by flourine in its oxidation power. Ozone is being increasingly used in
- purification of drinking water
- treatment of iridustrial wastes
- bleaching processes
- chemical synthesis
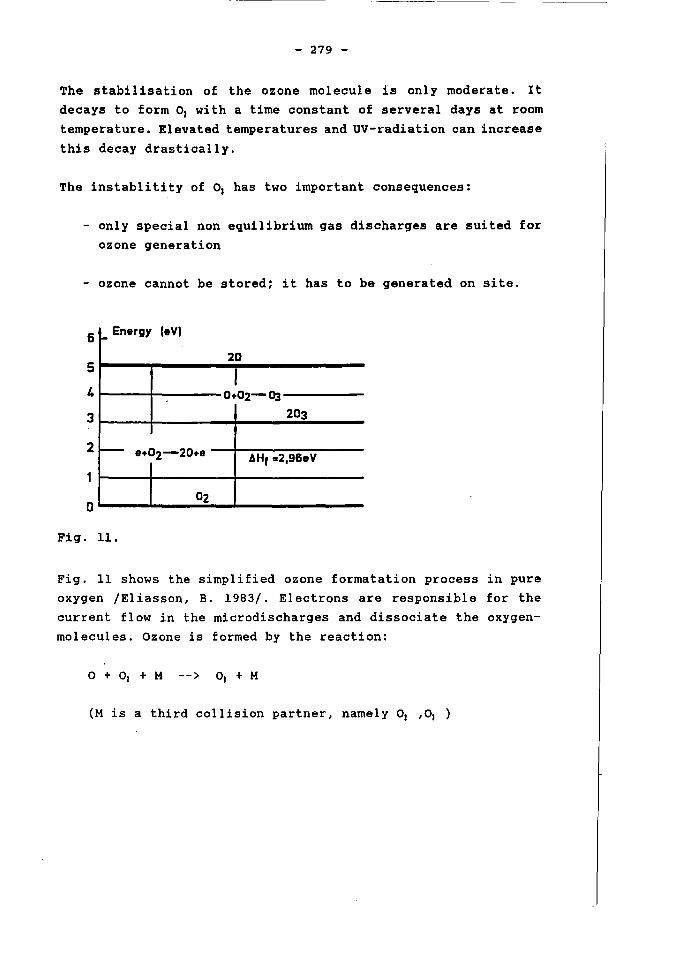
- 279 -
The stabilisation of the ozone molecule is only moderate. It decays to form ~ with a time constant of serveral days at roorn temperature. Elevated temperatures and UV-radiation can increase this decay drastically.
The instablitity of 0, has two irnportant consequences:
- only special non equilibrium gas discharges are suited for ozone generation
- ozone cannot be stored; it has to be generated on site.
6
5
4
3
2
1
o
f- Energy (eV,
- •• 02-20.e
02
Fig. 11.
20
I 0.02-03
203
AHf =2,96.V
Fig. 11 shows the simplified ozone formatation process in pure oxygen /Eliasson, B. 1983/. Electrons are responsible for the current flow in the microdischarges and dissociate the oxygenmolecules. Ozone is formed by the reaction:
° + 02 + M --) 0, + M
(M is a third collision partner, namely 02 ,0, )
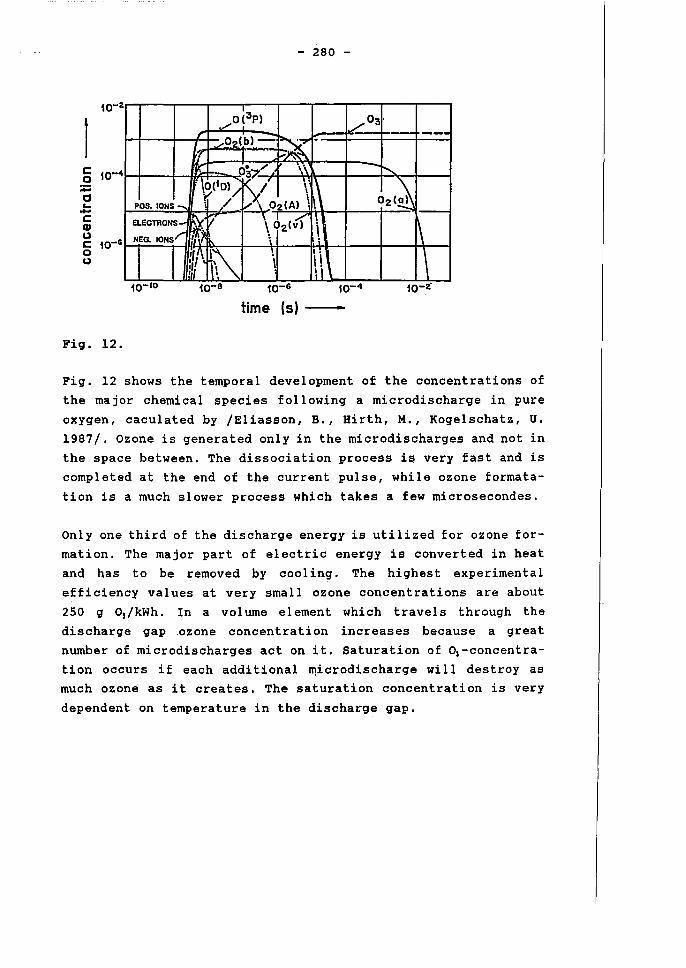
- 280 -
2
....... 0 (3p) ./03 , ~g.2.(b)"""':::~ .-1--- ----
II -1--~ , 1<; ~ 037-/ \\ -:--....
'0(10) &< \. ~\ 02(~ y '/ \ POS. IONS....... ! / ~.:~,.,o2 (A) \
~-ELECmONS- ~'I? \ 62 (.;) : \ NEO. IONS""" f;\; ~ \ \ 1\
'I fI, lill ~\\ \
I. 1\ . \ i \ \
10-10 10-6 10-2
time (5)
Pigo 120
Figo 12 shows the temporal development of the concentrations of
the major chemieal speeies following a microdiseharge in pure
oxygen, eaeulated by /Eliasson, Bo, Hirth, Mo, Kogelsehatz, U.
1987/. Ozone is generated only in the mierodiseharges and not in
the spaee between. The dissociation proeess is very fast and is
eompleted at the end of theeurrent pulse, while ozone formata
tion is a much slower process which takes a few mieroseeondes.
Only one third of the diseharge energy is utilized for ozone for
mation. The major part of eleetrie energy is converted in heat
and has to be removed by cooling. The highest experimental
effieieney values at very small ozone eoncentrations are about
250 9 0dkWh. In a volume element whieh travels through the
dis charge gapozone coneentration increases beeause a great
number of microdiseharges act on it. Saturation of 0s-eoneentra
tion oceurs if eaeh additional ~icrodiseharge will destroy as
much ozone as it creates. The saturation concentration is very
dependent on temperature in the discharge gap.
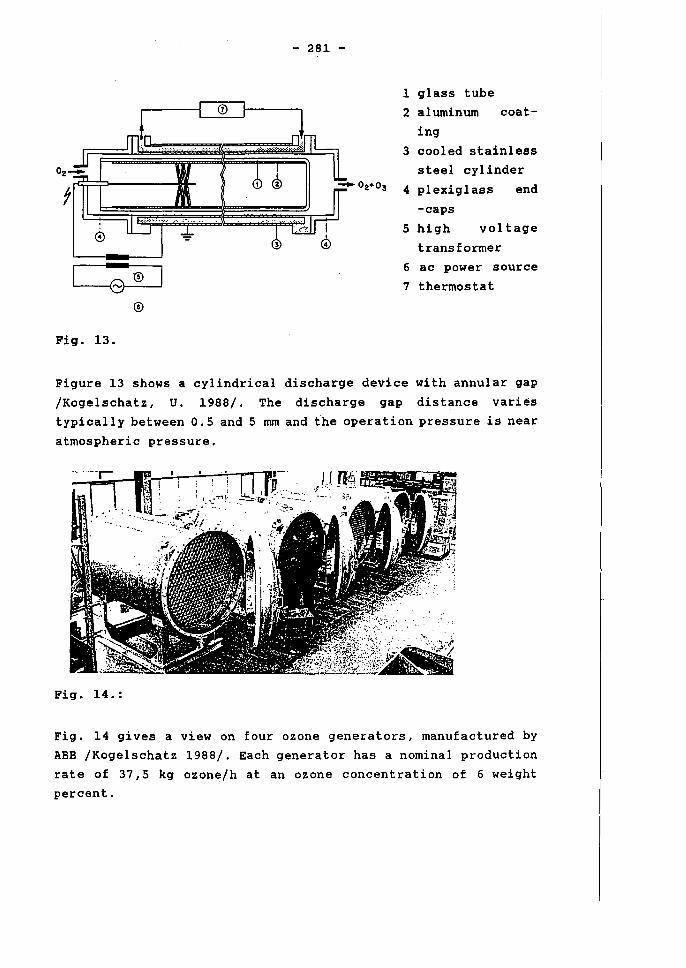
- 281 -
1 glass tube 0 2 aluminum coat-
ing
3 cooled stainless
steel cylinder
4 plexiglass end
-caps
5 high voltage
transformer
6 ac power source
7 thermostat
®
Pig. 13.
Figure 13 shows a cylindrical discharge device with annular gap
/Kogelschatz, U. 1988/. The discharge gap distance varies
typically between 0.5 and 5 mm and the operation pressure is near
atmospheric pressure.
<--(I R!' .. :~",,--~.f· ,li lf4 , '" '"' :". "-""~. -~ .. ;~:t"; .~>
" "'- ..........
Pig. 14.:
Fig. 14 gives a view on four ozone generators, manufactured by
ABB /Kogelschatz 1988/. Each generator has a nominal production
rate of 37,S kg ozone/h at an ozone concentration of 6 weight
percent.
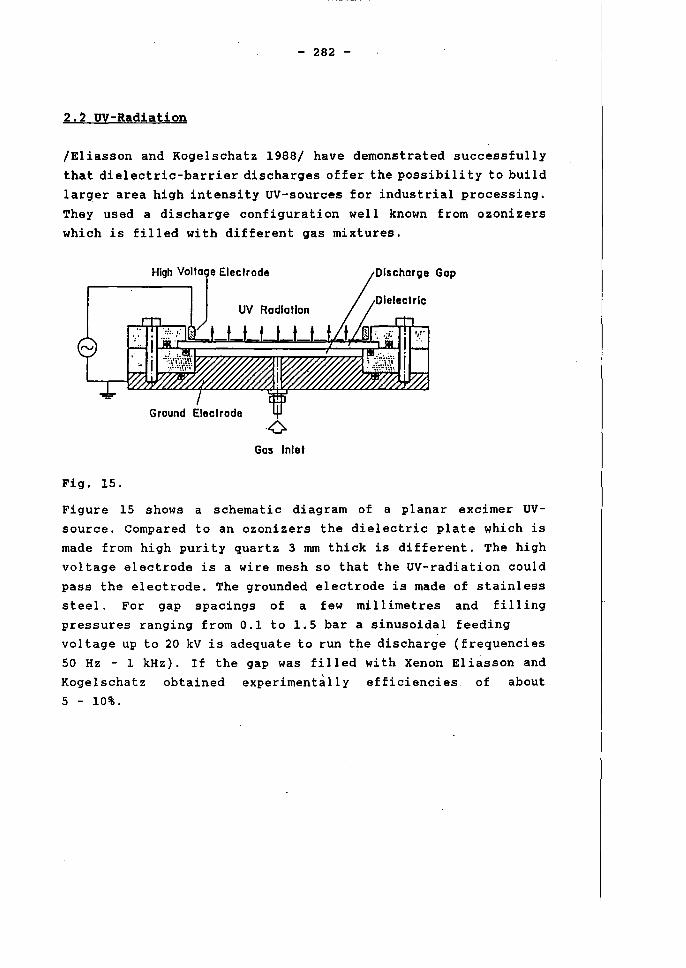
- 282 -
2.2 UV-Radiation
/Eliasson and Kogelschatz 1988/ have demonstrated successfully that dielectric-barrier discharges offer the possibili ty to build
larger area high intensity UV-sources for industrial processing.
They used a discharge configuration weIl known from ozonizers which is filled with different gas mixtures.
Gap
UV RadialIon
-0 Gas Inlet
Fig. 15.
Figure 15 shows a schematic diagram of a planar excimer UVsource. Compared to an ozonizers the dielectric plate which is made from high purity quartz 3 mm thick is different. The high
voltage electrode is a wire mesh so that the UV-radiation could pass the electrode. The grounded electrode is made of stainless steel. For gap spacings of a few millimetres and filling pressures ranging from 0.1 to 1.5 bar a sinusoidal feeding voltage up to 20 kV is adequate to run the dis charge (frequencies 50 Hz - 1 kHZ). If the gap was filled with Xenon Eliasson and Kogelschatz obtained experimentally efficiencies of about 5 - 10%.
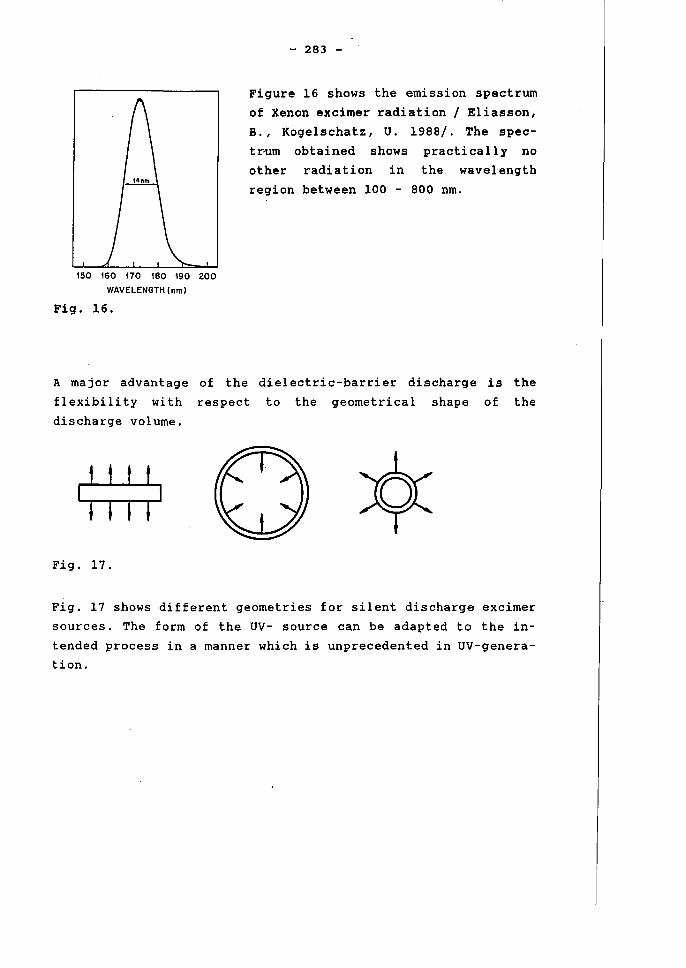
150 160 170 180 190 200
WAVELENGTH (nm)
Fig. 16.
- 283 -
Figure 16 shows the emission spectrum
of Xenon excimer radiation / Eliasson,
B., Kogelschatz, U. 1988/. The spec
tr~m obtained shows practically no
other radiation in the wavelength
region between 100 - 800 nm.
A major advantage of the dielectric-barrier discharge is the
flexibility with respect to the geometrical shape of the
discharge volume.
Fig. 17.
Fig. 17 shows different geometries for silent discharge excimer
sourees. The form of the UV- source can be adapted to the in
tended process in a manner which is unprecedented in UV-generation.
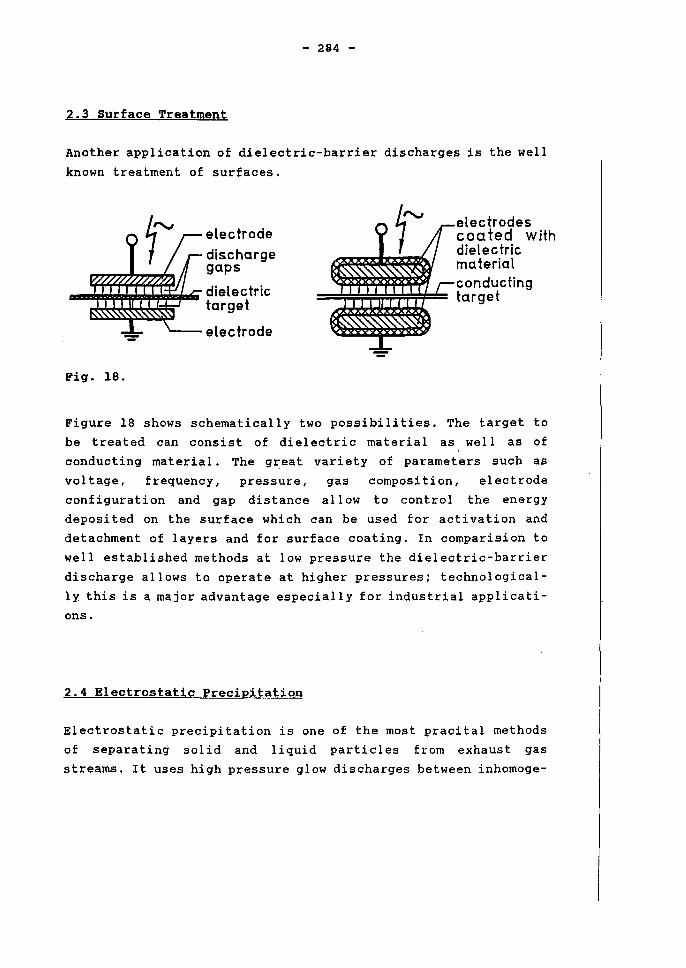
- 284 -
2.3 Surface Treatment
Another application of dielectric-barrier discharges is the weIl
known treatment of surfaces.
Fig. 18.
electrode
discharge gaps
dielectric target
electrode
electrodes coated with dielectric material conducting target
Figure 18 shows schematically two possibilities. The target to
be treated can consist of diel ectric material as weIl as of conducting material. The great variety of parameters such as
voltage, frequency, pressure, gas composition, electrode
configuration and gap distance allow to control the energy
deposited on the surface which can be used for activation and
detachment of layers and for surface coating. In comparision to
weIl established methods at low pressure the dielectric-barrier
discharge allows to operate at higher pressures; technological
ly this is a major advantage especially for industrial applications.
2.4 Electrostatic Precipitation
Electrostatic precipitation is one of the most pracital methods
of separating solid and liquid particles from exhaust gas
streams. It uses high pressure glow discharges between inhomoge-
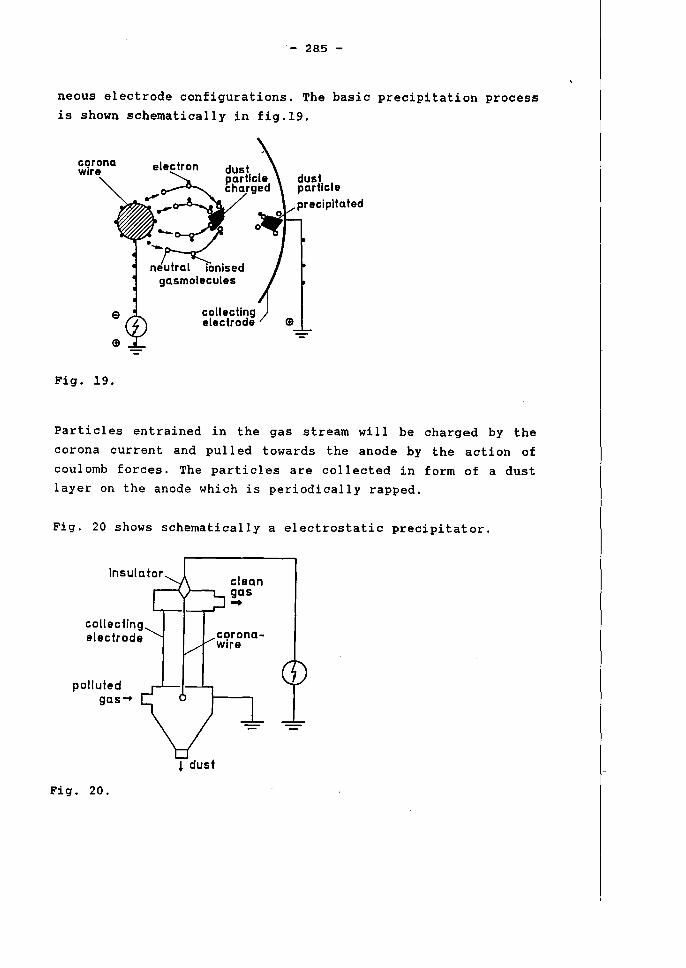
- 28.5 -
neous electrode configurations. The basic precipitation process is shown schematically in fig.19.
corona wire
Fig. 19.
electron dust
"-~P~~~~~"'~_If-,~~~IICle ... precipitated .:;;:z 0
neutral ionised gasmoleeules
collectlng electrode
Particl es entrained in the gas stream will be charged by the
corona current and pulled towards the anode by the action of
coulomb forces. The particles are collected in form of a dust layer on the anode which is periodically rapped.
Fig. 20 shows schematically a electrostatic precipitator.
polluted gas-+
Fig. 20.
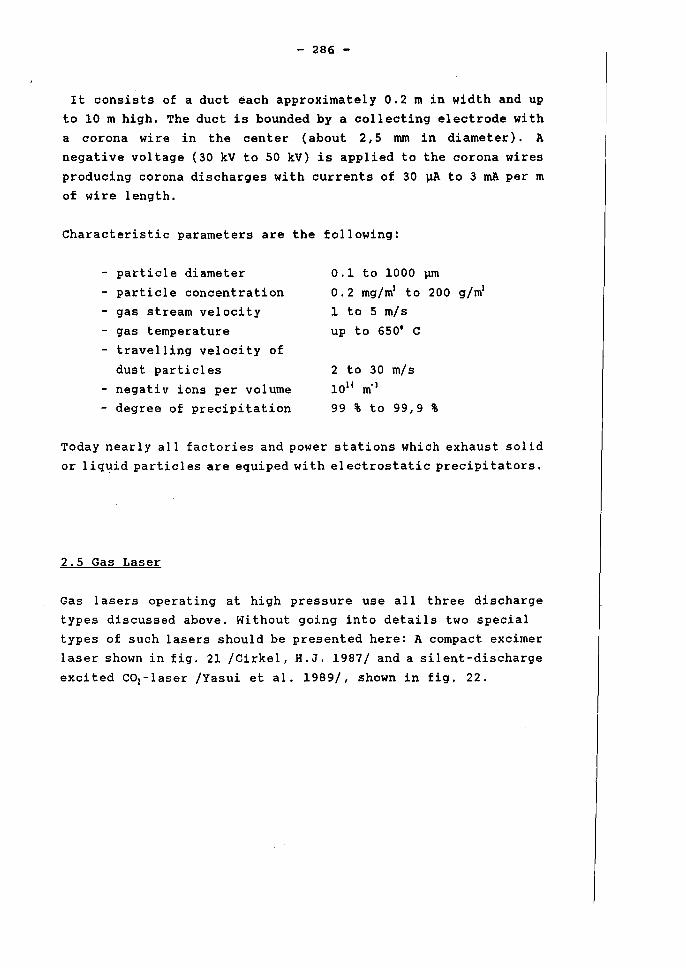
- 286 -
It consists of a duct each approximately 0.2 m in width and up to 10 m high. The duct is bounded by a collecting electrode with
a corona wire in the center (about 2,5 mm in diameter). A
negative voltage (30 kV to 50 kV) is applied to the corona wires
producing corona discharges with currents of 30 ~A to 3 mA per m of wire length.
Characteristic parameters are the following:
- particle diameter
- particle concentration - gas stream velocity
- gas temperature
- travelling velocity of
dust particles
- negativ ions per volume - degree of precipitation
0.1 to 1000 ~m
0.2 mg/rn' to 200 g/m'
1 to 5 m/s
up to 650' C
2 to 30 m/s 1014 m-' 99 % to 99,9 %
Today nearly all factories and power stations which exhaust solid or liquid particl es are equiped wi th el ectrostatic precipi tators.
2.5 Gas Laser
Gas lasers operating at high pressure use all three discharge
types discussed above. Without going into details two special
types of such lasers should be presented here: A compact excimer
laser shown in fig. 21 /Cirkel, H.J. 1987/ and a silent-discharge
excited COI-Iaser /Yasui et al. 1989/, shown in fig. 22.
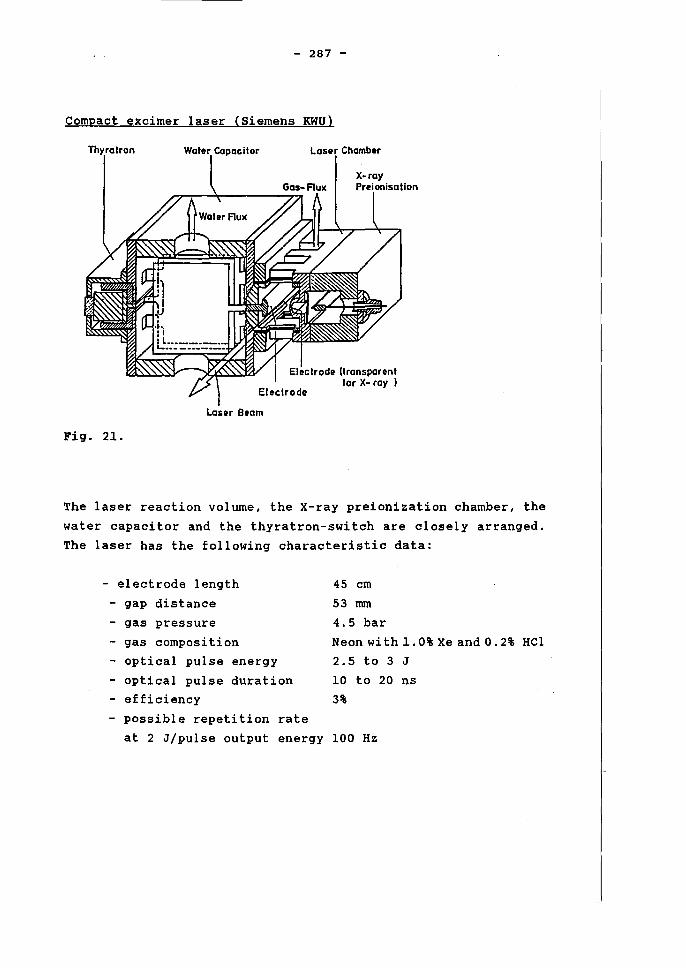
- 287 .,..
Compact excimer laser (Siemens KWU)
Capacilor Lase Chamber
Electrode (transparent tor X- ray )
Laser 8eam
Fig. 21.
The laser reaction volume, the X-ray preionization chamber, the
water capacitor and the thyratron-switch are closely arranged.
The laser has the following characteristic data:
- electrode length
- gap distance
- gas pressure
- gas composition - optical pulse energy
- optical pulse duration - efficiency
- possible repetition rate
45 cm
53 mm
4.5 bar
Neon wi th 1.0% Xe and 0.2% HCl 2.5 to 3 J
10 to 20 ns
3%
at 2 J/pulse output energy 100 Hz
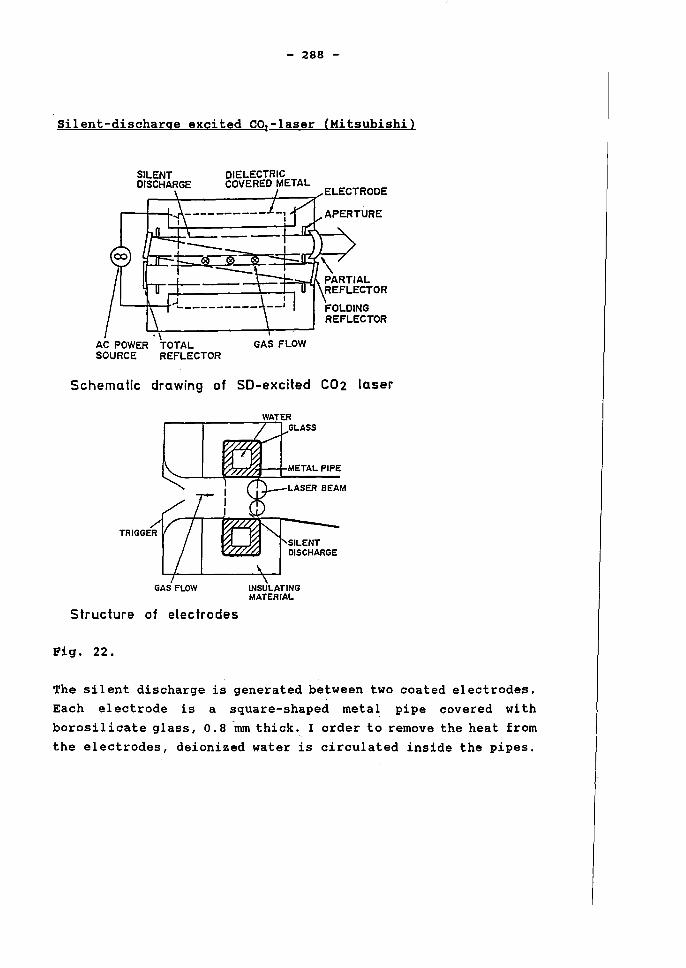
- 288 -
Silent-discharge excited COz-laser (Mitsubishi)
SILENT DIELECTRIC DISCHARGE COVERED METAL
AC POWER TOTAL GAS FLOW SOURCE REFLECTOR
Schematic drawing of SD-excited C02 laser
GAS FLOW
structure of electrodes
Fig. 22.
LASER BEAM
SILENT DISCHARGE
INSULATING MATERIAL
The silent discharge is generated between two coated electrodes. Each electrode is a square-shaped metal pipe covered with borosilicate glass, 0.8 -mm thick. 1 order to remove the heat from
the electrodes, deionized water is circulated inside the pipes.
- 289 -
The silent discharge COz-laser has the following characteristic data:
- discharge length 1.5 m
- gap distance 45 mm
- gas press ure 93 mbar
- gas composition COz, CO, Nz, He (8:4:60:28)
- gas flow velocity 80 m/s
- the output voltage is variable in order to control the discharge power and to realize pulsed laser waveforms
- voltage frequency 100 kHz
- output power: continuous operation pulse operation (300 Hz and 50% duty cycle)
- uniformly diffused discharge
- high-quality beam pattern of T~.
Acknowledgement
2.5 kW
3.8 kW
The author wishes to thank J. Heuer and H. Winkler for their valuable support in preparing this paper.
References
Cirkel, H.-J.
Friede, D.
Eliasson, B.
Eliasson, B.
Hirth, M.
Kogelschatz, U.
Eliasson, B.
Kogelschatz, U.
Francis, G.
Goll, O.
Heuer, J.
Kind, D.
Kärner, H.
Kogelschatz, U.
- 290 -
Excimer: Hohe Pumpleistungsdichte
Laser Magazin 1/86, pp. 36 - 39
Electrical Discharges in Oxygen
BBC-Report, Forschungszentrum Baden
Dättwil, 1983
Ozone Synthesis from Oxygen in
Dielctric-Barrier Discharges
J. Phys. D: Appl. Phys. 20 (1987)
pp. 1421 - 1437
UV-Excimer Radiation from Dielectric
Barrier Discharges Appl. Phys B. 46 (1988), pp. 299 - 303
The Glow Discharge at Low Pressure
Handbuch der Physik, Springer 1956,
p. 54
Ober die Erzeugung gepulster Gasent
ladungen aus stationären Niederdruck
plasmen
Dissertation TU Braunschweig 1989
Forschungsarbeit, TU Braunschweig 1989
unpublished
High-Voltage Insulation Technology
Vieweg u. Sohn, Braunschweig 1985
Advanced Ozone Generation in Process
Technology for Water Treatment
Plenum Press .1988, pp. 87 - 118
sigmond, R.S.
Yasuki, K. Kuzumoto, M. Ogawa, S., Tanaka, M. Yagi, S.
- "291 -
The Residual Streamer Channel: Return Stroke and Secondary Streamers J. of Appl. Phys. 56 (1984),
pp. 1355 - 1370
Silent-Discharge Excited TE~, 2.5 kW
C01-Laser IEEE Journal of Quantum Electronics Vol. 25 (1989) pp. 836 - 840
- 292 -
The Pseudo Spark-Switch - A Modern Plasma Application -
G. Ecker
Institute of Theoretical Physics
Ruhr-University Bochum, FRG
- 293 -
THE PSEUDO SPARK-swITCH
• A MODERN PLASMA APPLICATION
Günter Ecker, RUß
Plasma technology and switch gear
Plasma technology - one of the topics of tbis workshop - is a key technology, which means that the
plasma is crucial for a wide range of technical applications. The plasma serves as a source of
radiation in gas discharge lamps and lasers, it is the heat source for welding, cutting and melting, it
serves as a bumer, in plasma chemistry it serves for the synthesis and production of new materials,
it is the instrument of low pressure processing for the structuring of surfaces and thin film
technology, it is the fuel for nuclear fusion, and - last not least - it is the ideal and unique agens of
modem switch gear technique.
The task of a switch is seemingly simple: It changt:S between a "closed state" and an "open state". In
the closed state its resistivity should be smaller than 10 -6 Ohm, in its open state its resistivity
should be larger than 1018 Ohm. This change by a factor 1024 should occur on a very short time
scale. These requirements pose tremendous difficulties.
. . The key element which masters the problem in all switching devices is the PLASMA: • It ignites automatically and produces on a verysmall .time scale an' agent of excellent
conductivity. . It ignites reliably at the point of contact separation without additional assistance. It exists as long as there is energy supply. It is a good, rugged conductor, practically resistent to any'load Its time dependence can be infIuenced in many ways by extemal constructive measlires. It deionizes and extinguishes on a time scale which'allows areliable disconnection after current zero.
Switch gear technology is an important sodal factor. *eady th~ low voltage switch gem.: market in
West Germany by itself stands for about 1 Billion Dollru.:s per ye~, and the rest of the switch gear
will be good for another Billion Dollars. More important ev~~ without switch gear the supply of • • • , • +
the growing energy demand in the world could not, be handled This is particularly true for many
very specific technical areas.
One of these areas isthe field of pulsed power technique, • one'pf the most pioneering 6ndeavours
of ma;d,em technique. It allows to produce extreme poWCfr ß)IXe5 of TW/cm2, which permit us to
ente~ ~ew mat~ri~ states. In' m'aterial'~processing ilie short '~pplication thnes allow processing
- 294 -
which would be impossible in a continuous application. For instance, destructive effects can be
avoided or fast moving objects can be treated as in a stationary state.
Experts are aware that the success of puIsed power technique - apart from the problem of energy
storage - depends mainly on finding an extremely fast switch able to fulfill exceptional demands
with respect to current load, voltage resistivity, current rise rate, life time and repetition rates.
'{he PSEUDO SPARK is one of the most promising instr\l!llents to solve this exceptional technical
task in the field of plasma technology.
Typlcal discharges or gaseous eledronlcs
If one asks the question, which type of discharge govems the switch gear processes, the answer is:
"are discharges". Howev~r; already the fact that we have so many different types of switches like
oil-, magnetic-, blast-, SF6- and vacuum switches sheds doubt whether all these phenomena can be
subordinated to the concept of an arc discharge.
Nevertheless, with respect to the discussion of the PSS discharge in the literature it is important to
recall, what discharge types have been introduced in the early days of gaseous electronies, no
matter, how vague they may be defined.
To thls end figure 1 shows 'in a crude and somewhat schematic way the stationaring U-I
characteristic for hydogen at about one Torr press ure, giving for the various regions the discharge
names which have been attached. Particular attention should be payed to the fact that we have two
~ymbols, the one (-n- ) referring to plane parallel electrodes, the other ( (bI) ) to a cup
shaped cathode.
As we see; for very low currents there exists "no self sustained dischtuge". With increasing currents
we approach the range of the "Townsend discharge", which is free of space chaige effects and is
based on a mutual production mechanism of electrons froin the cathode by ions and photons and
production o~ ions in the gas by just these electrons deliberate4 from the cathode. Here the 50-
ca1Ied "Paschen-Iaw" holds. In the "subnonna/ range" the infIuence of space charges becomes
important imd in the "nonna/ glow discharge range" we have the characteristic mechanism of the
negative g10w with a constant voltage drop of several hundred volts and a constant current density.
Elecb-ons deliberated from the cathode by ion impact f~rm runaways in the cathode fall region
and produ~ the negative g1ow, from which the ions fall down' to the cathode. In the "abnonna/
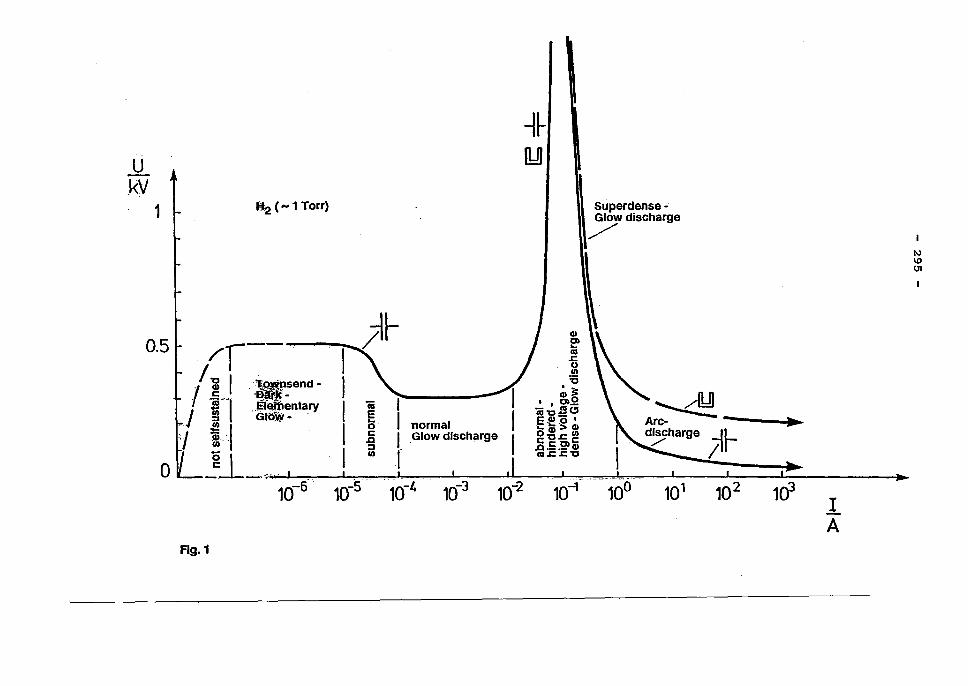
.!L
.kV 1
0.5
o
-I~ [b1J
f:l2( - 1 Torr) I Superdense-Glow diseharge
/
l /f-·- t ~
/ ~ 1 'te-lWsend - • :5 , c 'E)~~- 1 GI == n n . ·S"-' .,Ef~entary jij I ~ · g'S ............. /l!:J ~ Gtow- ' E I I CQ~~. ----- -
J!! I' 0 normal ·e 'lüg GI Are- ----i.~ '!: ..5 IGIOW dlseharge I g -g"§, ~ -'L
g~_,,,.,, ' ,,~J ' ,I ~:E:E~ /11,- ,"" ~ 10-6 10-5 10-1. 10-3 10-2 10-' 10° 10' 102 10J
Flg.1
1. A
'" \0 UI
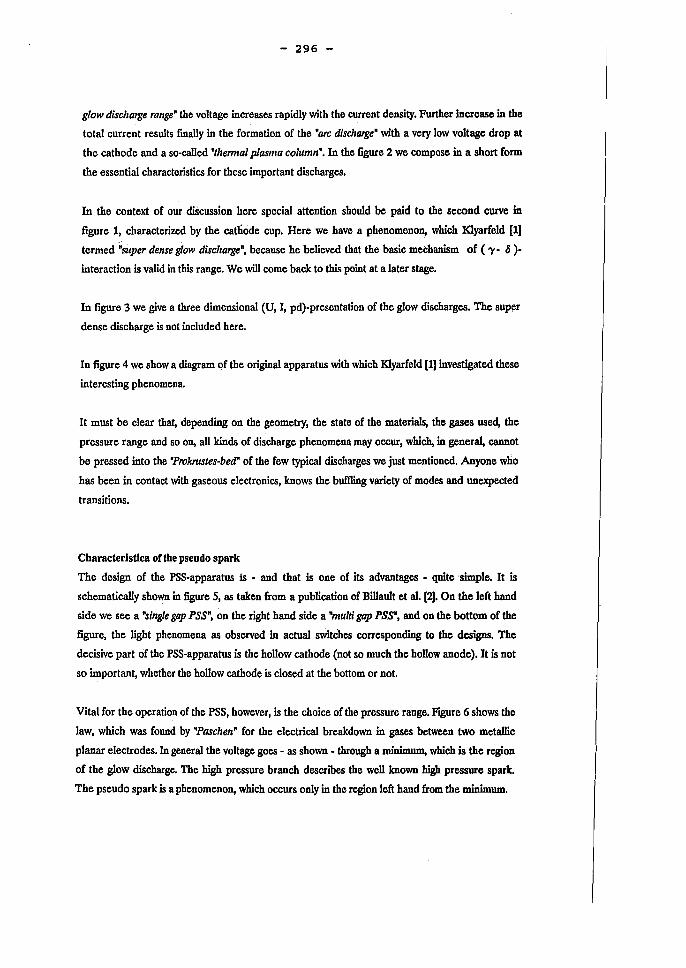
- 296 -
glow discharge range" the voltage increases rapidly with the current density. Further increase in the
total current results flDally in the formation of the "are discharge" with a very low voltage drop at
the cathode and a so-ca1Ied "thennal plasma column". In the ligure 2 we compose in a short form
the essential characteristics for these important discharges.
In the context of our diScussion here special attention should be paid to the second curve in
figure 1, characterized by the catIiode cup. Here we have a phenomenon, which Klyarfeld [1]
termed ~super dense glow discharge", because he believed that the basic meehanism of ('Y- 8)
interaction is valid in this range. We will come back to this point at a later stage.
In figure 3 we give a three dimensional (U, I, pd)-presentation of the g10w discharges. Tbe sUper
dense discharge is not included here.
In figure 4 we show a diagram of the original apparatus with which Klyarfeld [1] investigated these
interesting phenomena.
It must be clear that, depending on the geometry, the state of the materials, the gases used, the
pressure range and so on, a11 kinds of discharge phenomena may occur, which, in general, cannot
be pressed into the "Prokrustes-bed" of the few typica1 discharges we just mentioned. Anyone who
has been in contact with gaseous electronics, knows the buffling variety of modes and unexpected
transitions.
Characterlstlca or the pseudo spark
Tbe design of the PSS-apparatus is - and that is one of its advantages - quitesimple. It is
schematica11y shown in figure 5, as taken from a publication of Billault et a1. [2]. On the left hand
side we see a "single gap PSS", on the right hand side a "multi gap PSS", and on the bottom of the
figure, the light phenomena as observed in actual switches corresponding to the designs. Tbe
decisive part of the PSS-apparatus is the hollow cathode (not so much the hollow anode). It is not
so important, whether the hollow cathode is c10sed at the bottom or not.
Vital for the operation of the PSS, however, is the choice of the pressure range. F'JgIlI'e 6 shows the
law, which was found by "Paschen" for the electrica1 breakdown in gases between two metallic
planar electrodes. In general the voltage goes - as shown - through a minimum, which is the region
of the g10w discharge. Tbe high pressure branch describes the weil known high pressure spark.
The pseudo spark is a phenomenon, which occurs only in the region left hand from the minimum.
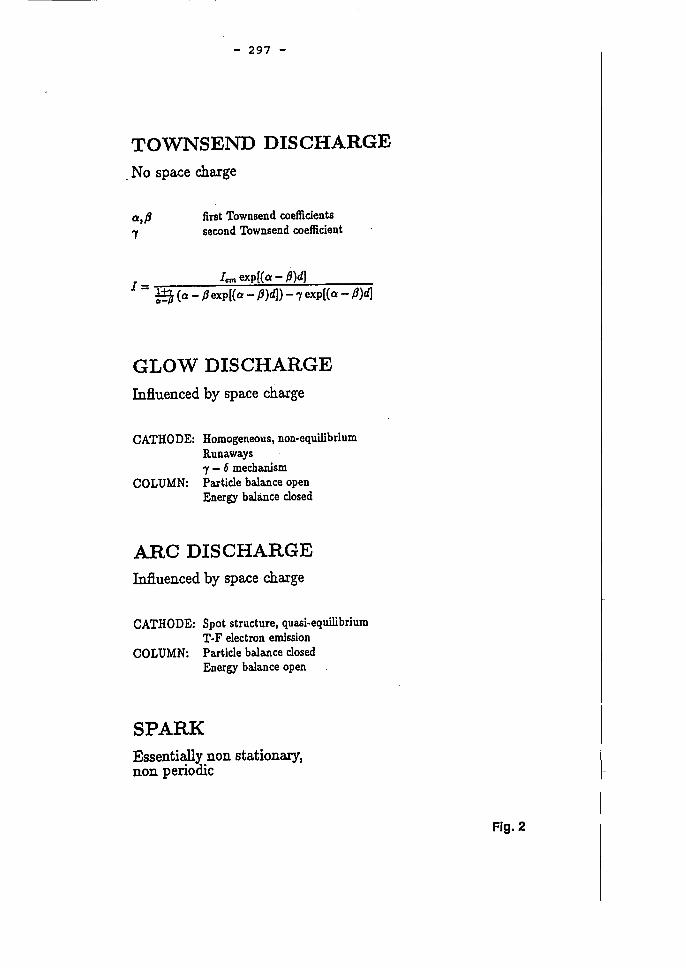
- 297 -
TOWNSEND DISCHARGE . Nospace charge
a,p first Townsend coefficients 7 second Townsend coefficient
1- Im> exp[(a - ß)d) - ~ (01 - pexp[(a - P)d) - 'Y exp[(a - P)d)
GLOW DIS CHARGE Inßuenced by space charge
CATHODE: Homogeneous, non-equilibrium Runaways 'Y - 6 mechanism
COLUMN: Particle bala.nce open Energy bala.nce closed
ARC DIS CHARGE Inßuenced by space charge
CATHODE: Spot structure, quasi-equilibrium T-F electron emission
COLUMN: Particle balance closed Energy balance open
SPARK Essentially non stationary, non periodie
Fig.2
- 298 -
U, kV
~L_.;--1 __ --r"'oo
'1# -, 10-% -7 :. 6 10-S 1Ö 10"
10 10 j, A/cm2
Types 01 gJow discharge in system 01 coordinates U, j, pd.
1) EJementary gJow discharge; 2) dense gJow discharge;
3) normal gJow discharge. The vaJues on the coordlnate
axes are 10r orientatlon only.
Flg.3
- 299 -
SUPERDENSE HOLLOW-CATHODE GLOW DISHCARGE
a
Anode
~100
I ~60
Ag. 4

!.!:~:.~~ ""''''''' .... 1 E LEG TRON
~IONS :--::: ~
-RE~;~:; BEAM
PLASMA ELECTRON
.~·~t.·~'~·
-4--IONs----.:: • -Rffi~~~ BEAM
~ 4
CATHODE ANODE CATHODE ANODE ~INSULATOR
~ _METAL
a) b)
Principle ((op) ami view (below) or a single-gal) (a) and a lIlulligal) (h) pseudospark chamber
Ag.5 I
IN o o
- 301 -
I PSEUDO-J SPARK
ce VACUUM ::> BREAKDOWN I
I I I GLOW I IDISCHARGEII I a.,y RAETHER'S
STREAMER DISCHARGE
ead
10 P·deff [mbar·mml
. PASCHEN-curve representing the breakdown behaviour of gasfilled two plane parallel electrode configurations
Flg.6
- 302 -
To start the operation of the PSS in the so-called "self-ignited mode", one may use an overvoltage
weil above the Paschen curve . However, for practical use this type of operation has many
dis advantages.
In actual applications one uses trigger mechanisms to ploduce the breakdown. Tbere are various
types Iike "slide-spark-triggering", "pulsed-glow-discharge-triggering", "j1ash-lamp-triggering" and "fiber
.optic triggering". Tbe two last methods are of particular importance for the so-called BACK-t
LIGHTED THYRATRON (BLT), which may be considered as a PSS with a special triggering
approach. The various methods mentioned are shown in the figure 7.
Operation and data ofthe pseudo spark dlscharge
Tbe operation of the PSS may be understood from figure 8, which schematica1ly presents the time
dependence of the voltage iuld the variation of this discharge voltage. Tbe time of ''voitage
application" is designated by ta . It follows the so-ca1Ied PREDISCHARGE, in which the current
transport in the PSS develops, but the current is still so small that the voltage essentially holds its
value. This time we designate by Ta' After that the current of the discharge grows so rapidly that
the voltage breaks down in a very short time Tb' which we ca1I the time of the MAIN
DISCHARGE.
However, before we consider typical quantitative data for the PSS operation we would Iike to
state three important qualitative observations:
1.) It appears that the plasma between the electrodes of the pseudo spark shows spatial homogeneity without any evidence of structuringj [~.
2.) Tbe cathode surface in a certain area (about 1 cm ) of the hole in the cathode shows melting and asplattered structure as shown in figure 9j[3].
3.) Occasionally hot spots are observed within the hole and at the rim of the cathode hole [4].
PSS discharges have been widely investigated by several groups in Europe and the United States.
In doing so, design, material and gases as weil as circuitry varied over wide ranges. So did the
technical data which were found. To give a comprehensible overview of these data we composed
typical values in the following three figures 10-12. Here, not only the basic phenomena are
described, but also some aspects, which have been observed only occasionally.
Advantages and bench marks
In a nut shell the advantages of the pseudo spark devices are the followings:
Flg.7
.......... _. ~ .. '"a= ... Ur.ODl
I Y.&CUUNSUPOl:l
(al
(bI
Schcm:uic uf thc slidc,~p:ld:'lricgcrcd pscudospart swilch (u). and cnlargcmcRI 01' .he lrigger sccliuR (b). Thc di~chargc is igoil!!..! by appl)'ing a high-vohagc pulse (nf typicaUy 2 L:V) tu .he Irigger clcclm.Jc. cilusin~ thc sudacc 01" ahe ahinner iO!l.uhuur 10 dash uycr.
IHSUL.l.tDR~
UOI>t
TR IGGER PULSE
~ kEEP-ALlYt CURRENT
BLocrlHG POfEHJU.L
Experimental pscudospark swilch dcsiCn ror pulscd·glow·di~· charlc triaccrina. and clcctric .. ' circuil. To lrigger lhc 5wilCh. thc blt..:l;.· ins: polcnlial ur s.cvcr.al hlln&Jred \/'uhs. is ... ri .... cn IlJ .t:cro ... nd &I ncg:.ali\/'c high.volt .. ,c pulse ur2-S kV in anlplilude and sever.,,1 micru!iic&:ond); du· 'allun is simululncously applicd to Ibc Irigger eh:clrudc.
GAS FLOW PORT
CATHODE ANODE
GUSS ENVELOPE
A •• h.lamp •• riggercd BLT Ihyralron •• ypc .wilch. Lighl (rom 'he uiggcrcd UV nashlamp is incidcot on ehe black-or-thc...:alhodc sud ac&: inilialiug che dischargc Ihrough pholocmission 0( dcclrons.
An9de
CA.hode
'1 ..... Shown is ehe dr:t.wing of the fibcr-opcic-lriggcred BlT. A UV liehl
pulse is lrölßsmiucd by thc tiber. Bcncr.uinl pholoclccu'Ons in thc high clcclnc ~cld ICJiion. whieh C3USCS an avalanche bre:&kdowQ o( ahe liIII
and ..:Ioscs Ibc swileh. Tbc b~dlc inside thc e:&d,u.Je eup clecuQdc-is used as il pholocleclron CoUcclor 10 mCilsurc thc quantum ctfic:icnc:y.
IN o IN
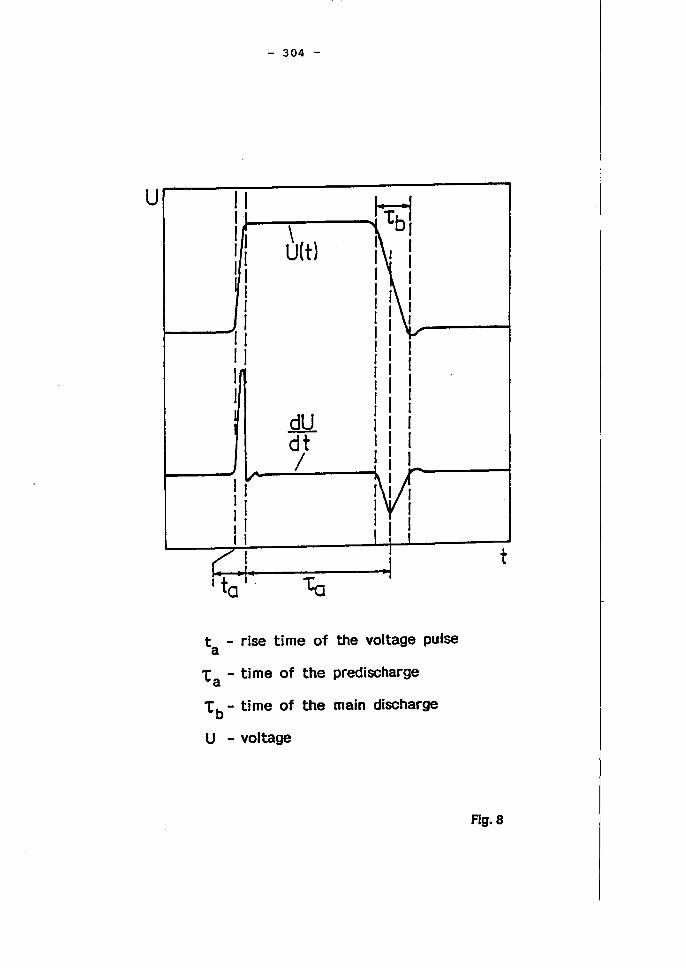
U
- 304 -
11 '·tbl I
'I \ 'I u(t) I ' 1 1
1 , I , I I , I
11 11 , 1
dU dt /
ta
- rise time of the voltage pulse
ta
- ti me of the predischarge
tb
- time of the main discharge
U - voltage
t
Flg.8
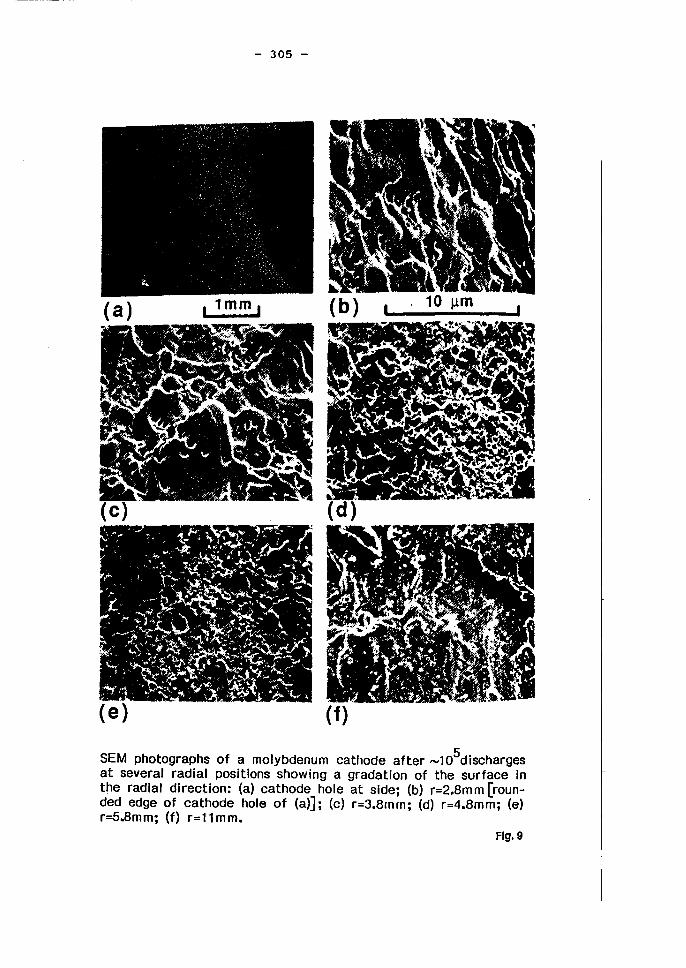
- 305 -
(e) (f)
SEM photographs of a molybdenum eathode after -105diseharges at several radial positions showing a gradation of the surfaee in the radial direetion: (a) eathode hole at side; (b) r=2.8mm [rounded edge of eathode hole of (a)]; (e) r=3.8rnrn; (d) r=4.8mm; (e) r=5.8mm; (f) r=llmm.
Flg.9
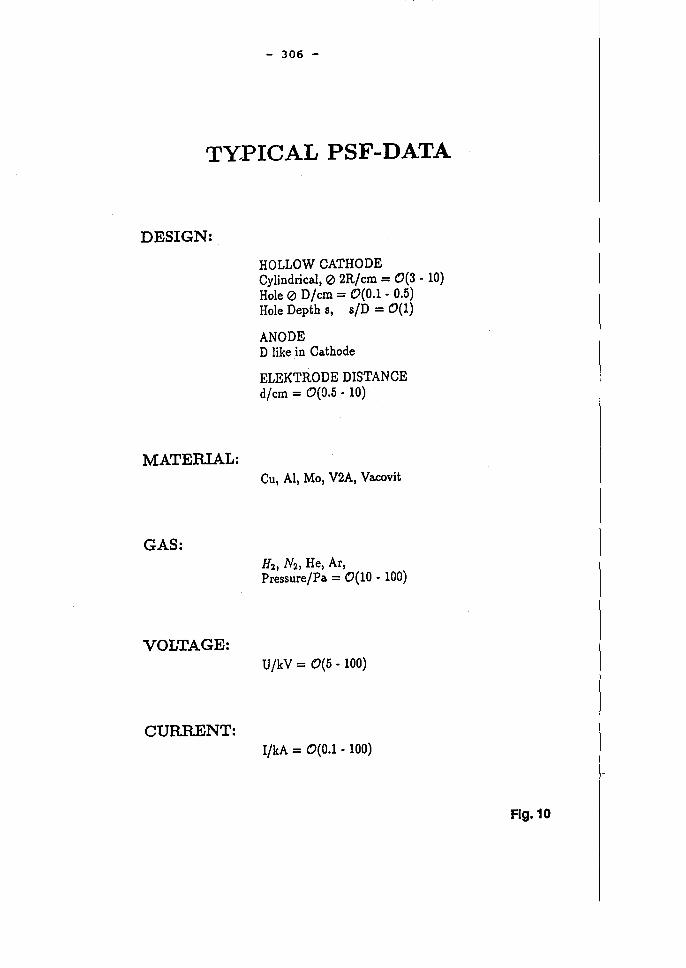
- 306 -
TY/PICAL PSF-DATA
DESIGN:
MATERlAL:
GAS:
VOLTAGE:
CURRENT:
HOLLOW CATHODE Cylindrieal, 0 2R/em = 0(3 - 10) Hole 0 D/em = 0(0.1 - 0.5) Hole Depth s, s/D = 0(1)
ANODE D like in Cathode
ELEKTRODE DISTANCE d/ern = 0(0.5 - 10)
Cu, Al, Mo, V2A, Vacovit
H2, N2, He, Ar, Pressure/Pa = 0(10 - 100)
U/kV = 0(5 - 100)
I/kA = 0(0.1 - 100)
Flg.10

- 307 -
TYPICAL PSF-DATA
PREDISCHARGE:
IdA -+ 0(1); grows with > D, < S . Tl/ns -+ 0(1000) for p < 50 Pa
-+ 0 (104 ) for p > 50 Pa
MAIN DIS CHARGE: 12/kA -+ 0(100); grows with < D, > S, < P. T2/ns -+ 0(100)
CURRENT RISE: (dI/dt)/(A/sec) $ 0 (1012
)
JITTER: TJ Ins = 0(1 • 100)
CURRENT DENSITY:
Axis io/(A/cm2) = 0 (105
- 106)
Edge iD/(A/cm2) = 0 (104
)
ELECTRON DENSITY: ne/cm3 = 0 (10 15
)
ELECTRON TEMPERATURE: Tc/eV = 0(1 . 5)
Flg.11
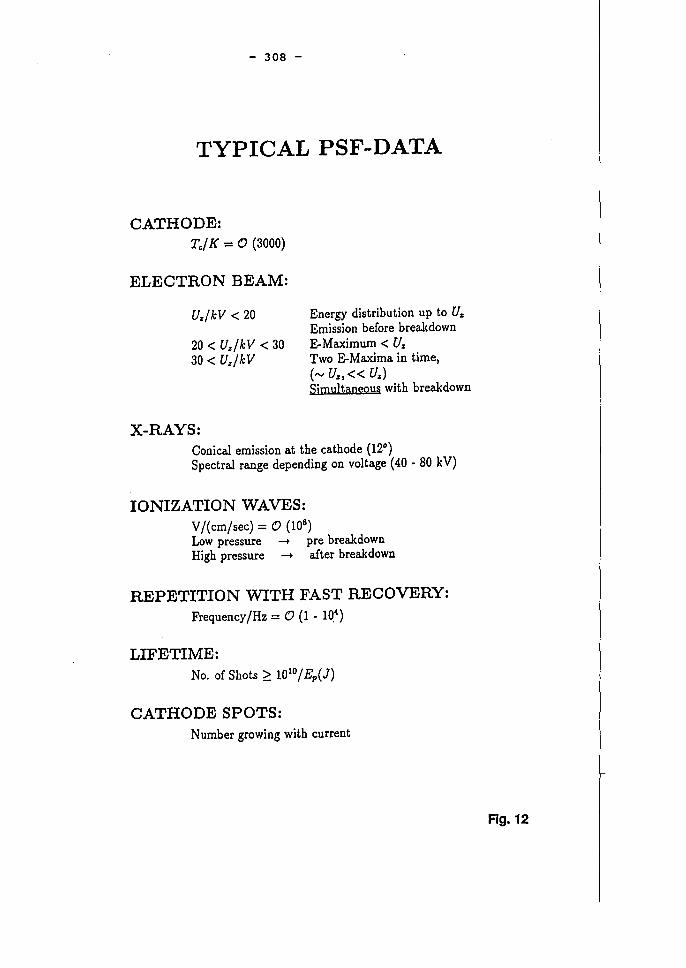
- 308 -
TYPICAL PSF-DATA
CATHODE: Te/ K = (9 (3000)
ELECTRON BEAM:
Uz/kV < 20
20< Uz/kV < 30 30< Uz/kV
X-RAYS:
Energy distribution up to Uz
Emission before break down E-Maximum < Uz
Two E-Maxima in time, ('" Uz ,« Uz ) Sjrnultaneous with breakdown
Conieal emission at the eathode (12°) Speetral range depending on voltage (40 - 80 k V)
IONIZATION WAVES: V /( ern/sec) = (9 (108
)
Low pressure -+ pre breakdown High pressure -+ after breakdown
REPETITION WITH FAST RECOVERY: Frequeney/Hz = (9 (1 - W4
)
LIFETIME: No. of Shots ~ 1010/Ep(J)
CATHODE SPOTS: N umber growing with eurrent
Flg.12
- 309 -
The construction is simpe and rugged Tbe pseudo spark can be effectively controlled and precisely triggered. The electrode holes and the location of the discharge channellead to a smooth transition in current and a drastic reduction of erosion. The well definded discharge channel minimizes the statistical jitter. The fast recovery after discharge allows high repetition rates. The current reversal is no problem due to the design symmetry. Tbe switch in its basic version does not consume electrical energy in the stand-by mode.
The technical performance achieved so far is characterized by the dates of the figures 10-12. The
bench marks of the endeavours of the scientists, however, stand higher. The aims are:
voltage current current rise rate repetition rate Iife time
1MV 2MA 1013Ns kHz 10IlIE (J)
P where Ep(J) designates the energy in Joule, which is handled by the switch.
Analysis and Interpretation of the PSS so far
In the past steadily improving diagnostic methods have been used to leam about the qua1ities of
the PSS. Modelling of the discharge started from qualitative concepts gradually developing into
first attempts of numerical quantitative approaches. Of course, here is not the room to quote and
evaluate all these investigations. What we can do is to characterize the situation by some of the
results, which we find particularly interesting without c1aiming completeness or implying a
judgement.
Let us first consider the PREDISCHARGE.: In the early days, attempts were made to apply the
Townsend mechanism in its stationary form to explain the axial concentration of the discharge
and to account for the statistical delay and jitter. Later the necessity to include dynamical
developments was recognized.
In connection with the BLT-discharge recently a much furtherdeveloped model [5] was based on a
sub-division into "beam electrons" and "bulk electrons". Tbe beam electrons originating from the
electrode surface in the cathode were considered to fall freely along the field lines, loosing by
collisions electrons to the bulk. Tbe bulk was described hydrodynamically, including the Poisson
equation for space charge fields and accounting for the surface electron production by photons. In
the hydrodynamic description the "local field approximation" was used. Tbe results allow to
calculate the delay time and the current distribution of the beam particles and the buIk particles
around the anode in the form of swarm pictures.
- 310 -
More detailed information was aehieved by an investigation [6], whieh used only hydrodynamical
deseription together with the Poisson equation within the hollow cathode. This investigation, too,
used local coeffieients, nec1eeted 'Yi' It also used Monte Carlo solutions in the outside space as a
boundary condition. Tbe results of this solution for the prediseharge are detailed and quite
instruetive. In figures 13 and 14 we show the equipotential Iines and the field Iines within the
hollow cathode and in the interelectrode space. Moreover, the radial electrie field components
and the total value of the electrie field are plotted within the hollow cathode in figure 15. F'JgU1'e 16
presents the distribution of the electron density and the ion density in the hollow cathode, and
figure 17 shows the time development of the electron eurrent density within the z = 0 - plane near
the exit of the cathode hole.
These results demonstrate some important facts:
The eleetrie field has a strong radial component pointing away !rom the axes within the hole of the hollow cathode. With time the eharged particle densities develop a peak near the axis of the cathode hole with a dominating positive space charge. At a certain time the electron eurrent density in the axis exponentially increases.
Let us now turn to MAIN DISCHARGE:
Here, no quantitive approaehes are available. In the early stages references were given to hollow
eathode phenomena and "capillary discharges" without any specification.
Later Klyarfeld's "super dense g10w discharge" was quoted, and it was partieularly stressed that
tbis was not Dnarc discharge. This, in spite of the observation that the 'Y , ~ -mechanism yielded
incredibly high values of ~.
On the basis of bis experimental investigations, Gundersen [4] considered the mechanism of field
enhanced thermal emission using, however, an estimated cathode fall and a sheath extension of
one Debye length. This result seemed to give sufficient electron emission for high, but not for low
temperatures. He estimated a necessary energy flux of 20 MW/cm2 to produce the high
temperatures within the nano-second time sca1e available. He also postulated high ion eurrent
densities.
Altogether, the results for the main discharge and the concepts are rather incomplete.
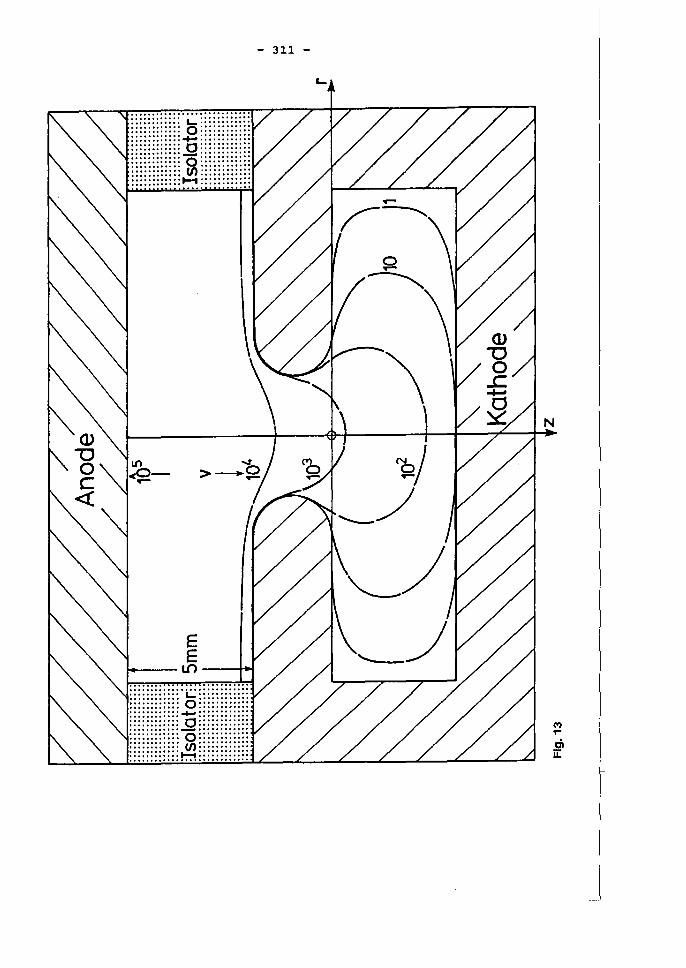
La ..... .Q a CI) ~
E E
~- L(') --+-.I
"L.: a .....
.Q a ~
- 311 -
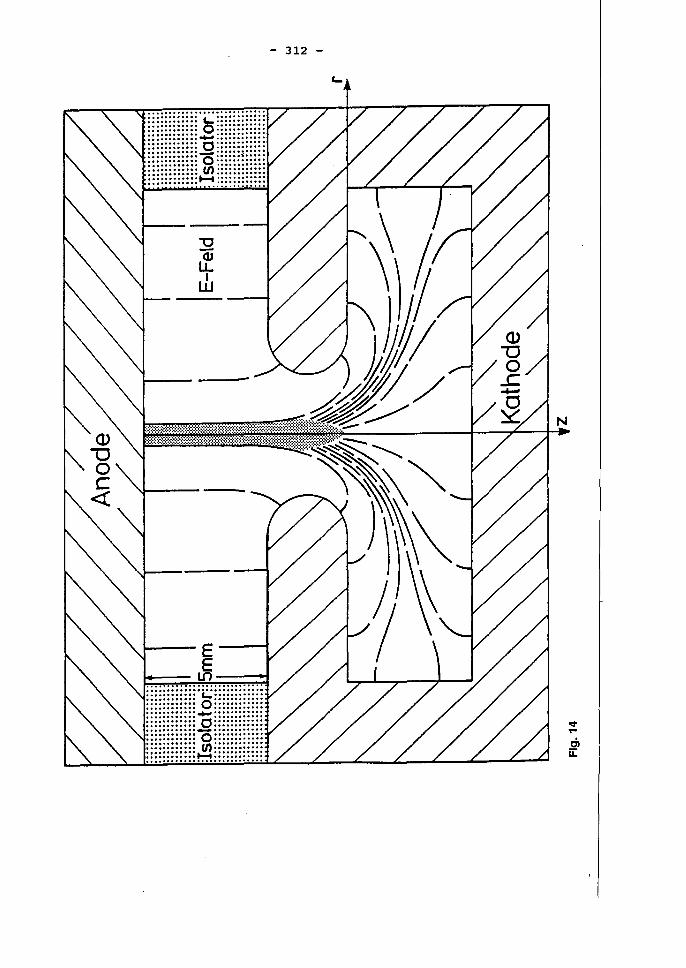
- 312 -
r...
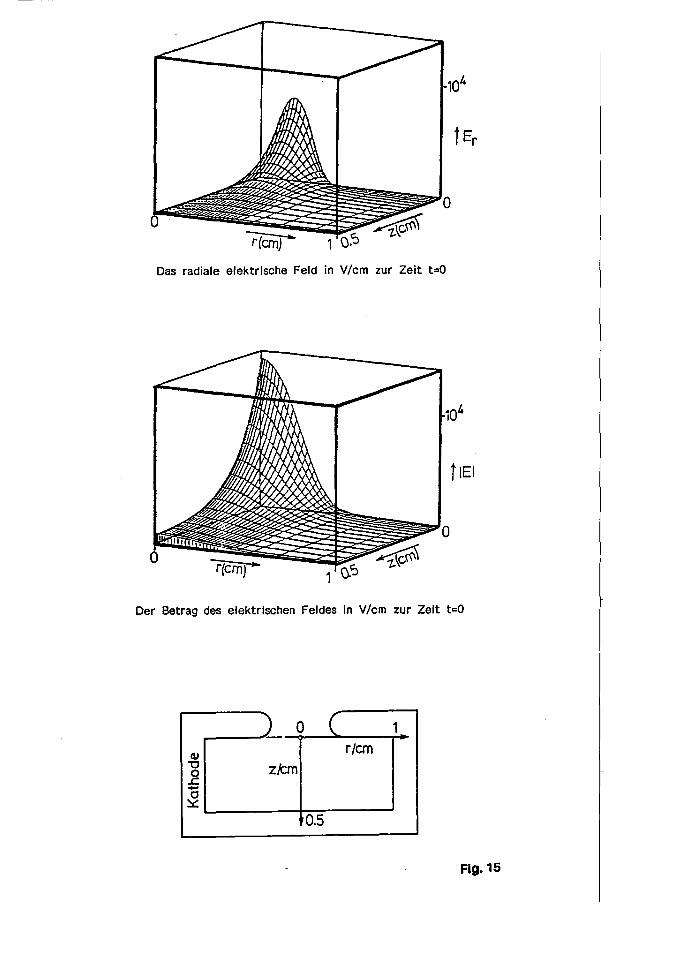
Das radiale elektrische Feld in V/ern zur Zeit t=O
1 eS
Der Betrag des elektrischen Feldes in V/cm zur Zeit t=O
1 0 ( 1
GI r/cm
"0 z/Cm 0 .c. .-Cl ~
0.5
Flg.15

105
o o ~
-3 Elektronendlehte (ern ) in der Hohlkathode zur Zelt des Pseudofunkendurehschlags
") ._0 cu
"'0 0 z/Cm .c -0 ~
I j 0.5
Flg.16
( r/cm
1 Q? lonendiehte (ern-3) In der Hohlkathode zur Zeit des Pseudofunkendurchschlags
l 1 -
-I
.10'3 12 -10
109
105
w .... ""
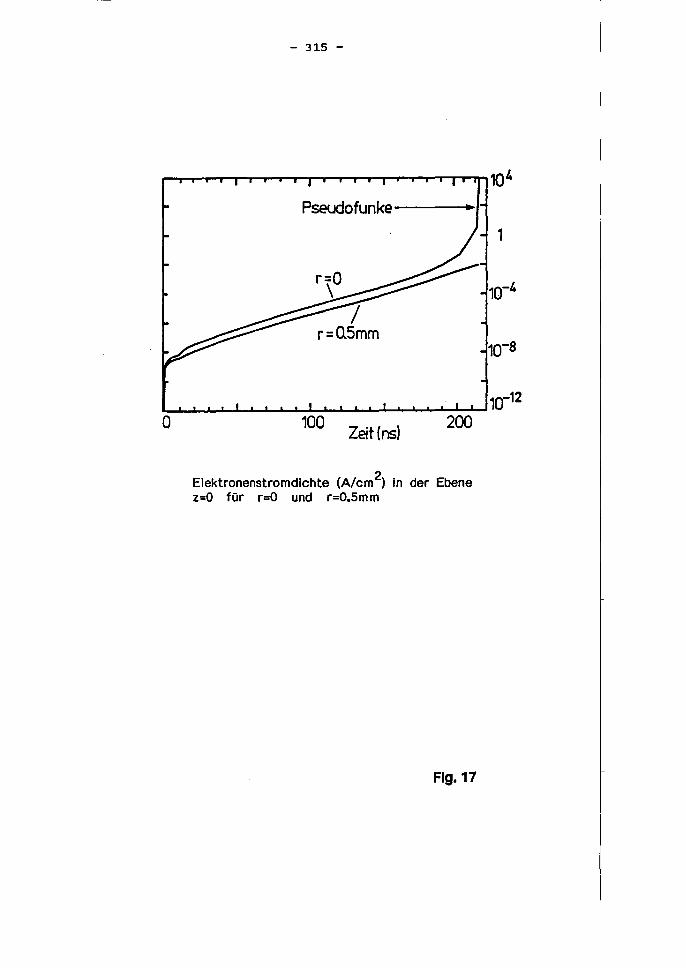
- 315 -
Pseudofunke •
r=O \
I r=D.5mm
~O~~~~~~~~~~~2~OO~
Zeit (115)
Elektronenstromdichte (A/cm2) in der Ebene z=O für r=O und r=O.5mm
Fig.17
1
10-12
- 316 -
Crlticlsm and cbllrBcterization of tbe predlscbarge
In contrast to tbe ideas presented i1i the preceding paragraphs we argue tbat a stationary
Townsend analysis is neitber applicable witbin tbe bollow cathode nor outside the hollow cathode.
Consequently, the application of Paschen's law to explain the focussing in the axis of the discharge
is not acceptable. Defmitely, non-stationary ealculations are required and liberation of electrons
by photo-emission at the cathode surface is decisive, since the ion transit time is quite large. But
again, the non stationary Townsend ealculations use loeal coefficients or the hydrodynamic
description and therefore are not applicable just as the concept of Debye screening in the cathode
hole does not hold.
To see this, let us have a look on the phenomenon of runaway electrons as demonstrated in figure
18 taken from (7). Tbe quantitiy (.?- ql (v» , wbich is shown in this figure is proportional to the
deceleration of electrons by coUisions in a helium gas. Tbe corresponding values of field
acceleration are shown in tbis figure for variuos values of EIN. These quantities are plotted versus
the electron velocity v.
As these figures demonstrate, we cannot reach stationary values for the motion of an electron, if it
reaches the velocity vb' Above a value EIN = 6,21 10-15 V cm 2 we bave no stationary state for
any value of the electron velocity. We have the phenomenon of runanways, wbich does not aUow
the concept of loeal coefficients. Comparing the data given in Ibis figure with the values of EIN
occurring in the pseudo spark, we recognize that the runaway phenomenon plays an important
role in the pseudo spark discharge. Tbis, in itself, together with the fast electron drainage in the
range of the hole of the cathode, does not permit the application of concepts of equilibrium Iike
the Debye length.
In our opinion the previous approaches to the predischarge - although very helpful and intelligent
- are still quite apart from the true behaviour in Ibis phase. Tbe following features, which may
characterize the situation in the predischarge, explain why we think the description of tbis phase is
very difficult and requires bigh numerieal efforts:
The predischarge operates in the Knudsen range. The discbarge is far from equilibrium and neither stationary nor dynamieal Townsend description is possible. Loeal coefficients cannot be used. Tbere is no relation to known standard discbarges. Tbe occurence of tbe electron beam will bave to be ealculated following tbe path of tbe electrons, wbicb - as one can estimate - does not follow the fjeld Iines. It can be expected,
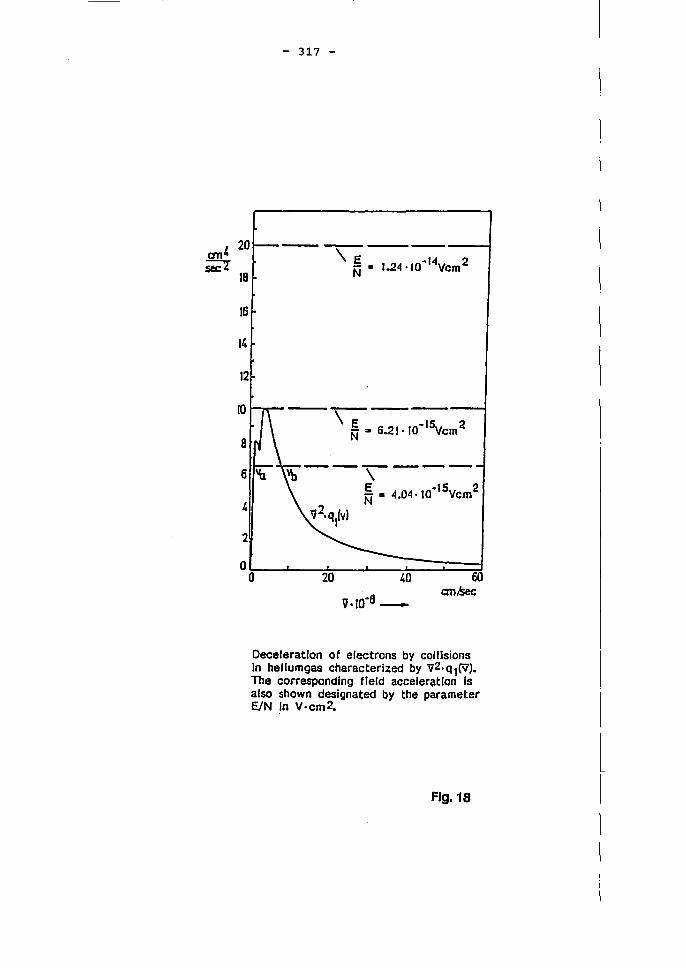
an' 20 sec 2
18
16
t4
12
10
8
6
2
- 317 -
-\7-~2 N .. 6.21· 10 VClO
--,---~ ::I 4.04.1O-15Vcm2
Deceleratlon of electrons by collisions In helIumgas characterized by V2·Ql(V). The correspondlng neid acceIeration Is also shown designated by the parameter EIN In V·cm2.
Flg.18
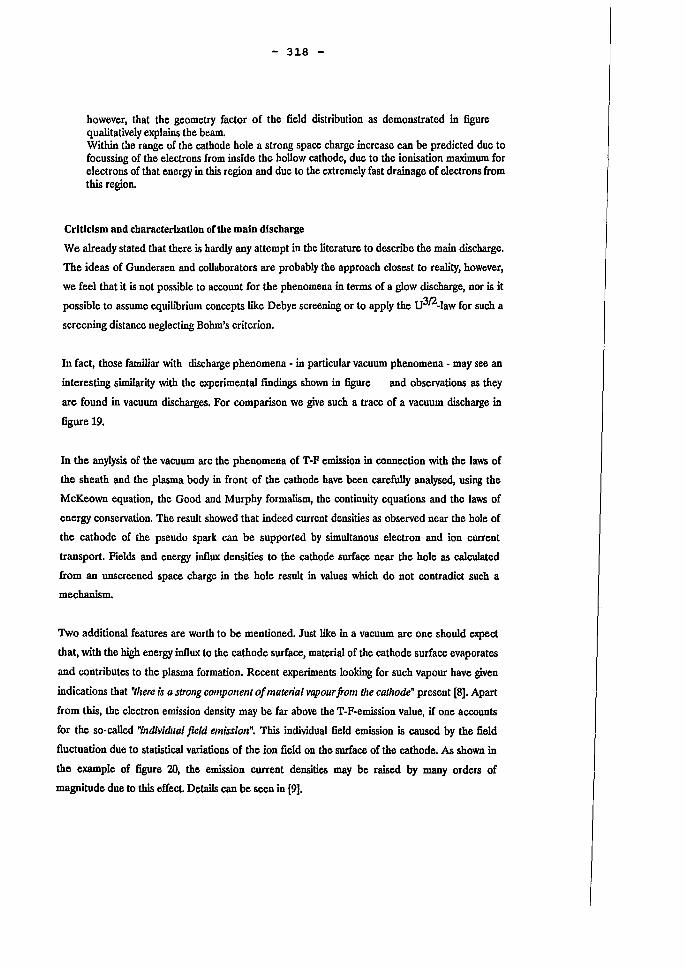
- 318 -
however, that the geometry factor of the field distribution as demonstrated in figure qualitatively explains the beam. Within the range of the cathode hole a strong space charge increase can be predicted due to focussing of the electrons from inside the hollow cathode, due to the ionisation maximum for electrons of that energy in this region and due to the extremely fast drainage of e1ectrons from tbis region.
Critlclsm and cbaracterizatlon ortbe maln dfscbarge
We a1ready stated tbat there is hardly any attempt in the literature to describe the main discharge.
Tbe ideas of Gundersen and collaborators are probably the approach c10sest to reality, however,
we feel that it is not possible to account for the phenomena in terms of a g10w discharge, nor is it
possible to assume equilibrium concepts Iike Debye screening or to apply the U3/2-law for such a
screening distance neglecting Bohm's criterion.
In fact, those familiar with discharge phenomena - in particular vacuum phenomena - may see an
interesting similarity with the experimental findings shown in figure and observations asthey
are found in vacuum discharges. For comparison we give such a trace of avacuum discharge in
figure 19.
In the anylysis of the vacuum arc the phenomena of T-P emission in connection with the laws of
the sheath and the plasma body in front of the cathode have been carefully analysed, using the
McKeown equation, the Good and Murphy formalism, the continuity equations and the laws of
energy conservation. The result showed that indeed current densities as observed near the hole of
the cathode of the pseudo spark can be supported by simultanous electron and ion current
transport. Fields and energy infIux densities to the cathode surface near the hole as calculated
from an unscreened space charge in the hole result in values which do not contradict such a
mechanism.
Two additional features are worth to be mentioned. Just Iike in a vacuum arc one should expect
that, with the high energy infIux to the cathode surface, material of the cathode surface evaporates
and contributes to the plasma formation. Recent experiments looking for such vapour have given
indications that "Ihere is a slrong componenl 0/ malerial vapour from Ihe calhode" present [8]. Apart
from this, the electron emission density may be far above the T-F-emission value, if one accounts
for the so-called "individual jield emission". This individual field emission is caused by the field
fluctuation due to statistical variations of the ion field on the surface of the cathode. As shown in
the example of figure 20, the emission current densities may be raised by many orders of
magnitude due to this effect. Details can be seen in [9].
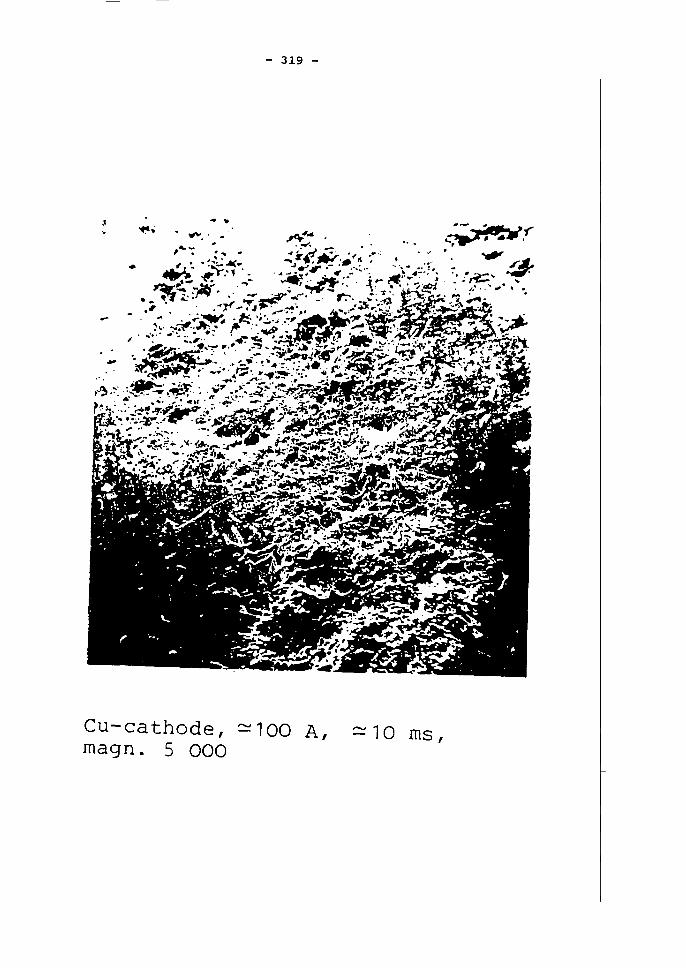
Cu-cath rnagn sOde,
. 000
- 319 -
~100 A, 10 rns I

i
8
7
6
4
- 320 -
4>~4.5V T=QoK
1~~ __ ~ ______ ~ __ --u---~~~
06 08 1 2 3
F ~
Average emission current density j without (N - F) and with (Fn ) individual field effects. The curve-parameter is the "limiting fieldll Fn measured in [107Vjcmj.
Ag. 20
- 321 -
Observations and informations of the arc spot theory seem to suggest that the main discharge is a
hybrid arc discharge of a vacuum arc with a background gas. It seems to be a "spotless arc with
superimposed spots". Under these aspects the approach to describe the main discharge would
require the caIculation of the E-diagram for a hollow cathode in the presence of a residual gas.
[1) L. Yu. Abramovich, B. N. K1yarfeld and Yu. N. Nostich, Sov. Phys.-Tech. Phys., .!1 528
(1966)
[2) P. Billault, H. Riege, M. van GuIik, E. Boggasch, K. Frank und R. Seeböck, Pseudo Spark
Switches; CERN, Proton Synchroton Division, Rep. 87-13 (1987)
[3) W. Hartmann, V. Dominic, G. F. Kirkman and M. A. Gundersen, AppI.Phys.Lett.:ll, 1699
(1988) (Homogen)
[4) W. Hartmann and M. Gundersen, Phys. Rev. Letters & 2371 (1988)
[5) M. J. Kushner, H. Pak and I. V. Di Carlo, Proc. of ICPIG XIX, Belgrad (1989)
[6) K. Mittag, Proc. of IXth International Conference on Gas Discharges and their
Applications, Venedig (1988)
[7] G. Ecker and K. G. Müller, Z. f. Naturf. ~ 246 (1%1)
[8) G. Lins, Siemens, Erlangen; privat communication
[9) G. Ecker and K. G. Müller, Z. f. Naturf . .M. 511 (1959)
- 322 -
Laser-Plasma-Interaction
J. Uhlenbusch and W. Viöl
Institute of Laser and Plasma Physics
Heinrich-Heine-University Düsseldorf, FRG
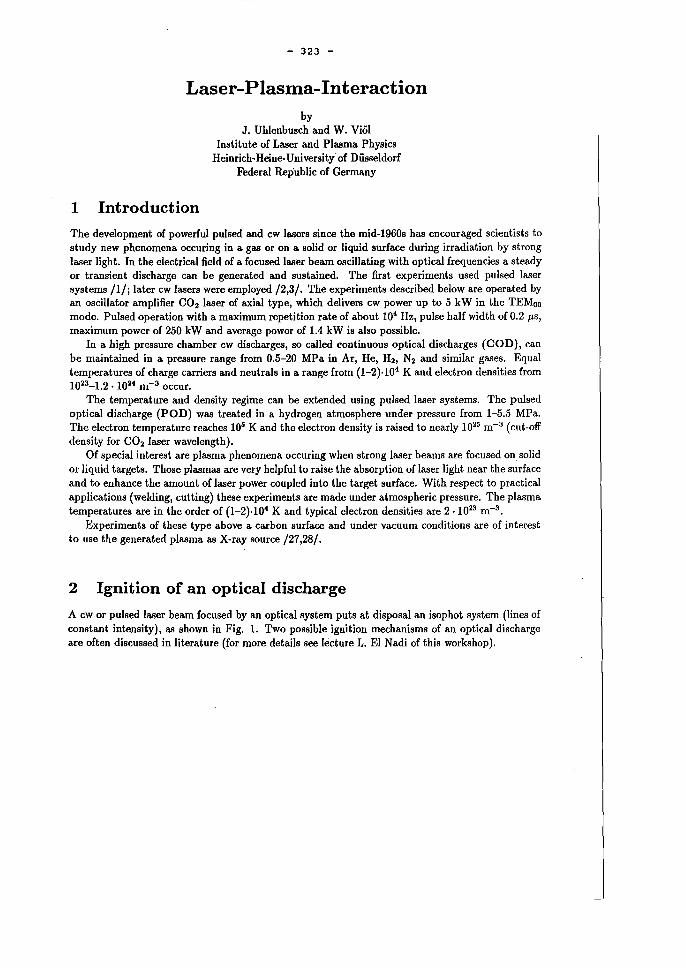
- 323 -
Laser-Plasma-Interaction
1 Introduction
by J. Uhlenbusch and W. Viöl
Institute of Laser and Plasma Physics Heinrich-Heine-University' of Düsseldorf
Federal Republic of Germany
The development of powerful pulsed and cw lasers since the mid-1960s has encouraged scientists to study new phenomena occuring in a gas or on asolid or liquid surface during irradiation by strong laser light. In the electrical field of a focused laser beam oscillating with optical frequencies a steady or transient discharge can be generated and sustained. The first experiments used pulsed laser systems /1/; later cw lasers were employed /2,3/. The experiments described below are operated by an oscillator amplifier CO2 laser ofaxial type, which delivers cw power up to 5 kW in the TEMoo mode. Pulsed operation with a maximum repetition rate of about 104 Hz, pulse half width of 0.2 JlS, maximum power of 250 kW and average power of 1.4 kW is also possible.
In a high pressure chamber cw discharges, so called continuous optical discharges (COD), can be maintained in apressure range from 0.5-20 MPa in Ar, He, H2, N2 and similar gases. Equal temperatures of charge carriers and neutrals in a range from (1-2).104 K and electron densities from 1023-1.2.1024 m-3 occur.
The temperature and density regime can be extended using pulsed laser systems. The pulsed optical discharge (POD) was treated in a hydrogen atmosphere under pressure from 1-5.5 MPa. The electron temperature reaches 105 K and the electron density is raised to nearly 1025 m-3 (cut-off density for CO2 laser wavelength).
Of special interest are plasma phenomena occuring when strong laser beams are focused on solid or liquid targets. Those plasmas are very helpful to raise the absorption of laser light near the surface and to enhance the amount of laser power coupled into the target surface. With respect to practical applications (welding, cutting) these experiments are made under atmospheric pressure. The plasma temperatures are in the order of (1-2).104 K and typical electron densities are 2 .1023 m-3
•
Experiments of these type above a carbon surface and under vacuum conditions are of interest to use the generated plasma as X-ray source /27,28/.
2 Ignition of an optical discharge
A cw or pulsed laser beam focused by an optical system puts at disposal an isophot system (lines of constant intensity), as shown in Fig. 1. Two possible ignition mechanisms of an optical discharge are often discussed in literature (for more details see lecture L. EI Nadi of this workshop).
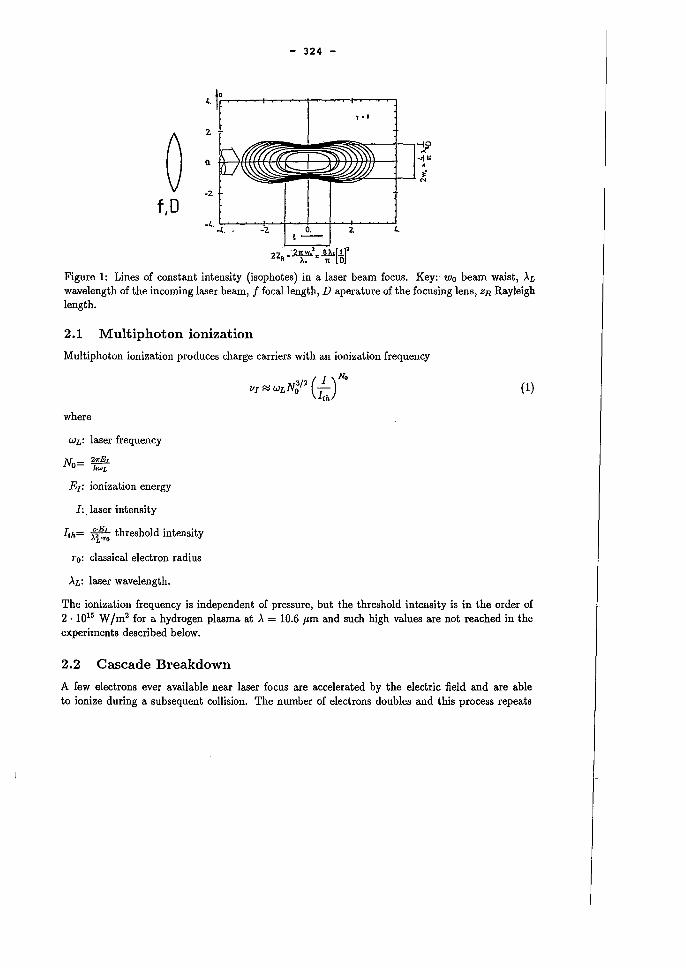
- 324 -
4·1" 1"
~ 2
-10 ..:
0. -oll'
" ~. N
-2
f,D -4. _'- -2 O. 2 4.
\--
. _"21tW.1_.&lu[lr
2Z. - ~. - 1t D
Figure 1: Lines of eonstant intensity (isophotes) in a laser beam foeus. Key: Wo beam waist, AL wavelength of the ineorning laser beam, f foeallength, D aperature of the foeusing lens, ZR Rayleigh length.
2.1 Multiphoton ionization
Multiphoton ionization pro duces charge carriers with an ionization frequency
where
WL: laser frequeney
No= ~ hWL
EI: ionization energy
I:. laser intensity
Ilh= #&- threshold intensity "'L'ro
7'0: classical electron radius
AL: laser wavelength.
(1)
The ionization frequeney is independent of pressure, but the threshold intensity is in the order of 2 . 1015 W 1m2 for a hydrogen plasma at ,\ = 10.6 p.m and such high values are not reaehed in the experiments deseribed below.
2.2 Cascade Breakdown
A few electrons ever available near laser foeus are aceelerated by the eleetric field and are able to ionize during a subsequent eollision. The number of eleetrons doubles and this proeess repeats
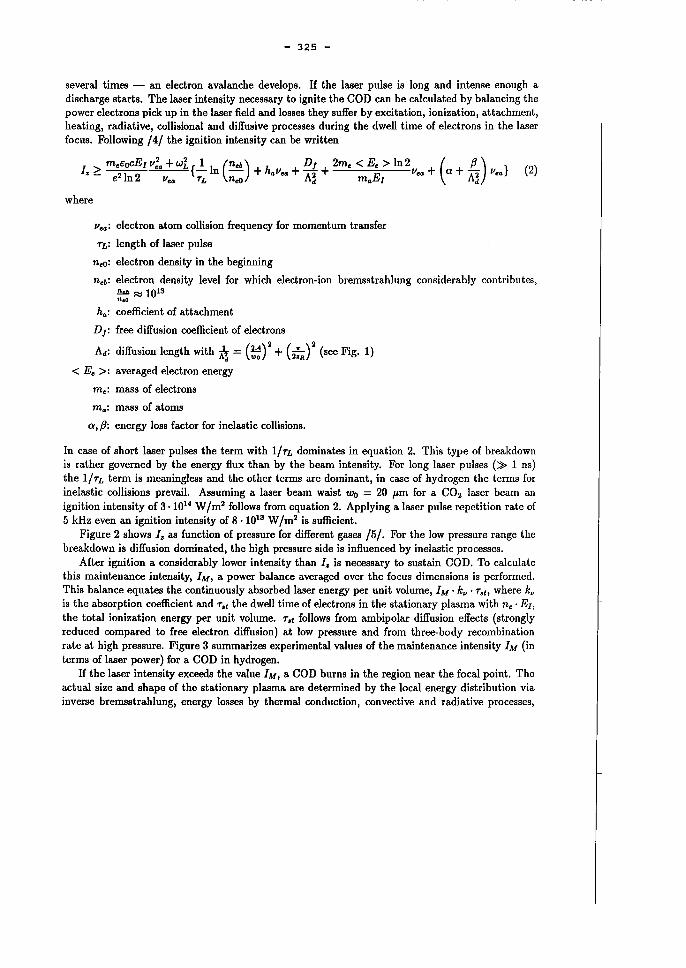
- 325 -
several times - an electron avalanche develops. If the laser pulse is long and intense enough a discharge starts. The laser intensity necessary to ignite the COD can be calculated by balancing the power electrons pick up in the laser field and losses they suffer byexcitation, ionization, attachment, heating, radiative, collisional and diffusive processes during the dweil time of electrons in the laser focus. Following /4/ the ignition intensity can be written
I > mOeocEIII:.+wL{11 (nOb) h D, 2mo <Eo >ln2 ( ß) } • - 21 2 - n - + .110 • + A2 + E 110 • + Cl + A2 110 • e n 110 • TL neO d m. I d
where
110.: electron atom collision frequency for moment um transfer
TL: length of laser pulse
neO: electron density in the beginning
(2)
n.b: electron density level for which electron-ion bremsstrahlung considerably contributes, !!dl Rj 1013 n.o
h.: coefficient of attachment
D,: free diffusion coefficient of electrons
Ad: diffusion length with "k = (::)2 + (2:R)2 (see Fig. I)
< Eo >: averaged electron energy
m.: mass of electrons
m.: mass of atoms
Cl, ß: energy loss factor for inelastic collisions.
In case of short laser pulses the term with I/TL dominates in equation 2. This type of breakdown is rather governed by the energy flux than by the beam intensity. For long laser pulses (~ 1 ns) the I/TL term is meaningless and the other terms are dominant, in case of hydrogen the terms for inelastic collisions prevail. Assuming a laser beam waist Wo = 20 Jlm for a CO2 laser beam an ignition intensity of 3 . 1014 W /m2 follows from equation 2. Applying a laser pulse repetition rate of 5 kHz even an ignition intensity of 8 . 1013 W /m2 is sufficient.
Figure 2 shows I. as function of pressure for different gases /51- For the low press ure range the breakdown is diffusion dominated, the high pressure side is influenced by inelastic processes.
After ignition a considerably lower intensity than I. is necessary to sustain COD. To calculate this maintenance intensity, IM, a power balance averaged over the focus dimensions is performed. This balance equates the continuously absorbed laser energy per unit volume, IM' kv • T.h where kv
is the absorption coefficient and T., the dweil time of electrons in the stationary plasma with n.· Er, the total ionization energy per unit volume. T., follows from ambipolar diffusion effects (strongly reduced compared to free electron diffusion) at low pressure and from three-body recombination rate at high pressure. Figure 3 summarizes experimental values of the maintenance intensity IM (in terms of laser power) for a COD in hydrogen.
If the laser intensity exceeds the value IM, a COD burns in the region near the focal point. The actual size and shape of the stationary plasma are determined by the local energy distribution via inverse bremsstrahlung, energy losses by thermal conduction, convective and radiative processes,
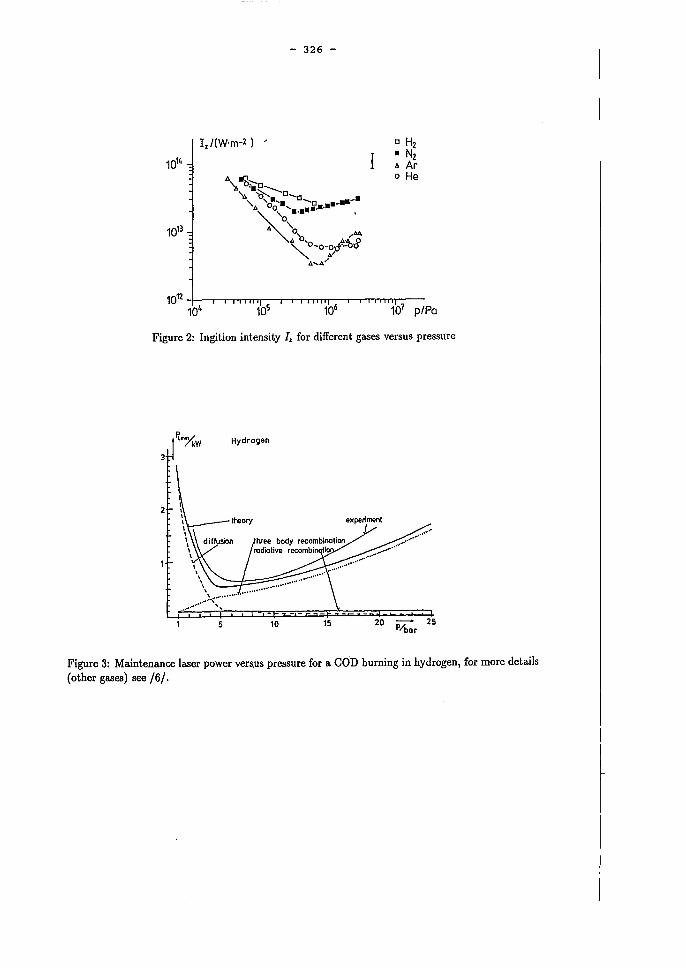
- 326 -
I z /(W-m-2 ) ,
107 piPa
Figure 2: Ingition intensity I. for different gases versus pressure
Hydrogen
, ~ __ - theory
5 10 15 20
Figure 3: Maintenance laser power vers,us pressure for a COD burning in hydrogen, for more details (other gases) see /6/,
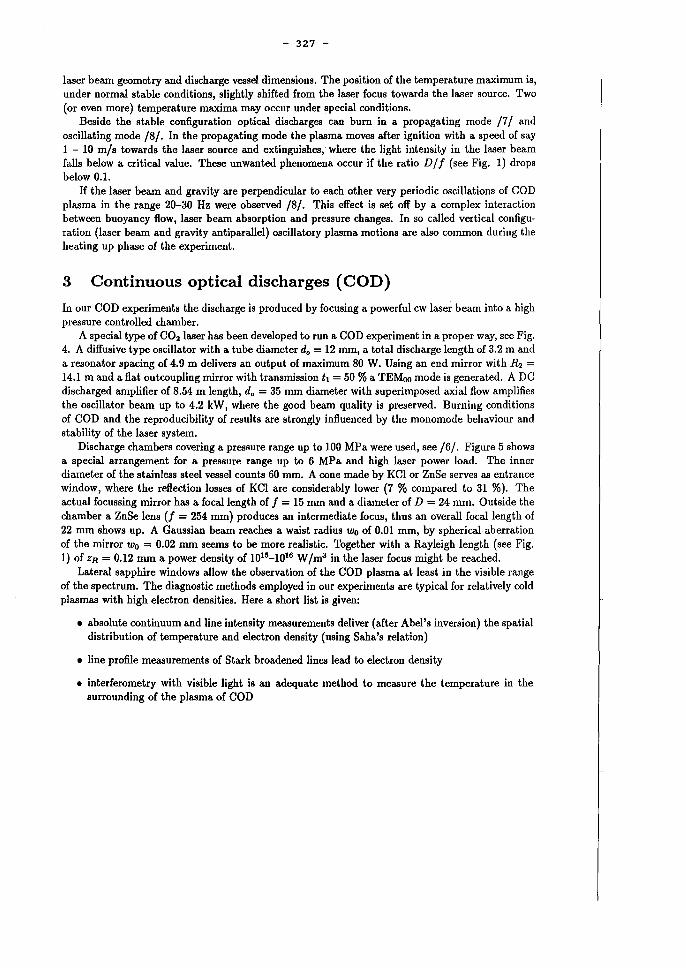
- 327 -
laser beam geometry and discharge vessel dimensions. The position of the temperature maximum is, under normal stable conditions, slightly shifted from the laser focus towards the laser source. Two (or even more) temperature maxima may occur under special conditions.
Beside the stable configuration optical discharges can burn in a propagating mode /7/ and oscillating mode /8/. In the propagating mode the plasma moves after ignition with a speed of say 1 - 10 m/s towards the laser source and extinguishes,' where the light intensity in the laser beam falls below a critical value. These unwanted phenomena occur if the ratio D/f (see Fig. 1) drops below 0.1.
If the laser beam and gravity are perpendicular to each other very periodic oscillations of COD plasma in the range 20-30 Hz were observed /8/. This effect is set off by a complex interaction between buoyancy flow, laser beam absorption and pressure changes. In so called vertical configuration (laser beam and gravity antiparallel) oscillatory plasma motions are also common during the heating up phase of the experiment.
3 Continuous optical discharges (COD)
In our COD experiments the discharge is produced by focusing a powerful cw laser beam into a high pressure controlled chamber.
A special type of C02 laser has been developed to run a COD experiment in a proper way, see Fig. 4. A diffusive type oscillator with a tube diameter do = 12 mm, a total discharge length of 3.2 m and a resonator spacing of 4.9 m deli vers an output of maximum 80 W. Using an end mirror with R2 = 14.1 m and a Hat outcoupling mirror with transmission t1 = 50 % a TEMoo mode is generated. A DC discharged amplifier of 8.54 m length, d. = 35 mm diameter with superimposed axial How amplifies the oscillator beam up to 4.2 kW, where the good beam quality is preserved. Burning conditions of COD and the reproducibility of results are strongly inHuenced by the monomode behaviour and stability of the laser system.
Discharge chambers covering apressure range up to 100 MPa were used, see /6/. Figure 5 shows a special arrangement for apressure range up to 6 MPa and high laser power load. The inner diameter of the stainless steel vessel counts 60 mm. A cone made by KCI or ZnSe serves as entrance window, where the refieCtion losses of KCI are considerably lower (7 % compared to 31 %). The actual focussing mirror has a focallength of f = 15 mm and a diameter of D = 24 mm. Outside the chamber a ZnSe lens (f = 254 mm) pro duces an intermediate focus, thus an overall focallength of 22 mm shows up. A Gaussian beam reaches a waist radius Wo of 0.01 mm, by spherical aberration of the mirror Wo = 0.02 mm seems to be more realistic. Together with a Rayleigh length (see Fig. 1) of ZR = 0.12 mm apower density of 1015_1016 W /m3 in the laser focus might be reached.
Lateral sapphire windows allow the observation of the COD plasma at least in the visible range of the spectrum. The diagnostic methods employed in our experiments are typical for relatively cold plasmas with high electron densities. Here a short list ia given:
• absolute continuum and line intensity measurements deli ver (after Abel's inversion) the spatial distribution of temperature and electron density (using Saha's relation)
• line profile measurements of Stark broadened lines lead to electron density
• interferometry with visible light is an adequate method to measure the temperature in the surrounding of the plasma of COD
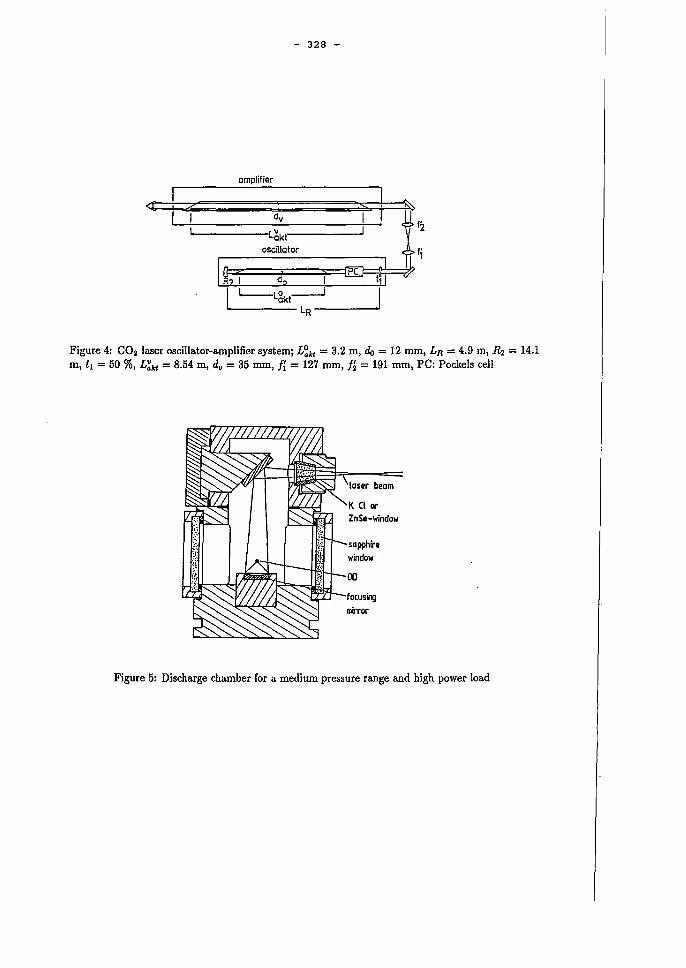
- 328 -
amplifier
'-------L~kt-------'
asciIIator
PC I d I
'---L8kt--i '------LR----~
f' 1
Figure 4: CO2 laser oscillator-amplifier system; L~kl = 3.2 m, da = 12 mm, LR = 4.9 m, R2 = 14.1 m, t1 = 50 %, L~kl = 8.54 m, d. = 35 mm, f~ = 127 mm, f~ = 191 mm, PC: Pockels cell
laser beam
K Cl or Zn Se -window
sapphire
Figure 5: Discharge chamber ror a medium press ure range and high power load
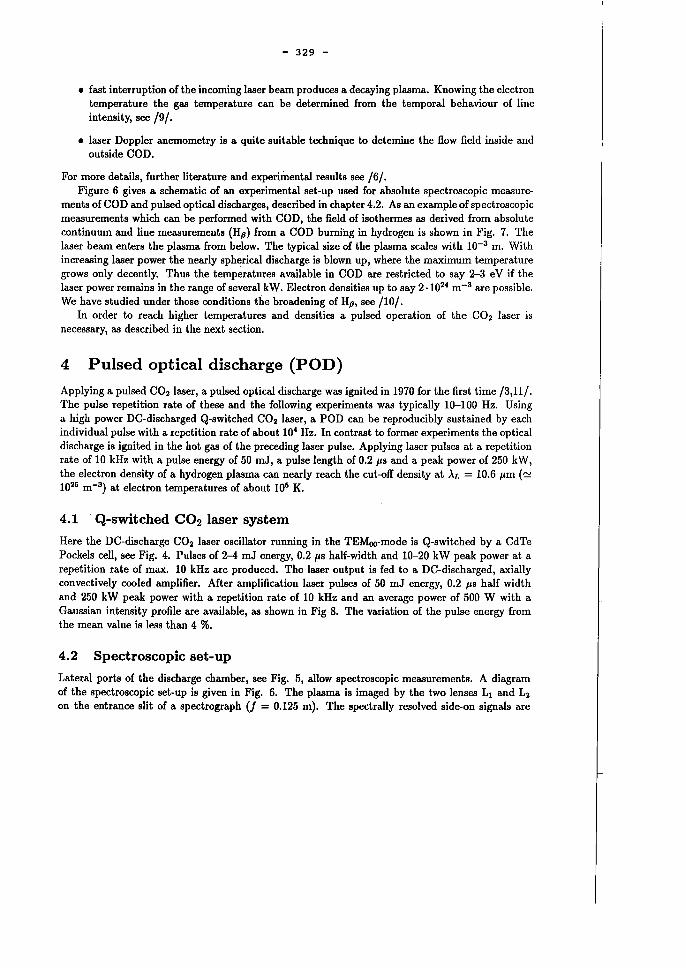
- 329 -
• fast interruption of the incoming laser beam pro duces a decaying plasma. Knowing the electron temperature the gas temperature can be determined from the temporal behaviour of line intensity, see /9/ .
• laser Doppler anemometry is a quite suitable technique to detemine the fiow field inside and outside COD.
For more details, further literature and experiinental results see /6/. Figure 6 gives a schematic of an experimental set-up used for absolute spectroscopic measure
ments of COD and pulsed optical discharges, described in chapter 4.2. As an example of spectroscopic measurements which can be performed with COD, the field of isothermes as derived from absolute continuum and line measurements (Hp) from a COD burning in hydrogen is shown in Fig. 7. The laser beam enters the plasma from below. The typical size of the plasma scales with 10-3 m. With increasing laser power the nearly spherical discharge is blown up, where the maximum temperature grows only decently. Thus the temperatures available in COD are restricted to say 2-3 eV if the laser power remains in the range of several kW. Electron densities up to say 2 .1024 m-3 are possible. We have studied under those conditions the broadening of Hp, see /10/.
In order to read higher temperatures and densities a pulsed operation of the CO2 laser is necessary, as described in the next section.
4 Pulsed optical dis charge (POD)
Applying a pulsed CO2 laser, a pulsed optical discharge was ignited in 1970 for the first time /3,1l/. The pulse repetition rate of these and the following experiments was typically 10-100 Hz. Using a high power DC-discharged Q-switched CO2 laser, a POD can be reproducibly sustained by each individual pulse with a repetition rate of about 104 Hz. In contrast to former experiments the optical dis charge is ignited in the hot gas oe the preceding laser pulse. Applying laser pulses at arepetition rate of 10 kHz with a pulse energy of 50 mJ, a pulse length of 0.2 I's and a peak power of 250 kW, the electron density oe a hydrogen plasma can nearly reach the cut-off density at AL = 10.6 I'm (~ 1025 m-3) at electron temperatures of ab out 106 K.
4.1 Q-switched C02 laser system
Here the DC-discharge CO2 laser oscillator running in the TEMoo-mode is Q-switched by a CdTe Pockels cell, see Fig. 4. Pulses of 2-4 mJ energy, 0.2 1'8 half-width and 10-20 kW peak power at a repetition rate of max. 10 kHz are produced. The laser output is fed to a DC-discharged, axially convectively cooled amplifier. After amplification laser pulses of 50 mJ energy, 0.2 I's half width and 250 kW peak power with a repetition rate of 10 kHz and an average power of 500 W with a Gau8sian intensity profile are available, as shown in Fig 8. The variation of the pulse energy from the mean value is less than 4 %.
4.2 Spectroscopic set-up
Lateral ports of the discharge chamber, see Fig. 5, allow spectroscopic measurements. A diagram of the spectroscopic set-up is given in Fig. 6. The plasma is imaged by the two lenses LI and L2
on the entrance slit of a spectrograph Cf = 0.125 m). The spectrally resolved side-on signals are
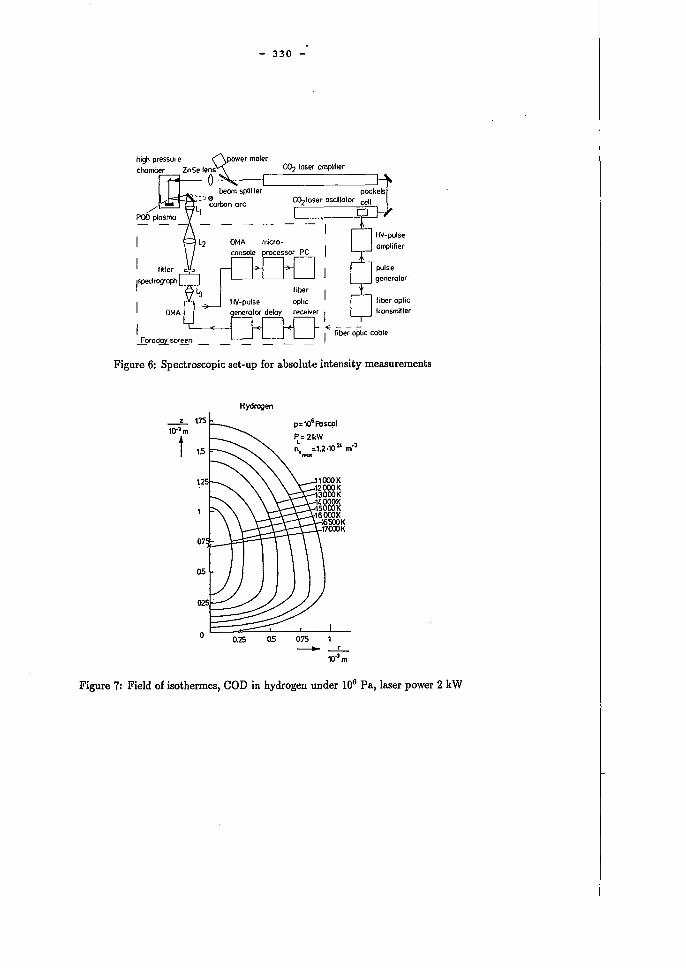
- 330
C02 loser ompl~ier
Figure 6: Spectroscopic set-up for absolute intensity measurements
_'_ \75 Io-'m
t
o
Hydrogen
0.25 os
p = 10' Alscal
P=2kW L 2J, .1
n .... =1.2.10 m
075 _ r
lO-3 m
Figure 7: Field of isothermes, con in hydrogen under 106 Pa, laser power 2 kW
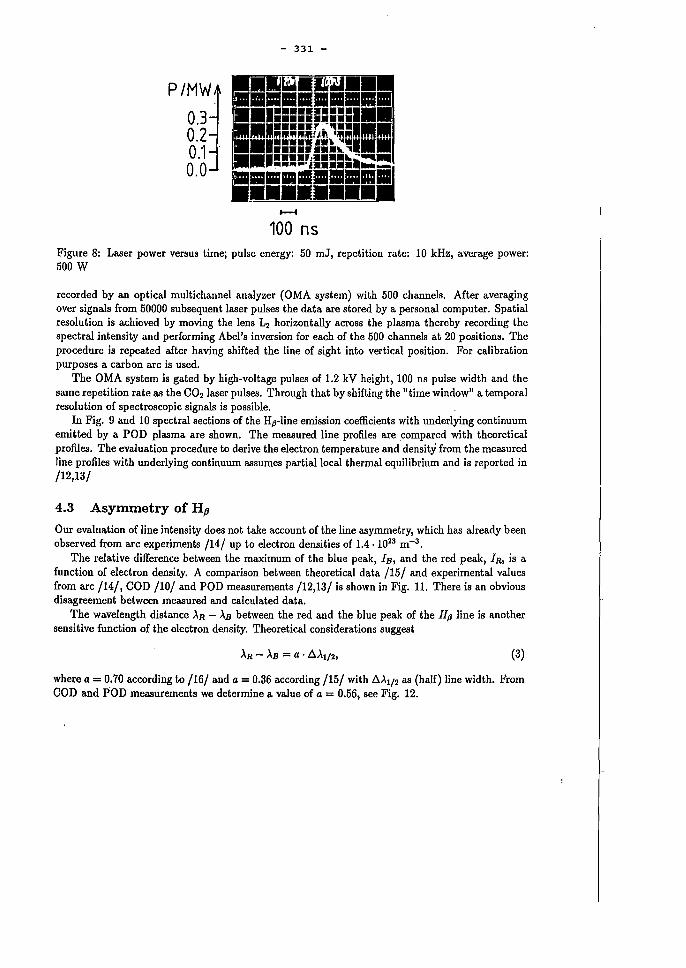
P/MW
0.3 0.2 0.1 0.0
- 331 -
-.. 100 ns
Figure 8: Laser power versus time; pulse energy: 50 mJ, repetition rate: 10 kHz, average power: 500 W
recorded by an optical multichannel analyzer (OMA system) with 500 channels. After averaging over signals from 50000 subsequent laser pulses the data are stored by a personal computer. Spatial resolution is achieved by moving the lens L2 horizontally across the plasma thereby recording the spectral intensity and performing Abel's inversion for each of the 500 channels at 20 positions. The procedure is repeated after having shifted the line of sight into vertical position. For calibration purposes a carbon arc is used.
The OMA system is gated by high-voltage pulses of 1.2 kV height, 100 ns pulse width and the same repetition rate as the C02 1aser pulses. Through that by shifting the "time window" a temporal resolution of spectroscopic signals is possible.
In Fig. 9 and 10 spectral sections of the Hp-li ne emission coefficients with underlying continuum emitted by a POD plasma are shown. The measured line profiles are compared with theoretical proffies. The evaluation procedure to derive the electron temperature and density from the measured line proffies with underlying continuum assurnes partiallocal thermal equilibrium and is reported in /12,13/
4.3 Asymmetry of Hp
Our evaluation of line intensity does not take account of the line asymmetry, which has al ready been observed from arc experiments /14/ up to electron densities of 1.4.1023 m-3 •
The relative difference between the maximum of the blue peak, IB, and the red peak, IR, is a function of electron density. A comparison between theoretical data /15/ and experimental values from arc /14/, COD /10/ and POD measurements /12,13/ is shown in Fig. 11. There is an obvious disagreement between measured and calculated data.
The wavelength distance AR - AB between the red and the blue peak of the Hp line is another sensitive function of the electron density. Theoretical considerations suggest
(3)
where a = 0.70 according to /16/ and a = 0.36 according /15/ with 6,A1/2 as (half) line width. From COD and POD measurements we determine a value of a = 0.56, see Fig. 12.
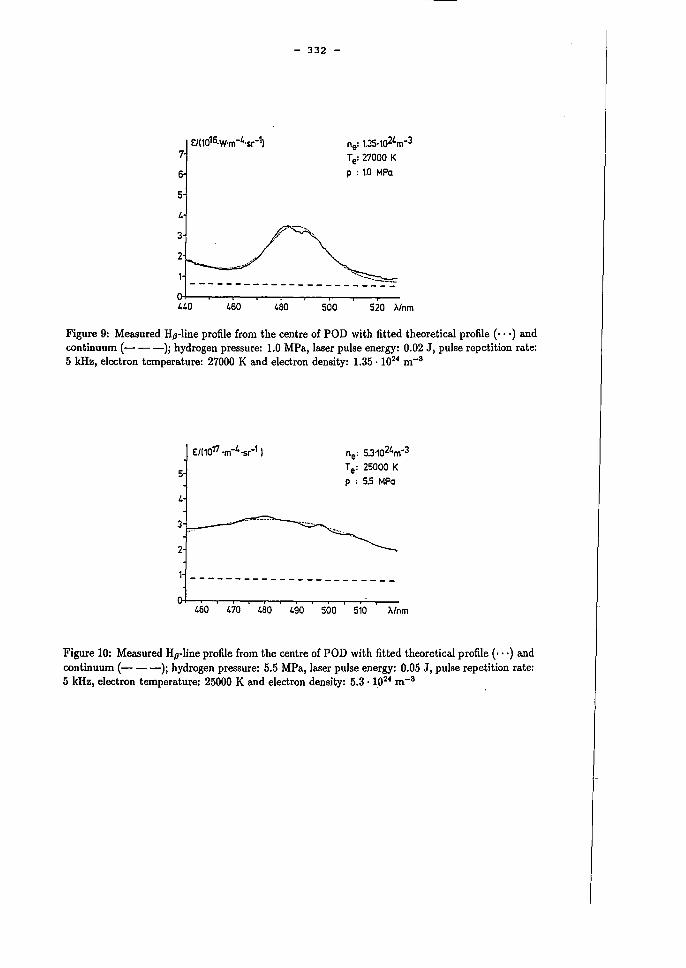
7
6
5
, 3
2
- 332 -
ne: 1.35·102'm-3
Te: 27000 K
p:1.0MPa
......... _-_._------------------------
Figure 9: Measured HiJ-line profile from the centre of POD with fitted theoretical profile ( ... ) and continuum (- - -)j hydrogen pressure: 1.0 MPa, laser pulse energy: 0.02 J, pulse repetition rate: 5 kHz, electron temperature: 27000 K and electron density: 1.35.1024 m-3
5
, 3
2
ne: 5.3·102'm-3
Te: 25000 K
P : 5.5 MPa
--------------------O+-~~~~-r~~~~--r_r_T_-
460 470 480 490 500 510 A/nm
Figure 10: Measured HiJ-Iine profile from the cent re of POD with fitted theoretical profile ( ... ) and continuum (- - -)j hydrogen pressure: 5.5 MPa, laser pulse energy: 0.05 J, pulse repetition rate: 5 kHz, electron temperature: 25000 K and electron density: 5.3.1024 m-3
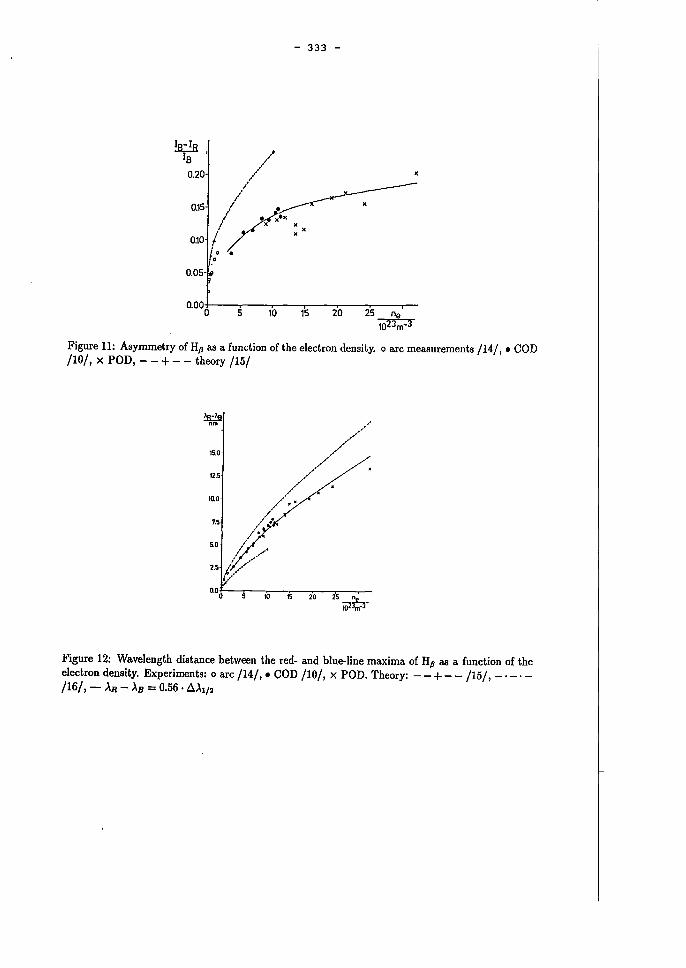
!a:..!B I ' B
0.20
- 333 -
0.001+0--5..---..... 10--1'1"5---:2'=-0---='=25:---n-e..--
1023m-3
Figure 11: Asymmetry of Hp as a function of the eleetron density. 0 are measurements /14/, • COD /10/, X POD, - - + - - theory /15/
~ nm
15.0
12.5
10.0
7.5
5.0
10 15 20 25 ne iö2:r,;;:r
Figure 12: Wavelength distanee between the red- and bIue-line maxima of Hp as a function of the eleetron density. Experiments: 0 are /14/,. COD /10/, x POD. Theory: - - + - - /15/, _. -._ /16/, - AR - AB = 0.56 . !:J.Al/2
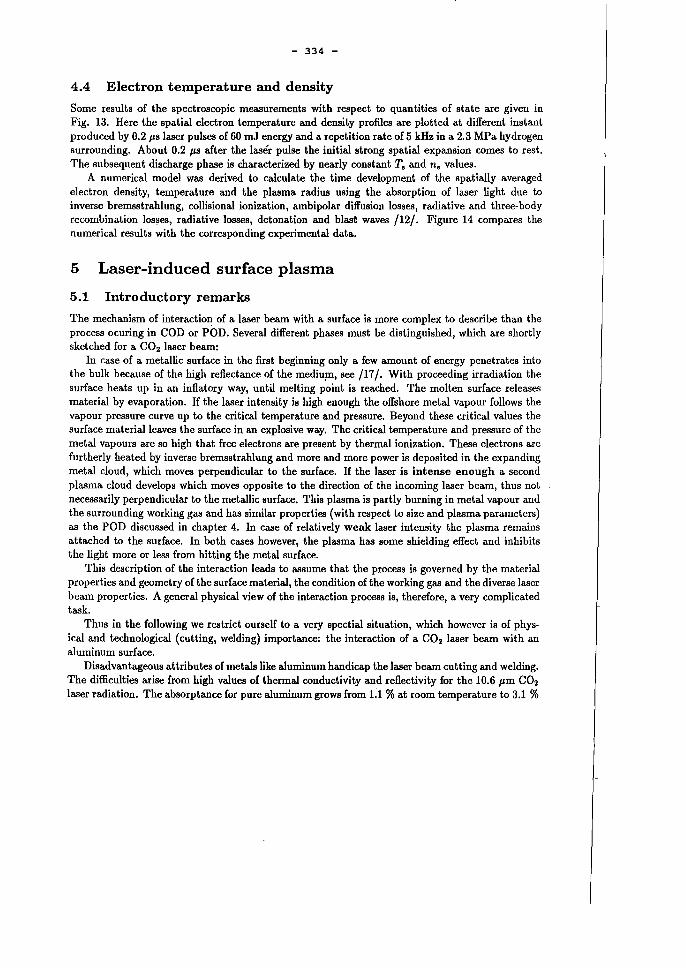
- 334 -
4.4 Electron temperature and density
Some results of the spectroscopic mea.surements with respect to quantities of state are given in Fig. 13. Here the apatial electron temperature and density profiles are plotted at different instant produced by 0.21's laser pulses of 60 mJ energy and a repetition rate of 5 kHz in a 2.3 MPa hydrogen surrounding. About 0.2 I's after the laser pulse the initial strong spatial expansion comes to rest. The subsequent discharge phase is characterized by nearly constant T. and n. values.
A numerical model was derived to calculate the time development of the spatially averaged electron density, temperature and the plasma radius uaing the absorption of laser light due to inverse bremsstrahlung, collisional ionization, ambipolar diffusion losses, radiative and three-body recombination losses, radiative losses, detonation and blast waves /12/. Figure 14 compares the numerical results with the corresponding experimental data.
5 Laser-induced surface plasma
5.1 Introductory remarks
The mechanism of interaction of a laser beam with a surface is more complex to describe than the process ocuring in COD or POD. Several different phases must be distinguished, which are shortly sketched for a CO2 laser beam:
In case of a metallic surface in the first beginning only a few amount of energy penetrates into the bulk because of the high reflectance of the mediu~, see /17/. With proceeding irradiation the surface heats up in an inflatory way, until melting point is reached. The molten surface releases material by evaporation. If the laser intensity ia high enough the offshore metal vapour follows the vapour pressure curve up to the critical temperature and pressure. Beyond these critical values the surface materialleaves the surface in an explosive way. The critical temperature and pressure of the metal vapours are so high that free electrons are present by thermal ionization. These electrons are furtherly heated by inverse bremsstrahlung and more and more power is deposited in the expanding metal cloud, which moves perpendicular to the surface. If the laser is intense enough a second plasma cloud develops which moves opposite to the direction of the incorning laser beam, thus not necessarily perpendicular to the metallic surface. This plasma is partly burning in metal vapour and the surrounding working gas and has similar properties (with respect to size and plasma parameters) as the POD discussed in chapter 4. In case of relatively weak laser intensity the plasma remains attached to the surface. In both cases however, the plasma has some shielding effect and inhibits the light more or less from hitting the metal surface.
This description of the interaction leads to assurne that the process is governed by the material properties and geometry of the surface material, the condition of the working gas and the diverse laser beam properties. A general physical view of the interaction process is, therefore, a very complicated task.
Thus in the following we restrict ourself to a very spectial situation, which however is of physical and technological (cutting, welding) importance: the interaction of a CO2 laser beam with an alurninum surface.
Disadvantageous attributes of metals like alurninum handicap the laser beam cutting and welding. The difficulties arise from high values of thermal conductivity and reflectivity for the 10.6 I'm CO2
laser radiation. The absorptance for pure alurninum grows from LI % at room temperature to 3.1 %
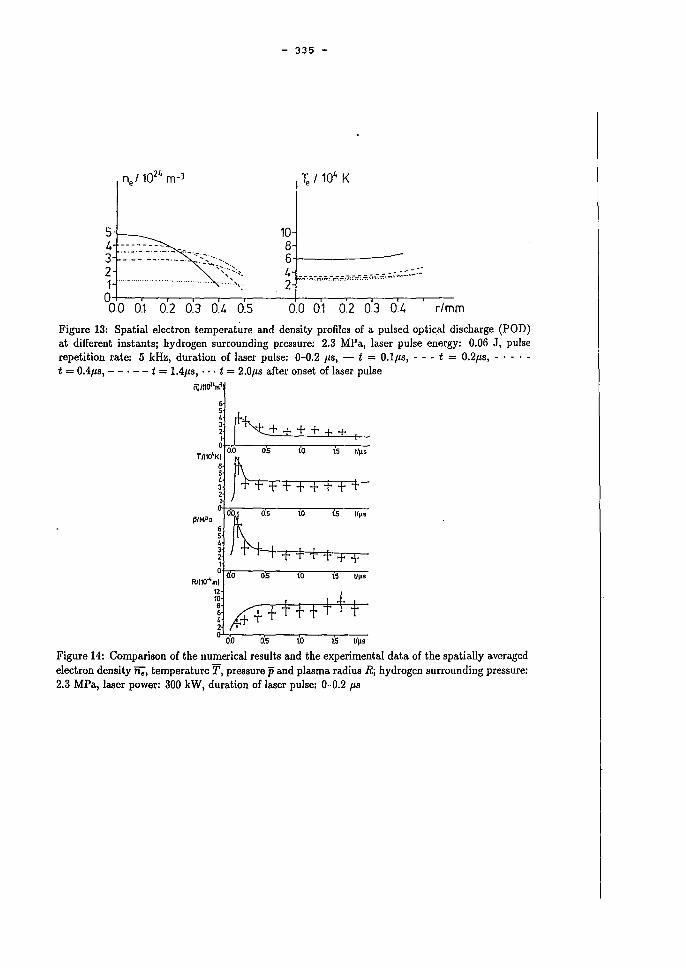
- 335 -
n 11024 m-3 e
5 10 4 -------- 8 ----_. __ .... 3 --- ------ -.;-.'--:.::~,.,. 6+------2 '-:..,-,~:>. 4 -.-.~c,;,~.-~~,:.",-i:."' ~~~.;.;, :.:.:.:.-1 .............. '\ 2 O+-~--,,--.--r--~-----r--.--r--.-~--,,---00 0.1 0.2 0.3 0.4 0.5 0.0 0.1 0.2 03 0.4 r/mm
Figure 13: Spatial electron temperature and density profiles of a pulsed optical discharge (POD) at different instantsj hydrogen surrounding pressure: 2.3 MPa, laser pulse energy: 0.06 J, pulse repetition rate: 5 kHz, duration of laser pulse: 0-0,2 JlS, - t = 0.1J1s, - - - t = 0.2J1s, - . - , -t = OAJls, - - . - - t = 1.4J1s, ... t = 2.0Jls after onset of laser pulse
n;iI1o"ni'
6 5 4 J 2 + 1 o,~~--~--~~--~~~
T/I10'KI 0.0 0.5 t5 I/~s
I ~++f++t++ 10 t5 tI~s 00~0'5 p/MPa
6 5 4
~ 1++++++ 1 01+O~ß~--0~.5~--~tO~--'1~5~1~/~-S
R/110-'ml
12 + 11 #+ + + f f + + o 0.0 0.5 1.0 15 lI~s
Figure 14: Comparison of the numerical results and the experimental data of the spatially averaged electron density n., temperature T, pressure p and plasma radius Rj hydrogen surrounding press ure: 2.3 MPa, laser power: 300 kW, duration of laser pulse: 0-0.2 Jls
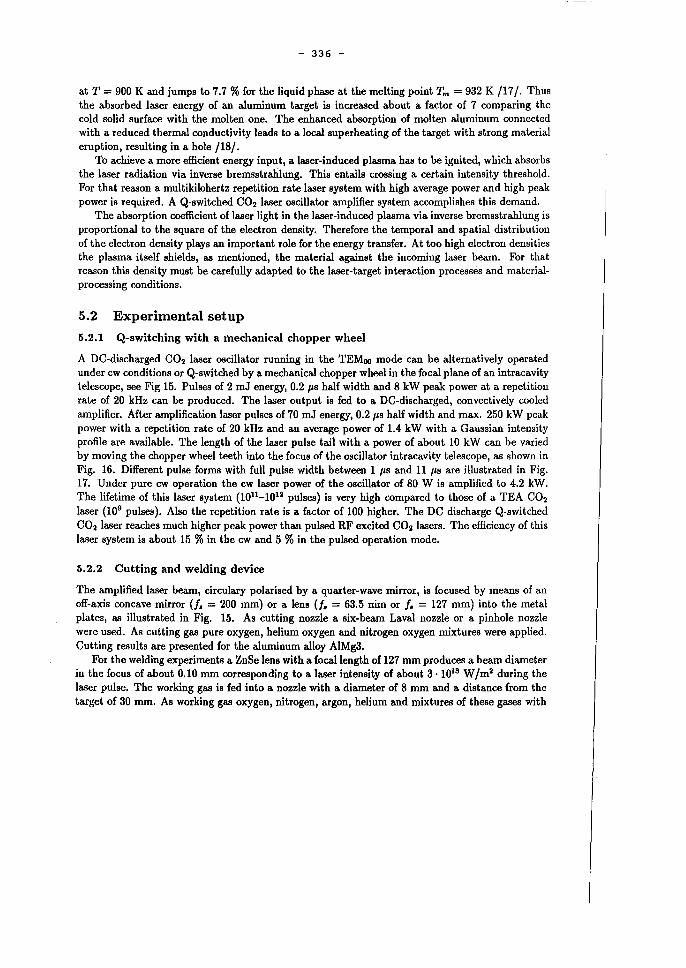
- 336 -
at T = 900 K and jumps to 7.7 % for the liquid phase at the melting point Tm = 932 K /17/. Thus the absorbed laser energy of an aluminum target is increased about a factor of 7 comparing the cold solid surface with the molten one. The enhanced absorption of molten aluminum connected with a reduced thermal conductivity leads to a local superheating of the target with strong material eruption, resulting in a hole /18/.
To achieve a more efficient energy input, a laser-induced plasma has to be ignited, which absorbs the laser radiation via inverse bremsstrahlung. This entails crossing a certain intensity threshold. For that reason a multikilohertz repetition rate laser system with high average power and high peak power is required. A Q-switched CO2 laser oscillator amplifter system accomplishes this demand.
The absorption coefficient of laser light in the laser-induced plasma via inverse bremsstrahlung is proportional to the square of the electron density. Therefore the temporal and spatial distribution of the electron density plays an important role for the energy transfer. At too high electron densities the plasma itself shields, as mentioned, the material against the incoming laser beam. For that reason this density must be carefully adapted to the laser-target interaction processes and materialprocessing conditions.
5.2 Experimental setup
5.2.1 Q-switching with a mechanical chopper wheel
A DC-discharged CO2 laser oscillator running in the TEMoo mode can be alternatively operated under cw conditions or Q-switched by a mechanical chopper wheel in the focal plane of an intracavity telescope, see Fig 15. Pulses of 2 mJ energy, 0.2 /JS half width and 8 kW peak power at arepetition rate of 20 kHz can be produced. The laser output is fed to a DC-discharged, convectively cooled amplifier. After amplification laser pulses of 70 mJ energy, 0.2 /JS half width and max. 250 kW peak power with a repetition rate of 20 kHz and an average power of 1.4 kW with a Gaussian intensity profile are available. The length of the laser pulse tail with apower of about 10 kW can be varied by moving the chopper wheel teeth into the focus of the oscillator intracavity telescope, as shown in Fig. 16. Different pulse forms with fuH pulse width between 1 /JS and 11 /Js are illustrated in Fig. 17. Under pure cw operation the cw laser power of the oscillator of 80 W is amplified to 4.2 kW. The lifetime of this laser system (1011_1012 pulses) is very high compared to those of a TEA CO2
laser (109 pulses). Also the repetition rate is a factor of 100 higher. The DC discharge Q-switehed CO2 laser reaches mueh higher peak power than pulsed RF excited CO2 lasers. The efficieney of this laser system is about 15 % in the cw and 5 % in the pulsed operation mode.
5.2.2 Cutting and welding device
The amplified laser beam, circulary polarised by a quarter-wave mirror, is foeused by means of an off-axis coneave mirror (f. = 200 mm) or a lens (f. = 63.5 nim or f. = 127 mm) into the metal plates, as iIIustrated in Fig. 15. As eutting nozzle a six-beam Laval nozzle or a pinhole nozzle were used. As cutting gas pure oxygen, helium oxygen and nitrogen oxygen mixtures were applied. Cutting results are presented for the aluminum alloy AIMg3.
For the welding experiments a ZnSe lens with a focallength of 127 mm pro duces a beam diameter in the focus of ab out 0.10 mm corresponding to a laser intensity of about 3 . 1013 W /m2 during the laser pulse. The working gas is fed into a nozzle with a diameter·of 8 mm and a distance from the target of 30 mm. As working gas oxygen, nitrogen, argon, helium and mixtures of these gases with
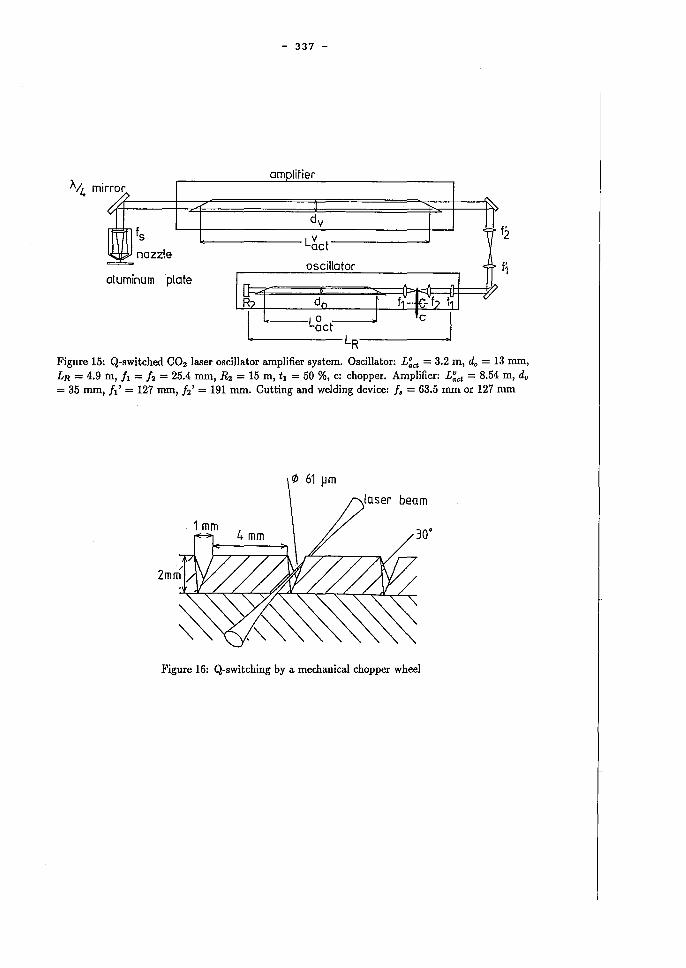
- 337 -
IT ampli ler rror:>
v d y
~ D fs Lbct
nozzle fi ===- oscillator <
aluminum plate
I~? I "' dn I f1-·k= f? 11'1 I 0 I 'e I Lact I
1,,--. ---LR---..I,
Figure 15: Q-switched CO2 laser oscillator amplifier system. Oscillator: L:ct = 3.2 rn, do = 13 mm, LR = 4.9 in, h = 12 = 25.4 mrn, R2 = 15 m, tl = 50 %, c: chopper. Arnplifier: L~ct = 8.54 m, du = 35 mm, h' = 127 mm, 12' = 191 mm. Cutting and welding device: f. = 63.5 mm or 127 mm
Figure 16: Q-switching by a mechanical chopper wheel
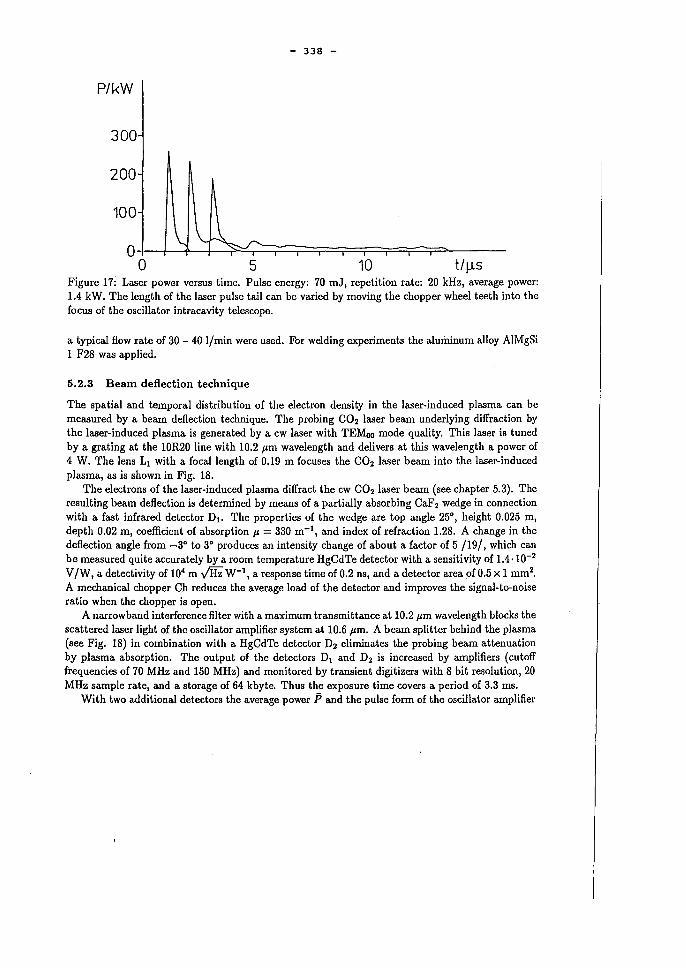
- 338 -
P/kW
300
200
100
O+-~+-~~~~~~~~~~~---o 5 10 t/lJ.S
Figure 17: Laser power versus time. Pulse energy: 70 mJ, repetition rate: 20 kHz, average power: 1.4 kW. The length of the laser pulse tail can be varied by moving the chopper wheel teeth into the focus of the oscillator intracavity telescope.
a typical flow rate of 30 - 40 l/min were used. For welding experiments the aluminum alloy AIMgSi 1 F28 was applied.
5.2.3 Beam deflection technique
The spatial and temporal distribution of the electron density in the laser-induced plasma can be measured by a beam deflection technique. The probing CO2 laser beam underlying diffraction by the laser-induced plasma is generated by a cw laser with TEMoo mode quality. This laser is tuned by a grating at the 1OR20 line with 10.2 jtm wavelength and deli vers at this wavelength apower of 4 W. The lens LI with a focallength of 0.19 m focuses the CO2 laser beam into the laser-induced plasma, as is shown in Fig. 18.
The electrons of the laser-induced plasma diffract the cw CO2 laser beam (see chapter 5.3). The resulting beam deflection is determined by means of a partially absorbing CaF2 wedge in connection with a fast infrared detector DI. The properties of the wedge are top angle 25°, height 0.025 m, depth 0.02 m, coefficient of absorption jt = 330 rn-I, and index of refraction 1.28. A change in the deflection angle from _3° to 3° produces an intensity change of about a factor of 5 /19/, which can be measured quite accurately by a room temperature HgCdTe detector with a sensitivity of 1.4.10-2
V /W, a detectivity of 104 m v'HZ W-l, a response time of 0.2 ns, and a detector area of 0.5 xI mm2•
A mechanical chopper Ch reduces the average load of the detector and improves the signal-to-noise ratio when the chopper is open.
A narrowband interference filter with a maximum transmittance at 10.2 jtm wavelength blocks the scattered laser light of the oscillator amplifier system at 10.6 jtm. A beam splitter behind the plasma (see Fig. 18) in combination with a HgCdTe detector D2 eliminates the probing beam attenuation by plasma absorption. The output of the detectors DI and D2 is increased by amplifiers (cutoff frequencies of 70 MHz and 150 MHz) and monitored by transient digitizers with 8 bit resolution, 20 MHz sampIe rate, and a storage of 64 kbyte. Thus the exposure time covers aperiod of 3.3 ms.
With two additional detectors the average power P and the pulse form of the oscillator amplifier
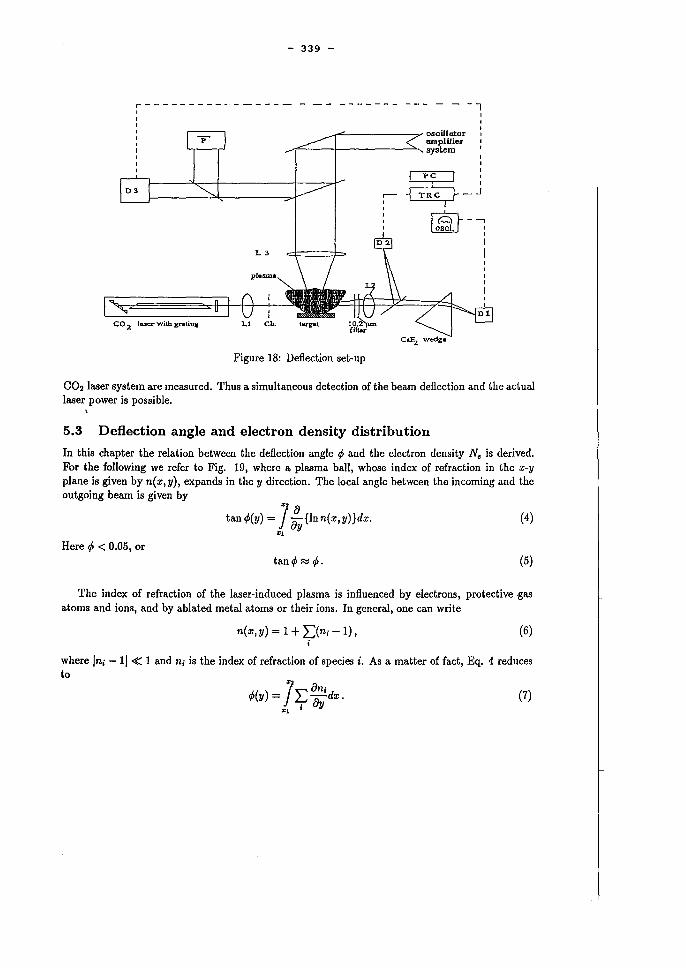
- 339 -
r - - - - - - - - - -- - - - - - - - - - - - - - - - - ------l
CO 2 lucr wilh. grati0i:
L3
.......,""------:7' c>scillator amplifier
..-'1""----11------->...... syslem I I
~: ~_J
CID--. osci. I I
J
I
Figure 18: Deflection set-up
CO2 laser system are measured. Thus a simultaneous detection of the beam deflection and the actual laser power is possible.
5.3 DeHection angle and electron density distribution
In this chapter the relation between the deflection angle I/> and the electron density N. is derived. For the following we refer to Fig. 19, where a plasma ball, whose index of refraction in the x-y plane is given by n(x, y), expands in the y direction. The local angle between the incoming and the outgoing beam is given by
'" a tanl/>(y) = J F{lnn(x,y)}dx.
"1 y (4)
Here I/> < 0.05, or tan I/> I':;j 1/>. (5)
The index of refraction of the laser-induced plasma is influenced by electrons, protective.gas atoms and ions, and by ablated metal atoms or their ions. In general, one can write
n(x,y) = 1 + I)nj -1), (6) j
where Ini - 11 ~ 1 and ni is the index of refraction of species i. As a matter of fact, Eq. 4 reduces to
J". an-I/>(Y) = ~ ay' dx.
"'1 •
(7)
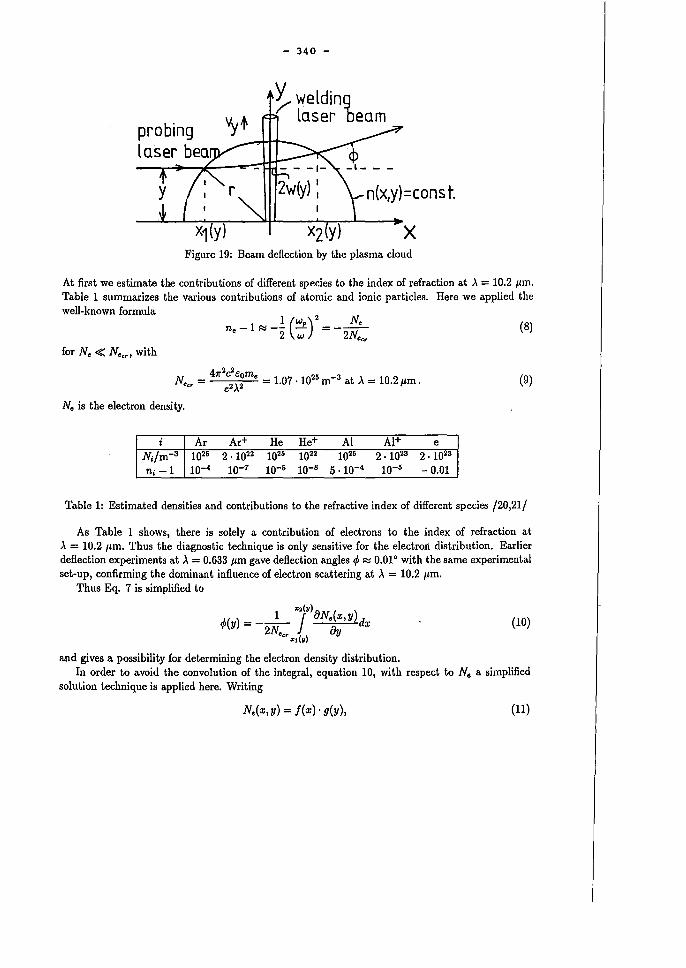
- 340 -
Y welding /' laser be am
n(x,y)=cons t.
x Figure 19: Beam deflection by the plasma cloud
At first we estimate the contributions of different species to the index of refraction at ). = 10.2 pm. Table 1 summarizes the various contributions of atomic and ionic particles. Here we applied the well-known formula
ne
_ 1 ~ _~ (Wp ) 2 = _~ 2 W 2Neer
(8)
for Ne ~ Neer> with
411"2C2cOme 25 -3 Neer = e2 ).2 = 1.07 . 10 m at). = 10.2 pm. (9)
Ne is the electron density.
i Ar Ar+ He He+ Al AI+ e N;jm-a 1025 2. 1022 1025 1022 1025 2.1023 2.1023
nj -1 10-4 10-7 10-5 10-8 5.10-4 10-5 - 0.01
Table 1: Estimated densities and contributions to the refractive index of different species /20,21/
As Table 1 shows, there is solely a contribution of electrons to the index of refraction at ). = 10.2 pm. Thus the diagnostic technique is only sensitive for the electron distribution. Earlier deflection experiments at ). = 0.633 pm gave deflection angles t/J ~ 0.010 with the same experimental set-up, confirming the dominant influence of electron scattering at ). = 10.2 pm.
Thus Eq. 7 is simplified to
",(y) t/J(y) = __ 1_ J (}Ne(x, y) dx
2Neer 8y ".(y)
(10)
and gives a possibility for determining the electron density distribution. In order to avoid the convolution of the integral, equation 10, with respect to Ne a simplified
solution technique is applied here. Writing
Ne(x, y) = I(x)· g(y), (11)
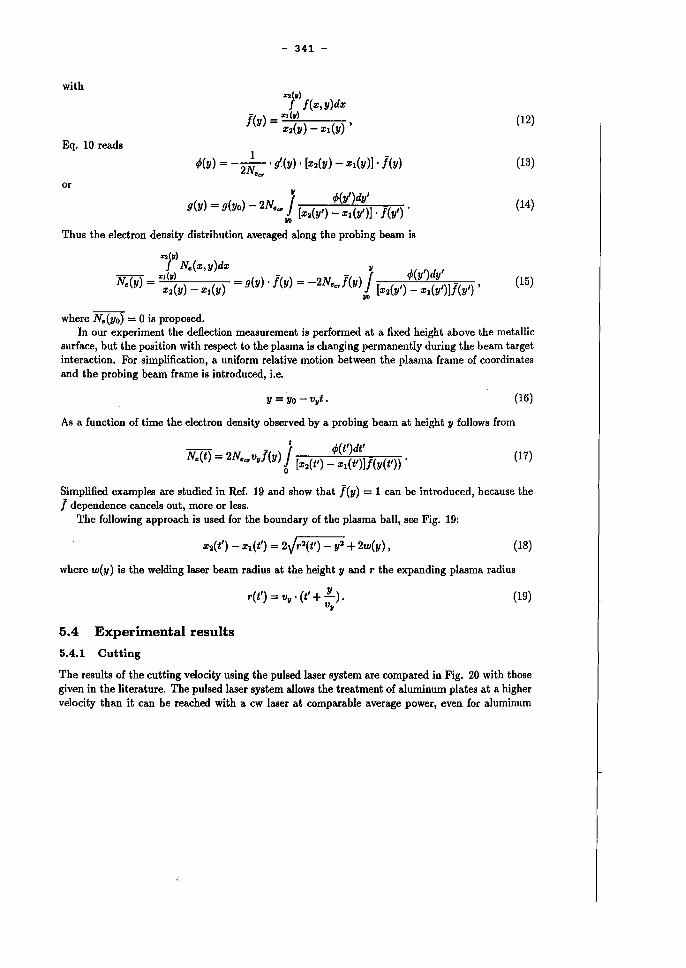
- 341 -
with
(12)
Eq. 10 reads
tP(y) = - 2~ . g'(y). [X2(Y) - Xl(Y»)' /(y) 'er
(13)
or
/
v tP(y')dy' g(y) = g(yo) - 2N.cr [X2(Y') - Xl(y'»)' f(y') .
VII
(14)
Thus the electron density distribution averaged a.long the probing bea.m is
... (v) J N.(x,y)dx v, ,
-- ",(v) - - / tP(y)dy N.(y) = X2(y) _ Xl(y) = g(y) . f(y) = -2N.c.f(y) [X2(Y') - Xl(y'»)J(y') ,
VII
(15)
where N.(yo) = 0 is proposed. In our experiment the deflection measurement is performed at a fixed height above the metallic
surfa.ce, but the position with respect to the plasma is changing permanently during the beam target intera.ction. For simplifica.tion, a uniform relative motion between the plasma frame of coordinates and the probing bea.m frame is introduced, i.e.
(16)
As a function of time the electron density observed by a probing beam at height y follows from
- - /' tP(t')dt' N.(t) = 2N'cr vvf(y) [X2(t') _ Xl(t'»)J(y(t'» .
o (17)
Simplified examples are studied in Ref. 19 and show that /(y) = 1 can be introduced, because the J dependence ca.ncels out, more or less.
The following approa.ch is used for the boundary of the plasma ball, see Fig. 19:
(18)
where w(y) is the welding laser bea.m radius at the height y and r the expanding plasma radius
5.4 Experimental results
5.4.1 Cutting
r(t') = vv' (t' + JL). Vv
(19)
The results of the cutting velocity using the pulsed laser system are compared in Fig. 20 with those given in the literat ure. The pulsed laser system a.llows the treatment of aluminum plates at a higher velocity than it can be rea.ched with a cw laser at comparable average power, even for aluminum
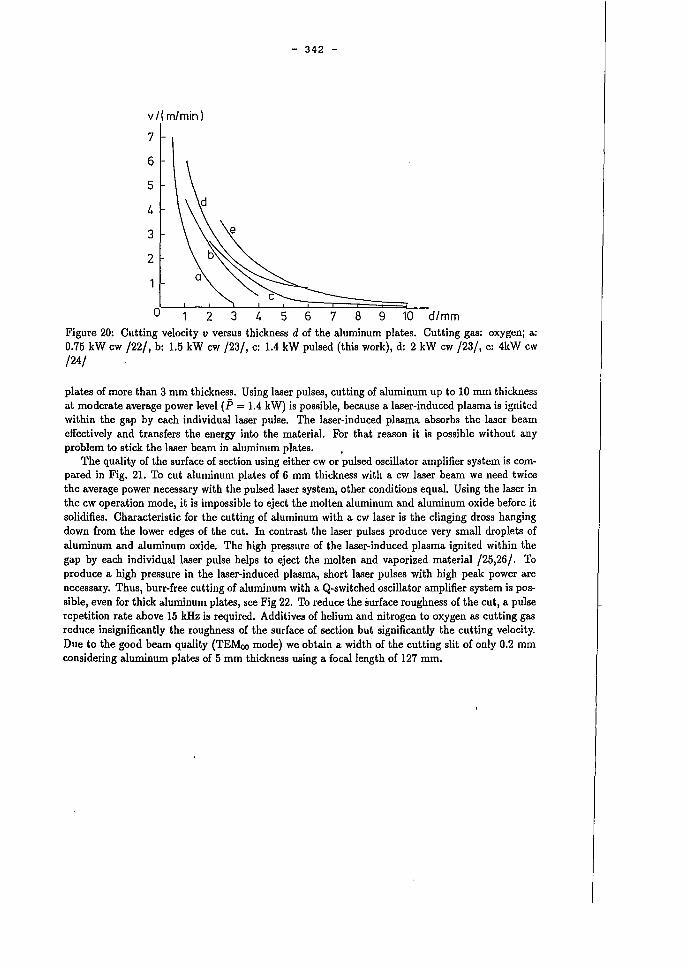
v/(m/min)
7
6
5
{.
3 -
2 -
o 2
- 342 -
3 5 6 7 8 9 10 d/mm Figure 20: Cutting velocity v versus thickness d of the aluminum plates. Cutting gas: oxygenj a: 0.75 kW cw /22/, b: 1.5 kW cw /23/, c: 1.4 kW pulsed (this work), d: 2 kW cw /23/, e: 4kW cw /24/
plates of more than 3 mm thickness. Using laser pulses, cutting of aluminum up to 10 mm thickness at moderate average power level (P = 1.4 kW) is possible, because a laser-induced plasma is ignited within the gap by each individual laser pulse. The laser-induced plasma absorbs the laser beam effectively and transfers the energy into the material. F6r that reason it is possible without any problem to stick the laser beam in aluminum plates. .
The quality of the surface of section using either cw or pulsed oscillator amplifier system is compared in Fig. 21. To cut aluminum plates of 6 mm thickness with a cw laser beam we need twice the average power necessary with the pulsed laser system, other conditions equal. Using the laser in the cw operation mode, it is impossible to eject the molten aluminum and aluminum oxide before it solidifies. Characteristic for the cutting of aluminum with a cw laser is the clinging dross hanging down from the lower edges of the cut. In contrast the laser pulses produce very small drop lets of aluminum and aluminum oxide. The high pressure of the laser-induced plasma ignited within the gap by each individual laser pulse helps to eject the molten and vaporized material /25,26/. To produce a high pressure in the laser-induced plasma, short laser pulses with high peak power are necessary. Thus, burr-free cutting of aluminum with a Q-switched oscillator amplifier system is possible, even for thick aluminum plates, see Fig 22. To reduce the aurface roughness of the cut, a pulse repetition rate above 15 kHz is required. Additives of helium and nitrogen to oxygen as cutting gas reduce insignificantly the roughness of the surface of section but significantly the cutting velocity. Due to the good beam quality (TEMoo mode) we obtain a width of the cutting slit of only 0.2 mm considering aluminum plates of 5 mm thickness using a focallength of 127 mm.
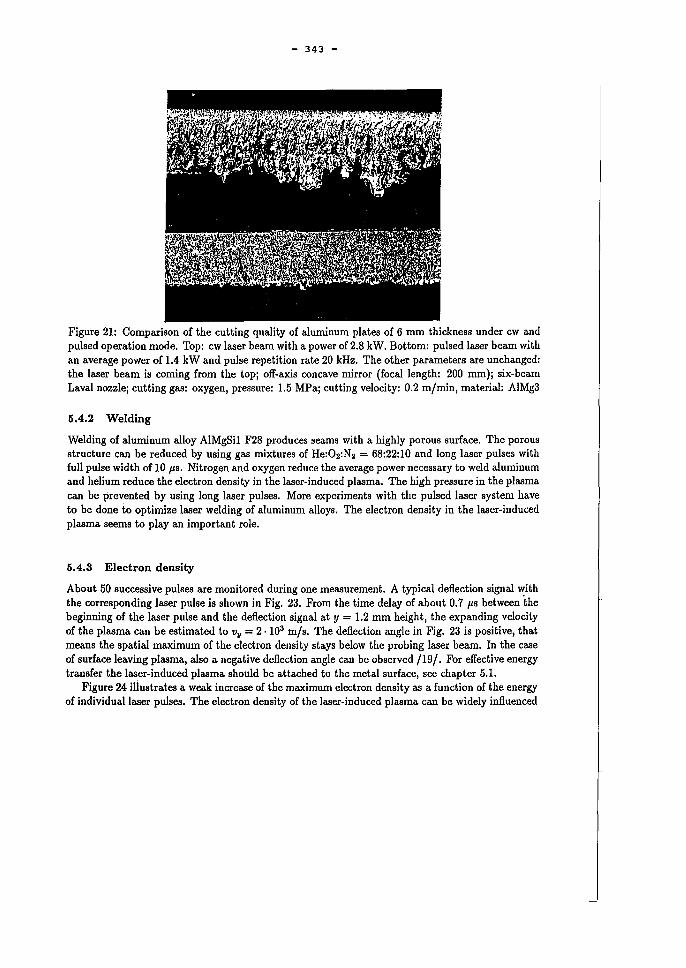
- 343 -
Figure 21: Comparison of the cutting quality of aluminum plates of 6 mm thickness under cw and pulsed operation mode. Top: cw laser beam with apower of 2.8 kW. Bottom: pulsed laser beam with an average power of 1.4 kW and pulse repetition rate 20 kHz. The other parameters are unchanged: the laser beam is coming from the tOpj off-axis concave mirror (focal length: 200 mm)j six-beam Laval nozzlej cutting gas: oxygen, pressure: 1.5 MPaj cutting velocity: 0.2 m/min, material: AIMg3
5.4.2 Welding
Welding of aluminum alloy AIMgSil F28 produces seams with a highly porous surface. The porous structure can be reduced by using gas mixtures of He:02:N2 = 68:22:10 and long laser pulses with full pulse width of 10 I's. Nitrogen and oxygen reduce the average power necessary to weid aluminum and helium reduce the electron density in the laser-induced plasma. The high pressure in the plasma can be prevented by using long laser pulses. More experiments with the pulsed laser system have to be done to optimize laser welding of aluminum alloys. The electron density in the laser-induced plasma seems to play an important role.
5.4.3 Electron density
About 50 successive pulses are monitored during one measurement. A typical deflection signal with the corresponding laser pulse is shown in Fig. 23. From the time delay of about 0.7 I's between the beginning of the laser pulse and the deflection signal at y = 1.2 mm height, the expanding velo city of the plasma can be estimated to v~ = 2· 103 m/s. The deflection angle in Fig. 23 is positive, that means the spatial maximum of the electron density stays below the probing laser beam. In the case of surface leaving plasma, also a negative deflection angle can be observed /19/. For effective energy transfer the laser-induced plasma should be attached to the metal surface, see chapter 5.1.
Figure 24 illustrates a weak increase of the maximum electron density as a function of the energy of individual laser pulses. The electron density of the laser-induced plasma can be widely influenced
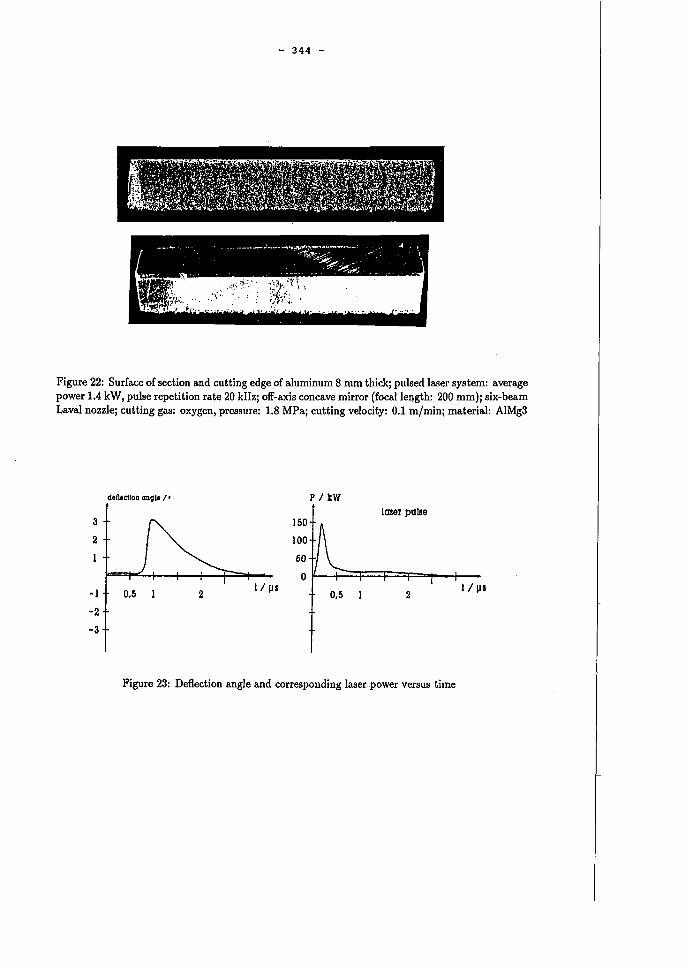
- 344 -
Figure 22: Surface of section and cutting edge of aluminum 8 mm thickj pulsed laser system: average power 1.4 kW, pulse repetition rate 20 kHzj off-axis concave mirror (foca.!length: 200 mm)j six-beam Lava.! nozzlej cutting gas: oxygen, pressure: 1.8 MPaj cutting velocity: 0.1 m/minj material: AlMg3
don.ctloD cmgll/' P / kW ICDer poise
3 150
2 IOD
I 60
0
-1 0.5 2 1/ IlS
0.5 2 1/ 118
-2
-3
Figure 23: Deflection angle a.nd corresponding laser power versus time
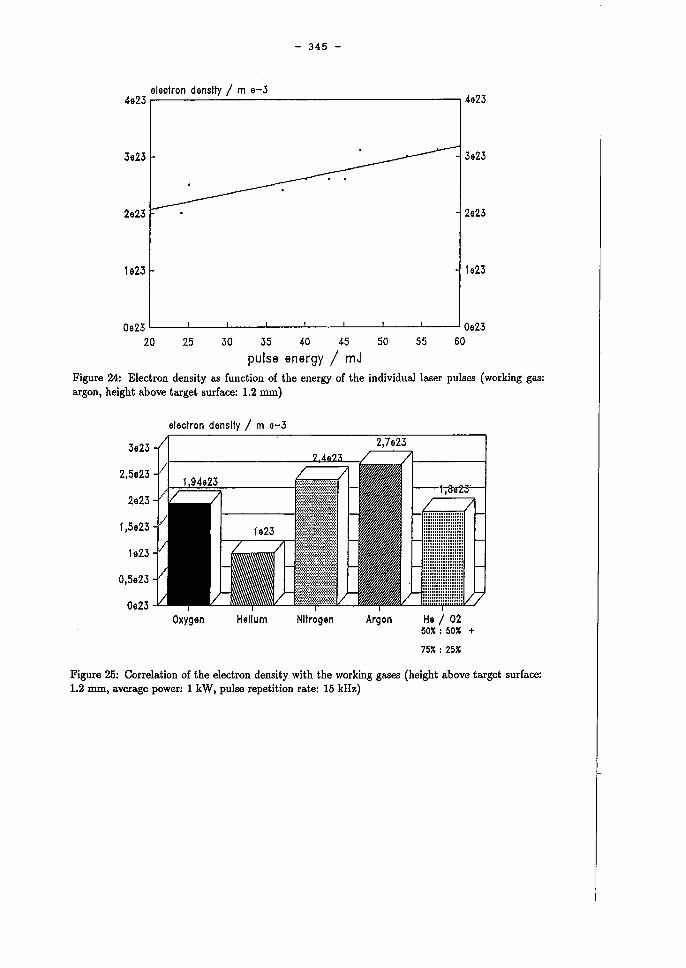
- 345 -
electron denslly / m e-3 4623,-----------------------,4623
3e23 3e23
2e23 2e23
1e23 1923
Oe23~--L--~--~-~--~-~~-~-~Oe23
20 25 30 35 40 45 50 55 60
pulse energy / mJ Figure 24: Electron density as function of the energy of the individual laser pulses (working gas: argon, height above target surface: 1.2 mm)
3e23
2,5e23
2e23
1,5e23
le23
O,5e23
Oe23
electron denslty / m 0-3
Oxygen Helium Nitrogen Argon He /02 50% : 50% +
75% : 25%
Figure 25: Correlation of the electron density with the working gases (height above target surface: 1.2 mm, a.verage power: 1 kW, pulse repetition rate: 15 kHz)
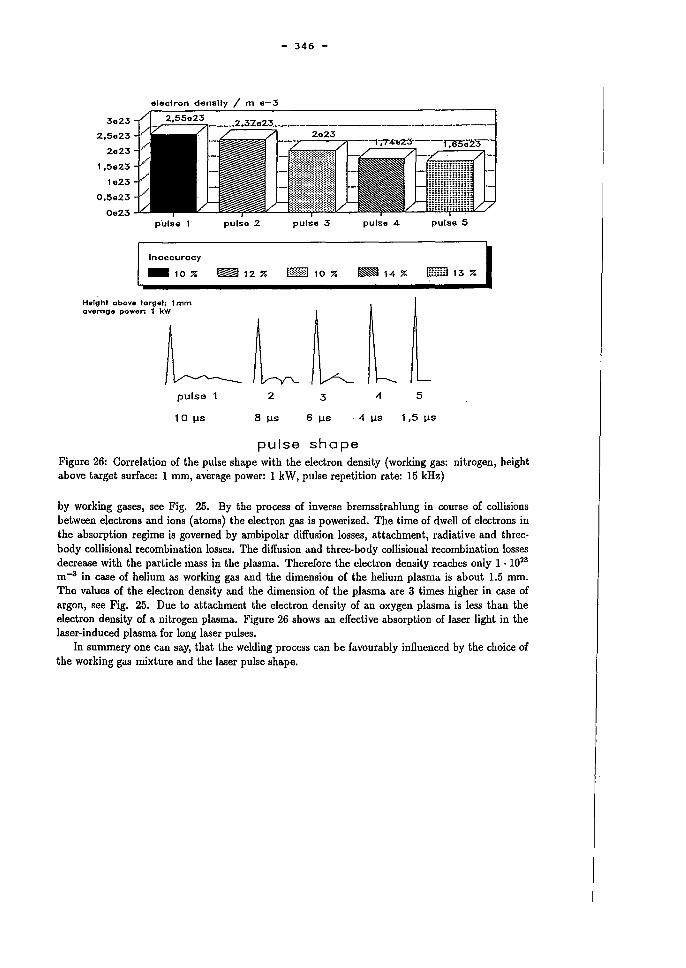
3e23
2,5e23
2e23
1,5e23
le23
O,5e23
Oe23
- 346 -
eleclron denslly / m e-3
pUlse 1 pulse 2 pulse 3 pulse 4 pulse 5
tnaccuracy
_10% ~12% P""",ll0 % ~14% lillillI 1 3 %
pulse 2 3 4 5
1 0 IlS 8 IlS 6 Ils 4 IlS 1,5 IlS
pulse shape Figure 26: Correlation of the pulse shape with the electron density (working gas: nitrogen, height above target surface: 1 mm, average power: 1 kW, pulse repetition rate: 15 kHz)
by working gases, see Fig. 25. By the process of inverse bremsstrahlung in course of collisions between electrons and ions (atoms) the electron gas is powerized. The time of dwell of electrons in the absorption regime is governed by ambipolar diffusion losses, attachment, radiative and threebody collisional recombination losses. The diffusion and three-body collisional recombination losses decrease with the particle mass in the plasma. Therefore the electron density reaches only 1 . 1023
m-3 in case of helium as working gas and the dimension of the helium plasma is about 1.5 mm. The values of the electron density and the dimension of the plasma are 3 times higher in case of argon, see Fig. 25. Due to attachment the electron density of an oxygen plasma is less than the electron density of a nitrogen plasma. Figure 26 shows an effective absorption of laser light in the laser-induced plasma for long laser pulses.
In summery one can say, that the welding process can be favourably influenced by the choice of the working gas mixture and the laser pulse shape.
- 347 -
6 References
1. P. D. Maker, R. w. Terhune and C. M. Savage, III Int. Conf. on Quant. Electronics, Paris (1963)
2. Yu. P. Raizer, JETP Lett. 11, 120 (1970)
3. N. A. Genera.!ov, V. P. Zimakov, G. I. Kozlov, V. A. Masyukov, Yu. P. Raizer, JETP LeU. 11, 228 (1970), ibid 11, 302 (1970), ibid 11, 407 (1970)
4. C. H. Chan, C. D. Moody, W. B. McKnight, J. Appl. Phys. 44,1179, (1973)
5. G. A. Hili, D. J. Ja.mes, S. A. Ra.msden, J. Phys. D: Appl. Phys. 5, L97 (1972)
6. J. Uhlenbusch, XVI Int. Conf. on Phenomena in Ionized Gases, Düsseldorf, Inv. Papers (1983)
7. D. C. Smith and M. C. Fowler, Appl. Phys. Lett. 22, 500 (1973)
8. Z. Mucha, Z. Peradszynski, A. Barvonovski, Bull. Acad. Pol. Scienc. 25, 361 (1977)
9. D. B. Gurewich, I. V. Podomoshenskii, Opt. Spectr. 18, 319 (1965)
10. C. Carlhoff, E. Kra.metz, J. H. Schäfer, J. Uhlenbusch, J. Phys. B: At. Mol. Phys. 19, 2629 (1986)
11. D. C. Smith, J. Appl. Phys. 41,4501 (1970)
12. W. Viöl, Thesis University of Düsseldorf (1988)
13. J. Uhlenbusch, W. Viöl, Contributions to Plasma Physics 29,459 (1989)
14. V. Helbig, K. P. Nick, J. Phys. B: At. Mol. Phys. 14,3573 (1981)
15. L. P. Kudrin, G. V. Sholin, Soviet Physics-Doklady 7, 1015 (1963)
16. J. Seidel, Z. Naturforsch. 32a, 1207 (1977)
17. M. Brüc~er, J. H. Schäfer, J. Uhlenbusch J. Appl. Phys. 66(3), 1326 (1989)
18. Z. Mucha, S. Müller, J. H. Schäfer, J. Uhlenbusch, W. Viöl, Springer Proceedings in Physics 15, Gas Flow & Chemica.! Lasers, ed. by S. Rosenwaks, 442 (1987)
19. E. Heidecker, J. H. Schäfer, J. Uhlenbusch, W. Viöl, J. Appl. Phys. 64(5), 2291 (1988)
20. J. A. McKay, R. D. Bleach, D. J. Nagel, J. T. Schriempf, R. B. Hall, C. R. Pond, S. K. Manlief, J. Appl. Phys. 50(5),3231 (1979)
21. P. W. Schreiber, A. M. Hunter, D. R. Smith, Plasma Phys. 15, 635 (1973)
22. Coherent Genera.! Everlase CO2 Laser Applications: Meta.! cutting, technical note, (1984)
23. Spectra Physics, Industria.! Laser Division: CO2 laser cutting, technical note, (1984)
- 348 -
24. R. Rothe, G. Sepold, K. Teske, Schweißen und Schneiden 82, DVS-Berichte 74, Düsseldorf (1982)
25. J. H. Schäfer, J. Uhlenbusch, W. Viöl, Aluminium 65(5), 501 (1989)
26. M. v. Hoesslin, I. Lange, M. Rutha', J. H. Schäfer, J. Uhlenbusch, W. Viöl, 'r" International Symposium on Gas Flow & Chemical Lasers, Dieter Schuöcker, Editor, Proc. SPIE 1031, 592 (1989)
27. S. Suckewer, C.H. Skinner, D. Kim, E. Valeo, D. Voorhees, and A. Wouters, Journal de Physique 47 (1986) C6-23-C6-30
28. S. Suckewer, C.H. Skinner, D. Kim, E. Valeo, D. Voorhees, and A. Wouters, Phys. Rev. Lett. 57 (1986) 1004-1007
- 349 -
Developments in Plasma Focus Research
J. SaIge
Institute of High VoItage Engineering
Technical University Braunschweig, FRG
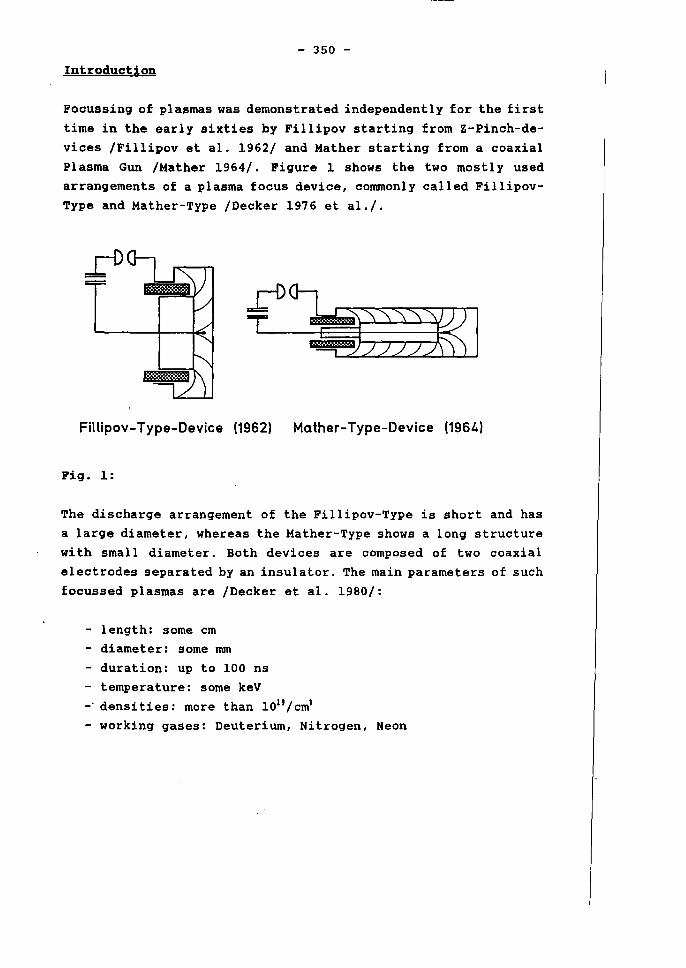
- 350 -
Introduction
Focussing of plasmas was demonstrated independently for the first time in the early sixties by Fillipov starting from Z-Pinch-devices IFillipov et al. 19621 and Mather starting from a coaxial Plasma Gun IMather 1964/. Figure 1 shows the two mostly used arrangements of a plasma focus device, commonly called FillipovType and Mather-Type IDecker 1976 et al.l.
Fillipov-Type-Device (1962) Mather-Type-Device (1964)
Fig. 1:
The discharge arrangement of the Fillipov-Type is short and has a large diameter, whereas the Mather-Type shows a long structure with small diameter. Both devices are composed of two coaxial electrodes separated by an insulator. The main parameters of such focussed plasmas are IDecker et al. 1980/:
- length: some cm - diameter: some mm - duration: up to 100 ns - temperature: some keV -" d-ensi ties: more than 10"1 cm' - working gases: Deuterium, Nitrogen, Neon
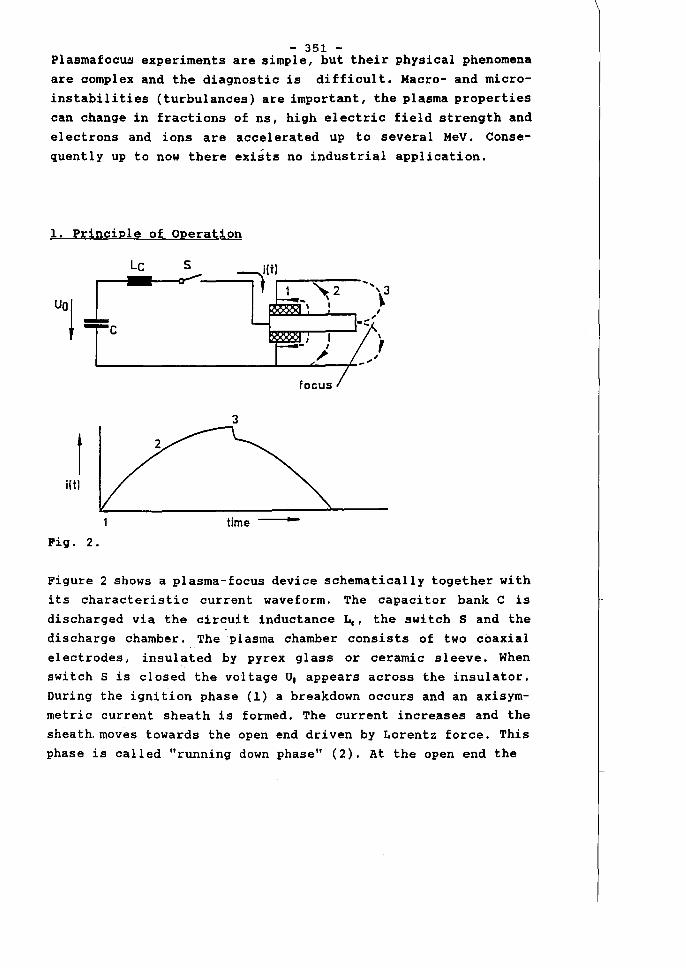
- 351 -Plasmafocus experiments are simple, but their physical phenomena
are complex and the diagnostic is difficult. Macro- and microinstabilities (turbulances) are important, the plasma properties can change in fractions of ns, high electric field strength and
electrons and ions are accelerated up to several MeV. Consequently up to now there exists no industrial application.
1. Principle of Operation
3
1 iltl
time .. Fig. 2.
Figure 2 shows a plasma-focus device schematically together with
its characteristic current waveform. The capacitor bank C is discharged via the circuit inductance ~, the switch Sand the
dis charge chamber. The plasma chamber consists of two coaxial electrodes, insulated by pyrex glass or ceramic sleeve. When switch S is closed the voltage U, appears across the insulator. During the ignition phase (1) a breakdown occurs and an axisymmetric current sheath is formed. The current increases and the sheath.moves towards the open end driven by Lorentz force. This
phase is called. "running down phase" (2). At the open end the
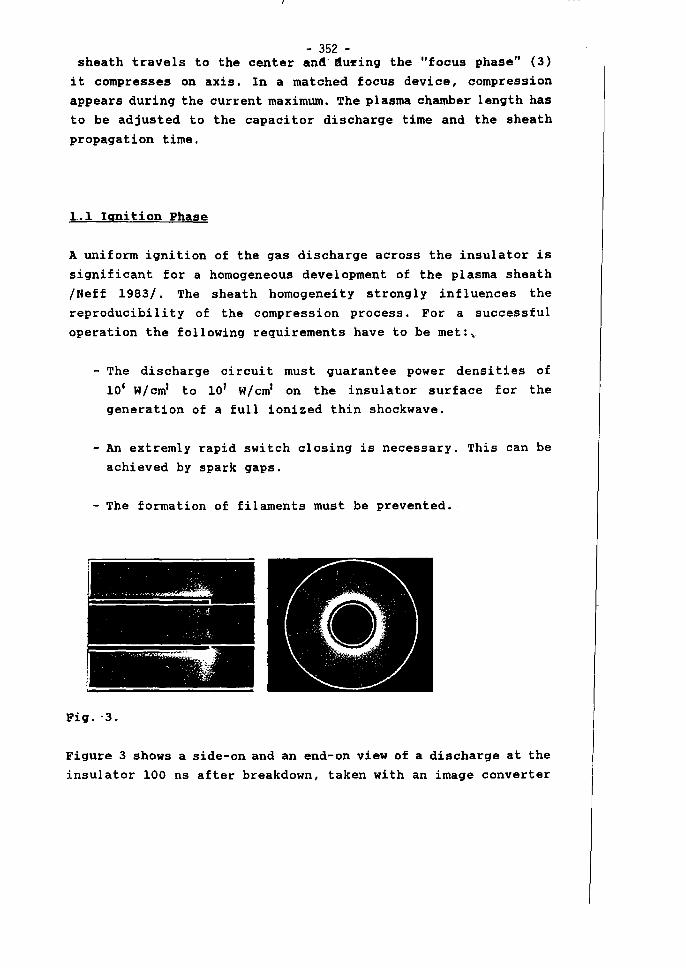
- 352 -sheath travels to the eenter end I!uring the "foeus phase" (3)
it eompresses on axis. In a matehed foeus deviee, eompression appears during the eurrent maximum. The plasma chamber length has
to be adjusted to the eapaeitor diseharge time and the sheath
propagation time.
1..1 Iqni tion Phase
A uniform ignition of the gas diseharge aeross the insulator is
signifieant for a homogeneous development of the plasma sheath /Neff 1983/. The sheath homogenei ty strongly influenees the
reprodueibility of the eompression proeess. For a sueeessful operation the following requirements have to be met: ~ ..
- The diseharge eireui t must guarantee power densi ties of
10' TA/eml to 10' TA/eml on the insulator surfaee for the generation of a full ionized thin shoekwave.
- An extremly rapid switeh elosing is neeessary. This can be
achieved by spark gaps.
- The formation of filaments must be prevented.
Fig. -3.
Figure 3 shows a side-on and an end-on view of a diseharge at the
insulator 100 ns after breakdown, taken with an image converter
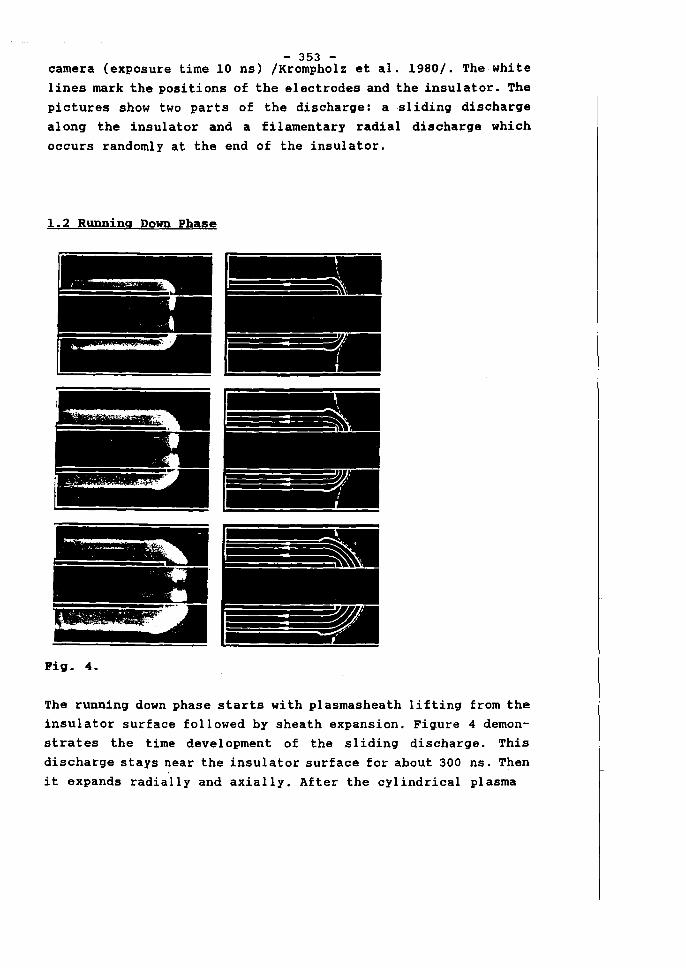
- 353 -eamera (exposure time 10 ns) IKrompholz et al. 19801. The white lines mark the positions of the eleetrodes and the insulator. The pietures show two parts of the diseharge: a ~liding diseharge along the insulator and a filamentary radial dis charge which oceurs randomly at the end of the insulator.
1.2 Running Down Phase
Pig. 4.
The running down phase starts with plasmasheath lifting from the insulator surfaee followed by sheath expansion. Figure 4 demonstrates the time development of the sliding diseharge. This discharge stays near the insulator surfaee for about 300 ns. Then it expands radially and axially. After the eylindrieal plasma
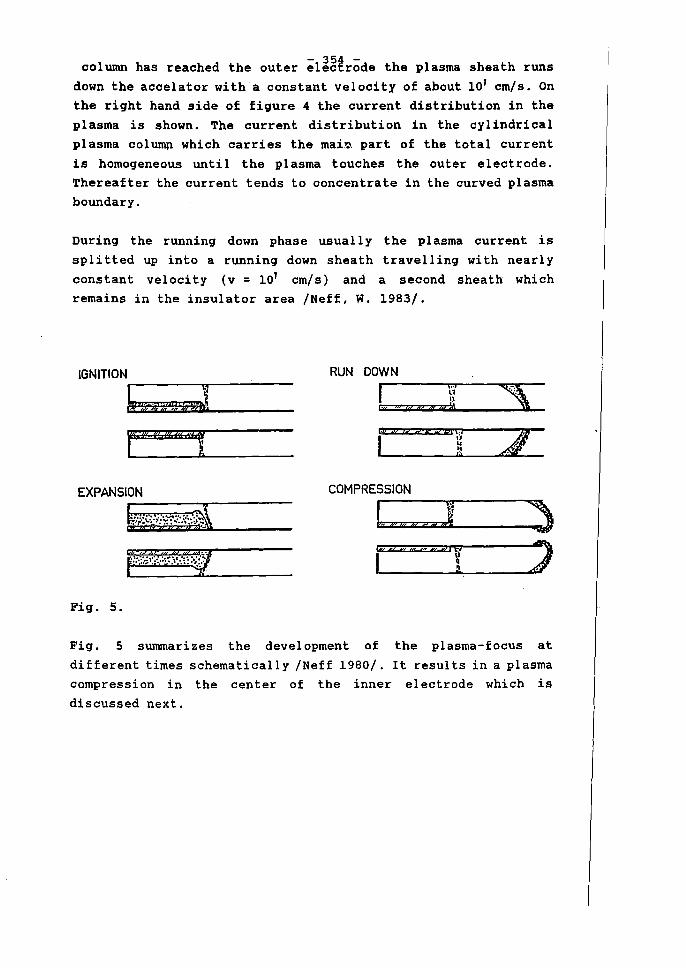
colurnn has reached the outer el~~trode the plasma sheath runs down the accelator witha constant velocity of about 10' em/s. On the right hand side of figure 4 the eurrent distribution in the plasma is shown. The current distribution in the eylindrieal plasma colump whieh carries the mai~ part of the total current is homogeneous until the plasma touches the outer eleetrode. Thereafter the eurrent tends to concentrate in the eurved plasma boundary.
During the running down phase usually the plasma eurrent is splitted up into a running down sheath travelling with nearly constant velocity (v = 10' em/s) and a second sheath which remains in the insulator area /Neff, W. 1983/.
IGNITION
L~-'-t-4-W-!AA-o-q-?-;J~i~----------
rww1Ü'1 EXPANSION
Fig. 5.
,r--f~'1f-\.?'i-':-:t~·-:··:;~·j""""'·;i~ --~ ~~ i!: ~t 2" ?t y......;:....
t"'.s?,y·:-1 d.,:!!/ t·:: .. ;··: .. :~·::···::·~
RUN DOWN
L '" & 11 m ?!IK
r 4 12 2 » R Pi li
Fig. 5 summarizes the development of the plasma-foeus at different times sehematically /Neff 1980/. It resul ts in a plasma eompression in the center of the inner electrode which is discussed next.
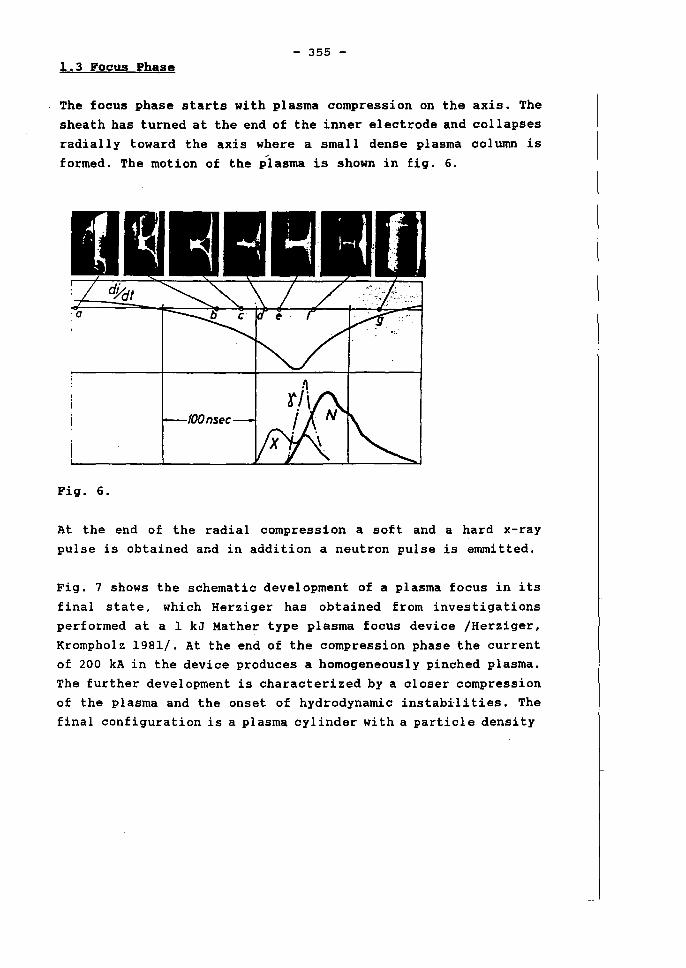
- 355 -1.3 Focus Phase
The focus phase starts with plasma compression on the axis. The
sheath has turned at the end of the inner electrode and collapses radially toward the axis where a small dense plasma column is
formed. The motion of the plasma is shown in fiq. 6.
Pig. 6.
At the end of the radial compression a soft and a hard x-ray pulse is obtained and in addition a neutron pulse is emmitted.
Fiq. 7 shows the schematic development of a plasma focus in its final state, which Herziqer has obtained from investiqations performed at a 1 kJ Hather type plasma focus device /Herziqer,
Krompholz 1981/. At the end of the compression phase the current of 200 kA in the device produces a homoqeneously pinched plasma.
The further development is characterized by a closer compression of the plasma and the onset of hydrodynamic instabilities. The final configuration is a plasma cylinder with a particle density
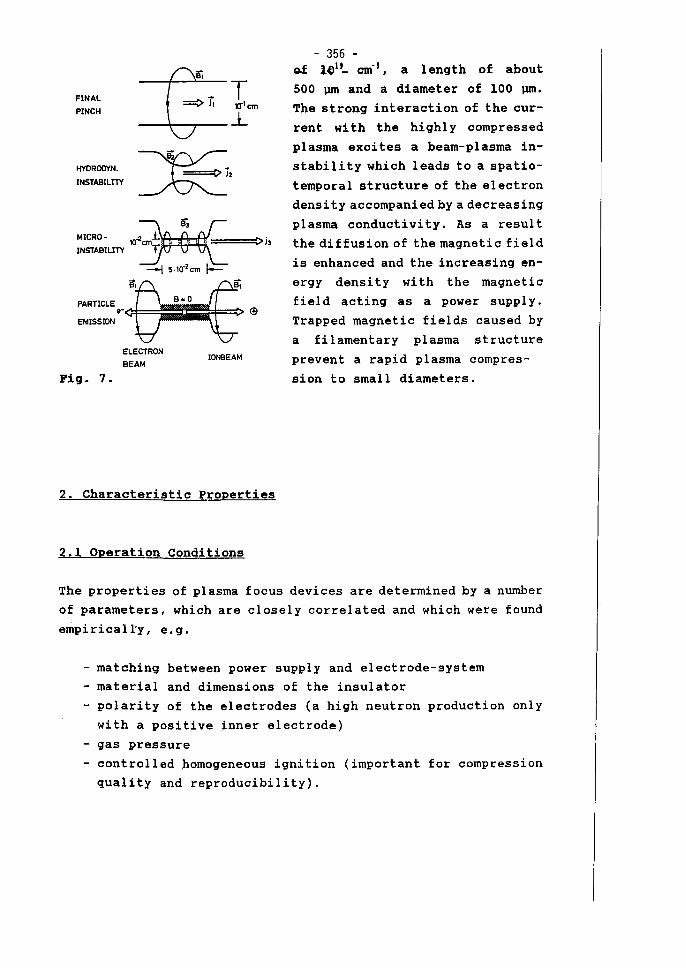
FINAL
PINCH
HYOROOYN.
INSTABILIl"Y
PARTICLE
EMISSION
Pig. 7.
e- ;',"±---=--,
ELECTRON
BEAM IONBEAM
2. Characteristic Properties
2.1 Operation Conditions
- 356 -o.f l(llt_ ern-I, a length of about
500 ~ and a diameter of 100 ~. The strang interaction of the cur
rent with the highly compressed
plasma excites a beam-plasma in
stability which leads to a spatio
temporal structure of the el ectron
densi ty accompanied by a decreasing
plasma conductivity. As a result
the diffusion of the magnetic field
is enhanced and the increasing en
ergy densi ty wi th the magneti c
field acting as apower supply.
Trapped magnetic fields caused by
a filamentary plasma structure
prevent a rapid plasma compres
sion to small diameters.
The properties of plasma focus devices are determined by a nurnber
of parameters, which are closely correlated and which were found
empiricall'y, e.g.
- matching between power supply and electrode-system
- material and dimensions of the insulator
- polarity of the electrodes (a high neutron production only
with a positive inner electrode)
- gas pressure
- controlled ~omogeneous ignition (important for compression
quality and reproducibility).
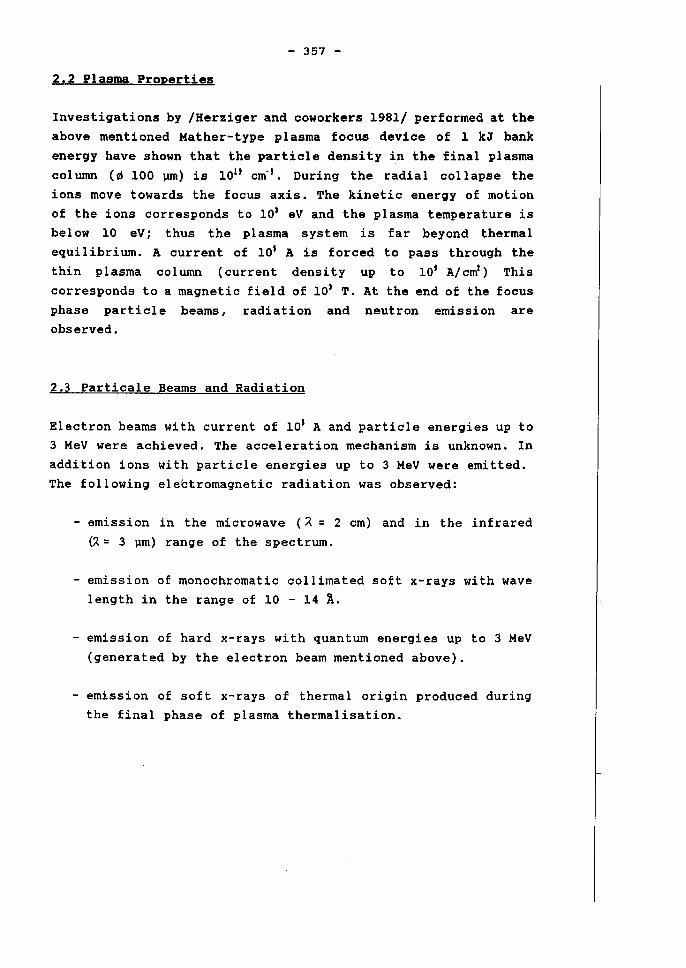
- 357 -
2.2 Plasma Properties
Investigations by /Herziger and eoworkers 1981/ performed at the
above mentioned Mather-type plasma foeus deviee of 1 kJ bank
energyhave shown that the partiele density in the final plasma
eolumn (QS 100 pm) is 10u ern-I. During the radial eollapse the
ions move towards the foeus axis. The kinetie energy of motion
of the ions eorresponds to 101 eV and the plasma temperature is below 10 eV; thus the pI asma system is far beyond thermal
equilibrium. A eurrent of 10' A is foreed to pass through the
thin plasma eolumn (eurrent density up to 10' A/eml ) This
eorresponds to a magnetie field of 101 T. At the end of the foeus
phase partiele beams, radiation and neutron emission are observed.
2.3 Partieale Bearns and Radiation
Eleetron beams with current of 10' A and partiele energies up to 3 MeV were achieved. The acceleration meehanism is unknown. In
addition ions with partieleenergies up to 3 MeV were emitted.
The following electromagnetic radiation was observed:
- emission in the microwave (A = 2 cm) and in the infrared
(;( = 3 prn) range of the spectrum.
- emission of monochromatic collimated soft x-rays with wave
length in the range of 10 - 14 Ä.
emission of hard x-rays with quantum energies up to 3 MeV
(generated by the eleetron beam mentioned above).
- emission of soft x-rays of thermal origin produced during
the final phase of plasma thermalisation.
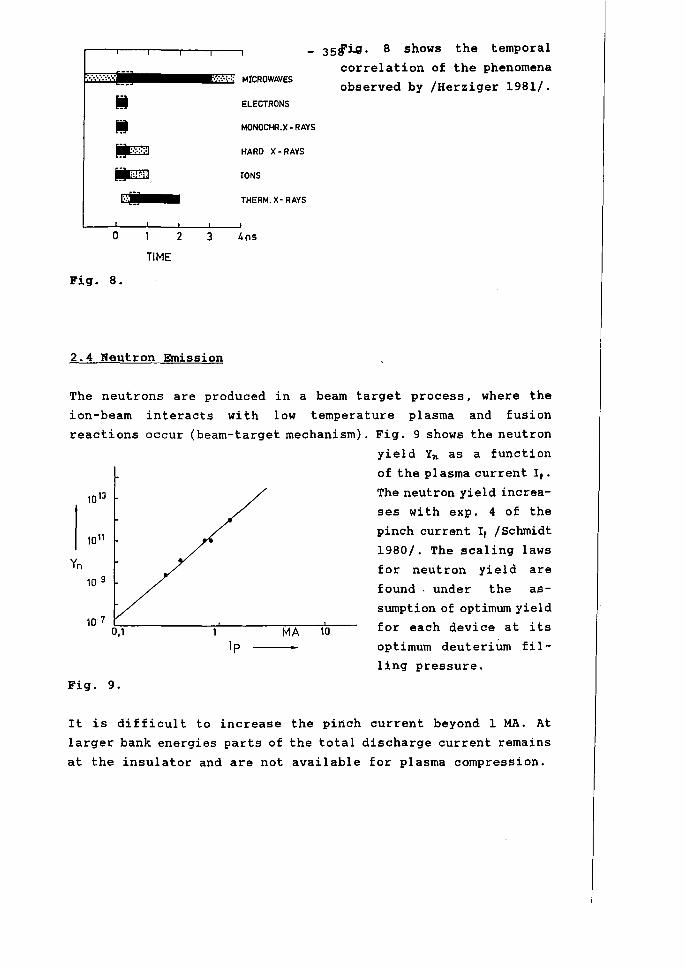
~:.~:.:§.:.:§, .• :~.: ~ ••••• E"~·:·.·:IT:··: M1CROWAVES
_ 351fiQ. 8 shows the temporal
correlation of the phenomena
observed by /Herziger 1981/. M M •. :.:.:.1
.::;:":1
r . ..[J
o TIME
Fig. 8.
2 3
2.4 Neutron Emission
ELECTRONS
MONOCHR.X - RAYS
HARO X -RAYS
IONS
THERM. x- RAYS
.4ns
The neutrons are produeed in a beam target proeess, where the
ion-beam interaets with low temperature plasma and fusion
reaetions oeeur (beam-target meehanism). Fig. 9 shows the neutron
10 13
10 11
Yn
10 9
10 7 0,1
Fig. 9.
MA 10
Ip
yield Yh as a funetion
of the pI asma eurrent Ir.
The neutron yield inerea
ses with exp. 4 of the
pineh eurrent Ir /Sehmidt
1980/. The sealing laws
for neutron yield are
found . under the as
sumption of optimum yield
for eaeh deviee at its
optimum deuterium filling pressure.
It is diffieult to inerease the pineh eurrent beyond 1 HA. At
larger bank energies parts of the total diseharge eurrent remains
at the insulator and are not available for plasma eompression.

- 359 -
3. Possible Applications
Simplieity, compaetness, insensitivness against impuritities are
attraetive aspeets for an applieation of plasma foeus deviees.
Opposed to these advantages there are teehnologieal problems
whieh are diffieult to solve (eleetrode erosion, sufficient
reprodueibility and lifetime, reliable operation at higher
repetition rates).
3.1 Neutron Souree
In the past plasma foeus deviees were mainly envisaged as test
beds in the field of fusion reaetor teehnology /Bernard et al.
1977/. Maehines generating neutron f1uxes beyond 1011 neu
trons/eml * s were diseussed. In this eonneetion theoperation of plasma focus deviees at high repetition rates was studied (DPF
Jülieh 11 has demonstrated a running with 2 diseharges/s, at an
energy of the capaeitor-bank of 23 kJ). Also maehines with stored
energies of more than 1 MJ were bui1t and tested in order to take
ful1 advantage of the significant inerease of neutron produetion
with inereasing pineh-eurrent (Fraseati, Stuttgart).
Fig. 10 shows the conceptual design of a 20 MJ discharge chamber with radiation test sample station proposed by /Bernhard et a1.
1977/. The discharge chamber has a diameter of 2.5 m and has to
serve the fol1owing purposes:
- provide the proper working press ure
- hold back tritium
- act as heat exchanger
- enclose the electrodes
- house the samp1e station.
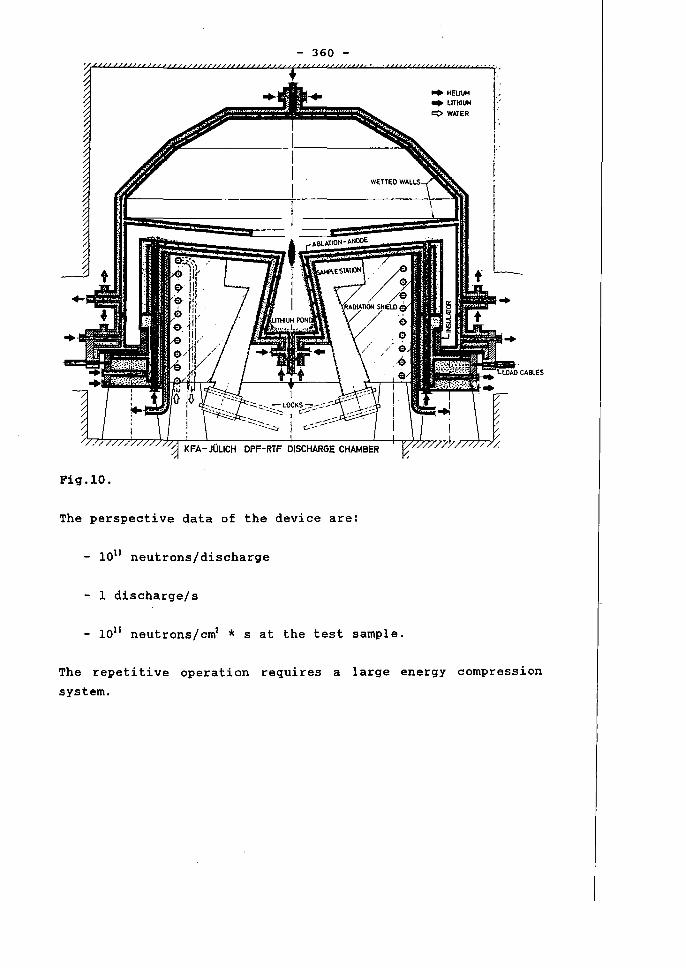
- 360 -
KFA-JÜLICH
Fig.10.
The perspective data of the device are:
- 1011 neutronsjdischarge
- 1 discharge/s
- 1011 neutrons/ernl * s at the test sarnple.
.. HELIUM
.. LITHIUM Q WATER
, i
! i I
I I I
L CABLES
The repetitive operation requires a large energy cornpression
system.
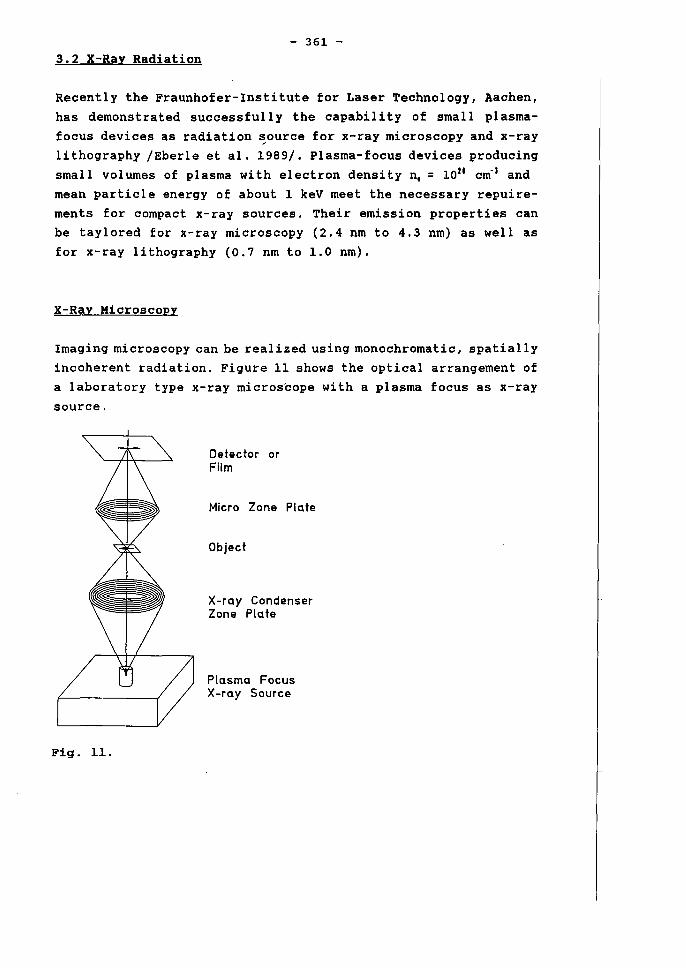
- 361 -
3.2 X-Ray Radiation
Recently the Fraunhofer-Institute for Laser Technology, Aachen, has demonstrated successfully the capability of small plasmafocus devices as radiation ~ource for x-ray microscopy and x-ray lithography /Eberle et al. 1989/. Plasma-focus devices producing small volwnes of plasma with electron density n. = 10u cm" and mean particle energy of ab out 1 keV meet the necessary repuirements for compact x-ray sourees. Their emission properties can be taylored for x-ray microscopy (2.4 nm to 4.3 nm) as weIl as for x-ray lithography (0.7 nm to 1.0 nm).
X-Ray Microscopy
Imaging microscopy can be realized using monochromatic, spatially incoherent radiation. Figure 11 shows the optical arrangement of a laboratory type x-ray microscope with a plasma focus as x-ray source.
Fig. 11.
Deteeter er Film
Miero Zone Plate
Object
X-ray Condenser Zone Plate
Plasma Foeus X-ray Souree
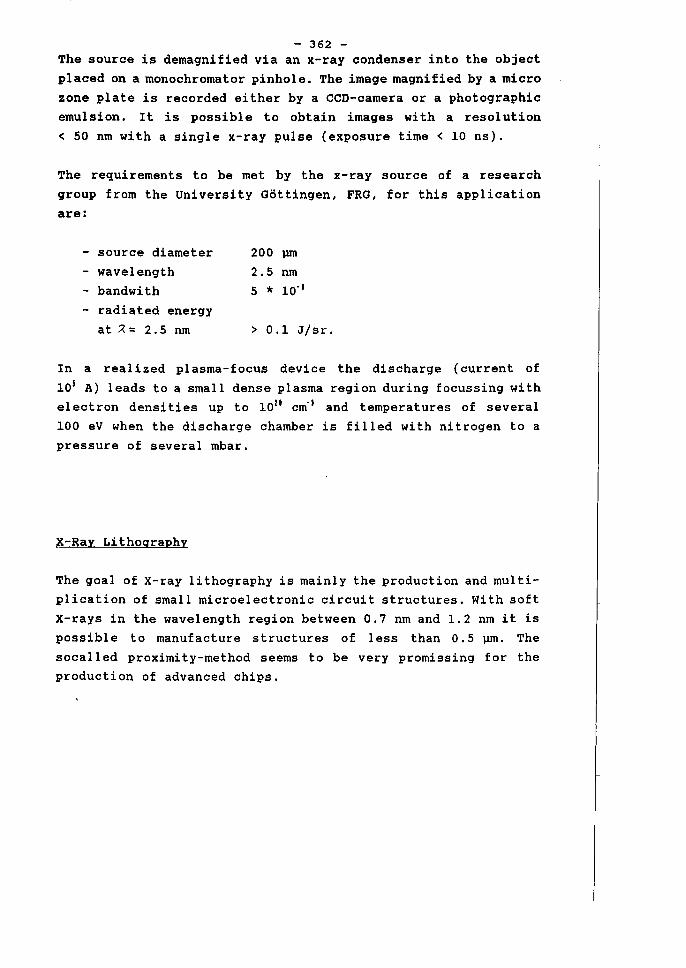
- 362 -The source is demagnified via an x-ray condenser into the object placed on a monochromator pinhole. The image magnified by a micro zone plate is recorded either by a CCD-camera or a photographic emulsion. It is possible to obtain images with aresolution
< 50 nm with a single x-ray pulse (exposure time< 10 ns).
The requirements to be met by the x-ray source of a research
group from the University Göttingen, FRG, for this application are:
- source diameter
- wavelength
- bandwith - radiated energy
at ~ = 2.5 nm
200 llJII
2.5 nm
5 * 10- 1
> 0.1 J/sr.
In a realized plasma-focus device the discharge (current of
105 A) leads to a small dense plasma region during focussing with el ectron densi ties up to 101t cm- I and temperatures of several 100 eV when the discharge chamber is filled with nitrogen to a
pressure of several mbar.
X-Ray Lithography
The goal of X-ray lithography is mainly the production and multiplication of small microelectronic circuit structures. With soft X-rays in the wavelength region between 0.7 nm and 1.2 nm it is
possible to manufacture structures of less than 0.5 llJII. The socalied proximity-method seems to be very promissing for the production of advanced chips.
plasma foeus x-ray souree
5mbar Ne
beam windowl
- 363 -
beam windowlJ
wafer eoated with x-ray resist
air 1bar
Fig. 12.
Figure 12 shows an experimental setup for lithography using a
plasma foeus as point radiation source, developed by the Aaehen
team together with the Karl Süss Company, Munieh. A approximity
gap of typieall y 50 \lm between the mask and the wafer is
neeessary to proteet the mask against meehanieal damage. The gap
between the last beam line window and the X-ray mask is 1 mm air
under atmospherie pressure.
The requirements of a plasma foeus point souree for X-ray
lithograpy are:
- wave length range
- souree diameter
- X-ray power on resist - exposure time
0.7 - 1.2 nm
< 1 mm
> 100 \lW/eml < 5 minutes.
Neon has proved to be the most suitable gas for this purpose.
It emits the main part of radiation between 0.7 nm to 1.4 nm.

The ernitted energy depends stron~~~ on the preparation of the pI asrna due to di fferent' dis charge Darameters , e. g.
- gas pressure - capacitor energy
- voltage.
Operating at a repetition rate of 2 Hz an average X-ray power of 120 pW/crn2 on the resist is achieved. For one exposure there are 500 pulses necessary. Running investigations are maimly concerned to improve the lifetirne of critical cornponents, e.g. insulator and switch.
Acknowledqement
The author wishes to thank J. Heuer and H. Winkler for their valuable support in preparing this paper.
References
Bernhard, A., Cloth, P.;
Conrads, H., Gourlan, G.,
Coudeville,A., Jolas, A.;
Maissonnier, CH.,
Rager, J.P.
Decker, G., Wienecke, R.
Decker, G., Herold, H.
Eberle, J., Holz, C.,
Lebert, R., Neff, W.
Richter, F., Noll, R.
Fi 11 ipov, N. V • ,
Fillipova, T.I,
Vinogradov, V.
Herziger, G., Kromp
holz, H.
Krompholz, H., Neff, W.,
Rühl, F., Schönbach, H.,
Herziger, G.
- 365 -
The Dense Plasma Focus - A High
Intensity Neutron Source,
Nuclear Instruments and Methods
145 (1977), pp. 191-218.
Plasma Focus Devices
Physica 82 C (1976) pp. 155-164
Der Plasmafokus Phys. Blätter (1980) pp. 328-333
Der Plasmafokus, eine neue Rönt
genquelle für die Röntgenmikro
skophie und Lithographie
Phys. Blätter 45 (1989) pp. 333-
339
Dense, High Temperature Plasma
in a Noncylindrical Z-Pinch Com
pression
Nucl. Fusion 2 (1962) p. 577
Phenomena of SeI f Organization
in Dense Plasma
in "Chaos and Order in Nature"
Springer 1981, pp. 131-141
Formatation of the Plasma Layer
in a Plasma Focus Device
Physics Letters, Vol. 77A (1980) pp. 246-248
Mather, J.H.
Neff I H. J.
Schmidt, H.
- 366 -Investigations of the High Ener-
gy Acceleration Mode in the
Coaxial Gun Phys. Fluids Supp. (1964) p.28
Homogenisierung von Plasmen für
den Plasmafokus Dissertation 1983 Techn. Hoch
schule Darmstadt
Second International Conference
on Emerging Nuclear Energy
Systems - The PI asma Focus - A revi ew Atomkernenergie-Kerntechnik Bd.
36 (1980) pp. 161-166
- 367 -
Ion Sputtering of Materials
H.F. Döbele
Physics Department
Essen University, FRG
Phenomenon:
- 368 -
Ion SDutterinQ or Materials
H. F. Döbele
Institut für Laser- und Plasmaphysik
Universität-GH Essen
D-4300 Essen 1, Fed. Rep. Germany
Release of particles from a surface by impact of atoms or ions.
First observations (coating on discharge tubesl date back to the
last century and were interpreted as the result of local heating
effects induced by particle impact. More realistic ideas of the
underlying mechanisms were developed on the basis of experiments
by Hehner [1], who demonstrated anisotr~py effects in sputtering
from crystals and also dependences of the sputtering yield Y on
the nuclear charge Z, with Y defined as:
Y (number of atoms releasedl (number of incident particlesl
Typical values of Y are between 1 and 50; values as low as 10- 5
and as high as 10 3 have been reported [2].
Applications of sputtering [6]
Ion beam machining or etching:
Hachining of metals, semiconductors and insulators. Structures
below 1 " (lateral and depthl may be formed, precise within 5 nm.
Other applications involve final tolerance control and removal of
surface strain regions after pOlishing.
Sources: beams, DC- and RF-discharges. Economical treatment of
large areas.
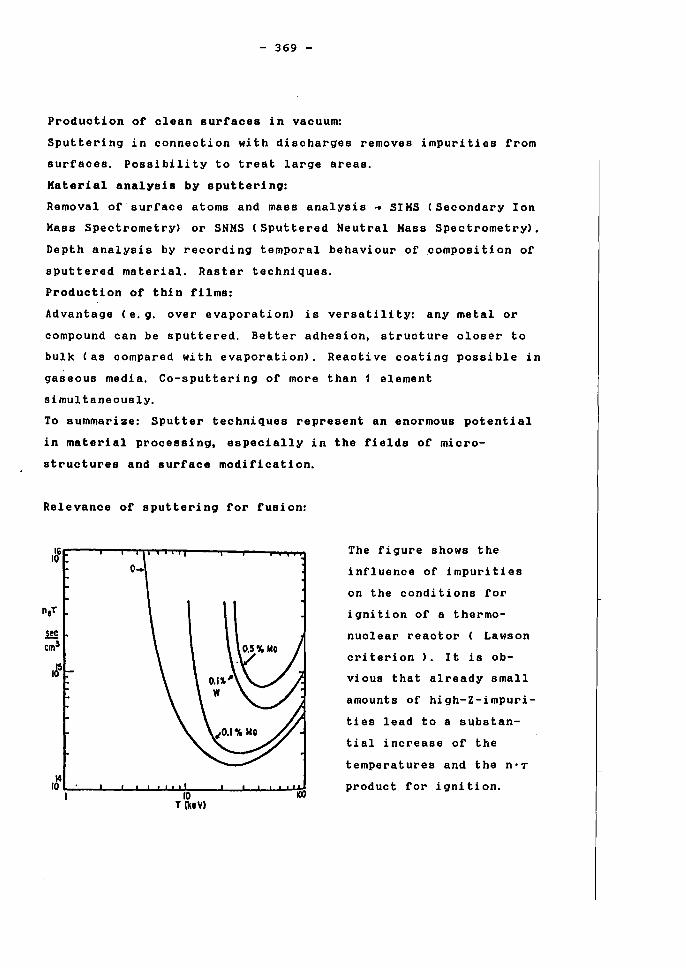
- 369 -
Production of clean surfaces in vacuum:
Sputtering in connection with discharges removes impurities from
surfaces. Possibili ty to treat large areas.
Material analysis by sputtering:
Removal ofsurface atoms and mass analysis ~ SIMS (Secondary Ion
Hass Spectrometry) or SNHS (Sputtered Neutral Hass Spectrometry).
Depth analysis by recording temporal behaviour of ~omposition of
sputtered material. Raster techniques.
Production of thin films:
Advantage (e.g. over evaporation) is versatility: any metal or
compound can be sputtered. Better adhesion, structure closer to
bulk (as compared with evaporation). Reactive coating possible in
gaseous media. Co-sputtering of more than 1 element
simul taneously.
To summarize: Sputter techniques represent an enormous potential
in material processing, especially in the fields of micro
structures and surface modification.
Relevance of sputtering for fusion:
sec cms
14 10~ __ ~ __ ~~~uu~ __ ~ __ ~~~~~
I 10 T IkeVI
The figure shows the
influence of impurities
on the conditions for
ignition of a thermo
nuclear reactor ( Lawson
criterion ). It is ob-
vious that al ready small
amounts of high-Z-impuri
ties lead to a substan
tial increase of the
temperatures and the n·T
product for ignition.
- 370 -
Detailed knowledge of impurities and impurity production
processes -e. g. sputtering- is essential.
The aspects of sputtering with respect to magnetic fusion
experiments have been discussed in several review papers ( see
e.g. [3,4,5]).
The main processes that lead to bombardment of the wall and
sputtering are:
*charge exchange processes in the edge region
( particle energy E ~ 100 eV
*plasma ions hitting limiter or divertor plates
(E ~ 100 eV)
*particles originating from neutral injection
( E up to 100 keV)
*fusion-Q-particles
Sputtered particles enter the plasma and are ionized as plasma
impurities. Impurities cause enhanced radiation losses.
Sputtering data are needed for model calculations. Hain
interests:
* sputtering yield and its distribution in angle.
dependence on projetile and target materials
* energy distribution of sputtered particles
* light projectiles
* low energy range
* sputtering of alloys and compounds
Characteristic sputtering regimes:
a) "The knock-on regime"
Primary event causes only few recoils. Sputter events not
numerous.
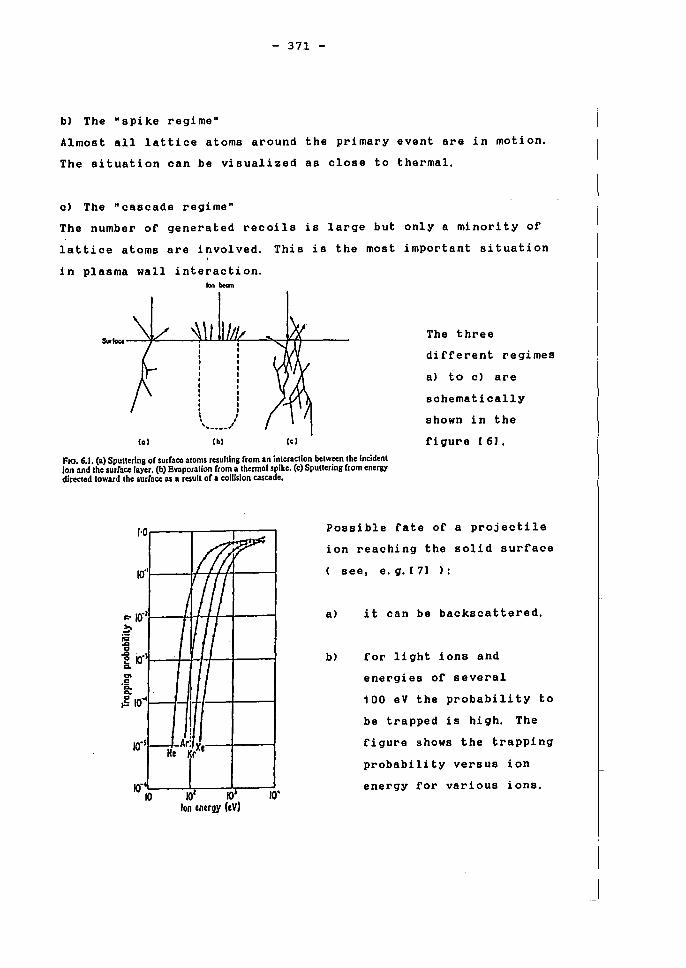
- 371 -
b) The "spike regime"
Almost all 1attice atoms around the primary event are in motion.
The situation can be visua1ized as c10se to thermal.
c) The "cascade regime"
The number of generated recoi1s is 1arge but on1y a minority of
1attice atoms are invo1ved. This is the most important situation
in plasma wall interaction. Ion bean
~~--~~----~~~~,--~~~~------The three
laI
, , , I I I , I I I I
• l , I
"" .... -'" Ibl le I
different regimes
a) to c) are
schematical1y
shown in the
figure [6].
Fro. 6.1. (a) Spullering or surraco aloms rcsulling rrom an inleraellon bclween rhe Ineidenl Ion Md Ihe surfacc layer. (b) Evaporalion rrom a Ihennal spike. (c) Spuuering from energy dlrecled loward Ihe surfacc as a resull or a collision cascade.
I-O..------.----r-----,
10·'I----W-+H+----I
F:' 10·'I----I-H-+-I--I----I .~ ~ ~ Kl·II---++-H~-+----I ls.
"" ·i 0.
~ 10~-~--~-~1~~/----+---~
!
Ar: Xc--I---~ Ne Kr
IO·"L---J.;----;--~ 10 10' 10' 10'
Ion energy (cV)
Possib1e fate of a projecti1e
ion reaching the solid surface
( see, e. g. [7] ):
a)
b)
it can be backscattered.
for light ions and
energies of severa1
100 eV the probability to
be trapped is high. The
figure shows the trapping
probability versus ion
energy for various ions.

- 372 -
Trapped ions gradually loose energy in interactions with elec
trons and lattice atoms and end up as lattice defects.
Slowing down by electrons:
Lattice electrons have a response time of - 10- 19 S. The inter
action is fully inelastic and continuous. No change in projectile
direction occurs.
log IdE/dKI
lindhord & SChor~ NUcll.'or_~
,-........ " I .-
,~
~ ,,' \, I , • " . " . " . " .
" I \ , , . , . . , (.112
V - Z 11 !.' - I h
Rl.'lolivisliC
log E
Electronic stopping is most effective for ions moving with velo
cities corresponding to the electron orbital velocity.
Slowing down by lattice atoms ( nuclear stopping ):
This mechanism is dominant at low particle energies, as can be
seen from the figure ( after [21 ). A two body interaction de
scription is adequate in this case. The interaction leads to a
deflection of the projectile and the generation of recoil atoms.
In the high energy part we mainly have Rutherford scattering in
the field of the nucleus. At intermediate energies the screening
influence of the electronic shell has to be taken into account.
At low energies, the interaction is via complex interaction
potentials.
A useful rule of thumb [71 is that for a projectile of atomic
weight A, the interaction with lattice atoms becomes predominant
for energies below A keV.
Lattice atoms can transfer energy to electrons ( with secondary
processes such as electron emission, emission of characteristic
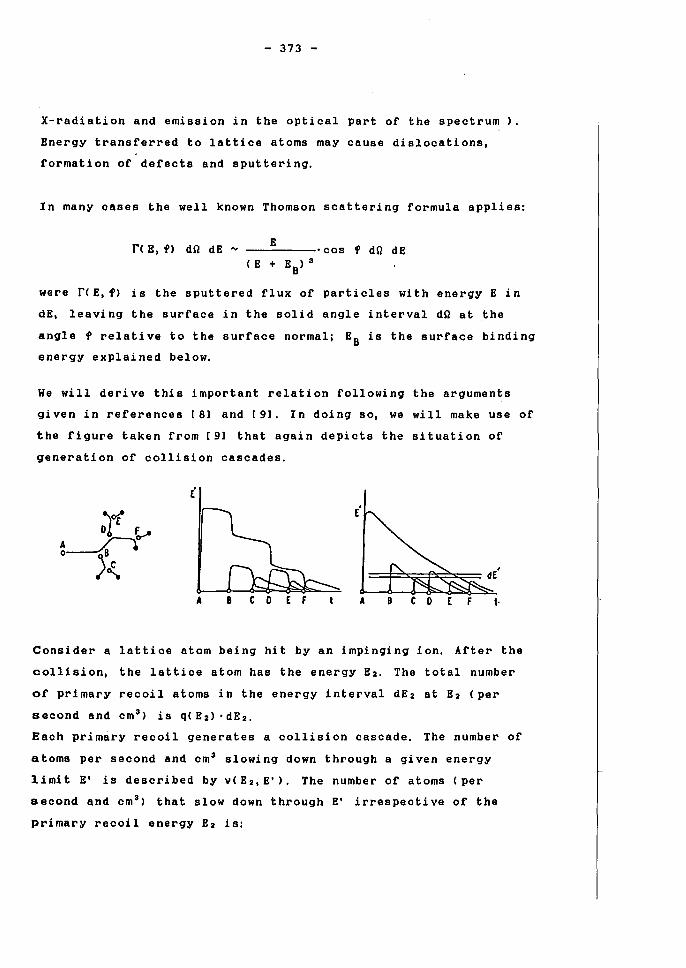
- 373 -
X-radiation and emission in the optical part of the spectrum ).
Energy transferred to lattice atoms may cause dislocations,
formation of defects and sputtering.
In many cases the weIl known Thomson scattering formula applies:
r( E, f) dQ dE ..., E f dQ dE -----·cos
(E + EB
) 3
were r(E,f) is the sputtered flux of particles with energy E in
dE, leaving the surface in the solid angle interval dQ at the
angle f relative to the surface normal; EB is the surface binding
energy explained belo~
He will derive this important relation following the arguments
given in references [81 and [91. In doing so, we will make use of
the figure taken from [91 that again depicts the situation of
generation of collision cascades.
A B C 0 E F
Consider a lattice atom being hit by an impinging ion. After the
collision, the lattice atom has the energy Ez. The total number
of primary recoil atoms in the energy interval dEz at Ez (per
second and cm 3) is q( Ez) . dEz.
Each primary recoil generates a collision cascade. The number of
atoms per second and cm 3 slowing down through a glven energy
limit E' is described by v( Ez, E'). The number of atoms (per
second and cm 3) that slow down through E' irrespective of the
primary recoil energy Ez is:
n( E' )
- 374 -
01)
I q( E2) ·v( E2, E') dE2 E'
Let us conside~ now the (smooth) cu~ve E'(t) of the figu~e. If s
is the coo~dinate along the pa~ticle's path, we have:
dE' dE' ds dt = ds . dt
dE' ds ·1;1
Therefo~e, the slowing down bl' dE' takes the time
dt
Let us now conside~ a di~ection in the solid cha~acte~i2ed bl' a
unit vecto~ .. e' . Quantities inside the solid will be identified bl'
a dash ('). The densitl' of atoms with ene~gl' in dE' at E' that
are moving in dQ' ..
a~ound e' can then be w~itten:
i>( E' , ~') dE' dQ' nIE') dt dQ/41r
(On the ~ight hand side we have the pa~ticles that a~e just on
thei~ wal' th~ough dE' which takes the time dt). He assume that
the cascade has become isot~opic du~ing this slowing down
p~ocess.
He now conside~ the flux th~ough an imagina~l' plane inside the
solid. The flux r' is given bl'
r' ( E' ,~) dE' dQ' i>( E' , ;)
and finalll':
dE' ... ... v' . n
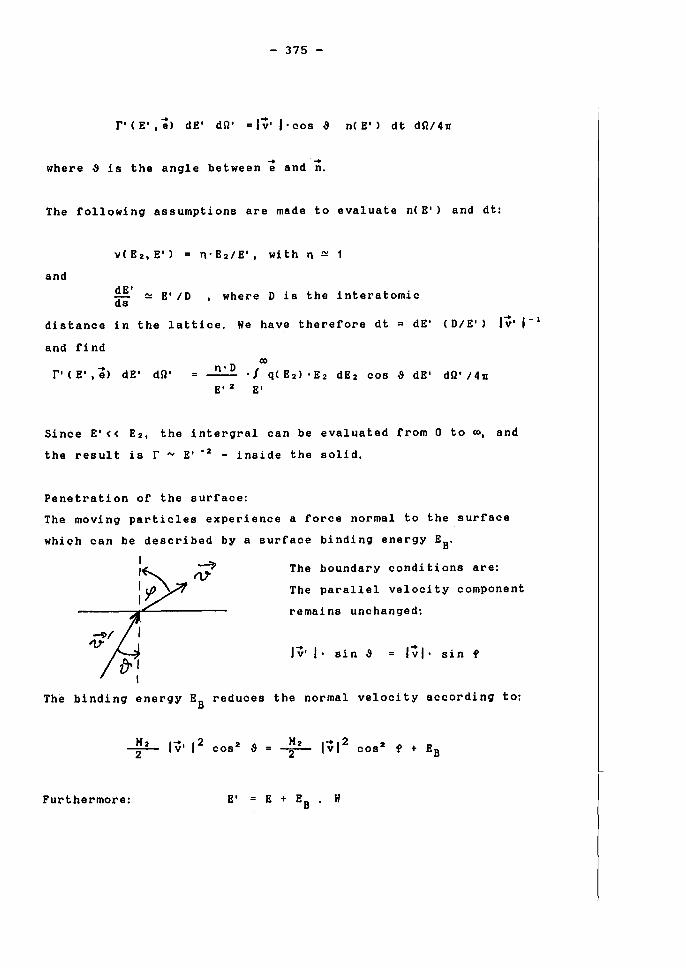
- 375 -
r'(E',a) dE' dQ' =I~' I·cos ~ n(E') dt dQ/41r
.. .. where ~ is the angle between e and n.
The following assumptions are made to evaluate n(E') and dt:
and
v(Ez,E') n·Ez/E', with n ~
dE' ~ E'/D , where D is the interatomic ds
distance in the lattice. He have therefore dt = dE' (D/E') I~' 1- 1
and find 00
r' ( E' ,e) dE' dQ' n·D ./ q(Ez).Ez dEz cos ~ dE' dQ'/41I E,2 E'
Since E'« Ez, the intergral can be evaluated from 0 to 00, and
the result is r 'Y E' -2 - inside the solid.
Penetration of the surface:
The moving particles experience a force normal to the surface
which can be described by a surface binding energy EB.
The boundary conditions are:
The parallel velocity component
remains unchanged:
Iv' I· Bin ~ 1~I·sinf
The binding energy EB reduces the normal velocity according to:
Kz Iv' 12 cos 2 ~ -2-
Furthermore: E'
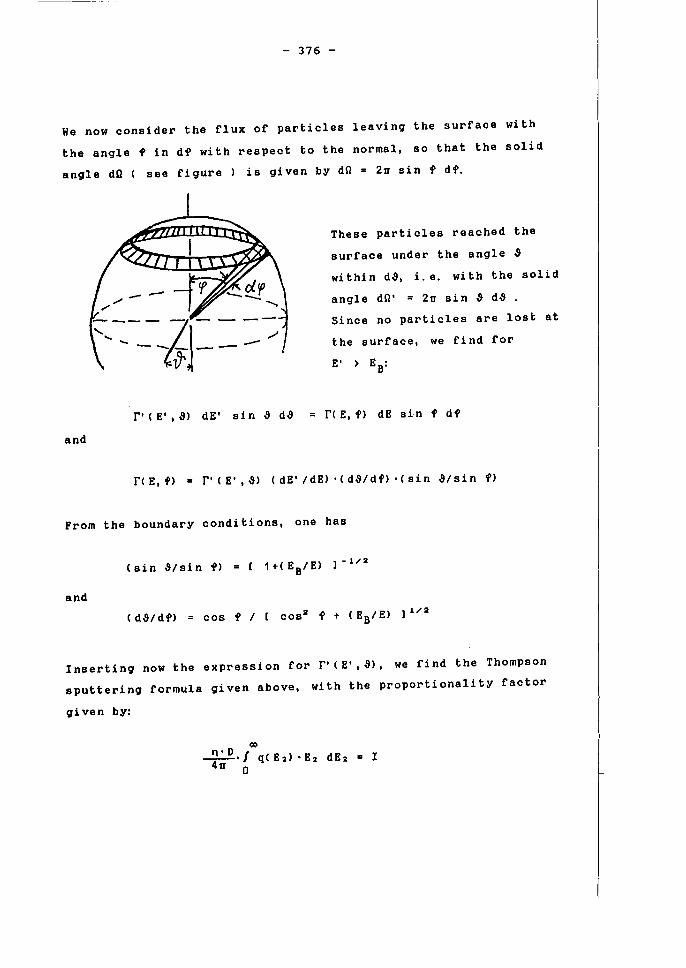
- 376 -
He now consider the flux of particles leaving the surface with
the angle f in df with respect to the normal, so that the solid
angle da ( see figure ) is given by da = 2~ sin f df.
and
r'(E',~) dE' sin ~ d~
These particles reached the
surface under the angle ~
within d~, i. e. with the solid
angle da' = 2~ sin ~ d~ .
Since no particles are lost at
the surface, we find for
E' > EB:
r< E, f) dE sin f df
r< E, f) r'(E',~) (dE'/dE)'(d~/df)'(sin ~/sin f)
From the boundary conditions, one has
(sin ~/sin f) [ 1+(E IE) ]-1/2 B
and
( d~/df) cos f I [ cos2 f + (EB/E) ]1/2
Inserting now the expression for r' (E' ,~), we find the Thompson
sputtering formula given above, with the proportionality factor
gi yen by:
(1)
~·I q( Ez) . Ez dEz I 4~ 0
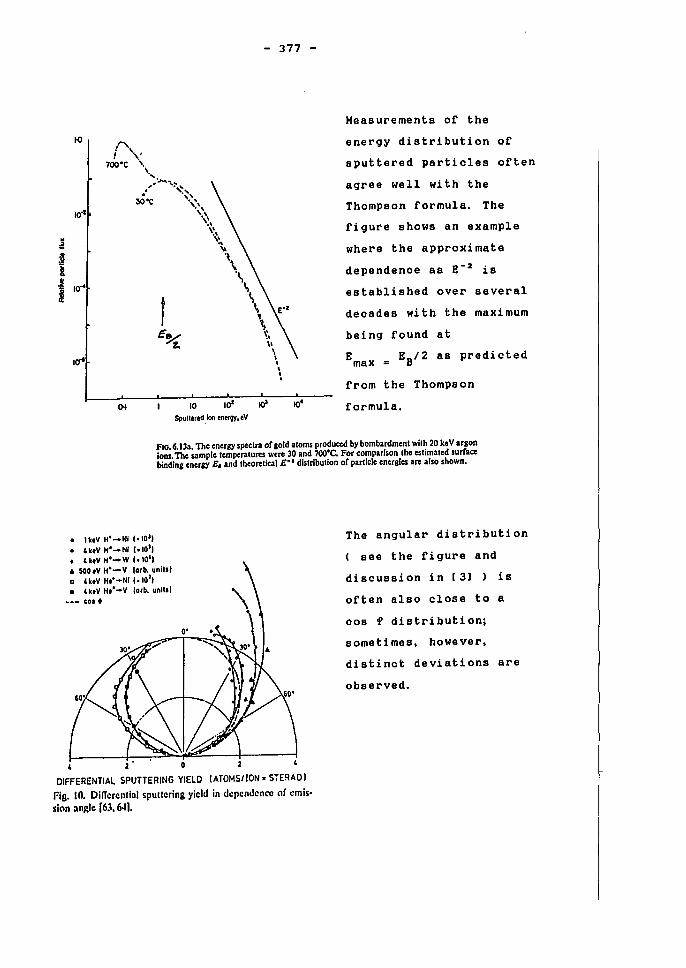
1-0
10"
.2 ~ l
j 10""
10"'
f E~ z.
10 Spullered ion enttrrt, eV
- 377 -
10'
Heasurements of the
energy distribution of
sputtered partic1es often
agree we11 with the
Thompson formu1a, The
figure shows an examp1e
where the approximate
dependence as 8- 2 is
estab1ished over severa1
decades with the maximum
being found at
8max
= 8 B/2 as predicted
from the Thompson
formu1a,
Flo. 6. 133. Tbc cnergy speetra or gold atoms produocd by bombardmcnt wilh 20 keV argon ions.1bc sampIe temperatum were 30 and 700'C. For comparison the estimated surrace bindinc energy E. and theoretical E-' distribution or partiele eneraies are also shown.
• IkiV H'-Ni 1,10'1 • H.V H'-NI 1,10'1 • H.V H'-W 1,10'1 • 500.V H'-V I.rb. unilll a u.v H.'-NII.IO', • U.V H.'-y I.rb. unilll
--- COI.
, 2 0 2
DIFFERENTIAL SPUTTERING VIELD IATOMSIION. STERAD)
Fig. 10. Differential sputlering yicld in dcpcndcncc oe emis· sion anAle r63,6-1).
The angular distribution
see the figure and
discussion in [3] is
often also c10se to a
cos f distribution;
sometimes, however,
distinct deviations are
observed.
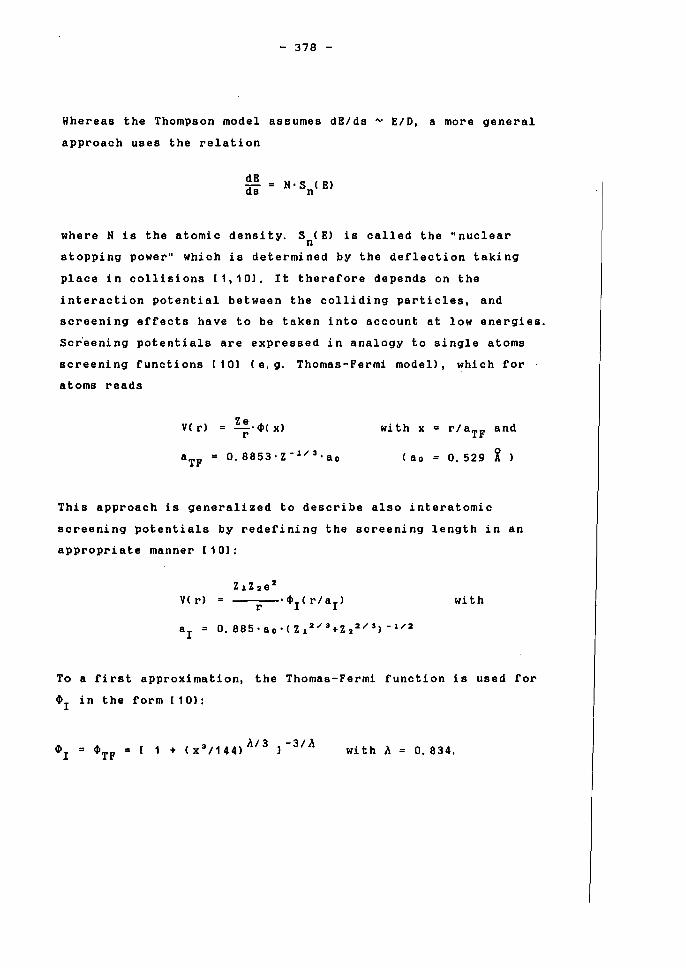
- 378 -
Hhereas the Thompson model assumes dE/ds ~ EID, a more general
approach uses the relation
dE ds
where N is the atomic density. Sn(E) is called the "nuclear
stopping power" which is determined by the deflection taking
place in collisions [1,10). lt therefore depends on the
interaction potential between the colliding particles, and
screening effects have to be taken into account at low energies.
Scieening potentials are expressed in analogy to single atoms
screening functions (10) (e. g. Thomas-Fermi model), which for
atoms reads
V( r) = !..!. ~( x) r wi th x
( a 0
r/aTF and
0.529 i )
This approach is generalized to describe also interatomic
screening potentials by redefining the screening length in an
appropriate manner (10):
V( r) ZlZ2e 2
--r-'~l( rIal) with
To a first approximation, the Thomas-Fermi function is used for
~l in the form (10):
~l = ~TF with ;. 0.834.
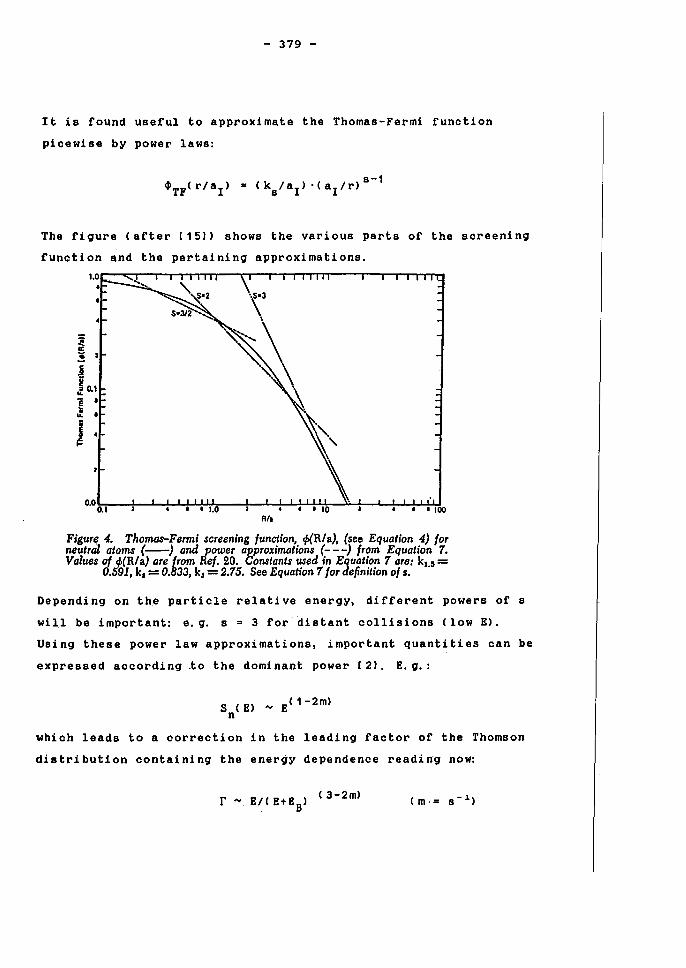
- 379 -
It is found useful to approximate the Thomas-Fermi function
picewise by power laws:
The figure (after [15) shows the various parts of the screening
function and the pertaining approximations.
O'0h---+-"'--!-'-+...I..!-~:---~-'--!-""""':-'-+-':!:-"""'-+-'--~-+~":! 0.1 • • 1.0 • • 10 • • 100 R/.
Figur~ 4. Thomas-Fenni screening function, tf>(R/a), (see Equation 4) for neutral atoms (--) and power approximations (- - -) from Equation 7. Values of t/l(R/a) are from Rel. 20. Constants Ufed in Equat~o!, 7 are: k1.5 =
0.591, k, = 0.833, k, = 2.75. See Equatlon 7 for defimllon of s.
Depending on the particle relative energy, different powers of s
will be important: e. g. s = 3 for distant collisions (low E).
Using these power law approximations, important quantities can be
expressed according _to the dominant power [2). E. g. :
S (E) .., E( 1 -2m) n
which leads to a correction in the leading factor of the Thomson
distribution containing the energy dependence reading now:
r .., E/( E+E ) (3-2m) B
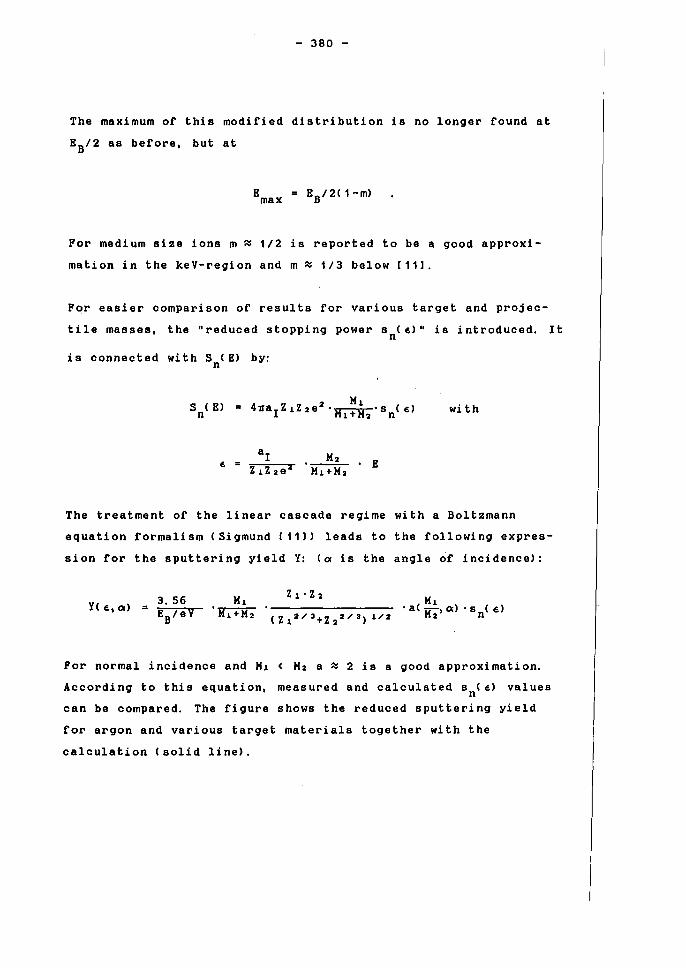
- 380 -
The maximum of this modified distribution is no longer found at
EB/2 as before, but at
E max
Por medium size ions m ~ 1/2 is reported to be a good approxi
mation in the keV-region and m ~ 1/3 below [11].
Por easier comparison of results for various target and projec-
tile masses, the "reduced stopping power sn(~)" is introduced. It
is connected with Sn(E) by:
S (E) n with
M2 • E ·Ml+M2
The treatment of the linear cascade regime with a Boltzmann
equation formalism (Sigmund [11]) leads to the following expres
sion for the sputtering yield Y: (~ is the angle of incidence):
Y( ~,~)
Por normal incidence and Ml < M2 a ~ 2 is a good approximation.
According to this equation, measured and calculated sn(~) values
can be compared. The figure shows the reduced sputtering yield
for argon and various target materials together with the
calculation (solid line).
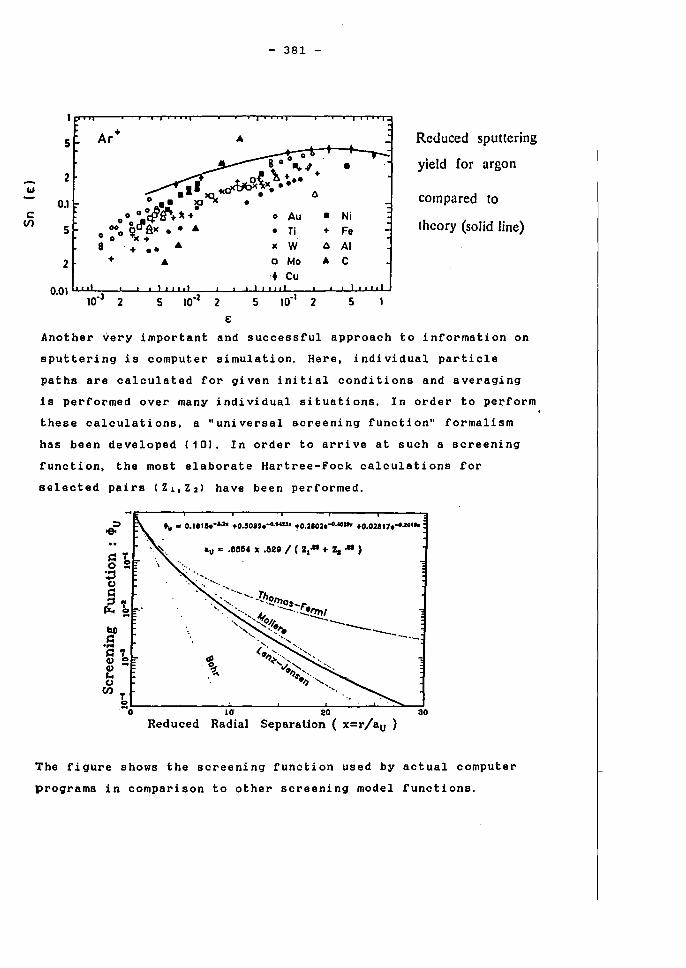
c V)
5
2
0.1
5
2
- 381 -
o 0 8 0
-..,
I .i,...9c\x \. ~.. + .1 )CI ico" l7'J • • 0
o • 1O-X •
o oo.oif.-+1t+. 0 Au o o __ ct' oo
ooc-al( ....
o 0 '1'1( + 8 . +.. ..
+
• Ti IC W o Mo
+ Cu
• Ni + Fe o AI .. C
Rcduced sputtering
yield for argon
compared to
Ihcory (solid line)
0.0 1 l..I.I.JL.L...::l:--'--'---'-'-'u..L.'-'--::2:--"--.1-JL.-LJL.J...L~I:--.L--'--''-'-'"'''''''''''''''' 10· 2 5 10· 2 5 10· 2 5
E
Another very important and successful approach to information on
sputtering is computer simulation. Here, individual particle
paths are calculated for given initial conditions and averaging
is performed over many individual situations. In order to perform
these calculations, a "universal screening function" formalism
has been developed [101. In order to arrive at such a screening
function, the most elaborate Hartree-Fock calculations for
selected pairs (Z I, Z 2) have been performed .
bO ~ .... ~ ... ~ ~ J.o ~
CI)
• u ... 8854 :I .628 I ( z.AI + Za AI )
t -O~------------~la~----~----~2~O----~~~~~30'
Reduced Radial Separation ( x=r/au )
The figure shows the screening function used by actual computer
programs in comparison to other screening model functions.
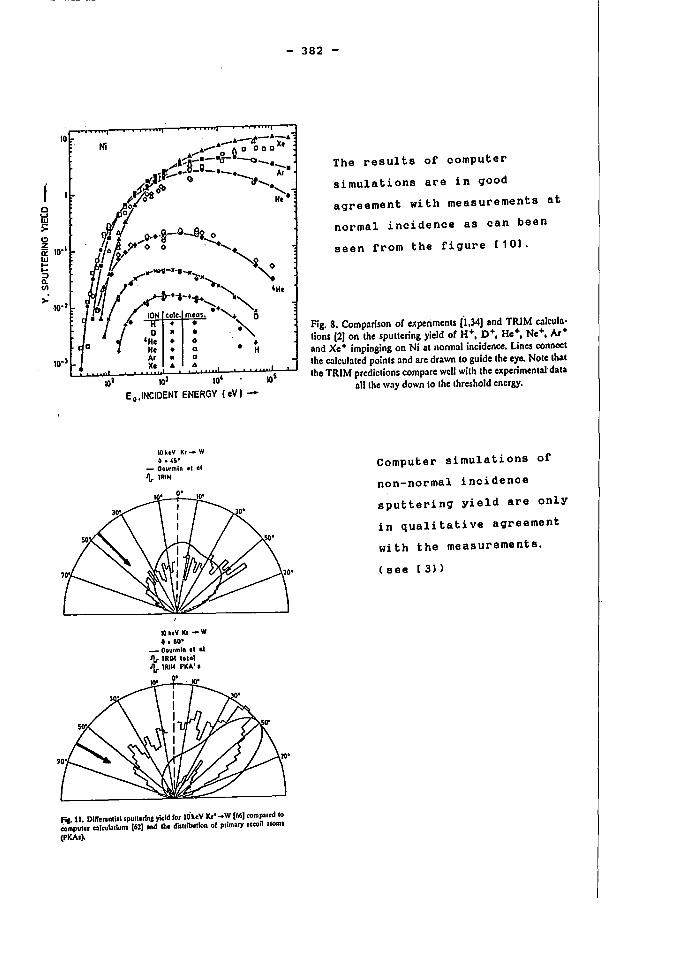
102 101 tO' lOS
E 0 ,INCIDENT ENERGY I eV I -
IOktV Kr- W ~ .U·
- Gourmln ., GI JL. I~IN
lOk'V Kr-W
_ Oou.mln •• al "Ir IRIM '0'01 .I(,. IRIN PKA' I
10' 0'.10'
Fis- 11, Dilleren,lllspuUerln, yield lor lI;teV Kr· ... W (66leompared 10 computer alcul:lllonl [63J and the disln'bution of primary recoil ~toml (PKAs).
- 382 -
The ~esults of compute~
simulations a~e in good
ag~eement with measu~ements at
no~mal incidence as can been
seen f~om the figu~e (10).
Fig. 8. Comparison of experiments (1,34] and TruM calcula· tions [2] on the sputtering yield oe H+, D+, He+, Ne+, Ar+ and Xe+ impinging on Ni at normal incidence. Lines connCCI the calculated points and are drawn to guide the eye. Note thai the TRIM predictions compare weil with the experimental data
nllthe way down to the threshold energy.
Compute~ simulations of
non-no~mal incidence
sputte~ing yield a~e only
in qualitative ag~eement
with the measu~ements .
. (see [3)
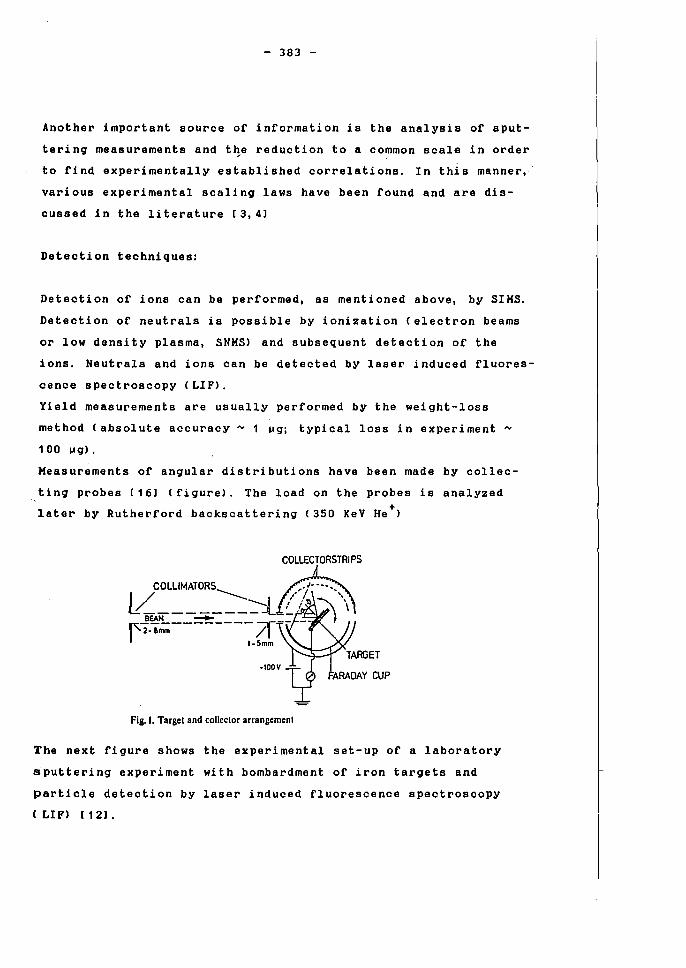
- 383 -
Another important source of information is the analysis of sput
tering measurements and t~e reduction to a common scale in order
to find experimentally established correlations. In this manner,
various experimental scaling laws have been found and are dis
oussed in the literature [3,4)
Deteotion techniques:
Detection of ions can be performed, as mentioned above, by SIMS.
Detection of neutrals is possible by ionization Celeotron beams
or low density plasma, SNMS) and subsequent detection of the
ions. Neutrals and ions can be detected by laser induced fluores
cence spectroscopy (LIF).
Yield measurements are usually performed by the weight-loss
method (absolute accuracy ~ 1 ~9i typical loss in experiment
1 00 ~g).
Measurements of angular distributions have been made by oollec
ting probes (16) (figure). The load on the probes is analyzed
later by Rutherford backscattering (350 KeV He+)
COLLECTORSTRI PS
Fig. I. Target and collector arrangement
The next figure shows the experimental set-up of a laboratory
sputtering experiment with bombardment of iron targets and
particle detection by laser induced fluorescence spectroscopy
CLIF) (12).
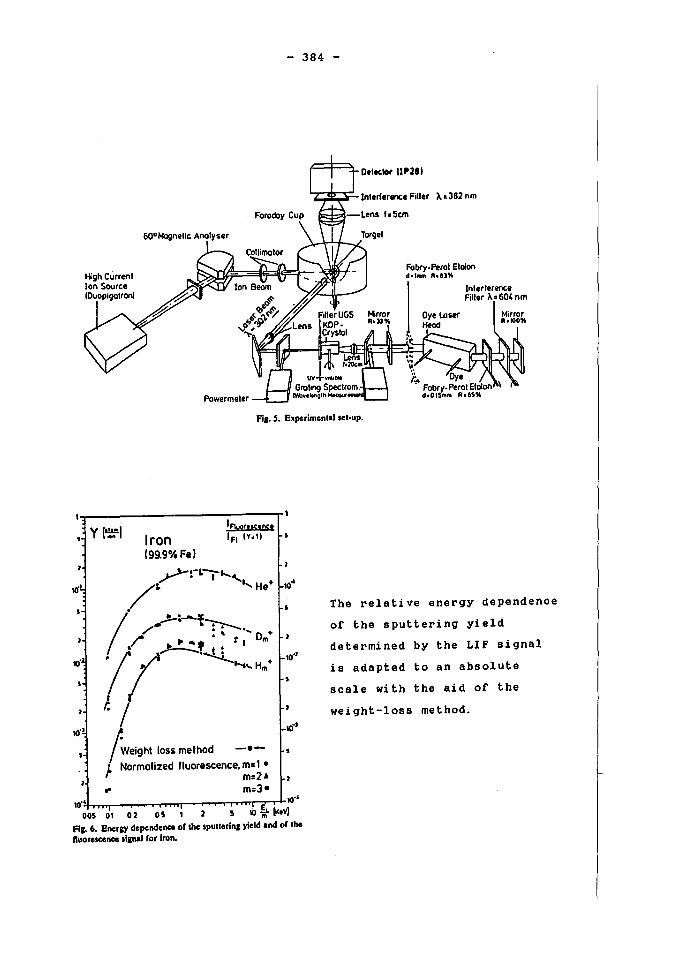
- 384 -
High Curren. Ion Sourtt (Ouopigo.ronl
Powerme.er
~.382 nm
In'erferente Filler ~. 604 nm
AI. S. Experimental set-up.
10"
YI~J Iron 199.9%Fel
'F!yOt'K'nc. IF1 ly.tI
.->-·-L-L ~ . '""' ..... /;. I, He+ 10"
, • :-.s /.r- ~~ ,. . '" .....
' ...... Hm+
I r.
!'wei9ht loss method -.~ L Normalized fluorescence, m=1 • r m=2A
.' m=3-10" 10"
005 01 02 05 1 5 10 ~ [KtV)
AI. 6. EnerlY dependcnce of the spullerinl yicld .nd of tM nuorcscence signal for Iroß.
The relative energy dependence
of the sputtering yield
determined by the LIF signal
is adapted to an absolute
scale with the aid of the
weight-loss method.
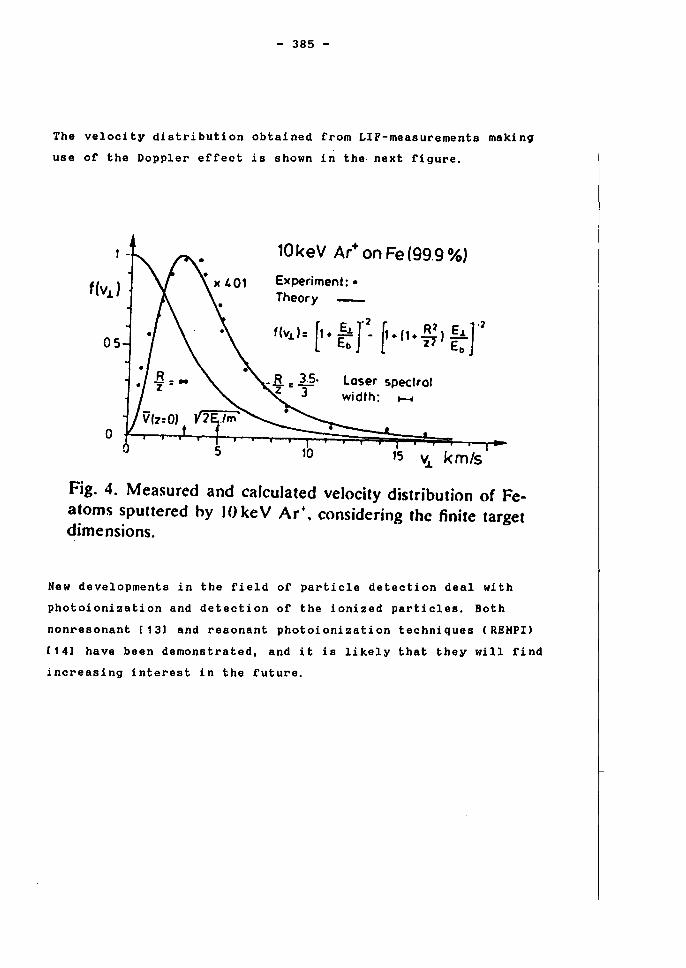
- 385 -
The velocity distribution obtained from LIF-measurements making
use of the Doppler effect is shown in the next figure.
f(v ... )
05
o
10keV Ar+ on Fe (99.9 %)
Experiment: • Theory
t(v~)= [1. ::r~ f·r1.~) ~~r'
10
Loser speclrol width: t--I
15 VJ, km/s
Fig. 4. Measured and calculated velocity distribution of Featoms sputtered hy )0 keV Ar·. considering the finite target dimensions.
New developments in the field of particle detection deal with
photoioni2ation and detection of the ioni2ed particles. Both
nonresonant [13] and resonant photoioni2ation techniques (REMPI)
[14] have been demonstrated. and i t is likely that they will find
increasing interest in the future.
- 386 -
Refel'ences:
[1] G. K. Hehner: Phys. Rev. 102 (1956) 690 and
J. Appl. Phys. 31 (1960) 1392
[2] R. Behl'isch, ed.: "Sputtel'ing by Pal'ticle Bombal'dment In
Spri ngel' Vel'lag, Bel'li n 1981
[ 3] J. Bohdansky: J. Nucl. Hatel'. 93 & 94 (1980) 44
[4] J. Roth: "Physical Sputtel'ing of Solids at Ion Bombal'dment"
in: D. E. Post and R. Behrisch, eds.:
"Physics of Plasma-Hall Intel'actions in Contl'olled Fusion",
Plenum Publishing Corp., 1986
[ 5] R. Behl'isch et al.:
Nucl. I nstr. Heth. Phys. Res. B18 (1987) 629
[6] P. D. Townsend, J. C. Kelly and N. E. Hal'tley:
"Ion Implantaion, Sputtel'ing and theil' Applications"
Academis Pl'ess, London 1976
[ 7] G. H. HcCracken: Rep. Prog. Phys. 38 (1975) 241
[ 8] H. H. Thompson: Phi 1. Hag. 18 (1968) 37'7
[9] H. H. Thompson: Physics Repol'ts 69 (1981) 335
[10] J. F. Ziegler, J. P. Biersack and U. Li ttmark:
"The Stopping Range of Ions in Solids"
Pergamon Press, New York 1985
[11] P. Sigmund: Phys. Rev. 184 (1969) 383
[12] E. Hintz et a1.: J. Nucl. Hater. 93 & 94 (1980) 656
[13] C.H.Becker and K.T.Gillen:
Anal. Chem 56 (1984) 1671
- 387 -
[14] J. E. Parks et a1.: Thin Solid Films: 8 (1983) 69
[15] H. F. Hinters, in:
H.K.Kaminsky,ed.: "Radiation Effects on Solid Surfaces",
American Chemical Society, Hashington, 1976
[ 16] H. L. Bay and J. Bohdansky: Appl. Phys. 19 (1979) 421
- 388 -
Plasma Assisted Deposition of Thin Films (discussed at the example of a-C:H)
J. Winter
Institute of Plasma Physics Association EURATOM-KFA
Forschungszentrum Jülich GmbH, FRG
- 389 -
P1asma Assisted Deposition of thin Films
(discUBsed at the example of a--c:H)
J. Winter
Institut für Plasmaphysik. Forschuogszentrum J"ü1ich GmbH.
Ass. EIJRATOM/KFA. P.O. BOX 1913. 5170 J"ü1ich
1. Introduction
Various inorganic and organic materials can be synthesized by plasma as
sisted chemical vapor deposition techniques in which the precursor gases are
decomposed in a glow discharge. Frequently the thin films can be grown on sub
strates close to room temperature.
Electron-impact dissociation of precursor gases in the glow dis charge is the
primary step for chemical reactions in a plasma system. As shown in Figure 1,
neutral fragments (radicals), produced in the gas phase, diffuse towards the
substrate and chamber wall, and ionic species move towards the electrodes un
der the influence of the applied electric field. Some of the neutral species
may be electronically or vibrationally excited by electron impact and emit
light whose wavelength ranges from vacuum UV to IR. Secondary processes such
as ion-molecule and neutral-molecule reactions take place through collisions
in the gas phase. Finally chemical reactions among reactive atoms, molecules,
and ions impinging onto the surface may occur to form a deposit.
In a conventional rf glow dis charge system for example electron and ion den
sities are at most 1011 cm-3 at apressure of 0.1 Torr. The number density of
molecules is on the order of 1015 cm-3• The electron temperature is of the or
der of a few eV and exceeds 104 K. while the gas temperature is usually seve
ral hundred degree Kelvin. The threshold energy to form neutral fragments is
close to that of the photolytic decomposition Ep • The electron-impact ioniza
tion needs a larger threshold energy than Ep • Consequently a ~ignificant flux
impinging onto the substrate surface will be radicals. The thin film formation
process might be controlled either by the generation rate of radicals or by
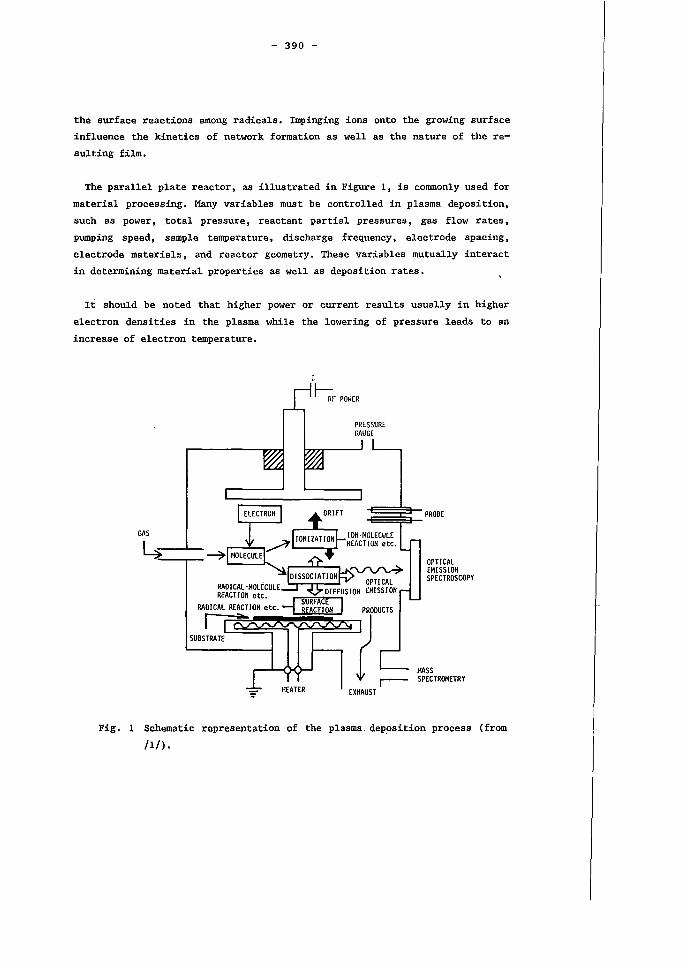
- 390 -
the surface reactions among radicals. Impinging ions onto the growing surface
influence the kinetics of network formation as well as the nature of the re
sulting film.
The parallel plate reactor, as illustrated in Figure I, is commonly used for
material processing. Many variables must be controlled in plasma deposition,
such as power, . total pressure , reactant partial pressures , gas flow rates,
pumping speed, sample temperature, dis charge frequency, electrode spacing,
electrode materials, and reactor geometry. These variables mutually interact
in determining material properties as well as deposition rates.
It should be no ted that higher power or current results usually in higher
electron densities in the plasma while the lowering of pressure leads to an
increase of electron temperature.
GAS
~~~~=PROBE
OPTlCAl EMISSION SPECTROSCOPY
HASS SPECTROHETRY
Fig. 1 Schematic representation of the plasma. dep.osition process (from
!11) •
- 391 -
The gas flow rate and pumping speed determine the residence time of the re
active -gas in the active region of the plasma. The extent of the deviation of
the system from the chemical equilibrium influences the deposition kinetics.
The attainment of equilibrium depends on whether or not the residence time is
shorter than the characteristic time of the reaction or the overall reaction
time constant.
Regarding the frequency of the input power, there are two distinct regions,
i.e. low frequency and high frequency regimes. The boundary between the two
regions is given by the critical frequency f c as:
(3)
where 1 is the electrode spacing, ~i is the ion mobility, and Eo is the ampli
tude of the ac electric field. The critical excitation frequency f c is estima
ted to be 10 - 100 kHz, below which both ions and electrons can respond to the
alternating electric field. Beyond f c ' ionic species can no longer move as
electrons can under the ac electric field. The substrate surface in the low
frequency plasma always suffers ion bombardment during one half of the cycle
and this bombardment significantly influences the properties of the deposit.
2. Deposition of hard amorphous carbon films a-C:H
Hard amorphous carbon films a-C:H have recently gained much interest because
of their unusual structure and properties. They are hard, resistant to chemi
cal attack and have a high refractive index. These properties appear to be
caused by a large number of tetrahedral (sp3) carbon-carbon bonds charac
teristic of the C-C bonds in diamond. Most of the dense carbon films incorpo
rate significant amounts of hydrogen, and in some ways appear analogous to
amorphous hydrogenated silicon (a-Si:H).
The unusual combination of density, hardness, chemical inertness, and rela
tive transparency makes such carbon films ideal candidates for optical coa
tings. This application is further enhanced by the discovery that the refrac
tive index can be systematically changed by varying the deposition conditions.
Other potential applications include coatings for tools, especially knives and
- 392 -
cutters that do not operate at high temeprature, and as a hard, low-friction
coating for moving parts. The films may also find use as protective coatings
against corrosion and as passivating diffusion barriers for e1ectonic compo
nents.
It shou1d be stated clearly, however, that there is nothing like a unique
hard amorphous 1ayer but that the a-C:H films rather form a whole class of
substances. Their properties may vary in a broad range according to the depo
sition conditions.
2.1 General Review of the Deposition Processes
One characteristic feature of most processes for growing a-C:H films from
hydrocarbon gases is the average energy of the species at impact, usua11y in
the range 50 to 500 eV. The most important deposition processes using hydro
carbon gases are brief1y reviewed below.
The hydrocarbon source gases used in the literature have been methane, eta
ne, butane, propane, acetylene, ethylene, propylene, cyc1ohexane, octane, de
cane, benzene, xy1ene, naphtha1ene, and probab1y others. Very little analysis
has been made of the plasma products, nor has direct measurement of the impact
energy been made.
Figure 2 shows several hydrocarbon discharge deposition schemes. The capaci
tive1y coup1ed rf glow dis charge , most commonly used to produce dense hydro
carbon films is shown in figure 2(a). The substrate is generally p1aced on the
small e1ectrica11y powered e1ectrode where it acquires a negative dc se1f
bias.
In an inductive1y coupled rf glow dis charge (Figure 2(b», the substrate re
ceives no bias except for the difference between floating potential and plas
ma potential (a few volts). The pressure is higher than for capacitively
coupled discharges, and the films are softer. The substrate is usually heated
and acetylene is often used as the source gas.
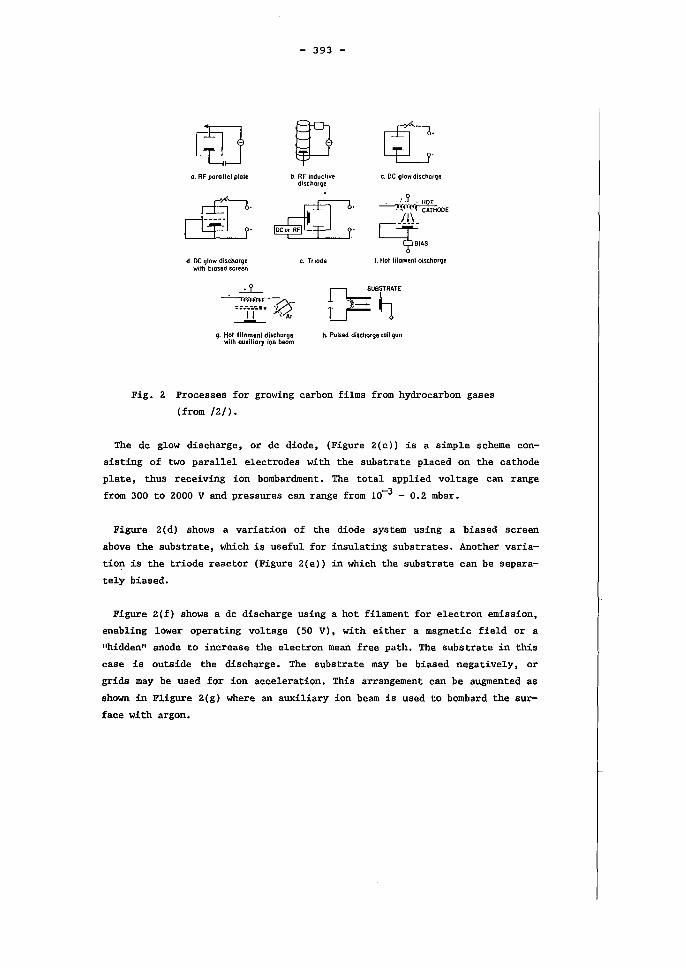
o. RF parallel pfore
d. oe glow discharge wilh blosed SCleen
• ..... it
11 ----
- 393 -
b. Rf induclive dischorge
c. oe glow dischorge
_ ~HOT .nllii CATHOOE
11\
q.'AS e. Triode f. HOl filamenl discharge
f)::UB~ATE
~ LJ 'b g. Hol filamenl dischorge
wilh auxiliar)' Ion beom h. Pulsed discharge rail gun
Fig. 2 Proeesses for growing earbon films from hydroearbon gases
(from /21).
The de glow dis charge , or de diode, (Figure 2(c» is a simple scheme eon
sisting of two parallel electrodes with the substrate plaeed on the eathode
plate, thus receiving ion bombardment. The total applied voltage can range
from 300 to 2000 V and pressures ean range from 10-3 - 0.2 mbar.
Figure 2(d) shows a variation of the diode system using a biased sereen
above the substrate, whieh is useful for insulating substrates. Another varia
tion is the triode reaetor (Figure 2(e» in which the substrate ean be separa
tely biased.
Figure l(f) shows a de diseharge using a hot filament for electron emission,
enabling lower operating voltage (50 V), with either a magnetie field or a
"hidden" anode to inerease the eleetron mean free path. The substrate in this
ease is outside the diseharge. The substrate may be biased negatively, or
grids may be used for ion aeceleration. This arrangement ean be augmented as
shown in Fligure leg) where an auxiliary ion beam is used to bombard the sur
faee with argon.
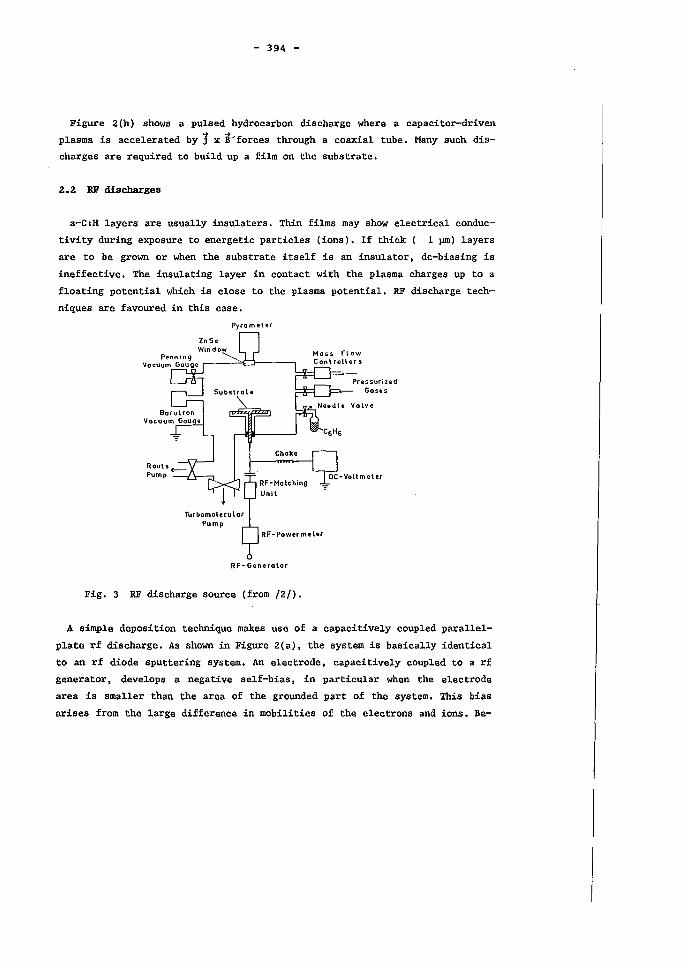
- 394 -
Figure 2(h) shows a pulsed hydrocarbon dis charge where a capacitor-driven
plasma is accelerated by 1 x B'forces through a co axial tube. Many such dis
charges are required to build up a film on the substrate.
2.2 RF discharges
a-C:H layers are usually insulaters. Thin films may show electrical conduc
tivity during exposure to energetic particles (ions). If thick ( 1~) layers
are to be grown or when the substrate itself is an insulator, dc-biasing is
ineffective. The insulating layer in contact with the plasma charges up to a
floating potential which is close to the plasma potential. RF dis charge tech
niques are favoured in this case.
Pyrometer
Zn Se
RF- Generator
Fig. 3 RF dis charge source (from /2/).
Pressurized Goses
A simple deposition technique makes use of a capacitively coupled parallel
plate rf discharge. As shown in Figure 2(a), the system is basically identical
to an rf diode sputtering system. An electrode, capacitively coupled to a rf
generator. develops a negative self-bias. in particular when the electrode
area is smaller than the area of the grounded part of the system. This bias
arises from the large difference in mobilities of the electrons and ions. Be-
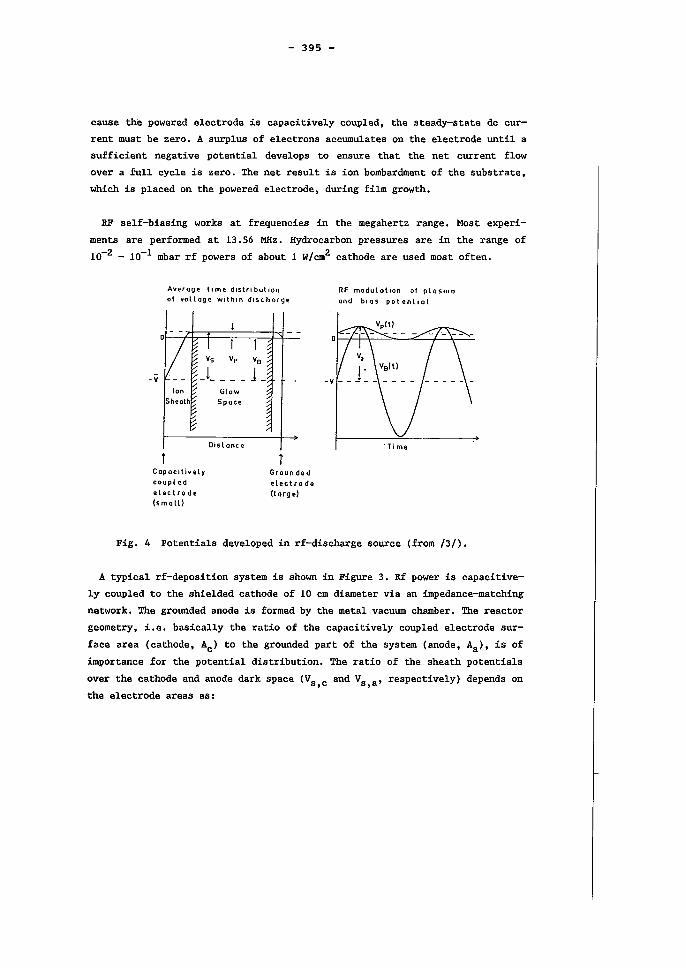
- 395 -
cause the powered electrode is capacitively coupled, the steady-state dc cur
rent must be zero. A surplus of electrons accumulates on the electrode until a
sufficient negative potential develops to ensure that the net current flow
over a full cycle is zero. The net result is ion bombardment of the substrate,
which is placed on the powered electrode, during film growth.
RF self-biasing works at frequencies in the megahertz range. Most experi
ments are performed at 13.56 MHz. Hydrocarbon pressures are in the range of
10-2 - 10-1 mbar rf powers of about 1 w/cm2 cathode are used most often.
Average time distri bullan of yoltoge wlthln discharge
I Vs Vp V J ____
-v Ion
Sheath
Copocitively couplcd
electrode (smatt)
Glow Spote
Distonce
VB
1_
1 Graun de d
electro de (targ e)
RF modulation of plasma
ond blos potentlol
'Ti me
Fig. 4 Potentials developed in rf-discharge source (from 13/).
A typical rf-deposition system is shown in Figure 3. Rf power is capacitive
ly coup1ed to the shielded cathode of 10 cm diameter via an impedance-matching
network. The grounded anode is formed by the metal vacuum chamber. The reactor
geometry, i.e. basically the ratio of the capacitively coupled electrode sur
face area (cathode, Ac) to the grounded part of the system (anode, Aa ), is of
importance for the potential distribution. The ratio of the sheath potentials
over the cathode and anode dark space (Vs,c and Vs,a' respectively) depends on
the electrode areas as:
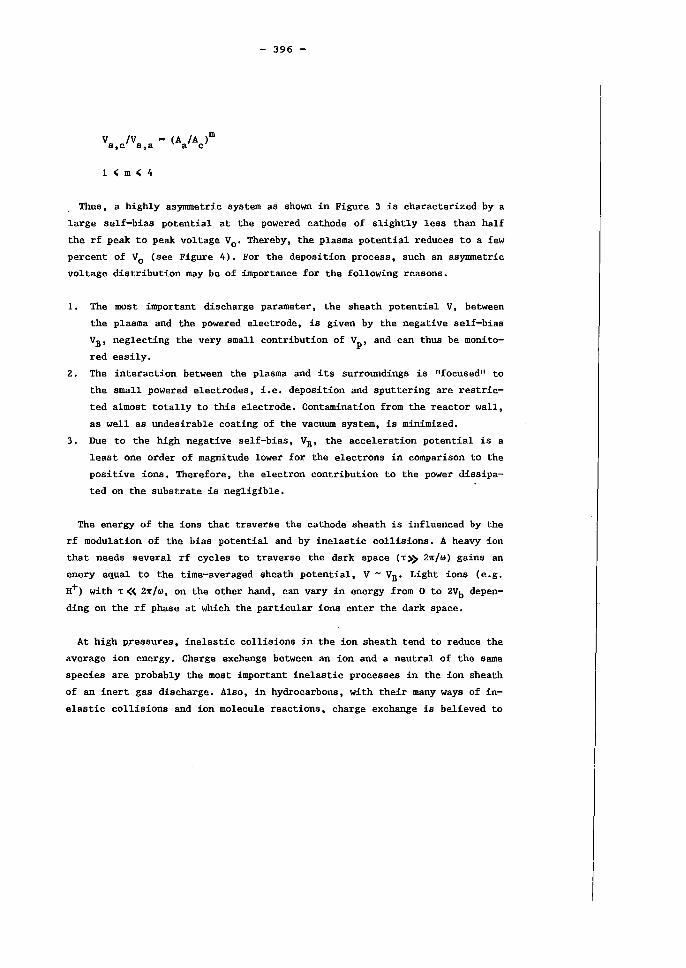
v /V S,C s,a
(A /A )m a c
- 396 -
. Thus, a highly asymmetrie system as shown in Figure 3 is characterized by a
large self-bias potential at the powered cathode of slightly less than half
the rf peak to peak voltage VO. Thereby, the plasma potential reduces to a few
percent of Vo (see Figure 4). For the deposition process, such an asymmetrie
voltage distribution may be of importance for the following reasons.
1. The most important dis charge parameter, the sheath potential V, between
the plasma and the powered electrode, is given by the negative self-bias
VB' neglecting the very small contribution of Vp ' and can thus be monito
red easily.
2. The interaction between the plasma and its surroundings is "focused" to
the small powered electrodes, i.e. deposition and sputtering are restric
ted almost totally to this electrode. Contamination from the reactor wall,
as weIl as undesirable coating of the vacuum system, is minimized.
3. Due to the high negative self-bias, VB' the acceleration potential is a
least one order of magnitude lower for the electrons in comparison to the
positive ions. Therefore, the electron contribution to the power dissipa
ted on the substrate is negligible.
The energy of the ions that traverse the cathode sheath is influenced by the
rf modulation of the bias potential and by inelastic collisions. A heavy ion
that needs several rf cycles to traverse the dark space (1:» 2'1!/(') gains an
enery equal to the time-averaged sheath potential, V - VB. Light ions (e.g.
H+) with 1: «( 2'1!/('), on the other hand, can vary in energy from 0 to 2Vb depen
ding on the rf phase at which the particular ions enter the dark space.
At high p.ressures, inelastic collisions in the ion sheath tend to reduce the
average ion energy. Charge exchange between an ion and a neutral of the same
species are probably the most important inelastic processes in the ion sheath
of an inert gas discharge. Also, in hydrocarbons, with their many ways of in
elastic collisions and ion moleeule reactions, charge exchange is believed to
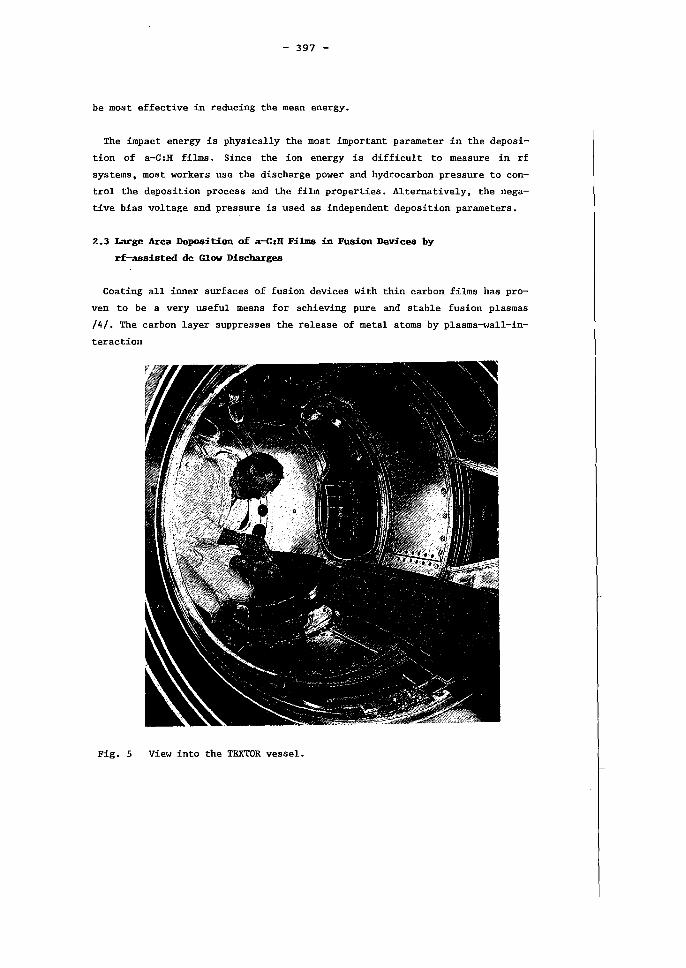
- 397 -
be moat effective in reducing the mean energy.
The impact energy ia physically the most important parameter in the deposi
tion of a-C:H films. Since the ion energy is difficult to measure in rf
systems, most workers use the dis charge power and hydrocarbon pressure to con
trol the deposition process and the film properties. Alternatively, the nega
tive bias voltage and pressure is used aa independent deposition parameters.
2.3 Large Area Depoaition of a-<::H Films in Fusion Devices by
rf-assisted dc Glow Discharges
Coating all inner surfaces of fusion devices with thin carbon films has pro
ven to be a very useful means for achieving pure and stable fusion plasmas
/4/. The carbon layer suppressea the release of metal atoms ·by plasma-wall-in
teraction
Fig. 5 View into the TEXTOR veasel.
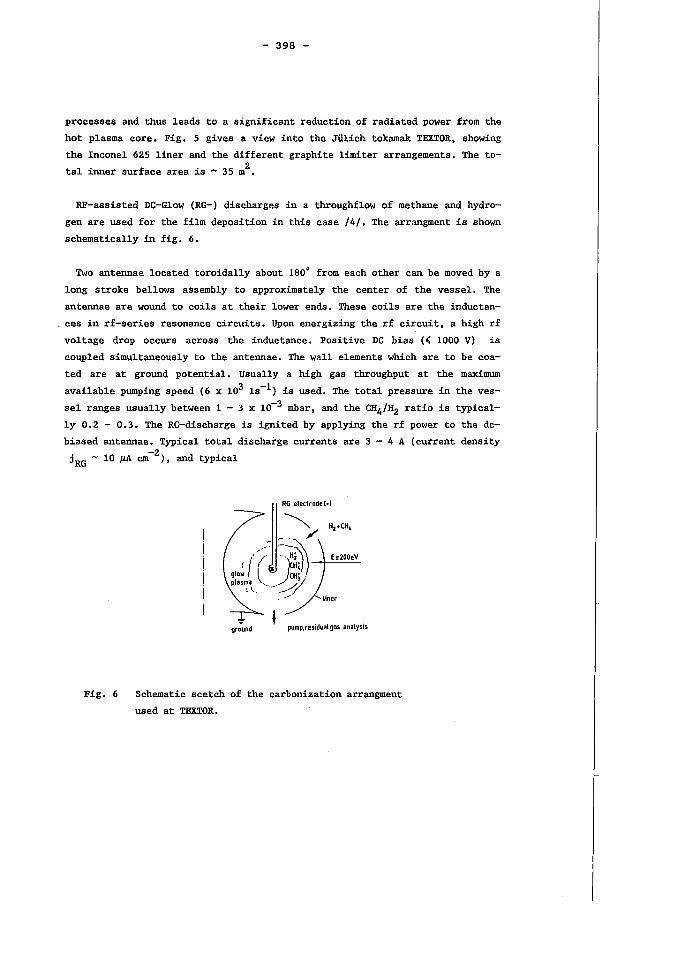
- 398 -
processes and thus leads to a significant reduction of radiated power from the
hot plasma core. Fig. 5 gives a view into the Jülich tokamak TEXTOR, showing
the Inconel 625 liner and the different graphite limiter arrangements. The to
tal inner surface area is - 35 m2•
RF-assisted DC-Glow (RG-) discharges in a throughflow of methane and hydro
gen are used for the film deposition in this case /4/. The arrangment is shown
schematically in fig. 6.
Two antennae located toroidally about 180· from each other can be moved by a
long stroke bellows assembly to approximately the center of the vessel. The
antennae are wound to coils at their lower ends. These coils are the inductan
ces in rf-series resonance circuits. Upon energizing the rf circuit, a high rf
voltage drop occurs across the inductance. Positive DC bias (.; 1000 V) is
coupled simultaneously to the antennae. The wall elements which are to be coa
ted are at ground potential. Usually a high gas throughput at the maximum
available pumping speed (6 x 10³ ls-l) is used. The total pressure in the ves
sel ranges usually between 1 - 3 x 10⁻³ mbar, and the CH41H2 ratio is typical
ly 0.2 - 0.3. The RG-discharge is ignited by applying the rf power to the dc
biased antennae. Typical total dis charge currents are 3 - 4 A (current density
jRG - 10 ~ cm-2 ), and typical
Fig. 6
ground pump,residual gas analysis
Schematic scetch of the carbonization arrangment
used at TEXTOR.
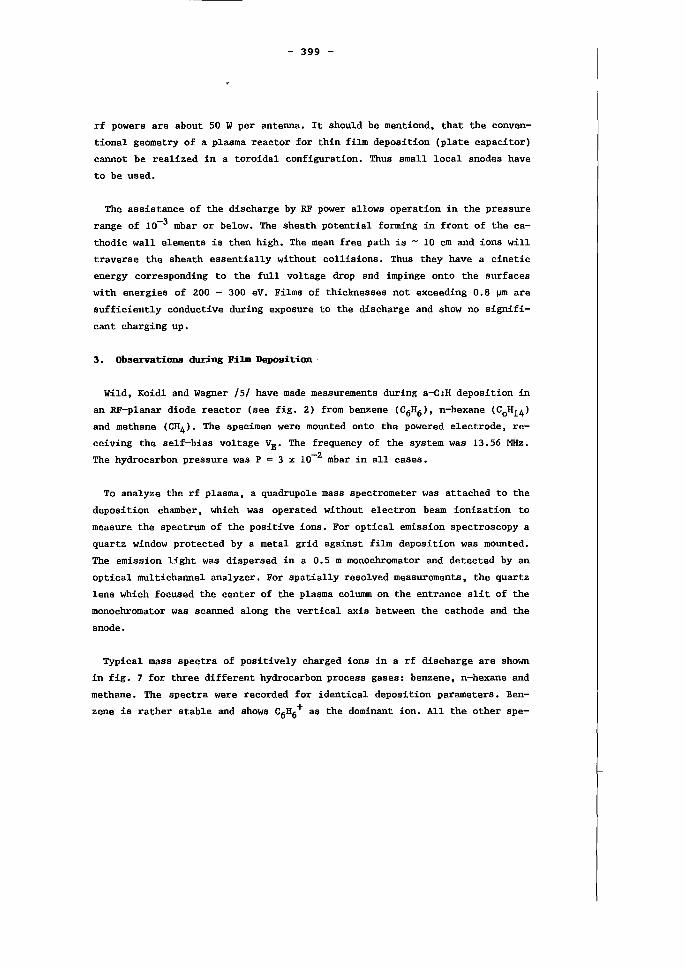
- 399 -
rf powers are ab out 50 W per antenna. It should be mentiond, that the conven
tional geometry of a plasma reactor for thin film deposition (plate capacitor)
cannot be realized in a toroidal configuration. Thus small local anodes have
to be used.
The assistance of the dis charge by RF power allows operation in the pressure
range of 10-3 mbar or below. The sheath potential forming in front of the ca
thodic wall elements is then high. The mean free path is - 10 cm and ions will
traverse the sheath essentially without collisions. Thus they have a cinetic
energy corresponding to the full voltage drop and impinge onto the surfaces
with energies of 200 300 eV. Films of thicknesses not exceeding 0.8 ~ are
sufficiently conductive during exposure to the dis charge and show no signifi
cant charging up.
3. observations during Film Deposition .
Wild, Koidl and Wagner /5/ have made measurements during a-C:H deposition in
an RF-planar diode reactor (see fig. 2) from benzene (C6H6 ), n-hexane (CoH14 )
and methane (CH4). The specimen were mounted onto the powered electrode, re
ceiving the self-bias voltage VB' The frequency of the system was 13.56 MHz.
The hydrocarbon pressure was P = 3 x 10⁻² mbar in all cases.
To analyze the rf plasma, a quadrupole mass spectrometer was attached to the
deposition chamber, which was operated without electron beam ionization to
measure the spectrum of the positive ions. For optical emission spectroscopy a
quartz window protected by a metal grid against film deposition was mounted.
The emission light was dispersed in a 0.5 m monochromator and detected by an
optical multichannel analyzer. For spatially resolved measurements, the quartz
lens which focused the center of the plasma columm on the entrance slit of the
monochromator was scanned along the vertical axis between the cathode and the
anode.
Typical mass spectra of positively charged ions in a rf dis charge are shown
in fig. 7 for three different hydrocarbon process gases: benzene, n-hexane and
methane. The spectra were recorded for identical deposition parameters. Ben
zene is rather stable and shows C6H6+ as the dominant ion. All the other spe-
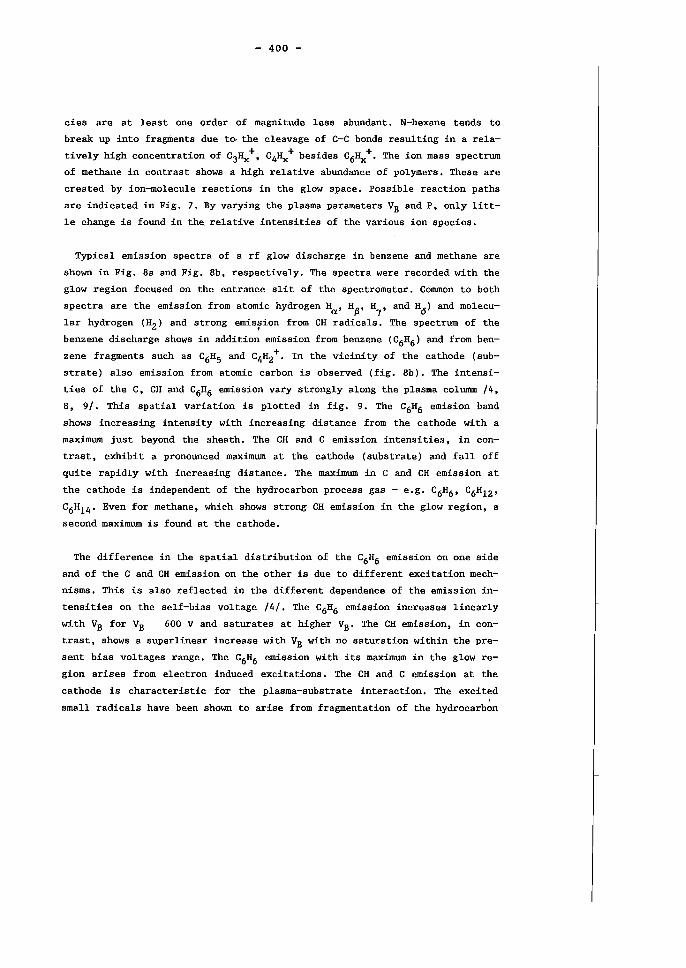
- 400 -
ci es are at least one order of magnitude less abundant. N-hexane tends to
break up into fragments due to the cleavage of C-C bonds resulting in a rela
tively high concentration of C3HX+, C4HX+ besides C6HX+. The ion mass spectrum
of methane in contrast shows a high relative abundance of polymers. These are
created by ion-molecule reactions in the glow space. Possible reaction paths
are indicated in Fig. 7. By varying the plasma parameters VB and P, only litt
le change is found in the relative intensities of the various ion species.
Typical emission spectra of a rf glow dis charge in benzene and methane are
shown in Fig. 8a and Fig. 8b, respectively. The spectra were recorded with the
glow region focused on the entrance slit of the spectrometer. Common to both
spectra are the emission from atomic hydrogen Ha' Hß, H1
, and H6 ) and molecu
lar hydrogen (HZ) and strong emis~ion from CH radicals. The spectrum of the
benzene dis charge shows in addition emission from benzene (C6H6) and from ben
zene fragments such as C6HS and C4HZ+. In the vicinity of the cathode (sub
strate) also emission from atomic carbon is observed (fig. 8b). The intensi
ties of the C, CH and C6H6 emission vary strongly along the plasma columm /4,
8, 9/. This spatial variation is plotted in Hg. 9. The C6H6 emision band
shows increasing intensity with increasing distance from the cathode with a
maximum just beyond the sheath. The CH and C emission intensities, in con
trast, exhibit a pronounced maximum at the cathode (substrate) and fall off
quite rapidly with increasing distance. The maximum in C and CH emission at
the cathode is independent of the hydrocarbon process gas - e.g. C6H6 , C6H1Z '
C6H14 • Even for methane, which shows strong CH emission in the glow region, a
second maximum is found at the cathode.
The difference in the spatial distribution of the C6H6 emission on one side
and of the C and CH emission on the other is due to different excitation mech
nisms. This is also reflected in the different dependence of the emission in
tensities on the self-bias voltage /4/. The C6H6 emission increases linearly
with VB for VB 600 V and saturates at higher VB. The CH emission, in con
trast, shows a superlinear increase with VB with no saturation within the pre
sent bias voltages range. The C6H6 emission with its maximum in the glow re
gion arises from electron induced excitations. The CH and C emission at the
cathode is characteristic for the plasma-substrate interaction. The excited
small radicals have been shown to arise from fragmentation of the hydrocarbon
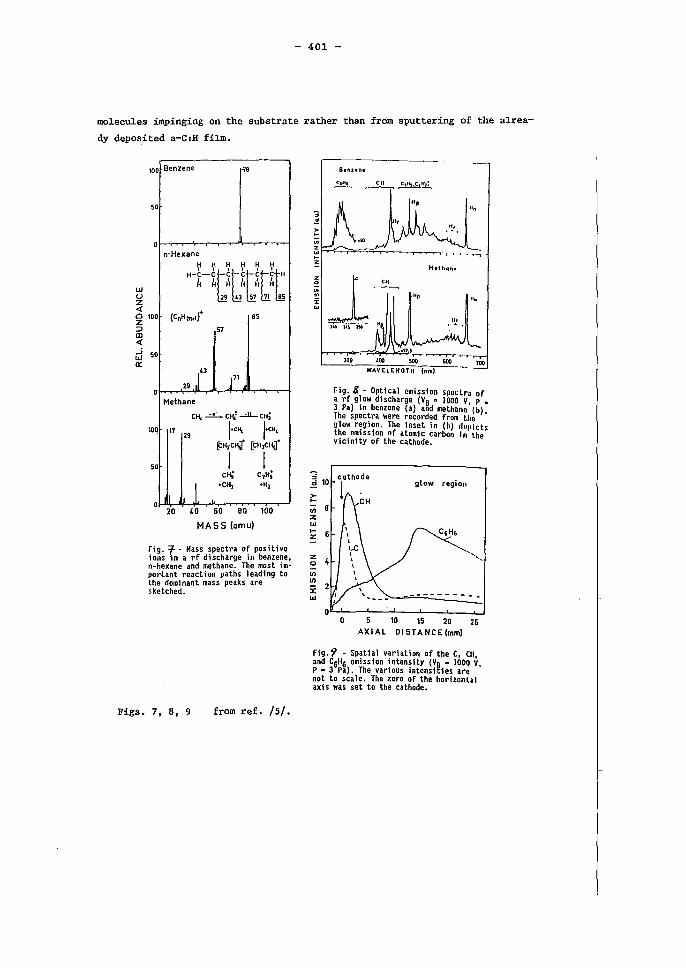
- 401 -
mo1ecules impinging on the substrate rather than from sputtering of the alrea
dy deposited a-C:H film.
10 o Benzene -78
0
0 n-Hexane
H-b-bt~t~t~t~t ~ H H H H H 29 '3 57 71 85
UJ U z « 010 Z
0 (CnH2no,t 85
::l al « --i UJ Ir
57
0
29 ,r l Methane
eH, ....:..!:...- cHi .....:..l!..- CHi q 17
29 '.e", reH, ~HjC~ [CH,CHt
10
0 I I eH; C2H:
I, .. eH) .H,
20 40 60 BO 100
MASS (emu)
Fig. t - Hass spectra of positive ions 1n a rf discharge in benzene, n-hexane .nd methane. The most important reaction paths leading to lhe dominant mass peaks are skelched.
Figs. 7, 8, 9 from ref. /5/.
> ~
UI
~~~~~~~~~~~~~ Z
Hethan-
i r ~UHP 11.
~ 11, 214 115 7JO ~ , ...
;; 10 ..!!
>-0-
ll)
Z tu 0-Z
Z 0
lI) lI)
i tu
~.U.5
300 '00 500 600 700
WAYELEHGTH (nm)
Fig.8 - Optical emission spoctr. of a rf glow discharge (VB' 1000 V, P • 3 Pa) in benzene (a) .nd methano (b) The spectra were recorded from lho . glow region. The inset in (b) 1IIIIIIcts the emission of atomic carbon In lhe vicinity of the cathode.
glow region
-------- .. -
o 10 15 20 25 AXIAL DISTANCE(mm)
Fig.9 - Spatial variation of the C, CII and C6H6 emission intensity (VB' 1000 Y P • 3 Pa). The various intensities are ' not to scale. The zero of the horizonhl axis was set to the cathode.
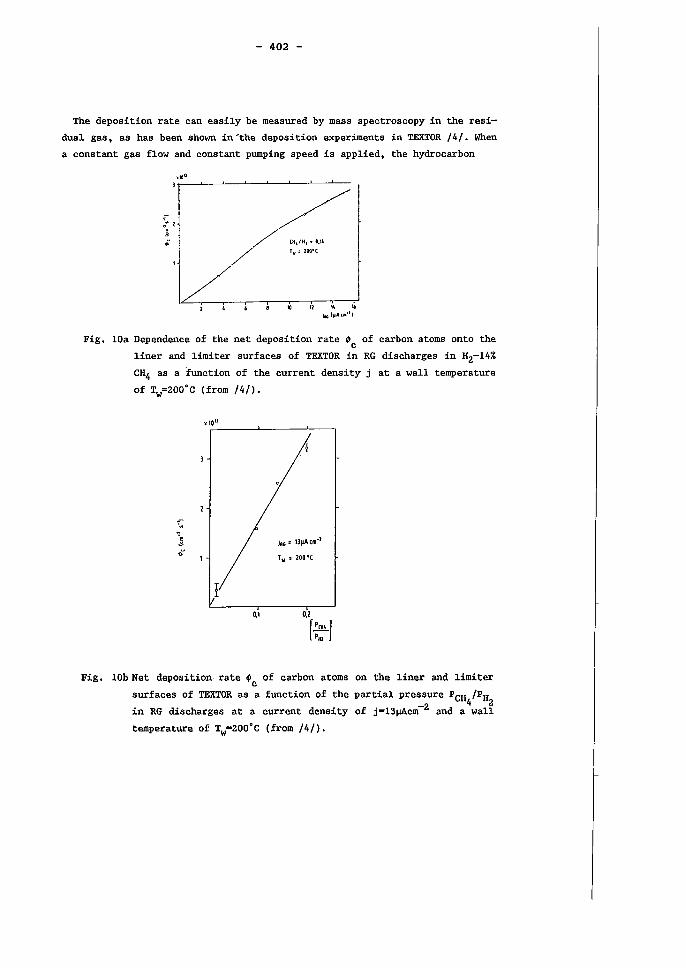
- 402 -
The deposition rate can easily be measured by mass spectroscopy in the resi
dual gas, as has been shown in'the deposition experiments in TEXTOR /4/. When
a constant gas flow and constant pumping speed is applied, the hydrocarbon
.~. lr-__ ~~ __ -L __ ~ __ ~ __ L-~ __ _
1I 12 110 16 i. h.lA,.·I,
Fig. 10a Dependence of the net deposition rate ~c of carbon atoms onto the
liner and limiter surfaces of TEXTOR in RG discharges in HZ-14%
CH4 as a function of the current density j at a wall temperature
of Tw=ZOO·C (from /4/).
I
JAG;: 13l1Acm·1
T.., =- 20QO(
0,1 0,2
r::'J Fig. Wb Net deposition, rate ~ c of carbon atoms on the liner and limiter
surfaces of TEXTOR as a function of the partial pressure PCH /PH 4 Z in RG discharges at a current density of j=13f.U\cm-Z and a wall
temperature of Tw=ZOO·C (from /4/).
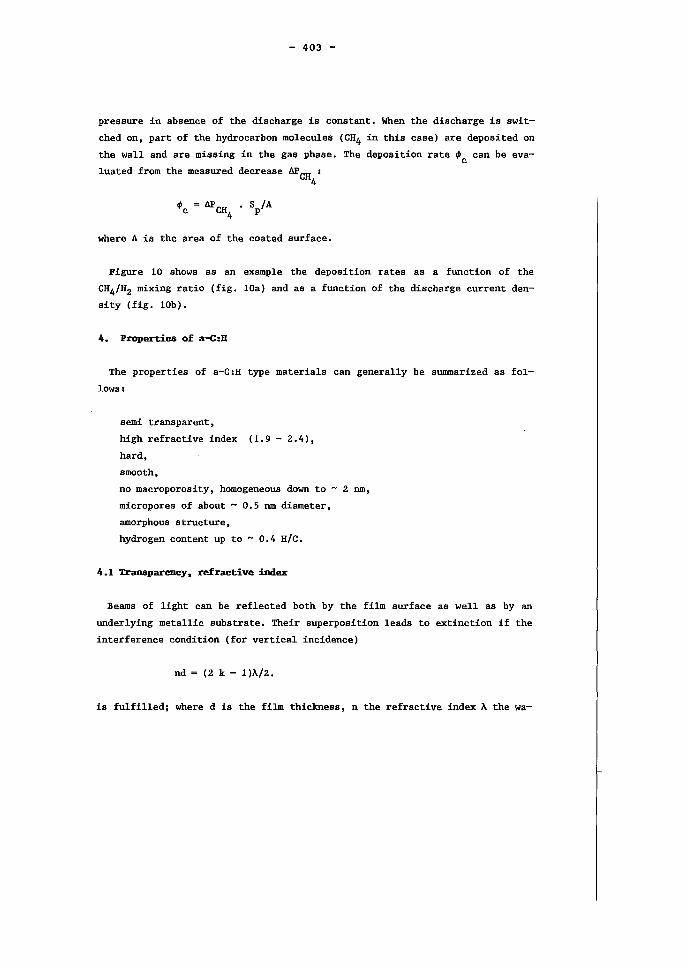
- 403 -
pressure in absence of the discharge is constant. When the discharge is swit
ched on, part of the hydrocarbon molecules (CH4 in this case) are deposited on
the wall and are missing in the gas phase. The deposition rate ~c can be eva
luated from the measured decrease APCH : 4
~c APCH 4
where A is the area of the coated surface.
Figure 10 shows as an example the deposition rates as a function of the
CH4/H2 mixing ratio (fig. 10a) and as a function of the dis charge current den
sity (fig. lOb).
4. Propertiea of a-C:H
The properties of a-C:H type materials can generally be summarized as fOl
lows:
semi transparent,
high refractive index (1.9 - 2.4),
hard,
smooth,
no macroporosity, homogeneous down to - 2 nm,
micropores of about - 0.5 nm diameter,
amorphous structure,
hydrogen content up to - 0.4 H/c.
4.1 Transparency. refractive index
Beams of light can be reflected both by the film surface as weIl as by an
underlying metallic substrate. Their superposition leads to extinction if the
interference condition (for vertical incidence)
nd (2 k - 1)A/2.
is fulfilled; where d is the film thickness, n the refractive index A the wa-
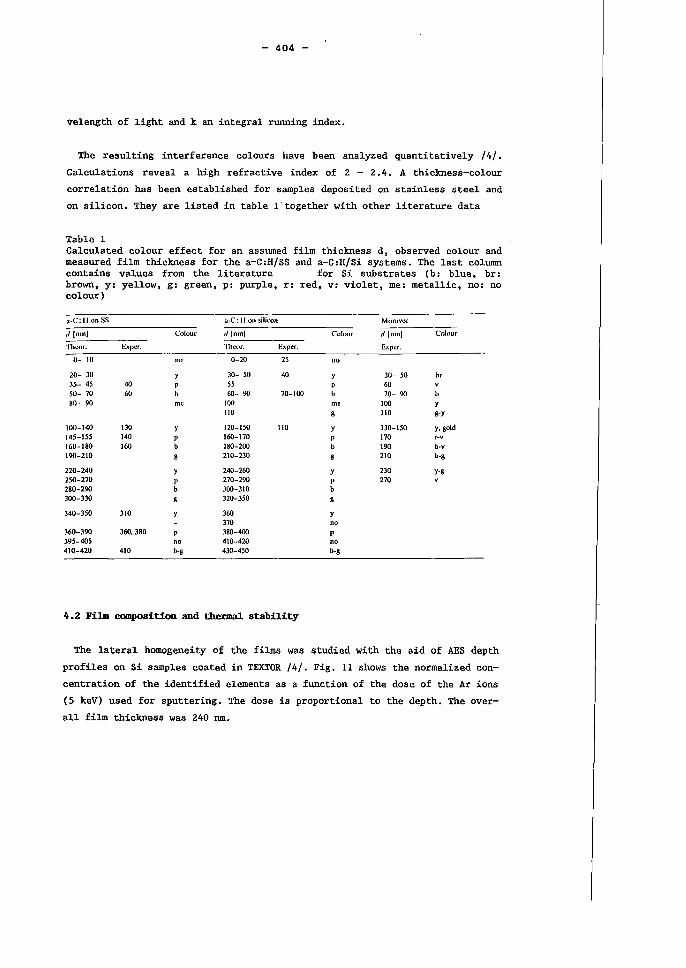
- 404 -
~elength of light and k an integral running index.
The resulting interference colours have been analyzed quantitatively /4/.
Calculations reveal a high refractive index of 2 - 2.4. A thickness-colour
correlation has been established for samples deposited on stainless steel and
on silicon. They are listed in table 1 together with other literature data
Table 1 Calculated colour effect for an assumed film thickness d, observed colour and measured film thickness for the a-C:H/SS and a-C:H/Si systems. The last column contains values from the literature for Si substrates (b: blue, br: brown, y: yellow, g: green, p: purple, r: red, v: violet, me: metallic, no: no colour)
;I'C: 11 on SS a·C: 11 Oll silicon Mowvcc
d Inml Colour Illnml Colour I1 (nml Colour
Tlu':llr. Expcr. Thcor. Expcr. Expcr.
0- 10 0-20 25 no
20- 30 30- SO 40 30- 50 hr J5- 45 40 55 p 60 sO- 70 60 60- 90 70-100 b 70- 90 KO- 90 mc 100 100
110 g 110 g-y
100-140 130 120-150 JlO y 130-150 y. gold 145-155 140 160-170 170 r-v 160-180 160 180-200 190 b-v 190-210 210-230 210 bog
220-240 240-260 Y 230 y-g 250-270 P 270-290 p 270 280-290 b 300-310 b 300-330 320-350
340-350 310 360 y 370 no
360-390 360.380 380-400 395-405 no 410-420 no 410-420 410 bog 430-450 bog
4.2 Film compositianand thermal stability
The lateral homogeneity of the films was studied with the aid of AES depth
profiles on Si samples coated in TEXTOR /4/. Fig. 11 shows the normalized con
centration of the identified elements as a function of the dose of the Ar ions
(5 keV) used for sputtering. The dose is proportional to the depth. The over
all film thickness was 240 nm.
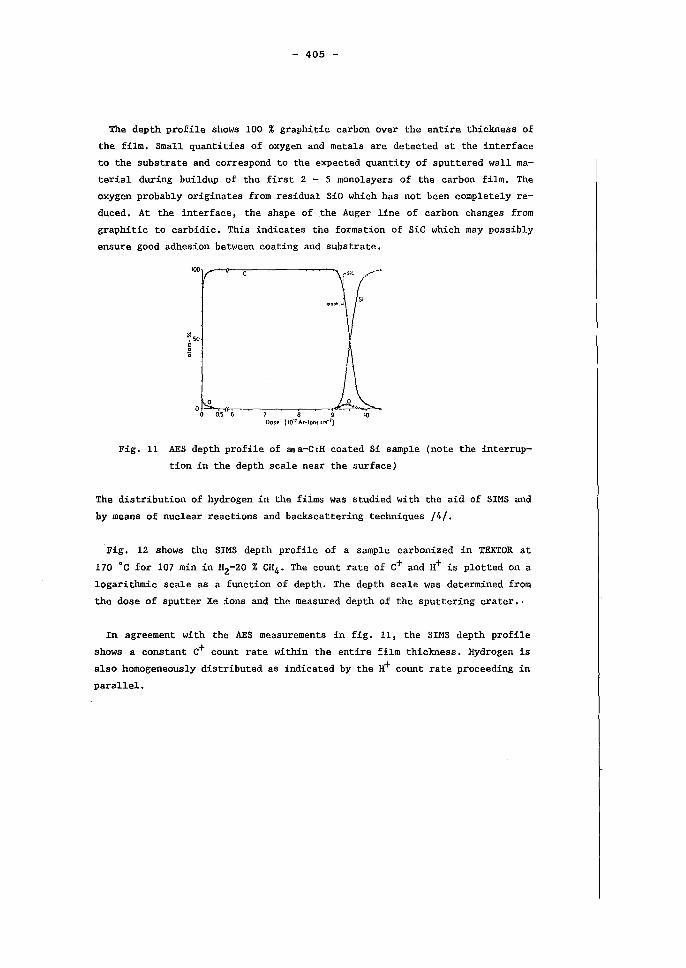
- 405 -
The depth profile shows 100 % graphitic carbon over the entire thickness of
the film. Sma11 quantities of oxygen and metals are detected at the interface
to the substrate and correspond to the expected quantity of sputtered wall ma
terial during bui1dup of the first 2 - 5 mono1ayers of the carbon film. The
oxygen probab1y originates from residual SiO which has not been comp1ete1y re
duced. At the interface, the shape of .the Auger 1ine of carbon changes from
graphitic to carbidic. This indicates the formation of SiC which may possib1y
ensure good adhesion between coating and substrate.
100
B 9 10 Dose (1017 Ar-Ions em-ll
Fig. 11 AES depth profile of ~a-C:H coated Si samp1e (note the interrup
tion in the depth sca1e near the surfacel
The distribution of hydrogen in the films was studied with the aid of SIMS and
by means of nuc1ear reactions and backscattering techniques /4/.
·Fig. 12 shows the SIMS depth profile of a samp1e carbonized in TEXTOR at
170 oe for 107 min in H2-20 % CH4• The count rate of C+ and H+ is plotted on a
10garithmic sca1e as a function of depth. The depth sca1e was determined from
the dose of sputter Xe ions and the measured depth of the sputtering crater.-
In agreement with the AES measurements in fig. 11, the SIMS depth profile
shows a constant C+ count rate within the entire =i1m thickness. Hydrogen is
also homogeneous1y distributed as indicated by the H+ count rate proceeding in
parallel.
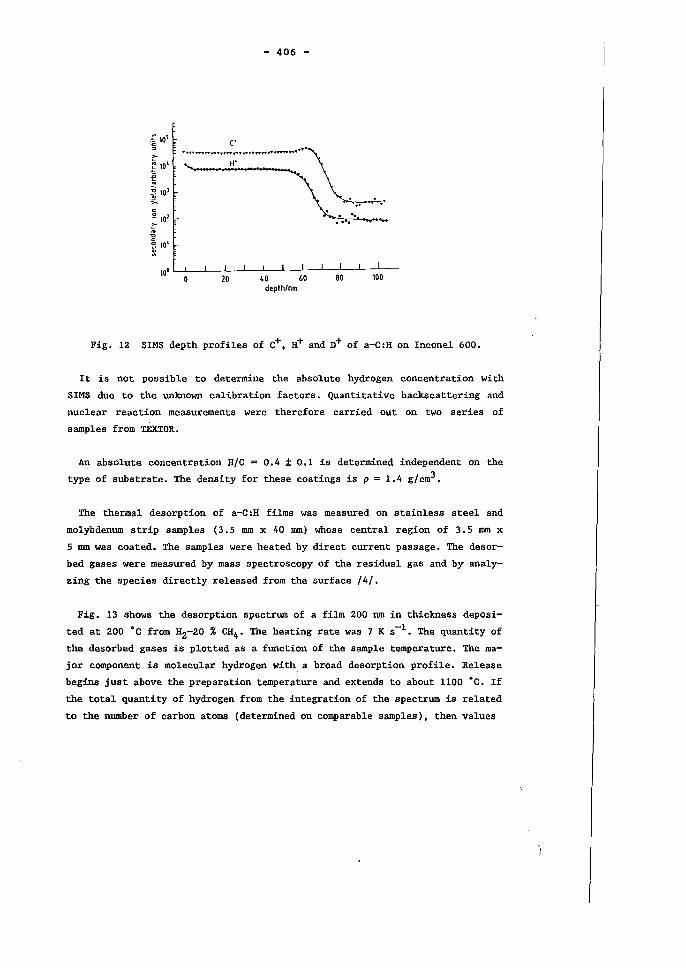
:~ IO~ 5
- 406 -
c .• ~ " ...................... ..-."",..,. ...... " .... ",..,."" ........................... H'
~ ~." .. . '. .... ..
10' LL-~-.l10-J.--..J4LO_L--6-'-O-..L-8-'O--'----:::10':-O
depth/nm
Fig. 12 SIMS depth profiles of C+, H+ and n+ of a-C:H on Inconel 600.
It is not possible to determine the absolute hydrogen concentration with
SIMS due to the unknown calibration factors. Quantitative backscattering and
nuclear reaction measurements were therefore carried out on two series of
samples from TEXTOR.
An absolute concentration H/C = 0.4 ± 0.1 is determined independent on the
type of substrate. The density for these coatings is p = 1.4 g/cm3.
The thermal desorption of a-C:H films was measured on stainless steel and
molybdenum strip samples (3.5 mm x 40 mm) whose central region of 3.5 mm x
5 mm was coated. The samples were heated by direct current passage. The desor
bed gases were measured by mass spectroscopy of the residual gas and by analy
zing the species directly released from the surface /4/.
Fig. 13 shows the desorption spectrum of a film 200 nm in thickness deposi
ted at 200 ·C from H2-20 % CH4• The heating rate was 7 K s-l. The quantity of
the desorbed gases is plotted as a function of the sample temperature. The ma
jor component is molecular hydrogen with. a broad desorption profile. Release
begins just above the preparation temperature and extends to about 1100 ·C. If
the total quantity of hydrogen from the integration of the spectrum is related
to the number of carbon atoms (determined on comparable samples), then values
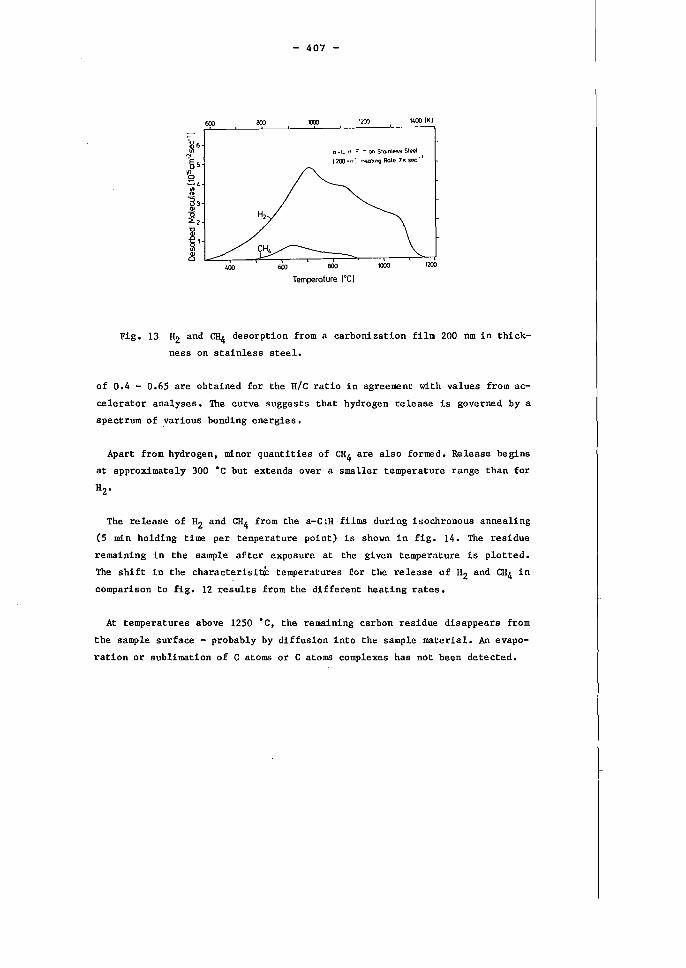
600 eoo
'00
- 407 -
°al "00 IKI
o - c ~ = -. on Sla.nless Sleel _ I
1200 .... T: ~hng Rote 7 K sec
600 800 1000
Temperoture I'CI
1200
Fig. 13 H2 and CH4 desorption from a carbonization film 200 nm in thick
ness on stainless steel.
of 0.4 - 0.65 are obtained for the H/c ratio in agreement with values from ac
celerator analyses. The curve suggests that hydrogen release is governed by a
spectrum of various bonding energies.
Apart from hydrogen, minor quantities of CH4 are also formed. Release begins
at approximately 300 ·c but extends over a smaller temperature range than for
H2 •
The release of H2 and CH4 from the a-C:H films during isochronous annealing
(5 min holding time per temperature point) is shown in fig. 14. The residue
remaining in the sampIe after exposure at the given temperature is plotted.
The shift in the characterisibC temperatures for the release of H2 and CH4 in
comparison to fig. 12 results from the different heating rates.
At temperatures above 1250 ·c, the remaining carbon residue disappears from
the sample surface - probably by diffusion into the sampIe material. An evapo
ration or sublimation of C atoms or C atoms complexes has not been detected.
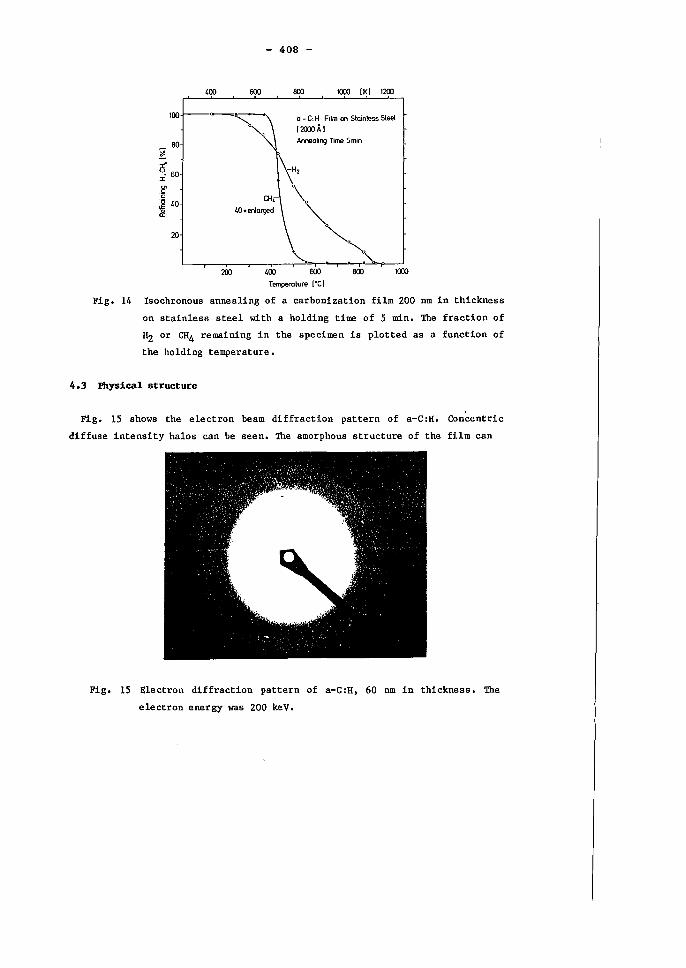
- 408 -
400 600 800 1000 IKI 1200
""'-0 100 r---~-';::::'-l o - C· H Film on Slainless Sieel
1200JÄI
80 ~HAnne2 aling Time Sm;n ~
er 60 r
:[ 40 01\\0 ~ 40. enlarged ""
~ ,,~ 200 400 600 800 1000
Temperalure I'CI
Fig. 14 Isochronous annealing of a carbonization film 200 nm in thickness
on stainless steel with a holding time of 5 min. The fraction of
H2 or CH4 remaining in the specimen is plot ted as a function of
the holding temperature.
4.3 Physical structure
Fig. 15 shows the electron beam diffraction pattern of a-C:H. Concentric
diffuse intensity halos can be seen. The amorphous structure of the film can
Fig. 15 Electron diffraction pattern of a-C :H, 60 nm in thickness. The
electron energy was 200 keV.
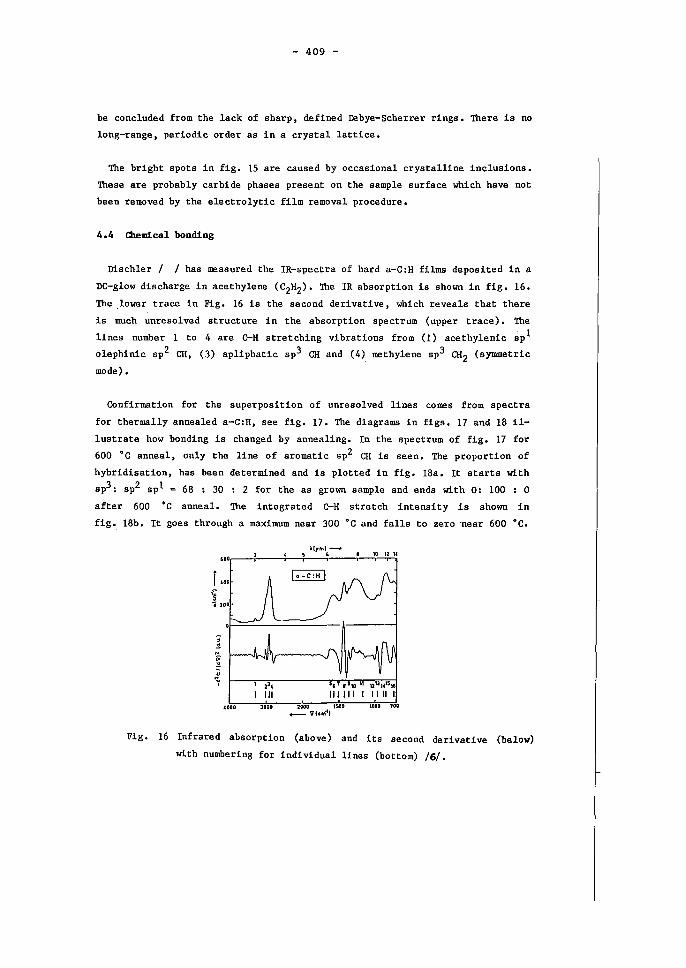
- 409 -
be concluded from the lack of sharp, defined Debye-Scherrer rings. There is no
long-range, periodic order as in a crystal lattice.
The bright spots in fig. 15 are caused by occasional crystalline inclusions.
These are probably carbide phases present on the sampie surface which have not
been removed by the electrolytic film removal procedure.
4.4 Olemlcal bonding
Dischler / / has measured the IR-spectra of hard a-C:H films deposited in a
DC-glow discharge in acethylene (C2H2). The IR absorption is shown in fig. 16.
The .lower trace in Fig. 16 is the second derivative, which reveals that there
is much unresolved structure in the absorption spectrum (upper trace). The
lines number 1 to 4 are C-H stretching vibrations from (1) acethylenic spl
olephinie sp2 CH, (3) apliphatic sp3 CH and (4) methylene sp3 CH2 (symmetrie
mode).
Confirmation for the superposition of unresolved lines comes from spectra
for thermally annealed a-C:H, see fig. 17. The diagrams in figs. 17 and 18 il
lustrate how bonding is changed by annealing. In the spectrum of fig. 17 for
600°C anneal, only the line of aromatic sp2 CH is seen. The proportion of
hybridisation, has been determined and is plotted in fig. 18a. It starts with
sp3: sp2 spl = 68 : 30 : 2 for the as grown sampie and ends with 0: 100 : 0
after 600°C anneal. The integrated C-H stretch intensity is shown in
fig. 18b. It goes through a maximum near 300°C and falls to zero "near 600°C.
J.lpmJ ---,10
00',---:------;.-+---1';---;..-':;:.'-':;.'.,"
f 400
~ .. 200
uoo lOOO 2000 1500 <t- y{cm-l,
1000 100
Fig. 16 Infrared absorption (above) and its second derivative (below)
with numbering for individual lines (bottom) /6/.
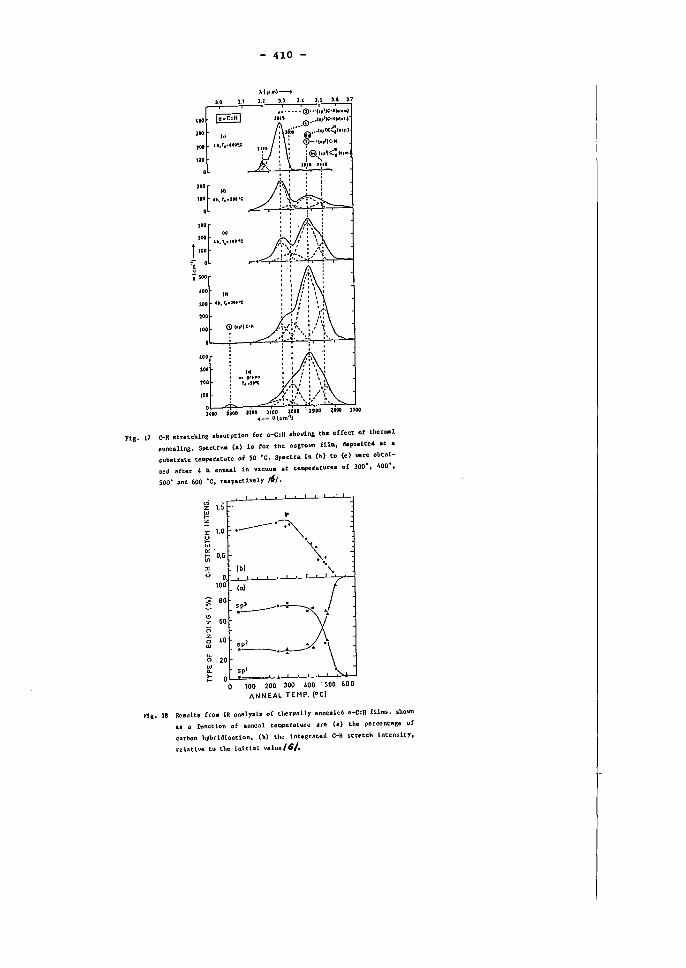
- 410 -
~"II")--to
3.0 :1.1 3.2 3.3 U 3.5 :u n
&0' ]0'
,., ]O.~ 20' 110
• ".1 •• '"''
-:~ 0
ü Soo ... ,. 300 u.T,,_lI'-C
20'
10'
... ]0'
20'
10'
,.·····(i)···h.IJt·H .. lt~
" •••• <D ••• II,lle:;"'tf.1 ~ ~ ••• II,'tC"'tCI .. r.J
: <P .. oll,IIC'H
:®.~"'1C::::h'fIL n.n n,u
~,oo ;300 3200 3100 3000 "2IDO ~.oo 2100 +-.9(c",o1)
F1g. 17 C-H stretching absorption for a-C:H shoving the effect of thermal
anoeaBng. spectrull Ca) 18 for the asgrown fUII, depos1ted at a
substrate tellperature of 50 ·C. Spectra in (b) co (e) V!re obtai
ned after 4 h aoneal in yaCUUII at temperatures of 300', 400' f
500' and 600 ·c, respectlvely Jtl ..
~ 1.5 w ... z:
100 200 JOD LOO 500 600
ANNEAL TEMP. (Oel
F1g. 18 Re8ults fro. [R analysls of thermally annealed a-C:H fUns. shown
as a functlon of anneal telllperature are <a> the percentsge of
carbon hybrldlsatioR. (b) the integrated C-H stretch lntensity,
relatlve u the initial value/6/.
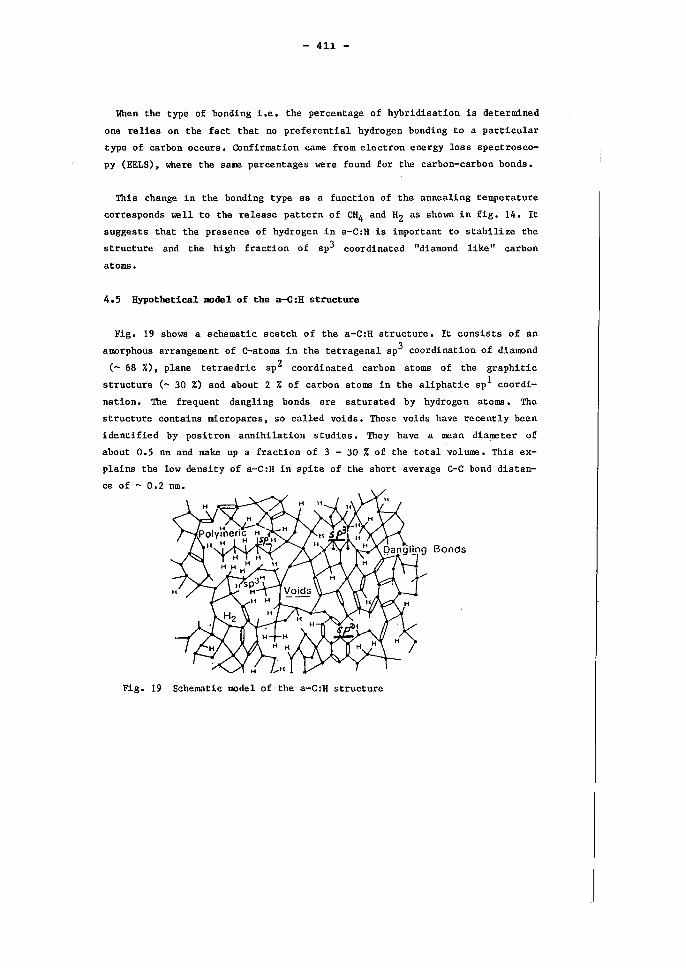
- 411 -
When the type of bonding i.e. the percentage of hybridisation is determined
one re lies on the fact that no preferential hydrogen bonding to a particular
type of carbon occurs. Confirmation came from electron energy loss spectrosco
py (EELS), where the same percentages were found for the carbon-carbon bonds.
This change in the bonding type as a function of the annealing temperature
corresponds well to the release pattern of CH4 and H2 as shown in fig. 14. It
suggests that the presence of hydrogen in a-C:H is important to stabilize the
structure and the high fraction of sp3 coordinated "diamond like" carbon
atoms.
4.5 Hypothetical model of the a-C:H structure
Fig. 19 shows a schematic scetch of the a-C:H structure. It consists of an
amorphous arrangement of C-atoms in the tetragenal sp3 coordination of diamond
(~ 68 %), plane tetraedric sp2 coordinated carbon atoms of the graphitic
structure (~ 30 %) and about 2 % of carbon atoms in the aliphatic sp1 coordi
nation. The frequent dangling bonds are saturated by hydrogen atoms. The
structure contains micropares, so called voids. These voids have recently been
identified by positron annihilation studies. They have a mean dia~ter of
about 0.5 nm and make up a fraction of 3 - 30 % of the total volume. This ex
plains the low density of a-C:H in spite of the short average C-C bond distan
ce of ~ 0.2 nm.
Bonds
Fig. 19 Schematic model of the a-C:H structure
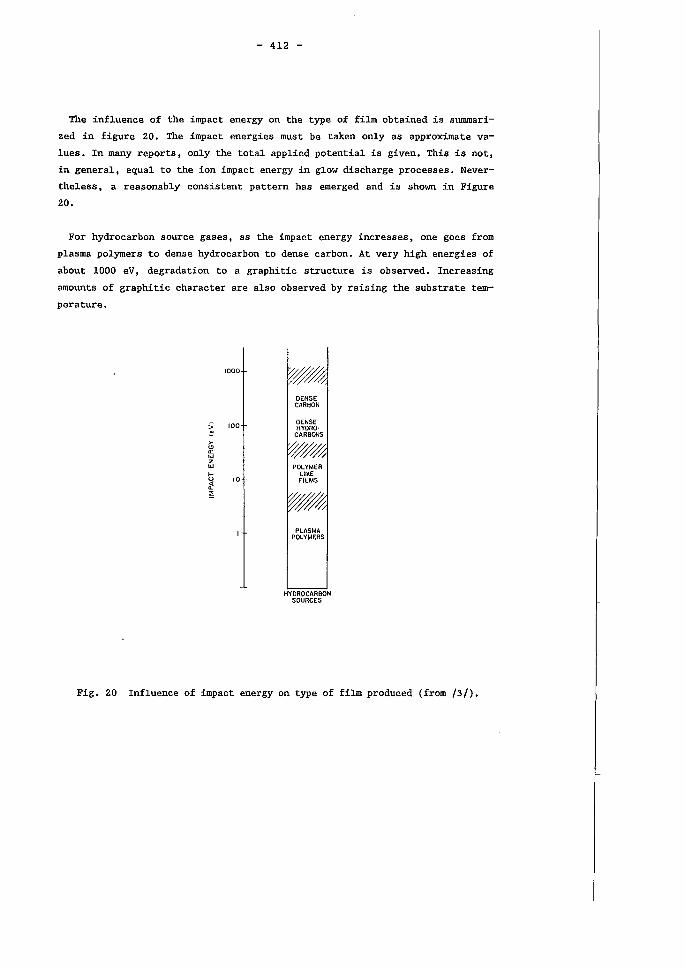
- 412 -
The inf1uence of the impact energy on the type of film obtained is summari
zed in figure 20. The impact energies must be taken only as approximate va
lues. In many reports, only the total applied potential is given. This is not,
in general, equal to the ion impact energy in glow discharge processes. Never
the1ess, a reasonably consistent pattern has emerged and is shown in Figure
20.
For hydrocarbon source gases, as the impact energy increases, one goes from
plasma polymers to dense hydrocarbon to dense carbon. At very high energies of
about 1000 eV, degradation to a graphitic structure is observed. Increasing
amounts of graphitic character are also observed by raising the substrate tem
perature.
1000
~ 100
>-'" Ir W Z w t-u 10 rt ;:;:
W~ DENSE CARBON
OENSE HYDRO·
CARBONS
~ POLYMER
LlKE FILMS
W PLASMA
POLYMERS.
HYDROCARBON SOURCES
Fig. 20 Influence of impact energy on type of film produced (from /3/).
- 413 -
The preferential accumulation of sp3 coordinated carbon atoms in a-C:H may
be exp1ained by considering sputter processes.
Tetrahedrally bonded (sp3) structures are assumed to be more resistant to
sputtering than trigonally bonded graphi tic precursors. The ion flux to the
growing surface serves both as a source of new material and as an agent for
resputtering non-sp3 structures, e.g., graphitic and olefinic nuclei. This
hypothesis is supported by the relative energies of the various processes.
The energies of importance to film growth are listed in Table 2. It is very
suggestive that the typical impact energies, from 50 to 500 eV. are just above
the sputtering thresho1d for carbon, at the reported displacement energies,
and very significantly below the energy where the sputter yield is greater
than unity. These considerations indicate that both sputtering and deposition
take place simultaneously during film growth.
Table 2: Energies of various processes
displacement energy for carbon in diamond 80 eV
displacement energy for carbon in graphite 25 eV
thresho1d energy for graphite sputtering 15 eV
minimum energy for a-C:H formation 50 eV
4.6 Adhesion to the Substrate
Adhesion of a-C:H films depends on the substrate material, its pretreatment,
the thickness of the film and on the ambient atmosphere /4/. It is difficult
to quantify and thus systematically study the adhesion. Reference is essen
tially made here to the optical intactness and smoothness of the film, as well
as to its wipe and scratch resistance. Films fu1filling these criteria are re
garded as adhering wel1.
In general, is is not possible to produce any films with good adhesion on
very contaminated surfaces and on surfaces with a large fr action of easily re
ducible oxide, such as CuO. For this reason, carful mechanical cleaning (ul-
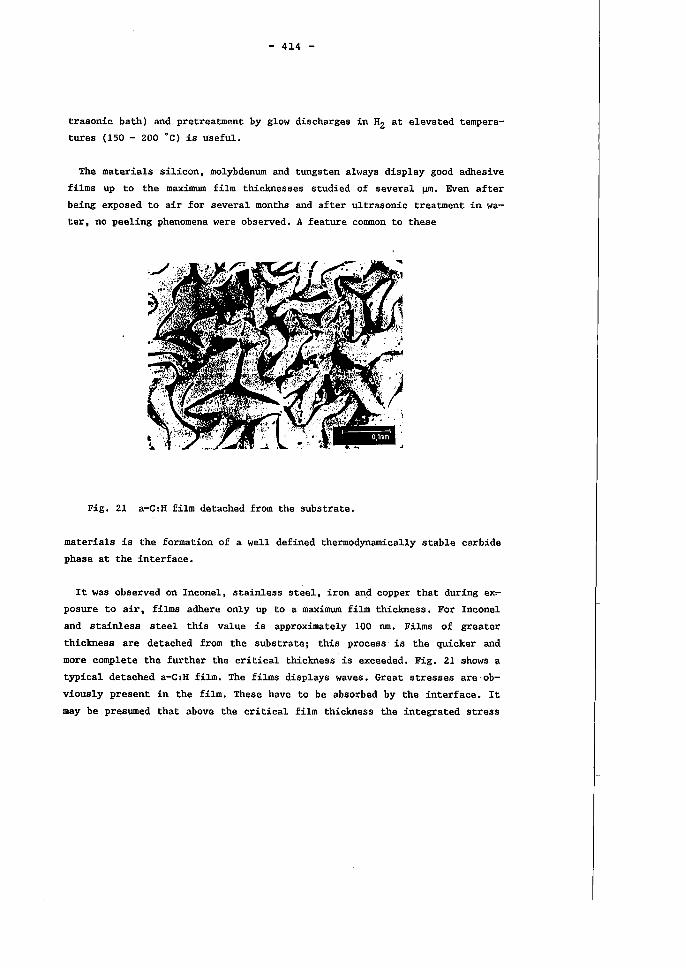
- 414 -
trasonic bath) and pretreatment by glow discharges in H2 at elevated tempera
tures (150 - 200 ·C) is useful.
The materials 'silicon, molybdenum and tungsten always display good adhesive
films up to the maximum film thicknesses studied of several ~. Even after
being exposed to air for several months and after ultrasonic treatment in wa
ter, no peeling phenomena were observed. A feature common to these
Fig. 21 a-C:H film detached from the substrate.
materials is the formation of a well defined thermodynamically stable carbide
phase at the interface.
It was observed on Inconel, stainless steel, iron and copper that during ex~
posure to air, films adhere only up to a maximum film thickness. For Inconel
and stainless steel this value is approximately 100 nm. Films of greater
thickness are detached from the substrate; this process is the quicker and
more complete the further the critical thickness is exceeded. Fig. 21 shows a
typical detached a-C:H film. The films displays waves. Great stresses are ob
viously present in the film. These have to be absorbed by the interface. It
may be presumed that above the critical film thickness the integrated stress
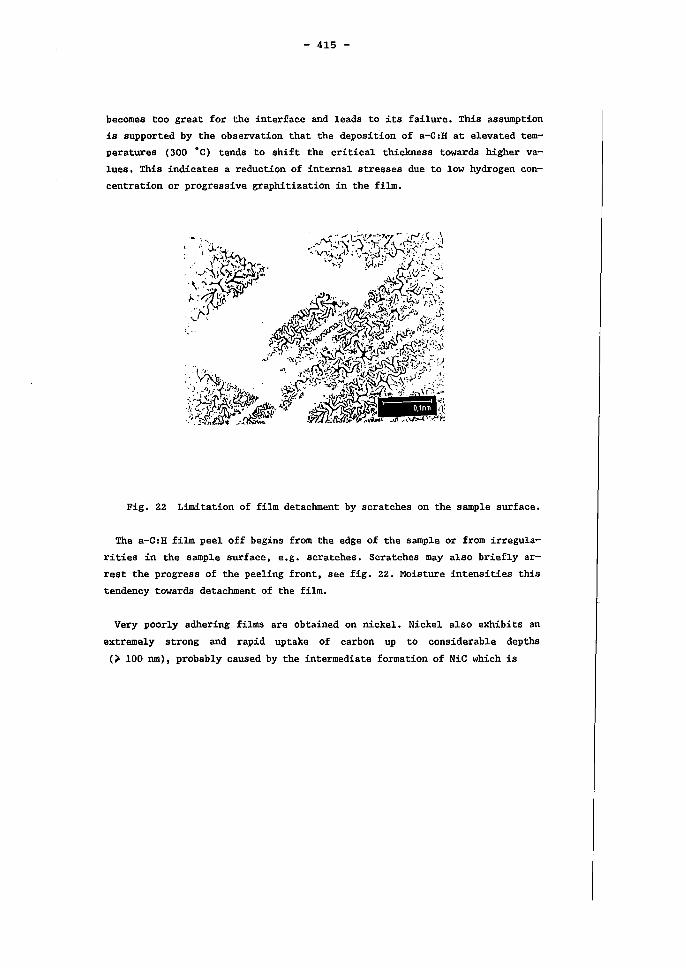
- 415 -
becomes too great for the interface and leads to its failure. This assumption
is supported by the observation that the deposition of a-C:H at elevated tem
peratures (300 ·C) tends to shift the critical thickness towards higher va
lues. This indicates a reduction of internal stresses due to low hydrogen con
centration or progressive graphitization in the film.
Fig. 22 Limitation of film detachment by scratches on the sample surface.
The a-C:H film peel off begins from the edge of the sample or from irregula
rities in the sample surface, e.g. scratches. Scratches may also briefly ar
rest the progress of the peeling front, see fig. 22. Moisture intensities this
tendency towards detachment of the film.
Very poorly adhering films are obtained on nickel. Nickel also exhibits an
extreme1y strong and rapid uptake of carbon up to considerable depths
() 100 nm), probably caused by the intermediate formation of NiC which is
- 416 -
References
/1/ M. Hirose, "P1asma-Deposited Films: Kinetic of Formation, Composition
and Microstructure" in Plasma Deposited Thin Films, J. Mort and F.
Jansen, Editors, CRC Press, Boca Raton, F1orida, 1986
/2/ A. Bubenzer, B. Dischler, G. Brandt and P. KOidl, J. Appl. Phys • ..2!!., 1983, 4590
/3/ J.C. Angus, P. Koidl and S. Domitz, "Carbon Thin Films", in Plasma
Deposited Thin Fi1m,s, J. Mort and F. Jansen, Editors, CRC Press, Boca
Raton, F1orida, 1986
/4/ J. Winter, "Conditioning of Fusion Devices by Reactive Plasmas", J.
Nucl. Mater. ill. (1989), 265
/5/ C. Wild, P. Koidl, J. Wagner, Proc. E-MRS Conf. Amorphous Hydrogenated
Carbon Films, P. Koidl, P. Oelhafen, Editors, Les Editions Physique,
Paris, 1987, Vo1 XVII, p. 137
/6/ B. Dischler, Proc. E-MRS Conf. Amorphous Hydrogenated Carbon Films,
P. Koidl, P. Oelhafen, Editors, Les Editions Physique, Paris, 1987,
Vol XVII, p. 189

Bilateral Seminars of the International Bureau
1 lind German Vugoslav Meeting in the Framework of the Bilateral Project Development of Innovation Structures in Vugoslavia Innovation Management Plitvice, October 18-20,1989 Edited by Vlastimir Matejic GERMAN-YUGOSLA V COOPERATION
2 lind Workshop on Plasma and Laser Technology Cairo, February 21-28, 1990 Editor: E. Hintz, Institut für Plasmaphysik GERMAN-EGYPTIAN COOPERATION

ISBN 3-89336-050-6