Mercury speciation in coastal sediments from the central east coast of India by modified BCR method
Samples for trace element analysis are rarely in aform suitable for direct introduction to an inductivelycoupled plasma-mass spectrometer (Longerich et al.1990, Jarvis and Jarvis 1992, Falkner et al. 1995,Ludden et al. 1995). They must usually be dissolved toform solutions for aspiration into the mass spectrometerion source. In many cases, it would be desirable toanalyse solid samples directly, without lengthy samplepreparation procedures which may lead to analytical
problems (Stotesbury et al. 1989, Jarvis 1990, Totlandet al. 1992, Perkins and Pearce 1995). Many analyticalmethods have been developed for d i rec t so l idsanalysis, each with unique strengths and weaknesses.Laser sampling, used in conjunction with the inductivelycoupled plasma-mass spectrometer (ICP-MS), has beenshown to be promising for direct and rapid traceelement determinations in solids at a low spatialresolution (Gray 1985, Arrowsmith 1987, Denoyer et al.
GEOSTANDARDSNEWSLETTERThe Journal of Geostandards and Geoanalysis
Ultraviolet Laser Sampling and High ResolutionInductively Coupled Plasma-Mass Spectrometryof NIST and BCR-2G Glass Reference Materials
Vol. 21 — N° 2 p . 2 0 5 > 2 1 4
A Merchantek LUV266TM petrographic ultraviolet(UV) laser microprobe has been used in conjunctionwith a Finnigan MAT ELEMENTTM high resolution ICPdouble-focusing mass spectrometer (HR-ICP-MS) forsolid microsampling and geochemical analysis. Thisnew configuration for laser ablation has theadvantage of coupling the high sensitivity and fastscanning technology applied in the ELEMENT withthe ablation efficiency of a UV laser. Optimisation ofthe configuration on the synthetic NIST SRM 612glass standard reference material using Q-switchedUV laser energy of 2 mJ and a 5 Hz repetition ratedemonstrates: (1) a linear element response factorthroughout the mass spectrum, suggesting limitedfractionation during laser ablation; (2) a highsensitivity and very low background noise for mostelements of interest; (3) limits of detection rangingfrom 3 ng g-1 for Sc to 300 pg g-1 for U; (4) a flattopped peak shape suitable for precise isotopicmeasurements; and (5) a flat bottomed cratergeometry which permits progressive ablation for theanalysis of thin sections. Average precision andaccuracy estimates based on replicate analyses ofsynthetic NIST standard reference material andUSGS BCR-2G glasses are below 10% for most elements.
Une microsonde laser ultraviolet (UV) deMerchantek (LUV266TM) a été utilisée en tandemavec une ICP à haute résolution et doublefocalisation (ELEMENT de Finnigan MAT), pourl’analyse géochimique de micro-échantillonssolides. Cette nouvelle configuration consacrée àl’ablation laser offre l’avantage d’associer la hautesensibilité et le balayage rapide de l’ELEMENTavec l’efficacité d’ablation du laser UV. Uneoptimisation de cette configuration sur le verresynthétique NIST SRM 612 en utilisant une énergiemodulée de 2 mJ et un taux de répétition de 5 Hzdémontre: (1) un facteur de réponse linéaire àtravers tout le spectre de masses; (2) une hautesensibilité et un bruit de fond très faible pour laplupart des éléments intéressants; (3) des limitesde détection allant de 3 ng g-1 pour le Sc jusqu’à300 pg g-1 pour U; (4) un plat de pic nécessairepour une mesure juste des isotopes et (5) uncratère d’ablation à fond plat qui permet uneablation progressive pour l’analyse des lamesminces. Les précisions et justesses moyennescalculées lors de l’analyse répétée des standardssynthétiques de référence (NIST et USGS BCR-2G)sont inférieures à 10% pour la plupart des éléments.
2 0 5
1297
Yann Lahaye (1), David Lambert (1) and Steve Walters (2)
(1) VIEPS Department of Earth Sciences, Monash University, Clayton Vic 3168, Australia(2) BHP Minerals International, Exploration Department, 152 Wharf Street, Brisbane QLD 4000, Australia
Received 28 Feb 97 — Accepted 08 Jul 97
1991, Jackson et al . 1992, Longerich et al . 1993,Perkins et al. 1993, Fryer et al. 1995, Perkins andPearce 1995). Microparticles and vapours from a lasersampling device may be swept with the flow of argoninto the ICP where they are ionised. Ions extracted fromthe ICP a re focused and shaped in the massspectrometer interface.
Two types of mass spectrometer are currently usedin ICP-MS ins t ruments . The mos t popu lar i s thequadrupole mass filter. A mass spectrum is obtained bymonitoring the ions passing through the quadrupolefilter as the voltages on the rods are varied. The secondtype of instrument is based on a magnetic sector massspectrometer, which simultaneously disperses ions as afunction of their m/z ratio between the poles of anelectromagnet (first focus). Some magnetic sector massspectrometers are double focusing and thus separateions additionally according to their kinetic energy usingan electrostatic analyser (second focus). In this study, aMerchantek LUV266 petrographic ultraviolet (UV) lasermicroprobe has been used in conjunc tion with adouble focusing magnetic sector HR-ICP-MS for directsolid microsampling and geochemical analysis. After adescription of the instrumental configuration, we willdescribe the advantages of this configuration for lasersampling of geological materials and discuss resultswhen ablating synthetic glass reference materials fromthe National Institute of Standards and Technology(NIST) and the U.S. Geological Survey (USGS).
Instrumentation
High resolution ICP-MS system
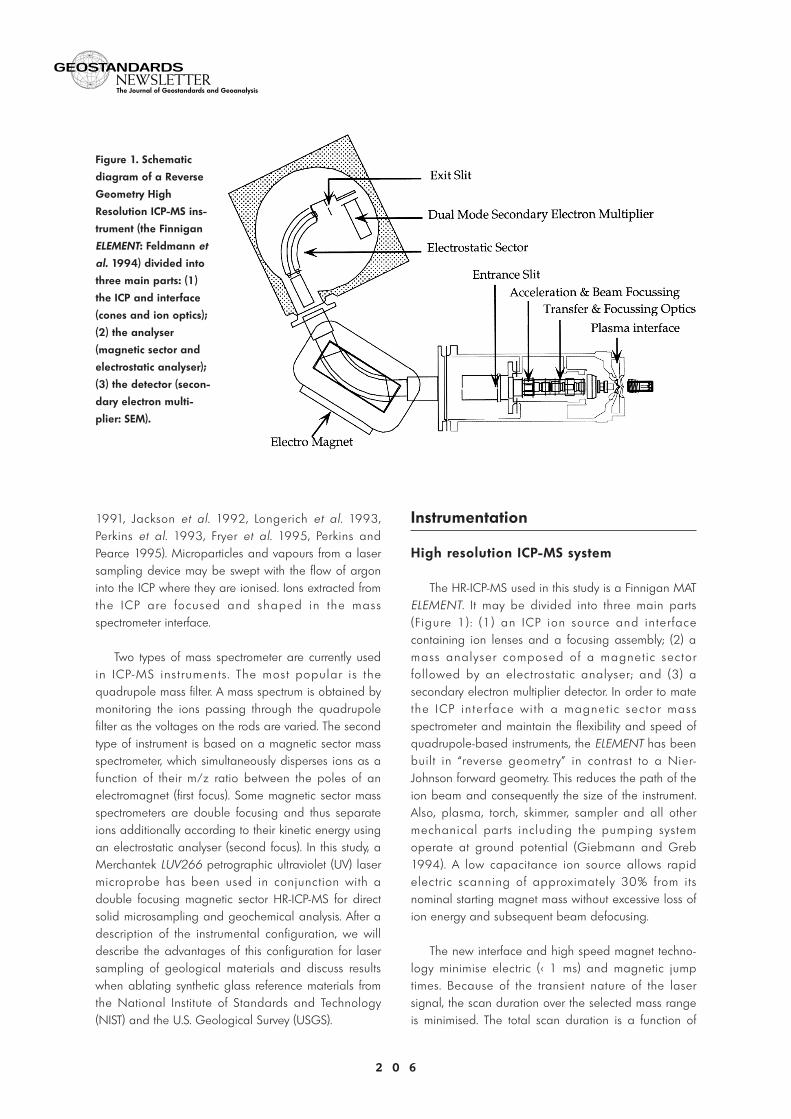
The HR-ICP-MS used in this study is a Finnigan MATELEMENT . It may be divided into three main parts( F igure 1) : (1 ) an ICP ion source and in te r facecontaining ion lenses and a focusing assembly; (2) amass ana ly se r composed o f a magnet i c sec to rfol lowed by an elec t rostat ic analyser ; and (3) asecondary electron multiplier detector. In order to matethe ICP in te r face w i th a magne t i c sec to r massspectrometer and maintain the flexibility and speed ofquadrupole-based instruments, the ELEMENT has beenbuil t in “reverse geometry” in contrast to a Nier-Johnson forward geometry. This reduces the path of theion beam and consequently the size of the instrument.Also, plasma, torch, skimmer, sampler and all othermechanical par ts inc luding the pumping sys temoperate at ground potential (Giebmann and Greb1994). A low capacitance ion source allows rapidelec t r ic scanning of approximately 30% from i tsnominal starting magnet mass without excessive loss ofion energy and subsequent beam defocusing.
The new interface and high speed magnet techno-logy minimise electric (< 1 ms) and magnetic jumptimes. Because of the transient nature of the lasersignal, the scan duration over the selected mass rangeis minimised. The total scan duration is a function of
2 0 6
GEOSTANDARDSNEWSLETTERThe Journal of Geostandards and Geoanalysis
Figure 1. Schematic
diagram of a Reverse
Geometry High
Resolution ICP-MS ins-
trument (the Finnigan
ELEMENT: Feldmann et
al. 1994) divided into
three main parts: (1)
the ICP and interface
(cones and ion optics);
(2) the analyser
(magnetic sector and
electrostatic analyser);
(3) the detector (secon-
dary electron multi-
plier: SEM).

the number of elements in the menu. In order todecrease the scan duration: (1) elements are dividedinto small groups in order to minimise the use of themagnet which has a longer jump time (Table 1). Thetotal scan thus comprises a series of large magneticjumps using 1 ms per amu of travel plus 5 ms for themagnet to settle; (2) the mass window is reduced overthe peak top, in order to acquire only three or fourchannels per peak top with a dwell time of 10 ms.
An example of operating conditions used in ourlaboratory is given in Table 1. Using four channels perpeak top and a menu of thirty elements which covernearly the entire mass range (from 44Ca to 238U), thetotal scan duration is less than 1.7 s. This scan durationcan be decreased to 1.4 s using three channels perpeak top. Assuming a scan time of 0.5-1 s for a qua-drupole mass filter, the total scan duration of the HR-ICP-MS is only about two to three times slower thanthat of the quadrupole mass filter.
The ELEMENT permits variable resolution of peakmasses using three sets of slit positions (M/ΔM= 300,3000, 7500). This option is useful for reducing thelevel of polyatomic ion interferences introduced intothe mass spectrometer by the ICP, which is particularlyadvantageous in solution-based ICP-MS (Giebmannand Greb 1994, Moens et al. 1994, Tittes et al. 1994,
Moens et al. 1995, Vanhaecke et al. 1997). Peakshapes are flat topped, as shown in Figure 2. Althoughnot investigated here, this in principle should allowmore precise isotope ratio measurements than thegaussian peak shape produced by quadrupole-basedinstruments designed for scanning over a relativelylarge mass range (e.g. Begley and Sharp 1997). Theinstrument is operated at high voltage (2000 eV) inorder to increase ion extraction efficiency from theplasma (Walder et al. 1993). As a result, sensitivitiescomparable to those of the most sensitive quadrupole-based instruments can be achieved. Due to the curva-ture of the optical axis of the ELEMENT (double-focu-sing geometry), the photon background derived fromthe ICP torch is greatly reduced without reducing sensi-tivity. For heavy masses, the background counting rateis negligible (< 0.2 cps) which significantly increasessignal/noise (S/N) and decreases the limit of detectionin comparison to quadrupole-based instruments whichtend to have a h igh backg round (~ 10 cps ) .Background with this configuration can only be severefor light elements, due to spectroscopic interferencesfrom the argon carrier gas. However, as in quadrupole-based instruments, molecular oxides and hydroxidesare significantly reduced under the dry plasma condi-tions encountered during laser ablation analysis.
Laser ablation system
Two types of UV lasers are commercially availableand used in laser ablation systems: excimer gas lasers(Bea et al. 1996, Ducreux-Zappa and Mermet 1996,
GEOSTANDARDSNEWSLETTERThe Journal of Geostandards and Geoanalysis
2 0 7
Table 1.Operating conditions for the Merchantek Nd-YAG laserand the Finnigan MAT ELEMENT HR-ICP-MS instrument.
Laser Source
Wavelength 266 nm
Q switch delay 216 μs
Repetition Rate 5 Hz
Energy 2 mJ
HR-ICP-MS
Resolution 300
Scan type Electric Scan
Magnet settling time 1 - 50 ms (see text)
Scan duration 1.7 s
Cool gas flow 13.00 l min-1
Auxillary gas flow 1,06 l min-1
Sample gas flow 1.00 l min-1
Cone High Performance Ni
Sample time 10 ms
Mass window 40%
Detection Mode Analogue (Ca44) and Pulse counting (other elements)
Element groups (Ca44-V51, Zn70, Rb85-Nb93, Cs133-Sm147,
Eu153-Lu175, Hf180-Ta181, Pb207-Th232, U238)
Figure 2. Peak shape of La (~ 37 μg g-1) when ablating the
NIST SRM 612 synthetic glass at 1 mJ and 20 Hz. This figure
represents an average of 50 scans (1 s scan duration) or a
thousand shots at low resolution (M/ΔM= 300).
Raw
Cou
nts
m/z
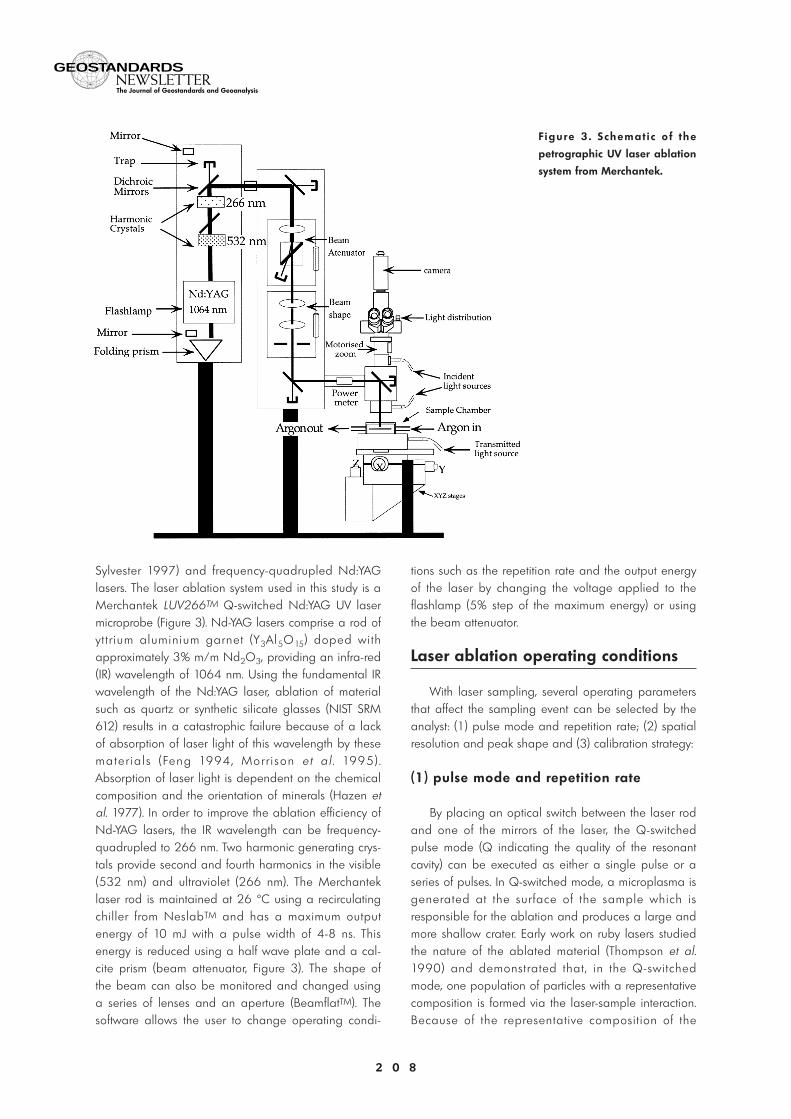
Sylvester 1997) and frequency-quadrupled Nd:YAGlasers. The laser ablation system used in this study is aMerchantek LUV266TM Q-switched Nd:YAG UV lasermicroprobe (Figure 3). Nd-YAG lasers comprise a rod ofy t t r ium aluminium garnet (Y3Al5O15) doped wi thapproximately 3% m/m Nd2O3, providing an infra-red(IR) wavelength of 1064 nm. Using the fundamental IRwavelength of the Nd:YAG laser, ablation of materialsuch as quartz or synthetic silicate glasses (NIST SRM612) results in a catastrophic failure because of a lackof absorption of laser light of this wavelength by thesemate r ia l s ( Feng 1994 , Mor r i son e t a l . 1995) .Absorption of laser light is dependent on the chemicalcomposition and the orientation of minerals (Hazen etal. 1977). In order to improve the ablation efficiency ofNd-YAG lasers, the IR wavelength can be frequency-quadrupled to 266 nm. Two harmonic generating crys-tals provide second and fourth harmonics in the visible(532 nm) and ultraviolet (266 nm). The Merchanteklaser rod is maintained at 26 °C using a recirculatingchiller from NeslabTM and has a maximum outputenergy of 10 mJ with a pulse width of 4-8 ns. Thisenergy is reduced using a half wave plate and a cal-cite prism (beam attenuator, Figure 3). The shape ofthe beam can also be monitored and changed usinga series of lenses and an aperture (BeamflatTM). Thesoftware allows the user to change operating condi-
tions such as the repetition rate and the output energyof the laser by changing the voltage applied to theflashlamp (5% step of the maximum energy) or usingthe beam attenuator.
Laser ablation operating conditions
With laser sampling, several operating parametersthat affect the sampling event can be selected by theanalyst: (1) pulse mode and repetition rate; (2) spatialresolution and peak shape and (3) calibration strategy:
(1) pulse mode and repetition rate
By placing an optical switch between the laser rodand one of the mirrors of the laser, the Q-switchedpulse mode (Q indicating the quality of the resonantcavity) can be executed as either a single pulse or aseries of pulses. In Q-switched mode, a microplasma isgenerated at the sur face of the sample which isresponsible for the ablation and produces a large andmore shallow crater. Early work on ruby lasers studiedthe nature of the ablated material (Thompson et al.1990) and demonstrated that , in the Q-switchedmode, one population of particles with a representativecomposition is formed via the laser-sample interaction.Because of the representative composit ion of the
2 0 8
GEOSTANDARDSNEWSLETTERThe Journal of Geostandards and Geoanalysis
F igu re 3 . S chemat i c o f the
petrographic UV laser ablation
system from Merchantek.

material ablated in the Q-switch mode, this mode ofoperation is preferable (e.g. Arrowsmith 1987).
A single laser pulse provides a transient signal;however, multiple pulses may be used to produce anear steady-state signal analogous to that obtainedwith continuous solution aspiration. Norman et al.(1996) suggested that selective elemental fractionationis greatly reduced by using a low repetition rate. Datain Figure 4 illustrate the signal variation for Ca-norma-lised trace element data obtained when ablating theNIST SRM 612 synthetic glass standard referencematerial, with our system, at various 50 μm-wide spotsand using a pulse energy of 2 mJ and various repeti-tion rates. This figure demonstrates limited fractionationat 4 Hz for first row transition elements with a low mel-ting point such as Zn, but more extensive fractionationat 15 Hz. Other elements with higher melting points,such as V, Th, the rare earth elements (REE = Ce, Y)and high field strength elements (HFSE = Zr), do notshow the same behaviour. Thus, a repetition rate of upto 15 Hz can be used with our system, without anysignificant decrease in signal stability.
(2) Spatial resolution and crater shape
Nd-YAG IR laser system produces spot sizes typical-ly between 30 to 500 μm (routinely 100-500 μm) indiameter. When working with geological thin sections(thickness ~ 30 μm), geochemists often need to reducethe spot size as much as possible even if the limit ofdetection increases dramatically. By replacing thesingle plano-convex focusing lens with a compoundobjec t ive, the spatial resolut ion can be rout inelydecreased down to 20-50 μm or even lower in some
specific applications (Pearce et al. 1992, Jackson et al.1992, Chenery and Cook 1993, Jeffries et al. 1995).New UV laser systems, such as the Merchantek lasermicroprobe used here, are thought to provide a similarspatial resolution while maintaining a more «top-hat»-shaped rather than gaussian beam energy profile. Thisproduces a flatter-bottomed and shallower crater mor-phology appropriate for thin section or layer analysis(Figure 5).
(3) Calibration strategy
Once microparticulate material has been transpor-ted by the stream of argon to the plasma, the numberof ions which reach the detector depends on (a) theatomic proportions of the element in the source mine-ral, (b) the amount of material removed during abla-tion, (c) the ionisation potential of the element in theplasma, and (d) isotopic abundance. Assuming nofractionation during ablation between volatile andother more refractory elements, it is possible to correctfor variations in ablation yield using an internal stan-dard. The concentration of this element is normallyknown by analysis using another technique. Electronmicroprobe analysis is usually used to measure theconcentration of the element chosen as the internalstandard in the unknown. Calibration can then beachieved by comparing the response for the internalstandard element in a reference material and the un-known sample. This element response for the internal
GEOSTANDARDSNEWSLETTERThe Journal of Geostandards and Geoanalysis
2 0 9
Figure 4. Signal variation (% RSD) for Ca-normalized trace
element isotopes (51V, 66Zn, 89Y, 90Zr, 140Ce, 232Th) versus
increasing repetition rates (3, 4, 5, 10, 15 Hz) at the same
energy (2 mJ) when ablating NIST SRM 612 synthetic glass
with a 50 μm wide spot.
Figure 5. Scanning electron microscope image of 70 μm
wide crater produced by firing the Merchantek UV laser
beam on the NIST SRM 612 synthetic glass at 2 mJ and
4 Hz. Note the lack of melting and the near flat pit bottom.
standard allows the analyst to apply a correction forother elements included in the selected menu. In orderto perform this correction, the geochemist must: (a)assume that the element response in the unknown issimilar to that of the reference material ( i .e . bothmatrices are matched); (b) assume that the referencematerial has a homogeneous trace element composi-tion and distribution and (c) choose an internal stan-dard element that has an isotope which can be mea-sured precisely in both the calibration sample and theunknown (usually a minor isotope of a major element).
Optimal parameters for laser sampling in our labo-ratory therefore include low laser energy (1 to 2 mJ),low repetition rate (< 15 Hz), Q-switched laser mode,and the calibration strategy described above, in parti-cular, internal standardisation. Instrumental parametersused in our laboratory are summarised in Table 1. Atypical analytical sequence comprises: (a) analysis ofthe argon blank; (b) analysis of the reference material(calibration sample); (c) analysis of the unknown; (d)second analysis of the reference material in order tomonitor drift (i.e. variation in sensitivity of the instrumentthrough time) and (e) analysis of other unknowns.
Performance of the configuration
In order to test the performance of our laser-ICP-MSconfiguration, we have examined key parametersincluding sensitivity, element response factors, limits ofdetection, inter-element fractionation, precision andaccuracy, in a series of experiments on NIST andUSGS glass reference materials. Because of the confi-guration of the interface, the ELEMENT is designed toaccommodate measurement of a transient signal pro-duced during laser ablation. Data in Figure 2 repre-sent an average of 50 scans using a 1 second scanduration which translates to 1000 UV laser shots at thesurface of the sample. Approximately 1.6*106 countsare produced for La during ablation of NIST SRM 612(~ 37 ng g-1) at 20 Hz, with a 100 μm spot, for a sen-sitivity of ~ 4*104 cps/ng g-1.
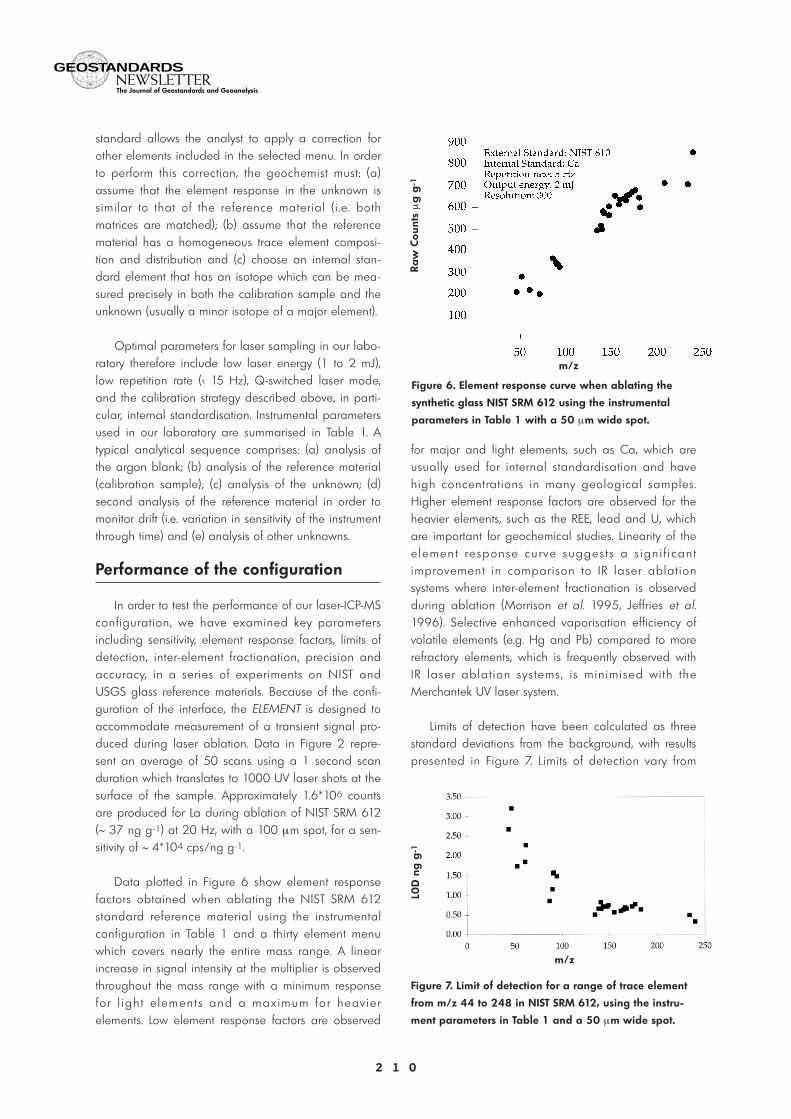
Data plotted in Figure 6 show element responsefactors obtained when ablating the NIST SRM 612standard reference material using the instrumentalconfiguration in Table 1 and a thirty element menuwhich covers nearly the entire mass range. A linearincrease in signal intensity at the multiplier is observedthroughout the mass range with a minimum responsefo r l igh t e lemen t s and a max imum fo r heav ie relements. Low element response factors are observed
for major and light elements, such as Ca, which areusually used for internal standardisation and havehigh concentrations in many geological samples.Higher element response factors are observed for theheavier elements, such as the REE, lead and U, whichare important for geochemical studies. Linearity of thee lemen t re sponse cu r ve sugges t s a s ign i f i can timprovement in compar ison to IR laser ablat ionsystems where inter-element fractionation is observedduring ablation (Morrison et al. 1995, Jeffries et al.1996). Selective enhanced vaporisation efficiency ofvolatile elements (e.g. Hg and Pb) compared to morerefractory elements, which is frequently observed withIR laser ablat ion sy s tems , i s min imised wi th theMerchantek UV laser system.
Limits of detection have been calculated as threestandard deviations from the background, with resultspresented in Figure 7. Limits of detection vary from
2 1 0
GEOSTANDARDSNEWSLETTERThe Journal of Geostandards and Geoanalysis
Figure 6. Element response curve when ablating the
synthetic glass NIST SRM 612 using the instrumental
parameters in Table 1 with a 50 μm wide spot.Ra
w C
ount
s μ
g g
-1
m/z
m/z
L0D
ng
g-1
Figure 7. Limit of detection for a range of trace element
from m/z 44 to 248 in NIST SRM 612, using the instru-
ment parameters in Table 1 and a 50 μm wide spot.

3 ng g-1 for Sc to 300 pg g-1 for heavier masses suchas Pb and U . These l im i t s o f de tec t ion can besignificantly reduced to the lower pg g-1 range byreducing the size of the element menu or by using a
higher laser output energy or repetition rate whenanalysing elements such as the REE and HFSE. Theseelements show less fractionation as a result of higherlaser pulse energies (Figure 4).
GEOSTANDARDSNEWSLETTERThe Journal of Geostandards and Geoanalysis
2 1 1
Figure 8. Results of laser ablation versus solution mode of analysis using NIST SRM 612, 610 and 614,
expressed as a percentage deviation from the solution analysis.
Figure 9. Primitive mantle-normalized
multi-element diagram showing a
comparison between laser ablation
mode of analysis (white circle) and
solution mode of analysis (black
circle). Primitive mantle values are
from Hofmann et al. (1988).
Prim
tive
ma
ntle
nor
ma
lized

Data in Figures 8 and 9 and Table 2 show quanti-tative data for synthetic glasses from NIST (SRM 610,612, 614) and the USGS (BCR-2G), using the instru-mental configuration in Table 1 and a spot size of 50μm. These results are compared with solution modeanalyses using the ELEMENT following a matrix-matchedexternal standardisation method and non-linear res-ponse drift corrections (Cheatham et al. 1993). All ofthe laser results have been measured using NIST SRM612 as an external standard and CaO concentrationas an internal standard. Reference values for the NISTSRM 612 glass and CaO concentrations for NISTglasses were from Norman et al. (1996). Results of
multiple analyses of the NIST SRM 612 glass calibra-ted against itself are shown in Figure 8. The shadedarea represents the range of results obtained on ninedeterminations of this reference material and the thickline represents the average of these nine determina-tions. Precision relative to the mean is between 3 and10% (1σ). The mean concentration of the nine measu-rements for each of the different elements is less than5% (1σ) different than the solution analysis, except forV (10%) and Cs (7%). Precision and accuracy are simi-lar for the highly enriched NIST SRM 610 glass butpoorer for the depleted NIST SRM 614 glass, especiallyfor Sc, V and Rb (up to 25%).
2 1 2
GEOSTANDARDSNEWSLETTERThe Journal of Geostandards and Geoanalysis
NIST SRM 610 NIST SRM 612 NIST SRM 614 USGS BCR-2GLaser Solution Laser Solution Laser Solution Laser SolutionN=9 N=9 N=9 N=5
Sc 493 469 41.5 42.0 1.21 0.89 32.53 31.74
V 426 437 44.5 40.3 0.87 1.12 429 411
Co 456 437 38.1 38.2 n.d. 2.32 48.75 36.37
Zn 503 472 42.5 40.7 n.d. 3.30 n.d. 120.30
Rb 482 421 33.0 33.7 0.73 0.92 63.85 52.07
Sr 538 514 81.8 83.0 48.58 45.94 347 357
Y 436 448 39.2 38.6 0.75 0.80 35.46 38.64
Zr 420 444 37.4 37.3 0.80 0.85 206 201
Nb 490 501 43.0 42.3 0.87 0.79 15.11 13.06
Cs 357 361 48.5 45.2 0.59 0.60 1.54 1.43
Ba 464 444 40.2 41.5 3.33 3.44 696 692
La 440 425 36.7 37.1 0.72 0.78 25.38 26.15
Ce 457 437 38.5 39.6 0.82 0.85 52.82 57.03
Pr 439 428 38.8 39.0 0.75 0.78 6.77 7.39
Nd 412 400 35.0 34.9 0.74 0.78 28.71 30.26
Sm 432 424 37.6 37.7 0.74 0.78 6.50 6.90
Eu 425 429 35.5 36.1 0.77 0.79 1.87 2.04
Gd 416 425 38.1 37.8 0.75 0.82 6.31 6.72
Tb 397 425 36.1 36.7 0.69 0.74 0.95 1.04
Dy 401 418 34.4 35.1 0.69 0.76 6.23 6.43
Ho 398 429 37.8 37.1 0.71 0.71 1.32 1.36
Er 422 424 38.4 37.4 0.70 0.74 3.65 3.60
Tm 394 420 35.7 36.6 0.67 0.71 0.49 0.46
Yb 420 421 37.1 37.8 0.70 0.74 3.33 3.49
Lu 391 402 35.6 35.5 0.69 0.67 0.50 0.52
Hf 410 442 37.9 37.5 0.69 0.65 4.88 5.15
Ta 454 478 38.9 39.6 0.81 0.76 0.86 0.88
Pb 454 430 41.7 39.7 2.12 1.95 12.50 13.60
Th 417 426 37.9 37.1 0.72 0.71 6.24 6.39
U 451 436 37.4 38.0 0.88 0.83 1.80 1.73
units: μg g-1
Table 2.Comparison between solution mode and laser ablation mode of analysis of synthetic glassesfrom NIST (SRM 610, 612, 614) and USGS basalt (BCR-2G). NIST SRM 612 has been used for externalstandardisation and CaO for internal standardisation. NIST CaO concentrations are from Normanet al. (1996) and BCR-2G CaO concentration are from S. Wilson (USGS, unpublished data).
Data in Figure 9 show a multi-element diagramnormalized to the primitive mantle (Hofmann 1988) inwhich a comparison is made between results obtainedby laser ablation and solution mode on the new BCR-2Gglass (Table 2). BCR-2G was prepared by remelting ofBCR-2 powder, a new USGS basalt reference materialcollected from the Columbia River Basin in north eas-tern Oregon. The trace element diagram is smoothand both results show an enrichment in light rare earthand alkali elements as well as a depletion in Nb, Taand Sc , charac ter i s t i c o f Columbia R iver Basal tsamples. Compared to the solution data (Table 2),most of the elements in BCR-2G agree to within 10%RSD, except for Rb, Nb and Co which give up to 25%higher concentrations by laser-ICP-MS.
Conclusions
The new laser microprobe-mass spectrometer confi-guration described in this paper offers many advan-tages when attempting to acquire multi-element datafrom transient laser ablation-initiated signals, specifi-cally: (1) variable mass resolution suitable for the ana-lysis of elements with polyatomic isobaric interferences;(2) rapid electric scanning (E-Scan), made possible bya low capacitance ion source operating at groundpotential, which permits the acquisition of isotopic dataover 30% of the mass range relative to current magnetmass; (3) high sensitivity as a result of high ion extrac-tion energy (2000 eV); (4) very low SEM detectorbackground permitting low limits of detection; (5) abla-tion using a UV wavelength providing higher spatialresolution (down to 10 mm) and a more uniform cratershape in comparison to IR lasers. Preliminary resultsbased on replicate analyses of synthetic glasses giveaverage precision and accuracy below 10%. Significantimprovement of these results are expected in the futuredue primarily to improved scanning strategies. Forexample, by al lowing magnetic and elec trostat icfields to change at the same time, the on-peak dutycycle as well as the sensitivity of the instrument shouldbe improved.
References
Arrowsmith P. (1987)Laser ablation of solids for elemental analysis byinductively coupled plasma-mass spectrometry.Analytical Chemistry, 59, 1437-1444.
Bea F. , Montero P. , Stoh A. and Baasner J. (1996)Microanalysis of minerals by an excimer UV-LA-ICP-MSsystem. Chemical Geology, 133, 145-156.
Begley I.S. and Sharp B.L. (1997)Characterisation and correction of instrumental bias ininductively coupled plasma-mass spectrometry foraccurate measurement of lead isotope ratios. Journal ofAnalytical Atomic Spectrometry, 12, 395-402.
Cheatham M.M. , Sangrey W.F. and White W.M. (1993)Sources of error in external calibration ICP-MS analysis ofgeological samples and an improved non-linear driftcorrection procedure. Spectrochimica Acta, 48B, E487-E506.
Chenery S. and Cook J.M. (1993)Determination of rare earth elements in single mineralgrains by laser ablation microprobe - inductively coupledplasma-mass spectrometry - preliminary study. Journal ofAnalytical Atomic Spectrometry, 8, 299-303.
Denoyer E.R. , Fredeen K.J. and Hager J. (1991)Laser solid sampling for inductively coupled plasma-massspectrometry. Analytical Chemistry, 63, 445A-457A.
Ducreux-Zappa M. and Mermet J.-M. (1996)Analysis of glass by UV laser ablation inductively coupledplasma-atomic emission spectrometry. Part 1. Effects of thelaser parameters on the amount of ablated material andthe temporal behaviour of the signal for different types oflaser. Spectrochimica Acta, 51B, 321-332.
Falkner K.K. , Klinkhammer G.P. , Ungerer C.A. andChristie D.M. (1995)Inductively coupled plasma-mass spectrometry in geo-chemistry. Annual Reviews of Earth and PlanetarySciences, 23, 409-449.
Feldmann I. , Tittes W. , Jakubowski N. andStuewer D. (1994)Performance characteristics of inductively coupledplasma-mass spectrometry with high mass resolution.Journal of Analytical Atomic Spectrometry, 9, 1007-1014.
Feng R. (1994)In situ trace element determination of carbonates by laserprobe inductively coupled plasma-mass spectrometryusing non-matrix matched standardisation. Geochimicaet Cosmochimica Acta, 58, 1615-1623.
Fryer B.J. , Jackson S.E. and Longerich H.P. (1995)The design, operation and role of the laser-ablationmicroprobe coupled with an inductively coupled plasma-mass spectrometer (LAM-ICP-MS) in the Earth Sciences.Canadian Mineralogist, 33, 303-312.
Giebmann U. and Greb U. (1994)High resolution ICP-MS - a new concept for elementalspectrometry. Fresenius Journal of Analytical Chemistry,350, 186-193.
Gray A.L. (1985)Solid sample introduction by laser ablation for inductivelycoupled plasma source mass spectrometry. Analyst, 110,551-556.
Hazen R.M. , Bell R.M. and Mao H.K. (1977)Comparison of adsorption spectra of lunar and terrestrialolivine. Carnegie Inst. Washington Yearbook, 77, 853-855.
GEOSTANDARDSNEWSLETTERThe Journal of Geostandards and Geoanalysis
2 1 3
references
Hofmann A.W. (1988)Chemical differentiation of the Earth: the relationshipbetween mantle, continental crust and oceanic crust. Earthand Planetary Science Letters, 90, 297-314.
Jackson S.E. , Longerich H.P. , Dunning G.R. and FryerB.J. (1992)The application of laser-ablation microprobe-inductivelycoupled plasma-mass spectrometry (LAM-ICP-MS) to insitu trace element determination in minerals. CanadianMineralogist, 30, 1049-1064.
Jarvis K.E. (1990)A critical evaluation of two sample preparation tech-niques for low-level determination of some geologicallyincompatible elements by inductively coupled plasma-mass spectrometry. Chemical Geology, 83, 89-103.
Jarvis I. and Jarvis K.E. (1992)Plasma spectrometry in the Earth Sciences: techniques,applications and future trends. Chemical Geology, 95, 1-33.
Jeffries T.E. , Perkins W.T. and Pearce N.J.G. (1995)Measurements of trace elements in basalts and theirphenocrysts by laser probe micro-analysis inductivelycoupled plasma-mass spectrometry. Chemical Geology,121, 131-144.
Jeffries T.E. , Pearce N.J.G. , Perkins W.T. and Raith A. (1996)Chemical fractionation during infrared and ultravioletlaser ablation-inductively coupled plasma-mass spectro-metry - Implications for mineral microanalysis. AnalyticalCommunications, 33, 35-39.
Longerich H.P. , Jenner G.A. , Fryer B.J. and Jackson S.E. (1990)Inductively coupled plasma-mass spectrometry analysis ofgeological samples: a critical evaluation based on casestudies. Chemical Geology, 83, 105-118.
Longerich H.P. , Jackson S.E. , Fryer B. and Strong D.F. (1993)The laser ablation microprobe-inductively coupled plas-ma-mass spectrometer. Geoscience Canada, 20, 21-27.
Ludden J.N. , Feng R. , Gauthier G. , Stix J. , Shi L. ,Francis D. , Machado N. and Wu G. (1995)Applications of LAM-ICP-MS analysis to minerals.Canadian Mineralogist, 33, 419-434.
Moens L. , Verrep P. , Dams R. , Greb U. , Jung G. andLaser B. (1994)New high resolution inductively coupled plasma-massspectrometry technology applied for the determination ofV, Fe, Cu, Zn and Ag in human serum. Journal ofAnalytical Atomic Spectrometry, 9, 1075-1078.
Moens L. , Vanhaecke F. , Riondato J. and Dams R. (1995)Some figures of merit of a new double focusing inducti-vely coupled plasma-mass spectrometer. Journal ofAnalytical Atomic Spectrometry, 10, 569-574.
Morrison C.A. , Lambert D.D. , Morrison R.J.S. ,Ahlers W.W. and Nicholls I.A. (1995)Laser ablation-inductively coupled plasma-mass spectro-metry: an investigation of elemental responses and matrixeffects in the analysis of geostandard materials.Chemical Geology, 119, 13-29.
Norman M.D. , Pearson N.J. , Sharma A. , Griffin W.L.and Shaw S. (1996)Quantitative analysis of trace elements in geologicalmaterials by laser ablation ICP-MS: instrumental opera-tion conditions and calibration values of NIST glasses.Geostandards Newsletter, 20, 247-261.
Pearce N.J.G. , Perkins W.T. , Abell I. , Duller G.A.T. andFuge R. (1992)Mineral microanalysis by laser-ablation inductively cou-pled plasma-mass spectrometry. Journal of AnalyticalAtomic Spectrometry, 7, 53-57.
Perkins W.T. , Pearce N.J.G. and Jeffries T.E. (1993)Laser ablation-inductively coupled plasma-mass spectro-metry: a new technique for the determination of traceand ultra-trace elements in silicates. Geochimica etCosmochimica Acta, 57, 475-482.
Perkins W.T. and Pearce N.J.G. (1995)Mineral microanalysis by laser probe inductively coupledplasma-mass spectrometry, In: Potts P.J., Bowles J.F.W.,Reed S.J.B. and Cave M.R. (eds), MicroprobeTechniques in the Earth Sciences. Chapman & Hall(London), 291-325.
Stotesbury S.J. , Pickering J.M. and Grifferty M.A. (1989)Analysis of lithium and boron by inductively coupledplasma-mass spectrometry. Journal of Analytical AtomicSpectrometry, 4, 457-460.
Sylvester P.J. (1997)New technique using laser ablation blasts into geo-chemical labs. EOS Transactions of the AmericanGeophysical Union, 78, 117-120.
Thompson M. , Chenery S. and Brett L. (1990)Nature of particulate matter produced by laser ablation -Implications for tandem analytical systems. Journal ofAnalytical Atomic Spectrometry, 5, 49-55.
Tittes W. , Jakubowski N. , Stüwer D. , Tölg G. andBroekaert J.A.C. (1994)Reduction of some selected spectral interferences ininductively coupled plasma-mass spectrometry. Journal ofAnalytical Atomic Spectrometry, 9, 1015-1020.
Totland M. , Jarvis I. and Jarvis K.E. (1992)An assessment of dissolution techniques for the analysisof geological samples by plasma spectrometry. ChemicalGeology, 95, 35-62.
Vanhaecke F. , Moens L. , Dams R. , Papadakis I. andTaylor P. (1997)Applicability of high resolution ICP-mass spectrometry forisotope ratio measurements. Analytical Chemistry, 69,268-273.
Walder A.J. , Abell I.D. , Platzner I. and Freedman P.A. (1993)Lead isotope ratio of NIST SRM 610 glass by laserablation inductively coupled plasma-mass spectrometry.Spectrochimica Acta, 48B, 397-402.
2 1 4
GEOSTANDARDSNEWSLETTERThe Journal of Geostandards and Geoanalysis
Copyright © 2022 FDOKUMEN