Comparison of feed-forward and recurrent sensitivities in speech recognition
Upload
independentCategory
view
0download
0
Spectrochimica Acta Part B 65 (2010) 908–917
Contents lists available at ScienceDirect
Spectrochimica Acta Part B
j ourna l homepage: www.e lsev ie r.com/ locate /sab
Influence of nebulizer design and aerosol impact bead on analytical sensitivities ofinductively coupled plasma mass spectrometry
Eduardo Paredes a, Jesús Bosque a, Jean Michel Mermet b, José Luis Todolí a,⁎a Department of Analytical Chemistry, Nutrition and Food Chemistry, University of Alicante, P.O. Box 99, 03080 Alicante, Spainb Spectroscopy Forever, 01390 Tramoyes, France
⁎ Corresponding author.E-mail address: [email protected] (J.L. Todolí).
0584-8547/$ – see front matter © 2010 Elsevier B.V. Adoi:10.1016/j.sab.2010.08.006
a b s t r a c t
a r t i c l e i n f oArticle history:Received 15 March 2010Accepted 21 August 2010Available online 22 September 2010
Keywords:Pneumatic concentric nebulizersCritical dimensionsInductively coupled plasma massSpectrometrySpray chamber association
The characteristics of the aerosols generated by pneumatic concentric nebulizers as well as sensitivities werestudied in ICP-MS with a total of 26 nebulizers: 17 of the A-type, 6 of the C-type, and 3 of the K-type.Although of the same design, discrepancies in sensitivity were observed among the A1-30 type nebulizers.Free delivery rate, relation between the median of the volume drop size distribution, D50, and the capillaryi.d., effect of the nebulizer gas exit cross sectional area on D50, energy transfer efficiency from the gas to theliquid stream and spatial homogeneity within the aerosol cones were studied. For a given nebulizer design,the gas exit cross-sectional area has shown to critically influence the aerosol characteristics. The aerosolgeneration mechanism has been explored and it has been concluded that, for A-type nebulizers thenebulization is more efficient than for C and K-type ones. The spray chamber design has also a marked effecton the results according to the particular nebulizer used. It has been observed that sample capillary was notperfectly centered with regard to the gas exit bore for several nebulizers. In order to minimize the problemsassociated with this bad alignment (i.e., different sensitivity depending on the nebulizer), spray chambersequipped with impact beads may be used, but to the detriment of the sensitivity.
ll rights reserved.
© 2010 Elsevier B.V. All rights reserved.
1. Introduction
Sensitivity and signal repeatability in ICP spectrochemistry arestrongly related to the sample introduction system, i.e. to thephenomena of aerosol formation, transport and filtering. As empha-sized many times, the sample introduction system remains theweakest point of the instrument chain. Typically, when working withICP techniques, the sample introduction step begins with thegeneration of an aerosol from a solution by means of a pneumaticnebulizer, with the concentric type remaining the most commonlyused device [1]. The generation of fine aerosols is very important asdroplets with diameters above 10 μm are not completely vaporizedbefore the plasma observation zone [2]. By taking into account themechanism of pneumatic aerosol generation, it can be inferred thatthe variables affecting the aerosol characteristics are: (i) the nebulizercritical dimensions [3,4] that influence the gas velocity and, therefore,the efficiency of the energy transfer from the gas to the liquid; (ii) thegas density after expansion; (iii) the liquid mass flow [4] and (iv) thephysical properties of the liquid such as surface tension, viscosity ordensity [5,6]. It may be then expected that pneumatic concentricnebulizers of the same type and of the same characteristics shouldprovide similar signals for given gas flow and solution delivery rates.
However, behind the characteristics of the primary aerosol, charac-terized, for instance, by the median of the aerosol volume drop sizedistribution, D50, the role of the spray chamber through its design anddead volume is crucial in the aerosol transport and filtering. Thetertiary aerosol entering the plasma will, then, depend upon thenebulizer-spray chamber association. Several chamber designs arecommercially available and routinely used such as the double passchamber, the conical chamber with and without an impact bead, andthe cyclonic chamber. However, a given spray chamber is usuallyprovided by the instrument manufacturer, but may be easilyinterchangeable. In this work, several pneumatic concentric nebuli-zers (A, C and K types) were used associated with the standardcyclonic spray chamber provided by the instrument manufacturer.The sensitivity was verified within a type series and possiblediscrepancies were studied as a function of the most relevantdimensions of the pneumatic concentric nebulizers that mayinfluence the drop size distributions (DSDs) of primary aerosols,including the spatial drop size distribution perpendicularly to theaerosol direction.
2. Experimental
Twenty six glass pneumatic concentric nebulizers (Meinhard,Santa Ana, USA) were used. In order to evaluate the different variablesinfluencing the DSDs, nebulizers with different designs (type Awithout a liquid capillary recess, and types C and K with a recess)
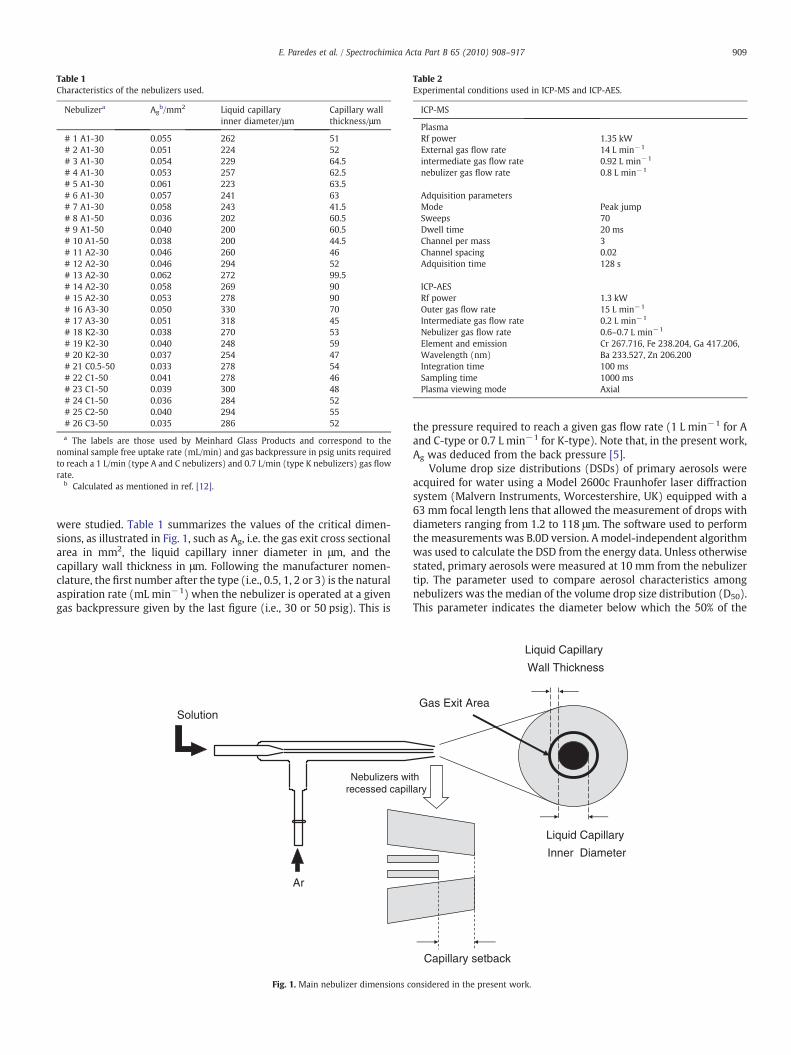
Table 1Characteristics of the nebulizers used.
Nebulizera Agb/mm2 Liquid capillary
inner diameter/μmCapillary wallthickness/μm
# 1 A1-30 0.055 262 51# 2 A1-30 0.051 224 52# 3 A1-30 0.054 229 64.5# 4 A1-30 0.053 257 62.5# 5 A1-30 0.061 223 63.5# 6 A1-30 0.057 241 63# 7 A1-30 0.058 243 41.5# 8 A1-50 0.036 202 60.5# 9 A1-50 0.040 200 60.5# 10 A1-50 0.038 200 44.5# 11 A2-30 0.046 260 46# 12 A2-30 0.046 294 52# 13 A2-30 0.062 272 99.5# 14 A2-30 0.058 269 90# 15 A2-30 0.053 278 90# 16 A3-30 0.050 330 70# 17 A3-30 0.051 318 45# 18 K2-30 0.038 270 53# 19 K2-30 0.040 248 59# 20 K2-30 0.037 254 47# 21 C0.5-50 0.033 278 54# 22 C1-50 0.041 278 46# 23 C1-50 0.039 300 48# 24 C1-50 0.036 284 52# 25 C2-50 0.040 294 55# 26 C3-50 0.035 286 52
a The labels are those used by Meinhard Glass Products and correspond to thenominal sample free uptake rate (mL/min) and gas backpressure in psig units requiredto reach a 1 L/min (type A and C nebulizers) and 0.7 L/min (type K nebulizers) gas flowrate.
b Calculated as mentioned in ref. [12].
Table 2Experimental conditions used in ICP-MS and ICP-AES.
ICP-MS
PlasmaRf power 1.35 kWExternal gas flow rate 14 L min−1
intermediate gas flow rate 0.92 L min−1
nebulizer gas flow rate 0.8 L min−1
Adquisition parametersMode Peak jumpSweeps 70Dwell time 20 msChannel per mass 3Channel spacing 0.02Adquisition time 128 s
ICP-AESRf power 1.3 kWOuter gas flow rate 15 L min−1
Intermediate gas flow rate 0.2 L min−1
Nebulizer gas flow rate 0.6–0.7 L min−1
Element and emission Cr 267.716, Fe 238.204, Ga 417.206,Wavelength (nm) Ba 233.527, Zn 206.200Integration time 100 msSampling time 1000 msPlasma viewing mode Axial
909E. Paredes et al. / Spectrochimica Acta Part B 65 (2010) 908–917
were studied. Table 1 summarizes the values of the critical dimen-sions, as illustrated in Fig. 1, such as Ag, i.e. the gas exit cross sectionalarea in mm2, the liquid capillary inner diameter in μm, and thecapillary wall thickness in μm. Following the manufacturer nomen-clature, the first number after the type (i.e., 0.5, 1, 2 or 3) is the naturalaspiration rate (mL min−1) when the nebulizer is operated at a givengas backpressure given by the last figure (i.e., 30 or 50 psig). This is
Solution
Ar
Nebulizers wirecessed capil
Fig. 1. Main nebulizer dimensions c
the pressure required to reach a given gas flow rate (1 L min−1 for Aand C-type or 0.7 L min−1 for K-type). Note that, in the present work,Ag was deduced from the back pressure [5].
Volume drop size distributions (DSDs) of primary aerosols wereacquired for water using a Model 2600c Fraunhofer laser diffractionsystem (Malvern Instruments, Worcestershire, UK) equipped with a63 mm focal length lens that allowed the measurement of drops withdiameters ranging from 1.2 to 118 μm. The software used to performthe measurements was B.0D version. A model-independent algorithmwas used to calculate the DSD from the energy data. Unless otherwisestated, primary aerosols were measured at 10 mm from the nebulizertip. The parameter used to compare aerosol characteristics amongnebulizers was the median of the volume drop size distribution (D50).This parameter indicates the diameter below which the 50% of the
Gas Exit Area
Liquid Capillary
Inner Diameter
Liquid Capillary
Wall Thickness
Capillary setback
th lary
onsidered in the present work.
10.00
12.00
14.00
16.00
18.00
20.00
22.00
24.00
26.00
28.00
30.00
0
50000
100000
150000
200000
250000
300000
350000
400000
450000
#1 A
1-30
#2 A
1-30
#3 A
1-30
#4 A
1-30
#5 A
1-30
#6 A
1-30
#7 A
1-30
#8 A
1-50
#9 A
1-50
#10
A1-
50#1
1 A
2-30
#12
A2-
30#1
3 A
2-30
#14
A2-
30#1
5 A
2-30
#16
A3-
30#1
7 A
3-30
#18
K2-
30#1
9 K
2-30
#20
K2-
30#2
1 C
.. #2
2 C
1-50
#23
C1-
50#2
4 C
1-50
#25
C2-
50#2
6 C
3-50
D50
(µm
)
Sig
nal
(co
un
ts s
-1)
55Mn 208Pb 115In D50
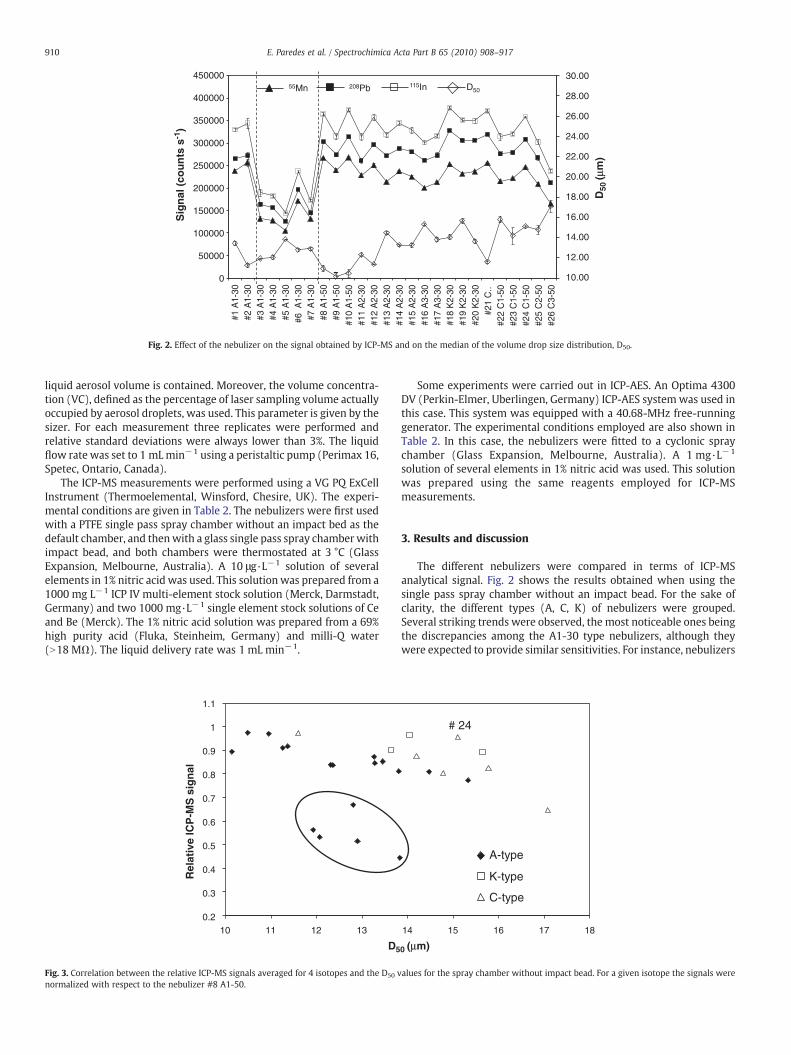
Fig. 2. Effect of the nebulizer on the signal obtained by ICP-MS and on the median of the volume drop size distribution, D50.
910 E. Paredes et al. / Spectrochimica Acta Part B 65 (2010) 908–917
liquid aerosol volume is contained. Moreover, the volume concentra-tion (VC), defined as the percentage of laser sampling volume actuallyoccupied by aerosol droplets, was used. This parameter is given by thesizer. For each measurement three replicates were performed andrelative standard deviations were always lower than 3%. The liquidflow rate was set to 1 mLmin−1 using a peristaltic pump (Perimax 16,Spetec, Ontario, Canada).
The ICP-MS measurements were performed using a VG PQ ExCellInstrument (Thermoelemental, Winsford, Chesire, UK). The experi-mental conditions are given in Table 2. The nebulizers were first usedwith a PTFE single pass spray chamber without an impact bed as thedefault chamber, and thenwith a glass single pass spray chamberwithimpact bead, and both chambers were thermostated at 3 °C (GlassExpansion, Melbourne, Australia). A 10 μg·L−1 solution of severalelements in 1% nitric acid was used. This solution was prepared from a1000 mg L−1 ICP IV multi-element stock solution (Merck, Darmstadt,Germany) and two 1000 mg·L−1 single element stock solutions of Ceand Be (Merck). The 1% nitric acid solution was prepared from a 69%high purity acid (Fluka, Steinheim, Germany) and milli-Q water(N18 MΩ). The liquid delivery rate was 1 mL min−1.
0.2
0.3
0.4
0.5
0.6
0.7
0.8
0.9
1
1.1
10 11 12 13
Rel
ativ
e IC
P-M
S s
ign
al
D5
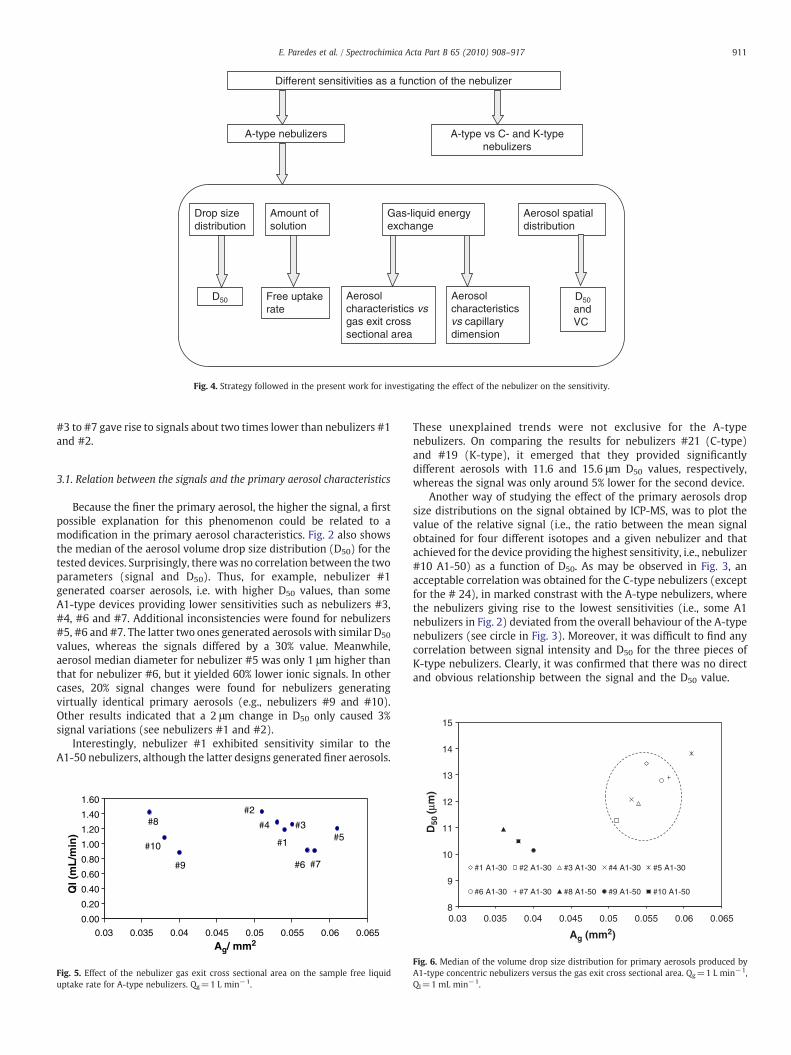
Fig. 3. Correlation between the relative ICP-MS signals averaged for 4 isotopes and the D50 vnormalized with respect to the nebulizer #8 A1-50.
Some experiments were carried out in ICP-AES. An Optima 4300DV (Perkin-Elmer, Uberlingen, Germany) ICP-AES system was used inthis case. This system was equipped with a 40.68-MHz free-runninggenerator. The experimental conditions employed are also shown inTable 2. In this case, the nebulizers were fitted to a cyclonic spraychamber (Glass Expansion, Melbourne, Australia). A 1 mg·L−1
solution of several elements in 1% nitric acid was used. This solutionwas prepared using the same reagents employed for ICP-MSmeasurements.
3. Results and discussion
The different nebulizers were compared in terms of ICP-MSanalytical signal. Fig. 2 shows the results obtained when using thesingle pass spray chamber without an impact bead. For the sake ofclarity, the different types (A, C, K) of nebulizers were grouped.Several striking trends were observed, the most noticeable ones beingthe discrepancies among the A1-30 type nebulizers, although theywere expected to provide similar sensitivities. For instance, nebulizers
14 15 16 17 18
A-type
K-type
C-type
# 24
0 (µm)
alues for the spray chamber without impact bead. For a given isotope the signals were
Different sensitivities as a function of the nebulizer
A-type nebulizers A-type vs C- and K-type nebulizers
Drop size distribution
D50
Amount of solution
Free uptake rate
Gas-liquid energy exchange
Aerosol characteristics vs capillary dimension
Aerosol characteristics vsgas exit cross sectional area
Aerosol spatial distribution
D50and VC
Fig. 4. Strategy followed in the present work for investigating the effect of the nebulizer on the sensitivity.
911E. Paredes et al. / Spectrochimica Acta Part B 65 (2010) 908–917
#3 to #7 gave rise to signals about two times lower than nebulizers #1and #2.
14
15
3.1. Relation between the signals and the primary aerosol characteristics
Because the finer the primary aerosol, the higher the signal, a firstpossible explanation for this phenomenon could be related to amodification in the primary aerosol characteristics. Fig. 2 also showsthe median of the aerosol volume drop size distribution (D50) for thetested devices. Surprisingly, therewas no correlation between the twoparameters (signal and D50). Thus, for example, nebulizer #1generated coarser aerosols, i.e. with higher D50 values, than someA1-type devices providing lower sensitivities such as nebulizers #3,#4, #6 and #7. Additional inconsistencies were found for nebulizers#5, #6 and #7. The latter two ones generated aerosols with similar D50
values, whereas the signals differed by a 30% value. Meanwhile,aerosol median diameter for nebulizer #5 was only 1 μm higher thanthat for nebulizer #6, but it yielded 60% lower ionic signals. In othercases, 20% signal changes were found for nebulizers generatingvirtually identical primary aerosols (e.g., nebulizers #9 and #10).Other results indicated that a 2 μm change in D50 only caused 3%signal variations (see nebulizers #1 and #2).
Interestingly, nebulizer #1 exhibited sensitivity similar to theA1-50 nebulizers, although the latter designs generated finer aerosols.
0.00
0.20
0.40
0.60
0.80
1.00
1.20
1.40
1.60
0.03 0.035 0.04 0.045 0.05 0.055 0.06 0.065
Ql (
mL
/min
)
Ag/ mm2
#5
#7#6
#1
#3#4
#2
#9
#10
#8
Fig. 5. Effect of the nebulizer gas exit cross sectional area on the sample free liquiduptake rate for A-type nebulizers. Qg=1 L min−1.
These unexplained trends were not exclusive for the A-typenebulizers. On comparing the results for nebulizers #21 (C-type)and #19 (K-type), it emerged that they provided significantlydifferent aerosols with 11.6 and 15.6 μm D50 values, respectively,whereas the signal was only around 5% lower for the second device.
Another way of studying the effect of the primary aerosols dropsize distributions on the signal obtained by ICP-MS, was to plot thevalue of the relative signal (i.e., the ratio between the mean signalobtained for four different isotopes and a given nebulizer and thatachieved for the device providing the highest sensitivity, i.e., nebulizer#10 A1-50) as a function of D50. As may be observed in Fig. 3, anacceptable correlation was obtained for the C-type nebulizers (exceptfor the # 24), in marked constrast with the A-type nebulizers, wherethe nebulizers giving rise to the lowest sensitivities (i.e., some A1nebulizers in Fig. 2) deviated from the overall behaviour of the A-typenebulizers (see circle in Fig. 3). Moreover, it was difficult to find anycorrelation between signal intensity and D50 for the three pieces ofK-type nebulizers. Clearly, it was confirmed that there was no directand obvious relationship between the signal and the D50 value.
8
9
10
11
12
13
0.03 0.035 0.04 0.045 0.05 0.055 0.06 0.065
#1 A1-30 #2 A1-30 #3 A1-30 #4 A1-30 #5 A1-30
#6 A1-30 #7 A1-30 #8 A1-50 #9 A1-50 #10 A1-50
Ag (mm2)
D50
(µm
)
Fig. 6. Median of the volume drop size distribution for primary aerosols produced byA1-type concentric nebulizers versus the gas exit cross sectional area. Qg=1 L min−1,Ql=1 mL min−1.
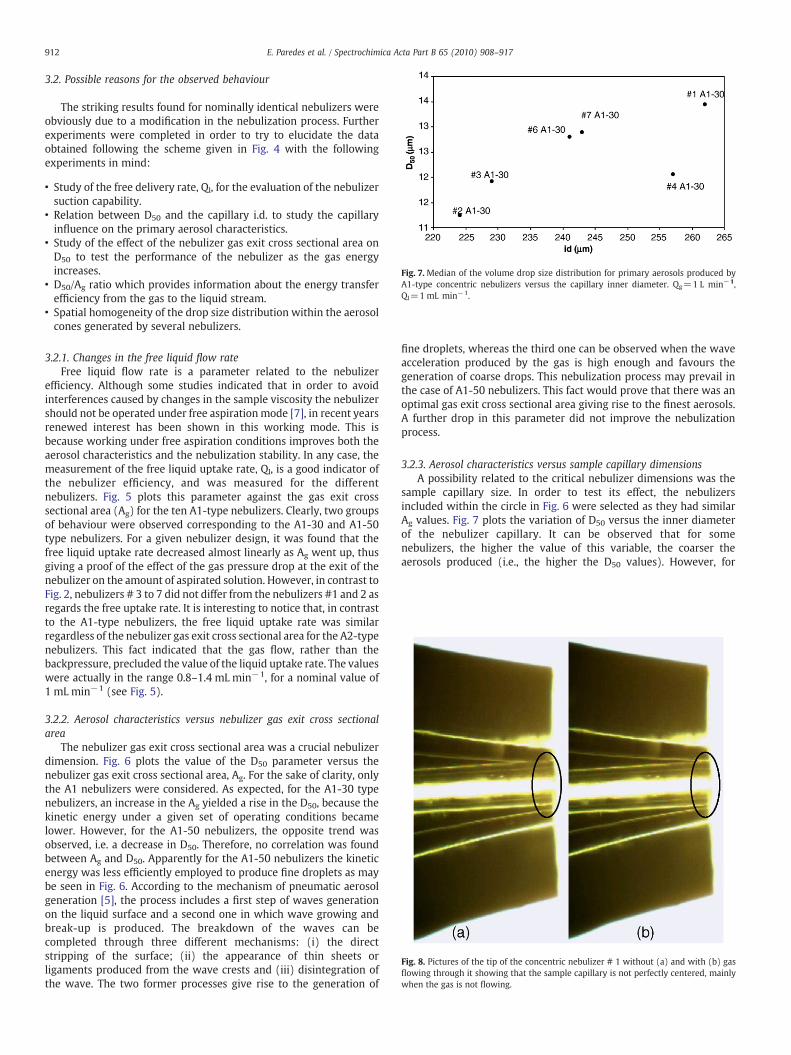
Fig. 7.Median of the volume drop size distribution for primary aerosols produced byA1-type concentric nebulizers versus the capillary inner diameter. Qg=1 L min−1,Ql=1 mL min−1.
Fig. 8. Pictures of the tip of the concentric nebulizer # 1 without (a) and with (b) gasflowing through it showing that the sample capillary is not perfectly centered, mainlywhen the gas is not flowing.
912 E. Paredes et al. / Spectrochimica Acta Part B 65 (2010) 908–917
3.2. Possible reasons for the observed behaviour
The striking results found for nominally identical nebulizers wereobviously due to a modification in the nebulization process. Furtherexperiments were completed in order to try to elucidate the dataobtained following the scheme given in Fig. 4 with the followingexperiments in mind:
• Study of the free delivery rate, Ql, for the evaluation of the nebulizersuction capability.
• Relation between D50 and the capillary i.d. to study the capillaryinfluence on the primary aerosol characteristics.
• Study of the effect of the nebulizer gas exit cross sectional area onD50 to test the performance of the nebulizer as the gas energyincreases.
• D50/Ag ratio which provides information about the energy transferefficiency from the gas to the liquid stream.
• Spatial homogeneity of the drop size distribution within the aerosolcones generated by several nebulizers.
3.2.1. Changes in the free liquid flow rateFree liquid flow rate is a parameter related to the nebulizer
efficiency. Although some studies indicated that in order to avoidinterferences caused by changes in the sample viscosity the nebulizershould not be operated under free aspirationmode [7], in recent yearsrenewed interest has been shown in this working mode. This isbecause working under free aspiration conditions improves both theaerosol characteristics and the nebulization stability. In any case, themeasurement of the free liquid uptake rate, Ql, is a good indicator ofthe nebulizer efficiency, and was measured for the differentnebulizers. Fig. 5 plots this parameter against the gas exit crosssectional area (Ag) for the ten A1-type nebulizers. Clearly, two groupsof behaviour were observed corresponding to the A1-30 and A1-50type nebulizers. For a given nebulizer design, it was found that thefree liquid uptake rate decreased almost linearly as Ag went up, thusgiving a proof of the effect of the gas pressure drop at the exit of thenebulizer on the amount of aspirated solution. However, in contrast toFig. 2, nebulizers # 3 to 7 did not differ from the nebulizers #1 and 2 asregards the free uptake rate. It is interesting to notice that, in contrastto the A1-type nebulizers, the free liquid uptake rate was similarregardless of the nebulizer gas exit cross sectional area for the A2-typenebulizers. This fact indicated that the gas flow, rather than thebackpressure, precluded the value of the liquid uptake rate. The valueswere actually in the range 0.8–1.4 mL min−1, for a nominal value of1 mL min−1 (see Fig. 5).
3.2.2. Aerosol characteristics versus nebulizer gas exit cross sectionalarea
The nebulizer gas exit cross sectional area was a crucial nebulizerdimension. Fig. 6 plots the value of the D50 parameter versus thenebulizer gas exit cross sectional area, Ag. For the sake of clarity, onlythe A1 nebulizers were considered. As expected, for the A1-30 typenebulizers, an increase in the Ag yielded a rise in the D50, because thekinetic energy under a given set of operating conditions becamelower. However, for the A1-50 nebulizers, the opposite trend wasobserved, i.e. a decrease in D50. Therefore, no correlation was foundbetween Ag and D50. Apparently for the A1-50 nebulizers the kineticenergy was less efficiently employed to produce fine droplets as maybe seen in Fig. 6. According to the mechanism of pneumatic aerosolgeneration [5], the process includes a first step of waves generationon the liquid surface and a second one in which wave growing andbreak-up is produced. The breakdown of the waves can becompleted through three different mechanisms: (i) the directstripping of the surface; (ii) the appearance of thin sheets orligaments produced from the wave crests and (iii) disintegration ofthe wave. The two former processes give rise to the generation of
fine droplets, whereas the third one can be observed when the waveacceleration produced by the gas is high enough and favours thegeneration of coarse drops. This nebulization process may prevail inthe case of A1-50 nebulizers. This fact would prove that there was anoptimal gas exit cross sectional area giving rise to the finest aerosols.A further drop in this parameter did not improve the nebulizationprocess.
3.2.3. Aerosol characteristics versus sample capillary dimensionsA possibility related to the critical nebulizer dimensions was the
sample capillary size. In order to test its effect, the nebulizersincluded within the circle in Fig. 6 were selected as they had similarAg values. Fig. 7 plots the variation of D50 versus the inner diameterof the nebulizer capillary. It can be observed that for somenebulizers, the higher the value of this variable, the coarser theaerosols produced (i.e., the higher the D50 values). However, for
913E. Paredes et al. / Spectrochimica Acta Part B 65 (2010) 908–917
nebulizers #3 A1-30 and #4 A1-30 it was found that in spite to thefact that they had capillaries with different inner diameters, primaryaerosols had virtually the same D50 values. Furthermore, nebulizers#1 and #4 had very similar inner diameters but they generatedsignificantly different aerosols. Note that all three nebulizers, #1, 3and 4, also presented similar values of the capillary wall thickness.Therefore, nebulizers #1 and 4 had the same critical dimensions buta different behaviour. In contrast, nebulizers #6 and 7 providedsimilar aerosols because they had virtually the same criticaldimensions.
3.2.4. Aerosol spatial distributionBecause most of the results shown in the present section could not
be explained in terms of nebulizer critical dimensions, additionalnebulizer characteristics and aerosol properties were investigated.First it was realized that the sample capillary was not perfectlycentred (see Fig. 8). As the gas flowed through it (Fig. 8b) the capillarymoved and was better centred with respect to the nebulizer tip.However, apparently the capillary was still slightly deviated from thecentre. All these changes could lead to modifications in the generatedaerosols.
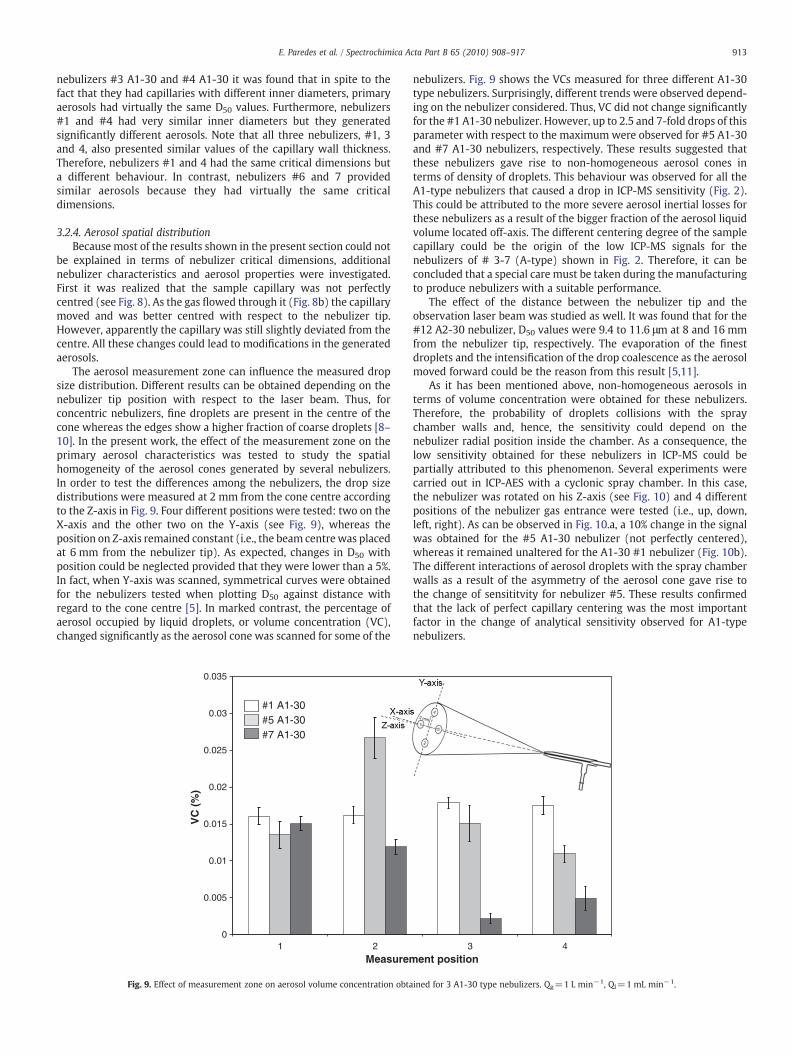
The aerosol measurement zone can influence the measured dropsize distribution. Different results can be obtained depending on thenebulizer tip position with respect to the laser beam. Thus, forconcentric nebulizers, fine droplets are present in the centre of thecone whereas the edges show a higher fraction of coarse droplets [8–10]. In the present work, the effect of the measurement zone on theprimary aerosol characteristics was tested to study the spatialhomogeneity of the aerosol cones generated by several nebulizers.In order to test the differences among the nebulizers, the drop sizedistributions were measured at 2 mm from the cone centre accordingto the Z-axis in Fig. 9. Four different positions were tested: two on theX-axis and the other two on the Y-axis (see Fig. 9), whereas theposition on Z-axis remained constant (i.e., the beam centrewas placedat 6 mm from the nebulizer tip). As expected, changes in D50 withposition could be neglected provided that they were lower than a 5%.In fact, when Y-axis was scanned, symmetrical curves were obtainedfor the nebulizers tested when plotting D50 against distance withregard to the cone centre [5]. In marked contrast, the percentage ofaerosol occupied by liquid droplets, or volume concentration (VC),changed significantly as the aerosol cone was scanned for some of the
0
0.005
0.01
0.015
0.02
0.025
0.03
0.035
1 2
VC
(%
)
Measurem
#1 A1-30#5 A1-30#7 A1-30
Fig. 9. Effect of measurement zone on aerosol volume concentration obta
nebulizers. Fig. 9 shows the VCs measured for three different A1-30type nebulizers. Surprisingly, different trends were observed depend-ing on the nebulizer considered. Thus, VC did not change significantlyfor the #1 A1-30 nebulizer. However, up to 2.5 and 7-fold drops of thisparameter with respect to the maximum were observed for #5 A1-30and #7 A1-30 nebulizers, respectively. These results suggested thatthese nebulizers gave rise to non-homogeneous aerosol cones interms of density of droplets. This behaviour was observed for all theA1-type nebulizers that caused a drop in ICP-MS sensitivity (Fig. 2).This could be attributed to the more severe aerosol inertial losses forthese nebulizers as a result of the bigger fraction of the aerosol liquidvolume located off-axis. The different centering degree of the samplecapillary could be the origin of the low ICP-MS signals for thenebulizers of # 3-7 (A-type) shown in Fig. 2. Therefore, it can beconcluded that a special care must be taken during the manufacturingto produce nebulizers with a suitable performance.
The effect of the distance between the nebulizer tip and theobservation laser beam was studied as well. It was found that for the#12 A2-30 nebulizer, D50 values were 9.4 to 11.6 μm at 8 and 16 mmfrom the nebulizer tip, respectively. The evaporation of the finestdroplets and the intensification of the drop coalescence as the aerosolmoved forward could be the reason from this result [5,11].
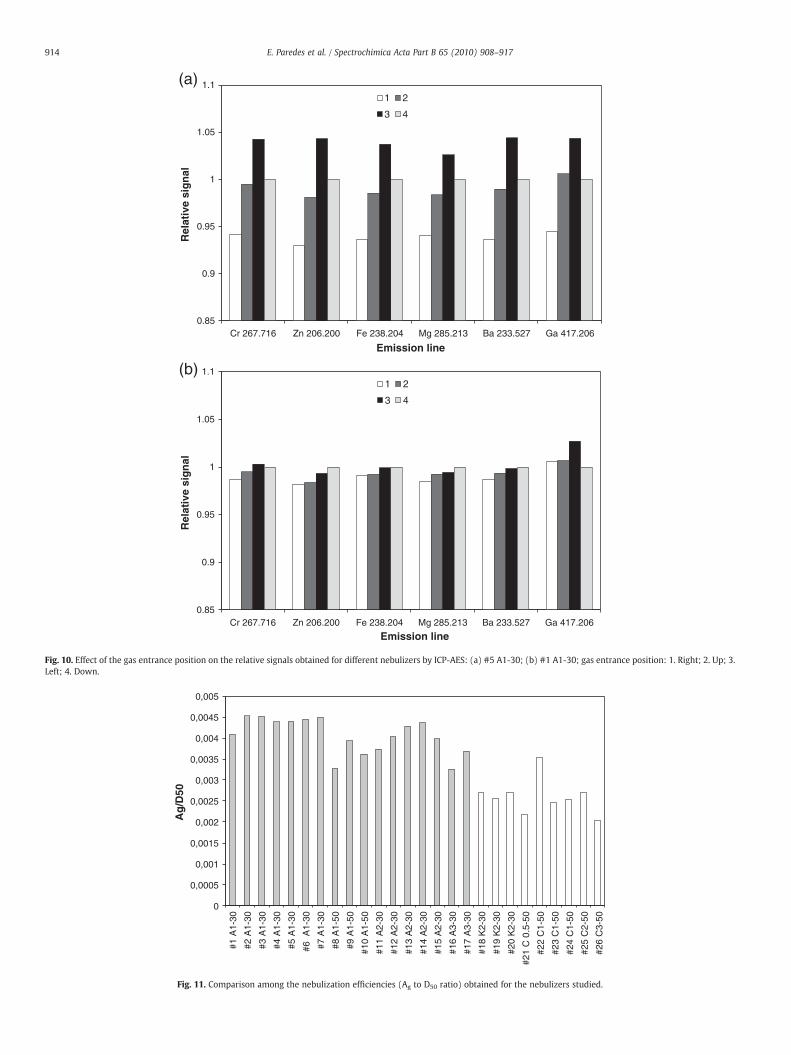
As it has been mentioned above, non-homogeneous aerosols interms of volume concentration were obtained for these nebulizers.Therefore, the probability of droplets collisions with the spraychamber walls and, hence, the sensitivity could depend on thenebulizer radial position inside the chamber. As a consequence, thelow sensitivity obtained for these nebulizers in ICP-MS could bepartially attributed to this phenomenon. Several experiments werecarried out in ICP-AES with a cyclonic spray chamber. In this case,the nebulizer was rotated on his Z-axis (see Fig. 10) and 4 differentpositions of the nebulizer gas entrance were tested (i.e., up, down,left, right). As can be observed in Fig. 10.a, a 10% change in the signalwas obtained for the #5 A1-30 nebulizer (not perfectly centered),whereas it remained unaltered for the A1-30 #1 nebulizer (Fig. 10b).The different interactions of aerosol droplets with the spray chamberwalls as a result of the asymmetry of the aerosol cone gave rise tothe change of sensititvity for nebulizer #5. These results confirmedthat the lack of perfect capillary centering was the most importantfactor in the change of analytical sensitivity observed for A1-typenebulizers.
3 4ent position
ined for 3 A1-30 type nebulizers. Qg=1 L min−1, Ql=1 mL min−1.
0.85
0.9
0.95
1
1.05
1.1
Cr 267.716 Zn 206.200 Fe 238.204 Mg 285.213 Ba 233.527 Ga 417.206
Rel
ativ
e si
gn
al
Emission line
1 2
3 4
(a)
(b)
0.85
0.9
0.95
1
1.05
1.1
Cr 267.716 Zn 206.200 Fe 238.204 Mg 285.213 Ba 233.527 Ga 417.206
Rel
ativ
e si
gn
al
Emission line
1 2
3 4
Fig. 10. Effect of the gas entrance position on the relative signals obtained for different nebulizers by ICP-AES: (a) #5 A1-30; (b) #1 A1-30; gas entrance position: 1. Right; 2. Up; 3.Left; 4. Down.
0
0,0005
0,001
0,0015
0,002
0,0025
0,003
0,0035
0,004
0,0045
0,005
#1 A
1-30
#2 A
1-30
#3 A
1-30
#4 A
1-30
#5 A
1-30
#6 A
1-30
#7 A
1-30
#8 A
1-50
#9 A
1-50
#10
A1-
50
#11
A2-
30
#12
A2-
30
#13
A2-
30
#14
A2-
30
#15
A2-
30
#16
A3-
30
#17
A3-
30
#18
K2-
30
#19
K2-
30
#20
K2-
30
#21
C 0
.5-5
0
#22
C1-
50
#23
C1-
50
#24
C1-
50
#25
C2-
50
#26
C3-
50
Ag
/D50
Fig. 11. Comparison among the nebulization efficiencies (Ag to D50 ratio) obtained for the nebulizers studied.
914 E. Paredes et al. / Spectrochimica Acta Part B 65 (2010) 908–917
Without solution
Withsolution
Aerosol plume
a)
Without solution
Withsolution
b)
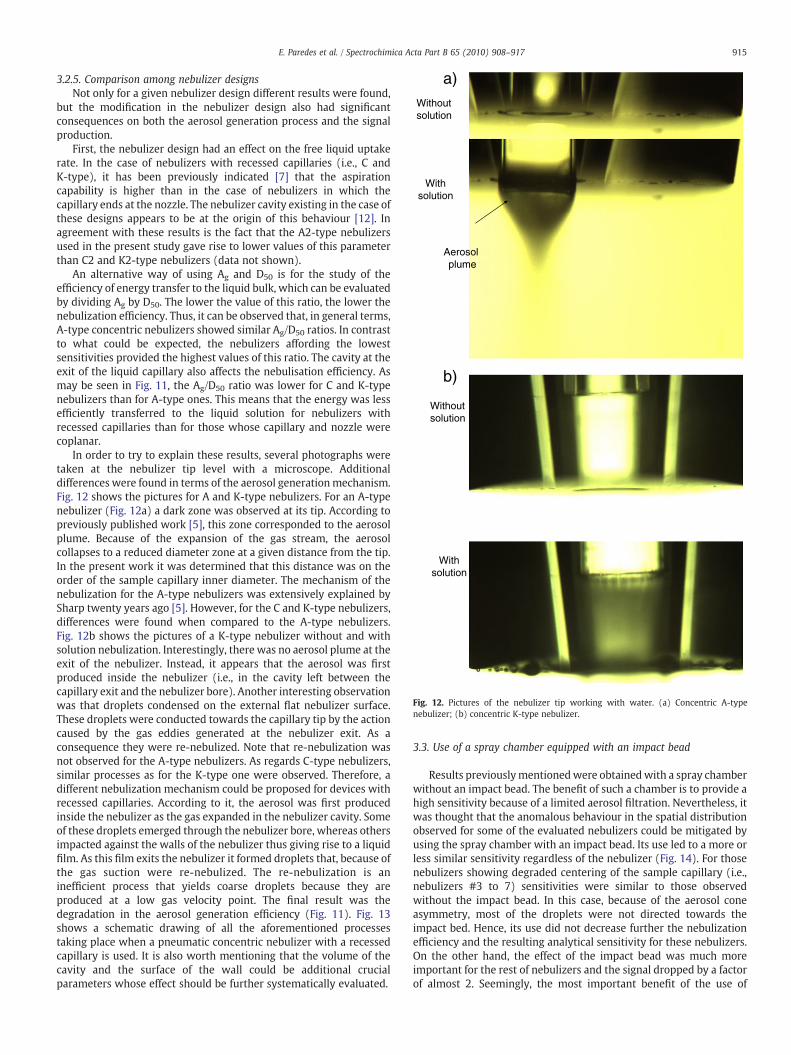
Fig. 12. Pictures of the nebulizer tip working with water. (a) Concentric A-typenebulizer; (b) concentric K-type nebulizer.
915E. Paredes et al. / Spectrochimica Acta Part B 65 (2010) 908–917
3.2.5. Comparison among nebulizer designsNot only for a given nebulizer design different results were found,
but the modification in the nebulizer design also had significantconsequences on both the aerosol generation process and the signalproduction.
First, the nebulizer design had an effect on the free liquid uptakerate. In the case of nebulizers with recessed capillaries (i.e., C andK-type), it has been previously indicated [7] that the aspirationcapability is higher than in the case of nebulizers in which thecapillary ends at the nozzle. The nebulizer cavity existing in the case ofthese designs appears to be at the origin of this behaviour [12]. Inagreement with these results is the fact that the A2-type nebulizersused in the present study gave rise to lower values of this parameterthan C2 and K2-type nebulizers (data not shown).
An alternative way of using Ag and D50 is for the study of theefficiency of energy transfer to the liquid bulk, which can be evaluatedby dividing Ag by D50. The lower the value of this ratio, the lower thenebulization efficiency. Thus, it can be observed that, in general terms,A-type concentric nebulizers showed similar Ag/D50 ratios. In contrastto what could be expected, the nebulizers affording the lowestsensitivities provided the highest values of this ratio. The cavity at theexit of the liquid capillary also affects the nebulisation efficiency. Asmay be seen in Fig. 11, the Ag/D50 ratio was lower for C and K-typenebulizers than for A-type ones. This means that the energy was lessefficiently transferred to the liquid solution for nebulizers withrecessed capillaries than for those whose capillary and nozzle werecoplanar.
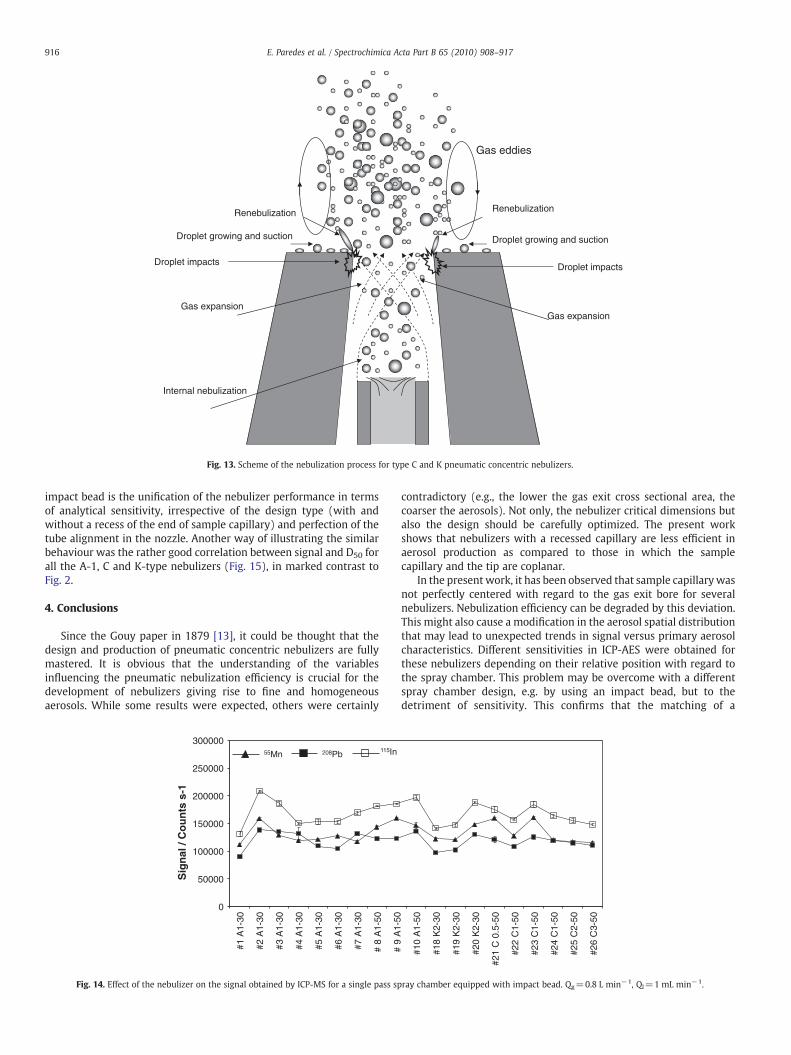
In order to try to explain these results, several photographs weretaken at the nebulizer tip level with a microscope. Additionaldifferences were found in terms of the aerosol generationmechanism.Fig. 12 shows the pictures for A and K-type nebulizers. For an A-typenebulizer (Fig. 12a) a dark zone was observed at its tip. According topreviously published work [5], this zone corresponded to the aerosolplume. Because of the expansion of the gas stream, the aerosolcollapses to a reduced diameter zone at a given distance from the tip.In the present work it was determined that this distance was on theorder of the sample capillary inner diameter. The mechanism of thenebulization for the A-type nebulizers was extensively explained bySharp twenty years ago [5]. However, for the C and K-type nebulizers,differences were found when compared to the A-type nebulizers.Fig. 12b shows the pictures of a K-type nebulizer without and withsolution nebulization. Interestingly, there was no aerosol plume at theexit of the nebulizer. Instead, it appears that the aerosol was firstproduced inside the nebulizer (i.e., in the cavity left between thecapillary exit and the nebulizer bore). Another interesting observationwas that droplets condensed on the external flat nebulizer surface.These droplets were conducted towards the capillary tip by the actioncaused by the gas eddies generated at the nebulizer exit. As aconsequence they were re-nebulized. Note that re-nebulization wasnot observed for the A-type nebulizers. As regards C-type nebulizers,similar processes as for the K-type one were observed. Therefore, adifferent nebulization mechanism could be proposed for devices withrecessed capillaries. According to it, the aerosol was first producedinside the nebulizer as the gas expanded in the nebulizer cavity. Someof these droplets emerged through the nebulizer bore, whereas othersimpacted against the walls of the nebulizer thus giving rise to a liquidfilm. As this film exits the nebulizer it formed droplets that, because ofthe gas suction were re-nebulized. The re-nebulization is aninefficient process that yields coarse droplets because they areproduced at a low gas velocity point. The final result was thedegradation in the aerosol generation efficiency (Fig. 11). Fig. 13shows a schematic drawing of all the aforementioned processestaking place when a pneumatic concentric nebulizer with a recessedcapillary is used. It is also worth mentioning that the volume of thecavity and the surface of the wall could be additional crucialparameters whose effect should be further systematically evaluated.
3.3. Use of a spray chamber equipped with an impact bead
Results previouslymentionedwere obtainedwith a spray chamberwithout an impact bead. The benefit of such a chamber is to provide ahigh sensitivity because of a limited aerosol filtration. Nevertheless, itwas thought that the anomalous behaviour in the spatial distributionobserved for some of the evaluated nebulizers could be mitigated byusing the spray chamber with an impact bead. Its use led to a more orless similar sensitivity regardless of the nebulizer (Fig. 14). For thosenebulizers showing degraded centering of the sample capillary (i.e.,nebulizers #3 to 7) sensitivities were similar to those observedwithout the impact bead. In this case, because of the aerosol coneasymmetry, most of the droplets were not directed towards theimpact bed. Hence, its use did not decrease further the nebulizationefficiency and the resulting analytical sensitivity for these nebulizers.On the other hand, the effect of the impact bead was much moreimportant for the rest of nebulizers and the signal dropped by a factorof almost 2. Seemingly, the most important benefit of the use of
Droplet impacts Droplet impacts
Renebulization Renebulization
Droplet growing and suction Droplet growing and suction
Gas expansion Gas expansion
Internal nebulization
Gas eddies
Fig. 13. Scheme of the nebulization process for type C and K pneumatic concentric nebulizers.
916 E. Paredes et al. / Spectrochimica Acta Part B 65 (2010) 908–917
impact bead is the unification of the nebulizer performance in termsof analytical sensitivity, irrespective of the design type (with andwithout a recess of the end of sample capillary) and perfection of thetube alignment in the nozzle. Another way of illustrating the similarbehaviour was the rather good correlation between signal and D50 forall the A-1, C and K-type nebulizers (Fig. 15), in marked contrast toFig. 2.
4. Conclusions
Since the Gouy paper in 1879 [13], it could be thought that thedesign and production of pneumatic concentric nebulizers are fullymastered. It is obvious that the understanding of the variablesinfluencing the pneumatic nebulization efficiency is crucial for thedevelopment of nebulizers giving rise to fine and homogeneousaerosols. While some results were expected, others were certainly
0
50000
100000
150000
200000
250000
300000
#1 A
1-30
#2 A
1-30
#3 A
1-30
#4 A
1-30
#5 A
1-30
#6 A
1-30
#7 A
1-30
# 8
A1-
50
Sig
nal
/ C
ou
nts
s-1
55Mn 208Pb 115In
Fig. 14. Effect of the nebulizer on the signal obtained by ICP-MS for a single pass sp
contradictory (e.g., the lower the gas exit cross sectional area, thecoarser the aerosols). Not only, the nebulizer critical dimensions butalso the design should be carefully optimized. The present workshows that nebulizers with a recessed capillary are less efficient inaerosol production as compared to those in which the samplecapillary and the tip are coplanar.
In the present work, it has been observed that sample capillarywasnot perfectly centered with regard to the gas exit bore for severalnebulizers. Nebulization efficiency can be degraded by this deviation.This might also cause a modification in the aerosol spatial distributionthat may lead to unexpected trends in signal versus primary aerosolcharacteristics. Different sensitivities in ICP-AES were obtained forthese nebulizers depending on their relative position with regard tothe spray chamber. This problem may be overcome with a differentspray chamber design, e.g. by using an impact bead, but to thedetriment of sensitivity. This confirms that the matching of a
# 9
A1-
50
#10
A1-
50
#18
K2-
30
#19
K2-
30
#20
K2-
30
#21
C 0
.5-5
0
#22
C1-
50
#23
C1-
50
#24
C1-
50
#25
C2-
50
#26
C3-
50
ray chamber equipped with impact bead. Qg=0.8 L min−1, Ql=1 mL min−1.

Fig. 15. Correlation between the ICP-MS signals averaged for 4 isotopes and the D50 values for the spray chamber with impact bead. Qg=0.8 L min−1, Ql=1 mL min−1.
917E. Paredes et al. / Spectrochimica Acta Part B 65 (2010) 908–917
nebulizer to a spray chamber is an important factor in theoptimization of the analytical performance.
Acknowledgments
The authors would like to thank Meinhard Glass Products forproviding a series of nebulizers after a careful selection of variousdimensions to make possible this study. The authors gratefullyacknowledge to the Spanish Education Ministry (Project CTQ2009-14063/BQU) and to the Vicerrectorado de Investigación of theUniversity of Alicante for the financial support.
Appendix A. List of acronyms and symbols used in the presentwork.
Acronym Definition
Ag Gas exit cross sectional areaD50 Median (μm) of the volume drop size distributionDSD Drop size distributionid Nebulizer capillary inner diameterQg Nebulizer gas flow rateQl free Free nebulizer liquid uptake rateLOD Limit of detectionRelative signal Analytical signal obtained for a given nebulizer operated under
particular conditions divided by that found for the nebulizerproviding the highest sensitivity
VC Volume concentration (%)
References
[1] J.L. Todolí, J.M. Mermet, Liquid Sample Introduction in ICP Spectrometry. APractical Guide, Elsevier, Amsterdam, 2008.
[2] J.W. Olesik, J.C. Fister III, Incompletely desolvated droplets in argon inductivelycoupled plasmas: their number, original size and effect on emission intensities,Spectrochim. Acta Part B 46 (1991) 851–868.
[3] D.E. Nixon, Comparison of two Meinhard nebulizers operating at the same argonflow but different pressures, Spectrochim. Acta Part B 48 (1993) 447–459.
[4] J.W. Olesik, L.C. Bates, Characterization of aerosols produced by pneumaticnebulizers for inductively coupled plasma sample introduction: effect of liquidand gas flow rates on volume based drop size distributions, Spectrochim. Acta Part B50 (1995) 285–303.
[5] B.L. Sharp, Pneumatic nebulisers and spray chambers for inductively coupledplasma spectrometry. Part 1. Nebulisers, J. Anal. At. Spectrom. 3 (1988) 939–963.
[6] A. Canals, J. Wagner, R.F. Browner, V. Hernandis, Empirical model for estimatingdrop size distributions of aerosols generated by inductively coupled plasmanebulizers, Spectrochim. Acta Part B 43 (1988) 1321–1335.
[7] S. Greenfield, H.McD. McGeachin, P.B. Smith, Nebulization effects with acidsolutions in ICP spectrometry, Anal. Chim. Acta 84 (1976) 67–78.
[8] A. Montaser (Ed.), Inductively Coupled Plasma Mass Spectrometry, Wiley-VCH,New York, 1998.
[9] K. Kahen, K. Jorabchi, C. Gray, A. Montaser, Spatial mapping of droplet velocity andsize for direct and indirect nebulization in plasma spectrometry, Anal. Chem. 76(2004) 7194–7201.
[10] J.L. Todoli, A. Canals, V. Hernandis, Behaviour of single-bore high pressurepneumatic nebulizer operating with alcohols in inductively coupled plasmaatomic emsision spectrometry, J. Anal. At. Spectrom. 11 (1996) 949–956.
[11] J. Posterörfer, J. Gebhart, G. Röbig, Effect of evaporation on the size distribution ofnebulized aerosols, J. Aerosol Sci. 8 (1977) 371–380.
[12] B.A. Meinhard, D.K. Brown, J.E. Meinhard, The effect of nebulizer structure onflame emission, Appl. Spectrosc. 46 (1992) 1134–1139.
[13] G.L. Gouy, Photometric research on colored flames, Ann. Chim. 18 (1879) 5–101.
Copyright © 2022 FDOKUMEN